46


2 3

3

4 5

5
His HighnessSheikh Sabah Al-Ahmed Al-Jaber Al-Sabah
Amir of the State of Kuwait
His HighnessSheikh Jaber Al-Mubarak Al-Sabah
Prime Minister
His HighnessSheikh Nawaf Al-Ahmed Al-Jaber Al-Sabah
Crown Prince

6 7

7
Contents Page
Board of Directors 7 Chairman’s Statement 8 - 9 Company Outline 10
QualityManagementSystemCertificates 11
& Health, Safty and Environment Award
Principals & Partners 12 - 13
Approvals & Endorsements 14
Independent Auditors’ Report 15 - 16
Consolidated Statement of Financial Position 17
Consolidated Statement of Income 18
Consolidated Statement of comprehensive Income 19
Consolidated Statement of Changes in Equity 20
Consolidated Statement of Cash Flows 21
Notes to the Consolidated Financial Statements 22 - 43

8 9

9
Omran Habib Jawhar HayatChairman
Board of Directors
Radwan Mohammed JamalMember
Mohammad Mahdi Al ShammariDeputy of Chairman
Hani Mohammed Eid MosallamMember
Munawer Anwar Al-NouriMember
Khalid Hamdan Al-SaifManaging Director
Muhaimen Ali BehbehaniMember

10 11
CHAIRMAN’S STATEMENT
Dear Shareholders of the National Petroleum Services Company.
I am pleased to announce our financial results for the year 2011 and to report continuing success across all of our business activities.
The year 2011 was exceptional. Against the backdrop of both political and economic change and uncertainty; and by the grace of Allah we have delivered significant increases in revenue and profitability.
Moving forward the Company will continue to pursue increasing the volume of its business through ongoing strategic planning, human resources development and operational excellence while offering our Clients premium services and value added solutions. We will continue to evaluate opportunities for geographical expansion into foreign markets that offer attractive investment return and whereby we can leverage our established and proven expertise in oilfield and environmental services.
Our achievements realized in 2011 include the following:
The Company’s Commercial Division achieved a number of notable successes that contributed to our increase in revenue and profitability. These include the signing of a Soil Investigation Contract with KOC for a period of three years. Additionally, several projects in the Health, Safety and Environment sector were secured with multinational Companies and the Kuwait Ministry of Electricity and Water. The Company was also awarded ISO 17025:2005 accreditation for our Environmental Laboratory, a significant achievement and the first such accreditation granted to a national Company in the private sector. We believe that this achievement will result in an increase in future related business and revenues for the Company.
In Iraq, the Company completed necessary infrastructure to provide services on an on-going basis. Our first oilfield services project for the Rumaila Operating Organization (ROO), a BP led consortium was completed in October and was by the grace of Allah an outstanding success.
The Company became qualified for Well Testing Services with Kuwait Oil Company and is currently pursuing opportunities that will commercially establish this new business line in the later part of 2012. As part of our Stimulation Services offering we have purchased new high pressure – high flow rate pumping equipment that will allow us to participate in a portion of the stimulation market that has been previously and exclusively dominated by the international Service Providers. We anticipate being operational in this segment of the stimulation market during the second half of 2012.
Several MOUs were signed with international Companies that have secured contracts with KOC for

11
Soil Remediation Services. We look forward to the execution of these projects in cooperation with these partner Companies.
At the request of one our main Clients, the Company initiated and completed development work on a proprietary Thermal Cement System that is required for the production of Heavy Oil. We anticipate this unique Cement System will be commercialized in the second quarter of 2012.
Company’s Financial Statements for year ending 31/12/2011.
The Company generated revenue from sales and services amounting to KD 16,377,366 for the year 2011 as compared to KD 10,558,225 for the year 2010, an increase of 55%.
As previously mentioned the Commercial Division contributed a significant portion of this increase which amounted to KD 7,776,000 for the year 2011 as compared to KD 3,032,000 in 2010.
A net profit of KD 2,338,400 was achieved in 2011 or 44.55 Fils per share as compared to KD 1,588,570 or 30.27 Fils per share in 2010, an increase of 47%.
By the grace of Allah the Company has not only earned unprecedented profits for the year 2011 but has also continued the growth of the Shareholders Equity, having reached KD 13,393,897 in 2011 as compared to KD 12,114,383 for the year 2010, and increase of 10.6%.
Our Company has maintained a strong position within our industry and we have grown our business by following a well defined strategy and providing high quality services to our Clients with the support and dedication of our qualified, loyal and professional work force. I wish to emphasize that with the grace of Allah, your support and the guidance and goals as set forth by our Board of Directors we will continue to pursue our business activities and future growth with dedication and diligence.
In conclusion, I wish to extend my sincere and profound appreciation to our Shareholders for their support, our Board of Directors who have been instrumental in guiding our organization to success and to our executive management and employees for their selfless efforts and commitment in the performance of their duties.
ـــــــــــــــــــــــــــــــــــــــــــــــــــــــــــــــــOmran Habib Johar Hayat
Chairman of Board
12 13
Name of the Company : National Petroleum Services Company (K.S.C) Closed
Commercial Registration No. : 49911 dated 28 March 1993
Date Established: 3rd of January 1993
Date Listed on the K S E : 18th of October 2003
Address : Shuaibah Industrial Area, Block 3, Street 6, Plot 76
P.O. Box 9801 Ahmadi 61008 Kuwait
Telephone: 22251000
Fax: 22251010
Website : www.napesco.com
Authorized Capital : KD 5,486,620
Paid Up : KD 5,486,620
Nominal Value of the Share : 100 Fils
Auditor : BDO Al-Nisf & Partners
P.O. Box 25578 Safat 13116 Kuwait
Telephone: 22426999
Fax: 22401666
Al-Dar International
Accountants and Consultants
P.O. Box 25597, Safat, 13116, Kuwait
Tel.: 22461 490
Fax: 22461 493
COMPANy OUTLINE
13
Name of the Company : National Petroleum Services Company (K.S.C) Closed
Commercial Registration No. : 49911 dated 28 March 1993
Date Established: 3rd of January 1993
Date Listed on the K S E : 18th of October 2003
Address : Shuaibah Industrial Area, Block 3, Street 6, Plot 76
P.O. Box 9801 Ahmadi 61008 Kuwait
Telephone: 22251000
Fax: 22251010
Website : www.napesco.com
Authorized Capital : KD 5,486,620
Paid Up : KD 5,486,620
Nominal Value of the Share : 100 Fils
Auditor : BDO Al-Nisf & Partners
P.O. Box 25578 Safat 13116 Kuwait
Telephone: 22426999
Fax: 22401666
Al-Dar International
Accountants and Consultants
P.O. Box 25597, Safat, 13116, Kuwait
Tel.: 22461 490
Fax: 22461 493
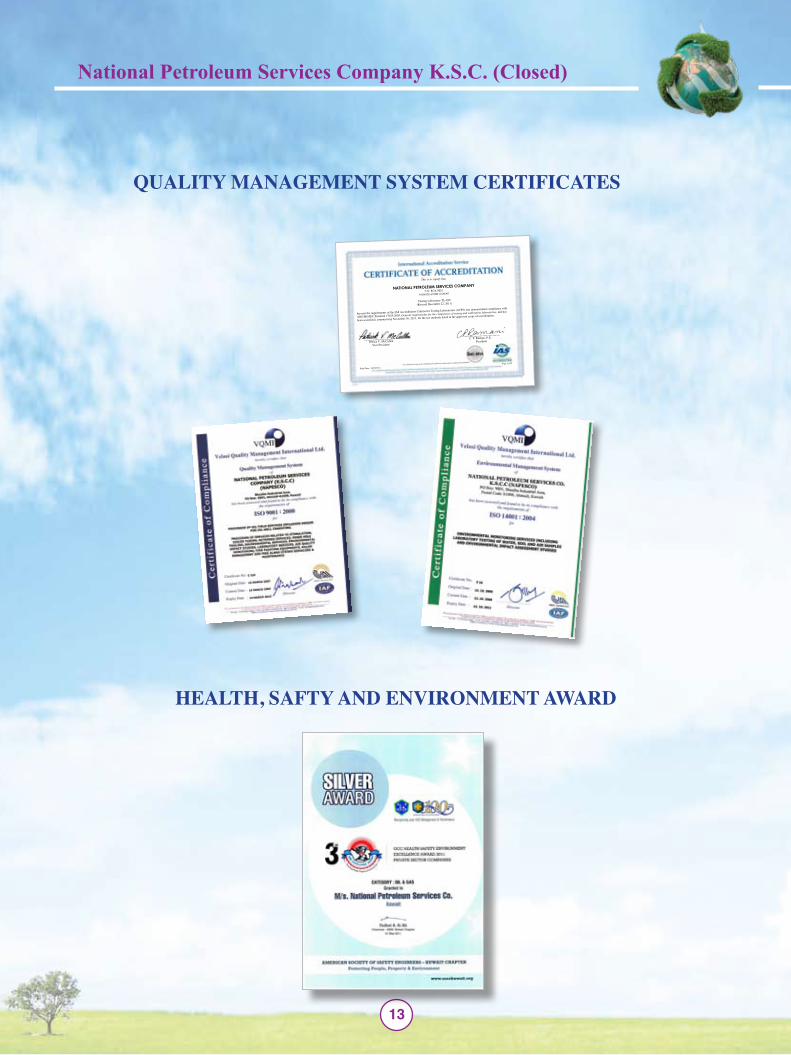
QUALITy MANAgEMENT SySTEM CERTIFICATES
HEALTH, SAFTy AND ENVIRONMENT AWARD
(see attached scope of accreditation for fields of testing and accredited test methods)
Print Date: 12/22/2011
Page 1 of 2
This is to signify that
NATIONAL PETROLEUM SERVICES COMPANY P.O. BOX 9801
AHMADI 61008, KUWAIT
Testing Laboratory TL-490 (Revised December 22, 2011)
has met the requirements of the IAS Accreditation Criteria for Testing Laboratories (AC89), has demonstrated compliance with
ANS/ISO/IEC Standard 17025:2005, General requirements for the competence of testing and calibration laboratories, and has
been accredited, commencing November 30, 2011, for the test methods listed in the approved scope of accreditation.
Patrick V. McCullen
C. P. Ramani, P.E.
Vice President President

14 15
PRINCIPAL COMPANIESServicesCountry of OriginCompany Name
SAFETY & RISK CONSULTANCYIndia CHOLAMANDALAM MS RISK SERVICES
ELECTRIC ACTUATORS, MOTORISED VALVESU.S.A.FLOWSERVE LIMITORQUE
FIRE ENGINEERING CONSULTANCYBelgium FPC (FIRE PROTECTION CONSULTANT) MIDDLE EAST
PROCESS FILTERSITALYFILTERS S.R.L
REFRACTORIES, INSULATION MATERIALSThe Netherlands N.V GOUDA VUURVAST
PRODUCTION TEST SEPARATORS, PROCESS EQUIPMENTSChinaCHINA OIL HBP SCIENCE & TECHNOLOGY CORPORATION LTD.
LEAK DETECTION AND REPAIRING AND EMISSION MONITORINGBelgium SNIFFERS N.V.
DESIGN & ENGINEERINGIndia PL ENGINEERING LIMITED
PROGRESS CAVITY RODLESS PUMPSChina RODLESS PUMPS INC.
INTEGRATED GEOLOGICAL GEOPHYSICAL AND ENGINEERING SERVICES USAFUSION PETROLEUM TECHNOLOGIES INC.
SMT SOFTWARE PRODUCTES /SALESUSASEISMIC MICRO TECHNOLOGY
BUSINESS PARTNERS
Activity / ProductCountry of OriginCompany Name
THERMAL DESORPTION TECHNOLOGY AND SEPARATION SYSTEMSGermanyECON INDUSTRIES GMBH
ENVIRONMENTAL, HEALTH CONSULTANCY AND SOIL REMEDIATIONUnited KingdomENVIRON
OCTG, TUBING, LINE PIPESDubaiPETROLEUM PIPE COMPANY- MIDDLE EAST
OCTG, TUBINGChinaSHANGDONG MOLONG
OIL SPILL CONTROL AND MANAGEMENTTurkey MEKE DENIZ TEMIZILIGI LTD.SERVICES
OCCUPATIONAL HEALTH, INDUSTRIAL HYGIENEIndiaSRI RAMACHANDRA MEDICAL COLLEGE& RESEARCH INSTITUTE
SOIL REMEDIATIONBelgium SITA REMEDIATION
SOIL TREATMENT SERVICES U.S.AWRS COMPASS
CO2 RECOVERY SYSTEMSU.S.AWITTEMANN
INDUSTRIAL PRODUCTS AND SERVICES NarwayGLOBAL CALL NETWORK
OIL FIELD PROJECT MANAGEMENT AND WELL SITE SUPERVISION CanadaPAJAK ENGINEERING LTD.
OIL FIELD SERVICES AND SUPPLY OmanMUTTRAH OIL FIELD SUPPLY AND SERVICES (MOSS)LLC.
PRODUCTS ELECTRO MECHANICALU.A.EArabian Eastern Group FZE, Dubai

15
PREQUALIFIED ACTIVITIESCompany Name Type of Work
Kuwait Oil Company
CEMENTING SERVICESCOILD TUBING,NITROGEN AND SIMULATION SERVICESENVIRONMENTAL CONSULTANCY HEALTH CONSULTANCY SERVICES SAFETY CONSULTANCY SERVICESWASTE MANAGEMENT SERVICESCOMPREHENSIVE MAINTENANCE OF FIRE FIGHTING SYSTEMSDESIGN & ENGINEERING SERVICESTUBULAR CLEANING SERVICESSUPPLY OF TUBING CASING AND ACCESSORIES
Kuwait Petroleum Corporation TRAINING SERVICES PROVIDER
Kuwait National Petroleum Company
ENVIRONMENTAL SERVICESENVIRONMENTAL IMPACT ASSESSMENT STUDYONLINE LABORATORY MAINTENANCE SERVICES SUPPLY, INSTALL , COMM & MAINT OF FIRE EXTINGUISHING SYSTEMSLEAK DETECTION & REPAIRING SERVICESOIL SPILL CONTROL AND MANAGEMENTSAFETY CONSULTANCY SERVICESHALON PHASE OUT CONSULTANCY
Joint Operations - Wafra
OILY VISCOUS LIQUID TREATMENT FIRE ALARM & FIRE FIGHTING SYSTEM CONSULTANCY ENVIRONMENTAL CONSULTANCY & MONITORING DESIGN & ENGINEERING SERVICESANALYTICAL LABORATORY SERVICES
Joint Operations - KhafjiSaudi Arabia
ASBESTOS CONSULTANCY ENVIRONMENTAL CONSULTANCYINDOOR AIR QUALITY SERVICES STACK EMISSION MONITORING SERVICES SEISMIC DATA INTERPRETATION & QUALITY CONTROL
Saudi Arabian Chevron ENVIRONMENTAL CONSULTANCY & MONITORING Kuwait Fire Department (KFD) HALON MANAGEMENT SERVICES
Ministry of Environment& Climat Affairs (Oman)
WASTE MANAGEMENT SERVICESHAZARDOUS WASTE MANAGEMENTENVIRONMENTAL CONSULTANCY
ENDORSEMENTS
Environment Public Authority
ENVIRONMENTAL CONSULTANCY EIA STUDIES MERCURY CONTAMINATED SOIL TREATMENT HALON MANAGEMENT SERVICES
U.S- Department Of Transportation PRESSURIZED CYLINDER RETESTER>S IDENTIFICATION NUMBER DNV SURVEY AND MAINTENANCE OF FIRE EXTINGUISHERS & SYSTEMS
Lloyods Register SURVEY AND MAINTENANCE OF FIRE EXTINGUISHERS & SYSTEMS
ISO 14001 : 2004 ENVIRONMENTAL MONITORING SERVICES INCLUDING LABORATORY TESTING OF WATER, SOIL AND AIR SAMPLES AND EIA
ISO 9001 : 2000 PROVISION OF OIL FILED SERVICES INCLUDING DESIGN FOR OIL WELL CEMENTINGISO 17025 : 2005 ENVIRONMENTAL LAB

16 17
APPROVALS & ENDORSEMENTS
17
INDEPENDENT AUDITORS’ REPORT TO THE SHAREHOlDERS OF NATIONAl PERTOlEUM SERVICES COMPANy K.S.C. (ClOSED)
Report on the Consolidated Financial StatementsWe have audited the accompanying consolidated financial statements of National Petroleum Services Company K.S.C. (Closed) (“the Parent Company”) and its subsidiary (together referred to as “the Group”) which comprise the consolidated statement of financial position as at 31 December 2011, and the consolidated statement of income, consolidated statement of comprehensive income, consolidated statement of changes in equity and consolidated statement of cash flows for the year then ended, and summary of significant accounting policies and other explanatory information.
Management’s responsibility for the financial statementsThe Parent Company’s management is responsible for the preparation and fair presentation of these consolidated financial statements in accordance with International Financial Reporting Standards, and for such internal control as management determines is necessary to enable the preparation of consolidated financial statements that are free from material misstatement, whether due to fraud or error.
Auditors’ responsibilityOur responsibility is to express an opinion on these consolidated financial statements based on our audit. We conducted our audit in accordance with International Standards on Auditing. Those standards require that we comply with ethical requirements and plan and perform the audit to obtain reasonable assurance about whether the consolidated financial statements are free from material misstatement.
An audit involves performing procedures to obtain audit evidence about the amounts and disclosures in the consolidated financial statements. The procedures selected depend on the auditors’ judgment, including the assessment of the risks of material misstatement of the consolidated financial statements, whether due to fraud or error. In making those risk assessments, the auditors consider internal control relevant to the entity’s preparation and fair presentation of the consolidated financial statements in order to design audit procedures that are appropriate in the circumstances, but not for the purpose of expressing an opinion on the effectiveness of the entity’s internal control. An audit also includes evaluating the appropriateness of accounting policies used and the reasonableness of accounting estimates made by management, as well as evaluating the overall presentation of the consolidated financial statements.
We believe that the audit evidence we have obtained is sufficient and appropriate to provide a basis for our audit opinion.
AL NISF & PARTNERS
P.O. Box 25578 Safat 13116 KuwaitAl-Shaheed Tower, 4th FloorKhalid Ben Al-Waleed Street, Sharq, KuwaitTelephone: 22426999 Fax: 22401666
Al-Dar InternationalAccountants and ConsultantsP.O. Box 25597, Safat, 13116, KuwaitTel.: +965 22461 490Fax: +965 22461 493Email: [email protected]
18 19
OpinionIn our opinion, the consolidated financial statements present fairly, in all material respects, the consolidated financial position of the Group as at 31 December 2011, and its consolidated financial performance and its consolidated cash flows for the year then ended in accordance with International Financial Reporting Standards.
Report on Other legal and Regulatory RequirementsWe further report that we have obtained the information and explanations that we required for the purpose of our audit and the consolidated financial statements include the information required by the Kuwait Commercial Companies Law of 1960, and the Parent Company’s articles and memorandum of association, as amended. In our opinion, proper books of account have been kept by the Parent Company, the inventory was duly carried out in accordance with recognized procedures and the accounting information given in the board of directors’ report agrees with the books of account. We have not become aware of any contravention, during the year ended 31 December 2011, of the Kuwait Commercial Companies Law of 1960, or of the Parent Company’s articles and memorandum of association, as amended that would materially affect the Group’s activities or its financial position.
Qais M. Al-Nisf Ahmed M. Al-Rasheed
Licence No. 38 - A Licence No. 39 - A
BDO Al Nisf & Partners Al-Dar International – DFK International
Kuwait: 20 February 2012
19
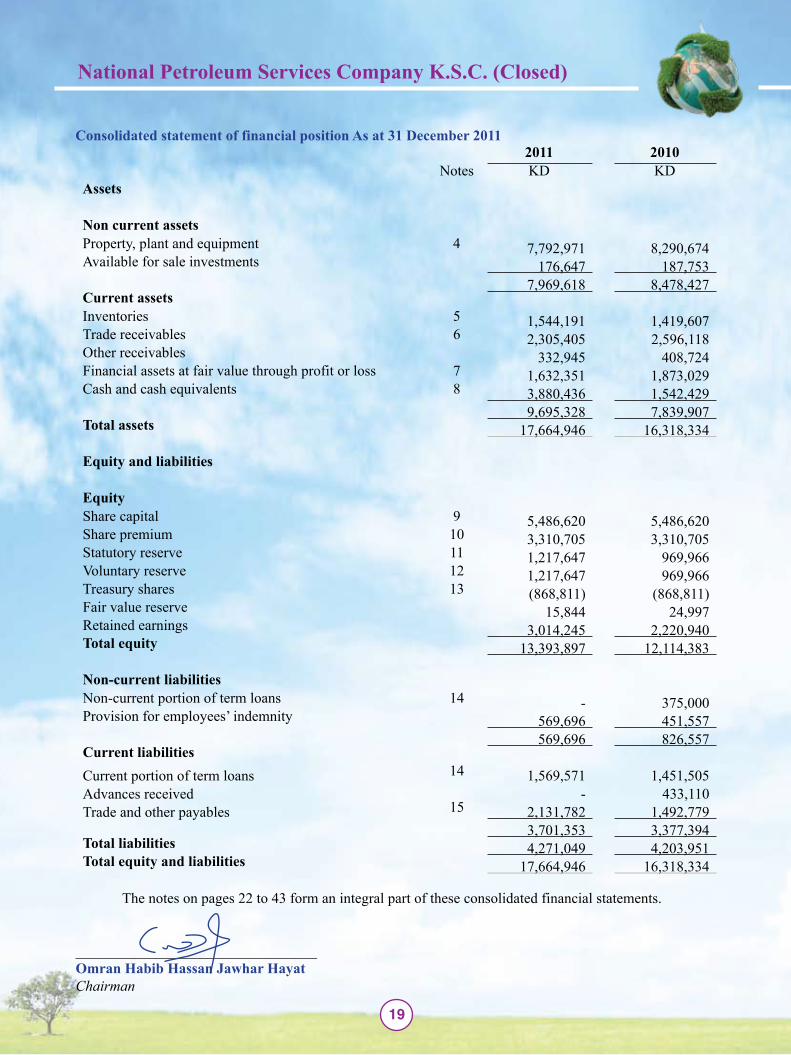
Consolidated statement of financial position As at 31 December 20112011 2010
Notes KD KDAssets
Non current assetsProperty, plant and equipment 4 7,792,971 8,290,674Available for sale investments 176,647 187,753
7,969,618 8,478,427Current assetsInventories 5 1,544,191 1,419,607Trade receivables 6 2,305,405 2,596,118Other receivables 332,945 408,724Financial assets at fair value through profit or loss 7 1,632,351 1,873,029Cash and cash equivalents 8 3,880,436 1,542,429
9,695,328 7,839,907Total assets 17,664,946 16,318,334
Equity and liabilities
EquityShare capital 9 5,486,620 5,486,620Share premium 10 3,310,705 3,310,705Statutory reserve 11 1,217,647 969,966Voluntary reserve 12 1,217,647 969,966Treasury shares 13 (868,811) (868,811)Fair value reserve 15,844 24,997Retained earnings 3,014,245 2,220,940Total equity 13,393,897 12,114,383
Non-current liabilitiesNon-current portion of term loans 14 - 375,000Provision for employees’ indemnity 569,696 451,557
569,696 826,557Current liabilitiesCurrent portion of term loans 14 1,569,571 1,451,505Advances received - 433,110Trade and other payables 15 2,131,782 1,492,779
3,701,353 3,377,394Total liabilities 4,271,049 4,203,951Total equity and liabilities 17,664,946 16,318,334
The notes on pages 22 to 43 form an integral part of these consolidated financial statements.
_________________________________Omran Habib Hassan Jawhar HayatChairman

20 21
Consolidated statement of income For the year ended 31 December 2011
2011 2010
Notes KD KD
Sales and service revenue 16,377,366 10,558,225
Cost of sales and services (12,862,941) (8,119,921)
Gross profit 3,514,425 2,438,304
Unrealized (loss) gain on financial assets at fair value through profit or loss (20,924) 34,810
Realized gain on sale of financial assets at fair value through profit or loss 17,169 5,220
Impairment loss on available for sale investments (1,953) (17,127)
Interest income 11,806 63,685
Other income 124,556 204,572
General and administrative expenses 16 (1,092,933) (917,652)
Finance costs (75,339) (114,679)
Profit for the year before contribution to Kuwait Foundation for the Advancement of Sciences (KFAS), National labour Support Tax (NlST), Zakat and Directors’ remuneration
2,476,807 1,697,133
Contribution to KFAS (21,749) (15,438)
NLST (60,165) (43,661)
Zakat (24,493) (17,464)
Directors’ remuneration (32,000) (32,000)
Profit for the year 17 2,338,400 1,588,570
Earnings per share (fils) 18 44.55 30.27
The notes on pages 22 to 43 form an integral part of these consolidated financial statements.

21
Consolidated statement of comprehensive income For the year ended 31 December 2011
2011 2010KD KD
Profit for the year 2,338,400 1,588,570
Other comprehensive incomeChange in the fair value of available for sale investments (11,106) (5,006)Impairment loss on available for sale investment 1,953 17,127Other comprehensive (loss) income for the year (9,153) 12,121Total comprehensive income for the year 2,329,247 1,600,691
The notes on pages 22 to 43 form an integral part of these consolidated financial statements.

2322
Shar
e ca
pita
lSh
are
prem
ium
Stat
utor
y re
serv
eVo
lunt
ary
rese
rve
Trea
sury
sh
ares
Fair
val
ue
rese
rve
Ret
aine
d ea
rnin
gsTo
tal e
quity
KD
KD
KD
KD
KD
KD
KD
KD
Bal
ance
at 1
Jan
uary
201
05,
486,
620
3,31
0,70
580
0,25
380
0,25
3(8
68,8
11)
12,8
762,
283,
964
11,8
25,8
60
Prof
it fo
r the
yea
r-
--
--
-1,
588,
570
1,58
8,57
0
Oth
er c
ompr
ehen
sive
inco
me
--
--
-12
,121
-12
,121
Tota
l com
preh
ensi
ve in
com
e fo
r the
ye
ar-
--
--
12,1
211,
588,
570
1,60
0,69
1
Div
iden
ds p
aid
--
--
--
(1,3
12,1
68)
(1,3
12,1
68)
Tran
sfer
to re
serv
es-
-16
9,71
316
9,71
3-
-(3
39,4
26)
-
Bal
ance
at 3
1 D
ecem
ber
2010
5,48
6,62
03,
310,
705
969,
966
969,
966
(868
,811
)24
,997
2,22
0,94
012
,114
,383
Prof
it fo
r the
yea
r-
--
--
-2,
338,
400
2,33
8,40
0
Oth
er c
ompr
ehen
sive
loss
--
--
-(9
,153
)-
(9,1
53)
Tota
l com
preh
ensi
ve (l
oss)
inco
me
for t
he y
ear
--
--
-(9
,153
)2,
338,
400
2,32
9,24
7
Div
iden
ds p
aid
--
--
--
(1,0
49,7
33)
(1,0
49,7
33)
Tran
sfer
to re
serv
es-
-24
7,68
124
7,68
1-
-(4
95,3
62)
-
Bal
ance
at 3
1 D
ecem
ber
2011
5,48
6,62
03,
310,
705
1,21
7,64
71,
217,
647
(868
,811
)15
,844
3,01
4,24
513
,393
,897
The
note
s on
page
s 22
to 4
3 a
form
an
inte
gral
par
t of t
hese
con
solid
ated
fina
ncia
l sta
tem
ents
.
Con
solid
ated
stat
emen
t of c
hang
es in
equ
ity F
or th
e ye
ar e
nded
31
Dec
embe
r 20
11
23
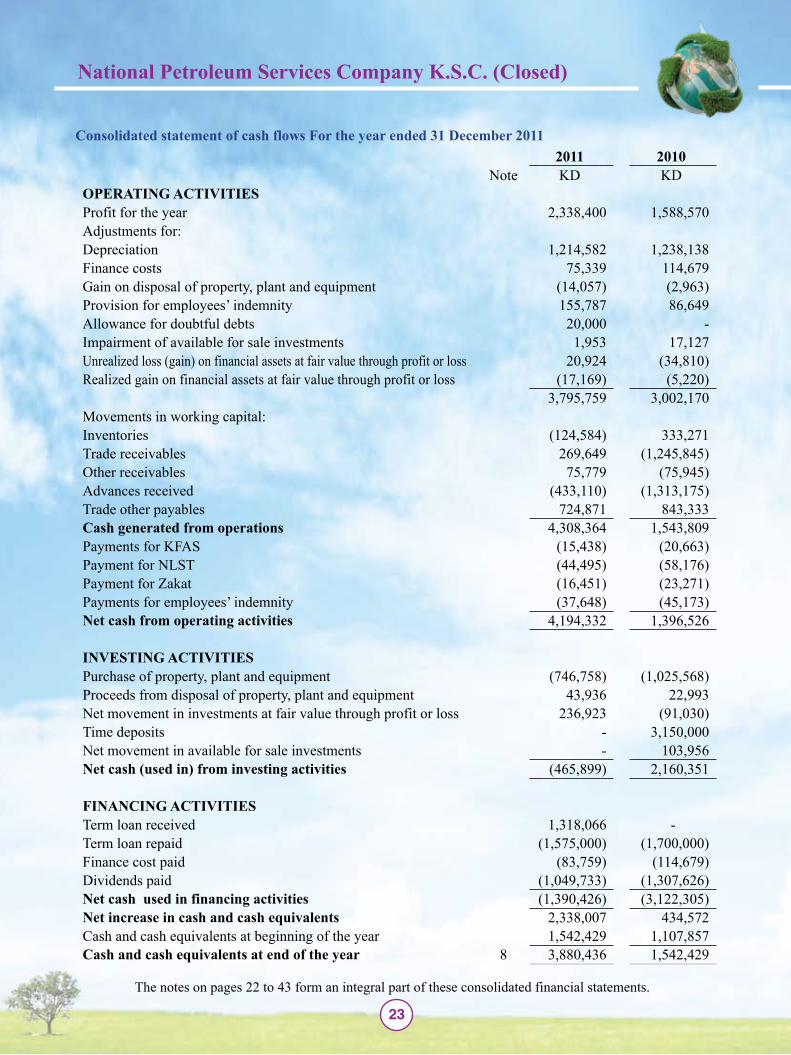
2011 2010Note KD KD
OPERATING ACTIVITIESProfit for the year 2,338,400 1,588,570Adjustments for:Depreciation 1,214,582 1,238,138Finance costs 75,339 114,679Gain on disposal of property, plant and equipment (14,057) (2,963)Provision for employees’ indemnity 155,787 86,649Allowance for doubtful debts 20,000 -Impairment of available for sale investments 1,953 17,127Unrealized loss (gain) on financial assets at fair value through profit or loss 20,924 (34,810)Realized gain on financial assets at fair value through profit or loss (17,169) (5,220)
3,795,759 3,002,170Movements in working capital:Inventories (124,584) 333,271Trade receivables 269,649 (1,245,845)Other receivables 75,779 (75,945)Advances received (433,110) (1,313,175)Trade other payables 724,871 843,333Cash generated from operations 4,308,364 1,543,809Payments for KFAS (15,438) (20,663)Payment for NLST (44,495) (58,176)Payment for Zakat (16,451) (23,271)Payments for employees’ indemnity (37,648) (45,173)Net cash from operating activities 4,194,332 1,396,526
INVESTING ACTIVITIESPurchase of property, plant and equipment (746,758) (1,025,568)Proceeds from disposal of property, plant and equipment 43,936 22,993Net movement in investments at fair value through profit or loss 236,923 (91,030)Time deposits - 3,150,000Net movement in available for sale investments - 103,956Net cash (used in) from investing activities (465,899) 2,160,351
FINANCING ACTIVITIESTerm loan received 1,318,066 -Term loan repaid (1,575,000) (1,700,000)Finance cost paid (83,759) (114,679)Dividends paid (1,049,733) (1,307,626)Net cash used in financing activities (1,390,426) (3,122,305)Net increase in cash and cash equivalents 2,338,007 434,572Cash and cash equivalents at beginning of the year 1,542,429 1,107,857Cash and cash equivalents at end of the year 8 3,880,436 1,542,429
The notes on pages 22 to 43 form an integral part of these consolidated financial statements.
Consolidated statement of cash flows For the year ended 31 December 2011

24 25
GENERAl INFORMATION1.
National Petroleum Services Company K.S.C. (Closed) (“the Parent Company”) is a closed Kuwaiti shareholding Company incorporated on 1 January 1993, in accordance with the provisions of Commercial Companies Law of 1960, as amended and its articles and memorandum of association. The Parent Company’s shares were listed on the Kuwait Stock Exchange on 18 October 2003.
The Parent Company is engaged in carrying out cementing, coil tubing, pumping, stimulation and other miscellaneous associated services relating to drilling operations.
The consolidated financial statements for the year ended 31 December 2011, comprise the Parent Company and its wholly owned subsidiary, Napesco International Petroleum Services Company W.L.L (together referred to as “the Group”).
The Parent Company is domiciled in Kuwait and the address of its registered office and principal place of business is Plot no 3, building no 76, Shuaiba, Kuwait.
The consolidated financial statements of National Petroleum Services Company K.S.C. (Closed) were authorized for issue by the Board of Directors on 20 February 2012. The shareholders’ of the parent Company have the power to amend these consolidated financial statements at the Annual General Assembly.
ADOPTION OF NEW AND REVISED INTERNATIONAl FINANCIAl REPORTING 2. STANDARDS (IFRSs)
2.1 Standards and Interpretations adopted by the Group
The following new and revised Standards and Interpretations have been adopted by the Group for the annual period beginning 1 January 2011:
IAS 1 Presentation of Financial Statements (Amendment)The amendment clarifies that an entity may choose to present the required analysis of items of other comprehensive income either in the statement of changes in equity or in the notes to the financial statements. The adoption of the amendment did not have any impact on the financial position or performance of the Group.
IAS 24 Related Party Disclosures (Revised)The amendment clarified the definition of a related party to simplify the identification of such relationships and to eliminate inconsistencies in its application. The adoption of the amendment did not have any impact on the financial position or performance of the Group.
Notes to the consolidated financial statements For the year ended 31 December 2011

25
2. ADOPTION OF NEW AND REVISED INTERNATIONAl FINANCIAl REPORTING STANDARDS (IFRSs) (continued)
• Amendments to IFRS 7,Disclosures Transfers of Financial Assets Effective for annual periods beginning on or after 1 July 2011
• IFRS 9 Financial Instruments Effective for annual periods beginning on or after 1 January 2013
• IFRS 10 Consolidated Financial Statements Effective for annual periods beginning on or after 1 January 2013
• IFRS 12 Disclosure of Interests in Other Entities Effective for annual periods beginning on or after 1 January 2013
• IFRS 13 Fair Value Measurement Effective for annual periods beginning on or after 1 January 2013
• Amendments to IAS 1, Presentation of Items of Other Comprehensive Income Effective for annual periods beginning on or after 1 July 2012
• IAS 19 (as revised in 2011) Employee Benefits Effective for annual periods beginning on or after 1 January 2013
• IAS 27 (as revised in 2011) Separate Financial Statements Effective for annual periods beginning on or after 1 January 2013
• IAS 28 (as revised in 2011) Investments in Associates and Joint Ventures Effective for annual periods beginning on or after 1 January 2013
Management anticipates that the adoption of these new and revised Standards once they become effective in future periods will not have a material financial impact on these consolidated financial statements of the Group in the period of initial application.
IFRS 9 addresses the classification, measurement and recognition of financial assets and financial liabilities. IFRS 9 was issued in November 2009 and amended in October 2010. It replaces the parts of IAS 39 that relate to the classification and measurement of financial instruments. IFRS 9 requires financial assets to be classified into two measurement categories: those measured at fair value and those measured at amortised cost. The determination is made at initial recognition. The classification depends on the entity’s business model for managing its financial instruments and the contractual cash flow characteristics of the instrument. For financial liabilities, the standard retains most of the IAS 39 requirements. The main change is that, in cases where the fair value option is taken for financial liabilities, the part of a fair value change due to an entity’s own credit risk is recorded in other comprehensive income rather than the income statement, unless this creates an accounting mismatch. The Group is yet to assess IFRS 9’s full impact and intends to adopt IFRS 9 no later than the accounting period beginning on or after 1 January 2013.
IFRS 13 establishes a single source of guidance under IFRS for all fair value measurements. The standard does not change when an entity is required to use fair value, but rather provides guidance on how to measure fair value under IFRS when fair value is required or permitted. The Group is yet to assess IFRS 13’s full impact and intends to adopt IFRS 13 no later than the accounting period beginning on or after 1 January 2013.
Notes to the consolidated financial statements For the year ended 31 December 2011
2.1 Standards and Interpretations in issue but not yet effective and not early adopted by the Group
26 27
SIGNIFICANT ACCOUNTING POlICIES3.
Statement of compliance3.1
The consolidated financial statements of the Group have been prepared in accordance with the International Financial Reporting Standards (IFRSs) as issued by the International Accounting Standards Board (IASB), IFRIC interpretations as issued by the International Financial Reporting Interpretations Committee (IFRIC) and Commercial Companies Law of 1960, as amended.
Basis of preparation 3.2
These consolidated financial statements have been prepared under the historical cost convention except for the measurement at fair value of investments at fair value through profit or loss and certain available for sale investments. The principal accounting policies are set out below.
These consolidated financial statements are presented in Kuwaiti Dinars (‘KD’) which is the Parent Company’s functional and presentation currency.
Basis of consolidation3.3
These consolidated financial statements comprise the financial statements Parent Company and its wholly owned subsidiary drawn up to 31 December 2011 (see below). The subsidiary’s reporting date is 31 December.
Subsidiaries are all entities over which the Parent Company has the power to control the financial and operating policies. The financial statements of subsidiaries are included in the consolidated financial statements from the date that control effectively commences until the date that control effectively ceases. The financial statements of the subsidiaries are consolidated on a line-by-line basis by adding together like items of assets, liabilities, income and expenses.
Intercompany balances and transactions, including intercompany profits and unrealized profits and losses are eliminated in full on consolidation. Amounts reported in the financial statements of subsidiaries have been adjusted where necessary to ensure consistency with the accounting policies adopted by the Group.
Non-controlling interests in the net assets of consolidated subsidiaries are identified separately from the Group’s equity therein. Non-controlling interests consist of amount of those interests at the date of original business combination and the non-controlling entity’s share of changes in equity since the date of the combination. Losses within a subsidiary are attributed to the non-controlling interest even if that results in a deficit balance.
Changes in the Group’s ownership interests in subsidiaries that do not result in the Group losing control over the subsidiaries are accounted for as equity transactions. For purchases from non-controlling interests, the difference between any consideration paid and the relevant share acquired of the carrying value of net assets of the subsidiary is recorded in equity. Gains or losses on disposals to non-controlling interests are also recorded in equity.
Notes to the consolidated financial statements For the year ended 31 December 2011
27
3. SIGNIFICANT ACCOUNTING POlICIES (Continued)
3.3 Basis of consolidation (Continued)
When the Group ceases to have control or significant influence, any retained interest in the entity is remeasured to its fair value, with the change in carrying amount recognised in profit or loss. The fair value is the initial carrying amount for the purposes of subsequently accounting for the retained interest as an associate, joint venture or financial asset. In addition, any amounts previously recognised in other comprehensive income in respect of that entity are accounted for as if the Group had directly disposed of the related assets or liabilities (i.e. reclassified to profit or loss or transferred directly to retained earnings as specified by applicable IFRSs).
Details of the Parent Company’s subsidiary is as follows.
Name of subsidiary
Country of incorporation
%Ownership Principal activity2011 2010
Napesco International Petroleum Services Company W.L.L.
Kuwait 99% 99%
Drilling and maintenance of petroleum and non petroleum well. Treatment of waste from petroleum, chemical and medical material
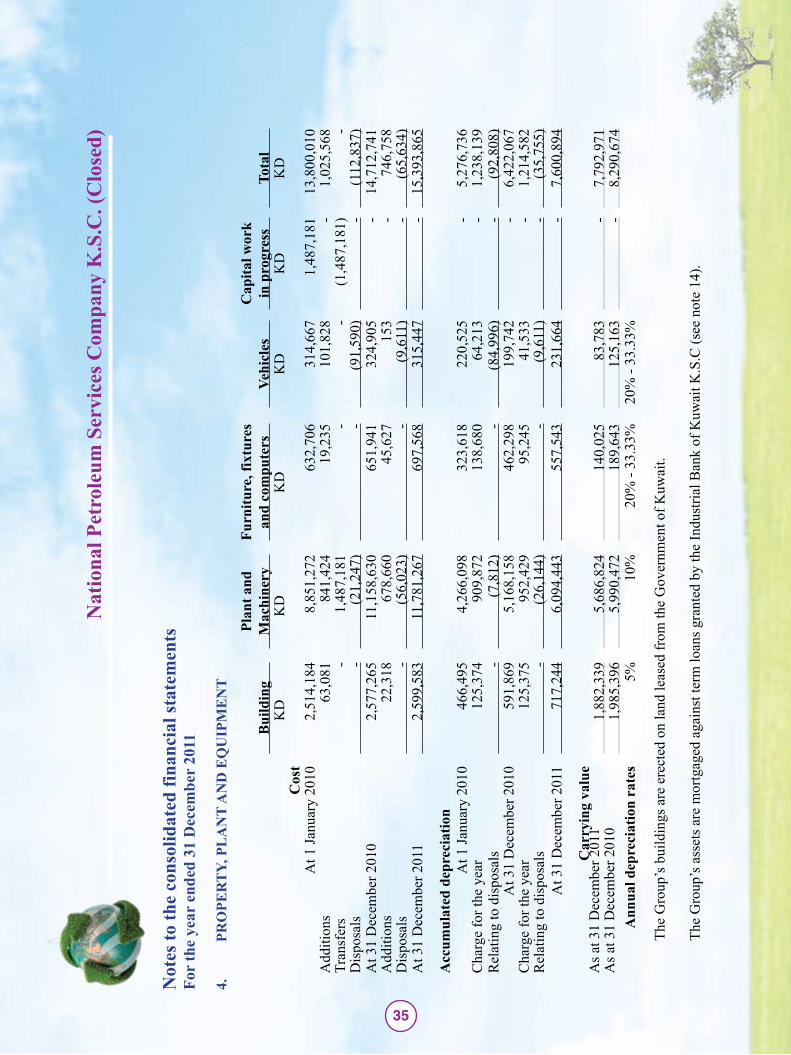
Property, plant and equipment 3.4
Property, plant and equipment except leasehold land are stated at cost less accumulated depreciation and any accumulated impairment losses. Properties in the course of construction for production, rental or administrative purposes, or for purposes not yet determined, are carried at cost, less any recognised impairment loss. Depreciation is calculated based on the estimated useful lives of the applicable assets on a straight-line basis commencing when the assets are ready for their intended use. The estimated useful lives, residual values and depreciation methods are reviewed at each year end, with the effect of any changes in estimate accounted for on a prospective basis. Maintenance and repairs, replacements and improvements of minor importance are expensed as incurred. Significant improvements and replacements of assets are capitalised.
The gain or loss arising on the disposal or retirement of an item of property, plant and equipment is determined as the difference between the sale proceeds and the carrying amount of the asset and is recognised in statement of income in the period in which they occur.
Financial assets3.5
Investments are recognised and derecognised on trade date where the purchase or sale of an investment is under a contract whose terms require delivery of the investment within the timeframe established by the market concerned, and are initially measured at fair value, plus transaction costs, except for those financial assets classified as at fair value through profit or loss, which are initially measured at fair value.
Notes to the consolidated financial statements For the year ended 31 December 2011

28 29
3. SIGNIFICANT ACCOUNTING POlICIES (Continued)
3.5 Financial assets (Continued)
Financial assets are classified into the following specified categories: ‘cash and cash equivalents’, ‘financial assets at fair value through profit or loss’, ‘available for sale investments’ and ‘trade receivables’. The classification depends on the nature and purpose of the financial assets and is determined at the time of initial recognition.
Effective interest rate methodThe effective interest rate is a method of calculating the amortised cost of a financial asset and of allocating interest income over the relevant period. The effective interest rate is the rate that exactly discounts estimated future cash receipts through the expected life of the financial asset, or, where appropriate, a shorter period.
Cash and cash equivalentsCash and cash equivalents comprise cash on hand and bank balances.
Financial assets at fair value through profit or loss (“FVTPL”)Financial assets are classified as at FVTPL where the financial asset is either held for trading or it is designated as at FVTPL. A financial asset is classified as held for trading if:
it has been acquired principally for the purpose of selling in the near future; or(i) it is a part of an identified portfolio of financial instruments that the Group manages together and (ii) has a recent actual pattern of short-term profit-taking; or it is a derivative that is not designated and effective as a hedging instrument. (iii)
A financial asset other than a financial asset held for trading may be designated as at FVTPL upon initial recognition if:
such designation eliminates or significantly reduces a measurement or recognition inconsistency (i) that would otherwise arise; or the financial asset forms part of a Group of financial assets or financial liabilities or both, (ii) which is managed and its performance is evaluated on a fair value basis, in accordance with the Group’s documented risk management or investment strategy, and information about the Grouping is provided internally on that basis; or it forms part of a contract containing one or more embedded derivatives, and IAS 39 Financial (iii) Instruments: Recognition and Measurement permits the entire combined contract (asset or liability) to be designated as at FVTPL.
Financial assets at FVTPL are stated at fair value, with any resultant gain or loss recognised in the consolidated statement of income. Fair value is determined in the manner described in note 21.
Available for sale investments Available for sale investments are initially measured at cost which is the fair value of consideration given. Subsequent to initial recognition, available for sale investments are measured at fair value. For investments traded in organised financial markets, fair value is determined by reference to the last quoted bid price at the close of business on the financial position date.
Notes to the consolidated financial statements For the year ended 31 December 2011

29
3. SIGNIFICANT ACCOUNTING POlICIES (Continued)
3.5 Financial assets (Continued)
For investments where there is no quoted market price, a reasonable estimate of fair value is determined by reference to the current market value of another instrument which is substantially the same or is based on the expected cash flows or the underlying net asset base of the investment. Investments whose fair value cannot be reliably measured are carried at cost less any impairment loss.
Gains or losses arising from changes in fair value of available for sale investments are recognised directly in other comprehensive income and accumulated in the fair value reserve until the investment is sold, collected, or otherwise disposed of, or until the investment is determined to be impaired at which time the cumulative gain or loss previously recognised in the fair value reserve is reclassified to the consolidated statement of income for the period in which they arise. Foreign exchange gains and losses on monetary assets, are recognised directly in the consolidated statement of income.
Dividends on available for sale equity instruments are recognised in the consolidated statement of income when the Group’s right to receive the dividends is established.
Trade receivablesTrade receivables are measured at initial recognition at fair value, and are subsequently measured at amortised cost using the effective interest rate method. Appropriate allowances for estimated irrecoverable amounts are recognised in the consolidated statement income when there is objective evidence the asset is impaired. The allowance recognised is measured as the difference between the asset’s carrying amount and the present value of estimated future cash flows discounted at the effective rate computed at initial recognition.
Inventories3.6 Inventories are stated at the lower of cost or net realizable value after making allowance for any slow moving, obsolete or damaged items. Net realizable value is the estimated selling price in the ordinary course of business, less the estimated costs of completion and selling expenses. The cost of inventories is based on the weighted average cost and includes expenditure incurred in acquiring the inventories and bringing them to their existing location and condition. In the case of manufactured inventories and work in progress, cost includes an appropriate share of overheads based on normal operating capacity.
Financial liabilities3.7
The Group’s financial liabilities include bank borrowings and trade payables.
Trade payablesTrade payables are initially measured at fair value, and are subsequently measured at amortised cost, using the effective interest rate method.
Notes to the consolidated financial statements For the year ended 31 December 2011

30 31
3. SIGNIFICANT ACCOUNTING POlICIES (Continued)
3.7 Financial liabilities (Continued)
Bank borrowingsInterest bearing bank loans are initially measured at fair value, and are subsequently measured at amortised cost, using the effective interest rate method. Any difference between the proceeds (net of transaction costs) and the settlement or redemption of borrowings is recognised over the term of the borrowings in accordance with the Group’s accounting policy for borrowing costs.
Derecognition of financial liabilitiesA financial liability is derecognised when the obligation specified in the contract is discharged, cancelled or expired.
Provision for employees’ indemnity3.8 Provision is made for amounts payable to employees under the Kuwaiti Labour Law and employment contracts. This liability, which is unfunded, represents the amount payable to each employee as a result of involuntary termination on the financial position date, and approximates the present value of the final obligation.
Revenue recognition3.9 Revenue is measured at the fair value of the consideration received or receivable. Revenue is reduced for estimated customer returns, rebates and other similar allowances.
Revenue from the sale of goods is recognised when all the following conditions are satisfied:
• the Group has transferred to the buyer the significant risks and rewards of ownership of the goods;• the Group retains neither continuing managerial involvement to the degree usually associated with
ownership nor effective control over the goods sold;• the amount of revenue can be measured reliably;• it is probable that the economic benefits associated with the transaction will flow to the entity; and• the costs incurred or to be incurred in respect of the transaction can be measured reliably.
Service revenue is recognized in the consolidated statement of income in proportion to the stage of completion of the transaction at the financial position date. The method used determines services performed as a percentage of total services to be performed and applies this percentage to total revenue expected. No revenue is recognised if there are significant uncertainties regarding recovery of the consideration due, associated costs or the possible return of goods.
Dividend income from investments is recognised when the shareholder’s right to receive payment has been established.
Interest income is accrued on a time basis, by reference to the principal outstanding and at the effective interest rate applicable, which is the rate that exactly discounts estimated future cash receipts through the expected life of the financial asset to that asset’s net carrying amount.
Notes to the consolidated financial statements For the year ended 31 December 2011
31
3. SIGNIFICANT ACCOUNTING POlICIES (Continued)
Foreign currency translation3.10
Transactions in foreign currencies are recorded in KD at the rate of exchange ruling at the date of the transaction. Monetary assets and liabilities denominated in foreign currencies are translated at the rate of exchange ruling at the financial position date. Exchange differences arising on settlement or translation of monetary items are taken to the consolidated statement of income. Non-monetary items carried at fair value that are denominated in foreign currencies are translated at the rates prevailing on the date when the fair value was determined. Non-monetary items that are measured in terms of historical cost in a foreign currency are not retranslated. Translation differences on non-monetary items such as equity investments which are classified as financial assets at fair value through profit or loss are reported as part of the fair value gain or loss.
Impairment of tangible assets3.11
At each financial position date, the Group reviews the carrying amounts of its tangible assets to determine whether there is any indication that those assets have suffered an impairment loss. If any such indication exists, the recoverable amount of the asset is estimated in order to determine the extent of the impairment loss (if any). Where it is not possible to estimate the recoverable amount of an individual asset, the Group estimates the recoverable amount of the cash-generating unit to which the asset belongs. Where a reasonable and consistent basis of allocation can be identified, corporate assets are also allocated to individual cash-generating units, or otherwise they are allocated to the smallest group of cash-generating units for which a reasonable and consistent allocation basis can be identified.
Recoverable amount is the higher of fair value less costs to sell and value in use. In assessing value in use, the estimated future cash flows are discounted to their present value using a discount rate that reflects current market assessments of the time value of money and the risks specific to the asset for which the estimates of future cash flows have not been adjusted.
If the recoverable amount of an asset (or cash-generating unit) is estimated to be less than its carrying amount, the carrying amount of the asset (cash-generating unit) is reduced to its recoverable amount. An impairment loss is recognised immediately in the consolidated statement of income, unless the relevant asset is carried at a revalued amount, in which case the impairment loss is treated as a revaluation decrease.
Where an impairment loss subsequently reverses, the carrying amount of the asset (cash-generating unit) is increased to the revised estimate of its recoverable amount, but so that the increased carrying amount does not exceed the carrying amount that would have been determined had no impairment loss been recognised for the asset (cash-generating unit) in prior years. A reversal of an impairment loss is recognised immediately in the consolidated statement of income, unless the relevant asset is carried at a revalued amount, in which case the reversal of the impairment loss is treated as a revaluation increase.
Notes to the consolidated financial statements For the year ended 31 December 2011

32 33
3. SIGNIFICANT ACCOUNTING POlICIES (Continued)
Impairment of financial assets3.12
Financial assets, other than those at FVTPL, are assessed for indicators of impairment at each financial position date. Financial assets are considered to be impaired where there is objective evidence that, as a result of one or more events that occurred after the initial recognition of the financial asset, the estimated future cash flows of the financial asset have been impacted.
For financial assets classified as available for sale investments, a significant or prolonged decline in the fair value of the security below its cost is considered to be objective evidence of impairment.
For trade receivables, objective evidence of impairment could include: (i) significant financial difficulty of the issuer or counterparty; or (ii) default or delinquency in interest or principal payments; or (iii) it becoming probable that the borrower will enter bankruptcy or financial re-organisation.
For certain categories of financial assets, such as trade receivables, assets that are assessed not to be impaired individually are subsequently assessed for impairment on a collective basis.
Objective evidence of impairment for a portfolio of receivables could include the Group’s past experience of collecting payments, an increase in the number of delayed payments in the portfolio past the average credit period of 90 days, as well as observable changes in national or local economic conditions that correlate with default on receivables.
For financial assets carried at amortised cost, the amount of the impairment is the difference between the asset’s carrying amount and the present value of estimated future cash flows, discounted at the financial asset’s original effective interest rate. The carrying amount of the financial asset is reduced by the impairment loss directly for all financial assets with the exception of receivables, where the carrying amount is reduced through the use of an allowance account. When a trade receivable is considered uncollectible, it is written off against the allowance account. Subsequent recoveries of amounts previously written off are credited against the allowance account. Changes in the carrying amount of the allowance account are recognised in the consolidated statement of income.
When an available for sale investment is considered to be impaired, cumulative gains or losses previously recognised in other comprehensive income are reclassified to profit or loss in the period.
With the exception of available for sale investments, if, in a subsequent period, the amount of the impairment loss decreases and the decrease can be related objectively to an event occurring after the impairment was recognised, the previously recognised impairment loss is reversed through the consolidated statement of income to the extent that the carrying amount of the investment at the date the impairment is reversed does not exceed what the amortised cost would have been had the impairment not been recognised.
In respect of available for sale investments, impairment losses previously recognised through the consolidated statement of income are not reversed through the consolidated statement of income. Any increase in fair value subsequent to an impairment loss is recognised directly in other comprehensive income.
Notes to the consolidated financial statements For the year ended 31 December 2011
33
3. SIGNIFICANT ACCOUNTING POlICIES (Continued)
Provisions3.13
A provision is recognized in the consolidated statement of financial position when the Group has a legal or constructive obligation as a result of a past event, it is probable that an outflow of economic benefits will be required to settle the obligation and a reliable estimate can be made of the amount of the obligation. If the effect is material, provisions are determined by discounting the expected future cash flows at a rate that reflects current market assessments of the time value of money and, where appropriate, the risks specific to the liability.
Treasury shares3.14
Treasury shares consist of the Group’s own shares that have been issued, subsequently reacquired by the Group and not yet reissued, sold or cancelled. No gain or loss is recognized in the consolidated statement of income on the purchase, sale, issue or cancellation of the treasury shares. Consideration paid or received is directly recognized in equity. When the treasury shares are sold, gains are credited to a separate account in shareholders’ equity (treasury shares reserve) which is not distributable. Any realized losses are charged to the same account to the extent of the credit balance on that account. Any excess losses are charged to retained earnings and then to reserves.
Gains realized subsequently on the sale of treasury shares are first used to offset any previously recorded losses in the order of reserves, retained earnings and treasury shares reserve account. No cash dividends are paid on these shares. The issue of bonus shares increases the number of treasury shares proportionately and reduces the average cost per share without affecting the total cost of treasury shares.
Dividends3.15 Dividends are recognized as a liability in the Group’s consolidated financial statements in the period in which the dividends are approved by the shareholders.
Significant accounting judgments and estimation uncertainty3.16
Accounting judgments
In the process of applying the Group’s accounting policies, management has used judgments and made estimates in determining the amounts recognised in the consolidated financial statements. The most significant use of judgments and estimates are as follows:
Classification of investments
Management decides on acquisition of an investment whether it should be classified as financial assets at fair value through profit or loss or as available for sale investments.
Classification of investments as financial assets at fair value through profit or loss depends on how management monitor the performance of these investments. When they are not classified as held for trading but have readily available reliable fair values and the changes in fair values are reported as part of consolidated statement of income in the management accounts, they are classified as financial assets at fair value through profit or loss. All other investments are classified as available for sale.
Notes to the consolidated financial statements For the year ended 31 December 2011

34
3. SIGNIFICANT ACCOUNTING POlICIES (Continued)
3.16 Significant accounting judgments and estimation uncertainty (continued)
Impairment of investmentsThe Group treats available for sale investments as impaired when there has been a significant or prolonged decline in the fair value below its cost. The determination of what is “significant” or “prolonged” requires significant judgment. In addition, the Group also evaluates among other factors, normal volatility in the share price for quoted investments and the future cash flows and the discount factors for unquoted investments.
Estimation uncertainty
The key assumptions concerning the future and other key sources of estimation uncertainty at the financial position date, that have a significant risk of causing a material adjustment to the carrying amounts of assets and liabilities within the next financial year are discussed below:
Valuation of unquoted equity investments
Valuation of unquoted equity investments is normally based on one of the following:• recent arm’s length market transactions;• current fair value of another instrument that is substantially the same;• other valuation models.
Useful lives of tangible assetsAs described in note 3.4, the Group’s reviews the estimated useful lives over which its tangible assets are depreciated. The Group’s management is satisfied that the estimates of useful lives are appropriate.
Notes to the consolidated financial statements For the year ended 31 December 2011
PRO
PER
Ty,
Pl
AN
T A
ND
EQ
UIP
ME
NT
4.
Bui
ldin
gPl
ant a
nd
Mac
hine
ryFu
rnitu
re, f
ixtu
res
and
com
pute
rsVe
hicl
esC
apita
l wor
k in
pro
gres
sTo
tal
KD
KD
KD
KD
KD
KD
Cos
tA
t 1 Ja
nuar
y 20
102,
514,
184
8,85
1,27
263
2,70
631
4,66
71,
487,
181
13,8
00,0
10A
dditi
ons
63,0
8184
1,42
419
,235
101,
828
-1,
025,
568
Tran
sfer
s -
1,48
7,18
1-
-(1
,487
,181
)-
Dis
posa
ls-
(21,
247)
-(9
1,59
0)-
(112
,837
)A
t 31
Dec
embe
r 201
02,
577,
265
11,1
58,6
3065
1,94
132
4,90
5-
14,7
12,7
41A
dditi
ons
22,3
1867
8,66
045
,627
153
-74
6,75
8D
ispo
sals
-(5
6,02
3)-
(9,6
11)
-(6
5,63
4)A
t 31
Dec
embe
r 201
12,
599,
583
11,7
81,2
6769
7,56
831
5,44
7-
15,3
93,8
65
Acc
umul
ated
dep
reci
atio
nA
t 1 Ja
nuar
y 20
1046
6,49
54,
266,
098
323,
618
220,
525
-5,
276,
736
Cha
rge
for t
he y
ear
125,
374
909,
872
138,
680
64,2
13-
1,23
8,13
9R
elat
ing
to d
ispo
sals
-(7
,812
)-
(84,
996)
-(9
2,80
8)A
t 31
Dec
embe
r 201
059
1,86
95,
168,
158
462,
298
199,
742
-6,
422,
067
Cha
rge
for t
he y
ear
125,
375
952,
429
95,2
4541
,533
-1,
214,
582
Rel
atin
g to
dis
posa
ls-
(26,
144)
-(9
,611
)-
(35,
755)
At 3
1 D
ecem
ber 2
011
717,
244
6,09
4,44
355
7,54
323
1,66
4-
7,60
0,89
4
Car
ryin
g va
lue
As a
t 31
Dec
embe
r 201
11,
882,
339
5,68
6,82
414
0,02
583
,783
-7,
792,
971
As a
t 31
Dec
embe
r 201
01,
985,
396
5,99
0,47
218
9,64
312
5,16
3-
8,29
0,67
4A
nnua
l dep
reci
atio
n ra
tes
5%10
%20
% -
33.3
3%20
% -
33.3
3%
The
Gro
up’s
bui
ldin
gs a
re e
rect
ed o
n la
nd le
ased
from
the
Gov
ernm
ent o
f Kuw
ait.
The
Gro
up’s
ass
ets a
re m
ortg
aged
aga
inst
term
loan
s gra
nted
by
the
Indu
stria
l Ban
k of
Kuw
ait K
.S.C
(see
not
e 14
).
Not
es to
the
cons
olid
ated
fina
ncia
l sta
tem
ents
Fo
r th
e ye
ar e
nded
31
Dec
embe
r 20
11
35

36 37
INVENTORIES5.
2011 2010
KD KD
Cement and acidizing chemicals 901,434 816,382
Environmental chemicals 40,647 45,430
Spares and tools 602,110 557,795
1,544,191 1,419,607
TRADE6. RECEIVABlES
2011 2010
KD KD
Trade receivables 2,345,405 2,616,118
Less: allowance for doubtful debts (40,000) (20,000)
2,305,405 2,596,118
At the financial position date, net trade receivables amounting to KD 612,974 (2010: KD 495,883) were past due but not considered to be impaired. The ageing analysis of these receivables is as follows:
Ageing of past due but not impaired
2011 2010KD KD
90 – 120 days 165,477 193,950120 – 180 days 350,335 165,812180 – 365 days 62,962 77,511Above 365 days 34,200 58,610Total 612,974 495,883
Accounts receivable that are not past due are considered collectible based on historic experience.
Notes to the consolidated financial statements For the year ended 31 December 2011
37
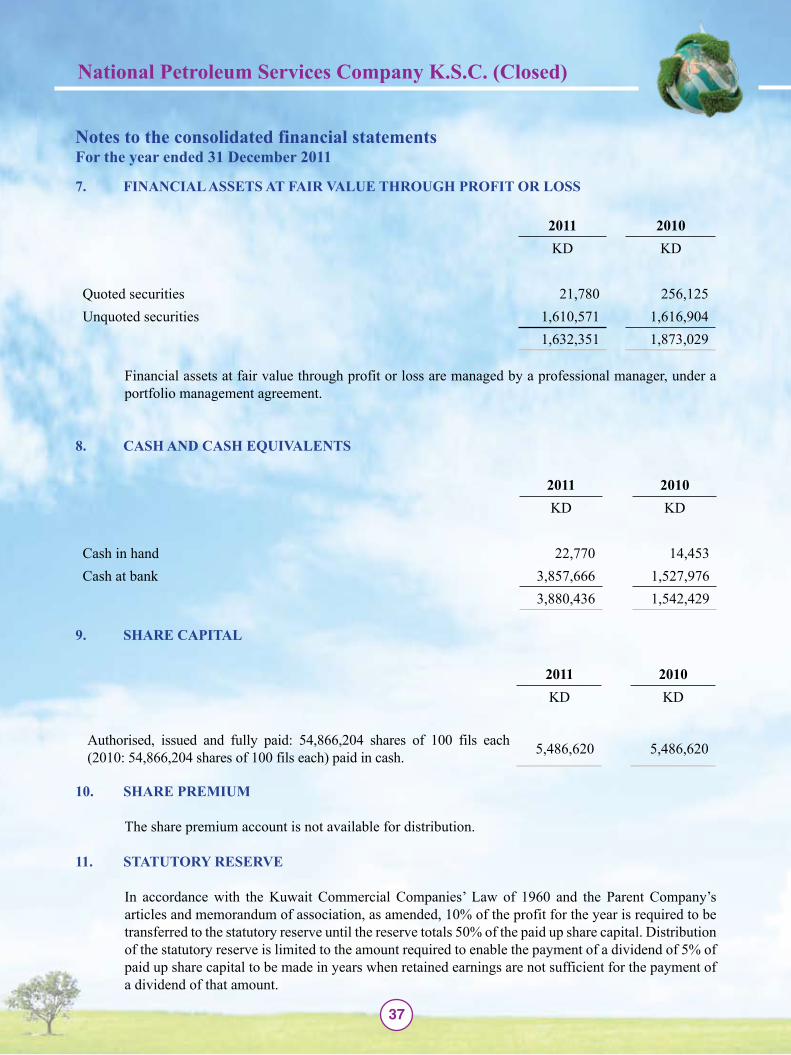
FINANCIAl ASSETS AT FAIR VAlUE THROUGH PROFIT OR lOSS7.
2011 2010KD KD
Quoted securities 21,780 256,125Unquoted securities 1,610,571 1,616,904
1,632,351 1,873,029
Financial assets at fair value through profit or loss are managed by a professional manager, under a portfolio management agreement.
CASH AND CASH EQUIVAlENTS8.
2011 2010KD KD
Cash in hand 22,770 14,453Cash at bank 3,857,666 1,527,976
3,880,436 1,542,429
SHARE CAPITAl9.
2011 2010KD KD
Authorised, issued and fully paid: 54,866,204 shares of 100 fils each (2010: 54,866,204 shares of 100 fils each) paid in cash. 5,486,620 5,486,620
SHARE PREMIUM10.
The share premium account is not available for distribution.
STATUTORy RESERVE11.
In accordance with the Kuwait Commercial Companies’ Law of 1960 and the Parent Company’s articles and memorandum of association, as amended, 10% of the profit for the year is required to be transferred to the statutory reserve until the reserve totals 50% of the paid up share capital. Distribution of the statutory reserve is limited to the amount required to enable the payment of a dividend of 5% of paid up share capital to be made in years when retained earnings are not sufficient for the payment of a dividend of that amount.
Notes to the consolidated financial statements For the year ended 31 December 2011
38 39
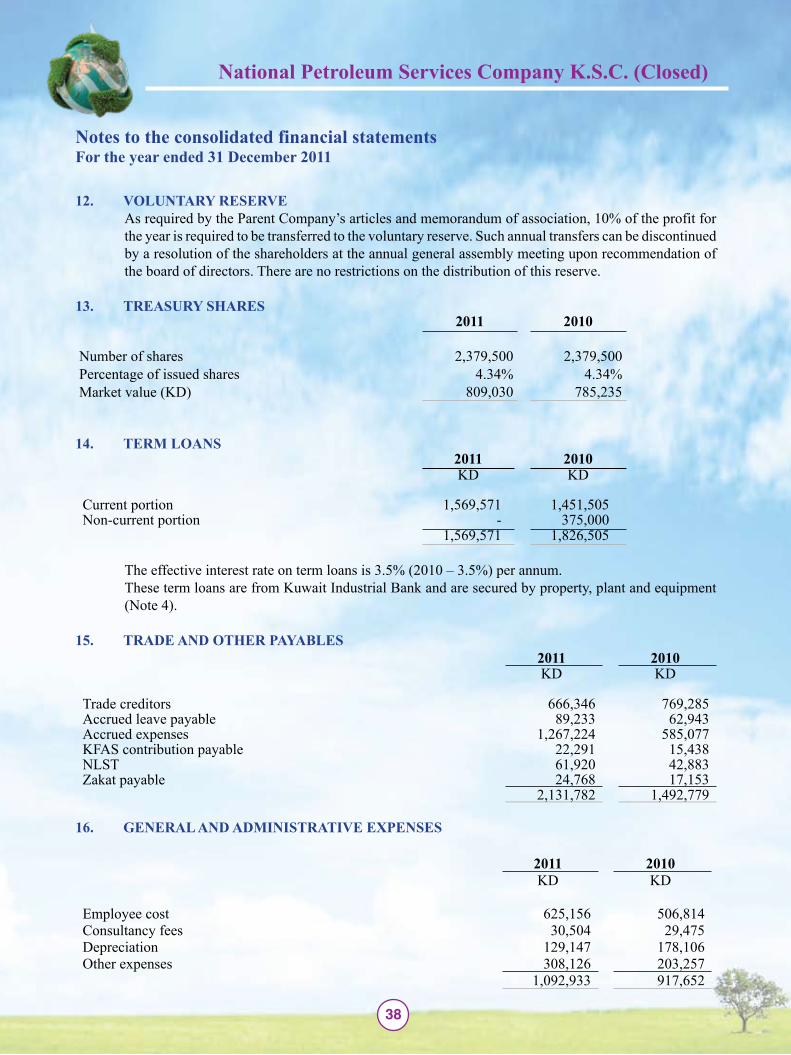
VOlUNTARy12. RESERVEAs required by the Parent Company’s articles and memorandum of association, 10% of the profit for the year is required to be transferred to the voluntary reserve. Such annual transfers can be discontinued by a resolution of the shareholders at the annual general assembly meeting upon recommendation of the board of directors. There are no restrictions on the distribution of this reserve.
TREASURy13. SHARES2011 2010
Number of shares 2,379,500 2,379,500Percentage of issued shares 4.34% 4.34%Market value (KD) 809,030 785,235
TERM lOANS14. 2011 2010KD KD
Current portion 1,569,571 1,451,505Non-current portion - 375,000
1,569,571 1,826,505
The effective interest rate on term loans is 3.5% (2010 – 3.5%) per annum.These term loans are from Kuwait Industrial Bank and are secured by property, plant and equipment (Note 4).
TRADE AND OTHER PAyABlES15. 2011 2010KD KD
Trade creditors 666,346 769,285Accrued leave payable 89,233 62,943Accrued expenses 1,267,224 585,077KFAS contribution payable 22,291 15,438NLST 61,920 42,883Zakat payable 24,768 17,153
2,131,782 1,492,779
GENERAl AND ADMINISTRATIVE EXPENSES16.
2011 2010KD KD
Employee cost 625,156 506,814Consultancy fees 30,504 29,475Depreciation 129,147 178,106Other expenses 308,126 203,257
1,092,933 917,652
Notes to the consolidated financial statements For the year ended 31 December 2011

39
EMPlOyEE COST AND DEPRECIATION17.
Employee cost and depreciation charges are included in the consolidated statement of income under the following categories:
2011 2010KD KD
Employee costCost of sales and services 2,693,952 1,833,532General and administrative expenses 625,156 506,815
3,319,108 2,340,347DepreciationCost of sales and services 1,085,435 1,060,032General and administrative expenses 129,147 178,106
1,214,582 1,238,138
EARNINGS PER SHARE18.
Earnings per share is computed by dividing net income for the year by the weighted average numbers of shares outstanding during the year.
2011 2010
Net profit for the year (KD) 2,338,400 1,588,570Weighted average number of issued and paid up shares of the parent Company excluding treasury shares (Nos.) 52,486,704 52,486,704
Earnings per share (fils) 44.55 30.27
RElATED PARTy TRANSACTIONS19.
Related parties consist shareholders, directors and executive officers of the Group, their families and entities controlled, jointly controlled or significantly influenced by such parties. All related party transactions approximate arms length terms and are approved by the Group’s management.
The related party transactions during the year are as follows: 2011 2010KD KD
Compensation of key management personnelShort term benefits 170,025 149,500Employees’ indemnity 9,134 4,615
179,159 154,115
Notes to the consolidated financial statements For the year ended 31 December 2011

40 41
SEGMENTAl REPORTING20.
The Group identifies its operating segments on the basis of internal reports about components of the Group that are regularly reviewed by the chief operating decision maker in order to assess its performance.
Information regarding the Group’s reportable segments is presented below.Financial information about the operating segments for the year ended 31 December 2011 is set out below:
Oil field services
Industrial products and
services Others TotalKD KD KD KD
Segment revenue 8,601,771 7,775,595 - 16,377,366Segment expenses (5,630,873) (7,232,068) - (12,862,941)Segment result 2,970,898 543,527 - 3,514,425Unallocated income 130,654Unallocated expenses (1,306,679)Profit for the year 2,338,400
Segment assets 17,127,378 537,568 - 17,664,946
Segment liabilities 4,271,049 - - 4,271,049
The Group operates from one location in Kuwait and all its customers are based in Kuwait. The Group’s assets are based in Kuwait.
Financial information about operating segments for the year ended 31 December 2010 are set out below:
Oil field services
Industrial products and
servicesOthers Total
KD KD KD KD
Segment revenue 7,405,601 3,129,721 22,903 10,558,225Segment expenses (5,679,406) (2,440,515) - (8,119,921)Segment result 1,726,195 689,206 22,903 2,438,304Unallocated income 271,024Unallocated expenses (1,120,758)Profit for the year 1,588,570
Segment assets 13,881,155 376,297 2,060,882 16,318,334
Segment liabilities 4,203,951 - - 4,203,951
Notes to the consolidated financial statements For the year ended 31 December 2011

41
FINANCIAl INSTRUMENTS21.
Capital risk management(a)
The Group’s objectives when managing capital are to safeguard the Group’s ability to continue as a going concern, through the optimisation of the debt and equity balance so that it can continue to provide returns for shareholders and benefits for other stakeholders and to provide an adequate return to shareholders by pricing products and services commensurately with the level of risk.
The Group sets the amount of capital in proportion to risk. The Group manages the capital structure and makes adjustments to it in the light of changes in economic conditions and the risk characteristics of the underlying assets. In order to maintain or adjust the capital structure, the Group may adjust the amount of dividends paid to shareholders, return capital to shareholders, issue new shares or debt and or sell assets to reduce debt.
For the purpose of capital risk management, the total capital resources consist of the following components:
2011 2010Term loans 1,569,571 1,826,505Less: cash and cash equivalents (3,880,436) (1,542,429)Net debt (2,310,865) 284,076Total equity 13,393,897 12,114,383Total capital resources 11,083,032 12,398,459Gearing ratio - 2.3%
Credit risk(b)
Credit risk is the risk that one party to a financial instrument will fail to discharge an obligation and cause the other party to incur a financial loss. The Group credit policy and exposure to credit risk are monitored on an ongoing basis. The Group seeks to avoid undue concentration of risks with individuals or Group of customers in specific locations or business through diversification of activities. It also obtains security when appropriate.
The maximum credit risk exposure arising from default of the counter-party is limited to the carrying amount of cash and cash equivalents, trade receivables.
Interest rate risk (c)
Interest rate risk is the risk that the value of a financial instrument will fluctuate due to changes in market interest rates. The Group is exposed to interest rate risk as it borrows funds at both fixed and floating interest rates. The risk is managed by the Group by maintaining an appropriate mix between fixed and floating rate borrowings.
The following table demonstrates the sensitivity of the statement of income to reasonably possible changes in interest rates, with all other variables held constant.
Notes to the consolidated financial statements For the year ended 31 December 2011

42 43
21. FINANCIAl INSTRUMENTS (continued)
(c) Interest rate risk (continued)
Increase / (Decrease) in interest rate
Effect on profit for the year
KD2011KD 1,569,571 + 50 basis points +7,8482010KD 1,826,505 + 50 basis points +9,133
Foreign currency risk management(d)
Foreign currency risk is the risk that the value of a financial instrument will fluctuate due to changes in foreign exchange rates. Management believes that there is minimal risk of significant losses due to exchange rate fluctuations and consequently the Group does not hedge foreign currency exposure.
The carrying amounts of the Group’s foreign currency denominated monetary assets and monetary liabilities at the financial position date are as follows:
liabilities Assets2011 2010 2011 2010KD KD KD KD
US Dollars 66,421 1,672,951 502,100 459,771Euro - - 1,104 53
66,421 1,672,951 503,204 459,824
Foreign currency sensitivity analysisAt 31 December 2011, if the foreign currencies had weakened/strengthened by 5% against the KD with all other variables held constant, profit for the year would have been KD 21,839 (2010: KD 60,659 higher/lower mainly due to the foreign exchange gains / (losses) on translation of foreign currency cash and cash equivalents, trade receivables and trade payables.
liquidity risk(e)
Liquidity risk is the risk that the Group will be unable to meet its liabilities when they fall due. To limit this risk, management has arranged diversified funding sources, manages assets with liquidity in mind, and monitors liquidity on a daily basis.
Ultimate responsibility for liquidity risk management rests with the board of directors, which has built an appropriate liquidity risk management framework for the management of the Group’s short, medium and long-term funding and liquidity management requirements. The Group manages liquidity risk by maintaining adequate reserves, banking facilities and reserve borrowing facilities, by continuously monitoring forecast and actual cash flows and matching the maturity profiles of financial assets and liabilities. Included in note 15 is a listing of additional undrawn facilities that the Group has at its disposal to further reduce liquidity risk.
Notes to the consolidated financial statements For the year ended 31 December 2011
43
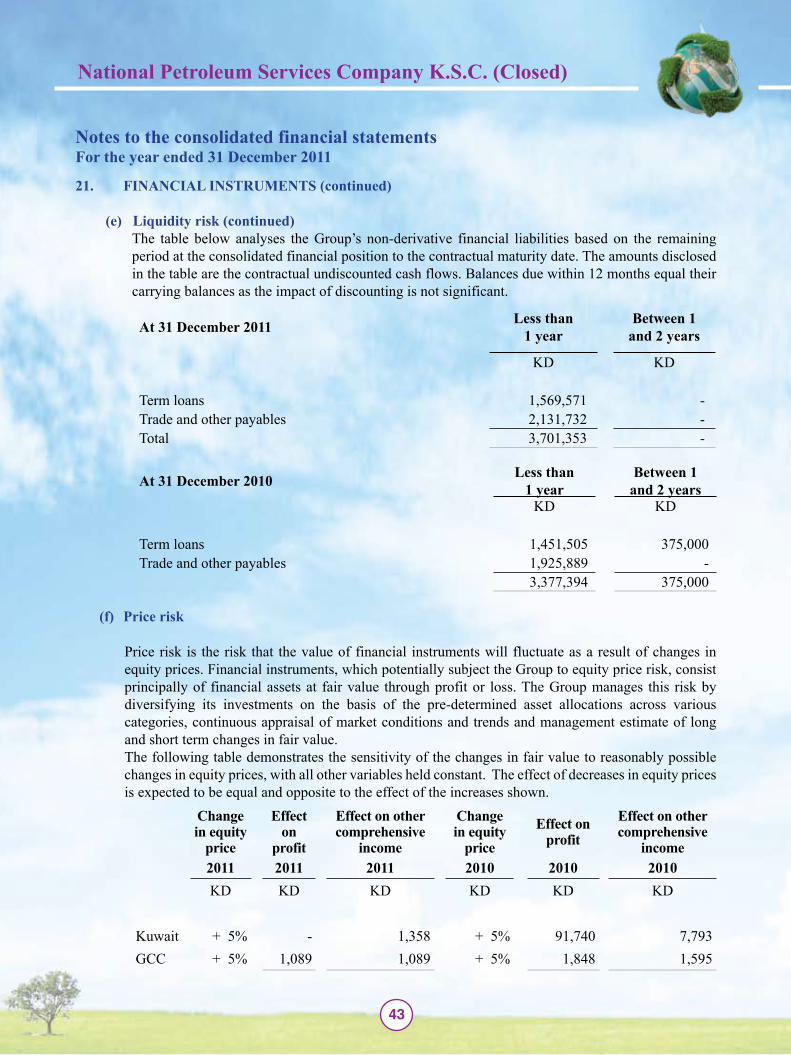
21. FINANCIAl INSTRUMENTS (continued)
(e) liquidity risk (continued)The table below analyses the Group’s non-derivative financial liabilities based on the remaining period at the consolidated financial position to the contractual maturity date. The amounts disclosed in the table are the contractual undiscounted cash flows. Balances due within 12 months equal their carrying balances as the impact of discounting is not significant.
At 31 December 2011 less than 1 year
Between 1 and 2 years
KD KD
Term loans 1,569,571 -Trade and other payables 2,131,732 -Total 3,701,353 -
At 31 December 2010 less than 1 year
Between 1 and 2 years
KD KD
Term loans 1,451,505 375,000Trade and other payables 1,925,889 -
3,377,394 375,000
Price risk(f)
Price risk is the risk that the value of financial instruments will fluctuate as a result of changes in equity prices. Financial instruments, which potentially subject the Group to equity price risk, consist principally of financial assets at fair value through profit or loss. The Group manages this risk by diversifying its investments on the basis of the pre-determined asset allocations across various categories, continuous appraisal of market conditions and trends and management estimate of long and short term changes in fair value.The following table demonstrates the sensitivity of the changes in fair value to reasonably possible changes in equity prices, with all other variables held constant. The effect of decreases in equity prices is expected to be equal and opposite to the effect of the increases shown.
Change in equity
price
Effect on
profit
Effect on other comprehensive
income
Change in equity
priceEffect on
profit Effect on other comprehensive
income2011 2011 2011 2010 2010 2010KD KD KD KD KD KD
Kuwait + 5% - 1,358 + 5% 91,740 7,793GCC + 5% 1,089 1,089 + 5% 1,848 1,595
Notes to the consolidated financial statements For the year ended 31 December 2011

44 45
21. FINANCIAl INSTRUMENTS (continued)
Fair value of financial instruments(g) Fair value of financial instruments carried at amortised costa) In the opinion of management, carrying amounts of the financial instruments carried at amortised cost are not materially different from their respective fair values as at the financial position date.Fair value measurements recognised in the consolidated statement of financial positionb) The following table provides an analysis of financial instruments that are measured subsequent to initial recognition at fair value, grouped into Levels 1 to 3 based on the degree to which the fair value is observable.
• Level 1 fair value measurements are those derived from quoted prices (unadjusted) in active markets for identical assets or liabilities.
• Level 2 fair value measurements are those derived from inputs other than quoted prices included within Level 1 that are observable for the asset or liability, either directly (i.e. as prices) or indirectly (i.e. derived from prices).
• Level 3 fair value measurements are those derived from valuation techniques that include inputs for the asset or liability that are not based on observable market data (unobservable inputs).31 December 2011 level 1 level 2 level 3 Total
KD KD KD KD
Financial assets at fair value through profit or loss
Quoted equities 21,780 - - 21,780
Unquoted equities - 1,610,571 - 1,610,571
Available-for-sale investments
Quoted equities 34,159 - - 34,159
Unquoted equities - 142,488 - 142,488
Total 55,939 1,753,059 - 1,808,998
31 December 2010 level 1 level 2 level 3 Total
KD KD KD KD
Financial assets at fair value through profit or loss
Quoted equities 256,125 - - 256,125
Unquoted equities - 1,616,904 - 1,616,904
Available-for-sale investments
Quoted equities 33,759 - - 33,759
Unquoted equities - 153,994 - 153,994
Total 289,884 1,770,898 - 2,060,782
Notes to the consolidated financial statements For the year ended 31 December 2011

45
DIVIDENDS22.
The Annual General Assembly meeting held on 8 April 2011 approved the annual consolidated financial statements for the year ended 31 December 2010 and the distribution of a cash dividend of 20% (2009: 25%).
The board of directors have proposed cash dividend of 25% and bonus shares of 5% of the paid up share capital for the year ended 31 December 2011. This proposal is subject to the approval of the shareholders’ General Assembly.
CONTINGENT lIABIlITIES23.
2011 2010
KD KD
Letters of credit 696,802 943,071
Letters of guarantee 3,255,883 4,840,180
3,952,685 5,783,251
Notes to the consolidated financial statements For the year ended 31 December 2011

46


![Untitled-1 [app.billabonghighbhopal.com]app.billabonghighbhopal.com/.../VISHESHAN_PRACTICE_WORK.pdf · 2019. 3. 16. · Bi\hl Înng ROO . Bi\hl Înng ROO . Bi\hl Înng ROO](https://static.documents.pub/doc/80x56/60c1085c3164d909ea1cceab/untitled-1-app-app-2019-3-16-bihl-nng-roo-bihl-nng-roo-bihl.jpg)


