The Journal of Experimental Biology – ACCEPTED AUTHOR MANUSCRIPT 1 Biomechanics and energetics of walking on uneven terrain 2 Alexandra S. Voloshina 1, 2 , Arthur D. Kuo 2 , Monica A. Daley 3 , and Daniel P. Ferris 1 3 4 1 School of Kinesiology, University of Michigan, Ann Arbor, MI, USA 5 2 Department of Mechanical Engineering, University of Michigan, Ann Arbor, MI, USA 6 3 Comparative Biomedical Sciences, The Royal Veterinary College, London, UK 7 8 9 Corresponding author address: [email protected]10 http://jeb.biologists.org/lookup/doi/10.1242/jeb.081711 Access the most recent version at J Exp Biol Advance Online Articles. First posted online on 2 August 2013 as doi:10.1242/jeb.081711 Copyright (C) 2013. Published by The Company of Biologists Ltd http://jeb.biologists.org/lookup/doi/10.1242/jeb.081711 Access the most recent version at First posted online on 2 August 2013 as 10.1242/jeb.081711
Transcript
The
Jou
rnal
of
Exp
erim
enta
l Bio
logy
– A
CC
EPT
ED
AU
TH
OR
MA
NU
SCR
IPT
1
Biomechanics and energetics of walking on uneven terrain 2
Alexandra S. Voloshina1, 2, Arthur D. Kuo2, Monica A. Daley3, and Daniel P. Ferris1 3
4 1School of Kinesiology, University of Michigan, Ann Arbor, MI, USA 5
2Department of Mechanical Engineering, University of Michigan, Ann Arbor, MI, USA 6 3Comparative Biomedical Sciences, The Royal Veterinary College, London, UK 7
http://jeb.biologists.org/lookup/doi/10.1242/jeb.081711Access the most recent version at J Exp Biol Advance Online Articles. First posted online on 2 August 2013 as doi:10.1242/jeb.081711
Copyright (C) 2013. Published by The Company of Biologists Ltd
http://jeb.biologists.org/lookup/doi/10.1242/jeb.081711Access the most recent version at First posted online on 2 August 2013 as 10.1242/jeb.081711
the semitendinosus of the medial hamstring (MH) muscles, during all treadmill trials. All EMG data 168
were collected only for the right leg. Bipolar surface electrodes (sample rate: 1000 Hz; Biometrics Ltd., 169
Ladysmith, VA) were placed over the belly center of the muscle and in parallel to the muscle according 170
to the procedure of Winter and Yack (1987). The inter-electrode distance was 2.0 cm for all trials and 171
electrode diameters were 1.0 cm. The EMG amplifier had a bandwidth of 20 Hz – 460 Hz. As with other 172
measurements, only the last 2.5 min of EMG data were used for data analysis. All electromyography 173
signals were high-pass filtered with a 20 Hz cutoff-frequency (4th order Butterworth filter, zero-lag) and 174
then full-wave rectified. We then normalized each muscle’s data to the maximum activation observed 175
for that same muscle over all three conditions for that subject (Winter and Yack, 1987; Yang and 176
Winter, 1984) and averaged over subjects to create representative EMG profiles. Standard deviations of 177
the EMG traces were found at each time point for every subject and condition and also averaged, to 178
determine mean standard deviation envelopes. Although the relationship between EMG variability and 179
metabolic cost is undetermined, this measure can indicate the level of perturbation to gait mechanics 180
from uneven terrain. To determine increases in muscle activation, we found the average of the 181
normalized EMG profile for each subject and condition. These average values were then averaged over 182
subjects. In addition, we assessed muscle co-activation as the amount of mutual contraction (MC) as 183
defined by Thoroughman and Shadmehr (1999) to indicate “wasted” contraction, for each stride for 184
three pairs of antagonistic muscles (SO/TA, MH/VM, MH/VL). To do so, we used the equation: 185
MC = min 𝑓!, 𝑓! 𝑑𝑡
where f1 and f2 are the full-wave rectified EMG profiles, averaged over one hundred steps, of the two 186
antagonistic muscles and min(f1, f2) is the minimum of the two profiles at each time point. Integrals were 187
computed over the duration of the whole stride and in 1% increments to identify where in the stride 188
cycle mutual contraction occurred. 189
The
Jou
rnal
of
Exp
erim
enta
l Bio
logy
– A
CC
EPT
ED
AU
TH
OR
MA
NU
SCR
IPT
190
Metabolic Rate 191
For all treadmill walking conditions, we measured the rate of VO2 using an open-circuit respirometry 192
system (CareFusion Oxycon Mobile, Hoechberg, Germany). We recorded 7 minutes of respirometry 193
data during a quiet standing trial, and 10 minutes for all walking trials. Although 3-minute trials are 194
sufficient to reach steady-state energy expenditure on uniform terrain (Poole and Richardson, 1997), we 195
expected walking on uneven terrain to be an increase in exercise intensity and allowed subjects 7.5 196
minutes of walking to reach steady-state before collection 2.5 minutes of data. We later confirmed that 197
subjects had reached steady-state in both biomechanics and energetics on the novel terrain conditions by 198
checking that no adaptation trends were still present in the last 2.5 minutes of data. We calculated the 199
metabolic energy expenditure rate of each subject using standard empirical equations yielding metabolic 200
rate 𝐸!"# (in W) (Brockway, 1987; Weir, 1949). Net metabolic rate was found by subtracting the 201
standing metabolic power from the metabolic power of all other conditions. We normalized the net 202
metabolic power for all conditions by dividing by subject body mass (kg). 203
204
Data and Statistical Analyses 205
To compare changes in variability for step parameter, joint parameter and EMG data, we averaged the 206
variability for each of the three conditions over all subjects. For step data, we defined variability as the 207
standard deviation of contiguous step distances or periods over time, for each subject. For joint 208
parameter and EMG data, means are found across trials for each point in relative stride cycle timing. 209
Similarly, joint parameter and EMG variability was defined for each subject and condition as the 210
standard deviation across trials for each point. We then report the mean variations (and standard 211
deviations) across subjects for each condition. Differences between the conditions were quantified by 212
performing repeated-measures ANOVAs on the data sets of interest. The significance level α was set at 213
0.05 and post hoc Holm-Sidak multiple comparison tests were performed where appropriate. 214
215
RESULTS 216
Walking on uneven terrain resulted in a variety of changes to gait compared to walking on smooth 217
terrain. Subjects walked with slightly shorter step lengths and substantially increased step variability. 218
Gait kinematics remained similar overall but knee and hip mechanical work increased on uneven terrain. 219
We also observed increased mean activity among multiple proximal leg muscles (VM, VL, RF, MH), 220
and greater muscle mutual contraction about all three joints on uneven terrain. In all variables, the two 221
smooth terrain conditions (with and without a foam layer) exhibited negligible differences between each 222
The
Jou
rnal
of
Exp
erim
enta
l Bio
logy
– A
CC
EPT
ED
AU
TH
OR
MA
NU
SCR
IPT
other. We therefore report comparisons mainly between the Uneven + Foam and Even + Foam 223
conditions. 224
225
Kinetics and Kinematics 226
Although mean step parameters changed little, there were large changes in step variability during 227
walking on the uneven surface when compared to the even foam surface (Table 1). Of the mean step 228
distances, only step length changed significantly, decreasing by 3.7%. Because walking speed was kept 229
fixed, this was accompanied by a 3.7% decrease in mean step duration. Variability of step width, length 230
and height all increased significantly by about 35%, 23%, and 105%, respectively. Step period 231
variability also increased significantly by 26.7%. 232
233
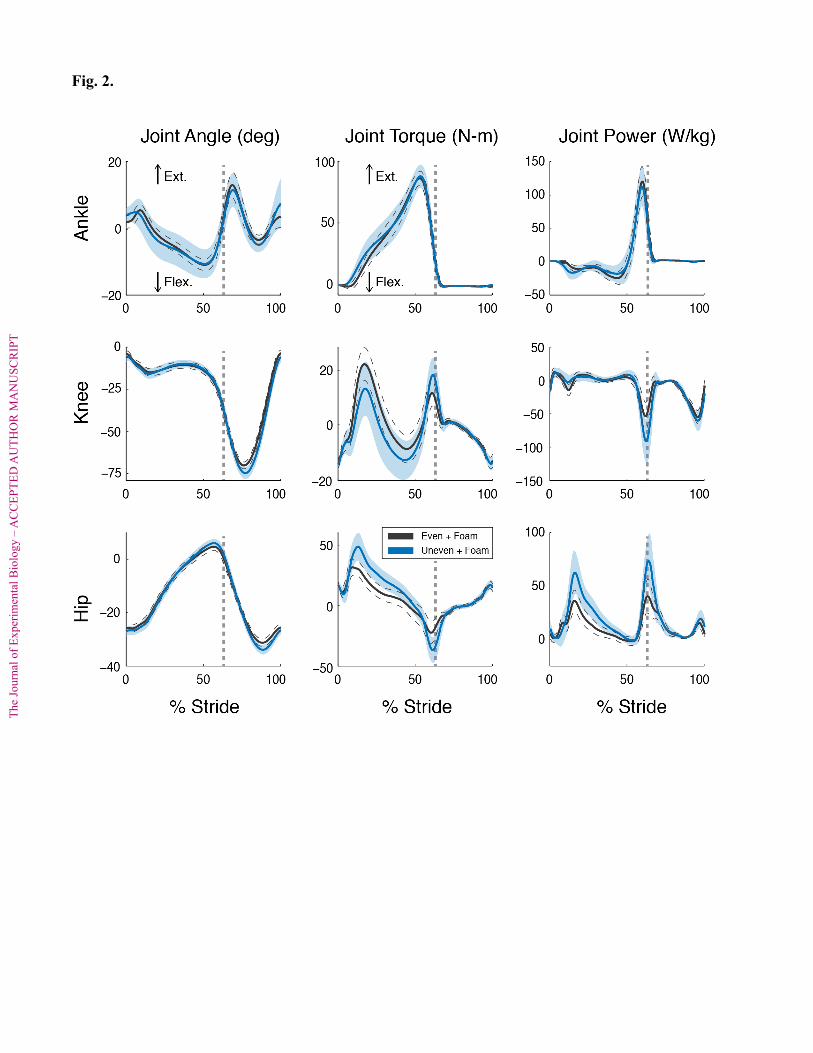
A number of effects were observed on joint kinematics and kinetics when subjects walked on uneven 234
terrain when compared to the even surface (Fig. 2). Qualitative examination of sagittal plane joint angles 235
on uneven terrain suggest slightly greater knee and hip flexion at mid-swing, perhaps associated with 236
greater ground clearance of the swing foot. Mean ankle angle trajectory changed little (Fig. 2). However, 237
on uneven terrain, we observed larger effects on the joint moments during stance, with increased knee 238
flexion and increased hip extension moments at mid-stance. At the end of stance during push-off, these 239
patterns reversed, with greater knee extension and hip flexion moments. The main changes in joint 240
power were also confined to the knee and hip, with increased peak powers, especially at push-off (by 241
about 65% and 85%, respectively) when walking on the uneven surface. Hip power also increased by 242
75% during mid-stance, at about 20% of stride time. Toe-off timing in the stride cycle did not appear to 243
differ between conditions. Joint trajectories were more variable on uneven terrain (Fig. 2). The ankle 244
angle variability more than doubled on uneven terrain, while the knee and hip variability increased by 245
about 30% (all p < 0.05). The mean ankle and knee torque variability both increased by approximately 246
50% (all p < 0.05). All joint power variability also increased by 50% or more on the uneven terrain 247
condition (all p < 0.05). 248
249
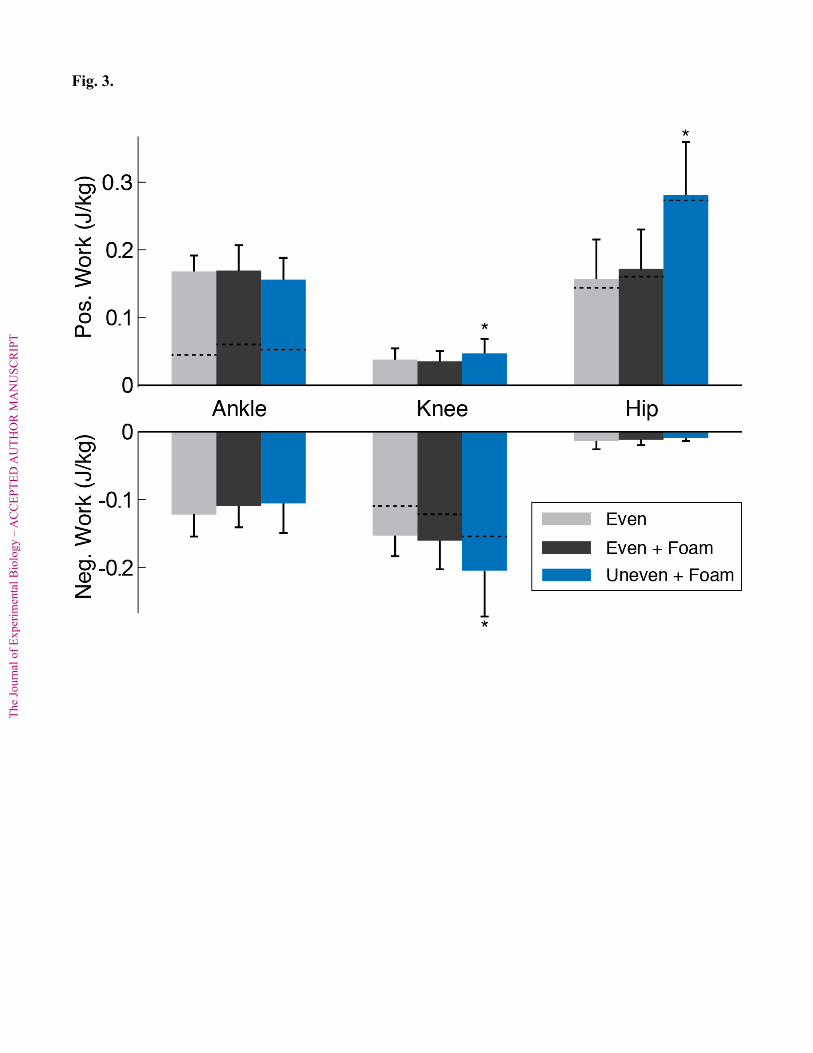
The biomechanical effects included greater joint work performed over a stride (Fig. 3). There was a 250
0.0106 J/kg (28%) increase in positive knee work and a 0.0425 J/kg (26%) increase in negative knee 251
work (p = 0.011 and p = 0.0019, respectively). Positive hip work also significantly increased by 0.1078 252
J/kg (62%; p < 0.0001). No statistically significant changes were found in positive or negative ankle 253
work, or negative hip work. 254
255
The
Jou
rnal
of
Exp
erim
enta
l Bio
logy
– A
CC
EPT
ED
AU
TH
OR
MA
NU
SCR
IPT
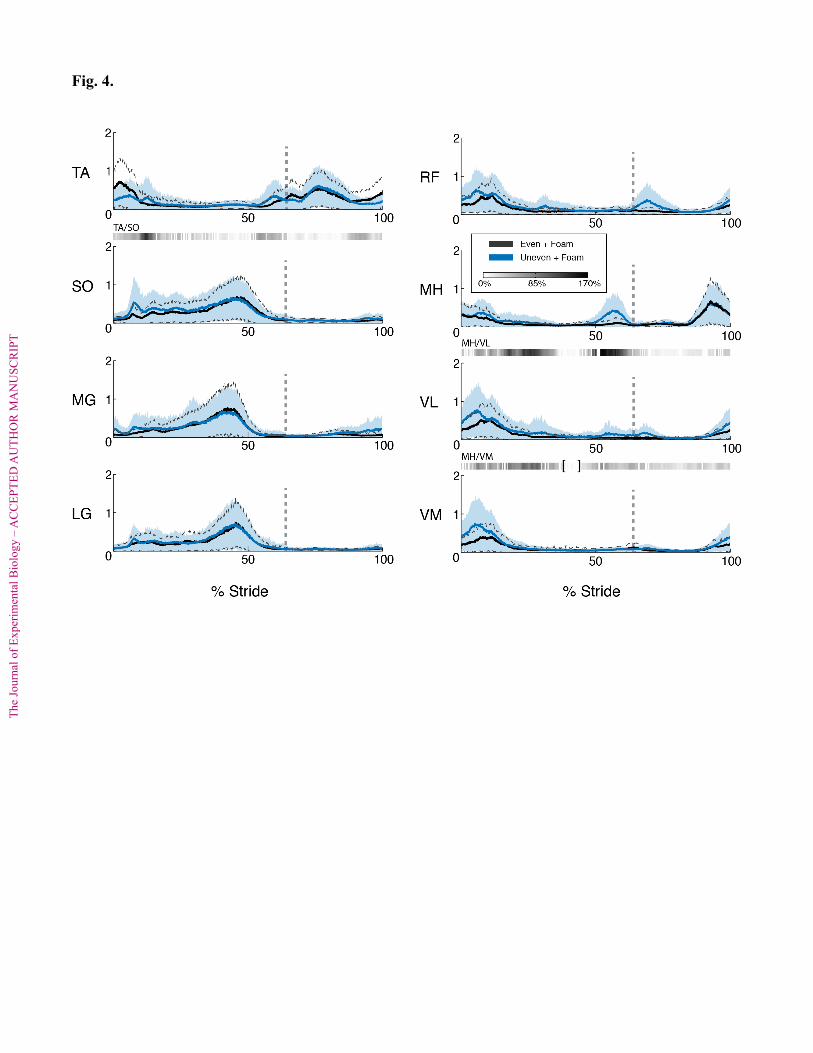
Muscle Activation 256
Subjects showed increased muscle activity, variability of activity (Fig. 4), and mutual contraction when 257
walking on the uneven surface. There were significant increases in activation for six of the eight muscles 258
measured (Fig. 5). Averaged, normalized EMG values increased for all of the thigh muscles: VM, VL, 259
RF and MH increased by 49%, 60%, 54% and 47%, respectively (p < 0.05). In the lower leg, SO muscle 260
activity increased by 28%, while the MG muscle activity increased by 17% (p < 0.05). The remaining 261
muscles, TA and LG, did not exhibit significant changes in mean activity across the stride, although TA 262
appeared to have slightly decreased activity in the first 10% of stride. 263
264
Variability of EMG increased significantly for nearly all muscles on the uneven terrain (Fig. 4). On 265
average, walking on uneven terrain resulted in a larger increase in variability (standard deviation of 266
muscle activity) in the thigh muscles (mean 60% increase) than in the leg muscles (mean 30% increase). 267
For the thigh muscles, RF and VL variability increasing over 80% (p < 0.05), and VM and MH muscles 268
showed over 45% increases (p < 0.05). The SO, MG and LG muscles in the leg showed a minimum 269
increase in standard deviation of 27%, and as much as 40% for MG (p < 0.05). 270
271
We also observed changes in co-contraction over the entire stride for all three pairs of antagonistic 272
muscles (Table 2). However, upon breaking the stride down into 1% increments, mutual activation for 273
the MH/VM and MH/VL muscle pairs appears to increase substantially only around mid-stance. The 274
MH/VL muscle pair also shows a significant increase pre toe-off. The largest increase of mutual 275
contraction of the TA/SO muscles was seen shortly after heel-strike (Fig. 4). 276
277
Metabolic Energy Expenditure 278
Walking on the uneven terrain resulted in a significant increase in energy expenditure compared to the 279
other surfaces (Fig. 6). Net metabolic rate increased from 2.65 W/kg (s.d. 0.373 W/kg) to 3.38 W/kg 280
(s.d. 0.289 W/kg) (p < 0.0001), about 28%, from the even foam to uneven terrain. There was no 281
difference between the energetic cost of walking on the even surface (mean metabolic rate of 2.53 W/kg; 282
s.d. 0.282 W/kg) and the even foam surface (p = 0.330). Average standing metabolic rate was found to 283
be 1.48 W/kg (s.d. 0.181 W/kg). 284
285
DISCUSSION 286
On natural terrain, there are many surface properties that can dictate the metabolic cost of locomotion. 287
Surface compliance and damping can affect locomotion energetics and dynamics (Ferris et al., 1998; 288
The
Jou
rnal
of
Exp
erim
enta
l Bio
logy
– A
CC
EPT
ED
AU
TH
OR
MA
NU
SCR
IPT
Ferris et al., 1999; Kerdok et al., 2002) as do surface inclines or declines (Margaria, 1976; Minetti et al., 289
1993). However, few studies have characterized the biomechanics and energetics of walking on uneven 290
surfaces. We examined the effects of uneven terrain compared to smooth surfaces, and found a number 291
of biomechanical factors related to energetic cost. Locomotion on terrain with a surface variability of 292
only 2.5 cm resulted in a 28% increase in net metabolic cost. For comparison, this is approximately 293
energetically equivalent to walking up a 2% steady incline (Margaria, 1968) and is likely comparable to 294
natural terrain variation experienced when moving over trails, grass or uneven pavement. 295
296
We observed only modest changes in stepping strategy with uneven terrain. For example, average step 297
length decreased by only 4%, and the increase in step width was not significant. Examination of 298
previous studies on the effects of varying step parameters (Donelan et al., 2001; Gordon et al., 2009; 299
O’Connor and Kuo, 2009) suggests that differences seen here are too small to have a substantial 300
influence on energetic cost. However, we did observe a 22% increase in step length variability and a 301
36% increase in step width variability. As shown by others (Donelan et al., 2004; O’Connor et al., 302
2012), it is costlier to walk with more variability (e.g. 65% greater step width variability results in 5.9% 303
higher energetic cost), in part because increased step variability reduces the use of passive energy 304
exchange and increases step-to-step transition costs. However, the differences we found in our study 305
would not likely translate to large changes in energetic cost. Available evidence suggests that changes in 306
step distances and variability could account for only a small percent of increased energy expenditure. 307
308
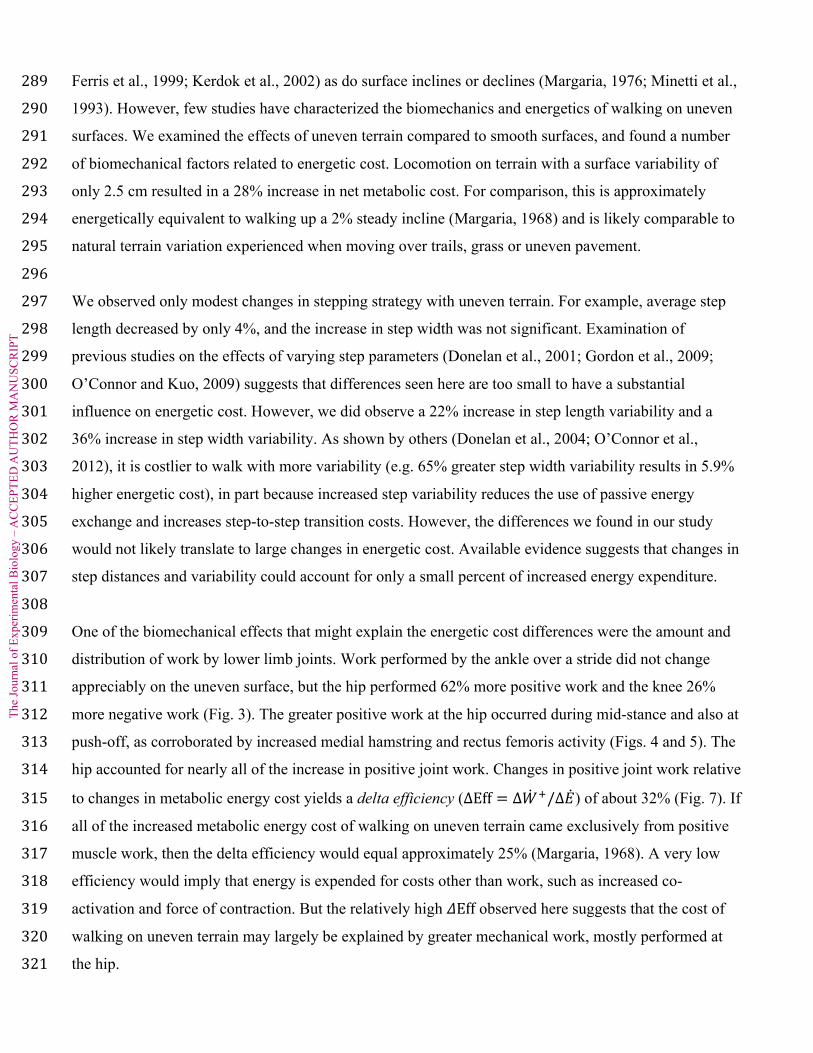
One of the biomechanical effects that might explain the energetic cost differences were the amount and 309
distribution of work by lower limb joints. Work performed by the ankle over a stride did not change 310
appreciably on the uneven surface, but the hip performed 62% more positive work and the knee 26% 311
more negative work (Fig. 3). The greater positive work at the hip occurred during mid-stance and also at 312
push-off, as corroborated by increased medial hamstring and rectus femoris activity (Figs. 4 and 5). The 313
hip accounted for nearly all of the increase in positive joint work. Changes in positive joint work relative 314
to changes in metabolic energy cost yields a delta efficiency (ΔEff = Δ𝑊!/Δ𝐸) of about 32% (Fig. 7). If 315
all of the increased metabolic energy cost of walking on uneven terrain came exclusively from positive 316
muscle work, then the delta efficiency would equal approximately 25% (Margaria, 1968). A very low 317
efficiency would imply that energy is expended for costs other than work, such as increased co-318
activation and force of contraction. But the relatively high 𝛥Eff observed here suggests that the cost of 319
walking on uneven terrain may largely be explained by greater mechanical work, mostly performed at 320
the hip. 321
The
Jou
rnal
of
Exp
erim
enta
l Bio
logy
– A
CC
EPT
ED
AU
TH
OR
MA
NU
SCR
IPT
322
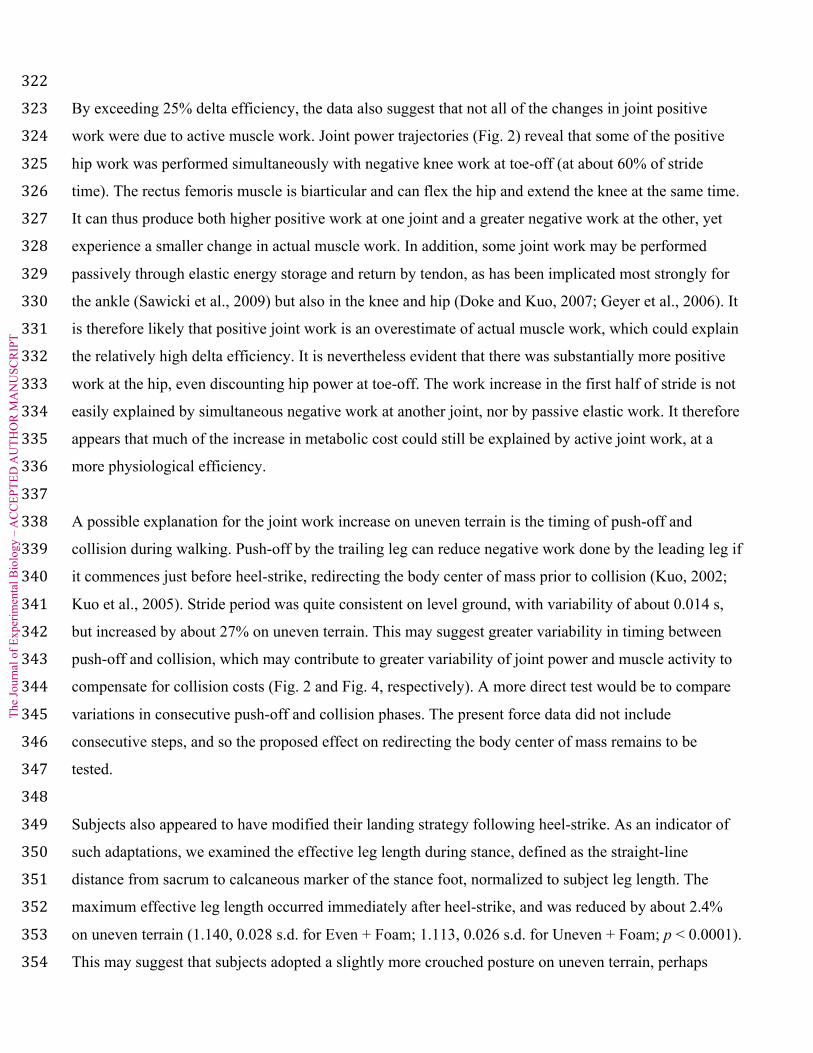
By exceeding 25% delta efficiency, the data also suggest that not all of the changes in joint positive 323
work were due to active muscle work. Joint power trajectories (Fig. 2) reveal that some of the positive 324
hip work was performed simultaneously with negative knee work at toe-off (at about 60% of stride 325
time). The rectus femoris muscle is biarticular and can flex the hip and extend the knee at the same time. 326
It can thus produce both higher positive work at one joint and a greater negative work at the other, yet 327
experience a smaller change in actual muscle work. In addition, some joint work may be performed 328
passively through elastic energy storage and return by tendon, as has been implicated most strongly for 329
the ankle (Sawicki et al., 2009) but also in the knee and hip (Doke and Kuo, 2007; Geyer et al., 2006). It 330
is therefore likely that positive joint work is an overestimate of actual muscle work, which could explain 331
the relatively high delta efficiency. It is nevertheless evident that there was substantially more positive 332
work at the hip, even discounting hip power at toe-off. The work increase in the first half of stride is not 333
easily explained by simultaneous negative work at another joint, nor by passive elastic work. It therefore 334
appears that much of the increase in metabolic cost could still be explained by active joint work, at a 335
more physiological efficiency. 336
337
A possible explanation for the joint work increase on uneven terrain is the timing of push-off and 338
collision during walking. Push-off by the trailing leg can reduce negative work done by the leading leg if 339
it commences just before heel-strike, redirecting the body center of mass prior to collision (Kuo, 2002; 340
Kuo et al., 2005). Stride period was quite consistent on level ground, with variability of about 0.014 s, 341
but increased by about 27% on uneven terrain. This may suggest greater variability in timing between 342
push-off and collision, which may contribute to greater variability of joint power and muscle activity to 343
compensate for collision costs (Fig. 2 and Fig. 4, respectively). A more direct test would be to compare 344
variations in consecutive push-off and collision phases. The present force data did not include 345
consecutive steps, and so the proposed effect on redirecting the body center of mass remains to be 346
tested. 347
348
Subjects also appeared to have modified their landing strategy following heel-strike. As an indicator of 349
such adaptations, we examined the effective leg length during stance, defined as the straight-line 350
distance from sacrum to calcaneous marker of the stance foot, normalized to subject leg length. The 351
maximum effective leg length occurred immediately after heel-strike, and was reduced by about 2.4% 352
on uneven terrain (1.140, 0.028 s.d. for Even + Foam; 1.113, 0.026 s.d. for Uneven + Foam; p < 0.0001). 353
This may suggest that subjects adopted a slightly more crouched posture on uneven terrain, perhaps 354
The
Jou
rnal
of
Exp
erim
enta
l Bio
logy
– A
CC
EPT
ED
AU
TH
OR
MA
NU
SCR
IPT
associated with increased EMG activity in the thigh muscles. Past research has suggested that vertical 355
stiffness decreases with a more crouched posture, for both human running (McMahon et al., 1987) and 356
walking (Bertram et al., 2002). A more crouched limbed posture on uneven terrain might also increase 357
compliance and provide a smoother gait, albeit at higher energetic cost. We also observed decreased 358
tibialis anterior activation at heel strike, which may be associated with adaptations for variable 359
conditions at heel-strike. These overall changes to landing strategy, along with increased variability in 360
stride period duration, may have contributed to increased joint work and energetic cost during walking 361
on uneven terrain. 362
363
There are other factors that may have contributed to the increased energetic cost of walking on uneven 364
terrain compared to even terrain. Co-activation of muscles about a joint can lead to increased metabolic 365
cost in human movement (Cavanagh and Kram, 1985). Although our data suggest an increase in mutual 366
muscle contraction about the ankle and knee joints (Table 2), it is difficult to convert relative amounts of 367
co-activation to a prediction of energetic cost. The increased vastus lateralis and vastus medialis activity 368
during stance (Figs. 4 and 5) could also lead to greater energy expenditure. Although much of that cost 369
could be quantified by knee power, production of muscle force may also have an energetic cost beyond 370
that for muscle work (Dean and Kuo, 2009; Doke and Kuo, 2007). Although we cannot estimate a cost 371
for co-activation or force production, it is quite possible that they contributed to the increased metabolic 372
cost on uneven terrain. 373
374
There were several limitations to this study. A limitation of the data setup was the arrangement of the 375
force plates during over-ground trials. Force plates placed consecutively would have allowed us to 376
collect force data during consecutive steps and to analyze simultaneous work by the leading and trailing 377
legs. Another limitation was that subjects walked at a controlled walking speed. This might have 378
constrained their freedom to negotiate terrain by varying their speed. We also did not test a range of 379
walking speeds to determine if uneven terrain causes an altered relationship between energy cost and 380
speed. We also tested only one pattern and range of surface heights, with the expectation that greater 381
height variation would largely have a magnified effect on energetics. Subjects were also given little time 382
to become accustomed to the uneven terrain. We had assumed that everyday experience would allow 383
them to adapt to uneven surface relatively quickly. There was also reduced ability for subjects to view 384
the terrain surface ahead of them, due to the limited length of the treadmill. This did not seem to pose an 385
undue challenge for the small perturbations here, but we would expect vision to be increasingly 386
important with greater terrain variations (Patla, 1997). 387
The
Jou
rnal
of
Exp
erim
enta
l Bio
logy
– A
CC
EPT
ED
AU
TH
OR
MA
NU
SCR
IPT
388
This study characterizes some of the adaptations that might occur on uneven terrain. These include 389
relatively minor adaptations in stepping strategy, increases in muscle activity, and additional work 390
performed at the hip. A controlled experiment can hardly replicate the limitless variations of the actual 391
environment, nor can it capture the entire range of compensations humans might perform in daily living. 392
But this study does suggest that much of the energetic cost of walking on uneven terrain may be 393
explained by changes in mechanical work from lower limb muscles. As a result, these findings can 394
potentially influence future designs of robotic exoskeletons used to assist with locomotion on natural 395
surfaces, as well as the development of various legged robots. In addition, numerous studies have been 396
done on the biomechanics and energetics of locomotion in humans and other primates with the intent of 397
highlighting factors driving the evolution of bipedal locomotion (Pontzer et al., 2009; Sockol et al., 398
2007). Our findings highlight that rather small changes in terrain properties (about 2.5 cm terrain height 399
variation) can have substantial impact on muscular work distribution across the lower limb. Thus, future 400
studies should take into account how properties of natural terrain, such as terrain height variability and 401
terrain damping (Lejeune et al., 1998), can influence potential conclusions relating locomotion 402
biomechanics and energetics of bipedal evolution. 403
404
ACKNOWLEDGMENTS 405
The authors thank Sarah Weiss, and members of the Human Neuromechanics Laboratory and Human 406
Biomechanics and Control Laboratory for assistance in collecting the data. 407
408
FUNDING 409
This research was supported by a grant from the Army Research Laboratory [W911NF-09-1-0139 to 410
D.F., W91 1NF-10-2-0022 to D.F.]; Department of Defense [W81XWH-09-2-0142 to A.K.]; Defense 411
Advanced Research Projects Agency [Atlas Program to A.K.]; Office of Naval Research [ETOWL to 412
A.K.]; and the University of Michigan Rackham Graduate Student Fellowship to A.V. 413
The
Jou
rnal
of
Exp
erim
enta
l Bio
logy
– A
CC
EPT
ED
AU
TH
OR
MA
NU
SCR
IPT
REFERENCES
Bertram, J. E., D’antonio, P., Pardo, J. and Lee, D. V. (2002). Pace length effects in human 414 walking:“Groucho” gaits revisited. Journal of motor behavior 34, 309–318. 415
Brockway, J. (1987). Derivation of formulae used to calculate energy expenditure in man. Hum 416 Nutr Clin Nutr 41, 463–71. 417
Cappellini, G., Ivanenko, Y. P., Dominici, N., Poppele, R. E. and Lacquaniti, F. (2010). Motor 418 patterns during walking on a slippery walkway. Journal of Neurophysiology 103, 746–760. 419
Cavanagh, P. R. and Kram, R. (1985). Mechanical and muscular factors affecting the efficiency of 420 human movement. Medicine & Science in Sports & Exercise 17, 326. 421
Davies, S. and Mackinnon, S. (2006). The energetics of walking on sand and grass at various 422 speeds. Ergonomics 49, 651–660. 423
Dean, J. and Kuo, A. (2009). Elastic coupling of limb joints enables faster bipedal walking. Journal 424 of The Royal Society Interface 6, 561. 425
Doke, J. and Kuo, A. D. (2007). Energetic cost of producing cyclic muscle force, rather than work, 426 to swing the human leg. Journal of Experimental Biology 210, 2390–2398. 427
Donelan, M. J., Kram, R. and Arthur D, K. (2001). Mechanical and metabolic determinants of the 428 preferred step width in human walking. Proceedings of the Royal Society of London. Series B: 429 Biological Sciences 268, 1985. 430
Donelan, J. M., Shipman, D. W., Kram, R. and Kuo, A. D. (2004). Mechanical and metabolic 431 requirements for active lateral stabilization in human walking. Journal of Biomechanics 37, 432 827–835. 433
Ferris, D. P., Louie, M. and Farley, C. T. (1998). Running in the real world: adjusting leg stiffness 434 for different surfaces. Proc Biol Sci 265, 989–94. 435
Ferris, D. P., Liang, K. and Farley, C. T. (1999). Runners adjust leg stiffness for their first step on 436 a new running surface. J Biomech 32, 787–94. 437
Geyer, H., Seyfarth, A. and Blickhan, R. (2006). Compliant leg behaviour explains basic dynamics 438 of walking and running. Proc Biol Sci 273, 2861–7. 439
Gordon, K. E., Ferris, D. P. and Kuo, A. D. (2009). Metabolic and mechanical energy costs of 440 reducing vertical center of mass movement during gait. Archives of physical medicine and 441 rehabilitation 90, 136–144. 442
Hak, L., Houdijk, H., Steenbrink, F., Mert, A., Van der Wurff, P., Beek, P. J. and Van Dieën, J. H. 443 (2012). Speeding up or slowing down?: Gait adaptations to preserve gait stability in 444 response to balance perturbations. Gait & Posture. 445
Kerdok, A. E., Biewener, A. A., McMahon, T. A., Weyand, P. G. and Herr, H. M. (2002). 446 Energetics and mechanics of human running on surfaces of different stiffnesses. Journal of 447 Applied Physiology 92, 469–478. 448
Kuo, A. D. (2002). Energetics of actively powered locomotion using the simplest walking model. 449 Journal of Biomechanical Engineering 124, 113. 450
Kuo, A. D., Donelan, J. M. and Ruina, A. (2005). Energetic consequences of walking like an 451 inverted pendulum: step-‐to-‐step transitions. Exercise and sport sciences reviews 33, 88–97. 452
Lejeune, T., Willems, P. and Heglund, N. (1998). Mechanics and energetics of human locomotion 453 on sand. Journal of Experimental Biology 201, 2071. 454
MacLellan, M. J. and Patla, A. E. (2006). Adaptations of walking pattern on a compliant surface to 455 regulate dynamic stability. Experimental brain research 173, 521–530. 456
Margaria, R. (1968). Positive and negative work performances and their efficiencies in human 457 locomotion. European journal of applied physiology and occupational physiology 25, 339–458 351. 459
Margaria, R. (1976). Biomechanics and energetics of muscular exercise. Clarendon Press Oxford. 460
The
Jou
rnal
of
Exp
erim
enta
l Bio
logy
– A
CC
EPT
ED
AU
TH
OR
MA
NU
SCR
IPT
Marigold, D. S. and Patla, A. E. (2002). Strategies for dynamic stability during locomotion on a 461 slippery surface: effects of prior experience and knowledge. Journal of Neurophysiology 88, 462 339–353. 463
McAndrew, P. M., Dingwell, J. B. and Wilken, J. M. (2010). Walking variability during continuous 464 pseudo-‐random oscillations of the support surface and visual field. Journal of biomechanics 465 43, 1470–1475. 466
McMahon, T. A., Valiant, G. and Frederick, E. C. (1987). Groucho running. Journal of Applied 467 Physiology 62, 2326–2337. 468
Minetti, A. E., Ardigo, L. and Saibene, F. (1993). Mechanical determinants of gradient walking 469 energetics in man. The Journal of physiology 472, 725–735. 470
Murray, M. P., Kory, R. C. and Clarkson, B. H. (1969). Walking patterns in healthy old men. 471 Journal of Gerontology 24, 169–178. 472
Nakazawa, K., Kawashima, N., Akai, M. and Yano, H. (2004). On the reflex coactivation of ankle 473 flexor and extensor muscles induced by a sudden drop of support surface during walking in 474 humans. Journal of Applied Physiology 96, 604–611. 475
O’Connor, S. M. and Kuo, A. D. (2009). Direction-‐dependent control of balance during walking 476 and standing. Journal of Neurophysiology 102, 1411–1419. 477
O’Connor, S. M., Xu, H. Z. and Kuo, A. D. (2012). Energetic cost of walking with increased step 478 variability. Gait & Posture 36, 102–107. 479
Pandolf, K., Haisman, M. and Goldman, R. (1976). Metabolic energy expenditure and terrain 480 coefficients for walking on snow. Ergonomics 19, 683–690. 481
Patla, A. E. (1997). Understanding the roles of vision in the control of human locomotion. Gait & 482 Posture 5, 54–69. 483
Pinnington, H. C. and Dawson, B. (2001). The energy cost of running on grass compared to soft 484 dry beach sand. Journal of Science and Medicine in Sport 4, 416–430. 485
Pontzer, H., Raichlen, D. A. and Sockol, M. D. (2009). The metabolic cost of walking in humans, 486 chimpanzees, and early hominins. Journal of human evolution 56, 43–54. 487
Poole, D. C. and Richardson, R. S. (1997). Determinants of oxygen uptake. Sports Med 24, 308–488 320. 489
Sawicki, G. S., Lewis, C. L. and Ferris, D. P. (2009). It pays to have a spring in your step. Exercise 490 and sport sciences reviews 37, 130. 491
Sockol, M. D., Raichlen, D. A. and Pontzer, H. (2007). Chimpanzee locomotor energetics and the 492 origin of human bipedalism. Proceedings of the National Academy of Sciences 104, 12265–493 12269. 494
Soule, R. G. and Goldman, R. F. (1972). Terrain coefficients for energy cost prediction. Journal of 495 Applied Physiology 32, 706–708. 496
Sponberg, S. and Full, R. (2008). Neuromechanical response of musculo-‐skeletal structures in 497 cockroaches during rapid running on rough terrain. Journal of Experimental Biology 211, 498 433–446. 499
Thoroughman, K. A. and Shadmehr, R. (1999). Electromyographic correlates of learning an 500 internal model of reaching movements. The Journal of Neuroscience 19, 8573–8588. 501
Wade, C., Redfern, M. S., Andres, R. O. and Breloff, S. P. (2010). Joint kinetics and muscle 502 activity while walking on ballast. Human Factors: The Journal of the Human Factors and 503 Ergonomics Society 52, 560–573. 504
Weir, J. B. V. (1949). New methods for calculating metabolic rate with special reference to protein 505 metabolism. The Journal of physiology 109, 1–9. 506
Winter, D. and Yack, H. (1987). EMG profiles during normal human walking: stride-‐to-‐stride and 507 inter-‐subject variability. Electroencephalography and clinical Neurophysiology 67, 402–411. 508
The
Jou
rnal
of
Exp
erim
enta
l Bio
logy
– A
CC
EPT
ED
AU
TH
OR
MA
NU
SCR
IPT
Yang, J. and Winter, D. (1984). Electromyographic amplitude normalization methods: improving 509 their sensitivity as diagnostic tools in gait analysis. Archives of physical medicine and 510 rehabilitation 65, 517. 511
Zamparo, P., Perini, R., Orizio, C., Sacher, M. and Ferretti, G. (1992). The energy cost of walking 512 or running on sand. European journal of applied physiology and occupational physiology 65, 513 183–187. 514
The
Jou
rnal
of
Exp
erim
enta
l Bio
logy
– A
CC
EPT
ED
AU
TH
OR
MA
NU
SCR
IPT
FIGURE LEGENDS
Fig. 1. A) Treadmill with the uneven terrain surface attached. B) Schematic of the uneven surface 515
layout, consisting of three alternating heights (arrows indicate the treadmill’s long axis). C) Close-up 516
representation of the individual blocks comprising each stepping area. Dimensions: H – 1.27cm; L – 517
15.2cm; W – 2.54 cm. 518
519
Fig. 2. Joint angles, torques, and powers vs. stride time for two terrain conditions. Mean trajectories for 520
ankle, knee and hip are plotted against % stride time for Uneven and Even terrain (both with Foam) 521
conditions. Shaded area denotes standard deviation across subjects for Uneven + Foam; dashed lines for 522
Even + Foam. Strides start and end at same-side heel-strike; dashed vertical gray lines indicate toe-off. 523
524
Fig. 3. Joint work per stride for three terrain conditions. Values shown are positive and negative work 525
for ankle, knee, and hip, with error bars denoting standard deviations. Dashed lines indicate net work for 526
that specific joint and condition. Asterisks signify a statistically significant difference of the Uneven + 527
Foam condition from the other two conditions (𝛼 = 0.05). 528
529
Fig. 4. Averaged EMG (electromyographic) activity vs. stride time for even and uneven terrain 530
conditions. EMG data were normalized to the maximum activation of each muscle for each subject and 531
plotted against % stride time for Uneven and Even terrain (both with Foam). Strides start and end at 532