First Quarter 2007 Highlights Drilled and completed 6.0 (2.6 net) wells in the quarter resulting in a 100 percent success rate. Added approximately 800 boe/d during the first quarter at a cost of $20,000 per flowing boe, increasing production to current levels of 5,100 boe/d. Achieved hedging gains of $2.8 million through the Company’s risk management program, increasing the Company’s average realized natural gas price by $1.42 per thousand cubic feet, 19 percent higher than the benchmark AECO price in the first quarter of 2007. Closed a flow-through common share financing of 7,350,000 shares at an issue price of $2.45 per share for gross proceeds of $18.0 million. Achieved a cash netback of $27.41 per boe in the first quarter of the year, six percent higher than the cash netback of $25.78 per boe achieved in the fourth quarter of 2006. Three Months Ended March 31 Operational Highlights 2007 2006 % Change Production Natural gas (mcf/d) 21,658 23,695 (9) Crude oil (bbls/d) 366 544 (33) Natural gas liquids (bbls/d) 346 518 (33) Total (boe/d) 4,322 5,011 (14) Financial Highlights ($000s except per boe and per share amounts) Petroleum and natural gas sales 21,974 23,809 (8) Per boe 56.49 52.79 7 Funds from operations 10,665 12,380 (14) Per boe 27.41 27.45 - Per share – Basic 0.17 0.22 (23) Per share – Diluted 0.17 0.22 (23) Net earnings (loss) (11,653) 1,187 - Per boe (29.97) 2.64 - Per share – Basic (0.18) 0.02 - Per share – Diluted (0.18) 0.02 - Capital invested 15,996 81,029 (80) Proceeds on dispositions - - - Net capital 15,996 81,029 (80)
Transcript
First Quarter 2007 Highlights
Drilled and completed 6.0 (2.6 net) wells in the quarter resulting in a 100 percent success rate.
Added approximately 800 boe/d during the first quarter at a cost of $20,000 per flowing boe, increasing production to current levels of 5,100 boe/d.
Achieved hedging gains of $2.8 million through the Company’s risk management program, increasing the Company’s average realized natural gas price by $1.42 per thousand cubic feet, 19 percent higher than the benchmark AECO price in the first quarter of 2007.
Closed a flow-through common share financing of 7,350,000 shares at an issue price of $2.45 per share for gross proceeds of $18.0 million.
Achieved a cash netback of $27.41 per boe in the first quarter of the year, six percent higher than the cash netback of $25.78 per boe achieved in the fourth quarter of 2006.
Three Months Ended March 31 Operational Highlights 2007 2006 % Change Production Natural gas (mcf/d) 21,658 23,695 (9) Crude oil (bbls/d) 366 544 (33) Natural gas liquids (bbls/d) 346 518 (33) Total (boe/d) 4,322 5,011 (14) Financial Highlights ($000s except per boe and per share amounts)
Petroleum and natural gas sales 21,974 23,809 (8) Per boe 56.49 52.79 7 Funds from operations 10,665 12,380 (14) Per boe 27.41 27.45 - Per share – Basic 0.17 0.22 (23) Per share – Diluted 0.17 0.22 (23) Net earnings (loss) (11,653) 1,187 - Per boe (29.97) 2.64 - Per share – Basic (0.18) 0.02 - Per share – Diluted (0.18) 0.02 - Capital invested 15,996 81,029 (80) Proceeds on dispositions - - - Net capital 15,996 81,029 (80)
- 2 -
March 31, 2007 December 31, 2006 % Change Debt plus working capital deficit 106,823 118,178 (10) Total assets 326,941 326,668 - Shares outstanding Basic 68,012,491 60,662,491 12 Diluted 72,242,191 64,892,191 11
MESSAGE TO SHAREHOLDERS
During the first quarter of 2007, Delphi focussed its drilling program primarily at Bigstone in North West Alberta and at Bigfoot in North East British Columbia. These operations were completed late in the quarter resulting in production additions mostly affecting second quarter production. The successful winter program is a direct result of the high quality and low risk profile of the projects in inventory combined with the excess capacity in Delphi owned infrastructure strategically built in 2006.
Operational Review
BIGSTONE, NORTH WEST ALBERTA
The Company completed its winter drilling program in the Bigstone area resulting in two gas wells (1.5 net), two oil wells (0.5 net), one potential oil well (0.55 net) awaiting completion after break-up and one standing well (0.05 net) awaiting further evaluation. The Bigstone property continues to deliver significant upside with successful step-out drilling in the Viking/Gething formations and new discoveries in the Bluesky/Falher formations. On the lands currently being developed, wells typically have the potential to encounter up to seven productive zones resulting in multi-zone completions and follow-up drilling. The Delphi operated wells have been equipped and are now producing through Delphi’s 100 percent owned infrastructure.
Development of the Cardium light oil play progressed successfully during the winter program with positive initial production rates from three wells. The Company has identified in excess of 20 potential drilling locations targeting the Cardium light oil play.
After spring break-up, Delphi anticipates drilling at least two development wells targeting natural gas and light oil. Follow-up drilling to some of this winter’s success is restricted to winter access and will become part of Delphi’s winter 2007/08 drilling program.
BIGFOOT, NORTH EAST BRITISH COLUMBIA
Winter operations in Bigfoot were completed with the drilling, completion and tie-in of one horizontal well. Taking advantage of the significant infrastructure constructed during 2006, the well had an on-lease tie-in requiring minimal surface production equipment and commenced production within 14 days of releasing the drilling rig. The well is anticipated to stabilize at a rate of approximately 1,200 mcf/d (100 boe/d net to Delphi) over the next three to four months. The Company had planned to drill as many as three wells over the winter drilling season, however, time constraints associated with weather and rig availability resulted in a single well being drilled. The Company also completed the tie-in of three standing wells from the previous winter program. Well testing and plunger lift installation on the existing producing wells was also completed during the first quarter.
TOWER CREEK, ALBERTA
Equipping and tie-in operations are proceeding on schedule and are anticipated to be completed within the next six weeks. Initial gross raw gas production rates are estimated to be between 20 and 25 mmcf/d (500 to 600 boe/d net sales to Delphi).
The second exploration test is scheduled to commence drilling during the second quarter. This seismically defined deep exploration test is targeting high pressure sweet gas from the highly fractured Wabamun formation. Wabamun analogs in the area have commenced production at gross raw rates of up to 30 mmcf/d of sweet gas. Delphi will pay 23.9 percent of the costs of the well to earn a 20.8 percent in the wellbore and surrounding acreage.
- 3 -
Financial Review
Funds from operations for the first quarter of 2007 were $10.7 million ($0.17 per share) resulting in a cash netback of $27.41 per boe. Delphi achieved its positive flow of funds primarily through higher than benchmark realized natural gas prices resulting from its strategic risk management program. The risk management program resulted in hedging gains of $2.8 million, increasing the Company’s average realized natural gas price by $1.42 per mcf, 19 percent higher than the benchmark AECO price in the first three months of 2007. The cash netback of $27.41 per boe is comparable to the cash netback of $27.45 per boe received in the first quarter of 2006 and better than the average cash netback received in all of 2006 of $25.97 per boe. Operating costs per boe, included in the cash netback, were higher in the first quarter of 2007 on a per boe basis at $9.87, primarily due to lower production volumes. The absolute amount of operating costs increased only five percent to $3.8 million compared to the same period in the previous year of $3.7 million, primarily due to several higher than expected facility equalization adjustments. The Company expects operating costs to trend back to historic averages of approximately $8.25 per boe going forward, based on its current production volume, thereby contributing to the Company’s overall forecast netback of approximately $26.00 per boe for the year.
The Company incurred a net loss of $11.7 million ($0.18 per share) in the first quarter of 2007, primarily as a result of the one-time charge to earnings for the impairment of goodwill. The non-cash charge of $12.1 million is based on a review of the valuation of goodwill as of March 31, 2007 which incorporates the market capitalization of the Company as indicated by the Company’s share price on March 31, 2007.
In the first quarter of 2007, Delphi incurred total capital expenditures of $16.0 million, with 66 percent of the capital being directed towards drilling and completion operations on seven wells to increase production volumes. The majority of the capital costs were incurred in the Bigstone area where six of the seven wells were drilled. As of March 31, 2007, one well in the area had yet to have completion operations undertaken. This activity is expected to take place after spring break-up. The capital program was financed through funds from operations and the utilization of the Company’s credit facilities with its lenders.
During the first quarter of 2007, the Company issued 7.35 million flow-through common shares at an issue price of $2.45 per share for gross proceeds of $18.0 million. The net proceeds of the offering were initially used to reduce the Company’s bank debt and will subsequently be used to fund its exploration program.
At March 31, 2007, Delphi had outstanding bank debt plus working capital deficiency of $106.8 million. Subsequent to the end of the quarter, the existing credit facilities consisting of a $115.0 million revolving credit facility and a $10.0 million acquisition/development credit facility were confirmed by the Company’s lenders based on their scheduled annual review of the Company’s independently evaluated oil and gas reserves. Delphi anticipates its cash flow in the second quarter will be greater than the planned capital program resulting in a further reduction in bank debt plus working capital deficiency to approximately $100.0 million as of June 30, 2007.
OUTLOOK
The quality of Delphi’s producing assets offer a high netback cash flow stream as well as a reliable borrowing base. A strategic commodity hedging program protects the cash flow stream from commodity price volatility. Delphi has approximately 53 percent of its natural gas production hedged at a minimum price of approximately $8.54 per mcf from April 2007 to March 2008. This compares favourably to both the 2006 AECO average price of $6.55 per mcf and the current AECO average price of approximately $7.25 per mcf.
Delphi reiterates its expectation to exit the year producing approximately 5,700 boe/d, a 32 percent increase over the first quarter 2007 production rate. Current production is approximately 5,100 boe/d. The forecast average yearly production rate for 2007 remains between 5,200 to 5,400 boe/d. Capital expenditures for the remainder of the year are anticipated to be approximately $30 million to $35 million, focused on the drilling of up to 15 wells and the recompletion and workover of an estimated six wells.
Delphi remains focused on creating shareholder value through its development and exploration programs on its high quality assets concentrated in North West Alberta and North East British Columbia. The Company is well positioned for long term sustainable growth with an inventory of drilling opportunities in excess of five years.
On behalf of the Board,
David J. Reid, President and Chief Executive Officer May 8, 2007
- 4 -
Management’s Discussion and Analysis (all tabular amounts are expressed in thousands of CDN dollars, except per unit amounts)
The following discussion and analysis has been prepared by management and reviewed and approved by the Board of Directors of Delphi Energy Corp (“Delphi” or “the Company”). The discussion and analysis is a review of the financial results of the Company based upon accounting principles generally accepted in Canada. Its focus is primarily a comparison of the financial performance for the three months ended March 31, 2007 and 2006 and should be read in conjunction with the audited financial statements and accompanying notes for the year ended December 31, 2006. The discussion and analysis has been prepared as of May 8th, 2007.
Basis of Presentation. For the purpose of reporting production information, reserves and calculating unit prices and costs, natural gas volumes have been converted to a barrel of oil equivalent (boe) using six thousand cubic feet equal to one barrel. A boe conversion ratio of 6:1 is based upon an energy equivalency conversion method primarily applicable at the burner tip and does not represent a value equivalency at the wellhead. This conversion conforms with the Canadian Securities Administrators’ National Instrument 51-101 when boes are disclosed. Boes may be misleading, particularly if used in isolation. NON GAAP Measures. The MD&A contains the terms “funds from operations”, “funds from operations per share” and “netbacks” which are not recognized measures under Canadian generally accepted accounting principles. The Company uses these measures to help evaluate its performance. Management considers netbacks an important measure as it demonstrates its profitability relative to current commodity prices. Management uses funds from operations to analyze performance and considers it a key measure as it demonstrates the Company’s ability to generate the cash necessary to fund future capital investments and to repay debt. Funds from operations has been defined by the Company as net earnings plus the addback of non-cash items (depletion, depreciation and accretion, stock-based compensation, future income taxes and unrealized (gain)/loss on risk management activities) and excludes the change in non-cash working capital related to operating activities and expenditures on asset retirement obligations and reclamation. The Company also presents funds from operations per share whereby amounts per share are calculated using weighted average shares outstanding consistent with the calculation of earnings per share. Delphi’s determination of funds from operations may not be comparable to that reported by other companies nor should it be viewed as an alternative to cash flow from operating activities, net earnings or other measures of financial performance calculated in accordance with Canadian GAAP. Forward-Looking Statements. Certain information regarding Delphi Energy Corp. set forth in this document, including management’s assessment of the Company’s future plans and operations, contains forward-looking statements that involve substantial known and unknown risks and uncertainties. These forward-looking statements are subject to numerous risks and uncertainties, certain of which are beyond the Company’s control, including the effects of general economic conditions, industry conditions, volatility of commodity prices, currency fluctuations, imprecision of reserve estimates, environmental risks, competition from other oil and gas companies, the lack of availability of qualified personnel or management, stock market volatility and ability to access sufficient capital from both internal and external sources. The Company’s actual results, performance or achievement could differ materially from those expressed in, or implied by, these forward-looking statements, and accordingly, no assurance can be given that any of the events anticipated by the forward-looking statements will transpire or occur.
Production
2007 2006 % ChangeNatural gas (mcf/d) 21,658 23,695 (9) Crude oil (bbl/d) 366 544 (33) Natural gas liquids (bbl/d) 346 518 (33) Total (boe/d) 4,322 5,011 (14)
Three Months EndedMarch 31
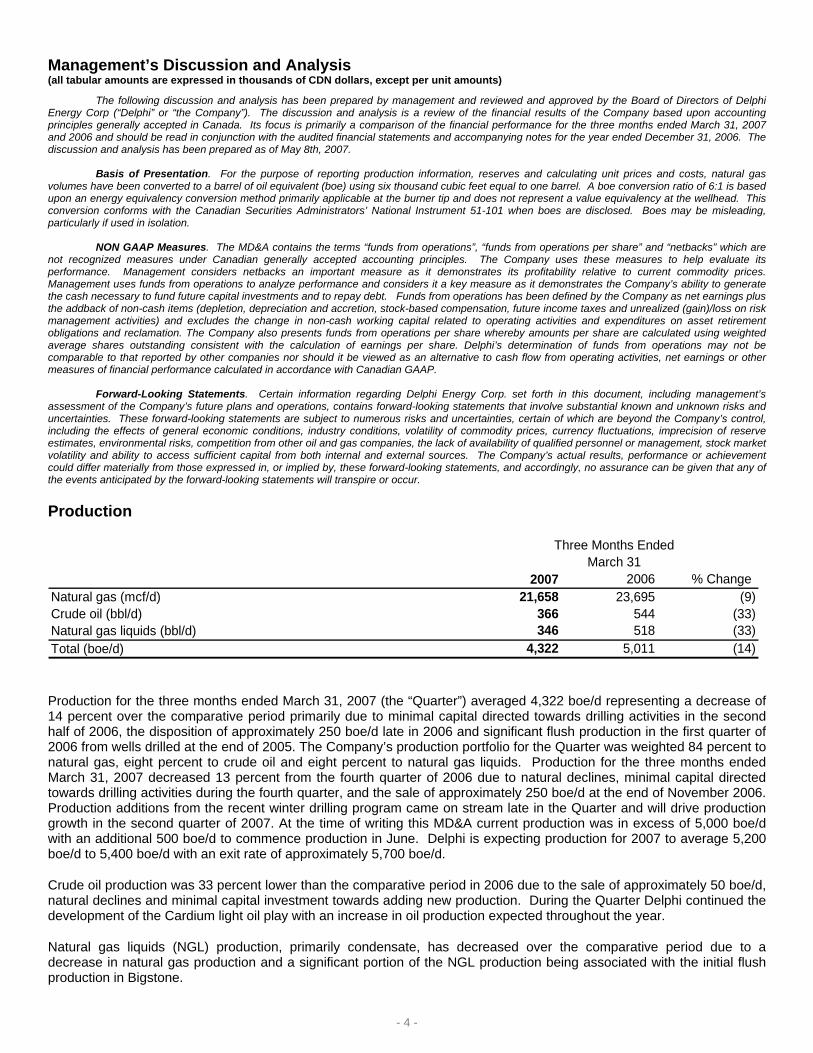
Production for the three months ended March 31, 2007 (the “Quarter”) averaged 4,322 boe/d representing a decrease of 14 percent over the comparative period primarily due to minimal capital directed towards drilling activities in the second half of 2006, the disposition of approximately 250 boe/d late in 2006 and significant flush production in the first quarter of 2006 from wells drilled at the end of 2005. The Company’s production portfolio for the Quarter was weighted 84 percent to natural gas, eight percent to crude oil and eight percent to natural gas liquids. Production for the three months ended March 31, 2007 decreased 13 percent from the fourth quarter of 2006 due to natural declines, minimal capital directed towards drilling activities during the fourth quarter, and the sale of approximately 250 boe/d at the end of November 2006. Production additions from the recent winter drilling program came on stream late in the Quarter and will drive production growth in the second quarter of 2007. At the time of writing this MD&A current production was in excess of 5,000 boe/d with an additional 500 boe/d to commence production in June. Delphi is expecting production for 2007 to average 5,200 boe/d to 5,400 boe/d with an exit rate of approximately 5,700 boe/d.
Crude oil production was 33 percent lower than the comparative period in 2006 due to the sale of approximately 50 boe/d, natural declines and minimal capital investment towards adding new production. During the Quarter Delphi continued the development of the Cardium light oil play with an increase in oil production expected throughout the year.
Natural gas liquids (NGL) production, primarily condensate, has decreased over the comparative period due to a decrease in natural gas production and a significant portion of the NGL production being associated with the initial flush production in Bigstone.
- 5 -
Commodity Prices and Risk Management
Benchmark Prices
2007 2006 % ChangeNatural gasNYMEX (US $/mmbtu) 7.20 7.66 (6) AECO (CDN $/mcf) 7.45 7.48 -Crude oilWest Texas Intermediate (US $/bbl) 58.10 63.48 (8) Edmonton Light (CDN $/bbl) 70.05 68.87 2 Foreign exchange rateCanadian to US dollar 1.17 1.15 2 US to Canadian dollar 0.85 0.87 (2)
Three Months EndedMarch 31
Natural Gas
United States natural gas prices are commonly referenced to the New York Mercantile Exchange Henry Hub in Louisiana (NYMEX) while Canadian natural gas prices are typically referenced to the AECO Hub in Alberta. Natural gas prices are influenced more by North American supply and demand than global fundamentals. Natural gas prices decreased six percent over the comparative period and increased eight percent over the fourth quarter of 2006. Natural gas prices remained relatively robust especially considering the significant amount of natural gas in storage. After a mild December, a cold snap hit most of North America, including the top consuming regions in mid-January with temperatures remaining below seasonal norms throughout most of February, which helped push record storage levels closer to the five year average. Although natural gas storage levels remain high relative to historical levels, supply concerns are growing due to producers struggling to boost overall gas production and increasing demand. Delphi expects the overall balance between supply and demand to remain tight in 2007 with any significant supply disruption or higher than normal temperatures having a material affect on prices.
Delphi expects prices to remain volatile throughout 2007 and as such, has extended its price protection strategy to protect the Company’s capital program and its balance sheet. Currently, Delphi has hedged approximately 53 percent of its before-royalty gas production at an average AECO floor price of $8.54 per thousand cubic feet from April 1, 2007 to March 31, 2008.
Crude Oil
West Texas Intermediate at Cushing, Oklahoma (WTI) is the benchmark reference for North American crude oil prices. Canadian crude oil prices are based upon postings, primarily at Edmonton, Alberta, and represent the WTI price adjusted for quality and transportation differentials as well as the US/CDN dollar exchange rate.
The prices received for crude oil are related to the price of crude oil in world markets. Prices for heavy oil and other lesser quality crudes trade at a discount or differential to light crude oil due to the additional costs in the refining process. The narrowing of the differential was the primary driver of a 27 percent increase in Bow River crude prices, a benchmark for medium grade oil prices.
Risk Management Activities
Delphi enters into both financial and physical commodity contracts as part of its risk management program to manage commodity price fluctuations designed to ensure sufficient cash is generated to fund its capital program particularly when commodity prices are extremely volatile.
On January 1, 2007 the Company adopted the new accounting standards regarding the accounting for financial instruments. In addition to the adoption of the new standards, management has elected not to use hedge accounting and consequently records the fair value of its natural gas financial contracts at each reporting period with the change in the fair value being classified as unrealized gains and losses in the statement of earnings.
- 6 -
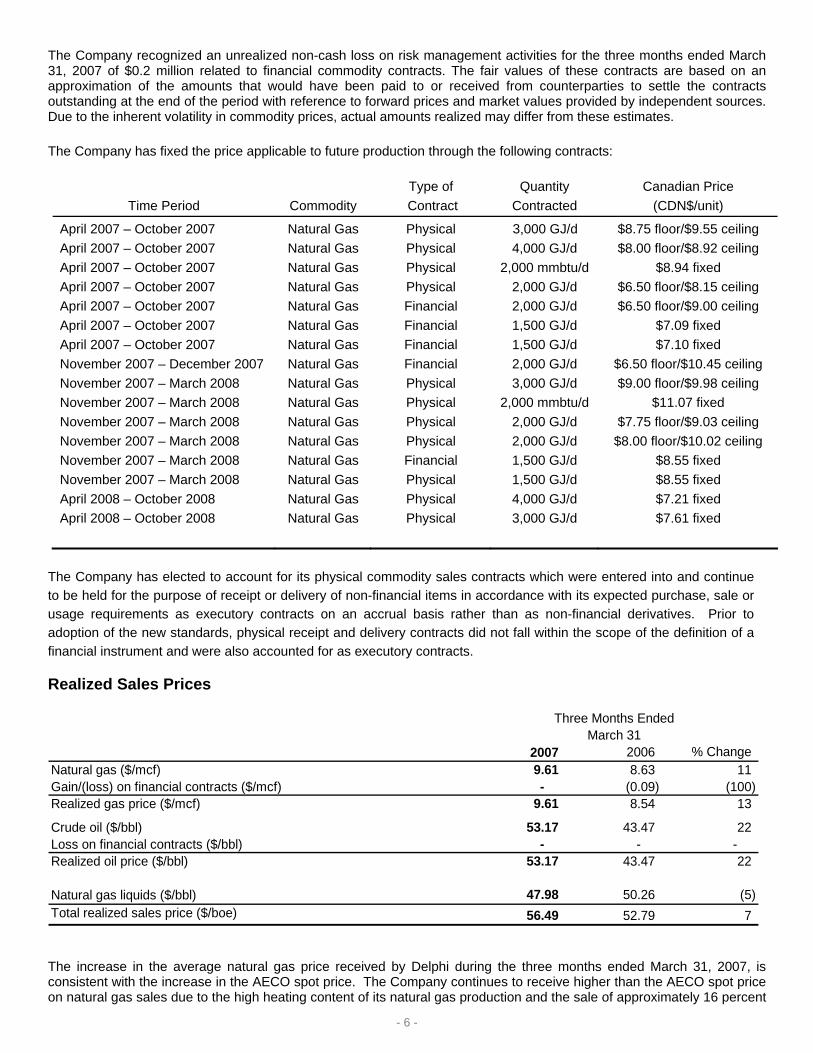
The Company recognized an unrealized non-cash loss on risk management activities for the three months ended March 31, 2007 of $0.2 million related to financial commodity contracts. The fair values of these contracts are based on an approximation of the amounts that would have been paid to or received from counterparties to settle the contracts outstanding at the end of the period with reference to forward prices and market values provided by independent sources. Due to the inherent volatility in commodity prices, actual amounts realized may differ from these estimates.
The Company has fixed the price applicable to future production through the following contracts:
Time Period
Commodity
Type of Contract
Quantity Contracted
Canadian Price (CDN$/unit)
April 2007 – October 2007 April 2007 – October 2007 April 2007 – October 2007 April 2007 – October 2007 April 2007 – October 2007 April 2007 – October 2007 April 2007 – October 2007 November 2007 – December 2007 November 2007 – March 2008 November 2007 – March 2008 November 2007 – March 2008 November 2007 – March 2008 November 2007 – March 2008 November 2007 – March 2008 April 2008 – October 2008 April 2008 – October 2008
Natural Gas Natural Gas Natural Gas Natural Gas Natural Gas Natural Gas Natural Gas Natural Gas Natural Gas Natural Gas Natural Gas Natural Gas Natural Gas Natural Gas Natural Gas Natural Gas
The Company has elected to account for its physical commodity sales contracts which were entered into and continue to be held for the purpose of receipt or delivery of non-financial items in accordance with its expected purchase, sale or usage requirements as executory contracts on an accrual basis rather than as non-financial derivatives. Prior to adoption of the new standards, physical receipt and delivery contracts did not fall within the scope of the definition of a financial instrument and were also accounted for as executory contracts.
Realized Sales Prices
2007 2006 % ChangeNatural gas ($/mcf) 9.61 8.63 11 Gain/(loss) on financial contracts ($/mcf) - (0.09) (100) Realized gas price ($/mcf) 9.61 8.54 13
Natural gas liquids ($/bbl) 47.98 50.26 (5) Total realized sales price ($/boe) 56.49 52.79 7
Three Months EndedMarch 31
The increase in the average natural gas price received by Delphi during the three months ended March 31, 2007, is consistent with the increase in the AECO spot price. The Company continues to receive higher than the AECO spot price on natural gas sales due to the high heating content of its natural gas production and the sale of approximately 16 percent
- 7 -
of the Company’s production being priced at Chicago from sales on the Alliance Pipeline for the three months ended March 31, 2007. During the Quarter, Delphi benefited from its risk management program in which the Company fixed the price on a portion of its natural gas production at amounts significantly higher than the AECO spot price. The risk management program increased the average natural gas price received during the Quarter by approximately $1.42 per mcf. The increase in the average oil price received by Delphi during the three months ended March 31, 2007, is consistent with the narrowing of the quality differential. Delphi’s oil production is predominantly a medium grade oil, therefore the Company’s average price fluctuates with the quality differential. Realized natural gas liquids prices have decreased due to the decrease in the price received for condensate, the primary component of the Company’s natural gas liquids production.
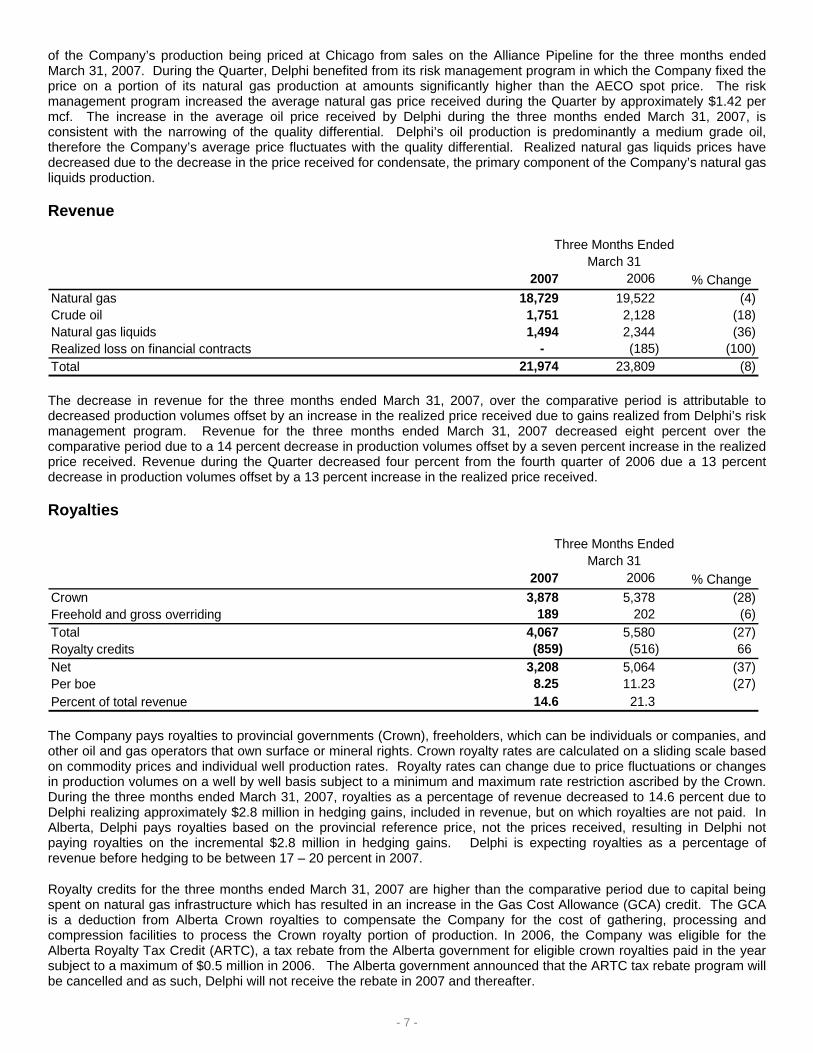
Revenue
2007 2006 % ChangeNatural gas 18,729 19,522 (4) Crude oil 1,751 2,128 (18) Natural gas liquids 1,494 2,344 (36) Realized loss on financial contracts - (185) (100) Total 21,974 23,809 (8)
Three Months EndedMarch 31
The decrease in revenue for the three months ended March 31, 2007, over the comparative period is attributable to decreased production volumes offset by an increase in the realized price received due to gains realized from Delphi’s risk management program. Revenue for the three months ended March 31, 2007 decreased eight percent over the comparative period due to a 14 percent decrease in production volumes offset by a seven percent increase in the realized price received. Revenue during the Quarter decreased four percent from the fourth quarter of 2006 due a 13 percent decrease in production volumes offset by a 13 percent increase in the realized price received.
Royalties
2007 2006 % ChangeCrown 3,878 5,378 (28) Freehold and gross overriding 189 202 (6) Total 4,067 5,580 (27) Royalty credits (859) (516) 66 Net 3,208 5,064 (37) Per boe 8.25 11.23 (27) Percent of total revenue 14.6 21.3
Three Months EndedMarch 31
The Company pays royalties to provincial governments (Crown), freeholders, which can be individuals or companies, and other oil and gas operators that own surface or mineral rights. Crown royalty rates are calculated on a sliding scale based on commodity prices and individual well production rates. Royalty rates can change due to price fluctuations or changes in production volumes on a well by well basis subject to a minimum and maximum rate restriction ascribed by the Crown. During the three months ended March 31, 2007, royalties as a percentage of revenue decreased to 14.6 percent due to Delphi realizing approximately $2.8 million in hedging gains, included in revenue, but on which royalties are not paid. In Alberta, Delphi pays royalties based on the provincial reference price, not the prices received, resulting in Delphi not paying royalties on the incremental $2.8 million in hedging gains. Delphi is expecting royalties as a percentage of revenue before hedging to be between 17 – 20 percent in 2007.
Royalty credits for the three months ended March 31, 2007 are higher than the comparative period due to capital being spent on natural gas infrastructure which has resulted in an increase in the Gas Cost Allowance (GCA) credit. The GCA is a deduction from Alberta Crown royalties to compensate the Company for the cost of gathering, processing and compression facilities to process the Crown royalty portion of production. In 2006, the Company was eligible for the Alberta Royalty Tax Credit (ARTC), a tax rebate from the Alberta government for eligible crown royalties paid in the year subject to a maximum of $0.5 million in 2006. The Alberta government announced that the ARTC tax rebate program will be cancelled and as such, Delphi will not receive the rebate in 2007 and thereafter.
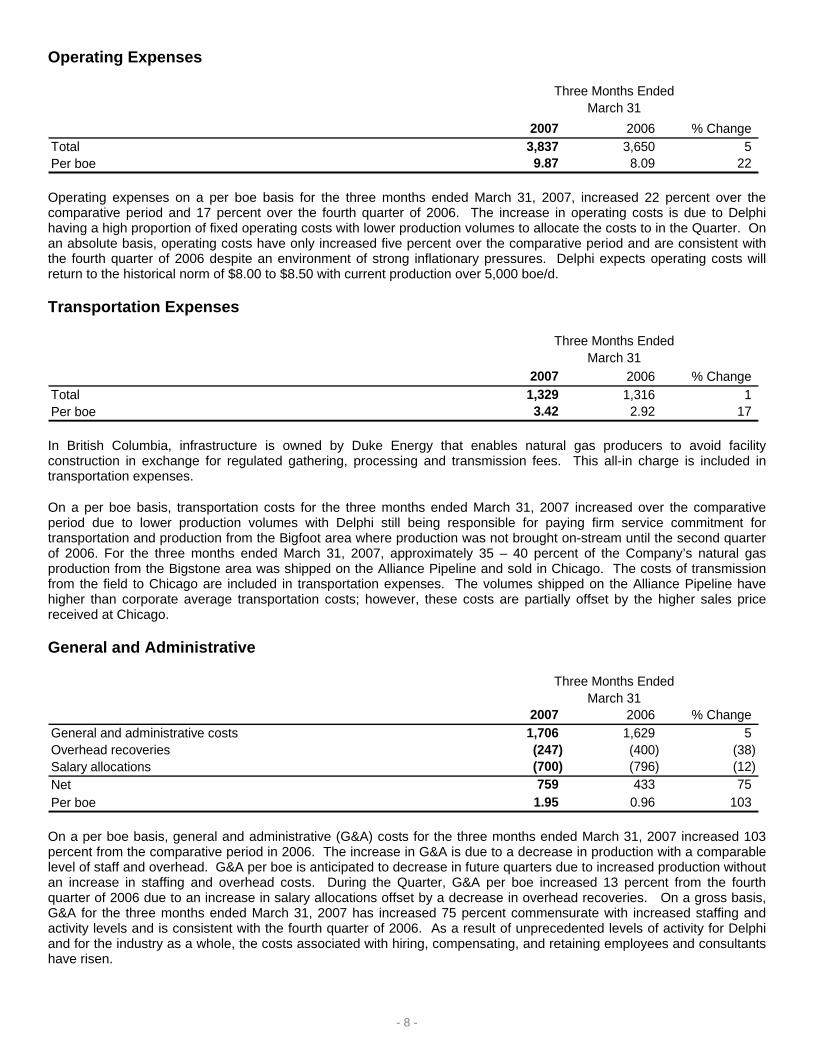
Operating expenses on a per boe basis for the three months ended March 31, 2007, increased 22 percent over the comparative period and 17 percent over the fourth quarter of 2006. The increase in operating costs is due to Delphi having a high proportion of fixed operating costs with lower production volumes to allocate the costs to in the Quarter. On an absolute basis, operating costs have only increased five percent over the comparative period and are consistent with the fourth quarter of 2006 despite an environment of strong inflationary pressures. Delphi expects operating costs will return to the historical norm of $8.00 to $8.50 with current production over 5,000 boe/d.
In British Columbia, infrastructure is owned by Duke Energy that enables natural gas producers to avoid facility construction in exchange for regulated gathering, processing and transmission fees. This all-in charge is included in transportation expenses.
On a per boe basis, transportation costs for the three months ended March 31, 2007 increased over the comparative period due to lower production volumes with Delphi still being responsible for paying firm service commitment for transportation and production from the Bigfoot area where production was not brought on-stream until the second quarter of 2006. For the three months ended March 31, 2007, approximately 35 – 40 percent of the Company’s natural gas production from the Bigstone area was shipped on the Alliance Pipeline and sold in Chicago. The costs of transmission from the field to Chicago are included in transportation expenses. The volumes shipped on the Alliance Pipeline have higher than corporate average transportation costs; however, these costs are partially offset by the higher sales price received at Chicago.
General and Administrative
2007 2006 % ChangeGeneral and administrative costs 1,706 1,629 5 Overhead recoveries (247) (400) (38) Salary allocations (700) (796) (12) Net 759 433 75 Per boe 1.95 0.96 103
Three Months EndedMarch 31
On a per boe basis, general and administrative (G&A) costs for the three months ended March 31, 2007 increased 103 percent from the comparative period in 2006. The increase in G&A is due to a decrease in production with a comparable level of staff and overhead. G&A per boe is anticipated to decrease in future quarters due to increased production without an increase in staffing and overhead costs. During the Quarter, G&A per boe increased 13 percent from the fourth quarter of 2006 due to an increase in salary allocations offset by a decrease in overhead recoveries. On a gross basis, G&A for the three months ended March 31, 2007 has increased 75 percent commensurate with increased staffing and activity levels and is consistent with the fourth quarter of 2006. As a result of unprecedented levels of activity for Delphi and for the industry as a whole, the costs associated with hiring, compensating, and retaining employees and consultants have risen.
Stock-based compensation expense is the amortization over the vesting period of the fair value of stock options granted to employees, directors and key consultants of the Company. The fair value of all options granted is estimated at the date of grant using the Black-Scholes option pricing model. The non-cash compensation expense for the three months ended March 31, 2007, decreased 86 percent due to no options being granted to employees during the Quarter. During the three months ended March 31, 2007, Delphi capitalized $0.2 million of stock-based compensation associated with exploration and development activities.
Interest expense on a per boe basis increased 184 percent over the comparable period due to higher bank debt from increased capital spending, higher average interest rates and lower production volumes. Delphi anticipates interest per boe will decrease throughout the year as debt is paid down and production is brought on stream.
Depletion, Depreciation and Accretion
2007 2006 % ChangeDepletion and depreciation 9,375 8,792 7 Accretion expense 158 149 6 Total 9,533 8,941 7 Per boe 24.51 19.82 24
Three Months EndedMarch 31
Depletion, depreciation, and accretion per boe increased 24 percent due to higher cost proved reserve additions, which is a trend throughout the industry. Throughout 2006, Delphi invested a significant amount of capital towards field infrastructure, allocated to depletable costs on a reasonable basis, which does not increase proved reserves but is critical to current operations and future development plans. Depletion per boe is consistent with the fourth quarter of 2006.
The accretion expense for the three months ended March 31, 2007 increased six percent over the comparative period due to new wells drilled in 2006 and 2007.
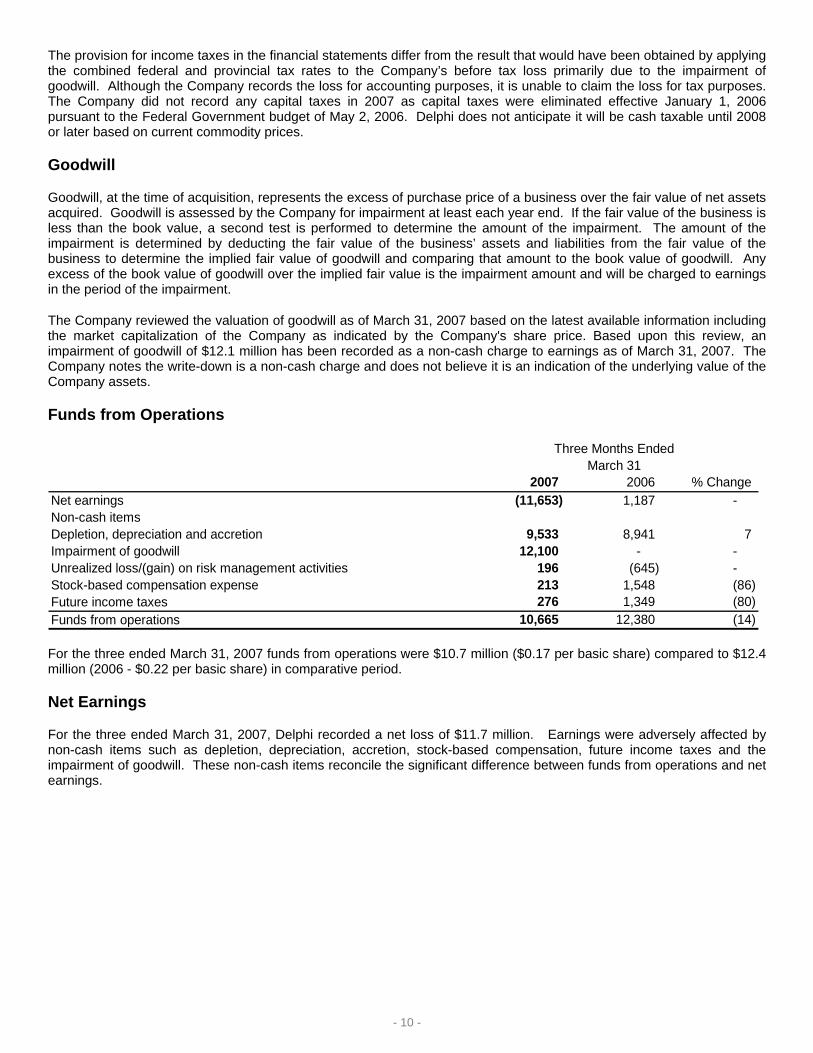
The provision for income taxes in the financial statements differ from the result that would have been obtained by applying the combined federal and provincial tax rates to the Company’s before tax loss primarily due to the impairment of goodwill. Although the Company records the loss for accounting purposes, it is unable to claim the loss for tax purposes. The Company did not record any capital taxes in 2007 as capital taxes were eliminated effective January 1, 2006 pursuant to the Federal Government budget of May 2, 2006. Delphi does not anticipate it will be cash taxable until 2008 or later based on current commodity prices.
Goodwill
Goodwill, at the time of acquisition, represents the excess of purchase price of a business over the fair value of net assets acquired. Goodwill is assessed by the Company for impairment at least each year end. If the fair value of the business is less than the book value, a second test is performed to determine the amount of the impairment. The amount of the impairment is determined by deducting the fair value of the business’ assets and liabilities from the fair value of the business to determine the implied fair value of goodwill and comparing that amount to the book value of goodwill. Any excess of the book value of goodwill over the implied fair value is the impairment amount and will be charged to earnings in the period of the impairment.
The Company reviewed the valuation of goodwill as of March 31, 2007 based on the latest available information including the market capitalization of the Company as indicated by the Company's share price. Based upon this review, an impairment of goodwill of $12.1 million has been recorded as a non-cash charge to earnings as of March 31, 2007. The Company notes the write-down is a non-cash charge and does not believe it is an indication of the underlying value of the Company assets.
Funds from Operations
2007 2006 % ChangeNet earnings (11,653) 1,187 - Non-cash itemsDepletion, depreciation and accretion 9,533 8,941 7 Impairment of goodwill 12,100 - - Unrealized loss/(gain) on risk management activities 196 (645) - Stock-based compensation expense 213 1,548 (86) Future income taxes 276 1,349 (80) Funds from operations 10,665 12,380 (14)
Three Months EndedMarch 31
For the three ended March 31, 2007 funds from operations were $10.7 million ($0.17 per basic share) compared to $12.4 million (2006 - $0.22 per basic share) in comparative period.
Net Earnings
For the three ended March 31, 2007, Delphi recorded a net loss of $11.7 million. Earnings were adversely affected by non-cash items such as depletion, depreciation, accretion, stock-based compensation, future income taxes and the impairment of goodwill. These non-cash items reconcile the significant difference between funds from operations and net earnings.
Approximately 84 percent of Delphi’s production is natural gas and therefore Delphi’s netbacks are primarily driven by the price received for natural gas. Delphi has an active risk management program to mitigate some of the volatility in commodity prices. Cash netbacks are consistent with the comparable period and have increased six percent over the fourth quarter of 2006. The cash netback during the Quarter reflects the benefit of the risk management program.
The Company had a successful Quarter with the drill bit resulting in a drilling success rate of 100 percent. The Company has in excess of 100 drilling locations identified within its core areas of operations.
- 12 -
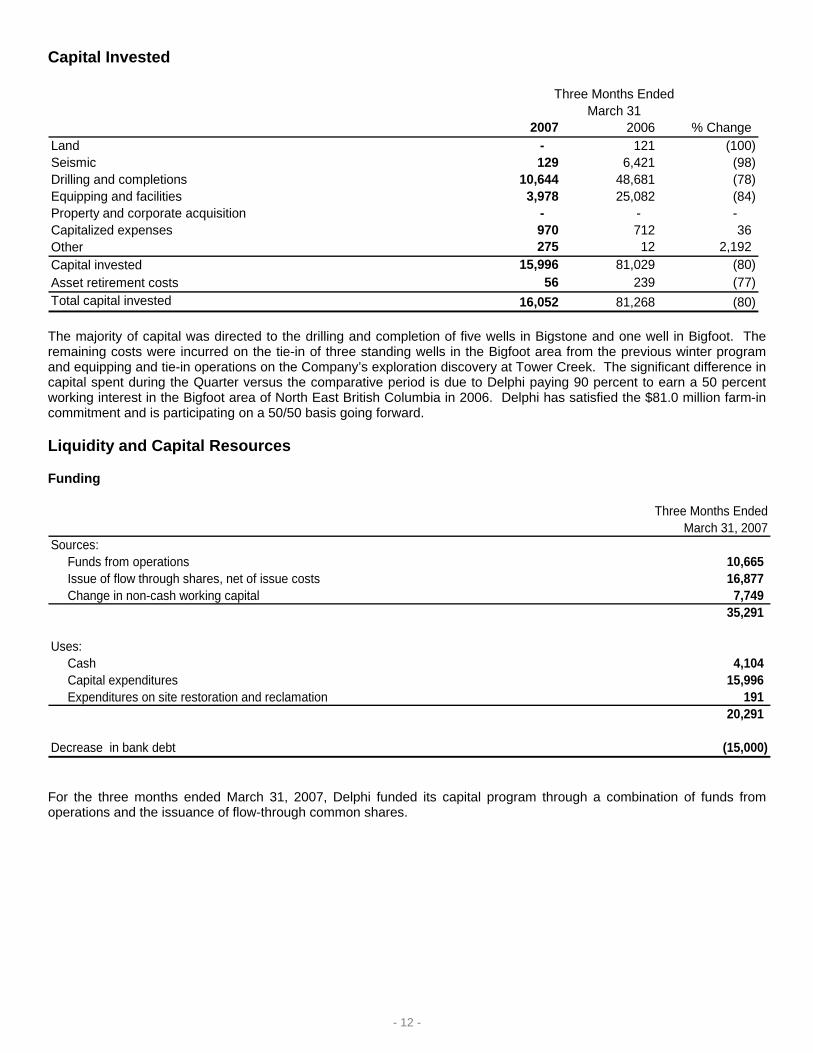
Capital Invested
2007 2006 % ChangeLand - 121 (100) Seismic 129 6,421 (98) Drilling and completions 10,644 48,681 (78) Equipping and facilities 3,978 25,082 (84) Property and corporate acquisition - - - Capitalized expenses 970 712 36 Other 275 12 2,192 Capital invested 15,996 81,029 (80) Asset retirement costs 56 239 (77) Total capital invested 16,052 81,268 (80)
Three Months EndedMarch 31
The majority of capital was directed to the drilling and completion of five wells in Bigstone and one well in Bigfoot. The remaining costs were incurred on the tie-in of three standing wells in the Bigfoot area from the previous winter program and equipping and tie-in operations on the Company’s exploration discovery at Tower Creek. The significant difference in capital spent during the Quarter versus the comparative period is due to Delphi paying 90 percent to earn a 50 percent working interest in the Bigfoot area of North East British Columbia in 2006. Delphi has satisfied the $81.0 million farm-in commitment and is participating on a 50/50 basis going forward.
Liquidity and Capital Resources
Funding
Sources: Funds from operations 10,665 Issue of flow through shares, net of issue costs 16,877 Change in non-cash working capital 7,749
35,291
Uses: Cash 4,104 Capital expenditures 15,996 Expenditures on site restoration and reclamation 191
20,291
Decrease in bank debt (15,000)
Three Months EndedMarch 31, 2007
For the three months ended March 31, 2007, Delphi funded its capital program through a combination of funds from operations and the issuance of flow-through common shares.
- 13 -
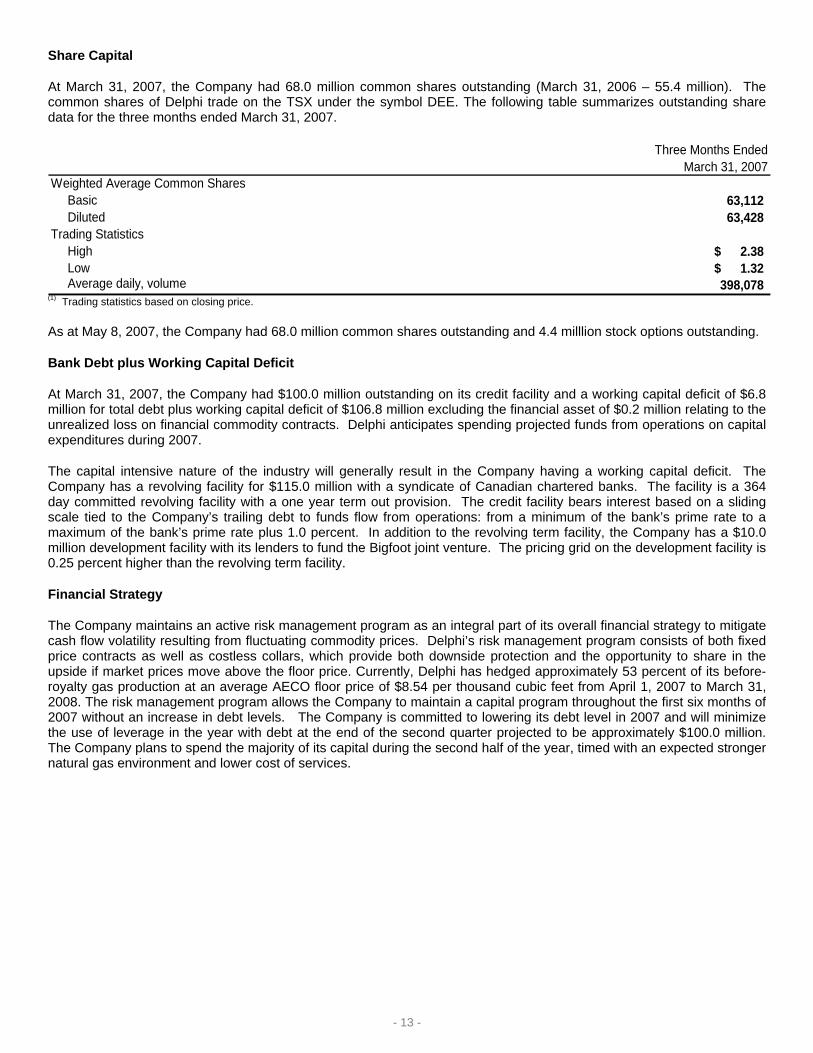
Share Capital
At March 31, 2007, the Company had 68.0 million common shares outstanding (March 31, 2006 – 55.4 million). The common shares of Delphi trade on the TSX under the symbol DEE. The following table summarizes outstanding share data for the three months ended March 31, 2007.
Weighted Average Common Shares Basic 63,112 Diluted 63,428 Trading Statistics High 2.38$ Low 1.32$ Average daily, volume 398,078
Three Months EndedMarch 31, 2007
(1) Trading statistics based on closing price.
As at May 8, 2007, the Company had 68.0 million common shares outstanding and 4.4 milllion stock options outstanding.
Bank Debt plus Working Capital Deficit
At March 31, 2007, the Company had $100.0 million outstanding on its credit facility and a working capital deficit of $6.8 million for total debt plus working capital deficit of $106.8 million excluding the financial asset of $0.2 million relating to the unrealized loss on financial commodity contracts. Delphi anticipates spending projected funds from operations on capital expenditures during 2007.
The capital intensive nature of the industry will generally result in the Company having a working capital deficit. The Company has a revolving facility for $115.0 million with a syndicate of Canadian chartered banks. The facility is a 364 day committed revolving facility with a one year term out provision. The credit facility bears interest based on a sliding scale tied to the Company’s trailing debt to funds flow from operations: from a minimum of the bank’s prime rate to a maximum of the bank’s prime rate plus 1.0 percent. In addition to the revolving term facility, the Company has a $10.0 million development facility with its lenders to fund the Bigfoot joint venture. The pricing grid on the development facility is 0.25 percent higher than the revolving term facility.
Financial Strategy
The Company maintains an active risk management program as an integral part of its overall financial strategy to mitigate cash flow volatility resulting from fluctuating commodity prices. Delphi’s risk management program consists of both fixed price contracts as well as costless collars, which provide both downside protection and the opportunity to share in the upside if market prices move above the floor price. Currently, Delphi has hedged approximately 53 percent of its before-royalty gas production at an average AECO floor price of $8.54 per thousand cubic feet from April 1, 2007 to March 31, 2008. The risk management program allows the Company to maintain a capital program throughout the first six months of 2007 without an increase in debt levels. The Company is committed to lowering its debt level in 2007 and will minimize the use of leverage in the year with debt at the end of the second quarter projected to be approximately $100.0 million. The Company plans to spend the majority of its capital during the second half of the year, timed with an expected stronger natural gas environment and lower cost of services.
- 14 -
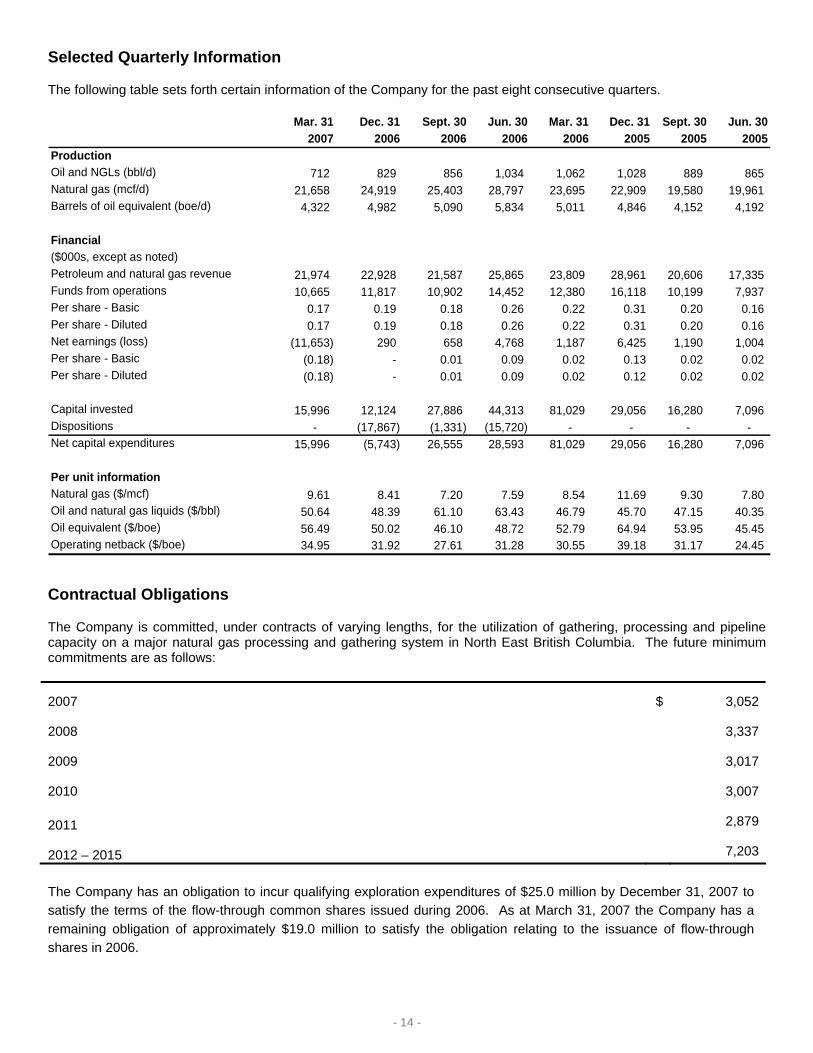
Selected Quarterly Information
The following table sets forth certain information of the Company for the past eight consecutive quarters.
Financial($000s, except as noted)Petroleum and natural gas revenue 21,974 22,928 21,587 25,865 23,809 28,961 20,606 17,335 Funds from operations 10,665 11,817 10,902 14,452 12,380 16,118 10,199 7,937 Per share - Basic 0.17 0.19 0.18 0.26 0.22 0.31 0.20 0.16 Per share - Diluted 0.17 0.19 0.18 0.26 0.22 0.31 0.20 0.16 Net earnings (loss) (11,653) 290 658 4,768 1,187 6,425 1,190 1,004 Per share - Basic (0.18) - 0.01 0.09 0.02 0.13 0.02 0.02 Per share - Diluted (0.18) - 0.01 0.09 0.02 0.12 0.02 0.02
Capital invested 15,996 12,124 27,886 44,313 81,029 29,056 16,280 7,096 Dispositions - (17,867) (1,331) (15,720) - - - - Net capital expenditures 15,996 (5,743) 26,555 28,593 81,029 29,056 16,280 7,096
Per unit informationNatural gas ($/mcf) 9.61 8.41 7.20 7.59 8.54 11.69 9.30 7.80 Oil and natural gas liquids ($/bbl) 50.64 48.39 61.10 63.43 46.79 45.70 47.15 40.35 Oil equivalent ($/boe) 56.49 50.02 46.10 48.72 52.79 64.94 53.95 45.45 Operating netback ($/boe) 34.95 31.92 27.61 31.28 30.55 39.18 31.17 24.45
Contractual Obligations
The Company is committed, under contracts of varying lengths, for the utilization of gathering, processing and pipeline capacity on a major natural gas processing and gathering system in North East British Columbia. The future minimum commitments are as follows:
2007 $ 3,052
2008 3,337
2009 3,017
2010 3,007
2011 2,879
2012 – 2015 7,203
The Company has an obligation to incur qualifying exploration expenditures of $25.0 million by December 31, 2007 to satisfy the terms of the flow-through common shares issued during 2006. As at March 31, 2007 the Company has a remaining obligation of approximately $19.0 million to satisfy the obligation relating to the issuance of flow-through shares in 2006.
- 15 -
Guarantees and Off-balance Sheet Arrangements
Delphi has not entered into any off-balance sheet arrangements or guarantees.
Business Conditions and Risk
See the Company’s 2006 Annual Information Form (AIF) for a listing of risks.
Critical Accounting Estimates
Delphi’s financial statements have been prepared in accordance with Canadian general accepted accounting principles. Certain accounting policies require management to make decisions with respect to the formulation of estimates and assumptions that affect the reported amounts of assets, liabilities, revenues and expenses. Delphi’s management review their estimates frequently; however, the emergence of new information and changed circumstances may result in actual results or changes to estimated amounts that differ materially from current estimates. Delphi attempts to mitigate this risk by employing individuals with the appropriate skill set and knowledge to make reasonable estimates; developing internal reporting systems; and comparing past estimates to actual results.
The Company’s financial and operating results include estimates of the following:
• Depletion, depreciation and accretion based on estimates of oil and gas reserves; • Estimated revenues, operating expenses and royalties for which actual revenues and costs have not been
received; • Estimated capital expenditures on projects that are in progress; • Estimated fair value of derivative contracts; and • Estimated amount of the asset retirement obligation including estimates of future costs and the timing of the
costs; • Estimated fair value of the Company in performing the goodwill impairment test.
Change in Accounting Policies
Effective January 1, 2007, the Company adopted the new Canadian accounting standards for financial instruments – recognition and measurement; financial instruments – presentation and disclosure, hedging and comprehensive income. The Company has adopted these standards prospectively and as such the comparative financial statements have not been restated. The adoption of these standards had no effect on opening retained earnings or accumulated other comprehensive income. The Company adopted Section 1506 – Accounting Changes, the only effect of which is to provide disclosure of when an entity has not applied a new source of GAAP that has been issued but is not yet effective. This is the case with Section 1535 – Capital; Section 3862 – Financial Instruments Disclosures; and Section 3863 - Financial Instruments Presentations; which are required to be adopted for fiscal years beginning on or after October 1, 2007. The Company will adopt these standards on January 1, 2008 and it is expected the only effect on the Company will be incremental disclosures about the Company's financial instruments as well as its capital and how it is managed
Corporate Governance
Overview
The shareholders’ interests are a critical factor in the operation and management of Delphi. The Company is committed to maintaining the highest level of investor confidence in the Company through the development of its corporate governance polices. Delphi’s Board consists of five independent directors and two officers of the Company who meet regularly to discuss matters of strategy and execution of the business plan. See Delphi’s AIF for a listing of committees that oversee specific aspects of the Company’s operating and financial strategy.
Disclosure Controls
Disclosure controls and procedures have been designed to ensure information required to be disclosed by Delphi is accumulated and communicated to the Company’s Management as appropriate to allow timely decisions regarding disclosures. The Company’s Chief Executive Officer and Chief Financial Officer have concluded, based on their
- 16 -
evaluation as of the end of the period covered by the interim filings, that the Company’s disclosure controls and procedures provide a reasonable level of assurance that information required to be disclosed by the Company is recorded, processed, summarized and reported within the time periods specified and the controls and procedures are designed to ensure that information required to be disclosed by the Company is accumulated and communicated to the issuer's management, including its Chief Executive Officer and Chief Financial Officer, as appropriate to allow timely decisions regarding required disclosure. The Company notes that while it believes the disclosure controls and procedures provide a reasonable level of assurance that they are effective, it does not expect that the disclosure controls and procedures will prevent all errors and fraud. A control system is designed to provide reasonable, not absolute, assurance that the objectives of the control system are met.
SEDAR Filing
Additional information about Delphi is available on the Canadian Securities Administrators’ System for Electronic Distribution and Retrieval (SEDAR) at www.sedar.com and at the Company’s website at www.delphienergy.ca.
- 17 -
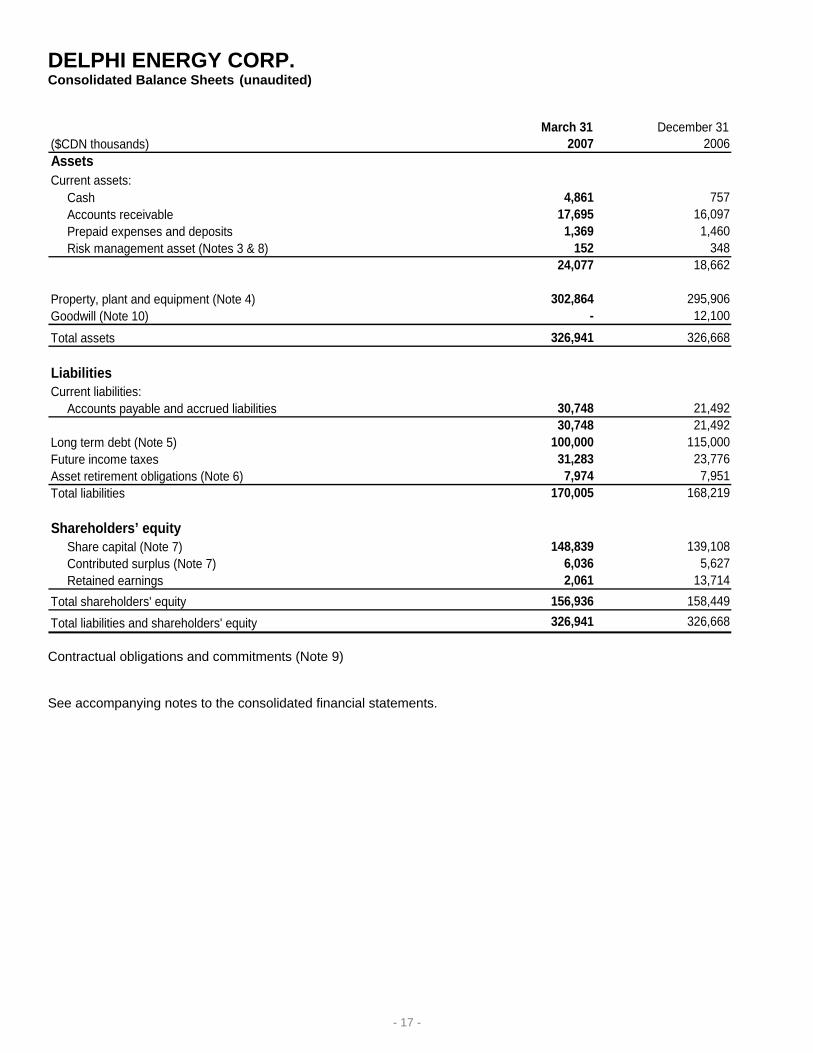
DELPHI ENERGY CORP. Consolidated Balance Sheets (unaudited)
LiabilitiesCurrent liabilities: Accounts payable and accrued liabilities 30,748 21,492
30,748 21,492 Long term debt (Note 5) 100,000 115,000 Future income taxes 31,283 23,776 Asset retirement obligations (Note 6) 7,974 7,951 Total liabilities 170,005 168,219
Shareholders’ equity Share capital (Note 7) 148,839 139,108 Contributed surplus (Note 7) 6,036 5,627 Retained earnings 2,061 13,714 Total shareholders' equity 156,936 158,449 Total liabilities and shareholders' equity 326,941 326,668 Contractual obligations and commitments (Note 9)
See accompanying notes to the consolidated financial statements.
- 18 -
DELPHI ENERGY CORP. Consolidated Statements of Earnings/(Loss), Comprehensive Income/(Loss) and Retained Earnings (unaudited) For the three months ended March 31 ($CDN thousands, except per unit amounts) 2007 2006
Revenue:Petroleum and natural gas sales 21,974 23,994 Realized loss on risk management activities - (185)
Expenses:Operating 3,837 3,650 Transportation 1,329 1,316 General and administrative 759 433 Stock-based compensation (Note 7) 213 1,548 Interest 2,176 889 Depletion, depreciation and accretion 9,533 8,941 Impairment of goodwill (Note 10) 12,100 -
29,947 16,777
Earnings/(loss) before taxes (11,377) 2,613
Taxes: Capital - 77 Future 276 1,349
276 1,426 Net earnings/(loss) and comprehensive income/(loss) (11,653) 1,187 Retained earnings, beginning of period 13,714 6,811 Retained earnings, end of period 2,061 7,998
Earnings/(loss) per share (Note 7)Basic and diluted (0.18) 0.02 See accompanying notes to the consolidated financial statements.
- 19 -
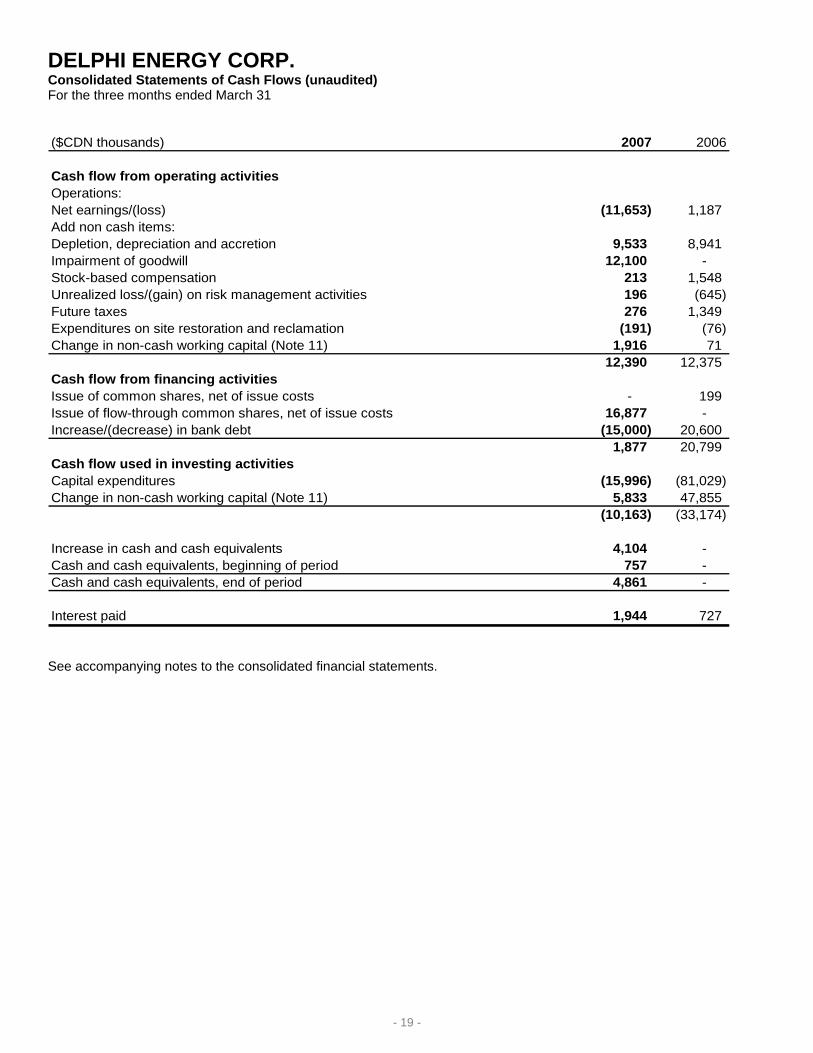
DELPHI ENERGY CORP. Consolidated Statements of Cash Flows (unaudited) For the three months ended March 31 ($CDN thousands) 2007 2006
Cash flow from operating activitiesOperations:Net earnings/(loss) (11,653) 1,187 Add non cash items:Depletion, depreciation and accretion 9,533 8,941 Impairment of goodwill 12,100 - Stock-based compensation 213 1,548 Unrealized loss/(gain) on risk management activities 196 (645) Future taxes 276 1,349 Expenditures on site restoration and reclamation (191) (76) Change in non-cash working capital (Note 11) 1,916 71
12,390 12,375 Cash flow from financing activitiesIssue of common shares, net of issue costs - 199 Issue of flow-through common shares, net of issue costs 16,877 - Increase/(decrease) in bank debt (15,000) 20,600
1,877 20,799 Cash flow used in investing activitiesCapital expenditures (15,996) (81,029) Change in non-cash working capital (Note 11) 5,833 47,855
(10,163) (33,174)
Increase in cash and cash equivalents 4,104 - Cash and cash equivalents, beginning of period 757 - Cash and cash equivalents, end of period 4,861 -
Interest paid 1,944 727
See accompanying notes to the consolidated financial statements.
- 20 -
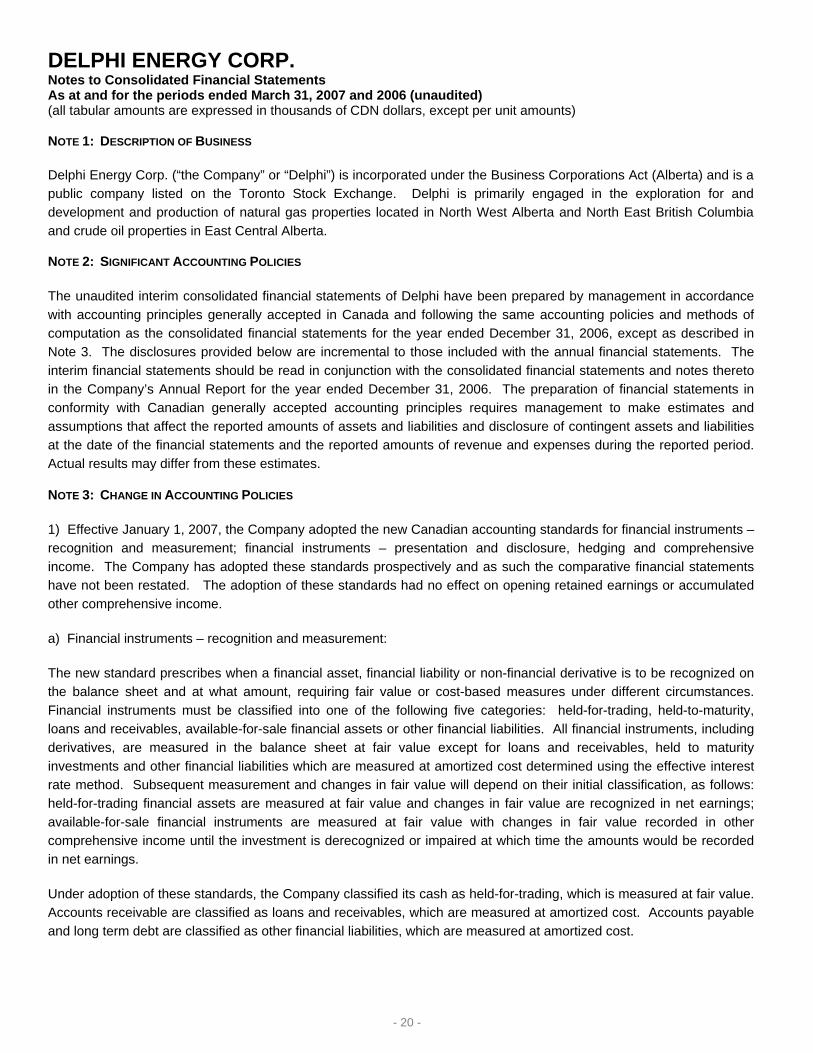
DELPHI ENERGY CORP. Notes to Consolidated Financial Statements As at and for the periods ended March 31, 2007 and 2006 (unaudited) (all tabular amounts are expressed in thousands of CDN dollars, except per unit amounts) NOTE 1: DESCRIPTION OF BUSINESS
Delphi Energy Corp. (“the Company” or “Delphi”) is incorporated under the Business Corporations Act (Alberta) and is a public company listed on the Toronto Stock Exchange. Delphi is primarily engaged in the exploration for and development and production of natural gas properties located in North West Alberta and North East British Columbia and crude oil properties in East Central Alberta. NOTE 2: SIGNIFICANT ACCOUNTING POLICIES
The unaudited interim consolidated financial statements of Delphi have been prepared by management in accordance with accounting principles generally accepted in Canada and following the same accounting policies and methods of computation as the consolidated financial statements for the year ended December 31, 2006, except as described in Note 3. The disclosures provided below are incremental to those included with the annual financial statements. The interim financial statements should be read in conjunction with the consolidated financial statements and notes thereto in the Company’s Annual Report for the year ended December 31, 2006. The preparation of financial statements in conformity with Canadian generally accepted accounting principles requires management to make estimates and assumptions that affect the reported amounts of assets and liabilities and disclosure of contingent assets and liabilities at the date of the financial statements and the reported amounts of revenue and expenses during the reported period. Actual results may differ from these estimates.
NOTE 3: CHANGE IN ACCOUNTING POLICIES
1) Effective January 1, 2007, the Company adopted the new Canadian accounting standards for financial instruments – recognition and measurement; financial instruments – presentation and disclosure, hedging and comprehensive income. The Company has adopted these standards prospectively and as such the comparative financial statements have not been restated. The adoption of these standards had no effect on opening retained earnings or accumulated other comprehensive income.
a) Financial instruments – recognition and measurement:
The new standard prescribes when a financial asset, financial liability or non-financial derivative is to be recognized on the balance sheet and at what amount, requiring fair value or cost-based measures under different circumstances. Financial instruments must be classified into one of the following five categories: held-for-trading, held-to-maturity, loans and receivables, available-for-sale financial assets or other financial liabilities. All financial instruments, including derivatives, are measured in the balance sheet at fair value except for loans and receivables, held to maturity investments and other financial liabilities which are measured at amortized cost determined using the effective interest rate method. Subsequent measurement and changes in fair value will depend on their initial classification, as follows: held-for-trading financial assets are measured at fair value and changes in fair value are recognized in net earnings; available-for-sale financial instruments are measured at fair value with changes in fair value recorded in other comprehensive income until the investment is derecognized or impaired at which time the amounts would be recorded in net earnings.
Under adoption of these standards, the Company classified its cash as held-for-trading, which is measured at fair value. Accounts receivable are classified as loans and receivables, which are measured at amortized cost. Accounts payable and long term debt are classified as other financial liabilities, which are measured at amortized cost.
- 21 -
b) Derivatives:
All derivative instruments, including embedded derivatives, are recorded on the balance sheet at fair value unless exempted from derivative treatment as a normal purchase and sale. All changes in the fair value of derivative instruments are recorded in earnings unless cash flow hedge accounting is used, in which case changes in fair value are recorded in other comprehensive income. The Company has a risk management program whereby the commodity price associated with a portion of its future production is fixed in order to mitigate cash flow volatility resulting from fluctuating commodity prices. The Company sells forward a portion of its future production and enters into a combination of fixed price physical sale contracts with customers and fixed price contracts with financial counterparties. The Company has elected not to use cash flow hedge accounting on its fixed price contracts with financial counterparties resulting in all changes in fair value being recorded in the statement of earnings. The Company has elected to account for its physical commodity sales contracts which were entered into and continue to be held for the purpose of receipt or delivery of non-financial items in accordance with its expected purchase, sale or usage requirements as executory contracts on an accrual basis rather than as non-financial derivatives. Prior to adoption of the new standards, physical receipt and delivery contracts did not fall within the scope of the definition of a financial instrument and were also accounted for as executory contracts.
c) Other comprehensive income
The new standards require a new statement of comprehensive income, which is comprised of net earnings and other comprehensive income which, for the Company, related to changes in gains or losses on derivatives designated as cash flow hedges. The Company has combined this new statement with the statement of earnings.
d) Effective interest rate method
Transactions costs attributable to financial instruments classified as other than held for trading are included in the recognized amount of the related financial instrument and recognized over the life of the resulting financial instrument.
2) The Company adopted Section 1506 – Accounting Changes, the only effect of which is to provide disclosure of when an entity has not applied a new source of GAAP that has been issued but is not yet effective. This is the case with Section 1535 – Capital; Section 3862 – Financial Instruments Disclosures; and Section 3863 - Financial Instruments Presentations; which are required to be adopted for fiscal years beginning on or after October 1, 2007. The Company will adopt these standards on January 1, 2008 and it is expected the only effect on the Company will be incremental disclosures about the Company's financial instruments as well as its capital and how it is managed
NOTE 4: PROPERTY, PLANT AND EQUIPMENT
Accumulateddepletion and Net book
As at March 31, 2007 Cost depreciation valuePetroleum and natural gas properties $ 296,644 $ 79,398 $ 217,246 Production equipment 100,714 15,371 85,343 Furniture, fixtures and office equipment 673 398 275
$ 398,031 $ 95,167 $ 302,864
As at December 31, 2006Petroleum and natural gas properties $ 285,168 $ 71,331 $ 213,837 Production equipment 95,892 14,087 81,805 Furniture, fixtures and office equipment 639 375 264
$ 381,699 $ 85,793 $ 295,906
- 22 -
As at March 31, 2007, costs in the amount of $33.3 million (December 31, 2006 - $35.8 million) representing unproved properties were excluded from the depletion calculation and estimated future development costs of $20.1 million (December 31, 2006 - $21.7 million) have been included in costs subject to depletion. All costs of unproved properties have been capitalized. Ultimate recoverability of these costs will be dependent upon finding proved oil and natural gas reserves. The Company performed a separate impairment review of assets excluded from the ceiling test and determined that no impairment has occurred.
The Company capitalized $0.7 million (March 31, 2006 - $0.7 million) of general and administrative costs directly related to exploration and development activities.
NOTE 5: LONG TERM DEBT
The Company has a revolving facility for $115.0 million with a syndicate of Canadian chartered banks. The facility is a 364 day committed revolving facility with a one year term out provision. The credit facility bears interest based on a sliding scale tied to the Company’s trailing debt to cash flow: from a minimum of the bank’s prime rate to a maximum of the bank’s prime rate plus 1.0 percent.
In addition to the revolving term facility, the Company has a $10.0 million development facility with its lenders to fund the Bigfoot joint venture. The pricing grid on the development facility is 0.25 percent higher than the revolving term facility.
The two facilities are secured by a $150.0 million demand floating charge debenture and a general security agreement over all assets of the Company.
NOTE 6: ASSET RETIREMENT OBLIGATIONS
The Company’s asset retirement obligations result from working interests in petroleum and natural gas assets including well sites, gathering systems and processing facilities. The Company estimates the total undiscounted amount of cash flows required to settle its asset retirement obligations, over the next three to twenty years, is approximately $17.1 million. A credit-adjusted risk-free rate of 8.0 percent and an inflation rate of 2.5 percent were used to calculate the estimated fair value of the asset retirement obligations.
A reconciliation of the asset retirement obligations is provided below.
March 31 December 312007 2006
Balance, beginning of period 7,951$ 7,394$ Liabilities incurred 56 606 Liabilities sold - (183) Liabilities acquired - - Liabilities settled (191) (503) Change in estimate - - Accretion expense 158 637 Balance, end of period 7,974$ 7,951$
NOTE 7: SHARE CAPITAL
(a) Authorized:
An unlimited number of voting common shares.
An unlimited number of preferred shares issuable in series.
Balance, beginning of period 60,663 139,108$ 55,254 123,692$ Issue of flow-through common shares 7,350 18,007 5,209 25,003 Issue of common shares - - - - Exercise of stock options - - 200 305 Allocated from contributed surplus - - - 145 Share issue costs - (1,130) - (1,725) Future tax effect of share issue costs - 354 - 528 Tax benefit renounced to shareholders - (7,500) - (8,840) Balance, end of period 68,013 148,839$ 60,663 139,108$
March 31, 2007 December 31, 2006
On March 1, 2007, the Company issued 7.35 million flow-through common shares at a price of $2.45 per share for gross proceeds of $18.0 million.
On June 29, 2006, the Company issued 5.2 million flow-through common shares at a price of $4.80 per share for gross proceeds of $25.0 million.
The Company has incurred the necessary qualifying exploration expenditures to satisfy the terms of the flow-through shares issued in 2005. Although the Company believes it has incurred the necessary qualifying expenditures, these amounts may be subject to audit and subsequent interpretation by the Canada Revenue Agency. The Company has an obligation to incur qualifying exploration expenditures of $25.0 million by December 31, 2007 to satisfy the terms of the flow-through common shares issued during 2006. As at March 31, 2007, the Company has a remaining obligation of approximately $19.0 million to satisfy the obligation relating to the issuance of flow-through shares in 2006.
(c) Stock options:
The Company has established a stock option plan under which it has granted options to acquire common shares to certain officers, directors, employees and key consultants. The plan provides for the granting of options equal to ten percent of the issued and outstanding common shares of the Company. Options issued under the plan have a term of five years to expiry and vest over a two-year period starting on the date of the grant. The exercise price of each option equals the closing market price of the Company’s common shares immediately preceding the date of the grant. As at March 31, 2007 there were 4.2 million options to purchase shares outstanding.
The following table summarizes the changes in the number of options outstanding and the weighted average share prices.
March 31, 2007 December 31, 2006
Outstanding
options (000’s)Weighted average
exercise priceOutstanding
options (000’s) Weighted average
exercise price
Balance, beginning of year 4,229 $ 3.40 2,629 $ 2.37Granted - - 1,800 4.69Exercised - - (200) 1.53
Balance, end of year 4,229 3.40 4,229 3.40
Exercisable at end of year 3,429 $ 3.16 2,641 $ 2.81
- 24 -
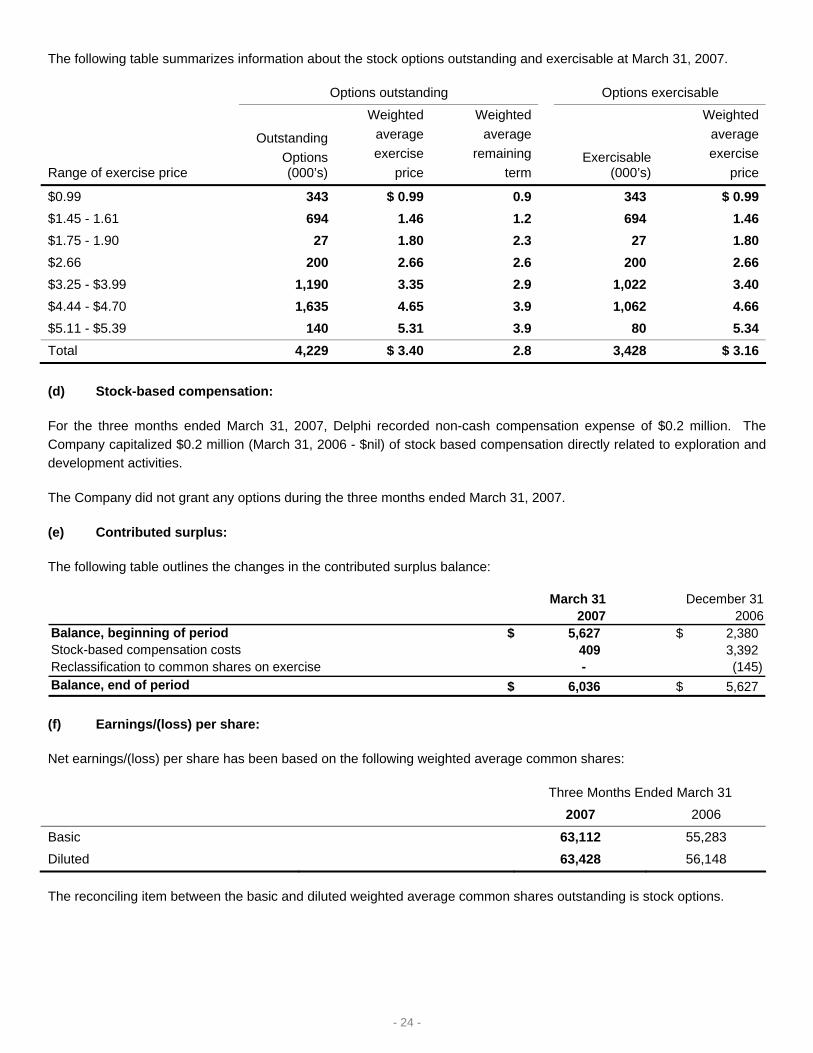
The following table summarizes information about the stock options outstanding and exercisable at March 31, 2007.
For the three months ended March 31, 2007, Delphi recorded non-cash compensation expense of $0.2 million. The Company capitalized $0.2 million (March 31, 2006 - $nil) of stock based compensation directly related to exploration and development activities.
The Company did not grant any options during the three months ended March 31, 2007.
(e) Contributed surplus:
The following table outlines the changes in the contributed surplus balance:
March 31 December 312007 2006
Balance, beginning of period 5,627$ 2,380$ Stock-based compensation costs 409 3,392 Reclassification to common shares on exercise - (145) Balance, end of period 6,036$ 5,627$
(f) Earnings/(loss) per share:
Net earnings/(loss) per share has been based on the following weighted average common shares:
Three Months Ended March 31 2007 2006
Basic 63,112 55,283 Diluted 63,428 56,148
The reconciling item between the basic and diluted weighted average common shares outstanding is stock options.
- 25 -
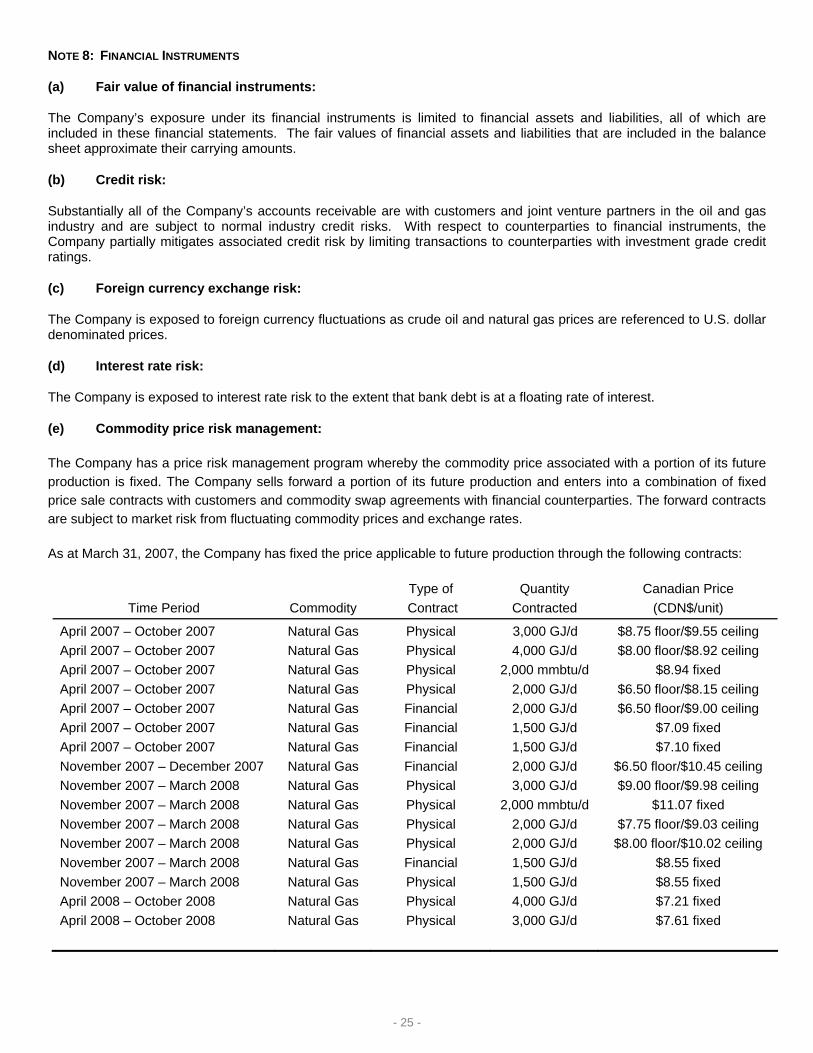
NOTE 8: FINANCIAL INSTRUMENTS
(a) Fair value of financial instruments:
The Company’s exposure under its financial instruments is limited to financial assets and liabilities, all of which are included in these financial statements. The fair values of financial assets and liabilities that are included in the balance sheet approximate their carrying amounts.
(b) Credit risk:
Substantially all of the Company’s accounts receivable are with customers and joint venture partners in the oil and gas industry and are subject to normal industry credit risks. With respect to counterparties to financial instruments, the Company partially mitigates associated credit risk by limiting transactions to counterparties with investment grade credit ratings.
(c) Foreign currency exchange risk:
The Company is exposed to foreign currency fluctuations as crude oil and natural gas prices are referenced to U.S. dollar denominated prices.
(d) Interest rate risk:
The Company is exposed to interest rate risk to the extent that bank debt is at a floating rate of interest.
(e) Commodity price risk management:
The Company has a price risk management program whereby the commodity price associated with a portion of its future production is fixed. The Company sells forward a portion of its future production and enters into a combination of fixed price sale contracts with customers and commodity swap agreements with financial counterparties. The forward contracts are subject to market risk from fluctuating commodity prices and exchange rates.
As at March 31, 2007, the Company has fixed the price applicable to future production through the following contracts:
Time Period
Commodity
Type of Contract
Quantity Contracted
Canadian Price (CDN$/unit)
April 2007 – October 2007 April 2007 – October 2007 April 2007 – October 2007 April 2007 – October 2007 April 2007 – October 2007 April 2007 – October 2007 April 2007 – October 2007 November 2007 – December 2007 November 2007 – March 2008 November 2007 – March 2008 November 2007 – March 2008 November 2007 – March 2008 November 2007 – March 2008 November 2007 – March 2008 April 2008 – October 2008 April 2008 – October 2008
Natural Gas Natural Gas Natural Gas Natural Gas Natural Gas Natural Gas Natural Gas Natural Gas Natural Gas Natural Gas Natural Gas Natural Gas Natural Gas Natural Gas Natural Gas Natural Gas
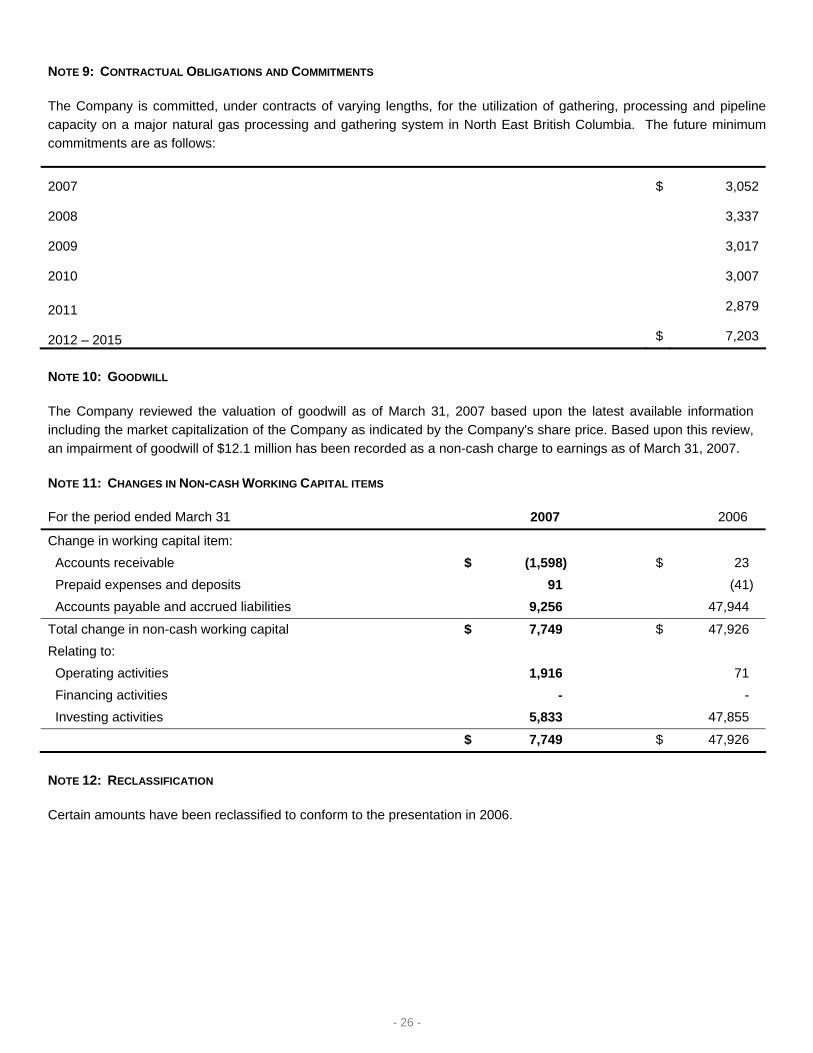
The Company is committed, under contracts of varying lengths, for the utilization of gathering, processing and pipeline capacity on a major natural gas processing and gathering system in North East British Columbia. The future minimum commitments are as follows:
2007 $ 3,052
2008 3,337
2009 3,017
2010 3,007
2011 2,879
2012 – 2015 $ 7,203
NOTE 10: GOODWILL
The Company reviewed the valuation of goodwill as of March 31, 2007 based upon the latest available information including the market capitalization of the Company as indicated by the Company's share price. Based upon this review, an impairment of goodwill of $12.1 million has been recorded as a non-cash charge to earnings as of March 31, 2007.
NOTE 11: CHANGES IN NON-CASH WORKING CAPITAL ITEMS
For the period ended March 31 2007 2006
Change in working capital item: Accounts receivable $ (1,598) $ 23 Prepaid expenses and deposits 91 (41) Accounts payable and accrued liabilities 9,256 47,944
Total change in non-cash working capital $ 7,749 $ 47,926 Relating to: Operating activities 1,916 71 Financing activities - - Investing activities 5,833 47,855
$ 7,749 $ 47,926
NOTE 12: RECLASSIFICATION
Certain amounts have been reclassified to conform to the presentation in 2006.
- 27 -
CORPORATE INFORMATION
DIRECTORS David J. Reid President and Chief Executive Officer Delphi Energy Corp. Tony Angelidis Senior Vice President Exploration Delphi Energy Corp. Harry S. Campbell, Q.C. (2) Partner Burnet, Duckworth & Palmer LLP Henry R. Lawrie (1) Independent Businessman Robert A. Lehodey, Q.C. (2) Partner Osler, Hoskin & Harcourt LLP Andrew E. Osis (1) Independent Businessman Lamont C. Tolley (1) Independent Businessman (1) Member of the Audit and Reserves Committee (2) Member of the Corporate Governance and Compensation Committee OFFICERS David J. Reid President and Chief Executive Officer Tony Angelidis Senior Vice President Exploration Rod A. Hume Vice President Engineering Michael S. Kaluza Chief Operating Officer Brian P. Kohlhammer Vice President Finance and Chief Financial Officer