EBITDA (NOK millions) Earnings per share (NOK) Debt/equity ratio 0 2,000 4,000 6,000 1Q13 4Q12 3Q12 2Q12 1Q12 4Q11 3Q11 0 5 10 15 1Q13 4Q12 3Q12 2Q12 1Q12 4Q11 3Q11 -0.1 0.0 0.1 0.2 0.3 1Q13 4Q12 3Q12 2Q12 1Q12 4Q11 3Q11 REPORT EARNINGS PER SHARE NOK 8.04 Yara International ASA – quarterly report • Strong results with stable margins • Strong cash flow • Fertilizer deliveries close to last year despite late spring • Record NPK production and sales First quarter 2013 Yara reports a strong first quarter with stable margins and sales volumes.
Transcript
EBITDA (NOK millions) Earnings per share (NOK) Debt/equity ratio
0
2,000
4,000
6,000
1Q134Q123Q122Q121Q124Q113Q110
5
10
15
1Q134Q123Q122Q121Q124Q113Q11-0.1
0.0
0.1
0.2
0.3
1Q134Q123Q122Q121Q124Q113Q11
REPORT
EARNINGS PER SHARE
NOK 8.04
Yara International ASA – quarterly report
• Strong results with stable margins
• Strong cash flow
• Fertilizer deliveries close to last year despite late spring
• Record NPK production and sales
First quarter 2013
Yara reports a strong first quarter with stable margins and sales volumes.
2 YARA FIRST QUARTER 2013
FINANCIAL HIGHLIGHTS
NOK millions, except where indicated otherwise 1Q 2013 1Q 2012 2012
Revenue and other income 20,690 21,303 84,509 Operating income 2,682 3,087 11,159 Share net income equity-accounted investees 525 363 1,964 EBITDA 4,129 4,310 16,970 EBITDA excl. special items 4,094 3,933 16,850 Net income after non-controlling interests 2,255 3,008 10,552 Earnings per share 1) 8.04 10.54 37.31 Earnings per share excl.currency 1) 8.60 9.58 35.85 Earnings per share excl.currency and special items 1) 8.51 8.32 35.34 Average number of shares outstanding (millions) 280.6 285.5 282.8 CROGI (12-month rolling average) 2) 17.0 % 20.7 % 17.3 %ROCE (12-month rolling average) 18.7 % 25.2 % 19.3 %
1) NOK per share. Yara currently has no share-based compensation programs that result in a dilutive effect on EPS.2) First-quarter 2013 CROGI excl. special items annualized 16.4%.
KEY STATISTICS
1Q 2013 1Q 2012 2012
Average market pricesUrea prilled (fob Black Sea) USD per ton 400 389 407CAN (cif Germany) USD per ton 351 361 337Ammonia (fob Black Sea) USD per ton 562 399 545DAP (fob US Gulf) USD per ton 489 517 536Phosphate rock (fob Morocco) USD per ton 161 196 182
European gas (Zeebrugge) USD per MMBtu 11.1 9.3 9.4US gas (Henry Hub) USD per MMBtu 3.5 2.5 2.8Yara's gas & oil cost (weighted average) 1) USD per MMBtu 8.3 7.9 8.0Yara's European gas & oil cost (weighted average) 1) USD per MMBtu 11.5 11.0 11.0USD/NOK currency rate 5.63 5.78 5.81
Production 1)
Ammonia 1,826 1,682 7,035 Finished fertilizer and industrial products (excl. blends and industrial gases) 4,610 4,263 17,521 Total 6,436 5,945 24,555
1) Including Yara’s share in equity-accounted investees.
Yara’s first-quarter net income after non-controlling interests was NOK 2,255 million, compared with NOK 3,008 million last year. Excluding net foreign exchange gain/loss and special items, the result was NOK 2,389 million, compared with NOK 2,374 million in first quarter 2012. The corresponding earnings per share were NOK 8.51 compared with NOK 8.32 last year.
“Yara reports a strong first quarter with stable margins and sales volumes,” said Jørgen Ole Haslestad, President and Chief Executive Officer of Yara.
“Our production increased due to the Qafco expansions, the Lifeco re-start and a record production performance in Yara’s NPK plants in the first quarter,” said Jørgen Ole Haslestad.
FERTILIZER MARKET CONDITIONSStrong crop prices continue to support fertilizer demand. According to the US Department of Agriculture (USDA), 2012/13 global grain production is expected to drop by 2.9% compared with the previous season, due to adverse weather in key producing regions. As stocks are already low, demand rationing through high prices is needed to balance the market, and the USDA is predicting a 1.4% drop in grain use for 2012/13, limiting the draw on stocks to 30 million tons. The Food and Agriculture Organization of the United Nations (FAO) food price index for the first quarter was 2% lower than first quarter last year overall (8% higher than the five year average), while its cereal price index was up 9% (13% higher than the five year average).
First quarter 2013
3YARA FIRST QUARTER 2013
Global urea demand was strong during the first quarter. The average price at USD 400 per ton fob Black Sea, 3% higher than first quarter last year, implied a demand-driven market where all producers had incentives to produce at maximum rates, despite additional capacity in Qatar and Vietnam. Last year, urea prices increased significantly towards the end of the first quarter, due to insufficient pre-buying in key Northern hemisphere regions, most notably in North America. This has not happened this year, with the same key markets being better supplied than last season, made possible by record exports from China in addition to the new capacity in Qatar and Vietnam. For the period July through February, China has this season exported 7.2 million tons, up from 3.0 million tons same period the previous season.
Overall, the ammonia market remained solid for the quarter, with the average price fob Black Sea 41% higher than same quarter last year. However, prices have shown a weakening trend since October as demand has been negatively affected by a weak phosphate market. Ammonia supply was sufficient to meet demand without having to reduce production of urea or other upgraded nitrogen products, in contrast to the situation during fourth quarter 2012.
Phosphate fertilizer demand is strong in most regions of the world, but with India as an important exception which is the key reason for downward pressure on prices. Subsidy reduction and sharply higher prices for Indian farmers negatively impact phosphate use, and high phosphate stocks in India further reduce the need for imports. As India normally represents roughly half of global DAP imports, reduced Indian demand is strongly felt in the phosphate market. Sales of DAP in India for 2012/13 are reported down 16% on the previous year, and application is probably down more.
Lower DAP prices resulted in lower prices for phosphate rock and phosphoric acid compared with the same quarter last year, leaving upgrading margins from rock to DAP at roughly the same level.
REGIONAL MARKET DEVELOPMENTSFirst-quarter nitrogen fertilizer deliveries in Western Europe were in line with last year, with imports up 3%. While deliveries were in line with historic volumes for a first quarter, they were negatively affected in March by the late spring, in addition to continued wet conditions in some areas. For the season, deliveries are 4% ahead of last year, with imports 8% higher.
First-quarter US nitrogen deliveries are up by an estimated 7% on first quarter 2012, with a large contribution from additional urea imports. Season-to-date deliveries are up by an estimated 5%. Additional supply coupled with a cold and late spring has led to a market situation without the price spikes seen last season.
In India, urea sales this year (from April to March) are reported up 2% on last year, at 30 million tons. Production increased less, leaving a modest increase in the import requirement. First quarter is off-season for urea imports to India.
Urea production in China is gaining year on year, helped by lower production costs, better feedstock availability and increased capacity. Urea exports during January and February were 0.6 million tons, compared to 0.1 million tons same period last year, allowed at a low export tax despite the low tax period ending October 31. The average domestic urea price for first quarter was at the same level as last year.
In Brazil, total fertilizer deliveries were 5.4 million tons for the quarter, up 2% on last year. Urea imports for the quarter were 0.9 million tons, 60% above same quarter last year.
Volume & mix 101 Price/margin 458 Oil & gas costs in Europe (122)Special items (342)Other (180)Translation NOK vs. USD 1) (95)Total variance explained (181)
1) Based on average NOK per USD for the quarter 2013: 5.63 (2012: 5.78)
Yara delivered strong first-quarter results, reflecting stable margins and additional ammonia and urea volumes from Qafco, Lifeco and Yara Pil-bara which more than offset a small decline in Yara fertilizer deliveries.
Volume developmentGlobal Yara fertilizer deliveries were down 3% on first quarter 2012, as higher urea and NPK blend sales did not fully offset lower UAN and phos-phate trade sales. Urea sales increased by 4%, mainly reflecting higher sales of Qafco urea in Brazil and North America. Sales of NPK blends in-creased 16%, driven by higher sales in Brazil where the market improved compared with a weak first quarter 2012. Compound NPK deliveries were down 2%, but deliveries of Yara-produced compound NPK increased by 4%. Nitrate sales were in line with last year, as increased European deliv-eries were offset by lower deliveries to markets outside Europe, especially Brazil where sales to the sugar cane and citrus segments were lower than last year. UAN sales decreased by 19% mainly due to reduced product availability from the Belle Plaine plant.
Total European sales were in line with last year, with season-to-date deliv-eries 6% ahead. Sales outside Europe were down 6%, mainly due to lower phosphate trade sales.
Sales volumes in equity-accounted investees increased with new volumes from the Qafco 5 and 6 expansions and the return of production in Libya. Yara’s sales of Qafco and Lifeco produced urea increased by 60% from first quarter 2012.
4 YARA FIRST QUARTER 2013
Industrial sales volumes decreased by 5% compared with first quarter 2012. Technical ammonium nitrate (TAN) sales declined 16% due to lower sales to Australia, where imports were high last year due to local production problems. Sales of stationary NOX abatement products were down 4% mainly due to lower coal-based power production both in Eu-rope and North America. Sales of ammonia, urea and nitric acid to the European process industry were down 8%, as several customers reduced production. Cold weather in Europe dampened sales of CO2 and con-sumption of water treatment products. Air1 sales were 24% ahead of last year, reflecting continued strong sales in Europe and North America.
Yara’s ammonia production increased 9% compared with last year, mainly reflecting increased Qafco production, the return of production in Libya and outages in Billingham in first quarter 2012. Finished fertilizer produc-tion was 8% above first quarter 2012. Urea production increased 18%, as additional Qafco and Lifeco were only partly offset by an unscheduled stop in the Belle Plaine plant. NPK plants have been running well in the quarter, with monthly production records in several plants delivering an increase of 9% from first quarter 2012.
Margin developmentAmmonia margins improved significantly compared with first quarter 2012, while upgrading margins from ammonia were lower. A significant part of the price/margin variance is related to Yara Pilbara, where Yara ac-quired a controlling stake with subsequent consolidation from 1 February 2012, with limited initial earnings on fair value adjusted opening stocks.
Ammonia prices increased by 37%, while realized urea prices were 1% higher than a year ago resulting in lower upgrading margins. Realized ni-trate prices were in line with last year, resulting in slightly lower premiums over urea. NPK compound prices were down 2%, decreasing less than equivalent commodity nutrient values, as demand for value-added prod-ucts remained strong. NPK blend margins improved as the Brazil market approached normal levels compared with a weak first quarter 2012.
Industrial margins were higher compared with first quarter last year. Chemicals showed a positive margin development reflecting a realloca-tion of products towards higher paying segments, and margins for water treatment products increased compared with last year. Strong margins for Air1 and NOx abatement products in the Nordic regions were offset by price pressure in Continental Europe and increased sourcing cost in the US. TAN margins were lower compared with first quarter 2012 due to lower mining activity in Yara’s main markets.
Yara’s average European gas and oil cost increased by 0.5 USD/MMBtu compared with the first quarter 2012, but ended lower than guidance as the euro weakened substantially against the US dollar during the quarter. Measured in EUR, costs were in line with guidance. Both spot gas and oil linked gas increased from last year. Yara’s global average oil and gas cost increased 5% on a USD per MMBtu basis as there was also an increase in costs outside Europe due to ammonia-linked contracts and increased Henry Hub price.
Other items The special items variance of NOK 342 million primarily reflects the Yara Pilbara transaction effects of NOK 390 million in first quarter 2012. For further details on special items see pages 8 and 9.
The major part of the “Other” variance is related to increased fixed costs, primarily due to growth and plant reliability related activities.
The US dollar was approximately 3% weaker versus the Norwegian krone compared with first quarter 2012, resulting in a negative translation effect in Yara’s results.
The volume and price effects shown in the Yara variance table include net income from equity-accounted investees, which is shown in the table be-low.
Net income from equity-accounted investees
NOK millions 1Q 2013 1Q 2012
Qafco 350 309 Tringen 89 57 GrowHow UK Ltd 32 53 Lifeco 49 (62)Other 5 5 Total 525 363
Net income from equity-accounted investees increased by NOK 162 million compared with last year, mainly driven by resumed production in Libya and higher sales volume from the Qafco 5 and 6 expansions.
Tringen benefitted from higher ammonia prices. GrowHow UK was affected by delayed demand in the UK market as more than normal rain delayed planting as well as higher gas cost due to colder weather than normal.
Lifeco resumed production but with smaller outages, however results are below what could normally be expected as there has been inventory buildup to normal operational level during the quarter.
5YARA FIRST QUARTER 2013
PRODUCTION VOLUMES 1)
Thousand tons 1Q 2013 1Q 2012 2012
Ammonia 1,826 1,682 7,035 of which equity-accounted investees 489 365 1,695
Urea 1,191 1,007 4,121 of which equity-accounted investees 426 225 1,142
Nitrate 1,520 1,496 6,217 of which equity-accounted investees 68 63 375
NPK 1,244 1,137 4,490 of which equity-accounted investees 11 62 257
1)Including Yara share of production in equity-accounted investees.
SALES VOLUMES
Thousand tons 1Q 2013 1Q 2012 2012
Ammonia 869 779 3,398 of which industrial products 1) 169 190 683
Urea 1,598 1,584 5,994 of which fertilizer 1,284 1,238 4,699 of which Yara-produced fertilizer 449 587 2,070 of which Yara-produced industrial products 2) 287 269 1,046 of which equity-accounted investees 691 432 1,975
Nitrate 1,646 1,693 6,369 of which fertilizer 1,450 1,466 5,529 of which Yara-produced fertilizer 1,352 1,386 5,130 of which Yara-produced industrial products 167 187 710
NPK 1,626 1,603 6,626 of which Yara-produced compounds 1,221 1,174 4,169 of which Yara-produced blends 320 275 2,090
CN 332 326 1,271 of which fertilizer 261 233 898 of which Yara-produced fertilizer 258 225 862 of which Yara-produced industrial products 65 87 344
UAN 316 392 1,222 of which Yara-produced fertilizer 293 377 1,165
Europe 2,892 2,880 9,706Latin America 923 798 4,720North America 802 796 3,038Asia 484 610 2,124Africa 198 353 1,160Total 5,300 5,437 20,748
For a description of the key global fertilizer products, see the Yara Fertilizer Industry Handbook:http://www.yara.com/investor_relations/reports_presentations/index.aspx
Interest income from customers 30 35 Interest income, other 55 57 Interest income and other financial income 85 92
Interest expense (162) (181)Net interest expense on net pension liabilities (20) (15)Foreign exchange gain/(loss) (218) 394 Other 23 (16)Interest expense and foreign exchange gain/(loss) (377) 181
Net financial income/(expense) (292) 273
First-quarter net financial expense was NOK 292 million compared with an income of NOK 273 million last year. The variance primarily reflects a net foreign exchange loss this quarter of NOK 218 million compared with a net gain of NOK 394 million in the same quarter last year.
Interest income was NOK 2 million lower than in the same quarter last year. Average cash deposits were NOK 3.4 billion higher than in the same quarter last year, but average interest rates were around 75 basis points lower. The cash has mainly been kept as bank deposits in Norwegian kroner.
Interest expense was NOK 162 million compared with NOK 181 million last year. The variance mainly reflects an average gross debt around NOK 1.6 billion lower than in the same quarter last year and interest expense related to tax payments in Yara Pilbara included in last year’s figure.
The foreign exchange loss this quarter was NOK 218 million, as the US dollar appreciated around 3% against the euro and close to 5% against the Norwegian krone. At the end of the quarter, the US dollar debt generating currency effects in the income statement was approximately USD 1,050 million, with around USD 650 million of the exposure towards the euro.
TAXFirst-quarter provisions for current and deferred taxes were NOK 558 million, approximately 19% of income before tax, in line with the tax rate implied in previously published earnings scenarios.
NET INTEREST-BEARING DEBT
NOK millions 1Q 2013
Net interest-bearing debt at beginning of period (954)Cash earnings 1) 2,741 Dividends received from equity-accounted investees 1,119 Net operating capital change (169)Investments (net) (682)Foreign exchange gain/(loss) (218)Other 146Net cash at end of period 1,984
1) Operating income plus depreciation and amortization, minus tax paid, net gain/(loss) on disposals, net interest expense and bank charges.
As a supplement to the consolidated statement of cash flows (page 16), this table highlights the key factors behind the development in net interest-bearing debt.
The net cash position at the end of the first quarter was NOK 1,984 million, compared with net interest-bearing debt of NOK 954 million at the end of 2012. Strong cash earnings and dividends from equity-accounted investees far exceeded capital expenditure.
First-quarter dividends from Qafco amounted to NOK 1,104 million. Net operating capital increased by NOK 169 million, reflecting slightly higher inventory volume. The investment activity for the quarter mainly reflects planned maintenance programs.
7YARA FIRST QUARTER 2013
OutlookThe global farm margin outlook and incentives for fertilizer application remain strong. The FAO food price index is 2% lower than a year ago, but the cereal price index is 9% higher reflecting a needed demand rationing as a consequence of lower global production.
The US Department of Agriculture estimates that global grain stocks-to-use will decline by 5% during the 2012/13 season, underlining the continued long-term challenge of increasing agricultural productivity.
Global nitrogen demand was strong through the first quarter, as higher North American and European buying activity kept prices higher than a year ago despite increased supply from China and elsewhere. However, the higher Northern hemisphere imports so far this season combined with a late spring both in Europe and North America has seen prices soften in March and April. In contrast, North American nitrogen prices increased strongly during first half 2012, amid favorable spring planting conditions and low buying activity earlier in the season.
The Chinese urea export tax will according to official information be at 77% until 1 July, after which a minimum 2% level will apply until 1 November. Urea production in China has increased so far in 2013, and a continuation of this trend would increase the probability of significant second-half urea export volumes from China.
Start-ups of new nitrogen capacity outside China continue to be delayed, and gas curtailments impacting existing capacity remain an issue for
several countries. Further capacity delays are evident going forward, with unclear timing for most of the remaining 2013 start-ups.
Following a slow start to the 2012/13 season, Western European nitrogen fertilizer industry deliveries increased in the fourth quarter and were stable in the first quarter, leaving season-to-date deliveries 4% ahead of last year. Yara’s European deliveries were impacted by poor weather in March, but have recovered so far in April as planting conditions have improved.
Yara’s value-added nitrate and NPK products continue to deliver strong and stable margins which are relatively less exposed to swings in commodity nitrogen, phosphate and potash markets. Continued strong food demand and increased focus on food chain efficiency and quality are expected to reinforce this trend going forward.
Based on current forward markets for oil products and natural gas (12 April) Yara’s second-quarter energy costs are expected to be approximately NOK 300 million higher than last year. Third-quarter 2013 energy costs are expected to be NOK 50 million higher than a year earlier. The estimates may change considerably depending on future energy prices. From second quarter 2013, Yara’s European oil and gas exposure is 90% spot gas and 10% spot oil products.
The Board of Directors and Chief Executive OfficerYara International ASA
Oslo, 19 April 2013
Bernt ReitanChairperson
Elisabeth Harstad Board member
Juha Ilari RantanenBoard member
Hilde Merete Aasheim Board member
Rune Asle BrattebergBoard member
Guro Mauset Board member
Geir Olav SundbøBoard member
Jørgen Ole HaslestadPresident and CEO
8 YARA FIRST QUARTER 2013
Definitions and variance analysis
The fertilizer season in West Europe referred to in this discussion starts 1 July and ends 30 June.
Several of Yara’s purchase and sales contracts for commodities are, or have embedded terms and conditions which under IFRS are, accounted for as derivatives. The derivative elements of these contracts are presented under “Commodity-based derivatives gain/(loss)” in the condensed consolidated interim statement of income, and are referenced in the variance analysis (see below) as “Special items”.
“Other and eliminations” consists mainly of cross-segment elimina-tions, in addition to Yara’s headquarter costs. Profits on sales from Up-stream to Downstream and Industrial are not recognized in the consoli-dated Yara condensed consolidated interim statement of income before the products are sold to external customers. These internal profits are eliminated in “Other and eliminations”.
Changes in “Other and eliminations” EBITDA therefore usually reflect changes in Upstream-sourced stock (volumes) held by Downstream and Industrial, but can also be affected by changes in Upstream margins on products sold to Downstream and Industrial, as transfer prices move in line with arms-length market prices. With all other variables held constant, higher stocks would result in a higher (negative) elimination effect in Yara’s results, as would higher Upstream margins. Over time these effects tend to even out, to the extent that stock levels and margins normalize.
In the discussion of operating results, Yara refers to certain non-GAAP financial measures including EBITDA and CROGI. Yara’s management makes regular use of these measures to evaluate the performance, both in absolute terms and comparatively from period to period. These mea-sures are viewed by management as providing a better understanding - both for management and for investors – of the underlying operating results of the business segments for the period under evaluation. Yara manages long-term debt and taxes on a group basis. Therefore, net income is discussed only for the Group as a whole.
Yara’s management model, referred to as Value Based Management, reflects management’s focus on cash flow-based performance indicators. EBITDA, which Yara defines as income/(loss) before tax, interest ex-pense, foreign exchange gains/losses, depreciation, amortization and write-downs, is an approximation of cash flow from operating activities before tax and net operating capital changes. EBITDA is a measure that in addition to operating income, also includes interest income, other financial income, and results from equity-accounted investees. It ex-cludes depreciation, write-downs and amortization, as well as amortiza-tion of excess values in equity-accounted investees. Yara’s definition of EBITDA may differ from that of other companies.
EBITDA should not be considered as an alternative to operating income and income before tax as an indicator of the company’s operations in ac-cordance with generally accepted accounting principles. Nor is EBITDA an alternative to cash flow from operating activities in accordance with generally accepted accounting principles.
Yara management uses CROGI (Cash Return On Gross Investment) to measure performance. CROGI is defined as gross cash flow, divided by average gross investment and is calculated on a 12-month rolling basis. “Gross cash flow” is defined as EBITDA less total tax expense, exclud-ing tax on net foreign exchange gains/ losses. On Yara level, actual tax expense is used for the calculation while a standardized tax rate of 25% is used on segment level. “Gross Investment” is defined as total assets (exclusive of deferred tax assets, cash and cash equivalents, other liquid assets and fair value adjustment recognized in equity) plus accumulated depreciation and amortization, less all short-term interest-free liabili-ties, except deferred tax liabilities. On segment level, cash and other liq-uid assets are not excluded from “Gross Investment”.
ROCE (Return on capital employed) has been included as an additional performance measure to CROGI to simplify benchmarking with other companies. ROCE is defined as EBIT minus tax divided by average capital employed and is calculated on a 12-month rolling average basis. Capital employed is defined as total assets adjusted for deferred tax assets minus other current liabilities.
In order to track underlying business developments from period to period, Yara’s management also uses a variance analysis methodology, developed within the Company (“Variance Analysis”), that involves the extraction of financial information from the accounting system, as well as statistical and other data from internal management information sys-tems. Management considers the estimates produced by the Variance Analysis, and the identification of trends based on such analysis, suffi-ciently precise to provide useful data to monitor our business. However, these estimates should be understood to be less than an exact quantifi-cation of the changes and trends indicated by such analysis.
The variance analysis presented in Yara quarterly and annual financial reports is prepared on a Yara EBITDA basis including net income from equity-accounted investees. The volume, margin and other variances presented therefore include effects generated by performance in non-consolidated investees.
Yara defines “special items” as material items in the results which are not regarded as part of underlying business performance for the period. These fall into 2 categories, namely “non-recurring items” and “contract derivatives”. “Non-recurring items” comprise restructuring-related items and other gains or losses which are not primarily related to the period in which they are recognized, subject to a minimum value of NOK 20 million per item within a 12-month period. “Contract derivatives” are commodity-based derivatives gains or losses (see above) which are not the result of active exposure or position management by Yara.
Due to it being impractical to obtain financial reports at the same re-porting dates as Yara uses, the results for some of Yara’s equity-account-ed investees are included in Yara results with a one-month time lag.
9YARA FIRST QUARTER 2013
EBITDA effect Operating income effect
NOK millions 1Q 2013 1Q 2012 1Q 2013 1Q 2012
Settlement of pension plan in France - 21 - 21 Total Downstream - 21 - 21
Settlement of pension plan in France - 3 - 3 Total Industrial - 3 - 3
Settlement of pension plan in France - 1 - 1 Yara Pilbara transaction effects - 390 - 390 Libya costs - (62) - - Contract derivatives 35 23 28 12 Total Upstream 35 352 28 403
Settlement of pension plan in France - 1 - 1 Total Other and eliminations - 1 - 1
Total Yara 35 377 28 428
Special items
10 YARA FIRST QUARTER 2013
11YARA FIRST QUARTER 2013
NOK millions, except share information Notes 1Q 20131Q 2012
Restated 4)2012
Restated 4)
Revenue 3 20,617 20,849 83,997 Other income 3 41 431 678 Commodity based derivatives gain/(loss) 32 23 (166)Revenue and other income 3 20,690 21,303 84,509
Raw materials, energy costs and freight expenses 3) 5 (15,425) (15,808) (62,751)Payroll and related costs 3) 9 (1,265) (1,176) (5,059)Depreciation, amortization and impairment loss (835) (759) (3,424)Other operating expenses 3) (483) (473) (2,117)Operating costs and expenses (18,008) (18,216) (73,350)
Operating income 3 2,682 3,087 11,159
Share of net income in equity-accounted investees 3 525 363 1,964 Interest income and other financial income 3 85 92 404 Earnings before interest expense and tax (EBIT) 3 3,292 3,541 13,527
Foreign exchange gain/(loss) (218) 394 596 Interest expense and other financial items 9 (159) (212) (941)Income before tax 3 2,915 3,722 13,183
Income tax expense 9 (558) (729) (2,582)Net income 2,357 2,994 10,601
Net income attributable toShareholders of the parent 2,255 3,008 10,552 Non-controlling interests 103 (14) 49 Net income 2,357 2,994 10,601
Earnings per share 1) 8.04 10.54 37.31Weighted average number of shares outstanding 2) 280,567,264 285,456,159 282,821,544
1) Yara currently has no share-based compensation that results in a dilutive effect on earnings per share.2) Weighted average number of shares outstanding was reduced in second, third and fourth quarter 2012, due to the share buy-back program.3) 1Q 2012 figures have been reclassified within “operating costs and expenses” compared to the 1Q 2012 report to achieve consistent classification.4) See note 9 for more information.
Condensed consolidated interim statement of income
12 YARA FIRST QUARTER 2013
NOK millions Notes 1Q 20131Q 2012
Restated 1)2012
Restated 1)
Net income 9 2,357 2,994 10,601
Other comprehensive income that may be reclassified to profit or loss in subsequent periodsExchange differences on translation of foreign operations 9 1,528 (1,530) (2,960)Available-for-sale financial assets - change in fair value 30 (10) (24)Hedge of net investments (156) 23 79 Share of other comprehensive income of equity-accounted investees (4) (5) (68)Net other comprehensive income that may be reclassified to profit or loss in subsequent periods 1,398 (1,523) (2,973)
Other comprehensive income that will not be reclassified to profit or loss in subsequent periodsRemeasurements of the net defined benefit pension liability 9 - 13 (500)Net other comprehensive income that will not be reclassified to profit or loss in subsequent periods - 13 (500)
Reclassification adjustments of the period- cash flow hedges 3 3 11 - exchange differences on foreign operations disposed of in the year - (385) (354)Net reclassification adjustment of the period 3 (382) (343)
Total other comprehensive income, net of tax 9 1,401 (1,892) (3,816)
Total comprehensive income 3,758 1,102 6,785
Total comprehensive income attributable toShareholders of the parent 3,574 1,159 6,816 Non-controlling interests 184 (57) (32)Total 3,758 1,102 6,785
1) See note 9 for more information.
Condensed consolidated interim statement of comprehensive income
13YARA FIRST QUARTER 2013
NOK millionsShare
capital 1)
Premium paid-in capital
Translation of foreign
operations
Available- for-sale financial assets
Cash flow
hedges
Hedge of net
investments
Total other
reservesRetained earnings
Attributable to the
shareholdersof the parent
Non-controlling
interestsTotal
equity
Balance at 31 December 2011 485 117 430 29 (267) 90 282 43,737 44,623 157 44,779
Balance at 1 January 2012 restated 485 117 430 29 (267) 90 282 43,822 44,707 157 44,864
Net income - - - - - - - 3,008 3,008 (14) 2,994
Other comprehensive income, net of tax - - (1,872) (10) 3 23 (1,857) 13 (1,844) (43) (1,887)Share of other comprehensive income of equity-accounted investees - - (1) - (4) - (5) - (5) - (5)
Total other comprehensive income, net of tax - - (1,873) (10) (1) 23 (1,862) 13 (1,849) (43) (1,892)
Long term incentive plan - - - - - - - 1 1 - 1 Transactions with non-controlling interests - - - - - - - - - 1,889 1,889 Balance at 31 March 2012 restated 3) 485 117 (1,443) 19 (268) 113 (1,579) 46,843 45,867 1,988 47,855
Net income - - - - - - - 7,544 7,544 63 7,607
Other comprehensive income, net of tax - - (1,361) (14) 8 57 (1,310) (512) (1,822) (38) (1,860)Share of other comprehensive income of equity-accounted investees - - (1) - 5 - 3 (67) (64) - (64)
Total other comprehensive income, net of tax - - (1,362) (14) 13 57 (1,306) (579) (1,886) (38) (1,924)
Current liabilitiesTrade and other payables 11,871 9,986 9,665 Current tax liabilities 1,797 1,176 1,932 Short-term provisions 237 295 230 Other short-term liabilities 813 702 680 Bank loans and other interest-bearing short-term debt 625 729 604 Current portion of long-term debt 736 315 1,004 Total current liabilities 16,080 13,203 14,115
Total equity and liabilities 86,440 80,106 81,249
Number of shares outstanding 1) 2 280,567,264 285,456,159 280,567,264
1) Number of shares outstanding was reduced in second, third and fourth quarter 2012, due to the share buy-back program.2) See note 9 for more information.
Condensed consolidated statement of financial position
The Board of Directors and Chief Executive OfficerYara International ASA
Oslo, 19 April 2013
Bernt ReitanChairperson
Elisabeth Harstad Board member
Juha Ilari RantanenBoard member
Hilde Merete Aasheim Board member
Rune Asle BrattebergBoard member
Guro Mauset Board member
Geir Olav SundbøBoard member
Jørgen Ole HaslestadPresident and CEO
16 YARA FIRST QUARTER 2013
NOK millions Notes Q1 2013Q1 2012
Restated 2)2012
Restated 2)
Operating activities Operating income 3,9 2,682 3,087 11,159
Adjustments to reconcile operating income to net cashprovided by operating activitiesDepreciation, amortization and impairment loss 835 759 3,424 Write-down and reversals, net (27) (134) (102)Tax paid (835) (1,018) (2,702)Dividend from equity-accounted investees 1,119 349 986 Change in net operating capital 1) (141) 1,740 1,629 Other 336 (725) (1,161)Net cash from operating activities 3,968 4,059 13,233
Investing activitiesPurchases of property, plant and equipment 3 (794) (521) (3,569)Purchases of other long-term investments 3 (102) (9) (695)Net sales/(purchases) of short-term investments - - (1)Proceeds from sales of property, plant and equipment 12 6 51 Proceeds from sales of other long-term investments 202 - 258 Net cash from/(used in) investing activities (682) (523) (3,955)
Financing activitiesLoan proceeds/(repayments), net (913) (543) (1,792)Purchase of treasury shares - - (954)Redeemed shares Norwegian State - - (317)Dividend - - (1,998)Net cash transfers (to)/from non-controlling interests (85) - 11 Net cash from/(used in) financing activities (998) (543) (5,050)
Foreign currency effects on cash flows 48 (53) (154)
Net increase (decrease) in cash and cash equivalents 2,337 2,940 4,073 Cash and cash equivalents at beginning of period 9,941 5,868 5,868 Cash and cash equivalents at end of period 12,278 8,808 9,941
Bank deposits not available for the use of other group companies 391 332 286
1) Operating capital consists of trade receivable, inventories and trade payable.2) See note 9 for more information.
Condensed consolidated statement of cash flows
17YARA FIRST QUARTER 2013
GENERAL AND ACCOUNTING POLICIESYara (the Group) consists of Yara International ASA (the Company) and its subsidiaries. Yara International ASA is a limited company incorpo-rated in Norway.
The condensed consolidated interim financial statements consist of the Group and the Group’s interests in equity-accounted investees. The consolidated financial statements of the Group as at and for the year ended 31 December 2012 are available upon request from the Com-pany’s registered office at Bygdøy Allé 2, Oslo, Norway or at www.yara.com. These condensed consolidated interim financial statements have been prepared in accordance with International Financial Reporting Standard (IFRS) IAS 34 Interim Financial Reporting as approved by EU and additional requirements in the Norwegian Securities Trading
Act. They do not include all of the information required for full annual consolidated financial statements, and should be read in conjunction with consolidated financial statements of the Group as at and for the year ended 31 December 2012. These condensed consolidated interim financial statements are unaudited.
The accounting policies applied by the Group in these condensed con-solidated interim financial statements are mainly the same as those ap-plied by the Group in its consolidated financial statements as at and for the year ended 31 December 2012, except for revised IAS 19 which Yara has implemented 1 January 2013. See note 9 for more information.
As a result of rounding differences, numbers or percentages may not add up to the total.
Note 1
Judgments, estimates and assumptions
The preparation of condensed consolidated interim financial statements in accordance with IFRS and applying the chosen accounting policies re-quires management to make judgments, estimates and assumptions that affect the reported amounts of assets, liabilities, income and expenses. The estimates and associated assumptions are based on historical experience and various other factors that are believed to be reasonable under the cir-cumstances. Actual results may differ from these estimates. The estimates and the underlying assumptions are reviewed on an ongoing basis. Revi-sions to accounting estimates are recognized in the period in which the estimate is revised if the revision affects only that period or in the period
of the revision and future periods if the revision affects both current and future periods. When preparing these condensed consolidated interim financial statements, the significant judgments made by management in applying the Group’s accounting policies and the key sources of estima-tion uncertainty, were mainly the same as those that applied to the con-solidated financial statements as of the period ended 31 December 2012. See note 8 for more information about ongoing investigations.
Note 2
Shares
Ordinary shares Own shares 1)
Balance at 31 December 2011 287,656,159 (2,200,000)
Redeemed shares Norwegian State 2) (1,248,895) - Shares cancelled 2) (2,200,000) 2,200,000 Treasury shares - share buy-back program 2) - (3,640,000)Balance at 31 December 2012 284,207,264 (3,640,000)
Balance at 31 March 2013 284,207,264 (3,640,000)
1) Including employee trust. 2) As approved by General Meeting 10 May 2012.
Notes to the condensed consolidated interim financial statements
18 YARA FIRST QUARTER 2013
Note 3
Operating segment information
NOK millions 1Q 20131Q 2012
Restated 2)2012
Restated 2)
External revenue and other incomeDownstream 14,557 15,484 59,559 Industrial 3,025 3,138 12,500 Upstream 3,053 2,663 12,378 Other and eliminations 55 17 73 Total 20,690 21,303 84,509
Internal revenue and other income Downstream 401 256 950 Industrial 53 24 117 Upstream 8,168 8,097 32,533 Other and eliminations (8,622) (8,378) (33,600)Total - - -
Revenue and other incomeDownstream 14,958 15,740 60,508 Industrial 3,078 3,163 12,617 Upstream 11,221 10,761 44,911 Other and eliminations (8,567) (8,360) (33,527)Total 20,690 21,303 84,509
ROCE (12-month rolling average)Yara 18.7% 25.2% 19.3%Downstream 16.2% 19.7% 16.1%Industrial 14.3% 35.0% 14.4%Upstream 18.2% 20.8% 17.5%
Reconciliation of EBITDA to Income before taxEBITDA 4,129 4,310 16,970 Depreciation, amortization and impairment loss 2) (837) (769) (3,443)Foreign exchange gain/(loss) (218) 394 596 Interest expense and other financial items (159) (212) (941)Income before tax 2,915 3,722 13,183
RECONCILIATION OF OPERATING INCOME TO EBITDA
NOK millions Operating incomeEquity-accounted
investees
Interest incomeand other
financial income EBIT
Depreciation, amortization and impairment loss 1) EBITDA
1) Including amortization of excess value in equity-accounted investees.
20 YARA FIRST QUARTER 2013
Note 4
Business initiative
On 6 December 2012, Yara International ASA entered into an agree-ment to acquire Bunge’s fertilizer business in Brazil. Bunge operates 22 blending units across Brazil, and delivered 4.8 million tons of fertilizer products in 2011. The Bunge assets also include a SSP plant with an an-nual production capacity of 300,000 metric tons, a port concession and a terminal development project. The business employs approximately 1,250 people. Yara and Bunge have also agreed to enter into a long-term fertilizer supply agreement, enabling Bunge to continue supplying fer-tilizer to farmers as part of its grain origination activities and creating a framework for logistics and other commercial activities. The transac-tion is valued at USD 750 million and comprises a net operating capital
value of USD 385 million and other assets valued at USD 365 million. The operating capital value is subject to a post-closing adjustment. The transaction will be financed from the existing cash balance of Yara In-ternational ASA. Closing of the deal is subject to approval of Brazilian competition authorities (CADE) and other customary approvals. The CADE approval process has a statutory maximum duration of 330 days from the date of signing. In case of major remedies imposed on Yara in connection with competition authority clearance, Yara may terminate the agreement with Bunge, subject to paying Bunge a termination fee of USD 47 million.
Note 5
Inventory
NOK millions 31 Mar 2013 31 Mar 2012 31 Dec 2012
Finished goods 7,558 6,299 6,823 Work in progress 550 377 543 Raw materials 4,651 4,001 4,560 Total 12,759 10,677 11,927
Write-downBalance at 1 January (96) (265) (265)Reversal/(write-down), net 19 132 160 Foreign currency translation (2) 7 9 Closing balance (78) (126) (96)
Note 6
Long-term debt
An updated overview of the contractual payments on long-term debt is provided in the table below:
NOK millions Debentures Bank LoansCapital lease and other
In January, Yara repaid the USD 160 million drawing on the bank facility in the Belgian subsidiary Yara SA/NV. The facility expired in February 2013.
21YARA FIRST QUARTER 2013
Note 7
Dividend and share buy-back program
The Board of Directors proposed a dividend for 2012 of NOK 13 per share. If approved by the Annual General Meeting in May 2013, the total dividend payment will be NOK 3,647 million based on current outstanding shares.
In May 2012, the Annual General Meeting authorized the Board of Direc-tors to acquire up to 5% own shares (14,210,363 shares) with a nominal value of up to NOK 24,157,617 in the equity market and from the Norwe-gian State. Within this frame, the Company has acquired 3,640,000 shares with a total nominal value of NOK 6,188,000. The Board has proposed to the Annual General Meeting in May 2013, that these shares shall be cancelled by reduction of the Company’s share capital. The Norwegian State has committed itself to participate on a pro-rata basis in the capital reduction. This means that the Norwegian State’s ownership interest of 36.21% remains unchanged. Total remuneration for the buy-back and re-demption of the Norwegian State’s shares amounts to NOK 1,495 million.
Yara has not purchased own shares during first quarter 2013.
The Board has proposed to the Annual General Meeting in May 2013 that the existing buy-back program is replaced by a new program, au-thorizing the Board to acquire up to 5% of Yara’s shares before the next Annual General Meeting. Shares may be purchased within a price range of NOK 10 to NOK 1,000. The shares may either be used for cancellation or as payment in business transactions. The company will enter into a new agreement with the Norwegian State to redeem shares on a pro-rata basis so that the State’s ownership is unchanged in the event of a cancel-lation of the shares bought back.
Note 8
Investigation
In April 2011, Yara decided to initiate an external investigation re-lated to the establishment of Libyan Norwegian Fertilizer Company (Lifeco), and in parallel notified The Norwegian National Authority for Investigation and Prosecution of Economic and Environmental Crime (ØKOKRIM) of the possibility that irregular payments may have oc-curred in 2007 in connection with the negotiations preced ing the com-pany’s investment in Libya. Yara subsequently widened its investigation to comprise other issues, and has communicated likely irregularities related to processes in India and Switzerland. In May 2011, ØKOKRIM charged the company with violation of the Norwegian penal code para-graph 276a, cf paragraph 276b. In June 2012, Yara published the main findings of the external investigation which confirmed previously com-municated areas of concern:
• Unacceptableoffersofpaymenttoaconsultantaredocumented,re-lated to the establishment of Libyan Norwegian Fertilizer Company (Lifeco). The completion of the actual payment is not documented.
• AnunacceptablepaymentofUSD1millionin2007toaconsultantin India is documented, related to negotiations with Krishak Bharati Cooperative Limited (Kribhco).
• AnumberofpaymentsoverseveralyearsfromthecompanyBalder-ton in Switzerland have been uncovered, totaling approximately USD 15 million. The payments have been made to persons employed by or associated with companies which are suppliers to Yara or Balderton. Payments from Balderton which have no commercial basis have also been uncovered.
At this stage, it is not possible to estimate the outcome of ØKOKRIM’S investigations and potential financial effects for Yara.
22 YARA FIRST QUARTER 2013
Note 9
Implementation of revised IAS 19 Employee Benefits
Effective 1 January 2013 Yara adopted the revised IAS 19 Employee Benefits with retrospective application.
Yara’s management is no longer estimating the expected return on plan assets. Instead, Yara applies the discount rate to calculate the net interest expense on the net pension obligation, effectively increasing net financial expenses. Administration expenses not directly related to the management of plan assets are now classified as operating expenses. Further, unvested past service cost is recognized immediately. 2012 restatement also includes effects of implementation on specific pension plans, including risk sharing implications of mandatory employee contribution and the valuation of one pension plan obligation no longer taking into account future plan administration costs.
The revised accounting standard requires retrospective application and the financial statements for 2012 have been restated as follows:
1Q 2012
NOK millionsAs previously
reportedEffect of
restatement1Q 2012 Restated
Condensed consolidated interim statement of incomePayroll and related costs (1,174) (2) (1,176)Operating income 3,088 (2) 3,087Interest expense and other financial items (197) (15) (212)Income before tax 3,739 (17) 3,722 Income tax expense (733) 5 (729)Net income 3,006 (12) 2,994
Condensed consolidated interim statement of comprehensive incomeExchange differences on translation of foreign operations (1,530) - (1,530)Remeasurements of the net defined benefit pension liability - 13 13 Total other comprehensive income, net of tax (1,905) 13 (1,892)
Condensed consolidated statement of incomePayroll and related costs (5,052) (7) (5,059)Operating income 11,166 (7) 11,159Interest expense and other financial items (880) (60) (941)Income before tax 13,251 (68) 13,183 Income tax expense (2,600) 18 (2,582)Net income 10,650 (50) 10,601
Condensed consolidated interim statement of comprehensive incomeExchange differences on translation of foreign operations (2,957) (3) (2,960)Remeasurements of the net defined benefit pension liability (550) 51 (500)Total other comprehensive income, net of tax (3,864) 48 (3,816)
Revenue and other income 3,676 3,692 3,559 3,637 3,689 Operating income 477 378 444 566 536 EBITDA 734 632 701 845 748 Net income after non-controlling interests 401 395 445 475 522 Earnings per share (USD) 1.43 1.41 1.58 1.67 1.83
1) USD numbers are calculated monthly based on average NOK/USD per month.2) 2012 figures have been restated, see note 9 for more information.
Quarterly historical information
Yara International ASABygdøy allé 2P. O. Box 2464, SolliNO–0202 OsloNorwayTel: +47 24 15 70 00Fax: +47 24 15 70 01
www.yara.com
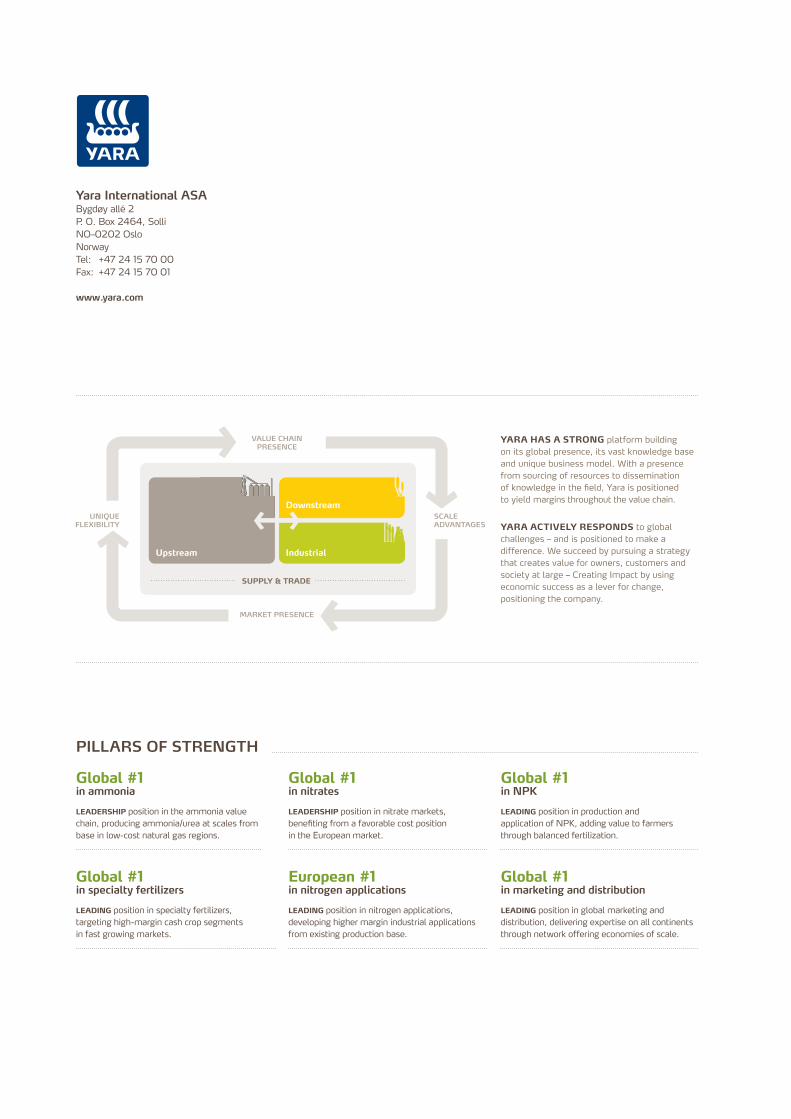
Global #1 in ammonia
LEADERSHIP position in the ammonia value chain, producing ammonia/urea at scales from base in low-cost natural gas regions.
Global #1 in nitrates
LEADERSHIP position in nitrate markets, benefiting from a favorable cost position in the European market.
Global #1 in NPK
LEADING position in production and application of NPK, adding value to farmers through balanced fertilization.
Global #1 in specialty fertilizers
LEADING position in specialty fertilizers, targeting high-margin cash crop segments in fast growing markets.
European #1 in nitrogen applications
LEADING position in nitrogen applications, developing higher margin industrial applications from existing production base.
Global #1 in marketing and distribution
LEADING position in global marketing and distribution, delivering expertise on all continents through network offering economies of scale.
PILLARS OF STRENGTH
VALUE CHAIN PRESENCE
MARKET PRESENCE
UNIQUEFLEXIBILITY
SCALEADVANTAGES
Upstream Downstream
Industrial
SUPPLY & TRADE
Upstream
Downstream
Industrial
SUPPLY & TRADE
MARKET PRESENCE
VALUE CHAINPRESENCE
UNIQUEFLEXIBILITY
SCALEADVANTAGES
YARA HAS A STRONG platform building on its global presence, its vast knowledge base and unique business model. With a presence from sourcing of resources to dissemination of knowledge in the field, Yara is positioned to yield margins throughout the value chain.
YARA ACTIVELY RESPONDS to global challenges – and is positioned to make a difference. We succeed by pursuing a strategy that creates value for owners, customers and society at large – Creating Impact by using economic success as a lever for change, positioning the company.