1 Ericsson | First Quarter Report 2017 First quarter 2017 Stockholm, April 25, 2017 FIRST QUARTER HIGHLIGHTS Read more (page) > Reported sales decreased by -11% YoY. Sales, adjusted for currency, decreased -16% YoY partly due to lower IPR licensing revenues which amounted to SEK 2.0 (3.8) b. 3 > Provisions and adjustments related to certain customer contracts of SEK -8.4 b., asset write-downs of SEK -3.3 b. and restructuring charges of SEK -1.7 b. were made in the quarter, in line with the announcement on March 28, 2017. 2 > Gross margin was 13.9%. Adjusted 1) gross margin declined to 30.5% (33.9%) mainly due to lower IPR licensing revenues. 4 > Operating income was SEK -12.3 b. Adjusted 1) operating income declined to SEK 1.1 (4.1) b. due to lower sales and lower gross margin. 4 > Networks operating margin was -2%. Networks adjusted 1) operating margin was solid at 12%, despite lower sales including reduced IPR licensing revenues. 2 > IT & Cloud operating income was SEK -9.0 b. Adjusted 1) operating income for IT & Cloud showed a significant negative development YoY with increased losses. Actions have been initiated to improve performance. 2 > Media operating income was SEK -2.8 b. Adjusted 1) operating income was significantly reduced YoY. Strategic opportunities are being explored. 2 > Cash flow from operating activities was SEK -1.5 (-2.4) b. 9 1) Restructuring, write-down of assets as well as provisions and adjustments related to certain customer projects had a significant negative impact on the reported Q1 2017 result. Numbers excluding these items are referred to in the text as “adjusted”, please see page 3 for reconciliation. SEK b. Q1 2017 Q1 2016 YoY change Q4 2016 QoQ change Net sales 46.4 52.2 -11% 65.2 -29% Sales growth adj. for comparable units and currency - - -16% - -29% Gross margin 13.9% 33.3% - 26.1% - Gross margin excluding restructuring charges and adjusted for items affecting comparability in Q1 2017 30.5% 33.9% - 29.4% - Operating income -12.3 3.5 - -0.3 - Operating income excluding restructuring charges and adjusted for items affecting comparability in Q1 2017 1.1 4.1 -73% 4.4 -75% Operating margin -26.6% 6.7% - -0.4% - Operating margin excluding restructuring charges and adjusted for items affecting comparability in Q1 2017 2.3% 7.9% - 6.7% - Net income -10.9 2.1 - -1.6 - EPS diluted, SEK -3.29 0.60 - -0.48 - EPS (Non-IFRS), SEK 2) -2.42 0.87 - 0.62 - Cash flow from operating activities -1.5 -2.4 -35% 19.4 -108% Net cash, end of period 28.3 36.5 -22% 31.2 -9% 2) EPS diluted, excl. amortizations and write-downs of acquired intangible assets, and excluding restructuring charges. Non-IFRS financial measures are reconciled to the most directly reconcilable line items in the financial statements at the end of this report.
Transcript
1 Ericsson | First Quarter Report 2017
First quarter 2017
Stockholm, April 25, 2017
FIRST QUARTER HIGHLIGHTSRead more
(page)
> Reported sales decreased by -11% YoY. Sales, adjusted for currency, decreased -16% YoY partly due to lower IPR licensing revenues which amounted to SEK 2.0 (3.8) b. 3
> Provisions and adjustments related to certain customer contracts of SEK -8.4 b., asset write-downs of SEK -3.3 b. and restructuring charges of SEK -1.7 b. were made in the quarter, in line with the announcement on March 28, 2017. 2
> Gross margin was 13.9%. Adjusted1) gross margin declined to 30.5% (33.9%) mainly due to lower IPR licensing revenues. 4
> Operating income was SEK -12.3 b. Adjusted1) operating income declined to SEK 1.1 (4.1) b. due to lower sales and lower gross margin. 4
> Networks operating margin was -2%. Networks adjusted1) operating margin was solid at 12%, despite lower sales including reduced IPR licensing revenues. 2
> IT & Cloud operating income was SEK -9.0 b. Adjusted1) operating income for IT & Cloud showed a significant negative development YoY with increased losses. Actions have been initiated to improve performance. 2
> Media operating income was SEK -2.8 b. Adjusted1) operating income was significantly reduced YoY. Strategic opportunities are being explored. 2
> Cash flow from operating activities was SEK -1.5 (-2.4) b. 9
1) Restructuring, write-down of assets as well as provisions and adjustments related to certain customer projects had a significant negative impact on the reported Q1 2017
result. Numbers excluding these items are referred to in the text as “adjusted”, please see page 3 for reconciliation.
SEK b.Q1
2017Q1
2016YoY
changeQ4
2016QoQ
change
Net sales 46.4 52.2 -11% 65.2 -29%
Sales growth adj. for comparable units and currency - - -16% - -29%
Gross margin 13.9% 33.3% - 26.1% -
Gross margin excluding restructuring charges and adjusted for items affecting comparability in Q1 2017 30.5% 33.9% - 29.4% -
Operating income -12.3 3.5 - -0.3 -
Operating income excluding restructuring charges and adjusted for items affecting comparability in Q1 2017 1.1 4.1 -73% 4.4 -75%
Operating margin -26.6% 6.7% - -0.4% -
Operating margin excluding restructuring charges and adjusted for items affecting comparability in Q1 2017 2.3% 7.9% - 6.7% -
Net income -10.9 2.1 - -1.6 -
EPS diluted, SEK -3.29 0.60 - -0.48 -
EPS (Non-IFRS), SEK2) -2.42 0.87 - 0.62 -
Cash flow from operating activities -1.5 -2.4 -35% 19.4 -108%
Net cash, end of period 28.3 36.5 -22% 31.2 -9%2) EPS diluted, excl. amortizations and write-downs of acquired intangible assets, and excluding restructuring charges.
Non-IFRS financial measures are reconciled to the most directly reconcilable line items in the financial statements at the end of this report.
2 Ericsson | First Quarter Report 2017
CEO Comments
Our performance in the first quarter continued to be unsatisfactory. Segment Networks delivered a solid result despite lower sales, while losses in segments IT & Cloud and Media increased significantly. In the quarter a more focused business strategy and a new Executive Team were announced. The immediate pri-ority is to improve profitability while also taking action to revitalize technology and market leadership.
Reported sales declined by -11%. Operating income was SEK -12.3 b., after provisions, write-downs and restructuring charges of SEK -13.4 b. Excluding these items the operating income amounted to SEK 1.1 b.
Despite lower sales, Networks delivered a solid result. Sales declined YoY due to lower investment levels in certain markets, lower IPR licensing revenues and the renewed managed ser-vices contract with reduced scope in North America. Networks adjusted1) operating margin improved sequentially and was supported by an improved business mix and a more com-petitive portfolio. The new Ericsson Radio System platform contributed to improving profitability and stabilizing the mar-ket share position, after several years of decline. The concerning developments in IT & Cloud continued with significantly increased losses. IT & Cloud remains a strate-gic area for Ericsson as our customers will digitalize their operations and invest in a future network architecture based on software-defined logic. However, our performance in this area is not acceptable and the new management team is ini-tiating actions to turn the business around. Actions include accelerating the introduction of the new products, stream-lining the services organization and tightening the contract scoping. We will continue to sell complete solutions in tele-com core, OSS and BSS, including hardware, software and services. However, we are seeking alternatives for our IT cloud infrastructure hardware business to gain necessary scale to ensure that we can offer competitive solutions to our customers. Tangible improvements in profitability are expected during 2018.
The accelerated losses in Media were caused by a faster than anticipated decline in legacy product sales, not offset by growth in the new portfolio. While continuing to develop our media solutions we are exploring strategic opportunities for Media to allow it to scale and succeed in the evolving media landscape.
Of the total adjustments1) of SEK -13.4 b., write-downs were SEK -3.3 b. and restructuring charges were SEK -1.7 b. Trig-gered by negative developments late in the quarter related to certain customer contracts, provisions and adjustments of SEK -8.4 b. were made of which SEK 5.8 b. is estimated to negatively affect cash flow over several years.
The provisions and adjustments of SEK -8.4 b. consist of the following items. Customer settlements and revaluation of customer discounts, due to lower projected customer vol-umes, reduced net sales by SEK -1.4 b. Operating expenses were impacted by SEK -1.5 b. due to reassessment of the
value of trade receivables. The remaining SEK -5.5 b. is pro-visions for additional project costs, mainly related to certain transformation projects in IT & Cloud, which due to recent negative developments are not expected to be covered by future project revenues.
In light of the current market environment and company position we are taking a more prudent approach in assess-ing risk exposures. In this work we have identified certain large, complex transformation projects with challenging profitability and higher inherent risks, that we are focused on mitigating.
On March 28, 2017, we presented a more focused business strategy and a new Executive Team. The new strategy aims to revitalize technology and market leadership, improve group profitability and enable customer success.
The strategy builds on reallocating resources and investments to core portfolio areas, fully leveraging the potential of 5G, IoT and cloud. We will also refocus Managed Services and Network Roll-out to improve profitability. By addressing low-performing operations within Managed Services and optimizing the offering within Network Roll-out, full-year sales are expected to be nega-tively impacted by up to SEK 10 b. by 2019.
We are not satisfied with the cost structure of the company and the existing cost and efficiency program is not yielding sufficient results. Based on current profitability, we will intensify our efforts to reduce cost with focus on structural changes to generate lasting efficiency gains and increase cost competitiveness. Our target is to surpass previous ambitions. However, we need to increase investment in certain core areas to develop our product portfolio, which can temporarily increase cost levels.
The more focused business strategy is expected to result in a significantly improved profitability already in 2018. Beyond 2018, we believe that we can at least double the underlying 2016 oper-ating margin.
Börje EkholmPresident and CEO
Planning assumptions going forward • Industry trends and business mix in mobile broadband from
2016 are expected to prevail in 2017.• RAN equipment market in USD estimated to decline
by -2% to -6% in 2017.• The earlier communicated renewed managed services contract
with reduced scope in North America will impact sales negatively YoY in Q2 and Q3 2017.
• Addressing low-performing operations in Managed Services and optimizing the offering within Network Rollout are expected to reduce full-year sales by up to SEK 10 b. by 2019.
• The baseline for current IPR licensing contract portfolio is approximately SEK 7 b. on an annual basis.
• The restructuring charges for 2017 are estimated to be SEK 6-8 b.
1) Restructuring, write-down of assets as well as provisions and adjustments related to cer-
tain customer projects had a significant negative impact on the reported Q1 2017 result.
Numbers excluding these items are referred to in the text as “adjusted”, please see page 3
for reconciliation.
3 Ericsson | First Quarter Report 2017
Financial highlights
Restructuring, write-down of assets as well as provisions and adjust-ments related to certain customer projects had a significant negative impact on the reported Q1 2017 result. Numbers excluding these items are referred to in the text as “adjusted”.
Net sales Sales as reported decreased by -11% YoY. Adjusted sales declined by -8% YoY to SEK 47.8 (52.2) b. Sales, adjusted for comparable units and currency, decreased -16% YoY. The mobile broadband market remained weak in the quarter with continued low investment levels, particularly in Latin America, Africa and parts of Europe.
Sales in North America declined YoY mainly due to the earlier communicated renewed managed services contract with reduced scope effective from Q4 2016. Sales in North East Asia were flat YoY supported by increased Networks sales in Japan, partly offset by lower IT & Cloud sales in mainland China. The transition from 3G to 4G continued and generated sales growth in South East Asia.
As anticipated, sales declined sequentially with more than nor-mal seasonality following hardware deliveries made in Q4 2016, on customer request, previously planned for Q1 2017. Sales declined by -29% QoQ.
Total sales for Managed Services, as defined in 2016, including Broadcast Services, were SEK 6.2 (7.4) b. The decline mainly refers to the earlier communicated re-scoped managed ser-vices contract in North America. The definition of Managed Ser-vices will be adjusted in 2018, at latest, to mirror the new organi-zation.
IPR licensing revenuesIPR licensing revenues declined YoY to SEK 2.0 (3.8) b. following certain one-time items in same period last year. IPR licensing revenues were flat QoQ.
Asset write-downs, provisions and adjustments As announced on March 28, the company has decided to focus its business strategy and explore strategic opportunities for the Media as well as the Cloud infrastructure hardware businesses. As a consequence write-down of assets amounting to SEK -3.3 b., of which SEK -1.5 b. in IT & Cloud, SEK -1.7 b. in Media and SEK -0.1 b. in Networks, were made in the quarter.
As also announced on March 28, provisions and adjustments triggered by negative developments late in the quarter, related to certain large customer projects were required. These provi-sions and adjustments amounted to SEK -8.4 b. Customer settlements and revaluation of customer discounts, due to lower
SEK b.Q1
2017Q1
2016YoY
change Q4
2016QoQ
change
Net sales 46.4 52.2 -11% 65.2 -29%
Of which Networks 34.9 39.9 -13% 47.8 -27%
Of which IT & Cloud 9.5 9.8 -3% 14.9 -36%
Of which Media 2.0 2.4 -20% 2.5 -23%
Gross income 6.4 17.4 -63% 17.0 -62%
Gross margin (%) 13.9% 33.3% - 26.1% -
Research and development expenses -9.1 -7.5 21% -8.9 2%
Selling and administrative expenses -9.9 -6.7 47% -8.8 12%
Other operating income and expenses 0.1 0.3 -48% 0.4 -61%
Operating income -12.3 3.5 - -0.3 -
Operating margin -26.6% 6.7% - -0.4% -
for Networks -2% 14% - 5% -
for IT & Cloud -94% -20% - -12% -
for Media -143% -13% - -33% -
Financial net -0.4 -0.5 -7% -0.7 -37%
Taxes 1.9 -0.9 - -0.6 -
Net income -10.9 2.1 - -1.6 -
Restructuring charges -1.7 -0.6 176% -4.6 -63%
Q1 2017 ADJUSTED FOR RESTRUCTURING CHARGES AND ITEMS AFFECTING COMPARABILITY
SEK b. Q1 2017 reported
Restructuring charges
Asset write-downs
Provisions and customer proj-
ect adjustmentsQ1 2017 adjusted
Q1 2016 excl. restructuring
charges
Q4 2016 excl. restructuring
charges
Net sales 46.4 - - 1.4 47.8 52.2 65.2
Gross income 6.4 1.5 - 6.7 14.6 17.7 19.2
Gross margin (%) 13.9% - - - 30.5% 33.9% 29.4%
Research and development expenses -9.1 0.2 1.9 0.2 -6.7 -7.2 -7.4
Other operating income and expenses 0.1 - - - 0.1 0.3 0.4
Operating income -12.3 1.7 3.3 8.4 1.1 4.1 4.4
for Networks -0.5 1.4 0.1 3.3 4.3 6.2 4.8
for IT & Cloud -9.0 0.2 1.5 5.0 -2.2 -1.8 0.0
for Media -2.8 0.1 1.7 - -1.0 -0.3 -0.4
Operating margin -26.6% - - - 2.3% 7.9% 6.7%
4 Ericsson | First Quarter Report 2017
projected customer volumes, reduced net sales by SEK -1.4 b. Operating expenses were impacted by SEK -1.5 b. due to reas-sessment of the value of trade receivables. The remaining SEK -5.5 b. is provisions for additional project costs, mainly related to certain transformation projects in IT & Cloud, which due to recent negative developments are not expected to be covered by future project revenues.
Gross marginGross margin declined to 13.9% (33.3%) and from 26.1% QoQ, mainly due to the additional provisions and adjustments.
The adjusted gross margin declined to 30.5% (33.9%) following lower IPR licensing revenues and lower gross margins in IT & Cloud and Media. Sequentially the adjusted gross margin improved from 29.4% driven by higher margins in Networks and a higher share of IPR licensing revenues, partly offset by reduced gross margins in IT & Cloud. Operating expensesOperating expenses increased to SEK 18.9 (14.2) b. and sequentially from SEK 17.7 b., due to the write-down of assets as well as additional provisions and adjustments. Adjusted R&D expenses and selling and administrative expenses, i.e operating expenses, declined to SEK 13.7 (13.9) b. and from SEK 15.2 b. in Q4 2016. The QoQ reduc-tion was mainly due to seasonality.
Other operating income and expensesOther operating income and expenses declined YoY and QoQ. The revaluation and realization effects of currency hedge con-tracts were SEK 0.0 (0.2) b. Such effects were SEK -0.4 b. in Q4, 2016.
As of Q1 2017, the funding of foreign exchange forecast hedging will be managed through foreign exchange loans (USD) instead of foreign exchange derivatives. Therefore, any revaluation and realization effects will be included in financial expenses instead of in other operating income and expenses.
The hedge balance is in USD. The SEK strengthened against the USD between Dec 31, 2016 (SEK/USD rate 9.06) and March 31, 2017 (SEK/USD rate 8.93).
Restructuring chargesTotal restructuring charges were SEK -1.7 (-0.6) b. For full-year 2017, the restructuring charges are estimated to be SEK 6-8 b.
Operating incomeOperating income decreased to SEK -12.3 (3.5) b., mainly due to the additional provisions and adjustments, asset write-downs and increased restructuring charges. The adjusted operating income decreased to SEK 1.1 b. from SEK 4.1 b. This was mainly due to lower sales and lower gross margin.
Operating income decreased sequentially from SEK -0.3 b., mainly due to the additional provisions and adjustments as well as asset write-downs, partly offset by reduced restructuring charges. The adjusted operating income decreased to SEK 1.1 b. from SEK 4.4 b. due to lower sales, partly offset by increased gross margin and lower operating expenses.
Financial netFinancial net was flat YoY and improved QoQ as Q4 2016 was negatively impacted by depreciated local currencies in certain markets.
TaxesTaxes were positive in the quarter following the negative income.
Net income and EPS Net income and EPS diluted decreased YoY and QoQ, following the negative operating income. EPS diluted was SEK -3.29 (0.60) and EPS (Non-IFRS) was SEK -2.42 (0.87).
Employees The number of employees on March 31, 2017 was 110,898 com-pared with 111,464 on Dec 31, 2016. A majority of the head-count reductions was in Sweden. In addition, 1,600 employees in Sweden, who left the company on voluntary basis, are still included in the headcount numbers without impacting salary costs.
5 Ericsson | First Quarter Report 2017
Regional sales
North AmericaNorth America sales declined, mainly due to the earlier commu-nicated reduced scope of a renewed managed services con-tract. Mobile broadband infrastructure sales were stable. IT & Cloud sales increased, driven by digital transformation projects reaching milestones in the quarter.
Latin AmericaSales declined as mobile broadband investments continue to be impacted by the macroeconomic environment and declining sales in Mexico.
Northern Europe and Central AsiaSales decreased, impacted by continued lower investments in mobile broadband infrastructure and last year’s project comple-tion in Russia.
Western and Central EuropeSales declined as operators continued to reduce investments in mobile broadband infrastructure in order to focus on cash flow as well as shifting investments into fiber deployments.
MediterraneanSales increased slightly with higher investments in mobile broadband infrastructure while the weak development of related capacity business continued. The managed services business continued to develop favorably.
Middle EastSales declined slightly in a continued challenging macroeco-nomic environment. Networks product sales declined as opera-tors remained cautious on mobile broadband capacity invest-ments while the networks services business grew.
Sub-Saharan AfricaSales declined due to a continued challenging macroeconomic environment in key markets following political uncertainty and on the back of low commodity prices impacting demand.
IndiaFollowing a fast pace of 4G deployments in Q4 2016, driven by the spectrum auctions late 2016, sales were down impacted by consolidations and tariff competition between operators.
North East AsiaSales remained stable. Sales in Mainland China declined due to continued reduced investments by one customer. Sales in Japan and Korea increased, driven by network modernizations and financial year-end sales in Japan.
South East Asia and OceaniaSales growth was driven primarily by mobile broadband invest-ments in Vietnam. Networks services developed favorably, mainly driven by managed services and network optimization.
OtherIPR licensing revenues amounted to SEK 2.0 (3.8) b. IPR licens-ing revenues in Q1 2016 were positively impacted by one-off items.
First quarter 2017 Change
SEK b. NetworksIT &
Cloud Media Total YoY QoQ
North America 9.2 2.3 0.3 11.8 -10% -20%
Latin America 2.0 0.8 0.0 2.9 -29% -42%
Northern Europe and Central Asia 1.2 0.4 0.1 1.7 -24% -38%
Western and Central Europe 2.5 0.7 0.4 3.6 -17% -21%
Mediterranean 2.8 1.4 0.2 4.4 1% -35%
Middle East 2.4 1.0 0.1 3.5 -3% -45%
Sub-Saharan Africa 1.4 0.5 0.0 1.9 -9% -29%
India 1.8 0.6 0.0 2.4 -10% -20%
North East Asia 4.6 0.9 0.0 5.6 0% -42%
South East Asia and Oceania 4.8 0.7 0.1 5.6 7% -16%
Other 1) 2.0 0.2 0.6 2.9 -40% 4%
Total 34.9 9.5 2.0 46.4 -11% -29%
1) Region “Other” includes licensing revenues, power modules, mobile broadband modules, Ericsson-LG Enterprise and other businesses.
6 Ericsson | First Quarter Report 2017
Segment results
Restructuring, write-down of assets as well as provisions and adjust-ments related to certain customer projects had a significant negative impact on the reported Q1 2017 result. Numbers excluding these items are referred to in the text as “adjusted”.
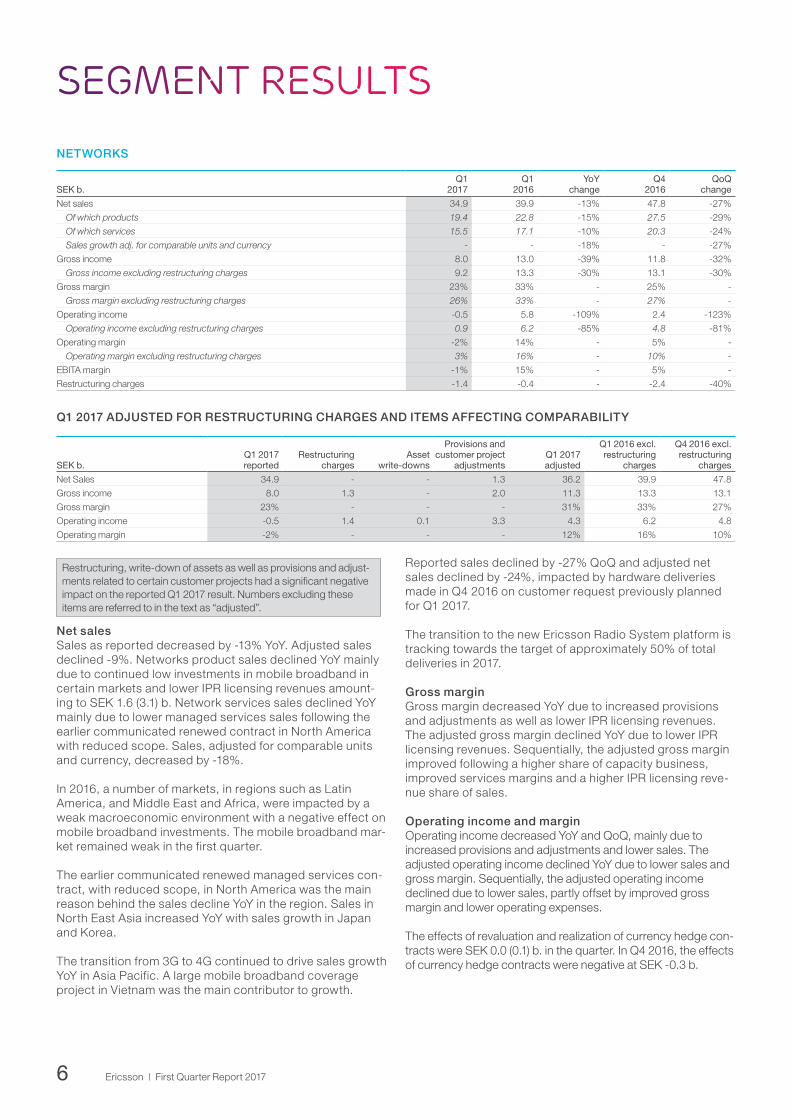
Net salesSales as reported decreased by -13% YoY. Adjusted sales declined -9%. Networks product sales declined YoY mainly due to continued low investments in mobile broadband in certain markets and lower IPR licensing revenues amount-ing to SEK 1.6 (3.1) b. Network services sales declined YoY mainly due to lower managed services sales following the earlier communicated renewed contract in North America with reduced scope. Sales, adjusted for comparable units and currency, decreased by -18%.
In 2016, a number of markets, in regions such as Latin America, and Middle East and Africa, were impacted by a weak macroeconomic environment with a negative effect on mobile broadband investments. The mobile broadband mar-ket remained weak in the first quarter.
The earlier communicated renewed managed services con-tract, with reduced scope, in North America was the main reason behind the sales decline YoY in the region. Sales in North East Asia increased YoY with sales growth in Japan and Korea.
The transition from 3G to 4G continued to drive sales growth YoY in Asia Pacific. A large mobile broadband coverage project in Vietnam was the main contributor to growth.
Reported sales declined by -27% QoQ and adjusted net sales declined by -24%, impacted by hardware deliveries made in Q4 2016 on customer request previously planned for Q1 2017.
The transition to the new Ericsson Radio System platform is tracking towards the target of approximately 50% of total deliveries in 2017.
Gross marginGross margin decreased YoY due to increased provisions and adjustments as well as lower IPR licensing revenues. The adjusted gross margin declined YoY due to lower IPR licensing revenues. Sequentially, the adjusted gross margin improved following a higher share of capacity business, improved services margins and a higher IPR licensing reve-nue share of sales.
Operating income and margin Operating income decreased YoY and QoQ, mainly due to increased provisions and adjustments and lower sales. The adjusted operating income declined YoY due to lower sales and gross margin. Sequentially, the adjusted operating income declined due to lower sales, partly offset by improved gross margin and lower operating expenses.
The effects of revaluation and realization of currency hedge con-tracts were SEK 0.0 (0.1) b. in the quarter. In Q4 2016, the effects of currency hedge contracts were negative at SEK -0.3 b.
NETWORKS
SEK b.Q1
2017Q1
2016YoY
change Q4
2016QoQ
change
Net sales 34.9 39.9 -13% 47.8 -27%
Of which products 19.4 22.8 -15% 27.5 -29%
Of which services 15.5 17.1 -10% 20.3 -24%
Sales growth adj. for comparable units and currency - - -18% - -27%
Gross income 8.0 13.0 -39% 11.8 -32%
Gross income excluding restructuring charges 9.2 13.3 -30% 13.1 -30%
Q1 2017 ADJUSTED FOR RESTRUCTURING CHARGES AND ITEMS AFFECTING COMPARABILITY
SEK b. Q1 2017 reported
Restructuring charges
Asset write-downs
Provisions and customer project
adjustmentsQ1 2017 adjusted
Q1 2016 excl. restructuring
charges
Q4 2016 excl. restructuring
charges
Net Sales 34.9 - - 1.3 36.2 39.9 47.8
Gross income 8.0 1.3 - 2.0 11.3 13.3 13.1
Gross margin 23% - - - 31% 33% 27%
Operating income -0.5 1.4 0.1 3.3 4.3 6.2 4.8
Operating margin -2% - - - 12% 16% 10%
7 Ericsson | First Quarter Report 2017
Restructuring, write-down of assets as well as provisions and adjust-ments related to certain customer projects had a significant negative impact on the reported Q1 2017 result. Numbers excluding these items are referred to in the text as “adjusted”.
Net salesSales as reported declined by -3% YoY due to lower product sales while services sales increased. Sales of legacy portfo-lio products, in network infrastructure as well as in OSS & BSS, continued to decline and were not offset by growth in the new portfolio. To prepare for 5G, customers are digitaliz-ing Core and IT, leading to an increased demand for trans-formation services while the demand for legacy products is decreasing. The services share of sales has increased from 51% Q1 2016 to 57% Q1 2017. IPR and licensing revenues declined YoY to SEK 0.2 (0.4) b.
Sales adjusted for comparable units and currency decreased by -7% YoY.
Sales declined by -36% QoQ after a seasonally strong Q4. Sales in North East Asia and Europe declined more than normal seasonality following milestone completions in large projects in 2016.
Gross marginGross margin decreased YoY and QoQ mainly due to increased provisions and adjustments. Adjusted gross mar-gin declined YoY due to lower services margins, lower IPR licensing revenues and an increased services share of seg-ment sales. The services margin continues to be impacted by the ongoing large transformation projects and the service capability build-up to handle the introduction of new plat-forms. In addition, IT managed services margins are nega-tively impacted by projects in their initial transformation phase. IT & Cloud product margins were stable.
Adjusted gross margin declined QoQ due to reduced ser-vices margins in large transformation projects as well as in IT managed services projects in the initial transformation phase.
Operating income and marginOperating income decreased YoY and QoQ, mainly due to increased provisions, adjustments and write-downs.
Adjusted operating income declined YoY due to lower gross margin and lower sales. The decline was partly offset by reduced operating expenses.
Adjusted operating income declined QoQ due to lower sales and lower gross margins. The decline was partly offset by reduced operating expenses.
IT & CLOUD
SEK b.Q1
2017Q1
2016YoY
change Q4
2016QoQ
change
Net sales 9.5 9.8 -3% 14.9 -36%
Of which products 4.1 4.8 -14% 6.7 -39%
Of which services 5.4 5.1 8% 8.2 -34%
Sales growth adj. for comparable units and currency - - -7% - -35%
Gross income -2.1 3.3 -164% 4.7 -145%
Gross income excluding restructuring charges -1.9 3.4 -158% 5.3 -136%
Q1 2017 ADJUSTED FOR RESTRUCTURING CHARGES AND ITEMS AFFECTING COMPARABILITY
SEK b. Q1 2017 reported
Restructuring charges
Asset write-downs
Provisions and customer project
adjustmentsQ1 2017 adjusted
Q1 2016 excl. restructuring
charges
Q4 2016 excl. restructuring
charges
Net Sales 9.5 - - 0.1 9.6 9.8 14.9
Gross income -2.1 0.2 - 4.5 2.7 3.4 5.3
Gross margin -22% - - - 28% 34% 36%
Operating income -9.0 0.2 1.5 5.0 -2.2 -1.8 0.0
Operating margin -94% - - - -23% -18% 0%
8 Ericsson | First Quarter Report 2017
Restructuring, write-down of assets as well as provisions and adjust-ments related to certain customer projects had a significant negative impact on the reported Q1 2017 result. Numbers excluding these items are referred to in the text as “adjusted”.
Net salesSales declined YoY primarily due to lower sales of legacy prod-ucts and lower IPR licensing revenues. The transition to the next-generation MediaFirst platform is ongoing with contracts signed and ongoing customer trials, which have not yet trans-lated into sales. IPR licensing revenues were SEK 0.2 (0.4) b.
The iconectiv (number portability solutions) sales grew more than 20% YoY. In the quarter, a minority investment in iconectiv by Francisco Partners, subject to regulatory approval, was secured to accelerate value growth.
Sales adjusted for comparable units and currency decreased by -22% YoY.
Sales declined QoQ by -23% after a seasonally strong Q4.
Gross marginAdjusted gross margin declined YoY due to lower IPR licensing revenues, a changed business mix and costs related to under-absorption of services resources.
Adjusted gross margin increased QoQ as Q4 2016 included cer-tain additional costs of SEK -0.2 b. The margin increase was partly offset by costs related to under-absorption of services resources.
Operating income and marginOperating income decreased YoY and QoQ, mainly due to asset write-downs.
Adjusted operating income declined YoY due to lower gross margin and lower sales. Operating expenses for legacy prod-ucts have been significantly reduced, however the reduction was offset by increased investments in new areas including the iconectiv business.
Adjusted operating income declined QoQ due to higher expenses and lower sales, partly offset by an improved gross margin.
MEDIA
SEK b.Q1
2017Q1
2016YoY
change Q4
2016QoQ
change
Net sales 2.0 2.4 -20% 2.5 -23%
Sales growth adj. for comparable units and currency - - -22% - -23%
Gross income 0.6 1.1 -49% 0.6 -1%
Gross income excluding restructuring charges 0.6 1.1 -46% 0.7 -13%
Q1 2017 ADJUSTED FOR RESTRUCTURING CHARGES AND ITEMS AFFECTING COMPARABILITY
SEK b. Q1 2017 reported
Restructuring charges
Asset write-downs
Provisions and customer project
adjustmentsQ1 2017 adjusted
Q1 2016 excl. restructuring
charges
Q4 2016 excl. restructuring
charges
Sales 2.0 - - - 2.0 2.4 2.5
Gross income 0.6 0.0 - - 0.6 1.1 0.7
Gross margin 28% - - - 31% 45% 27%
Operating income -2.8 0.1 1.7 - -1.0 -0.3 -0.4
Operating margin -143% - - - -51% -12% -17%
9 Ericsson | First Quarter Report 2017
CASH flow
Operating activitiesCash flow from operating activities was SEK -1.5 b. in the quar-ter, due to the negative net income. However, this was partly off-set by changes in operating assets of SEK 7.7 b. supported by lower trade receivables. The reduction of trade receivables QoQ was an effect of lower sales. The cash flow effect from sale of trade receivables in the quarter was SEK 1.4 b. higher than in Q1 2016.
Inventory increased sequentially following high project activity and seasonally lower delivery volumes. Trade payables increased slightly QoQ.
Cash outlays related to restructuring charges were SEK -1.6 (-0.5) b. in the quarter.
Investing activitiesCash flow from investing activities was impacted by investments in property, plant and equipment of SEK -1.0 b. where invest-ments in the Global ICT centers continued to decrease. The cash flow effect from capitalized development expenses amounted to SEK -0.9 b. Investments of SEK 11.9 b. were made in interest-bearing securities following the launch of the new Euro bonds. Financing activitiesCash flow from financing activities was positively impacted by the launch of two Euro bonds in March, together amounting to EUR 1.0 b. No large acquisition was made in the quarter.
Net cash was SEK 28.3 b. at the end of the quarter.
SEK b.Q1
2017Q1
2016Q4
2016
Net income reconciled to cash -9.2 3.6 1.6
Changes in operating net assets 7.7 -6.0 17.9
Cash flow from operating activities -1.5 -2.4 19.4
Cash flow from investing activities -13.6 -1.0 -6.6
Cash flow from financing activities 10.9 0.1 -1.0
Net change in cash and cash equivalents -4.0 -4.3 12.6
Net cash decreased by SEK -2.9 b. in the quarter mainly as a result of a negative cash flow from operating activities and investments in property, plant and equipment as well as in prod-uct development. The net cash position was SEK 28.3 b.
Post-employment benefits were SEK 23.8 b., compared with SEK 23.7 b. on Dec 31, 2016.
The company launched one Euro denominated 500 million 4-year bond with a fixed coupon rate of 0.875% and one Euro denominated 500 million 7-year bond with a fixed coupon rate of 1.875% in the quarter. The bonds were issued under Ericsson’s Euro Medium Term Note Program (EMTN). The Euro bonds were invested in interest-bearing securities.
The EUR 0.5 b. term loan facility issued in Q4 2016 has been terminated.
The average maturity of long-term borrowings as of March 31, 2017, was 4.1 years, compared with 4.5 years 12 months earlier.
In the quarter Standard & Poor’s downgraded Ericsson’s long-term rating from BBB with negative outlook to BBB- with nega-tive outlook.
SEK b.Mar 31
2017Mar 31
2016Dec 31
2016
+ Cash and cash equivalents 33.0 35.9 37.0
+ Interest-bearing securities, current 13.5 25.1 13.3
Swedish Export Credit Corporation MTN Bond Nordic Investment Bank European Investment Bank Notes and Bonds
11 Ericsson | First Quarter Report 2017
Parent company
Income after financial items was SEK 0.0 (0.4) b. The decrease was mainly due to write-down and restructuring cost of excess premises.
At the end of the quarter, gross cash: cash, cash equivalents, short-term investments, and interest-bearing securities non-cur-rent amounted to SEK 51.3 (42.9) b.
In the quarter, a dividend of SEK 3.3 b. was recognized accord-ing to the decision by the Annual General Meeting on March 29, 2017. The dividend was paid out in the first week of April.
In accordance with the conditions of the long-term variable compensation program (LTV) for Ericsson employees, 3,851,054 shares from treasury stock were sold or distributed to employees in the first quarter. The holding of treasury stock on March 31, 2017, was 58,341,336 Class B shares.
12 Ericsson | First Quarter Report 2017
OTHER INFORMATION
Ericsson launched Euro corporate bondsOn February 24, 2017, Ericsson announced a successful launch of one Euro denominated 500 million 4-year bond with a fixed coupon rate of 0.875% and one Euro denominated 500 million 7-year bond with a fixed coupon rate of 1.875%. The bonds were issued under Ericsson’s Euro Medium Term Note Program (EMTN).
Ericsson reported restated financials for 2015 and 2016On March 10, 2017, Ericsson reported restated financials for 2015 and 2016, in accordance with the new segment reporting structure introduced in the Q1 report 2017.
Ericsson presented focused business strategy On March 28, 2017, Ericsson presented a focused business strategy to revitalize technology and market leadership, improve group profitability and enable customer success. The company announced that it will reallocate resources and increase invest-ments in the following core portfolio areas: networks, digital ser-vices (OSS, BSS and telecom core) and Internet of Things (IoT). In addition, the company will implement a refocused strategy for Managed Services to improve profitability and also explore stra-tegic opportunities for the Media and Cloud infrastructure hard-ware businesses. The refocused strategy will have the following financial consequences in the short term: write down of assets to be made in Q1, 2017, with an estimated impact on operating income of SEK 3-4 b, restructuring charges estimated to approximately SEK 6-8 b. for 2017, of which approximately SEK 2 b. in Q1. Separately, the company announced that it will make provi-sions of an estimated SEK 7-9 b. in Q1, triggered by recent negative developments related to certain large customer projects.
Ericsson simplified organizational structure and named Executive Team On March 28, 2017, Ericsson announced that it would simplify its organizational structure by replacing the Executive Leader-ship Team and the Global Leadership Team by a single Execu-tive Team. In addition, the geographical setup with ten regions will become five market areas, and the business areas are re-defined and reduced to three. Effective April 1, 2017, Erics-son’s Executive Team members are: President and CEO – Börje Ekholm, Business Area Networks – Fredrik Jejdling,Business Area Managed Services – Peter Laurin, Business Area Digital Services – Ulf Ewaldsson,Market Area North America – Rima Qureshi, Market Area Europe & Latin America – Arun Bansal, Market Area Middle East & Africa – Rafiah Ibrahim, Market Area North East Asia – Chris Houghton, South East Asia, Oceania & India – Nunzio Mirtillo, Technology & Emerging Business – Niklas Heuveldop, Finance & Common Functions – Carl Mellander, Human Resources – MajBritt Arfert, Marketing & Communications - Helena Norrman, Sustainability & Corporate Responsibility - Elaine Weidman Grunewald, Legal Affairs – Nina Macpherson,
Advisor to the CEO – Jan Frykhammar, Advisor to the CEO – Magnus Mandersson.Per Borgklint, Anders Lindblad, Jean-Philippe Poirault and Charlotta Sund leave the Executive Leadership Team effective April 1, 2017.
Resolutions at the AGMOn March 29, 2017, Ericsson held its AGM in Kista, Stockholm. The proposed dividend of SEK 1.00 per share was approved by the AGM.In accordance with the proposal of the Nomination Committee, Leif Johansson was re-elected Chairman of the Board of Direc-tors.Nora Denzel, Börje Ekholm, Kristin Skogen Lund, Kristin S. Rinne, Sukhinder Singh Cassidy, Helena Stjernholm and Jacob Wallenberg were re-elected to the Board. Jon Fredrik Baksaas, Jan Carlson and Eric A. Elzvik were elected new Board mem-bers. Ulf J. Johansson left the Board.
In accordance with the Board of Directors’ proposal, the AGM resolved to approve the Guidelines for remuneration to Group Management and the implementation of a Long-Term Variable Compensation Program 2017 for the Executive Team.
The rating for Ericsson was downgraded to BBB- by Standard & Poor’sOn March 30, 2017, Standard & Poor’s announced that they had downgraded the senior unsecured debt ratings to BBB- with negative outlook from BBB with negative outlook.
Patent infringement lawsuitsIn 2012 and 2013, Intellectual Ventures (“IV”) filed patent infringe-ment lawsuits in the United States District Court for the District of Delaware accusing a number of Ericsson’s U.S. customers of infringing 16 U.S. patents, seeking an injunction and monetary damages. The first of these cases is set to go to trial in January 2018. IV subsequently filed another wave of lawsuits in the Dis-trict of Delaware accusing a number of Ericsson’s U.S. custom-ers of infringing 12 U.S. patents, seeking monetary damages. The first of these cases is set to go to trial in July 2017. The claims and scope of these lawsuits have recently become more well defined.
13 Ericsson | First Quarter Report 2017
RISK FACTORS
Ericsson’s operational and financial risk factors and uncertain-ties are described in our Annual Report 2016.
Risk factors and uncertainties in focus short term for the Parent Company and the Ericsson Group include, but are not limited to: > Potential negative effects on operators’ willingness to invest
in network development due to uncertainty in the financial markets and a weak economic business environment, or reduced consumer telecom spending, or increased pressure on us to provide financing, or delayed auctions of spectrums;
> Uncertainty regarding the financial stability of suppliers, for example due to lack of financing;
> Effects on gross margins and/or working capital of the busi-ness mix in the Networks segment between capacity sales and new coverage build-outs;
> Effects on gross margins of the business mix in the Networks and IT & Cloud segments including new network build-outs and new managed services or digital transformation deals with initial transition costs;
> Effects of the ongoing industry consolidation among our cus-tomers as well as between our largest competitors, e.g. with postponed investments and intensified price competition as a consequence;
> New and ongoing partnerships which may not be successful and expose us to future costs;
> Changes in foreign exchange rates, in particular USD; > Political unrest and uncertainty in certain markets; > Effects on production and sales from restrictions with respect
to timely and adequate supply of materials, components and production capacity and other vital services on competitive terms;
> No guarantees that strategy execution, specific restructuring or cost-savings initiatives, profitability restoring efforts and/or organizational changes will be sufficient, successful or exe-cuted in time to deliver any improvements in earnings;
> Cyber security incidents, which may have a material negative impact.
Ericsson stringently monitors the compliance with all relevant trade regulations and trade embargos applicable to dealings with customers operating in countries where there are trade restrictions or trade restrictions are discussed. Ericsson oper-ates globally in accordance with Group policies and directives for business ethics and conduct and has a dedicated anti- corruption program. However, in some of the countries where the company operates, corruption risks can be high and compli-ance failure could have a material adverse impact on our busi-ness, financial condition and brand.
Stockholm, April 25, 2017
Telefonaktiebolaget LM Ericsson (publ)
Börje Ekholm, President and CEO
Org. Nr 556016-0680
This report has not been reviewed by Telefonaktiebolaget LMEricsson’s auditors.
Date for next report: July 18, 2017
14 Ericsson | First Quarter Report 2017
EDITOR’S NOTE
Ericsson invites media, investors and analysts to a con ference call on April 25, 2017; one starts at 09.00 (CET) and the other at 14.00 (CET).
Live audio webcasts of the conference calls as well as support-ing slides will be available at: www.ericsson.com/press and www.ericsson.com/investors
Replay of the conference calls will be available approximately one hour after each call has ended and will remain available until May 2, 2017.
For further information, please contact:Helena Norrman, Senior Vice President, Chief Marketing and Communications OfficerPhone: +46 10 719 34 72E-mail: [email protected] or [email protected]
All statements made or incorporated by reference in this release, other than statements or characterizations of historical facts, are forward-looking statements. These forward-looking statements are based on our current expectations, estimates and projec-tions about our industry, management’s beliefs and certain assumptions made by us. Forward-looking statements can often be identified by words such as “anticipates”, “expects”, “intends”, “plans”, “predicts”, “believes”, “seeks”, “estimates”, “may”, “will”, “should”, “would”, “potential”, “continue”, and varia-tions or negatives of these words, and include, among others, statements regarding: (i) strategies, outlook and growth pros-pects; (ii) positioning to deliver future plans and to realize poten-tial for future growth; (iii) liquidity and capital resources and expenditure, and our credit ratings; (iv) growth in demand for our products and services; (v) our joint venture activities; (vi) eco-nomic outlook and industry trends; (vii) developments of our markets; (viii) the impact of regulatory initiatives; (ix) research and development expenditures; (x) the strength of our competi-tors; (xi) future cost savings and profitability; (xii) plans to launch new products and services; (xiii) assessments of risks; (xiv) inte-gration of acquired businesses; (xv) compliance with rules and regulations and (xvi) infringements of intellectual property rights of others.
In addition, any statements that refer to expectations, projec-tions or other characterizations of future events or circum-stances, including any underlying assumptions, are for-ward-looking statements. These forward-looking statements speak only as of the date hereof and are based upon the infor-mation available to us at this time. Such information is subject to change, and we will not necessarily inform you of such changes. These statements are not guarantees of future performance and are subject to risks, uncertainties and assumptions that are diffi-cult to predict. Therefore, our actual results could differ materi-ally and adversely from those expressed in any forward-looking statements as a result of various factors, such as those factors described under the risk factor section. Important factors that may cause such a difference for Ericsson include, but are not limited to: (i) material adverse changes in the markets in which we operate or in global economic conditions; (ii) increased prod-uct and price competition; (iii) reductions in capital expenditure by network operators; (iv) the cost of technological innovation and increased expenditure to improve quality of service; (v) sig-nificant changes in market share for our principal products and services; (vi) foreign exchange rate or interest rate fluctuations; and (vii) the failure to successfully implement our business and operational initiatives
16 Ericsson | First Quarter Report 2017
Financial STATEMENTS AND other INFORMATION
ContentsFinancial statements Consolidated income statement 17Statement of comprehensive income 17Consolidated balance sheet 18Consolidated statement of cash flows 19Consolidated statement of changes in equity 20Consolidated income statement – isolated quarters 20Consolidated statement of cash flows – isolated quarters 21Parent Company income statement 22Parent Company statement of comprehensive income 22Parent Company balance sheet 23
Additional information Accounting policies 24Net sales by segment by quarter 25Sales growth adjusted for comparable units and currency 26Gross income and gross margin by segment by quarter 26Operating income and operating margin by segment by quarter 27EBITA and EBITA margin by segment by quarter 27Net sales by region by quarter 28Net sales by region by quarter (cont.) 29Top 5 countries in sales 29Net sales by region by segment 30Provisions 31Information on investments 31Other information 32Number of employees 32
Items excluding restructuring charges Restructuring charges by function 33Restructuring charges by segment 33Gross income and gross margin excluding restructuring by segment by quarter 34Operating income and operating margin excluding restructuring by segment by quarter 34
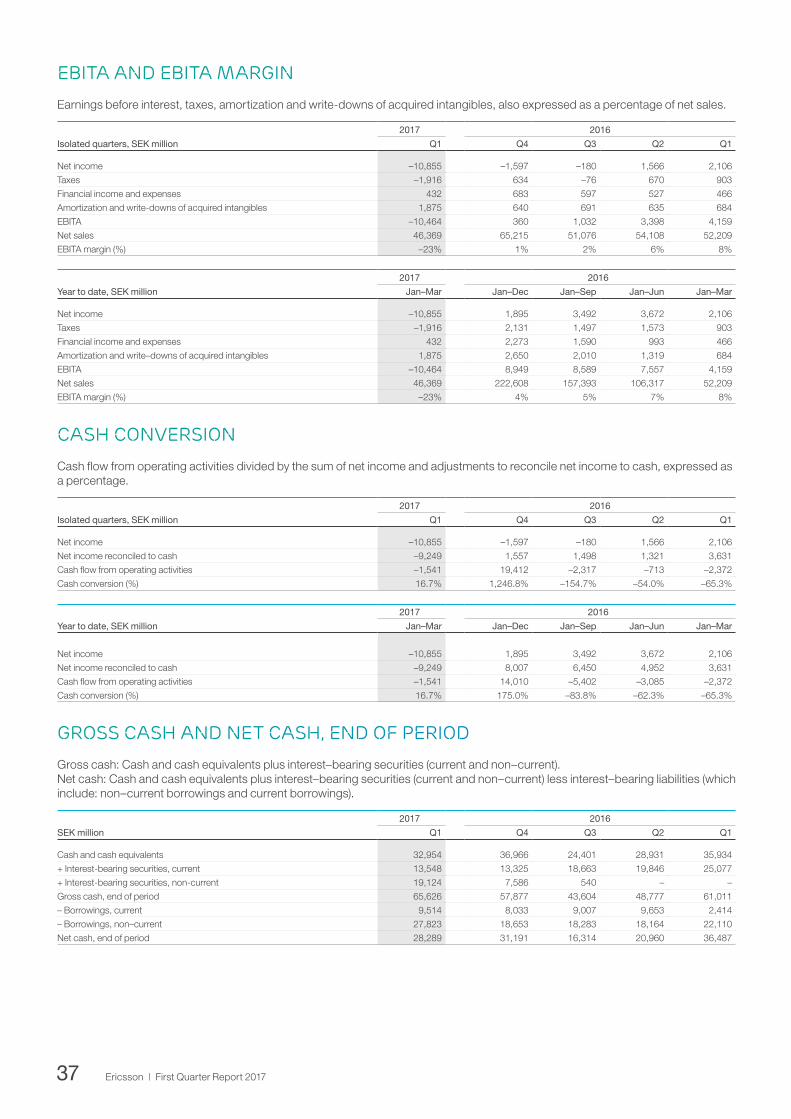
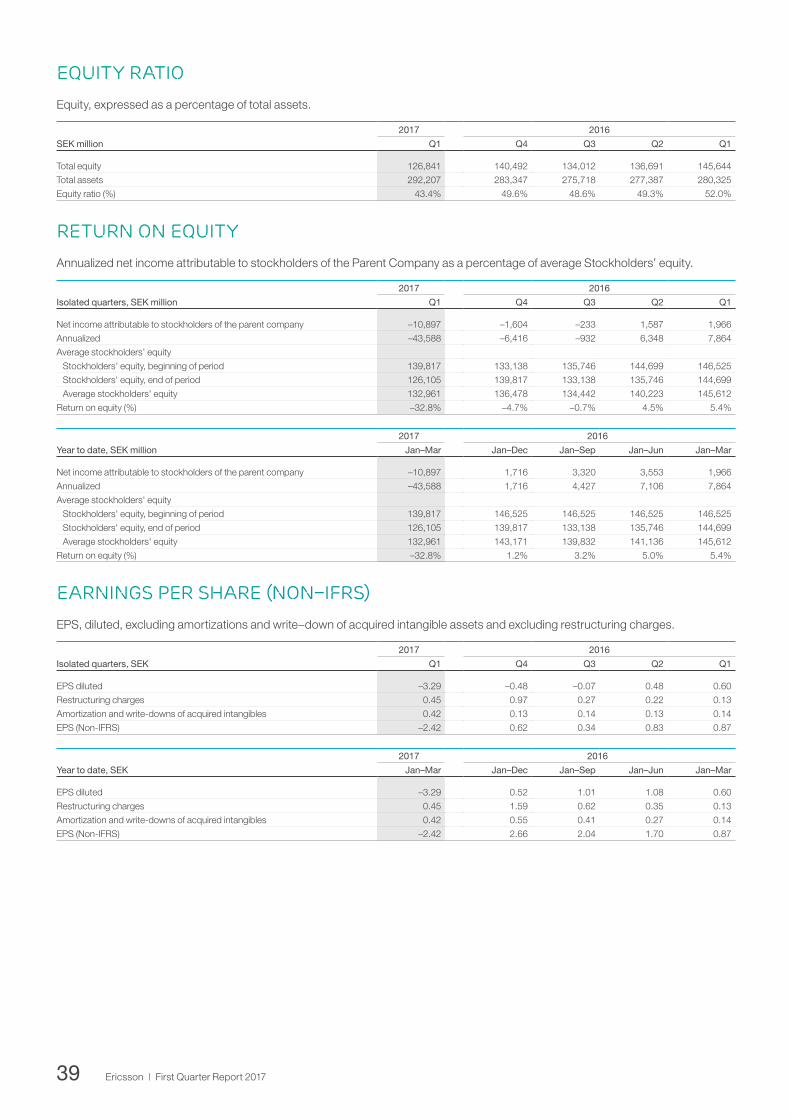
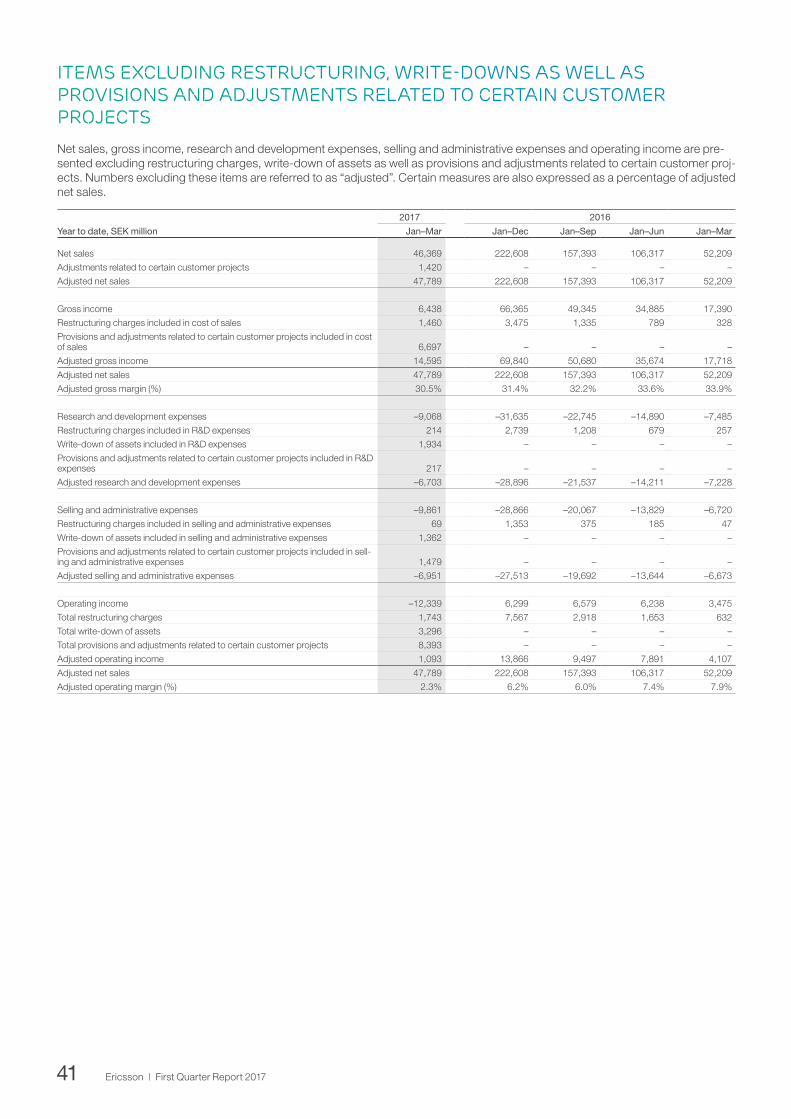
Alternative performance measuresSales growth adjusted for comparable units and currency 35Items excluding restructuring charges 36EBITA and EBITA margin 37Cash conversion 37Gross cash and net cash, end of period 37Capital employed 38Capital turnover 38Return on capital employed 38Equity ratio 39Return on equity 39Earnings per share (non-IFRS) 39Items excluding restructuring, write-downs, as well as provi-sions and adjustments related to certain customer projects 40
17 Ericsson | First Quarter Report 2017
CONSOLIDATED INCOME STATEMENTJan–Mar Jan–Dec
SEK million 2017 2016 Change 2016
Net sales 46,369 52,209 –11% 222,608
Cost of sales –39,931 –34,819 15% –156,243
Gross income 6,438 17,390 –63% 66,365
Gross margin (%) 13.9% 33.3% 29.8%
Research and development expenses –9,068 –7,485 21% –31,635
Selling and administrative expenses –9,861 –6,720 47% –28,866
Operating expenses –18,929 –14,205 33% –60,501
Other operating income and expenses 141 273 404
Shares in earnings of JV and associated companies 11 17 31
Operating income –12,339 3,475 –455% 6,299
Financial income –82 –89 –115
Financial expenses –350 –377 –2,158
Income after financial items –12,771 3,009 –524% 4,026
Taxes 1,916 –903 –2,131
Net income –10,855 2,106 –615% 1,895
Net income attributable to:
Stockholders of the Parent Company –10,897 1,966 1,716
Non-controlling interests 42 140 179
Other information
Average number of shares, basic (million) 3,272 3,258 3,263
Earnings per share, basic (S EK) 1) –3.33 0.60 0.53
Earnings per share, diluted (SEK) 1) –3.29 0.60 0.52
1) Based on Net income attributable to stockholders of the Parent Company.
STATEMENT OF COMPREHENSIVE INCOMEJan–Mar Jan–Dec
SEK million 2017 2016 2016
Net income –10,855 2,106 1,895
Other comprehensive income
Items that will not be reclassified to profit or loss
Remeasurements of defined benefits pension plans incl. asset ceiling 398 –3,502 –1,766
Tax on items that will not be reclassified to profit or loss –169 953 520
Items that may be reclassified to profit or loss
Available-for-sale financial assets
Gains/losses arising during the period 32 – –7
Reclassification adjustments on gains/losses included in profit or loss 3 – –
Revaluation of other investments in shares and participations
Fair value remeasurement 2 –4 –2
Changes in cumulative translation adjustments –21 –1,133 4,235
Share of other comprehensive income on JV and associated companies 10 –376 –362
Tax on items that may be reclassified to profit or loss –9 – 1
Total other comprehensive income, net of tax 246 –4,062 2,619
Total comprehensive income –10,609 –1,956 4,514
Total comprehensive income attributable to:
Stockholders of the Parent Company –10,674 –2,093 4,285
Non-controlling interest 65 137 229
Financial statements
18 Ericsson | First Quarter Report 2017
Consolidated balance sheet
SEK millionMar 31
2017Dec 31
2016
ASSETS
Non-current assets
Intangible assets
Capitalized development expenses 6,460 8,076
Goodwill 43,042 43,387
Intellectual property rights, brands and other intangible assets 5,869 7,747
Property, plant and equipment 16,645 16,734
Financial assets
Equity in JV and associated companies 792 775
Other investments in shares and participations 1,112 1,179
Cash flow from investing activities –13,584 –6,609 –2,040 1,364 –998
Cash flow before financing activities –15,125 12,803 –4,357 651 –3,370
Financing activities
Dividends paid –4 – –163 –12,067 –33
Other financing activities 10,902 –1,039 –1,295 2,761 94
Cash flow from financing activities 10,898 –1,039 –1,458 –9,306 61
Effect of exchange rate changes on cash 215 801 1,285 1,652 –981
Net change in cash and cash equivalents –4,012 12,565 –4,530 –7,003 –4,290
Cash and cash equivalents, beginning of period 36,966 24,401 28,931 35,934 40,224
Cash and cash equivalents, end of period 32,954 36,966 24,401 28,931 35,934
22 Ericsson | First Quarter Report 2017
PARENT COMPANY INCOME STATEMENTJan–Mar Jan–Dec
SEK million 2017 2016 2016
Net sales – – –
Cost of sales – – –
Gross income – – –
Operating expenses –289 –223 –1,185
Other operating income and expenses 572 574 2,698
Operating income 283 351 1,513
Financial net –331 11 14,039
Income after financial items –48 362 15,552
Transfers to (–) / from untaxed reserves – – –1,100
Taxes –10 –45 –206
Net income –58 317 14,246
Parent company STATEMENT OF COMPREHENSIVE INCOMEJan–Mar Jan–Dec
SEK million 2017 2016 2016
Net income –58 317 14,246
Available-for-sale financial assets
Gains/losses arising during the period 32 – –7
Reclassification adjustments on gains/losses included in profit or loss 3 – –
Revaluation of other investments in shares and participations
Fair value remeasurement – –5 –5
Tax on items that may be reclassified to profit or loss –8 – –
Total other comprehensive income, net of tax 27 –5 –12
Total comprehensive income –31 312 14,234
23 Ericsson | First Quarter Report 2017
PARENT COMPANY BALANCE SHEET
SEK millionMar 31
2017Dec 31
2016
ASSETS
Fixed assets
Intangible assets 487 547
Tangible assets 414 396
Financial assets* 123,786 111,981
124,687 112,924
Current assets
Inventories 2 3
Receivables 28,527 38,476
Short-term investments 13,209 12,991
Cash and cash equivalents 18,984 22,311
60,722 73,781
Total assets 185,409 186,705
STOCKHOLDERS' EQUITY, PROVISIONS AND LIABILITIES
Equity
Restricted equity 48,148 48,148
Non-restricted equity 41,461 44,753
89,609 92,901
Provisions 677 885
Non-current liabilities 59,691 50,428
Current liabilities 35,432 42,491
Total stockholders' equity, provisions and liabilities 185,409 186,705
* Of which interest-bearing securities, non-current 19,124 7,586
24 Ericsson | First Quarter Report 2017
Additional information
Accounting policies
THE GROUP
This interim report is prepared in accordance with IAS 34. The term “IFRS” used in this document refers to the application of IAS and IFRS as well as interpretations of these standards as issued by IASB’s Standards Interpretation Committee (SIC) and IFRS Interpretations Committee (IFRIC). The accounting policies adopted are consistent with those of the annual report for the year ended December 31, 2016, and should be read in conjunc-tion with that annual report.
There is no significant difference between IFRS effective as per December 31, 2017 and IFRS as endorsed by the EU.
None of the new or amended standards and interpretations that became effective January 1, 2017, have had a significant impact on the financial result or position of the Company.
25 Ericsson | First Quarter Report 2017
NET SALES BY SEGMENT BY QUARTER*
2017 2016
Isolated quarters, SEK million Q1 Q4 Q3 Q2 Q1
Networks 34,860 47,791 37,020 40,245 39,935
Of which products 19,410 27,519 19,249 23,037 22,795
Of which services 15,450 20,272 17,771 17,208 17,140
IT & Cloud 9,545 14,884 11,716 11,500 9,830
Of which products 4,103 6,682 5,479 5,298 4,773
Of which services 5,442 8,202 6,237 6,202 5,057
Media 1,964 2,540 2,340 2,363 2,444
Total 46,369 65,215 51,076 54,108 52,209
2017 2016
Sequential change, percent Q1 Q4 Q3 Q2 Q1
Networks –27% 29% –8% 1% –
Of which products –29% 43% –16% 1% –
Of which services –24% 14% 3% 0% –
IT & Cloud –36% 27% 2% 17% –
Of which products –39% 22% 3% 11% –
Of which services –34% 32% 1% 23% –
Media –23% 9% –1% –3% –
Total –29% 28% –6% 4% –29%
2017 2016
Year over year change, percent Q1 Q4 Q3 Q2 Q1
Networks –13% – – – –
Of which products –15% – – – –
Of which services –10% – – – –
IT & Cloud –3% – – – –
Of which products –14% – – – –
Of which services 8% – – – –
Media –20% – – – –
Total –11% –11% –14% –11% –2%
2017 2016
Year to date, SEK million Jan–Mar Jan–Dec Jan–Sep Jan–Jun Jan–Mar
Networks 34,860 164,991 117,200 80,180 39,935
Of which products 19,410 92,600 65,081 45,832 22,795
Of which services 15,450 72,391 52,119 34,348 17,140
IT & Cloud 9,545 47,930 33,046 21,330 9,830
Of which products 4,103 22,232 15,550 10,071 4,773
Of which services 5,442 25,698 17,496 11,259 5,057
Media 1,964 9,687 7,147 4,807 2,444
Total 46,369 222,608 157,393 106,317 52,209
2017 2016
Year to date, year over year change, percent Jan–Mar Jan–Dec Jan–Sep Jan–Jun Jan–Mar
Networks –13% –11% – – –
Of which products –15% –12% – – –
Of which services –10% –8% – – –
IT & Cloud –3% –7% – – –
Of which products –14% –16% – – –
Of which services 8% 1% – – –
Media –20% –7% – – –
Total –11% –10% –9% –7% –2%
*Net sales by segment has been restated for each quarter of 2016 and for the full year 2015. Comparisons against isolated quarters in 2015 are not available by segment.
26 Ericsson | First Quarter Report 2017
SALES GROWTH ADJUSTED FOR COMPARABLE UNITS AND CURRENCY*2017 2016
Sequential change, percent Q1 Q4 Q3 Q2 Q1
Networks –27% – – – –
IT & Cloud –35% – – – –
Media –23% – – – –
Total –29% 23% –9% 6% –28%
Isolated quarter, year over year change, percent
2017 2016
Q1 Q4 Q3 Q2 Q1
Networks –18% – – – –
IT & Cloud –7% – – – –
Media –22% – – – –
Total –16% –15% –14% –7% –1%
Year to date, year over year change, percent
2017 2016
Jan–Mar Jan–Dec Jan–Sep Jan–Jun Jan–Mar
Networks –18% – – – –
IT & Cloud –7% – – – –
Media –22% – – – –
Total –16% –10% –8% –4% –1%
*Sales growth adjusted for comparable units and currency has not been restated by segment for 2016.
Gross income and gross margin BY SEGMENT BY QUARTER
Isolated quarters, SEK million
2017 2016
Q1 Q4 Q3 Q2 Q1
Networks 7,980 11,783 9,867 12,522 13,011
IT & Cloud –2,100 4,676 3,833 4,061 3,281
Media 558 561 760 912 1,098
Total 6,438 17,020 14,460 17,495 17,390
Isolated quarters, As percentage of net sales
2017 2016
Q1 Q4 Q3 Q2 Q1
Networks 23% 25% 27% 31% 33%
IT & Cloud –22% 31% 33% 35% 33%
Media 28% 22% 32% 39% 45%
Total 14% 26% 28% 32% 33%
Year to date, SEK million
2017 2016
Jan-Mar Jan-Dec Jan-Sep Jan-Jun Jan-Mar
Networks 7,980 47,183 35,400 25,533 13,011
IT & Cloud –2,100 15,851 11,175 7,342 3,281
Media 558 3,331 2,770 2,010 1,098
Total 6,438 66,365 49,345 34,885 17,390
Year to date, As percentage of net sales
2017 2016
Jan–Mar Jan–Dec Jan–Sep Jan–Jun Jan–Mar
Networks 23% 29% 30% 32% 33%
IT & Cloud –22% 33% 34% 34% 33%
Media 28% 34% 39% 42% 45%
Total 14% 30% 31% 33% 33%
27 Ericsson | First Quarter Report 2017
OPERATING INCOME and operating margin BY SEGMENT BY QUARTER
Isolated quarters, SEK million
2017 2016
Q1 Q4 Q3 Q2 Q1
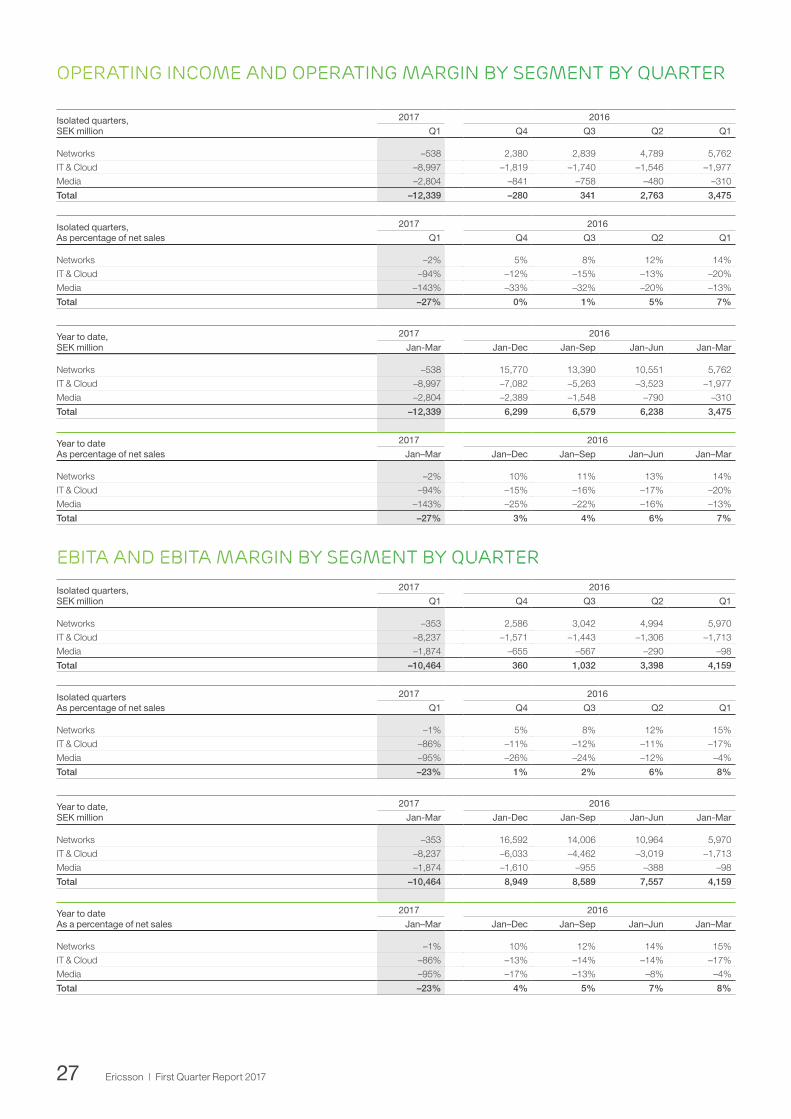
Networks –538 2,380 2,839 4,789 5,762
IT & Cloud –8,997 –1,819 –1,740 –1,546 –1,977
Media –2,804 –841 –758 –480 –310
Total –12,339 –280 341 2,763 3,475
Isolated quarters, As percentage of net sales
2017 2016
Q1 Q4 Q3 Q2 Q1
Networks –2% 5% 8% 12% 14%
IT & Cloud –94% –12% –15% –13% –20%
Media –143% –33% –32% –20% –13%
Total –27% 0% 1% 5% 7%
Year to date, SEK million
2017 2016
Jan-Mar Jan-Dec Jan-Sep Jan-Jun Jan-Mar
Networks –538 15,770 13,390 10,551 5,762
IT & Cloud –8,997 –7,082 –5,263 –3,523 –1,977
Media –2,804 –2,389 –1,548 –790 –310
Total –12,339 6,299 6,579 6,238 3,475
Year to date As percentage of net sales
2017 2016
Jan–Mar Jan–Dec Jan–Sep Jan–Jun Jan–Mar
Networks –2% 10% 11% 13% 14%
IT & Cloud –94% –15% –16% –17% –20%
Media –143% –25% –22% –16% –13%
Total –27% 3% 4% 6% 7%
EBITA and ebita margin BY SEGMENT BY QUARTER
Isolated quarters, SEK million
2017 2016
Q1 Q4 Q3 Q2 Q1
Networks –353 2,586 3,042 4,994 5,970
IT & Cloud –8,237 –1,571 –1,443 –1,306 –1,713
Media –1,874 –655 –567 –290 –98
Total –10,464 360 1,032 3,398 4,159
Isolated quarters As percentage of net sales
2017 2016
Q1 Q4 Q3 Q2 Q1
Networks –1% 5% 8% 12% 15%
IT & Cloud –86% –11% –12% –11% –17%
Media –95% –26% –24% –12% –4%
Total –23% 1% 2% 6% 8%
Year to date, SEK million
2017 2016
Jan-Mar Jan-Dec Jan-Sep Jan-Jun Jan-Mar
Networks –353 16,592 14,006 10,964 5,970
IT & Cloud –8,237 –6,033 –4,462 –3,019 –1,713
Media –1,874 –1,610 –955 –388 –98
Total –10,464 8,949 8,589 7,557 4,159
Year to date As a percentage of net sales
2017 2016
Jan–Mar Jan–Dec Jan–Sep Jan–Jun Jan–Mar
Networks –1% 10% 12% 14% 15%
IT & Cloud –86% –13% –14% –14% –17%
Media –95% –17% –13% –8% –4%
Total –23% 4% 5% 7% 8%
28 Ericsson | First Quarter Report 2017
NET SALES BY REGION BY QUARTER*2017 2016
Isolated quarters, SEK million Q1 Q4 Q3 Q2 Q1
North America 11,811 14,851 13,178 13,358 13,147
Latin America 2,887 4,974 4,383 4,550 4,047
Northern Europe & Central Asia 1) 2) 1,735 2,781 2,105 2,158 2,286
Western & Central Europe 2) 3,645 4,588 3,949 4,828 4,373
Mediterranean 2) 4,440 6,785 4,667 5,546 4,394
Middle East 3,487 6,397 4,286 4,926 3,579
Sub Saharan Africa 1,927 2,732 2,012 2,313 2,120
India 2,422 3,042 2,597 2,426 2,683
North East Asia 5,561 9,623 6,122 6,041 5,579
South East Asia & Oceania 5,587 6,676 5,081 5,304 5,222
Other 1) 2) 2,867 2,766 2,696 2,658 4,779
Total 46,369 65,215 51,076 54,108 52,2091) Of which in Sweden 925 843 690 477 1,1132) Of which in EU 8,239 11,154 8,507 9,635 9,229
2017 2016
Sequential change, percent Q1 Q4 Q3 Q2 Q1
North America –20% 13% –1% 2% –21%
Latin America –42% 13% –4% 12% –34%
Northern Europe & Central Asia 1) 2) –38% 32% –2% –6% –22%
Western & Central Europe 2) –21% 16% –18% 10% –25%
Mediterranean 2) –35% 45% –16% 26% –38%
Middle East –45% 49% –13% 38% –41%
Sub Saharan Africa –29% 36% –13% 9% –26%
India –20% 17% 7% –10% –15%
North East Asia –42% 57% 1% 8% –37%
South East Asia & Oceania –16% 31% –4% 2% –3%
Other 1) 2) 4% 3% 1% –44% –44%
Total –29% 28% –6% 4% –29%1) Of which in Sweden 10% 22% 45% –57% 15%2) Of which in EU –26% 31% –12% 4% –27%
2017 2016
Year–over–year change, percent Q1 Q4 Q3 Q2 Q1
North America –10% –11% –8% –8% 8%
Latin America –29% –19% –22% –10% –12%
Northern Europe & Central Asia 1) 2) –24% –5% –19% –18% –18%
Western & Central Europe 2) –17% –21% –21% –15% –17%
Mediterranean 2) 1% –4% –17% –7% –14%
Middle East –3% 5% –25% –24% –21%
Sub Saharan Africa –9% –4% –25% –13% –2%
India –10% –4% –28% –20% –24%
North East Asia 0% 8% –4% –13% –7%
South East Asia & Oceania 7% 25% 5% 8% 23%
Other 1) 2) –40% –67% –6% –3% 54%
Total –11% –11% –14% –11% –2%1) Of which in Sweden –17% –13% –39% –20% 2%2) Of which in EU –11% –12% –20% –16% –15%
*Net sales by region has been restated. Broadcast services, previously reported in Region Other, is now reported per geographical region. In addition, part of the business related to former Telcordia has been transferred from the geographic regions to Region Other.
29 Ericsson | First Quarter Report 2017
NET SALES BY REGION BY QUARTER, cont.*2017 2016
Year to date, SEK million Jan–Mar Jan–Dec Jan–Sep Jan–Jun Jan–Mar
North America 11,811 54,534 39,683 26,505 13,147
Latin America 2,887 17,954 12,980 8,597 4,047
Northern Europe & Central Asia 1) 2) 1,735 9,330 6,549 4,444 2,286
Western & Central Europe 2) 3,645 17,738 13,150 9,201 4,373
Mediterranean 2) 4,440 21,392 14,607 9,940 4,394
Middle East 3,487 19,188 12,791 8,505 3,579
Sub Saharan Africa 1,927 9,177 6,445 4,433 2,120
India 2,422 10,748 7,706 5,109 2,683
North East Asia 5,561 27,365 17,742 11,620 5,579
South East Asia & Oceania 5,587 22,283 15,607 10,526 5,222
Other 1) 2) 2,867 12,899 10,133 7,437 4,779
Total 46,369 222,608 157,393 106,317 52,2091) Of which in Sweden 925 3,123 2,280 1,590 1,1132) Of which in EU 8,239 38,525 27,371 18,864 9,229
Year to date, year–over–year change, percent
2017 2016
Jan–Mar Jan–Dec Jan–Sep Jan–Jun Jan–Mar
North America –10% –6% –3% –1% 8%
Latin America –29% –16% –15% –11% –12%
Northern Europe & Central Asia 1) 2) –24% –15% –18% –18% –18%
Western & Central Europe 2) –17% –18% –17% –16% –17%
Mediterranean 2) 1% –10% –12% –10% –14%
Middle East –3% –16% –24% –23% –21%
Sub Saharan Africa –9% –11% –14% –8% –2%
India –10% –20% –25% –22% –24%
North East Asia 0% –3% –8% –10% –7%
South East Asia & Oceania 7% 15% 12% 15% 23%
Other 1) 2) –40% –25% 16% 27% 54%
Total –11% –10% –9% –7% –2%1) Of which in Sweden –17% –18% –19% –6% 2%2) Of which in EU –11% –15% –17% –16% –15%
*Net sales by region has been restated. Broadcast services, previously reported in Region Other, is now reported per geographical region. In addition, part of the business related to former Telcordia has been transferred from the geographic regions to Region Other.
TOP 5 COUNTRIES IN SALESCountry Q1 Jan–Dec
Percentage of Net sales 2017 2016 2016
United States 26% 27% 25%
China 7% 9% 9%
India 5% 5% 5%
Japan 5% 4% 3%
Vietnam 4% 1% 1%
30 Ericsson | First Quarter Report 2017
NET SALES BY REGION BY segmentQ1 2017
SEK million Networks IT & Cloud Media Total
North America 9,229 2,287 295 11,811
Latin America 2,015 845 27 2,887
Northern Europe & Central Asia 1,208 424 103 1,735
Western & Central Europe 2,519 690 436 3,645
Mediterranean 2,844 1,367 229 4,440
Middle East 2,397 1,015 75 3,487
Sub Saharan Africa 1,354 538 35 1,927
India 1,825 586 11 2,422
North East Asia 4,625 889 47 5,561
South East Asia & Oceania 4,828 692 67 5,587
Other 2,016 212 639 2,867
Total 34,860 9,545 1,964 46,369
Share of total 75% 21% 4% 100%
Q1 2017
Sequential change, percent Networks IT & Cloud Media Total
North America –22% –11% –42% –20%
Latin America –43% –35% –79% –42%
Northern Europe & Central Asia –39% –37% –20% –38%
Western & Central Europe –8% –47% –21% –21%
Mediterranean –25% –49% –27% –35%
Middle East –47% –42% –15% –45%
Sub Saharan Africa –36% –10% 775% –29%
India –28% 21% –39% –20%
North East Asia –35% –63% –18% –42%
South East Asia & Oceania –15% –21% –29% –16%
Other 9% –21% –2% 4%
Total –27% –36% –23% –29%
Q1 2017
Year over year change, percent Networks IT & Cloud Media Total
North America –15% 32% –44% –10%
Latin America –32% –19% –52% –29%
Northern Europe & Central Asia –31% 4% –18% –24%
Western & Central Europe –21% 6% –20% –17%
Mediterranean 4% –6% 8% 1%
Middle East –3% –1% –7% –3%
Sub Saharan Africa –8% –16% 150% –9%
India –15% 17% –52% –10%
North East Asia 8% –30% 4% 0%
South East Asia & Oceania 8% 3% 10% 7%
Other –44% –52% –15% –40%
Total –13% –3% –20% –11%
31 Ericsson | First Quarter Report 2017
PROVISIONS2017 2016
Isolated quarters, SEK million Q1 Q4 Q3 Q2 Q1
Opening balance 6,357 3,245 3,387 3,532 3,838
Additions 6,365 4,349 666 839 492
Utilization/Cash out –2,085 –976 –716 –794 –667
Of which restructuring –1,586 –785 –529 –639 –487
Reversal of excess amounts –66 –253 –129 –240 –67
Reclassification, translation difference and other –11 –8 37 50 –64
Closing balance 10,560 6,357 3,245 3,387 3,532
2017 2016
Year to date, SEK million Jan–Mar Jan–Dec Jan–Sep Jan–Jun Jan–Mar
Opening balance 6,357 3,838 3,838 3,838 3,838
Additions 6,365 6,346 1,997 1,331 492
Utilization/Cash out –2,085 –3,153 –2,177 –1,461 –667
Of which restructuring –1,586 –2,440 –1,655 –1,126 –487
Reversal of excess amounts –66 –689 –436 –307 –67
Reclassification, translation difference and other –11 15 23 –14 –64
Closing balance 10,560 6,357 3,245 3,387 3,532
Information on INVESTMENTS
Investments in assets subject to depreciation, amortization, impairment and write–downs
2017 2016
Isolated quarters, SEK million Q1 Q4 Q3 Q2 Q1
Additions
Property, plant and equipment 1,015 1,699 1,384 1,572 1,474
Capitalized development expenses 1) 865 1,291 885 1,099 1,208
IPR, brands and other intangible assets 1 0 –4 13 5
Total 1,881 2,990 2,265 2,684 2,687
Depreciation, amortization and impairment losses
Property, plant and equipment 1,075 1,318 1,106 1,083 1,062
Capitalized development expenses 2,481 652 511 386 351
IPR, brands and other intangible assets 1,875 640 691 635 684
Total 5,431 2,610 2,308 2,104 2,097
1) Including reclassification
2017 2016
Year to date, SEK million Jan–Mar Jan–Dec Jan–Sep Jan–Jun Jan–Mar
Additions
Property, plant and equipment 1,015 6,129 4,430 3,046 1,474
Capitalized development expenses 1) 865 4,483 3,192 2,307 1,208
IPR, brands and other intangible assets 1 14 14 18 5
Total 1,881 10,626 7,636 5,371 2,687
Depreciation, amortization and impairment losses
Property, plant and equipment 1,075 4,569 3,251 2,145 1,062
Capitalized development expenses 2,481 1,900 1,248 737 351
IPR, brands and other intangible assets 1,875 2,650 2,010 1,319 684
Total 5,431 9,119 6,509 4,201 2,097
1) Including reclassification
32 Ericsson | First Quarter Report 2017
OTHER InformationJan–Mar Jan–Dec
SEK million 2017 2016 2016
Number of shares and earnings per share
Number of shares, end of period (million) 3,331 3,305 3,331
Of which class A-shares (million) 262 262 262
Of which class B-shares (million) 3,069 3,043 3,069
Number of treasury shares, end of period (million) 58 46 62
Number of shares outstanding, basic, end of period (million) 3,273 3,259 3,269
Numbers of shares outstanding, diluted, end of period (million) 3,314 3,293 3,309
Average number of treasury shares (million) 59 47 60
Average number of shares outstanding, basic (million) 3,272 3,258 3,263
Average number of shares outstanding, diluted (million) 1) 3,313 3,292 3,303
Earnings per share, basic (SEK) –3.33 0.60 0.53
Earnings per share, diluted (SEK) 1) –3.29 0.60 0.52
Earnings per share (Non–IFRS), diluted (SEK) 2) –2.42 0.87 2.66
Ratios
Days sales outstanding 117 108 95
Inventory turnover days 73 80 69
Payable days 58 58 56
Equity ratio (%) 43.4% 52.0% 49.6%
Return on equity (%) –32.8% 5.4% 1.2%
Return on capital employed (%) –26.2% 6.9% 3.2%
Capital turnover (times) 1.0 1.1 1.2
Cash conversion (%) 16.7% –65.3% 175.0%
Exchange rates used in the consolidation 3)
SEK/EUR– closing rate 9.54 9.23 9.56
SEK/USD– closing rate 8.93 8.11 9.06
Other
Regional inventory, end of period 19,047 18,089 16,231
Export sales from Sweden 21,460 23,254 107,036
1) Potential ordinary shares are not considered when their conversion to ordinary shares would increase earnings per share. 2) Excluding amortizations and write–downs of acquired intangibles and restructuring charges.3) Translation method changed from 2015. Monthly rates used to translate transactions are available on www.ericsson.com/thecompany/investors.
NUMBER OF EMPLOYEES2017 2016
End of period Mar 31 Dec 31 Sep 30 Jun 30 Mar 31
North America 11,253 11,547 12,229 13,838 14,081
Latin America 9,252 9,513 9,592 9,616 9,836
Northern Europe & Central Asia 1) 18,534 19,136 19,759 20,177 20,167
Western & Central Europe 13,368 13,646 13,574 13,727 12,100
Mediterranean 13,040 12,578 13,110 12,957 12,906
Middle East 3,256 3,346 3,479 3,573 3,608
Sub Saharan Africa 2,012 2,086 2,167 2,347 2,377
India 23,253 22,552 22,340 22,541 22,424
North East Asia 12,962 13,042 13,434 13,547 13,623
South East Asia & Oceania 3,968 4,018 4,113 4,184 4,178
Total 110,898 111,464 113,797 116,507 115,3001) Of which in Sweden 14,712 15,303 15,872 16,190 16,290
33 Ericsson | First Quarter Report 2017
Items excluding restructuring chargesRESTRUCTURING CHARGES BY FUNCTION
2017 2016
Isolated quarters, SEK million Q1 Q4 Q3 Q2 Q1
Cost of sales –1,460 –2,140 –546 –461 –328
Research and development expenses –214 –1,531 –529 –422 –257
Selling and administrative expenses –69 –978 –190 –138 –47
Total –1,743 –4,649 –1,265 –1,021 –632
2017 2016
Year to date, SEK million Jan–Mar Jan–Dec Jan–Sep Jan–Jun Jan–Mar
Cost of sales –1,460 –3,475 –1,335 –789 –328
Research and development expenses –214 –2,739 –1,208 –679 –257
Selling and administrative expenses –69 –1,353 –375 –185 –47
Total –1,743 –7,567 –2,918 –1,653 –632
RESTRUCTURING CHARGES BY Segment2017 2016
Isolated quarters, SEK million Q1 Q4 Q3 Q2 Q1
Networks –1,447 –2,430 –557 –472 –434
of which cost of sales –1,254 –1,341 –365 –342 –250
of which operating expenses –193 –1,089 –192 –130 –184
IT & Cloud –241 –1,810 –604 –478 –191
of which cost of sales –168 –671 –109 –106 –76
of which operating expenses –73 –1,139 –495 –372 –115
Media –55 –409 –104 –71 –7
of which cost of sales –38 –128 –72 –13 –2
of which operating expenses –17 –281 –32 –58 –5
Total –1,743 –4,649 –1,265 –1,021 –632
2017 2016
Year to date, SEK million Jan–Mar Jan–Dec Jan–Sep Jan–Jun Jan–Mar
Networks –1,447 –3,893 –1,463 –906 –434
of which cost of sales –1,254 –2,298 –957 –592 –250
of which operating expenses –193 –1,595 –506 –314 –184
IT & Cloud –241 –3,083 –1,273 –669 –191
of which cost of sales –168 –962 –291 –182 –76
of which operating expenses –73 –2,121 –982 –487 –115
Media –55 –591 –182 –78 –7
of which cost of sales –38 –215 –87 –15 –2
of which operating expenses –17 –376 –95 –63 –5
Total –1,743 –7,567 –2,918 –1,653 –632
34 Ericsson | First Quarter Report 2017
Gross income and gross margin excluding restructuring by segement by quarter
Isolated quarters, SEK million
2017 2016
Q1 Q4 Q3 Q2 Q1
Networks 9,234 13,124 10,232 12,864 13,261
IT & Cloud –1,932 5,347 3,942 4,167 3,357
Media 596 689 832 925 1,100
Total 7,898 19,160 15,006 17,956 17,718
As percentage of net sales, isolated quarters
2017 2016
Jan–Mar Jan–Dec Jan–Sep Jan–Jun Jan–Mar
Networks 26% 27% 28% 32% 33%
IT & Cloud –20% 36% 34% 36% 34%
Media 30% 27% 36% 39% 45%
Total 17% 29% 29% 33% 34%
Year to date, SEK million
2017 2016
Q1 Q4 Q3 Q2 Q1
Networks 9,234 49,481 36,357 26,125 13,261
IT & Cloud –1,932 16,813 11,466 7,524 3,357
Media 596 3,546 2,857 2,025 1,100
Total 7,898 69,840 50,680 35,674 17,718
As percentage of net sales, year to date
2017 2016
Jan–Mar Jan–Dec Jan–Sep Jan–Jun Jan–Mar
Networks 26% 30% 31% 33% 33%
IT & Cloud –20% 35% 35% 35% 34%
Media 30% 37% 40% 42% 45%
Total 17% 31% 32% 34% 34%
Operating income and operating margin excluding restructuring by segement by quarter
Isolated quarters, SEK million
2017 2016
Q1 Q4 Q3 Q2 Q1
Networks 909 4,810 3,396 5,261 6,196
IT & Cloud –8,756 –9 –1,136 –1,068 –1,786
Media –2,749 –432 –654 –409 –303
Total –10,596 4,369 1,606 3,784 4,107
As percentage of net sales, isolated quarters
2017 2016
Jan–Mar Jan–Dec Jan–Sep Jan–Jun Jan–Mar
Networks 3% 10% 9% 13% 16%
IT & Cloud –92% 0% –10% –9% –18%
Media –140% –17% –28% –17% –12%
Total –23% 7% 3% 7% 8%
Year to date, SEK million
2017 2016
Q1 Q4 Q3 Q2 Q1
Networks 909 19,663 14,853 11,457 6,196
IT & Cloud –8,756 –3,999 –3,990 –2,854 –1,786
Media –2,749 –1,798 –1,366 –712 –303
Total –10,596 13,866 9,497 7,891 4,107
As percentage of net sales, year to date
2017 2016
Jan–Mar Jan–Dec Jan–Sep Jan–Jun Jan–Mar
Networks 3% 12% 13% 14% 16%
IT & Cloud –92% –8% –12% –13% –18%
Media –140% –19% –19% –15% –12%
Total –23% 6% 6% 7% 8%
35 Ericsson | First Quarter Report 2017
alternative performance MEASURESThis section includes a reconciliation of certain Alternative Per-formance Measures (APMs) to the most directly reconcilable line items in the financial statements. The presentation of APMs has limitations as analytical tools and should not be considered in isolation or as a substitute for related financial measures pre-pared in accordance with IFRS.
APMs are presented to enhance an investor’s evaluation of ongoing operating results, to aid in forecasting future periods and to facilitate meaningful comparison of results between peri-ods.
Management uses these APMs to, among other things, evaluate ongoing operations in relation to historical results, for internal planning and forecasting purposes and in the calculation of cer-tain performance-based compensation.
The APMs presented in this report may differ from similarly titled measures used by other companies.
For additional information, see Alternative Performance Mea-sures in the Ericsson Annual Report 2016.
SALES GROWTH ADJUSTED FOR COMPARABLE UNITS ANd CURRENCY
Sales growth adjusted for the impact of acquisitions and divestments as well as the effects of foreign currency fluctuations.
Reported net sales 46,369 65,215 51,076 54,108 52,209
Acquired/divested business – – –63 –35 –
Net FX impact 234 –2,446 –1,924 1,221 766
Comparable net sales, excluding FX impact 46,603 62,769 49,089 55,294 52,975
Sales growth adjusted for comparable units and currency (%) –29% 23% –9% 6% –28%
2017 2016
Isolated quarter, year over year change Q1 Q4 Q3 Q2 Q1
Reported net sales 46,369 65,215 51,076 54,108 52,209
Acquired/divested business – –49 –96 –95 –73
Net FX impact –2,435 –2,528 –200 2,329 655
Comparable net sales, excluding FX impact 43,934 62,638 50,780 56,342 52,791
Sales growth adjusted for comparable units and currency (%) –16% –15% –14% –7% –1%
2017 2016
Year to date, year over year change Jan–Mar Jan–Dec Jan–Sep Jan–Jun Jan–Mar
Reported net sales 46,369 222,608 157,393 106,317 52,209
Acquired/divested business – –313 –264 –168 –73
Net FX impact –2,435 254 2,783 2,983 655
Comparable net sales, excluding FX impact 43,934 222,549 159,912 109,132 52,791
Sales growth adjusted for comparable units and currency (%) –16% –10% –8% –4% –1%
36 Ericsson | First Quarter Report 2017
Items excluding restructuring charges
Gross income, operating expenses, and operating income are presented excluding restructuring charges and, for certain measures, as a percentage of net sales.
2017 2016
Isolated quarters, SEK million Q1 Q4 Q3 Q2 Q1
Gross income 6,438 17,020 14,460 17,495 17,390
Net sales 46,369 65,215 51,076 54,108 52,209
Gross margin (%) 13.9% 26.1% 28.3% 32.3% 33.3%
Gross income 6,438 17,020 14,460 17,495 17,390
Restructuring charges included in cost of sales 1,460 2,140 546 461 328
Gross cash: Cash and cash equivalents plus interest–bearing securities (current and non–current).Net cash: Cash and cash equivalents plus interest–bearing securities (current and non–current) less interest–bearing liabilities (which include: non–current borrowings and current borrowings).
2017 2016
SEK million Q1 Q4 Q3 Q2 Q1
Cash and cash equivalents 32,954 36,966 24,401 28,931 35,934
+ Interest-bearing securities, current 13,548 13,325 18,663 19,846 25,077
Other non-current liabilities 2,699 2,621 2,127 2,030 1,834
Provisions, current 5,694 5,411 3,075 3,142 3,374
Trade payables 25,814 25,318 21,633 23,709 21,549
Other current liabilities 63,293 56,003 52,896 54,394 55,429
Capital employed 187,952 190,901 193,765 191,831 195,883
Capital turnover
Annualized net sales divided by average capital employed.
2017 2016
Isolated quarters, SEK million Q1 Q4 Q3 Q2 Q1
Net sales 46,369 65,215 51,076 54,108 52,209
Annualized net sales 185,476 260,860 204,304 216,432 208,836
Average capital employed
Capital employed at beginning of period 190,901 193,765 191,831 195,883 195,150
Capital employed at end of period 187,952 190,901 193,765 191,831 195,883
Average capital employed 189,427 192,333 192,798 193,857 195,517
Capital turnover (times) 1.0 1.4 1.1 1.1 1.1
2017 2016
Year to date, SEK million Jan–Mar Jan–Dec Jan–Sep Jan–Jun Jan–Mar
Net sales 46,369 222,608 157,393 106,317 52,209
Annualized net sales 185,476 222,608 209,857 212,634 208,836
Average capital employed
Capital employed at beginning of period 190,901 195,150 195,150 195,150 195,150
Capital employed at end of period 187,952 190,901 193,765 191,831 195,883
Average capital employed 189,427 193,026 194,458 193,491 195,517
Capital turnover (times) 1.0 1.2 1.1 1.1 1.1
Return on capital employed
The annualized total of operating income plus financial income as a percentage of average capital employed.
2017 2016
Isolated quarters, SEK million Q1 Q4 Q3 Q2 Q1
Operating income –12,339 –280 341 2,763 3,475
Financial income –82 61 –226 139 –89
Annualized operating income + financial income –49,684 –876 460 11,608 13,540
Average capital employed
Capital employed at beginning of period 190,901 193,765 191,831 195,883 195,150
Capital employed at end of period 187,952 190,901 193,765 191,831 195,883
Average capital employed 189,427 192,333 192,798 193,857 195,517
Return on capital employed (%) –26.2% –0.5% 0.2% 6.0% 6.9%
2017 2016
Year to date, SEK million Jan–Mar Jan–Dec Jan–Sep Jan–Jun Jan–Mar
Operating income –12,339 6,299 6,579 6,238 3,475
Financial income –82 –115 –176 50 –89
Annualized operating income + financial income –49,684 6,184 8,537 12,576 13,540
Average capital employed
Capital employed at beginning of period 190,901 195,150 195,150 195,150 195,150
Capital employed at end of period 187,952 190,901 193,765 191,831 195,883
Average capital employed 189,427 193,026 194,458 193,491 195,517
Return on capital employed (%) –26.2% 3.2% 4.4% 6.5% 6.9%
39 Ericsson | First Quarter Report 2017
Equity ratio
Equity, expressed as a percentage of total assets.
2017 2016
SEK million Q1 Q4 Q3 Q2 Q1
Total equity 126,841 140,492 134,012 136,691 145,644
Total assets 292,207 283,347 275,718 277,387 280,325
Equity ratio (%) 43.4% 49.6% 48.6% 49.3% 52.0%
Return on equity
Annualized net income attributable to stockholders of the Parent Company as a percentage of average Stockholders’ equity.
2017 2016
Isolated quarters, SEK million Q1 Q4 Q3 Q2 Q1
Net income attributable to stockholders of the parent company –10,897 –1,604 –233 1,587 1,966
Annualized –43,588 –6,416 –932 6,348 7,864
Average stockholders' equity
Stockholders' equity, beginning of period 139,817 133,138 135,746 144,699 146,525
Stockholders' equity, end of period 126,105 139,817 133,138 135,746 144,699
Average stockholders' equity 132,961 136,478 134,442 140,223 145,612
Return on equity (%) –32.8% –4.7% –0.7% 4.5% 5.4%
2017 2016
Year to date, SEK million Jan–Mar Jan–Dec Jan–Sep Jan–Jun Jan–Mar
Net income attributable to stockholders of the parent company –10,897 1,716 3,320 3,553 1,966
Annualized –43,588 1,716 4,427 7,106 7,864
Average stockholders' equity
Stockholders' equity, beginning of period 139,817 146,525 146,525 146,525 146,525
Stockholders' equity, end of period 126,105 139,817 133,138 135,746 144,699
Average stockholders' equity 132,961 143,171 139,832 141,136 145,612
Return on equity (%) –32.8% 1.2% 3.2% 5.0% 5.4%
Earnings per share (Non–ifrs)
EPS, diluted, excluding amortizations and write–down of acquired intangible assets and excluding restructuring charges.
2017 2016
Isolated quarters, SEK Q1 Q4 Q3 Q2 Q1
EPS diluted –3.29 –0.48 –0.07 0.48 0.60
Restructuring charges 0.45 0.97 0.27 0.22 0.13
Amortization and write-downs of acquired intangibles 0.42 0.13 0.14 0.13 0.14
EPS (Non-IFRS) –2.42 0.62 0.34 0.83 0.87
2017 2016
Year to date, SEK Jan–Mar Jan–Dec Jan–Sep Jan–Jun Jan–Mar
EPS diluted –3.29 0.52 1.01 1.08 0.60
Restructuring charges 0.45 1.59 0.62 0.35 0.13
Amortization and write-downs of acquired intangibles 0.42 0.55 0.41 0.27 0.14
EPS (Non-IFRS) –2.42 2.66 2.04 1.70 0.87
40 Ericsson | First Quarter Report 2017
Items excluding restructuring, write-downs as well as provisions and adjustments related to certain customer projects
Net sales, gross income, research and development expenses, selling and administrative expenses and operating income are pre-sented excluding restructuring charges, write-down of assets as well as provisions and adjustments related to certain customer proj-ects. Numbers excluding these items are referred to as “adjusted”. Certain measures are also expressed as a percentage of adjusted net sales.
2017 2016
Isolated quarters, SEK million Q1 Q4 Q3 Q2 Q1
Net sales 46,369 65,215 51,076 54,108 52,209
Adjustments related to certain customer projects 1,420 – – – –
Adjusted net sales 47,789 65,215 51,076 54,108 52,209
Gross income 6,438 17,020 14,460 17,495 17,390
Restructuring charges included in cost of sales 1,460 2,140 546 461 328
Provisions and adjustments related to certain customer projects included in cost of sales 6,697 – – – –
Adjusted gross income 14,595 19,160 15,006 17,956 17,718
Adjusted net sales 47,789 65,215 51,076 54,108 52,209
Items excluding restructuring, write-downs as well as provisions and adjustments related to certain customer projects
Net sales, gross income, research and development expenses, selling and administrative expenses and operating income are pre-sented excluding restructuring charges, write-down of assets as well as provisions and adjustments related to certain customer proj-ects. Numbers excluding these items are referred to as “adjusted”. Certain measures are also expressed as a percentage of adjusted net sales.
2017 2016
Year to date, SEK million Jan–Mar Jan–Dec Jan–Sep Jan–Jun Jan–Mar
Net sales 46,369 222,608 157,393 106,317 52,209
Adjustments related to certain customer projects 1,420 – – – –
Adjusted net sales 47,789 222,608 157,393 106,317 52,209
Gross income 6,438 66,365 49,345 34,885 17,390
Restructuring charges included in cost of sales 1,460 3,475 1,335 789 328
Provisions and adjustments related to certain customer projects included in cost of sales 6,697 – – – –
Adjusted gross income 14,595 69,840 50,680 35,674 17,718
Adjusted net sales 47,789 222,608 157,393 106,317 52,209