27
First quarter 2018 Oslo, April 20, 2018 First Quarter 2018

First quarter 2018Oslo, April 20, 2018
First Quarter 2018

The following presentation is being made only to, and is only directed at, persons to whom such presentation may lawfully be communicated (’relevant persons’). Any person who is not a relevant person should not rely, act or make assessment on the basis of this presentation or anything included therein.
The following presentation may include information related to investments made and key commercial terms thereof, including future returns. Such information cannot be relied upon as a guide to the future performance of such investments. The release, publication or distribution of this presentation in certain jurisdictions may be restricted by law,and therefore persons in such jurisdictions into which this presentation is released, published or distributed should inform themselves about, and observe, such restrictions. This presentation does not constitute an offering of securities or otherwise constitute an invitation or inducement to any person to underwrite, subscribe for or otherwise acquire securities in Scatec Solar ASA or any company within the Scatec Solar Group. This presentation contains statements regarding the future in connection with the Scatec Solar Group’s growth initiatives, profit figures, outlook, strategies and objectives as well as forward looking statements and any such information or forward-looking statements regarding the future and/or the Scatec Solar Group’s expectations are subject to inherent risks and uncertainties, and many factors can lead to actual profits and developments deviating substantially from what has been expressed or implied in such statements.
2
Disclaimer

• Highlights and project update
Raymond Carlsen, CEO
• Financial review
Mikkel Tørud, CFO
• Summary and Outlook
Raymond Carlsen, CEO
3
Agenda

• Q1’18 proportionate revenues of NOK 573 million and EBITDA of NOK 109 million
• Financial close reached 258 MW in South Africa and 40 MW in Mozambique – 2018 growth target confirmed
• D&C revenues set to increase significantly over the coming quarters after total contract award of NOK 8.5 billion
• 150 MW in Ukraine and 25 MW in Cameroon added to pipeline - a solid basis for growth beyond 2018
4
Delivering on our 1.5 GW target by end 2018
Module installation at the 162 MW Apodi site in Brazil
5
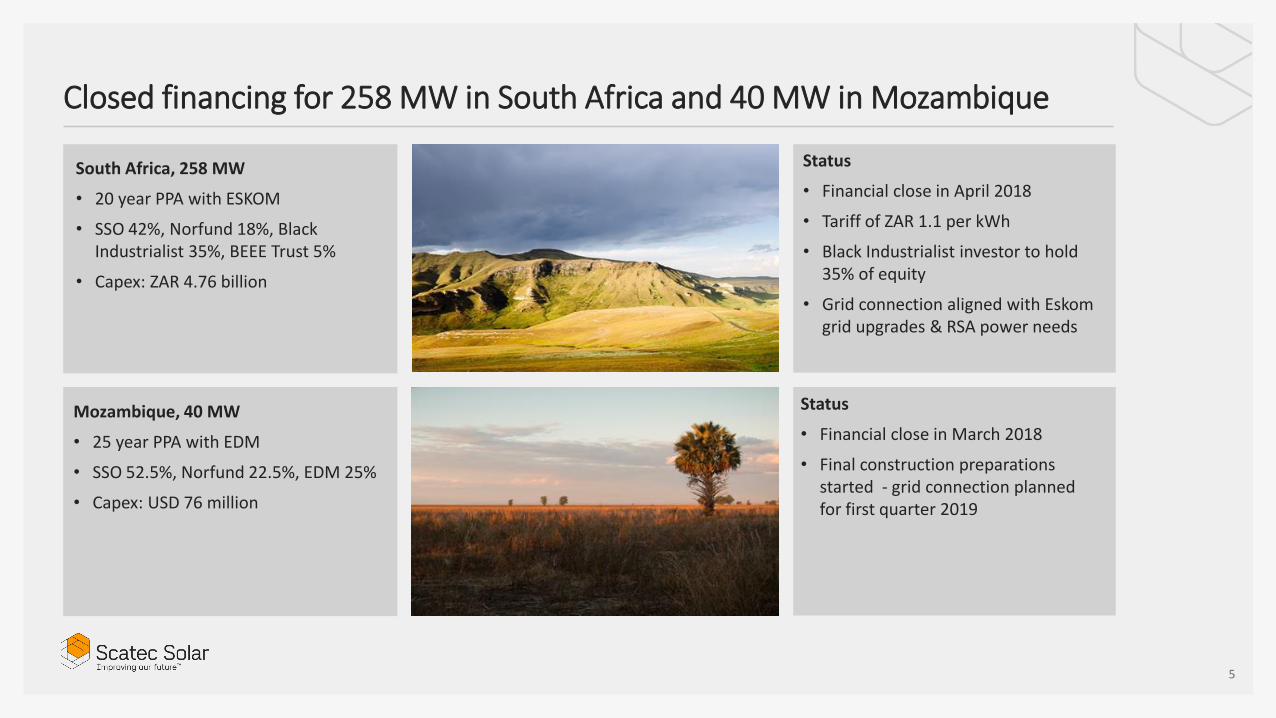
Closed financing for 258 MW in South Africa and 40 MW in Mozambique
South Africa, 258 MW
• 20 year PPA with ESKOM
• SSO 42%, Norfund 18%, Black Industrialist 35%, BEEE Trust 5%
• Capex: ZAR 4.76 billion
Status
• Financial close in April 2018
• Tariff of ZAR 1.1 per kWh
• Black Industrialist investor to hold 35% of equity
• Grid connection aligned with Eskom grid upgrades & RSA power needs
Mozambique, 40 MW
• 25 year PPA with EDM
• SSO 52.5%, Norfund 22.5%, EDM 25%
• Capex: USD 76 million
Status
• Financial close in March 2018
• Final construction preparations started - grid connection planned for first quarter 2019

6
Construction under way
Malaysia, 197 MW Brazil, 162 MW Honduras, 35 MW

7
1.1 GW under construction – a NOK 8.5 billion programme
197
2H’18 1H’19 2H’19 20+ years
Malaysia
Brazil
Honduras
Mozambique
Egypt
South Africa
1H’18
162
35
40
400
258
Construction
1,092Total
MW*Plant SSO %*
68%
44%
70%
52%
51%
42%
52%
About 50% of the NOK 8.5 billion contract value to be realised in 2018 - the balance in 2019
Operation
2H’17
Construction start / Expected construction start
Expected grid connection
Construction Operation
Construction Operation
Construction Operation
Construction Operation
Construction Operation
Financial review Mikkel Tørud, CFO

Financial reporting
• Segment financials on proportionate basis
• Proportionate financials adjusted for SSO’s economic interest in power companies
• Included revenues on asset management services provided by Scatec Solar to power companies
Non-financial reporting
• Scatec Solar 2017 Sustainability report now based on the GRI framework
• GRI includes reporting on a range of economic, environmental and social indicators
• Increasingly important report for all our stakeholders including project finance lenders
9
Update on Scatec Solar’s financial and non-financial reporting
10
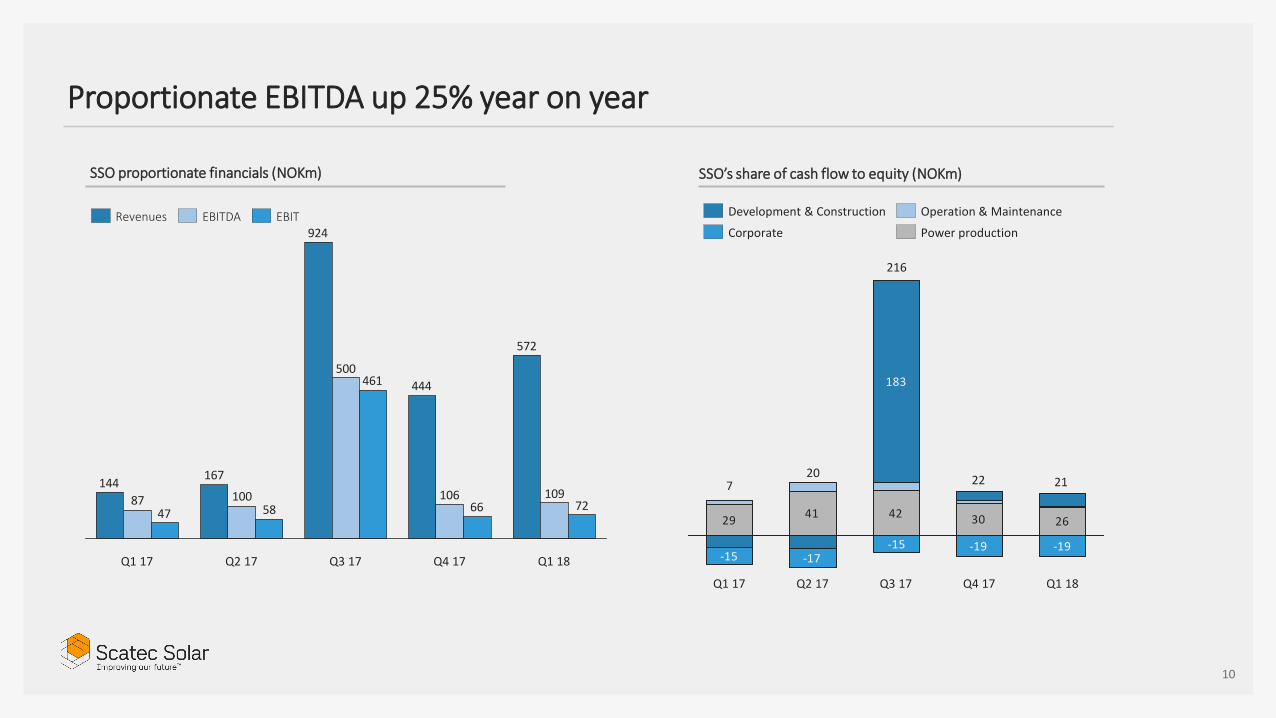
Proportionate EBITDA up 25% year on year
572
444
924
167144
109106
500
10087 7266
461
5847
Q1 18Q4 17Q3 17Q1 17 Q2 17
EBITRevenues EBITDA
SSO proportionate financials (NOKm) SSO’s share of cash flow to equity (NOKm)
42
-19-19-15
30 26
-17-15
4129
183
Q1 18Q3 17 Q4 17Q2 17Q1 17
Power production
Development & Construction
Corporate
Operation & Maintenance
720
216
22 21

11
Power Production
Stable revenues and EBITDA
Quarterly (NOKm)
• Year on year revenue growth is mainly explained by stronger ZAR and increased sale of asset management services to power companies under construction
85% 83% 84% 81% 77% 82% 82%
Last twelve months (NOKm)
554523
452431
Q1 18Q1 17
EBITDARevenues
137132
141145
127
106107119121
108
Q4 17Q2 17 Q3 17Q1 17 Q1 18
Revenues EBITDA
EBITDA

12
Operation & Maintenance
Fairly stable revenues – EBITDA down on one-offs
Quarterly (NOKm)
34% 52% 44% 25% 13% 48% 36%
Last twelve months (NOKm)
6864
25
31
Q1 18Q1 17
Revenues EBITDA
1415
2020
15
2
4
910
5
Q1 18Q2 17Q1 17 Q3 17 Q4 17
EBITDARevenues
EBITDA
• EBITDA impacted by seasonal variations and one-off cost related to establishment of central plant control centre in Cape Town
13
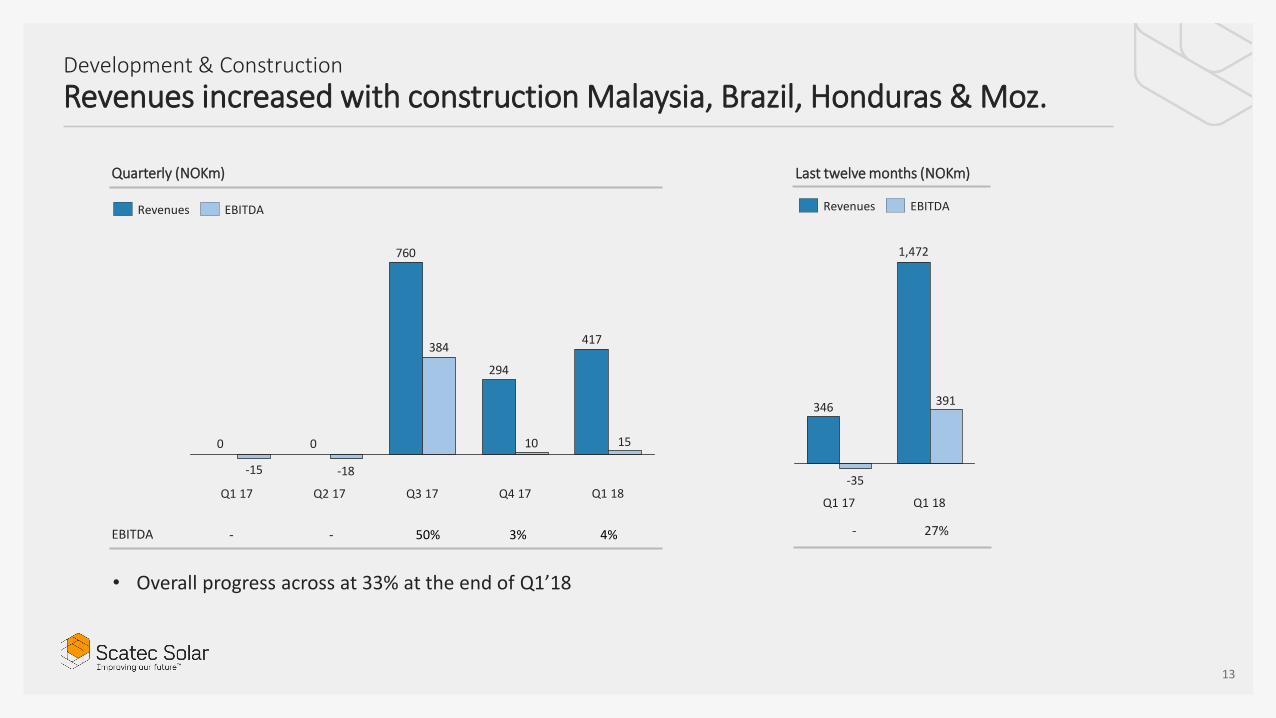
Development & Construction
Revenues increased with construction Malaysia, Brazil, Honduras & Moz.
Quarterly (NOKm)
• Overall progress across at 33% at the end of Q1’18
- - 50% 3% 4% - 27%
Last twelve months (NOKm)
346391
-35
1,472
Q1 18Q1 17
EBITDARevenues
417
294
760
1510
384
-18-15
Q1 18
0
Q2 17Q1 17 Q3 17 Q4 17
0
Revenues EBITDA
EBITDA
14
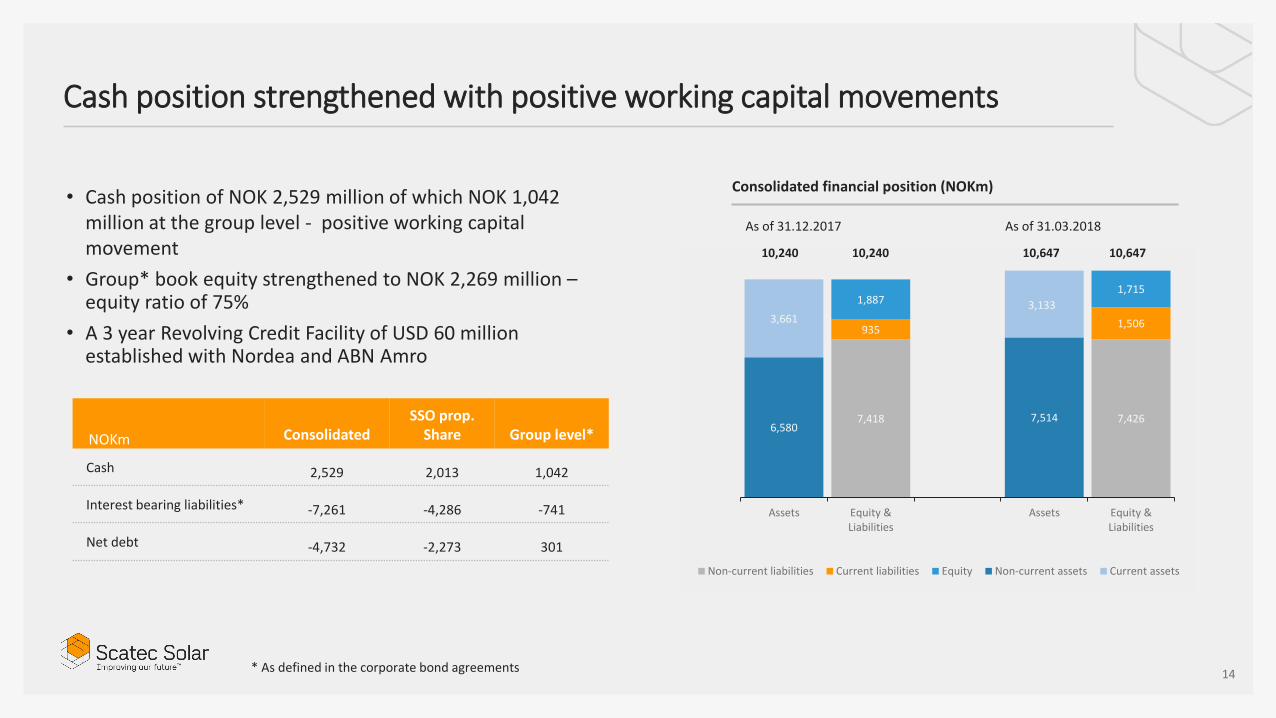
Cash position strengthened with positive working capital movements
• Cash position of NOK 2,529 million of which NOK 1,042 million at the group level - positive working capital movement
• Group* book equity strengthened to NOK 2,269 million –equity ratio of 75%
• A 3 year Revolving Credit Facility of USD 60 million established with Nordea and ABN Amro
Consolidated financial position (NOKm)
NOKm ConsolidatedSSO prop.
Share Group level*
Cash 2,529 2,013 1,042
Interest bearing liabilities* -7,261 -4,286 -741
Net debt -4,732 -2,273 301
As of 31.12.2017 As of 31.03.2018
7,418 7,426
9351,506
1,8871,715
6,5807,514
3,6613,133
Assets Equity &Liabilities
Assets Equity &Liabilities
Non-current liabilities Current liabilities Equity Non-current assets Current assets
* As defined in the corporate bond agreements
10,240 10,240 10,647 10,647
15
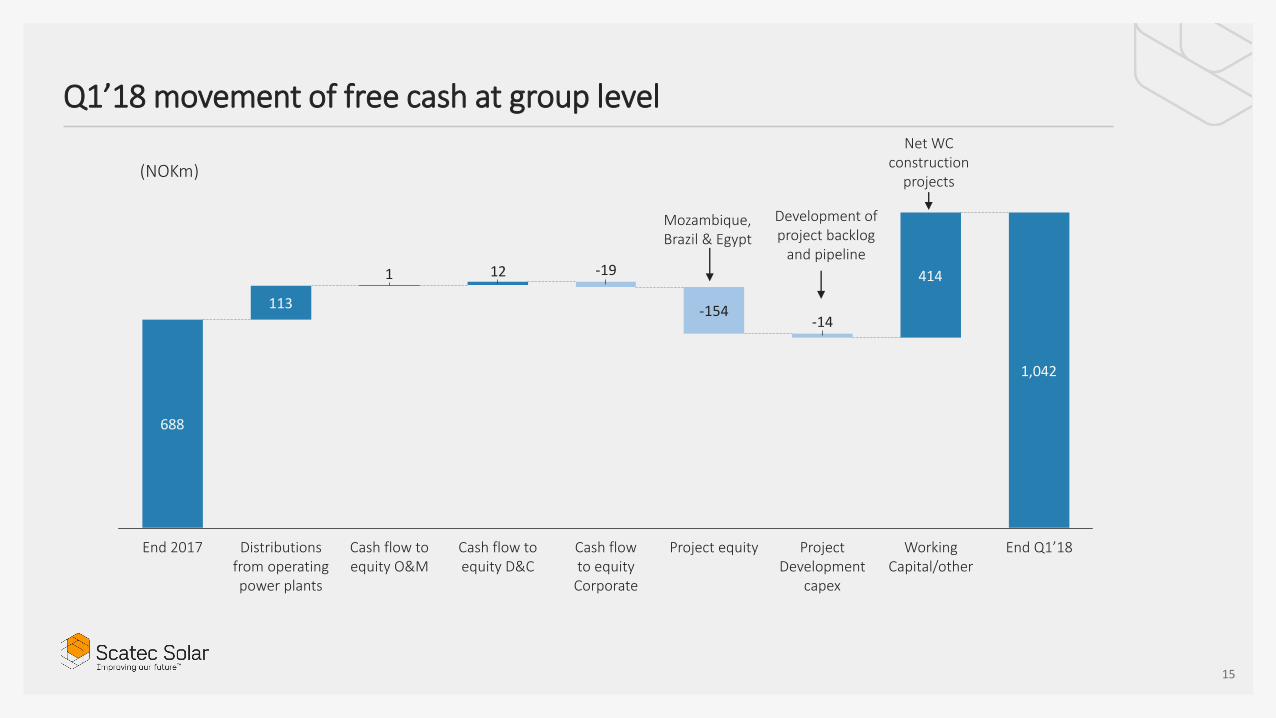
Q1’18 movement of free cash at group level
688
113
414121
1,042
End Q1’18Working Capital/other
-14
Cash flow to equity D&C
-19
Project Development
capex
Cash flow to equity Corporate
Cash flow to equity O&M
Project equity
-154
Distributions from operating power plants
End 2017
(NOKm)
Net WC construction
projects
Mozambique, Brazil & Egypt
Development of project backlog
and pipeline

NOKm
Capex 12,900
- Project debt 9,650
- Project equity 3,250
- Partners equity (43%) 1,400
- SSO equity (57%) 1,850
SSO remaining equity 850
16
Funding of projects under construction and in backlog
Scatec Solar is fully funded for investments in projects under construction and in backlog (1,183 MW) and further project development over the next 1-2 years
Uses – NOKm Sources – NOKm
Investments in projects under construction and in backlog (1,183 MW):
850
1,400-1,500350-400
TotalProject Development
200-250
Corporate & Dividends
Remaining equity end
Q1’18
Annual cash flow to equity from Power Production and O&M is expected to increase to NOK 430 - 480 million with backlog grid connected
330-370
Working Capital
Cash end Q1’18
1,040
Total
1,650-1,800
950-1050
-700
After tax D&C margin
CF from PP & OM
Summary and OutlookRaymond Carlsen, CEO
18
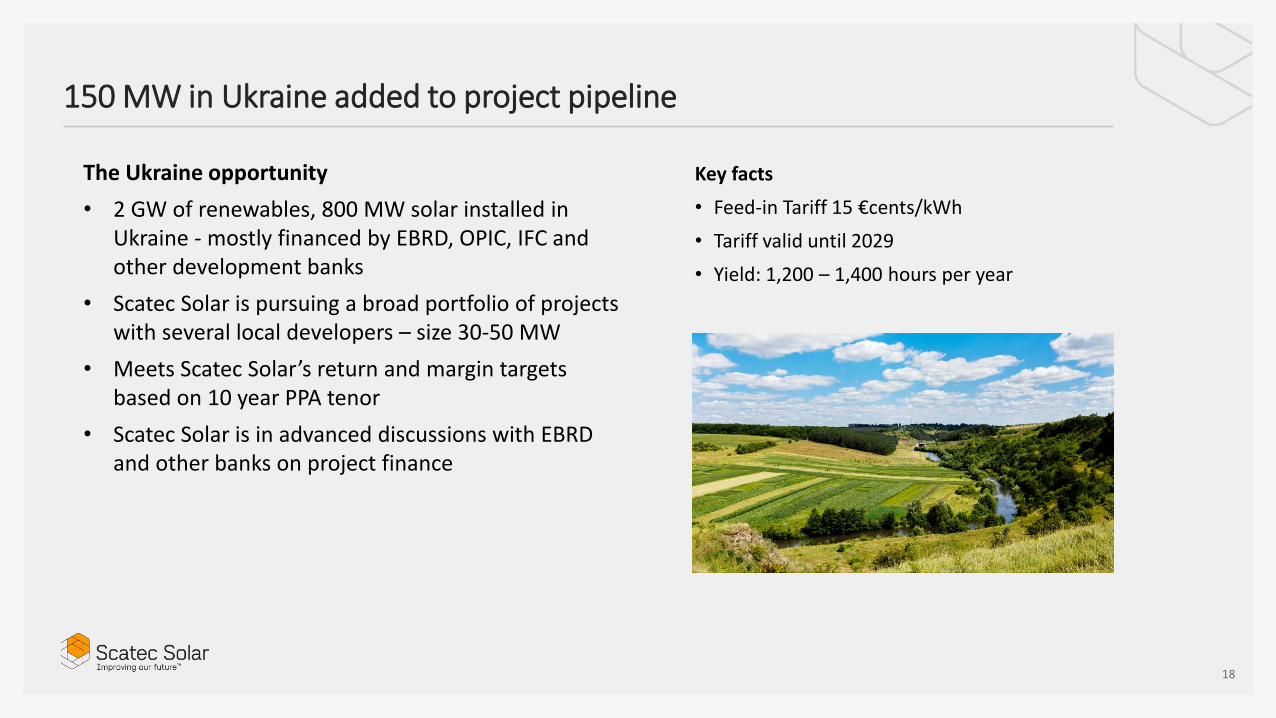
150 MW in Ukraine added to project pipeline
The Ukraine opportunity
• 2 GW of renewables, 800 MW solar installed in Ukraine - mostly financed by EBRD, OPIC, IFC and other development banks
• Scatec Solar is pursuing a broad portfolio of projects with several local developers – size 30-50 MW
• Meets Scatec Solar’s return and margin targets based on 10 year PPA tenor
• Scatec Solar is in advanced discussions with EBRD and other banks on project finance
Key facts
• Feed-in Tariff 15 €cents/kWh
• Tariff valid until 2029
• Yield: 1,200 – 1,400 hours per year

19
Summary
322
Under construction
& backlog
In operation
1,5001,183
3,600
Pipeline & opportunities
Target end ’18: in operation and under
construction
• Strong focus on delivery of current 1.1 GW construction programme
• 3.6 GW of pipeline & opportunities - a solid basis for growth beyond 2018
• Capital Markets Update on May 30, 2018
Thank You!
21
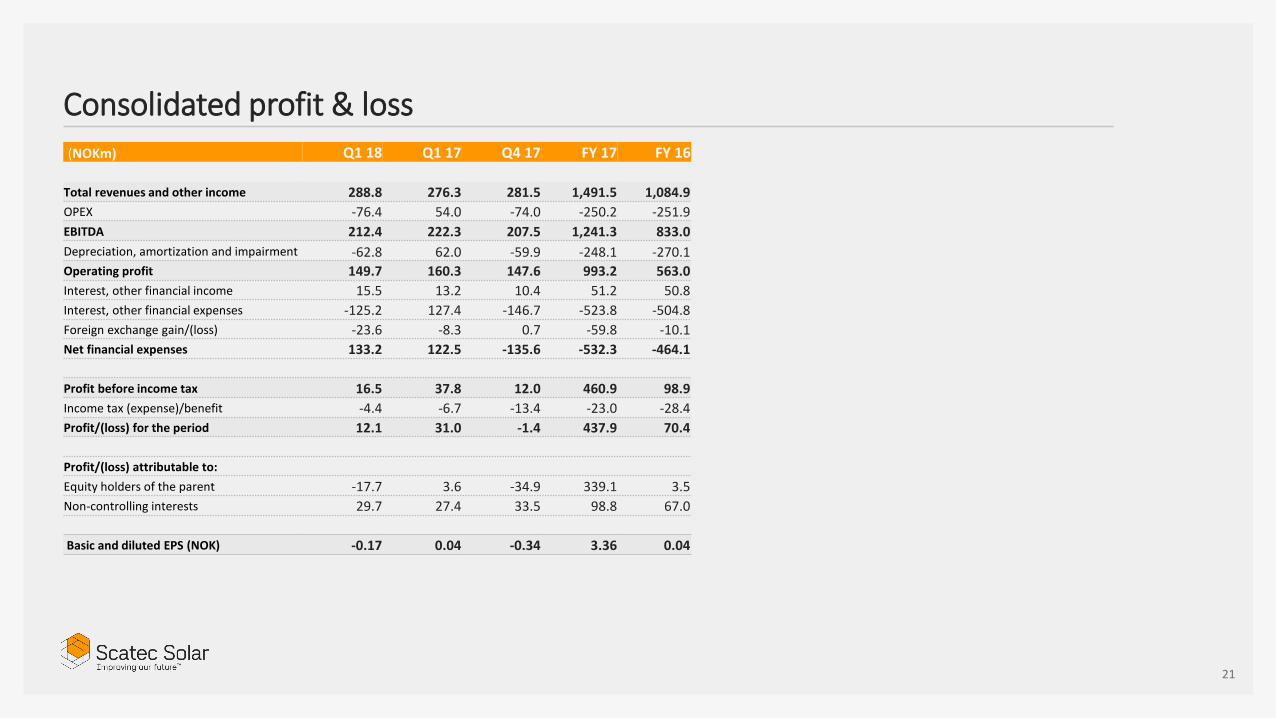
Consolidated profit & loss (NOKm) Q1 18 Q1 17 Q4 17 FY 17 FY 16
Total revenues and other income 288.8 276.3 281.5 1,491.5 1,084.9
OPEX -76.4 54.0 -74.0 -250.2 -251.9
EBITDA 212.4 222.3 207.5 1,241.3 833.0
Depreciation, amortization and impairment -62.8 62.0 -59.9 -248.1 -270.1
Operating profit 149.7 160.3 147.6 993.2 563.0
Interest, other financial income 15.5 13.2 10.4 51.2 50.8
Interest, other financial expenses -125.2 127.4 -146.7 -523.8 -504.8
Foreign exchange gain/(loss) -23.6 -8.3 0.7 -59.8 -10.1
Net financial expenses 133.2 122.5 -135.6 -532.3 -464.1
Profit before income tax 16.5 37.8 12.0 460.9 98.9
Income tax (expense)/benefit -4.4 -6.7 -13.4 -23.0 -28.4
Profit/(loss) for the period 12.1 31.0 -1.4 437.9 70.4
Profit/(loss) attributable to:
Equity holders of the parent -17.7 3.6 -34.9 339.1 3.5
Non-controlling interests 29.7 27.4 33.5 98.8 67.0
Basic and diluted EPS (NOK) -0.17 0.04 -0.34 3.36 0.04

22
Consolidated cash flow statement (NOKm) Q1 18 Q1 17 Q4 17 FY 17 FY 16
Net cash flow from operations 700.1 262.0 175.9 844.1 732.0
Net cash flow from investments -1,019.7 -44.0 -536.0 -874.1 -582.0
Net cash flow from financing -29.5 197.9 1,931.8 1,639.8 -660.0
Net increase/(decrease) in cash and cash equivalents -349.1 415.9 1,571.7 1,609.8 -510.1
Effect of exchange rate changes on cash and cash equivalents 15.4 9.3 172.5 116.1 8.7
Cash and cash equivalents at beginning of the period 2,863.1 1,137.2 1,118.9 1,137.2 1,638.6
Cash and cash equivalents at end of the period 2,529.4 1,562.5 2,863.1 2,863.1 1,137.2

23
A significant increase in D&C activities
Q1 2018
(NOKm)
Power Production
Operation & Maintenance
Development & Construction Corporate Total
Revenues 137 14 417 4 572
Gross margin 137 14 42 4 196
EBITDA 106 2 15 -14 109
EBIT 70 2 15 -14 72
EBIT (%) 51% 14% 4% - 13%
Q1 2017
(NOKm)
Power Production
Operation & Maintenance
Development & Construction Corporate Total
Revenues 127 15 - 3 144
Gross margin 127 15 - 3 144
EBITDA 108 5 -15 -11 87
EBIT 69 5 -16 -11 47
EBIT (%) 54% 33% - - 33%

24
Segment results – Q1’18
(NOKm)
PROPORTIONATE RESIDUAL OWNERSHIP
INTERESTS ELIMINATIONS CONSOLIDATEDPOWER
PRODUCTIONOPERATION &
MAINTENANCEDEVELOPMENT &
CONSTRUCTION CORPORATE TOTAL
External revenues 126.2 - - - 126.2 156.6 - 282.8
Internal revenues 10.6 13.9 417.4 4.0 445.9 34.1 -480.0 -
Net gain/(loss) from sale of project assets - - - - - - - -
Net income from JV and associated companies - - - - - 9.3 -3.2 6.0
Total revenues and other income 136.8 13.9 417.4 4.0 572.0 200.0 -483.2 288.8
Cost of sales - - -375.9 - -375.9 30.5 345.4 -
Gross profit 136.8 13.9 41.5 4.0 196.1 230.5 -137.8 288.8
Personnel expenses -4.1 -5.0 -10.8 -8.8 -28.7 0.2 - -28.5
Other operating expenses -27.0 -7.1 -15.3 -9.0 -58.4 -7.1 17.6 -47.9
EBITDA 105.7 1.8 15.4 -13.9 109.0 223.6 -120.2 212.4
Depreciation and impairment -36.0 -0.2 -0.9 -0.4 -37.5 -38.7 13.5 -62.8
Operating profit 69.7 1.5 14.5 -14.2 71.5 184.9 -106.7 149.7
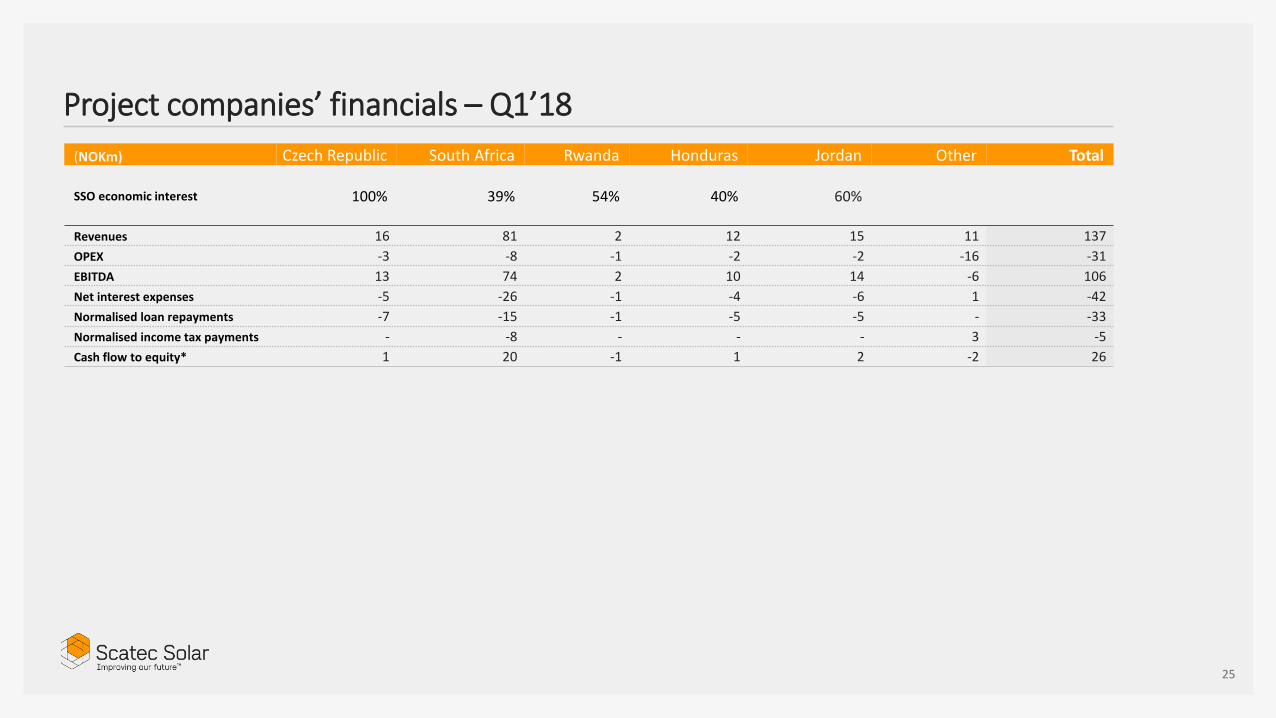
(NOKm) Czech Republic South Africa Rwanda Honduras Jordan Other Total
SSO economic interest 100% 39% 54% 40% 60%
Revenues 16 81 2 12 15 11 137
OPEX -3 -8 -1 -2 -2 -16 -31
EBITDA 13 74 2 10 14 -6 106
Net interest expenses -5 -26 -1 -4 -6 1 -42
Normalised loan repayments -7 -15 -1 -5 -5 - -33
Normalised income tax payments - -8 - - - 3 -5
Cash flow to equity* 1 20 -1 1 2 -2 26
25
Project companies’ financials – Q1’18
26
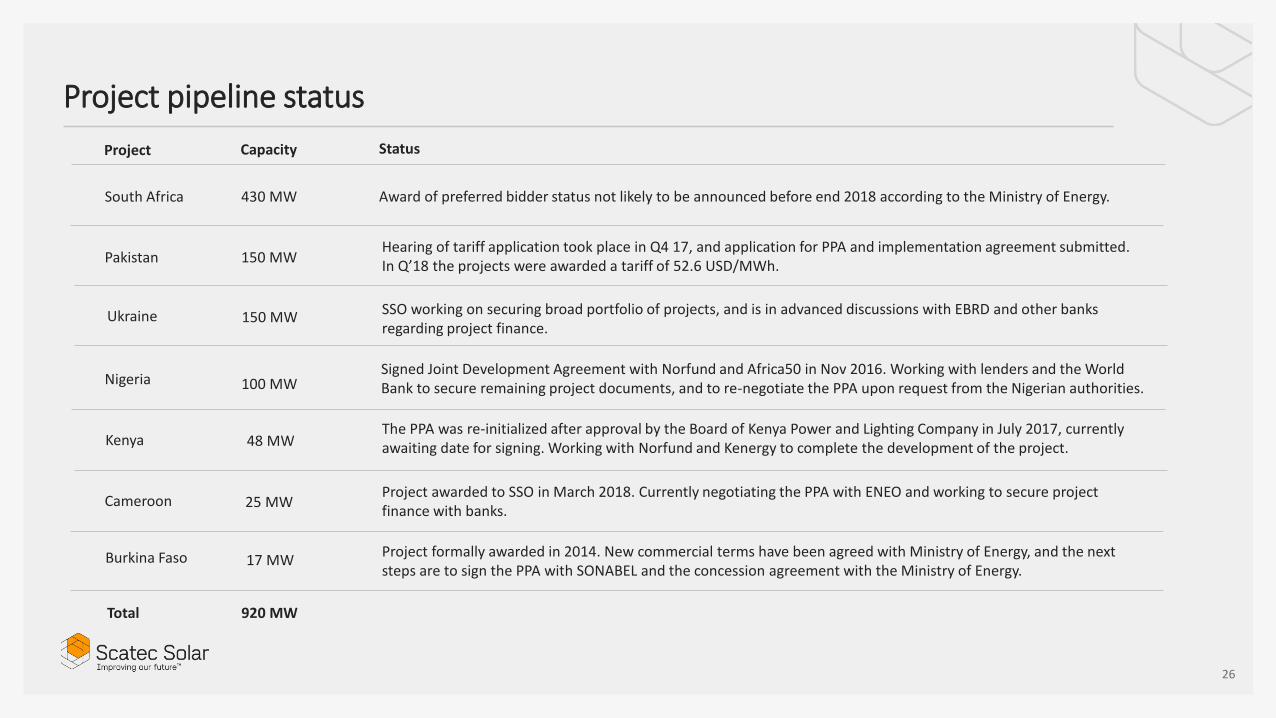
Project pipeline status
Capacity Status
Award of preferred bidder status not likely to be announced before end 2018 according to the Ministry of Energy.
Project
430 MWSouth Africa
Hearing of tariff application took place in Q4 17, and application for PPA and implementation agreement submitted. In Q’18 the projects were awarded a tariff of 52.6 USD/MWh.
150 MWPakistan
SSO working on securing broad portfolio of projects, and is in advanced discussions with EBRD and other banks regarding project finance.
150 MWUkraine
100 MWNigeria
48 MWKenya
Signed Joint Development Agreement with Norfund and Africa50 in Nov 2016. Working with lenders and the World Bank to secure remaining project documents, and to re-negotiate the PPA upon request from the Nigerian authorities.
The PPA was re-initialized after approval by the Board of Kenya Power and Lighting Company in July 2017, currently awaiting date for signing. Working with Norfund and Kenergy to complete the development of the project.
25 MWCameroon
Project formally awarded in 2014. New commercial terms have been agreed with Ministry of Energy, and the next steps are to sign the PPA with SONABEL and the concession agreement with the Ministry of Energy.
17 MWBurkina Faso
920 MWTotal
Project awarded to SSO in March 2018. Currently negotiating the PPA with ENEO and working to secure project finance with banks.
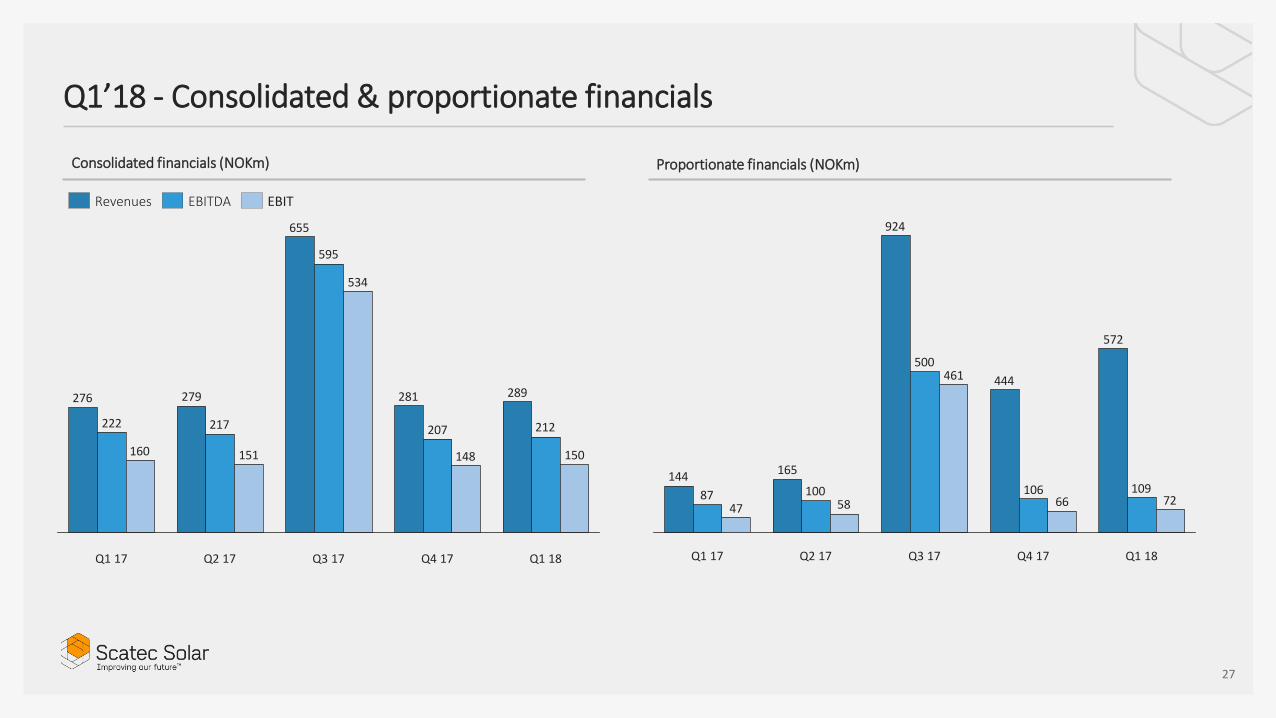
27
Q1’18 - Consolidated & proportionate financials
289281
655
279276
212207
595
217222
150148
534
151160
Q1 17 Q2 17 Q4 17Q3 17 Q1 18
Consolidated financials (NOKm)
572
444
924
165144109106
500
10087 7266
461
5847
Q4 17 Q1 18Q3 17Q2 17Q1 17
Proportionate financials (NOKm)
Revenues EBITDA EBIT


