Royal Bank of Canada | First Quarter 2018 Royal Bank of Canada first quarter 2018 results All amounts are in Canadian dollars and are based on financial statements prepared in compliance with International Accounting Standard 34 Interim Financial Reporting, unless otherwise noted. Effective November 1, 2017, we adopted IFRS 9 Financial Instruments. Prior period amounts are in accordance with IAS 39 Financial Instruments: Recognition and Measurement. Net Income $3.0 Billion Includes charge related to U.S. Tax Reform (1) of $178 million Diluted EPS $2.01 Includes charge related to U.S. Tax Reform (1) of $0.12 ROE 17.4% Balanced capital deployment CET1 Ratio 11.0% $920+ million of share repurchases in Q1 2018 TORONTO, February 23, 2018 – Royal Bank of Canada (RY on TSX and NYSE) today reported net income of $3,012 million for the first quarter ended January 31, 2018, which includes the impact of the U.S. Tax Reform (1) of $178 million, or $0.12 per share, primarily related to the write-down of net deferred tax assets. Net income was down $15 million from a year ago and diluted EPS (2) of $2.01 was up 2%. Excluding last year’s specified item related to the gain on sale of the U.S. operations of Moneris (3) , net income was up 7% and EPS was up 10% from a year ago. Results in the quarter were driven by strong earnings in Personal & Commercial Banking, Capital Markets, Wealth Management and Investor & Treasury Services. This quarter’s strong performance also reflects stable credit quality, with a provision for credit losses (PCL) on impaired loans ratio of 23 basis points (bps) compared to 22 bps a year ago, and a total PCL ratio of 24 bps, this quarter. Compared to last quarter, net income was up $175 million or 6%, mainly reflecting higher earnings in Capital Markets, Personal & Commercial Banking, Wealth Management and Investor & Treasury Services, partially offset by lower earnings in Insurance and the write-down associated with the U.S. Tax Reform (1) . “Strong client activity and volume growth across most businesses drove our first quarter earnings of $3 billion while we absorbed the write-down related to the U.S. Tax Reform. We invested in our businesses to support clients, and repurchased over $920 million of common shares. In addition, I am pleased to announce a 3% increase to our quarterly dividend,” said Dave McKay, RBC President and Chief Executive Officer. “Our strategy for sustainable growth is built on prudently managing risks and effectively deploying capital for strong returns through the cycle. We will continue to invest smartly and work hard to earn the trust of our clients, employees and communities.” Q1 2018 compared to Q1 2017 • Net income of $3,012 million • Diluted EPS of $2.01 • ROE (4) of 17.4% • CET1 (5) ratio of 11.0% → 0% ↑ 2% ↓ 60 bps → 0% Excluding specified item (3) : • Net income of $3,012 million • Diluted EPS of $2.01 • ROE of 17.4% ↑ 7% ↑ 10% ↑ 70 bps Q1 2018 compared to Q4 2017 • Net income of $3,012 million • Diluted EPS of $2.01 • ROE of 17.4% • CET1 ratio of 11.0% ↑ 6% ↑ 7% ↑ 80 bps ↑ 10 bps (1) In December 2017, the U.S. H.R. 1 (U.S. Tax Reform) was passed into law. (2) Earnings per share (EPS). (3) The specified item reflects our share of a gain related to the sale of the U.S. operations of Moneris Solutions Corporation (Moneris) to Vantiv, Inc., which was $212 million (before- and after- tax). Results and measures excluding the specified item are non-GAAP measures. For further information, including a reconciliation, refer to the Key performance and non-GAAP measures section of this Q1 2018 Report to Shareholders. (4) Return on Equity (ROE). This measure does not have a standardized meaning under GAAP. For further information, refer to the Key performance and non-GAAP measures section of this Q1 2018 Report to Shareholders. (5) Common Equity Tier 1 (CET1) ratio. Table of contents 1 First quarter highlights 2 Management’s Discussion and Analysis 2 Caution regarding forward-looking statements 2 Overview and outlook 2 About Royal Bank of Canada 3 Selected financial and other highlights 4 Economic, market and regulatory review and outlook 5 Financial performance 5 Overview 9 Business segment results 9 How we measure and report our business segments 10 Key performance and non-GAAP measures 13 Personal & Commercial Banking 14 Wealth Management 15 Insurance 16 Investor & Treasury Services 17 Capital Markets 18 Corporate Support 19 Quarterly results and trend analysis 21 Financial condition 21 Condensed balance sheets 22 Off-balance sheet arrangements 22 Risk management 22 Credit risk 30 Market risk 34 Liquidity and funding risk 41 Capital management 45 Capital, liquidity, and other regulatory developments 46 Accounting and control matters 46 Summary of accounting policies and estimates 46 Change in accounting policies and disclosures 46 Controls and procedures 46 Related party transactions 47 Enhanced Disclosure Task Force recommendations index 48 Interim Condensed Consolidated Financial Statements (unaudited) 53 Notes to the Interim Condensed Consolidated Financial Statements (unaudited) 80 Shareholder information
Transcript
Royal Bank of Canada |First Quarter 2018
Royal Bank of Canada first quarter 2018 results
All amounts are in Canadian dollars and are based on financial statements prepared in compliance with International Accounting Standard 34 Interim FinancialReporting, unless otherwise noted. Effective November 1, 2017, we adopted IFRS 9 Financial Instruments. Prior period amounts are in accordance with IAS 39Financial Instruments: Recognition and Measurement.
Net Income$3.0 Billion
Includes charge related to U.S.Tax Reform(1) of $178 million
Diluted EPS$2.01
Includes charge related to U.S.Tax Reform(1) of $0.12
ROE17.4%
Balancedcapital deployment
CET1 Ratio11.0%
$920+ million of sharerepurchases in Q1 2018
TORONTO, February 23, 2018 – Royal Bank of Canada (RY on TSX and NYSE) today reported net income of $3,012 million for the first quarter endedJanuary 31, 2018, which includes the impact of the U.S. Tax Reform(1) of $178 million, or $0.12 per share, primarily related to the write-down of netdeferred tax assets. Net income was down $15 million from a year ago and diluted EPS(2) of $2.01 was up 2%. Excluding last year’s specified itemrelated to the gain on sale of the U.S. operations of Moneris(3), net income was up 7% and EPS was up 10% from a year ago.
Results in the quarter were driven by strong earnings in Personal & Commercial Banking, Capital Markets, Wealth Management and Investor &Treasury Services. This quarter’s strong performance also reflects stable credit quality, with a provision for credit losses (PCL) on impaired loans ratioof 23 basis points (bps) compared to 22 bps a year ago, and a total PCL ratio of 24 bps, this quarter.
Compared to last quarter, net income was up $175 million or 6%, mainly reflecting higher earnings in Capital Markets, Personal & Commercial Banking,Wealth Management and Investor & Treasury Services, partially offset by lower earnings in Insurance and the write-down associated with the U.S. TaxReform(1).
“Strong client activity and volume growth across most businesses drove our first quarter earnings of $3 billion while we absorbed the write-downrelated to the U.S. Tax Reform. We invested in our businesses to support clients, and repurchased over $920 million of common shares. In addition,I am pleased to announce a 3% increase to our quarterly dividend,” said Dave McKay, RBC President and Chief Executive Officer. “Our strategy forsustainable growth is built on prudently managing risks and effectively deploying capital for strong returns through the cycle. We will continue toinvest smartly and work hard to earn the trust of our clients, employees and communities.”
Q1 2018compared toQ1 2017
• Net income of $3,012 million• Diluted EPS of $2.01• ROE(4) of 17.4%• CET1(5) ratio of 11.0%
→ 0%↑ 2%↓ 60 bps→ 0%
Excluding specified item(3):• Net income of $3,012 million• Diluted EPS of $2.01• ROE of 17.4%
↑ 7%↑ 10%↑ 70 bps
Q1 2018compared toQ4 2017
• Net income of $3,012 million• Diluted EPS of $2.01• ROE of 17.4%• CET1 ratio of 11.0%
↑ 6%↑ 7%↑ 80 bps↑ 10 bps
(1) In December 2017, the U.S. H.R. 1 (U.S. Tax Reform) was passed into law.(2) Earnings per share (EPS).(3) The specified item reflects our share of a gain related to the sale of the U.S. operations of Moneris Solutions Corporation (Moneris) to Vantiv, Inc., which was $212 million (before- and after-
tax). Results and measures excluding the specified item are non-GAAP measures. For further information, including a reconciliation, refer to the Key performance and non-GAAP measuressection of this Q1 2018 Report to Shareholders.
(4) Return on Equity (ROE). This measure does not have a standardized meaning under GAAP. For further information, refer to the Key performance and non-GAAP measures section of this Q1 2018Report to Shareholders.
(5) Common Equity Tier 1 (CET1) ratio.
Table of contents1 First quarter highlights2 Management’s Discussion and Analysis2 Caution regarding forward-looking statements2 Overview and outlook
2 About Royal Bank of Canada3 Selected financial and other highlights4 Economic, market and regulatory review
and outlook5 Financial performance
5 Overview9 Business segment results
9 How we measure and report our businesssegments
10 Key performance and non-GAAP measures13 Personal & Commercial Banking
14 Wealth Management15 Insurance16 Investor & Treasury Services17 Capital Markets18 Corporate Support
19 Quarterly results and trend analysis21 Financial condition
Statements (unaudited)53 Notes to the Interim Condensed Consolidated
Financial Statements (unaudited)80 Shareholder information
2 Royal Bank of Canada First Quarter 2018
Management’s Discussion and Analysis
Management’s Discussion and Analysis (MD&A) is provided to enable a reader to assess our results of operations and financialcondition for the three month period ended or as at January 31, 2018, compared to the corresponding period in the prior fiscal yearand the three month period ended October 31, 2017. This MD&A should be read in conjunction with our unaudited InterimCondensed Consolidated Financial Statements for the quarter ended January 31, 2018 (Condensed Financial Statements) and relatednotes and our 2017 Annual Report. This MD&A is dated February 22, 2018. All amounts are in Canadian dollars, unless otherwisespecified, and are based on financial statements prepared in accordance with International Financial Reporting Standards (IFRS) asissued by the International Accounting Standards Board (IASB), unless otherwise noted.
Additional information about us, including our 2017 Annual Information Form, is available free of charge on our website at rbc.com/investorrelations, on the Canadian Securities Administrators’ website at sedar.com and on the EDGAR section of the United States(U.S.) Securities and Exchange Commission’s (SEC) website at sec.gov.
Information contained in or otherwise accessible through the websites mentioned does not form part of this report. All references inthis report to websites are inactive textual references and are for your information only.
Caution regarding forward-looking statements
From time to time, we make written or oral forward-looking statements within the meaning of certain securities laws, including the “safeharbour” provisions of the United States Private Securities Litigation Reform Act of 1995 and any applicable Canadian securitieslegislation. We may make forward-looking statements in this Q1 2018 Report to Shareholders, in other filings with Canadian regulatorsor the SEC, in other reports to shareholders and in other communications. Forward-looking statements in this document include, but arenot limited to, statements relating to our financial performance objectives, vision and strategic goals, the Economic, market, andregulatory review and outlook for Canadian, U.S., European and global economies, the regulatory environment in which we operate, theStrategic priorities and Outlook sections for each of our business segments, and the risk environment including our liquidity andfunding risk, and includes our President and Chief Executive Officer’s statements. The forward-looking information contained in thisdocument is presented for the purpose of assisting the holders of our securities and financial analysts in understanding our financialposition and results of operations as at and for the periods ended on the dates presented, as well as our financial performanceobjectives, vision and strategic goals, and may not be appropriate for other purposes. Forward-looking statements are typicallyidentified by words such as “believe”, “expect”, “foresee”, “forecast”, “anticipate”, “intend”, “estimate”, “goal”, “plan” and “project”and similar expressions of future or conditional verbs such as “will”, “may”, “should”, “could” or “would”.
By their very nature, forward-looking statements require us to make assumptions and are subject to inherent risks anduncertainties, which give rise to the possibility that our predictions, forecasts, projections, expectations or conclusions will not proveto be accurate, that our assumptions may not be correct and that our financial performance objectives, vision and strategic goals willnot be achieved. We caution readers not to place undue reliance on these statements as a number of risk factors could cause ouractual results to differ materially from the expectations expressed in such forward-looking statements. These factors – many of whichare beyond our control and the effects of which can be difficult to predict – include: credit, market, liquidity and funding, insurance,operational, regulatory compliance, strategic, reputation, legal and regulatory environment, competitive and systemic risks and otherrisks discussed in the risks sections of our 2017 Annual Report and the Risk management section of this Q1 2018 Report toShareholders; including global uncertainty and volatility, elevated Canadian housing prices and household indebtedness, informationtechnology and cyber risk, including the risk of cyber-attacks or other information security events at or impacting our service providersor other third parties with whom we interact, regulatory change, technological innovation and non-traditional competitors, globalenvironmental policy and climate change, changes in consumer behaviour, the end of quantitative easing, the business andeconomic conditions in the geographic regions in which we operate, the effects of changes in government fiscal, monetary and otherpolicies, tax risk and transparency and environmental and social risk.
We caution that the foregoing list of risk factors is not exhaustive and other factors could also adversely affect our results. Whenrelying on our forward-looking statements to make decisions with respect to us, investors and others should carefully consider theforegoing factors and other uncertainties and potential events. Material economic assumptions underlying the forward-lookingstatements contained in this Q1 2018 Report to Shareholders are set out in the Overview and outlook section and for each businesssegment under the Strategic priorities and Outlook headings in our 2017 Annual Report, as updated by the Overview and outlooksection of this Q1 2018 Report to Shareholders. Except as required by law, we do not undertake to update any forward-lookingstatement, whether written or oral, that may be made from time to time by us or on our behalf.
Additional information about these and other factors can be found in the risk sections of our 2017 Annual Report and the Riskmanagement section of this Q1 2018 Report to Shareholders.
Overview and outlook
About Royal Bank of Canada
Royal Bank of Canada is a global financial institution with a purpose-driven, principles-led approach to delivering leadingperformance. Our success comes from the 81,000+ employees who bring our vision, values and strategy to life so we can help ourclients thrive and communities prosper. As Canada’s biggest bank, and one of the largest in the world based on market capitalization,we have a diversified business model with a focus on innovation and providing exceptional experiences to our 16 million clients inCanada, the U.S. and 34 other countries. Learn more at rbc.com.
Royal Bank of Canada First Quarter 2018 3
Selected financial and other highlights
As at or for the three months ended Change January 31, 2018 vs.
(Millions of Canadian dollars, except per share, number of and percentage amounts) (1)
Return on common equity (ROE) (4), (5) 17.4% 16.6% 18.0% 80 bps (60) bpsAverage common equity (4) $ 66,850 $ 65,900 $ 64,650 $ 950 $ 2,200Net interest margin (NIM) – on average earning assets (4) 1.65% 1.72% 1.73% (7) bps (8) bpsPCL as a % of average net loans and acceptances (6) 0.24% 0.17% 0.22% 7 bps 2 bpsPCL on impaired loans as a % of average net loans and
acceptances (6) 0.23% 0.17% 0.22% 6 bps 1 bpsGross impaired loans (GIL) as a % of loans and acceptances (7), (8) 0.45% 0.46% 0.66% (1) bps (21) bpsLiquidity coverage ratio (LCR) (9) 122% 122% 123% – bps (100) bps
Capital ratios and Leverage ratio (10)Common Equity Tier 1 (CET1) ratio 11.0% 10.9% 11.0% 10 bps – bpsTier 1 capital ratio 12.4% 12.3% 12.6% 10 bps (20) bpsTotal capital ratio 14.4% 14.2% 14.7% 20 bps (30) bpsLeverage ratio 4.2% 4.4% 4.4% (20) bps (20) bps
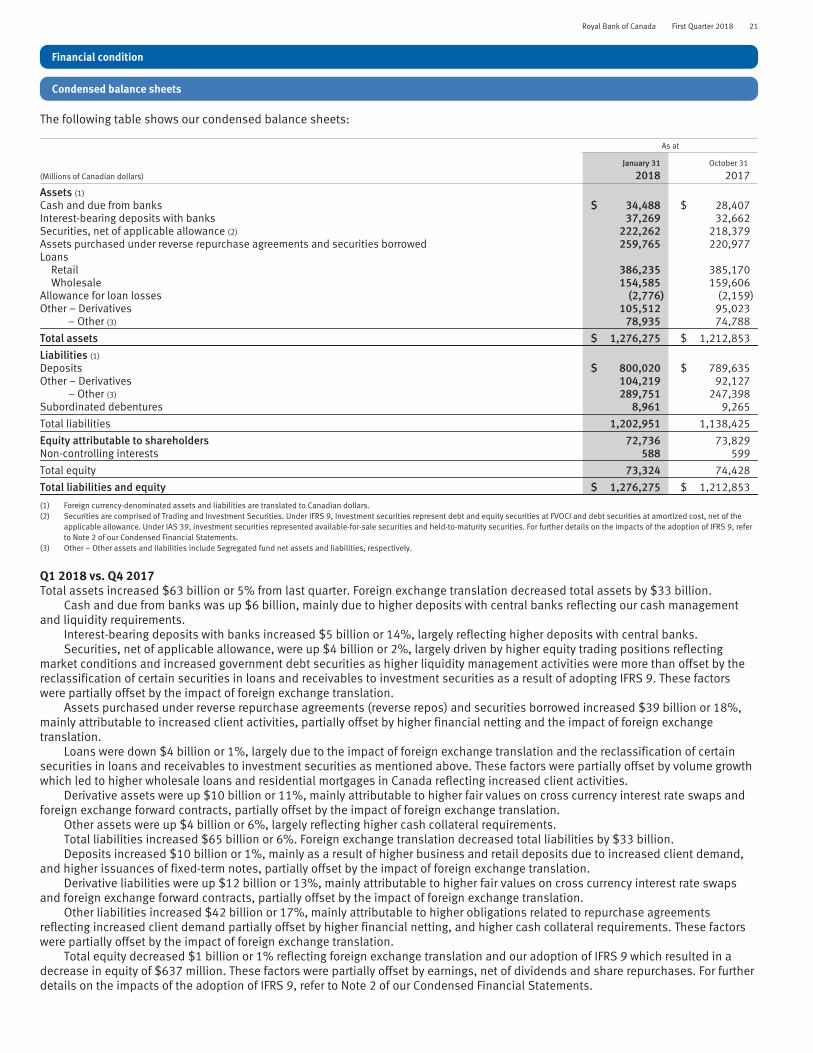
Selected balance sheet and other information (11)Total assets $ 1,276,275 $ 1,212,853 $ 1,161,766 $ 63,422 $ 114,509Securities, net of applicable allowance 222,262 218,379 224,827 3,883 (2,565)Loans, net of allowance for loan losses 538,044 542,617 522,010 (4,573) 16,034Derivative related assets 105,512 95,023 97,419 10,489 8,093Deposits 800,020 789,635 757,512 10,385 42,508Common equity 66,430 67,416 64,853 (986) 1,577Total capital risk-weighted assets 466,758 474,478 443,940 (7,720) 22,818Assets under management (AUM) 656,700 639,900 584,100 16,800 72,600Assets under administration (AUA) (12) 5,653,500 5,473,300 4,934,600 180,200 718,900
Common share informationShares outstanding (000s) – average basic 1,451,781 1,457,855 1,484,262 (6,074) (32,481)
– average diluted 1,458,714 1,464,916 1,492,350 (6,202) (33,636)– end of period 1,444,065 1,452,898 1,475,540 (8,833) (31,475)
Period average US$ equivalent of C$1.00 (15) $ 0.794 $ 0.792 $ 0.752 $ 0.002 $ 0.042Period-end US$ equivalent of C$1.00 $ 0.813 $ 0.775 $ 0.769 $ 0.038 $ 0.044(1) Effective November 1, 2017, we adopted IFRS 9 Financial Instruments. Results from periods prior to November 1, 2017 are reported in accordance with IAS 39 Financial Instruments: Recognition and
Measurement in this Q1 2018 Report to Shareholders. For further details on the impacts of the adoption of IFRS 9 including the description of accounting policies selected, refer to Note 2 of ourCondensed Financial Statements.
(2) Effective Q4 2017, service fees and other costs incurred in association with certain commissions and fees earned are presented on a gross basis in non-interest expense. Comparative amounts havebeen reclassified to conform with this presentation.
(3) Under IFRS 9, PCL relates primarily to loans, acceptances, and commitments, and also applies to all financial assets except for those classified or designated as fair value through profit or loss(FVTPL) and equity securities designated as fair value through other comprehensive income (FVOCI). Prior to the adoption of IFRS 9, PCL related only to loans, acceptances, and commitments. PCL onloans, acceptances, and commitments is comprised of PCL on impaired loans (Stage 3 PCL under IFRS 9 and PCL on impaired loans under IAS 39) and PCL on performing loans (Stage 1 and Stage 2PCL under IFRS 9 and PCL on loans not yet identified as impaired under IAS 39). Refer to the Credit risk section and Note 2 of our Condensed Financial Statements for further details.
(4) Average amounts are calculated using methods intended to approximate the average of the daily balances for the period. This includes Average common equity used in the calculation of ROE. Forfurther details, refer to the Key performance and non-GAAP measures section.
(5) These measures may not have a standardized meaning under generally accepted accounting principles (GAAP) and may not be comparable to similar measures disclosed by other financialinstitutions. For further details, refer to the Key performance and non-GAAP measures section.
(6) PCL represents PCL on loans, acceptances and commitments. PCL on impaired loans represents Stage 3 PCL under IFRS 9 and PCL on impaired loans under IAS 39. Stage 3 PCL under IFRS 9 iscomprised of lifetime credit losses of credit-impaired loans, acceptances and commitments.
(7) Effective November 1, 2017, GIL excludes $229 million of ACI loans related to our acquisition of City National Bank (City National) that have returned to performing status. As at January 31, 2018,$24 million of ACI loans that remain impaired are included in GIL. As at October 31, 2017 and January 31, 2017, GIL includes $256 million and $348 million related to the ACI loans portfolio fromour acquisition of City National. ACI loans included in GIL added 0 bps, 5 bps and 6 bps to our January 31, 2018, October 31, 2017, and January 31, 2017 GIL ratios, respectively. For further details,refer to Note 5 of our Condensed Financial Statements.
(8) Effective November 1, 2017, the definition of gross impaired loans has been shortened for certain products to align with a definition of default of 90 days past due under IFRS 9, resulting in anincrease in GIL of $134 million.
(9) LCR is calculated using the Basel III Liquidity Adequacy Requirements (LAR) guideline. For further details, refer to the Liquidity and funding risk section.(10) Capital and Leverage ratios presented above are on an “all-in” basis. The Leverage ratio is a regulatory measure under the Basel III framework. For further details, refer to the Capital management section.(11) Represents period-end spot balances.(12) AUA includes $18.2 billion and $9.1 billion (October 31, 2017 – $18.4 billion and $8.4 billion; January 31, 2017 – $18.7 billion and $8.4 billion) of securitized residential mortgages and credit card
loans, respectively.(13) Defined as dividends per common share divided by the average of the high and low share price in the relevant period.(14) Based on TSX closing market price at period-end.(15) Average amounts are calculated using month-end spot rates for the period.
4 Royal Bank of Canada First Quarter 2018
Economic, market and regulatory review and outlook – data as at February 22, 2018
The predictions and forecasts in this section are based on information and assumptions from sources we consider reliable. If thisinformation or these assumptions are not accurate, actual economic outcomes may differ materially from the outlook presented inthis section.
Economic and market review and outlookCanadaThe Canadian economy is estimated to have grown by 1.9%1 during the last calendar quarter of 2017, which is slightly above the priorquarter, primarily as a result of increased consumer spending and business investment. The unemployment rate in January was 5.9%,up slightly from December’s rate of 5.8%, which matched the lowest rate since 1976. After strong existing home sales at the end ofcalendar 2017, January 2018 resales declined reflecting a recent regulatory change to mortgage qualifications that took effect at thebeginning of the calendar year. Businesses have continued to increase investment spending despite concerns surroundingrenegotiation of the North American Free Trade Agreement (NAFTA). After January’s interest rate hike of 25 basis points to 1.25%, weexpect the Bank of Canada (BoC) to continue to raise rates. Despite higher interest rates and tight labour markets conditions, weexpect the Canadian economy to continue to grow in calendar 2018.
U.S.Overall growth in the U.S. economy slowed to 2.6%1 in the fourth calendar quarter of 2017, following growth of 3.2%1 in the previouscalendar quarter. Consumer spending remained strong amid low unemployment and positive wealth effects from rising equity marketsand home prices. We expect the U.S. economy to continue to expand as the recent tax reforms are expected to encourage businessinvestment and consumer spending. With the economy operating at full capacity, we expect the Federal Reserve (Fed) will continuewith gradual rate hikes.
EuropeThe Euro area grew at a rate of 0.6% in the last calendar quarter of 2017, marking a fifth consecutive quarter of growth. This positivemomentum is expected to continue throughout 2018, as business sentiment improves. We expect the European Central Bank to holdoff on raising rates in the near term. Despite uncertainty surrounding Brexit, the Bank of England has indicated a tightening bias. Assuch, we are forecasting higher interest rates in the U.K.
Financial marketsFinancial conditions were strong in early calendar 2018. Global equity markets rallied based on an optimistic growth outlook, with anumber of indices posting record highs in mid-January. Bond yields rose further over the second half of the fiscal quarter as marketsanticipate less accommodative central bank policies in a number of economies. To counteract inflationary pressures, central bankshave moderated their accommodative policies, including recent interest rate hikes announced in January 2018 and December 2017by the BoC and the Fed, respectively.
More recently, the low equity market volatility experienced globally throughout calendar 2017 ended abruptly. Among otherthings, the economic impact of rising interest rates and inflationary concerns has triggered equity markets to fall from their earlierpeaks.
Regulatory environmentWe continue to monitor and prepare for regulatory developments and changes in a manner that seeks to ensure compliance with newrequirements while mitigating any adverse business or financial impacts. Such impacts could result from new or amended laws orregulations and the expectations of those who enforce them. The following provides a high-level summary of some of the keyregulatory changes that have potential to increase our operational, compliance, and technology costs and to impact our profitability,as well as to potentially increase the cost and complexity of our operations.
United States Tax ReformIn December 2017, the U.S. H.R. 1 (U.S. Tax Reform) was passed into law. The resulting changes to the U.S. Internal Revenue Codeinclude: a reduction in the corporate income tax rate from 35% to 21%, limits on the deductibility of net interest expense, a new BaseErosion Anti-abuse Tax, a prohibition on deducting FDIC premium fees and entertainment expenses, and authorization of immediateexpensing of many capital expenditures. As applicable to us, the reduced corporate tax rate was phased in beginning January 1, 2018.Various effective dates apply to the other provisions. The reduction in the corporate tax rate resulted in a write-down of our netdeferred tax assets and reductions to our ongoing current tax expense. Predicting the impact of the U.S. Tax Reform is uncertainbecause elements of the U.S. Tax Reform are subject to guidance to be provided by the U.S. Treasury Department.
Canadian Housing Market and Consumer DebtOSFI’s revised B-20 Guideline came into effect on January 1, 2018, which further tightens lending standards in an attempt to maintaina sustainable level of Canadian household debt. Changes to the guideline include a higher minimum qualifying rate (or “stress test”)for mortgage borrowers with a down payment of more than 20%, and a broader loan-to-value (LTV) and lending limit frameworkdifferentiated by various ratio limits and risk factors. The government continues to explore other initiatives, such as an assessment bythe Department of Finance regarding a lender risk-sharing model.
(1) Annualized rate
Royal Bank of Canada First Quarter 2018 5
Negotiations on North American Free Trade Agreement (NAFTA)Canada, Mexico and the U.S. remain engaged in negotiations on potential changes to NAFTA. The existing chapters in NAFTA, such asthose relating to financial services, cross-border trade, and temporary entry rules, could be changed as a result of these discussions.In its current state, negotiating parties continue to debate a number of competing priorities and the outcome remains unclear.Changes to NAFTA may adversely affect certain of our businesses, either directly or indirectly, as a result of adverse effects onsegments of the Canadian and U.S. economies.
Consumer ProtectionThe Canadian federal government is exploring a number of issues relating to consumer protection. For example, regulatory agencieshave undertaken reviews of sales practices at Canadian banks and of provincial consumer protection rules. The Financial ConsumerAgency of Canada is expected to release a full report on sales practices by March 2018.
United States Regulatory InitiativesPolicymakers are considering reforms to various U.S. regulations, certain of which may, if implemented, result in reduced complexityof the U.S. regulatory framework and lower compliance costs. These include possible reforms to the Volcker Rule; the Department ofLabor fiduciary rule for brokers and advisors; the regulation of over-the-counter (OTC) derivatives; and key aspects of the capital,leverage, liquidity, and oversight framework in the U.S. (e.g. enhanced prudential standards applicable to foreign bank organizations;the Fed’s Comprehensive Capital Analysis (CCAR) program; and total loss absorbing capacity rules). These initiatives may lead tofinancial regulatory reforms, the extent, timing, and impact of which are unknown at this time.
U.K. and European Regulatory ReformThe revised directive and regulation on Markets in Financial Instruments (MiFID II/MiFIR) became effective January 2018, whichimpacts certain businesses operating in the European Union. The reforms introduced changes to pre- and post-trade transparency,market structure, trade and transaction reporting, algorithmic trading, and conduct of business. The U.K. is in negotiations to exit theEuropean Union. Until those negotiations are concluded, and the resulting changes are implemented, the U.K. will remain a EuropeanUnion Member State, subject to all European Union legislation.
Other regulatory developments include the General Data Protection Regulation which introduces significant obligations on datahandling globally, as well as the European Benchmarks Regulation that impacts users of, contributors to, and administrators ofbenchmarks. These regulations are effective May 2018 and January 2018, respectively.
For a discussion on risk factors resulting from these and other regulatory developments which may affect our business and financialresults, refer to the Risk management – Top and emerging risks and Legal and regulatory environment risk sections of our 2017Annual Report and the Capital, liquidity and other regulatory developments section of this Q1 2018 Report to Shareholders. For furtherdetails on our framework and activities to manage risks, refer to the risk and Capital management sections of our 2017 Annual Reportand the Risk management and Capital management sections of this Q1 2018 Report to Shareholders.
Financial performance
Overview
Q1 2018 vs. Q1 2017Net income of $3,012 million was down $15 million from a year ago, mainly due to our share of the gain related to the sale of the U.S.operations of Moneris in the prior year. Diluted earnings per share (EPS) of $2.01 was up $0.04 or 2% and return on common equity(ROE) of 17.4% was down 60 bps from 18.0% last year. Our Common Equity Tier 1 (CET1) ratio of 11.0%, remained unchanged from ayear ago.
Excluding our share of the gain related to the sale of the U.S. operations of Moneris, which was a specified item in the prior periodand is described further below, net income of $3,012 million was up $197 million or 7% from last year, diluted EPS of $2.01 was up$0.18, and ROE of 17.4% increased 70 bps. Our results reflected strong earnings in Wealth Management, Personal & CommercialBanking, Capital Markets and Investor & Treasury Services, partially offset by the write-down of net deferred tax assets associatedwith the U.S. Tax Reform and lower earnings in Insurance.
Wealth Management earnings increased mainly due to higher average fee-based assets, an increase in net interest income, and alower effective tax rate reflecting benefits from the U.S. Tax Reform. These factors were partially offset by higher variablecompensation on improved results, increased costs in support of business growth, and the impact of foreign exchange translation.
Personal & Commercial Banking earnings were lower as the prior year included our share of the gain noted above. Excluding thisspecified item, Personal & Commercial Banking earnings increased mainly due to average volume growth of 6%, higher spreads andhigher fee-based revenue in Canadian Banking. These factors were partially offset by higher PCL and higher costs in support ofbusiness growth in Canadian Banking.
Capital Markets results were up largely driven by a lower effective tax rate including the benefits from the U.S. Tax Reform andhigher results in Corporate and Investment Banking and Global Markets. These factors were partially offset by increased costs due tohigher variable compensation on improved results, litigation recoveries in the prior year, higher regulatory spend and the impact offoreign exchange translation.
Investor & Treasury Services results increased primarily due to growth in client deposits, increased revenue from our assetservices business, the impact of foreign exchange translation, as well as higher funding and liquidity earnings. These factors werelargely offset by higher investment in technology initiatives.
6 Royal Bank of Canada First Quarter 2018
Insurance results decreased primarily reflecting updates in the prior year related to premium and mortality experience, and higherclaims volumes in International Insurance. These factors were partially offset by higher investment-related gains and the impact of anew longevity reinsurance contract.
Corporate Support net loss was $200 million in the current quarter, largely due to the impact of the U.S. Tax Reform of$178 million which was primarily related to the write-down of net deferred tax assets.
For further details on our business segment results and CET1 ratio, refer to the Business segment results and Capitalmanagement sections, respectively.
Q1 2018 vs. Q4 2017Net income of $3,012 million was up $175 million or 6% from the prior quarter. Diluted EPS of $2.01 was up $0.13 and ROE of 17.4%was up 80 bps. Our CET1 ratio of 11.0%, was up 10 bps.
Our results reflected higher earnings in Capital Markets, Personal & Commercial Banking, Wealth Management and Investor &Treasury Services, partially offset by the write-down of net deferred tax assets associated with the U.S. Tax Reform and lower earningsin Insurance.
Capital Markets earnings were up largely driven by higher results in Global Markets and a lower effective tax rate reflecting thebenefits from the U.S. Tax Reform. These factors were partially offset by higher PCL and lower municipal banking activity.
Personal & Commercial Banking earnings increased largely due to higher fee-based revenue, a gain related to the reorganizationof Interac this quarter, average volume growth of 1% and higher spreads. Lower marketing costs also contributed to the increase.These factors were partially offset by higher PCL.
Wealth Management earnings were up primarily reflecting higher average fee-based assets, a lower effective tax rate reflectingbenefits from the U.S. Tax Reform, and increased transaction volumes. A favourable accounting adjustment related to City Nationaland higher net interest income also contributed to the increase. These factors were partially offset by increased costs in support ofbusiness growth and higher variable compensation on improved results.
Investor & Treasury Services earnings increased primarily due to higher funding and liquidity earnings and increased revenuefrom our asset services business.
Insurance earnings decreased due to favourable annual actuarial assumption updates in the prior quarter, and higher claimsvolumes.
Results excluding the specified item are non-GAAP measures. For further details, including a reconciliation, refer to the Keyperformance and non-GAAP measures section.
Impact of foreign currency translationThe following table reflects the estimated impact of foreign currency translation on key income statement items:
For the three months ended
(Millions of Canadian dollars, except per share amounts)
(1) Effective November 1, 2017, we adopted IFRS 9 Financial Instruments. Results from periods prior to November 1, 2017are reported in accordance with IAS 39 Financial Instruments: Recognition and Measurement. For further details on theimpacts of the adoption of IFRS 9 including the description of accounting policies selected, refer to Note 2 of ourCondensed Financial Statements.
The relevant average exchange rates that impact our business are shown in the following table:
(Average foreign currency equivalent of C$1.00) (1)
For the three months ended
January 31
2018October 31
2017January 31
2017
U.S. dollar 0.794 0.792 0.752British pound 0.578 0.600 0.603Euro 0.656 0.672 0.707(1) Average amounts are calculated using month-end spot rates for the period.
Net interest income $ 4,445 $ 4,361 $ 4,324NIM 1.65% 1.72% 1.73%
Insurance premiums, investment and fee income $ 1,144 $ 1,612 $ 497Trading revenue 318 146 263Investment management and custodial fees 1,325 1,228 1,159Mutual fund revenue 885 848 814Securities brokerage commissions 355 327 399Service charges 440 445 438Underwriting and other advisory fees 541 498 468Foreign exchange revenue, other than trading 281 230 227Card service revenue 257 211 236Credit fees 328 364 356Net gains on investment securities (1) 39 47 27Share of profit in joint ventures and associates 25 10 251Other 445 196 187
Non-interest income (2) $ 6,383 $ 6,162 $ 5,322
Total revenue (2) $ 10,828 $ 10,523 $ 9,646
Additional informationTotal trading revenue
Net interest income $ 550 $ 526 $ 669Non-interest income 318 146 263
Total trading revenue $ 868 $ 672 $ 932(1) Under IFRS 9, the Net gain (loss) on investment securities represents realized gains (losses) on debt securities at FVOCI and debt securities at amortized cost. Under IAS
39, the Net gain (loss) on investment securities represents realized gains (losses) on debt and equity available-for-sale securities.(2) Effective Q4 2017, service fees and other costs incurred in association with certain commissions and fees earned are presented on a gross basis in non-interest
expense. Comparative amounts have been reclassified to conform with this presentation.
Q1 2018 vs. Q1 2017Total revenue increased $1,182 million or 12% from last year mainly due to higher insurance revenue, higher investment managementand custodial fees, increased net interest income and higher other revenue. These factors were partially offset by lower share of profitin joint ventures and associates, as the prior year included our share of the gain from the sale of the U.S. operations of Moneris of$212 million, and the impact of foreign exchange translation which decreased our total revenue by $114 million. Excluding our shareof the gain in the prior year, total revenue increased $1,394 million or 15%.
Net interest income increased $121 million or 3%, largely due to volume growth in Canadian Banking and Wealth Management.The rising interest rate environment resulted in improved spreads in Canadian Banking and U.S. Wealth Management (including CityNational).
NIM was down 8 bps compared to last year due to volume growth in average earning assets primarily in reverse repos, partiallyoffset by higher interest rates in Canada and the U.S.
Insurance premiums, investment and fee income (insurance revenue) increased $647 million, mainly reflecting the change in thefair value of investments backing our policyholder liabilities, group annuity sales growth and the impact of restructured internationallife contracts, all of which were largely offset in PBCAE.
Investment management and custodial fees increased $166 million or 14%, mainly due to higher average fee-based assets undermanagement, reflecting capital appreciation and net sales.
Share of profit in joint ventures and associates decreased $226 million or 90%, as the prior year included our share of the gain ofMoneris as noted above.
Other revenue increased $258 million from last year mainly due to net gains in our other non-trading investment portfolios, afavourable accounting adjustment related to City National, a gain related to the reorganization of Interac, and the change in the fairvalue of our U.S. share-based compensation plan, which was largely offset in Non-interest expense.
Q1 2018 vs. Q4 2017Total revenue increased $305 million or 3% from the prior quarter, primarily due to higher fixed income trading revenue in NorthAmerica and Europe, increased equity trading revenue across all regions, and net gains in our other non-trading investment portfolios.Higher average fee-based assets reflecting capital appreciation and net sales in Wealth Management, volume growth and the impactof higher interest rates in Canadian Banking and Wealth Management also contributed to the increase. Revenue was also favourablyimpacted by an accounting adjustment related to City National, a gain related to the reorganization of Interac, the change in the fairvalue of our U.S. share-based compensation plan, which is largely offset in Non-interest expense, and higher transaction volumes inWealth Management. These factors were partially offset by lower insurance revenues reflecting the change in the fair value ofinvestments backing our policyholder liabilities and lower group annuity sales, both of which are largely offset in PBCAE.
8 Royal Bank of Canada First Quarter 2018
Provision for credit losses (PCL)Q1 2018 vs. Q1 2017Total PCL in Q1 2018 is $334 million with a PCL ratio of 24 bps.
PCL on loans of $334 million increased $40 million, or 14% from the prior year, mainly due to higher provisions in Personal &Commercial Banking which were partially offset by lower provisions in Capital Markets and Wealth Management. PCL on loans alsoreflects the adoption of IFRS 9 on November 1, 2017.
Q1 2018 vs. Q4 2017Total PCL of $334 million increased $100 million.
PCL on loans of $334 million increased $100 million, or 43% from the prior year, mainly due to higher provisions in CapitalMarkets and Personal & Commercial Banking. PCL on loans also reflects the adoption of IFRS 9, as noted above.
Insurance policyholder benefits, claims and acquisition expense (PBCAE)Q1 2018 vs. Q1 2017PBCAE increased $653 million from a year ago, reflecting the change in fair value of investments backing our policyholder liabilities,group annuity sales growth, and the impact of restructured international life contracts, all of which were largely offset in revenue.Updates in the prior year related to premium and mortality experience, and higher claims volumes in International Insurance, alsocontributed to the increase. These factors were partially offset by investment-related gains and the impact of a new longevityreinsurance contract.
Q1 2018 vs. Q4 2017PBCAE decreased $301 million or 26% from the prior quarter, mainly due to the change in fair value of investments backing ourpolicyholder liabilities and lower group annuity sales, both of which were largely offset in revenue. These factors were partially offsetby favourable impacts from annual actuarial assumption updates in the prior quarter, largely reflecting changes in credit and discountrates and favourable mortality experience, mainly in the U.K., and higher claims volumes in both Canadian Insurance andInternational Insurance.
Non-interest expenseFor the three months ended
(Millions of Canadian dollars, except percentage amounts) (1)
Human resources $ 3,502 $ 3,299 $ 3,309Equipment 372 373 356Occupancy 379 402 399Communications 224 299 221Professional fees 281 368 255Amortization of other intangibles 261 257 252Other 592 613 523
Non-interest expense $ 5,611 $ 5,611 $ 5,315Efficiency ratio (2) 51.8% 53.3% 55.1%Efficiency ratio adjusted (3) 51.9% 54.8% 53.6%(1) Effective Q4 2017, service fees and other costs incurred in association with certain commissions and fees earned are presented on a gross basis in non-interest
expense. Comparative amounts have been reclassified to conform with this presentation.(2) Efficiency ratio is calculated as non-interest expense divided by total revenue.(3) Measures have been adjusted by excluding the change in fair value of investments backing our policyholder liabilities and our share of the Q1 2017 gain related to the
sale of the U.S. operations of Moneris of $212 million (before- and after-tax). These are non-GAAP measures. For further details, refer to the Key performance andnon-GAAP measures section.
Q1 2018 vs. Q1 2017Non-interest expense increased $296 million or 6%, largely due to increased staff-related costs including higher variablecompensation on improved results and higher costs in support of business growth. The change in the fair value of our U.S. share-based compensation plan, which was largely offset in revenue, and higher regulatory spend also contributed to the increase. Thesefactors were partially offset by the impact of foreign exchange translation and continued benefits from our efficiency managementactivities.
Our efficiency ratio of 51.8% decreased 330 bps from 55.1% last year. Excluding the change in fair value of investments backingour policyholder liabilities and our share of the gain recorded in the prior year related to the sale of the U.S. operations of Monerisnoted previously, our efficiency ratio of 51.9% decreased 170 bps from 53.6% last year mainly driven by solid revenue growth acrossall businesses, the impact of foreign exchange translation and continued benefits from our efficiency management activities. Thesefactors were partially offset by increased staff-related costs and higher costs in support of business growth as noted above.
Q1 2018 vs. Q4 2017Non-interest expense remained flat, as higher variable compensation on improved results, the change in the fair value of our U.S.share-based compensation plan, which was largely offset in revenue, and increased costs in support of business growth were offsetby seasonally lower marketing costs and lower annual capital taxes.
Our efficiency ratio of 51.8% decreased 150 bps from 53.3% last quarter. Excluding the change in fair value of investmentsbacking our policyholder liabilities, our efficiency ratio of 51.9% decreased 290 bps from last quarter, due to solid revenue growthacross most businesses combined with prudent expense management activities.
Royal Bank of Canada First Quarter 2018 9
Efficiency ratio excluding the change in fair value of investments backing our policyholder liabilities and the specified item notedpreviously is a non-GAAP measure. For further details, including a reconciliation, refer to the Key performance and non-GAAPmeasures section.
Income taxes
For the three months ended
(Millions of Canadian dollars, except percentage amounts)
January 31
2018October 31
2017January 31
2017
Income taxes $ 1,035 $ 704 $ 827
Income before income taxes $ 4,047 $ 3,541 $ 3,854Canadian statutory income tax rate (1) 26.5% 26.5% 26.5%Lower average tax rate applicable to subsidiaries (2) (3.2)% (5.5)% (3.5)%Tax-exempt income from securities (1.6)% (1.9)% (2.1)%Tax rate change (3) 3.6% –% (0.2)%Other 0.3% 0.8% 0.8%
Effective income tax rate 25.6% 19.9% 21.5%(1) Blended Federal and Provincial statutory income tax rate.(2) As the reduced tax rates from the U.S. Tax Reform are effective on January 1, 2018, the Lower average tax rate applicable to subsidiaries includes the fiscal 2018
blended rate for U.S. subsidiaries.(3) In Q1 2018, the tax rate change is primarily related to the impact of the U.S. Tax Reform.
Q1 2018 vs. Q1 2017Income tax expense increased $208 million or 25% from last year, due to the impact of the U.S. Tax Reform which resulted in thewrite-down of net deferred tax assets partially offset by the lower corporate tax rate on U.S. earnings, and higher income beforeincome taxes.
The effective income tax rate of 25.6% increased 410 bps, primarily due to the impact of U.S. Tax Reform. The impact of our shareof a gain related to the sale of our U.S operations of Moneris of $212 million (before- and after-tax) in the prior year also contributed tothe increase. Excluding our share of the gain, the effective income tax rate increased 290 bps largely due to the impact of the U.S. TaxReform which resulted in the write-down of net deferred tax assets partially offset by the lower corporate tax rate on U.S. earnings.
Q1 2018 vs. Q4 2017Income tax expense increased $331 million or 47% from last quarter, due to the impact of the U.S. Tax Reform which resulted in thewrite-down of net deferred tax assets partially offset by the lower corporate tax rate on U.S. earnings, and higher income beforeincome taxes.
The effective income tax rate of 25.6% increased 570 bps from 19.9% in the last quarter, mainly due to the impact of the U.S. TaxReform which resulted in the write-down of net deferred tax assets, and favourable tax adjustments in the prior quarter. These factorswere partially offset by the lower corporate tax rate on U.S. earnings resulting from the U.S. Tax Reform.
Results excluding the specified item are non-GAAP measures. For further details, including a reconciliation, refer to the Keyperformance and non-GAAP measures section.
Business segment results
How we measure and report our business segments
The key methodologies and assumptions used in our management reporting framework are periodically reviewed by management toensure they remain valid. They remain unchanged from October 31, 2017, except as noted below.
Provisions for credit lossesOn November 1, 2017, we adopted IFRS 9, which introduced an expected credit loss impairment model that differs from the incurredloss model under IAS 39. PCL is recorded to recognize estimated credit losses on all financial assets, except for financial assetsclassified or designated as fair value through profit or loss (FVTPL) and equity securities designated as fair value through othercomprehensive income (FVOCI), which are not subject to impairment assessment. For details on our accounting policy on Allowancefor credit losses, refer to Note 2 of our Condensed Financial Statements.
PCL is included in the results of each business segment to fully reflect the appropriate expenses related to the conduct of eachbusiness segment. Prior to the adoption of IFRS 9, PCL on loans not yet identified as impaired was included in Corporate Support.
For further details on our key methodologies and assumptions used in our management reporting framework, refer to the How wemeasure and report our business segments section of our 2017 Annual Report.
10 Royal Bank of Canada First Quarter 2018
Key performance and non-GAAP measures
Performance measures
Return on common equity (ROE)We measure and evaluate the performance of our consolidated operations and each business segment using a number of financialmetrics, such as net income and ROE. We use ROE, at both the consolidated and business segment levels, as a measure of return ontotal capital invested in our business. Management views the business segment ROE measure as a useful measure for supportinginvestment and resource allocation decisions because it adjusts for certain items that may affect comparability between businesssegments and certain competitors. ROE does not have a standardized meaning under GAAP and may not be comparable to similarmeasures disclosed by other financial institutions. For further details, refer to the Key performance and non-GAAP measures section ofour 2017 Annual Report.
The following table provides a summary of our ROE calculations:
For the three months ended
January 31
2018October 31
2017January 31
2017
(Millions of Canadian dollars, except percentage amounts)
Personal &Commercial
BankingWealth
Management Insurance
Investor &TreasuryServices
CapitalMarkets
CorporateSupport Total Total Total
Net income available to common shareholders $ 1,497 $ 583 $ 125 $ 216 $ 727 $ (219) $ 2,929 $ 2,757 $ 2,940Total average common equity (1), (2) 20,750 13,400 1,750 3,150 19,650 8,150 66,850 65,900 64,650
ROE (3) 28.6% 17.3% 28.2% 26.9% 14.7% n.m. 17.4% 16.6% 18.0%(1) Total average common equity represents rounded figures.(2) The amounts for the segments are referred to as attributed capital.(3) ROE is based on actual balances of average common equity before rounding.n.m. not meaningful
Non-GAAP measuresWe believe that certain non-GAAP measures described below are more reflective of our ongoing operating results and provide readerswith a better understanding of management’s perspective on our performance. These measures enhance the comparability of ourfinancial performance for the three months ended January 31, 2018 with the corresponding period in the prior year and the threemonths ended October 31, 2017 as well as, in the case of economic profit, measure relative contribution to shareholder value.Non-GAAP measures do not have a standardized meaning under GAAP and may not be comparable to similar measures disclosed byother financial institutions.
The following discussion describes the non-GAAP measures we use in evaluating our operating results.
Economic profitEconomic profit is net income excluding the after-tax effect of amortization of other intangibles less a capital charge for use ofattributed capital. It measures the return generated by our businesses in excess of our cost of shareholders’ equity, thus enablingusers to identify relative contributions to shareholder value.
The following table provides a summary of our Economic profit:
Results excluding specified itemOur results were impacted by the following specified item:• For the three months ended January 31, 2017, our share of a gain related to the sale by our payment processing joint venture
Moneris of its U.S. operations to Vantiv, Inc., which was $212 million (before- and after-tax) and recorded in Personal &Commercial Banking.
Royal Bank of Canada First Quarter 2018 11
The following tables provide calculations of our consolidated and business segment results and measures excluding the specifieditem for the three months ended January 31, 2017:
Consolidated results
For the three months ended (1)
January 31
2017
Item excluded
(Millions of Canadian dollars, except per share and percentage amounts) (2) As reported
Net income before income taxes $ 3,854 $ (212) $ 3,642Income taxes 827 – 827
Net income $ 3,027 $ (212) $ 2,815Net income available to common shareholders $ 2,940 $ (212) $ 2,728
Average number of common shares (thousands) 1,484,262 1,484,262Basic earnings per share (in dollars) $ 1.98 $ (0.14) $ 1.84
Average number of diluted common shares (thousands) 1,492,350 1,492,350Diluted earnings per share (in dollars) $ 1.97 $ (0.14) $ 1.83
Average common equity (4) $ 64,650 $ 64,650ROE (5) 18.0% 16.7%
Efficiency ratio 55.1% 56.3%
Effective tax rate 21.5% 22.7%(1) There were no specified items for the three months ended January 31, 2018 and October 31, 2017.(2) Effective Q4 2017, service fees and other costs incurred in association with certain commissions and fees earned are presented on a gross basis in non-interest expense. Comparative amounts have
been reclassified to conform with this presentation.(3) Includes foreign currency translation.(4) Average common equity represents rounded figures.(5) ROE is based on actual balances of average common equity before rounding.
Personal & Commercial Banking
For the three months ended (1)
January 31
2017
Item excluded
(Millions of Canadian dollars, except percentage amounts) (2) As reported
(1) There were no specified items for the three months ended January 31, 2018 and October 31, 2017.(2) Effective Q4 2017, service fees and other costs incurred in association with certain commissions and fees earned are presented on a gross basis in non-interest expense. Comparative amounts have
been reclassified to conform with this presentation.(3) Includes foreign currency translation.
12 Royal Bank of Canada First Quarter 2018
Canadian Banking
For the three months ended (1)
January 31
2017
Item excluded
(Millions of Canadian dollars, except per share and percentage amounts) (2) As reported
(1) There were no specified items for the three months ended January 31, 2018 and October 31, 2017.(2) Effective Q4 2017, service fees and other costs incurred in association with certain commissions and fees earned are presented on a gross basis in non-interest expense. Comparative amounts have
been reclassified to conform with this presentation.(3) Includes foreign currency translation.
Efficiency ratio excluding the change in fair value of investments in Insurance and specified itemOur efficiency ratio is impacted by the change in fair value of investments backing our policyholder liabilities, which is reported inrevenue and largely offset in PBCAE. In addition, revenue for the three months ended January 31, 2017 was impacted by the specifieditem noted previously.
The following table provides calculations of our consolidated efficiency ratio excluding the change in fair value of investments backingour policyholder liabilities and the specified item:
For the three months ended
January 31
2018October 31
2017January 31
2017Item excluded Item excluded Items excluded
Change in fair value of Change in fair value of Change in fair value of Gain related to(Millions of Canadian dollars, investments backing investments backing investments backing the sale ofexcept percentage amounts) (1) As reported policyholder liabilities Adjusted As reported policyholder liabilities Adjusted As reported policyholder liabilities Moneris (2) Adjusted
Efficiency ratio 51.8% 51.9% 53.3% 54.8% 55.1% 53.6%
(1) Effective Q4 2017, service fees and other costs incurred in association with certain commissions and fees earned are presented on a gross basis in non-interest expense. Comparative amounts havebeen reclassified to conform with this presentation.
(2) Includes foreign currency translation.
Royal Bank of Canada First Quarter 2018 13
Personal & Commercial Banking
As at or for the three months ended
(Millions of Canadian dollars, except percentage amounts and as otherwise noted) (1)
January 31
2018October 31
2017January 31
2017Net interest income $ 2,856 $ 2,820 $ 2,649Non-interest income 1,309 1,199 1,427
Income before income taxes 2,047 1,877 2,058Net income $ 1,521 $ 1,404 $ 1,592Revenue by business
Canadian Banking $ 3,927 $ 3,766 $ 3,824Caribbean & U.S. Banking 238 253 252
Selected balance sheet and other informationROE 28.6% 26.7% 32.1%NIM 2.73% 2.71% 2.66%Efficiency ratio 43.2% 46.6% 43.4%Operating leverage 0.4% 2.4% 6.4%Effective income tax rate 25.7% 25.2% 22.6%Average earning assets, net $ 415,600 $ 412,200 $ 395,500Average loans and acceptances, net 416,000 412,000 394,600Average deposits 357,000 352,100 336,700AUA (2) 270,800 264,800 245,000PCL on impaired loans as a % of average net loans and acceptances (3) 0.26% 0.26% 0.25%
Other selected information – Canadian BankingNet income $ 1,480 $ 1,360 $ 1,546NIM 2.68% 2.65% 2.61%Efficiency ratio 41.5% 44.7% 40.8%Operating leverage (1.7)% 1.5% 8.9%Operating leverage adjusted (4) 4.3% n.a. 2.8%Effective income tax rate 25.9% 25.7% 23.2%
(1) Effective Q4 2017, service fees and other costs incurred in association with certain commissions and fees earned are presented on a gross basis in non-interest expense. Comparative amounts havebeen reclassified to conform with this presentation.
(2) AUA represents period-end spot balances and includes securitized residential mortgages and credit card loans as at January 31, 2018 of $18.2 billion and $9.1 billion, respectively (October 31,2017 – $18.4 billion and $8.4 billion; January 31, 2017 – $18.7 billion and $8.4 billion).
(3) PCL on impaired loans represents Stage 3 PCL under IFRS 9 and PCL on impaired loans under IAS 39. Stage 3 PCL under IFRS 9 is comprised of lifetime credit losses of credit-impaired loans,acceptances, and commitments.
(4) These are non-GAAP measures. Q1 2018 operating leverage of (1.7)% in Canadian Banking was impacted by our share of the gain related to the sale of Moneris of $212 million (before- and after-tax) in Q1 2017, which was a specified item. For our Q1 2017 adjusted operating leverage, including a reconciliation, refer to the Key performance and non-GAAP measures section. Q1 2018 revenueand expense growth rates in Canadian Banking were 2.7% and 4.4%, respectively. Excluding our share of the gain as noted above, Q1 2018 adjusted revenue growth rate was 8.7%.
n.a. not applicable
Effective Q1 2018, the lines of business within Canadian Banking have been realigned in a manner that emphasizes our client-centricstrategy. Personal Financial Services and Cards and Payment Solutions, previously reported separately, are reported collectively asPersonal Banking, and Business Financial Services has been renamed to Business Banking. The change had no impact on prior periodnet income for our Personal & Commercial Banking segment.
Financial performanceQ1 2018 vs. Q1 2017Net income decreased $71 million or 4% from last year as the prior year included our share of the gain related to the sale of the U.S.operations of Moneris of $212 million (before- and after-tax). Excluding our share of the gain, net income increased $141 million or10%, mainly due to average volume growth of 6%, higher spreads and higher fee-based revenue in Canadian Banking. These factorswere partially offset by higher PCL mainly due to the introduction of PCL on performing financial assets as a result of adopting IFRS 9and higher costs in support of business growth in Canadian Banking.
Total revenue increased $89 million or 2% as the prior year included our share of the gain related to the sale of Moneris as notedabove. Excluding our share of the gain related to the sale of Moneris, total revenue increased $301 million or 8%.
Canadian Banking revenue increased $103 million or 3% as the prior year included our share of the gain related to the sale ofMoneris as noted above. Excluding our share of the gain, revenue increased $315 million or 9% compared to last year, largelyreflecting average volume growth of 6% in loans and deposits, and improved spreads. Higher balances driving higher mutual funddistribution fees, a gain related to the reorganization of Interac this quarter, and higher purchase volumes resulting in higher cardservice revenue also contributed to the increase.
Caribbean & U.S. Banking revenue decreased $14 million or 6% compared to last year, mainly due to the impact of foreignexchange translation.
Net interest margin was up 7 bps, mainly due to improved spreads on deposits in Canadian Banking, reflecting the rising interestrate environment.
PCL on impaired loans ratio increased 1 bp. For further details, refer to Credit quality performance in the Credit Risk section.Non-interest expense increased $32 million or 2%, primarily attributable to increased costs in support of business growth,
reflecting ongoing investments in technology, including digital initiatives, and higher marketing costs. Higher staff-related costs alsocontributed to the increase. These factors were partially offset by continued benefits from our efficiency management activities. Theprior year also included an impairment related to properties held for sale in Caribbean Banking.
14 Royal Bank of Canada First Quarter 2018
Q1 2018 vs. Q4 2017Net income increased $117 million or 8% from last quarter, largely reflecting higher fee-based revenue, a gain related to thereorganization of Interac this quarter, average volume growth of 1% and higher spreads. Lower marketing costs also contributed to theincrease. These factors were partially offset by higher PCL mainly due to the introduction of PCL on performing financial assets as aresult of adopting IFRS 9.
Total revenue increased $146 million or 4% from last quarter, mainly driven by higher fee-based revenue primarily attributable tohigher purchase volumes resulting in higher card service revenue. A gain related to the reorganization of Interac this quarter, averagevolume growth of 1% in loans and deposits and higher spreads also contributed to the increase.
Net interest margin increased 2 bps largely due to improved deposit spreads in Canadian Banking, reflecting the rising interestrate environment.
PCL on impaired loans ratio remained flat. For further details, refer to Credit quality performance in the Credit Risk section.Non-interest expense decreased $71 million or 4%, largely reflecting seasonally lower marketing costs and lower annual capital
taxes. These factors were partially offset by higher staff-related costs.
Results excluding the specified item noted above are non-GAAP measures. For further details, including a reconciliation, refer to theKey performance and non-GAAP measures section.
Wealth Management
As at or for the three months ended
(Millions of Canadian dollars, except number of and percentage amounts and as otherwise noted) (1)
January 31
2018October 31
2017January 31
2017
Net interest income $ 612 $ 583 $ 541Non-interest income
Fee-based revenue 1,589 1,485 1,405Transaction and other revenue 582 494 539
Selected balance sheet and other informationROE 17.3% 14.2% 12.2%NIM 3.27% 3.13% 2.82%Pre-tax margin (2) 27.8% 25.8% 22.7%Number of advisors (3) 4,901 4,884 4,797Average earning assets, net $ 74,300 $ 73,900 $ 76,200Average loans and acceptances, net 52,500 51,600 50,800Average deposits 92,600 90,900 95,100AUA (4) 938,800 929,200 879,000
– U.S. Wealth Management (including City National) (4) 453,000 442,700 395,000– U.S. Wealth Management (including City National) (US$ millions) (4) 368,100 343,200 303,500
AUM (4) 651,000 634,100 578,600Average AUA 938,600 900,300 884,900Average AUM 656,100 617,400 580,100PCL on impaired loans as a % of average net loans and acceptances (5) 0.04% –% 0.10%
For the three months ended
Estimated impact of U.S. dollar, British pound and Euro translation on key income statement items(Millions of Canadian dollars, except percentage amounts and as otherwise noted)
Percentage change in average US$ equivalent of C$1.00 6% –%Percentage change in average British pound equivalent of C$1.00 (4)% (4)%Percentage change in average Euro equivalent of C$1.00 (7)% (2)%(1) Effective Q4 2017, service fees and other costs incurred in association with certain commissions and fees earned are presented on a gross basis in non-interest expense. Comparative amounts have
been reclassified to conform with this presentation.(2) Pre-tax margin is defined as Income before income taxes divided by Total revenue.(3) Represents client-facing advisors across all our Wealth Management businesses.(4) Represents period-end spot balances.(5) PCL on impaired loans represents Stage 3 PCL under IFRS 9 and PCL on impaired loans under IAS 39. Stage 3 PCL under IFRS 9 is comprised of lifetime credit losses of credit-impaired loans,
acceptances, and commitments.
Royal Bank of Canada First Quarter 2018 15
Financial performanceQ1 2018 vs. Q1 2017Net income increased $167 million or 39% from a year ago, largely reflecting higher average fee-based assets, an increase in netinterest income, and a lower effective tax rate reflecting benefits from the U.S. Tax Reform. These factors were partially offset by highervariable compensation on improved results, increased costs in support of business growth, and the impact of foreign exchangetranslation.
Total revenue increased $298 million or 12%.Canadian Wealth Management revenue increased $36 million or 5%, mainly due to higher average fee-based assets reflecting
capital appreciation and net sales, partially offset by lower transaction revenue.U.S. Wealth Management (including City National) revenue increased $201 million or 17%. In U.S. dollars, revenue increased
$210 million or 24%, mainly due to higher average fee-based assets reflecting capital appreciation and net sales, an increase in netinterest income reflecting the impact from volume growth and higher U.S. interest rates, and increased transaction revenue. Afavourable accounting adjustment related to City National, and the change in the fair value of our U.S. share-based compensationplan, which was largely offset in non-interest expense, also contributed to the increase.
Global Asset Management revenue increased $63 million or 13%, mainly due to higher average fee-based assets undermanagement, reflecting capital appreciation and net sales.
PCL on impaired loans ratio improved 6 bps, mainly due to lower provisions on impaired loans related to U.S. WealthManagement (including City National). For further details, refer to Credit quality performance in the Credit Risk section.
Non-interest expense increased $102 million or 5%, largely due to higher variable compensation on improved results, increasedcosts in support of business growth mainly reflecting higher staff costs in the U.S., and the change in the fair value of our U.S. share-based compensation plan, which was largely offset in revenue. These factors were partially offset by the impact of foreign exchangetranslation.
Q1 2018 vs. Q4 2017Net income increased $106 million or 22%, primarily reflecting higher average fee-based assets, a lower effective tax rate reflectingbenefits from the U.S. Tax Reform, and increased transaction volumes. A favourable accounting adjustment related to City Nationaland higher net interest income also contributed to the increase. These factors were partially offset by increased costs in support ofbusiness growth and higher variable compensation on improved results.
Total revenue increased $221 million or 9%, mainly due to higher average fee-based assets reflecting capital appreciation andnet sales, improved transaction volumes, and a favourable accounting adjustment related to City National. The change in the fairvalue of our U.S. share-based compensation plan, which was largely offset in non-interest expense, and an increase in net interestincome reflecting volume growth and higher interest rates, also contributed to the increase.
PCL on impaired loans ratio increased 4 bps due to higher provisions on impaired loans related to U.S. Wealth Management(including City National). For further details, refer to Credit quality performance in the Credit Risk section.
Non-interest expense increased $110 million or 6%, reflecting increased costs in support of business growth mainly reflectinghigher staff-related costs in the U.S., higher variable compensation on improved results, and the change in the fair value of our U.S.share-based compensation plan, which was largely offset in revenue.
Insurance
As at or for the three months ended
(Millions of Canadian dollars, except percentage amounts and as otherwise noted)
January 31
2018October 31
2017January 31
2017
Non-interest incomeNet earned premiums $ 939 $ 1,166 $ 749Investment income (1) 166 399 (353)Fee income 39 47 101
Selected balances and other informationROE 28.2% 52.3% 33.7%Premiums and deposits (2) $ 1,095 $ 1,302 $ 1,003Fair value changes on investments backing policyholder liabilities (1) 26 279 (481)
(1) Investment income can experience volatility arising from fluctuation of fair value through profit or loss (FVTPL) assets. The investments which support actuarial liabilities are predominantly fixedincome assets designated as at FVTPL. Consequently, changes in the fair values of these assets are recorded in investment income in the Consolidated Statement of Income and are largely offset bychanges in the fair value of the actuarial liabilities, the impact of which is reflected in insurance policyholder benefits and claims.
(2) Premiums and deposits include premiums on risk-based insurance and annuity products, and individual and group segregated fund deposits, consistent with insurance industry practices.
16 Royal Bank of Canada First Quarter 2018
Financial performanceQ1 2018 vs. Q1 2017Net income decreased $7 million or 5% from a year ago, primarily reflecting favourable updates in the prior year related to premiumand mortality experience, and higher claims volumes in International Insurance. These factors were partially offset by higherinvestment-related gains and the impact of a new longevity reinsurance contract.
Total revenue increased $647 million as compared to the prior year.Canadian Insurance revenue increased $601 million, mainly due to the change in fair value of investments backing our
policyholder liabilities and group annuity sales growth, both of which were largely offset in PBCAE.International Insurance revenue increased $46 million or 10%, mainly due to the impact of restructured international life
contracts, partially offset by the change in fair value of investments backing our policyholder liabilities, both of which were largelyoffset in PBCAE.
PBCAE increased $653 million, reflecting the change in fair value of investments backing our policyholder liabilities, groupannuity sales growth, and the impact of restructured international life contracts, all of which were largely offset in revenue. Favourableupdates in the prior year related to premium and mortality experience, and higher claims volumes in International Insurance, alsocontributed to the increase. These factors were partially offset by higher investment-related gains and the impact of a new longevityreinsurance contract.
Non-interest expense remained relatively unchanged from the prior year.
Q1 2018 vs. Q4 2017Net income decreased $138 million or 52% driven by favourable annual actuarial assumption updates in the prior quarter, and higherclaims volumes.
Total revenue decreased $468 million or 29%, mainly reflecting the change in fair value of investments backing our policyholderliabilities and lower group annuity sales, both of which were largely offset in PBCAE.
PBCAE decreased $301 million or 26%, mainly due to the change in fair value of investments backing our policyholder liabilitiesand lower group annuity sales, both of which were largely offset in revenue. These factors were partially offset by favourable impactsfrom annual actuarial assumption updates in the prior quarter, largely reflecting changes in credit and discount rates and favourablemortality experience, mainly in the U.K., and higher claims volumes in both Canadian Insurance and International Insurance.
Non-interest expense decreased $15 million or 10%, reflecting lower staff costs and lower spend on marketing initiatives.
Investor & Treasury Services
(Millions of Canadian dollars, except percentage amounts and as otherwise noted)
As at or for the three months ended
January 31
2018October 31
2017January 31
2017
Net interest income $ 128 $ 128 $ 237Non-interest income 548 474 394
Total revenue 676 602 631Non-interest expense 389 397 350
Net income before income taxes 287 205 281Net income $ 219 $ 156 $ 214
Selected balance sheet and other informationROE 26.9% 19.2% 25.1%Average deposits $ 155,300 $ 142,600 $ 128,500
Estimated impact of U.S. dollar, British pound and Euro translation on key income statement items(Millions of Canadian dollars, except percentage amounts)
Percentage change in average US$ equivalent of C$1.00 6% –%Percentage change in average British pound equivalent of C$1.00 (4)% (4)%Percentage change in average Euro equivalent of C$1.00 (7)% (2)%
(1) Represents period-end spot balances.
Q1 2018 vs. Q1 2017Net income increased $5 million or 2%, primarily due to growth in client deposits, increased revenue from our asset servicesbusiness, the impact of foreign exchange translation as well as higher funding and liquidity earnings. These factors were largely offsetby higher investment in technology initiatives.
Total revenue increased $45 million or 7%, mainly due to the impact of foreign exchange translation, growth in client deposits,increased revenue from our asset services business driven by higher client activity, and higher funding and liquidity revenue driven bygains from the disposition of certain securities.
Royal Bank of Canada First Quarter 2018 17
Non-interest expense increased $39 million or 11%, largely reflecting the impact of foreign exchange translation, higherinvestment in client-focused technology initiatives, and higher costs in support of business growth mainly reflecting increasedstaff-related costs.
Q1 2018 vs. Q4 2017Net income increased $63 million or 40%, primarily due to higher funding and liquidity earnings and increased revenue from ourasset services business.
Total revenue increased $74 million or 12%, mainly due to higher funding and liquidity revenue, increased revenue from ourasset services business due to higher client activity, the impact of foreign exchange translation, and gains from the disposition ofcertain securities.
Non-interest expense decreased $8 million or 2%, as the prior quarter included annual regulatory costs.
Capital Markets
As at or for the three months ended
(Millions of Canadian dollars, except percentage amounts and as otherwise noted)
January 31
2018October 31
2017January 31
2017
Net interest income (1) $ 866 $ 851 $ 947Non-interest income (1) 1,309 1,103 1,124
Net income before income taxes 941 770 914Net income $ 748 $ 584 $ 662
Revenue by businessCorporate and Investment Banking $ 994 $ 1,049 $ 936Global Markets 1,221 976 1,194Other (40) (71) (59)
Selected balance sheet and other informationROE 14.7% 12.4% 13.3%Average total assets $ 570,200 $ 490,600 $ 493,600Average trading securities 100,800 86,500 98,900Average loans and acceptances, net 81,400 83,000 83,800Average deposits 64,900 62,800 58,700PCL on impaired loans as a % of average net loans and acceptances (2) 0.22% (0.18)% 0.15%
For the three months ended
Estimated impact of U.S. dollar, British pound and Euro translation on key income statement items(Millions of Canadian dollars, except percentage amounts and as otherwise noted)
Percentage change in average US$ equivalent of C$1.00 6% –%Percentage change in average British pound equivalent of C$1.00 (4)% (4)%Percentage change in average Euro equivalent of C$1.00 (7)% (2)%
(1) The taxable equivalent basis (teb) adjustment for the three months ended January 31, 2018 was $92 million (October 31, 2017 – $225 million, January 31, 2017 – $119 million). For furtherdiscussion, refer to the How we measure and report our business segments section of our 2017 Annual Report.
(2) PCL on impaired loans represents Stage 3 PCL under IFRS 9 and PCL on impaired loans under IAS 39. Stage 3 PCL under IFRS 9 is comprised of lifetime credit losses of credit-impaired loans,acceptances and commitments.
Q1 2018 vs. Q1 2017Net income increased $86 million or 13%, primarily due to a lower effective tax rate including the benefits from the U.S. Tax Reformand higher results in Corporate and Investment Banking and Global Markets. These factors were partially offset by increased costsdue to higher variable compensation on improved results, litigation recoveries in the prior year, higher regulatory spend and theimpact of foreign exchange translation.
Total revenue increased $104 million or 5%.Corporate and Investment Banking revenue increased $58 million or 6%, mainly due to higher lending revenue across all regions,
and increased debt and equity origination activity in the U.S. An overall improvement in European Investment Banking revenue alsocontributed to the increase. These factors were partially offset by the impact of foreign exchange translation, lower loan syndicationactivity mainly in the U.S., decreased M&A activity in North America and lower equity origination activity in Canada.
Global Markets revenue increased $27 million or 2%, primarily driven by higher equity trading revenue across most regions andincreased debt origination activity across all regions. Higher equity origination activity largely in the U.S. and gains from thedisposition of certain securities also contributed to the increase. These factors were partially offset by lower fixed income tradingrevenue in Europe.
Other revenue increased $19 million largely reflecting gains in our legacy U.S. auction rate securities portfolios.PCL on impaired loans ratio increased 7 bps mainly due to fewer recoveries and lower provisions on impaired loans. For further
details, refer to Credit quality performance in the Credit Risk section.
18 Royal Bank of Canada First Quarter 2018
Non-interest expense increased $89 million or 8%, mainly due to higher costs related to changes in the timing of deferredcompensation, higher variable compensation on improved results, and litigation recoveries in the prior quarter. Higher regulatoryspend also contributed to the increase. These factors were partially offset by the impact of foreign exchange translation.
Q1 2018 vs. Q4 2017Net income increased $164 million or 28%, primarily due to higher results in Global Markets and a lower effective tax rate reflectingthe benefits from the U.S. Tax Reform. These factors were partially offset by higher PCL and lower municipal banking activity.
Total revenue increased $221 million or 11%, mainly due to higher fixed income trading revenue in North America and Europeand increased equity trading revenue across all regions. Higher equity origination activity in North America and gains from thedisposition of certain securities also contributed to the increase. These factors were partially offset by lower municipal bankingactivity, lower debt origination activity mainly in North America and decreased loan syndication revenue in the U.S.
PCL on impaired loans ratio increased 40 bps mainly due to higher recoveries in the oil & gas and real estate & related sectors inthe prior quarter and higher provisions primarily on a few accounts this quarter, including one in the consumer goods sector. Forfurther details, refer to Credit quality performance in the Credit Risk section.
Non-interest expense decreased $8 million or 1%, mainly due to lower annual capital taxes, largely offset by higher variablecompensation on improved results.
Corporate Support
For the three months ended
(Millions of Canadian dollars, except as otherwise noted)
January 31
2018October 31
2017January 31
2017
Net interest income (loss) (1) $ (17) $ (21) $ (50)Non-interest income (loss) (1) (98) (205) (64)
Net income (loss) before income taxes (1) (168) (290) (136)Income taxes (recoveries) (1) 32 (227) (131)
Net income (loss) (2) $ (200) $ (63) $ (5)
(1) Teb adjusted.(2) Net income reflects income attributable to both shareholders and Non-Controlling Interests (NCI). Net income attributable to NCI for the three months ended January 31, 2018 was $9 million
Due to the nature of activities and consolidation adjustments reported in this segment, we believe that a comparative period analysisis not relevant. The following identifies material items affecting the reported results in each period.
Total revenue and income taxes (recoveries) in each period in Corporate Support include the deduction of the teb adjustments relatedto the gross-up of income from Canadian taxable corporate dividends and the U.S. tax credit investment business recorded in CapitalMarkets. The amount deducted from revenue was offset by an equivalent increase in income taxes (recoveries).
The teb amount for the three months ended January 31, 2018 was $92 million as compared to $225 million in the prior quarter and$119 million last year.
The following identifies the material items, other than the teb impacts noted previously, affecting the reported results in each period.
Q1 2018Net loss was $200 million, largely due to the impact of the U.S. Tax Reform of $178 million which was primarily related to the write-down of net deferred tax assets.
Q4 2017Net loss was $63 million, largely reflecting net unfavourable tax adjustments, severance and related charges, and charges associatedwith our real estate portfolio.
Q1 2017Net loss was $5 million, largely reflecting asset/liability management activities.
Royal Bank of Canada First Quarter 2018 19
Quarterly results and trend analysis
Our quarterly results are impacted by a number of trends and recurring factors, which include seasonality of certain businesses,general economic and market conditions, and fluctuations in the Canadian dollar relative to other currencies. The following tablesummarizes our results for the last eight quarters (the period):
Quarterly results (1)
2018 2017 2016
(Millions of Canadian dollars, except per share andpercentage amounts) Q1 Q4 Q3 Q2 Q1 Q4 Q3 Q2
Net interest income $ 4,445 $ 4,361 $ 4,257 $ 4,198 $ 4,324 $ 4,187 $ 4,123 $ 4,025Non-interest income (2) 6,383 6,162 5,831 6,214 5,322 5,177 6,229 5,597
(1) Fluctuations in the Canadian dollar relative to other foreign currencies have affected our consolidated results over the period.(2) Effective Q4 2017, service fees and other costs incurred in association with certain commissions and fees earned are presented on a gross basis in non-interest expense. Comparative amounts have
been reclassified to conform with this presentation.
SeasonalitySeasonal factors may impact our results in certain quarters. The first quarter has historically been stronger for our Capital Marketsbusinesses. The second quarter has fewer days than the other quarters, which generally results in a decrease in net interest incomeand certain expense items. The third and fourth quarters include the summer months which results in lower client activity and maynegatively impact the results of our Capital Markets’ brokerage business and our Wealth Management’s investment managementbusiness.
Specified items affecting our consolidated results• In the first quarter of 2017, our results included our share of a gain related to the sale of the U.S. operations of Moneris of
$212 million (before- and after-tax).• In the third quarter of 2016, our results included a gain of $287 million ($235 million after-tax) related to the sale of RBC
General Insurance Company to Aviva.
Trend analysisThe Canadian economy has generally improved over the period, expanding since the second calendar quarter of 2016 as themanufacturing and mining sectors have been boosted by improving oil prices and positive results from the energy sector, after theimpact of the Alberta wildfires in May 2016. In particular, strong growth throughout 2017 reflected robust gains in consumer spendingamid strong employment growth, low interest rates, and wealth effects from rising home prices. With strong growth over 2017, theBoC raised its overnight rate in January 2018 following two rate hikes in 2017. The U.S. economy also experienced growth over theperiod due to higher household wages, strong job growth, and continued consumer confidence as well as rising business investment.As a result of improving economic conditions, in December 2017, the Fed raised its funds target range for the fourth time over theperiod. Global markets were given a boost since the beginning of 2017 as equity markets continued to rebound from the setbacksseen in 2016, coupled with an optimistic outlook. However, recent volatility has brought equity markets down from their highsreached in mid-January 2018. For further details, refer to the Economic, market, and regulatory review and outlook section.
20 Royal Bank of Canada First Quarter 2018
Earnings have generally trended upwards over the period, driven by our Personal & Commercial Banking results reflecting solidvolume growth, partially offset by lower spreads until the latter half of 2017, higher fee-based revenue and our share of the gain fromthe sale of the U.S. operations of Moneris in the first quarter of 2017. Our Wealth Management results reflect growth in averagefee-based client assets, mainly due to strong capital appreciation and net sales, volume growth, and the impact from higher interestrates since the first half of fiscal 2017. Capital Markets results have trended upwards over the period, driven by higher results inCorporate and Investment Banking and Global Markets driven by increased client activity and generally improved market conditions.The decline in the fourth quarter of 2017 was primarily due to lower trading revenue across most regions, as well as lower M&A andequity origination activity. Q1 2018 saw a rebound in both trading revenue and equity origination activity. Results in our Insurancesegment were impacted by the gain on the sale of our home and auto insurance manufacturing business in the third quarter of 2016as noted previously. Investor & Treasury Services results have generally trended higher over the period due to higher funding andliquidity earnings since the beginning of 2016, reflecting tightening credit spreads, higher foreign exchange market execution, as wellas favourable interest and foreign exchange rates movements. The first quarter of 2018 was negatively impacted by the U.S. TaxReform which resulted in the write-down of net deferred tax assets partially offset by the lower corporate tax rate on U.S. earnings.
Revenue has generally increased over the period, reflecting solid volume and fee-based revenue growth in our Personal &Commercial Banking businesses. The first quarter of 2017 benefitted from the gain on sale of the U.S. operations of Moneris as notedpreviously. Wealth Management revenue has generally trended upwards primarily due to growth in average fee-based client assetsand higher net interest income reflecting volume growth and the impact from higher interest rates since the first half of 2017. CapitalMarkets benefitted from stabilizing credit spreads since early 2016, resulting in higher fixed income trading over the period except inthe latter half of fiscal 2017, which was impacted by reduced market volatility. Fixed income trading revenue has seen some reboundin Q1 2018. The favourable impact of foreign exchange translation due to a generally weaker Canadian dollar over the period waspartially offset by the strengthening Canadian dollar during the past three quarters. Insurance revenue was primarily impacted bychanges in the fair value of investments backing our policyholder liabilities, which is largely offset in PBCAE, and benefitted from thegain on sale of our home and auto insurance manufacturing business in the third quarter of 2016, as noted previously, and the annualfavourable actuarial adjustments in the fourth quarter.
The credit quality of our portfolios has generally improved over the period. In early 2016, higher PCL was related to our CapitalMarkets and Canadian Banking businesses, mainly reflecting the impact of the sustained low oil price environment and generaleconomic uncertainty. PCL trended lower in 2017 due to lower provisions and recoveries in our Capital Markets and Canadian Bankingportfolios, and remained relatively stable in the first quarter of 2018.
PBCAE has fluctuated quarterly as it includes the changes to the fair value of investments backing our policyholder liabilities andthe impact of new group annuity and longevity reinsurance contracts, which is largely offset in revenue. PBCAE has also increased dueto business growth, and has been impacted by actuarial liability adjustments and claims costs over the period.
While we continue to focus on efficiency management activities, non-interest expense has generally trended upwards over theperiod, mostly to support business growth. Growth in non-interest expense in 2017 mainly reflects higher variable compensation inWealth Management and Capital Markets on improved results, as well as higher costs in support of business growth reflectingongoing investments in technology, including digital initiatives. In addition, the first quarter of 2017 included an impairment relatedto properties held for sale, while the third quarter of 2017 was impacted by higher severance costs. The unfavourable impact offoreign exchange translation due to a generally weaker Canadian dollar over the period was partially offset by the strengtheningCanadian dollar during the past three quarters.
Our effective income tax rate has fluctuated over the period, mostly due to varying levels of income reported in jurisdictions withdifferent tax rates, as well as fluctuating levels of income from tax-advantaged sources and various levels of tax adjustments. Oureffective income tax rate has generally been impacted over the period by higher earnings before income taxes and lower tax-exemptincome in 2017. The first quarter of 2018 was adversely impacted by the U.S. Tax Reform which resulted in the write-down of netdeferred tax assets partially offset by the lower corporate tax rate on U.S. earnings.
Results excluding the specified item noted previously are non-GAAP measures. For further details, including a reconciliation, refer tothe Key performance and non-GAAP measures section.
Royal Bank of Canada First Quarter 2018 21
Financial condition
Condensed balance sheets
The following table shows our condensed balance sheets:
As at
(Millions of Canadian dollars)
January 31
2018October 31
2017
Assets (1)
Cash and due from banks $ 34,488 $ 28,407Interest-bearing deposits with banks 37,269 32,662Securities, net of applicable allowance (2) 222,262 218,379Assets purchased under reverse repurchase agreements and securities borrowed 259,765 220,977Loans
Retail 386,235 385,170Wholesale 154,585 159,606
Allowance for loan losses (2,776) (2,159)Other – Derivatives 105,512 95,023
– Other (3) 289,751 247,398Subordinated debentures 8,961 9,265
Total liabilities 1,202,951 1,138,425
Equity attributable to shareholders 72,736 73,829Non-controlling interests 588 599
Total equity 73,324 74,428
Total liabilities and equity $ 1,276,275 $ 1,212,853
(1) Foreign currency-denominated assets and liabilities are translated to Canadian dollars.(2) Securities are comprised of Trading and Investment Securities. Under IFRS 9, Investment securities represent debt and equity securities at FVOCI and debt securities at amortized cost, net of the
applicable allowance. Under IAS 39, investment securities represented available-for-sale securities and held-to-maturity securities. For further details on the impacts of the adoption of IFRS 9, referto Note 2 of our Condensed Financial Statements.
(3) Other – Other assets and liabilities include Segregated fund net assets and liabilities, respectively.
Q1 2018 vs. Q4 2017Total assets increased $63 billion or 5% from last quarter. Foreign exchange translation decreased total assets by $33 billion.
Cash and due from banks was up $6 billion, mainly due to higher deposits with central banks reflecting our cash managementand liquidity requirements.
Interest-bearing deposits with banks increased $5 billion or 14%, largely reflecting higher deposits with central banks.Securities, net of applicable allowance, were up $4 billion or 2%, largely driven by higher equity trading positions reflecting
market conditions and increased government debt securities as higher liquidity management activities were more than offset by thereclassification of certain securities in loans and receivables to investment securities as a result of adopting IFRS 9. These factorswere partially offset by the impact of foreign exchange translation.
Assets purchased under reverse repurchase agreements (reverse repos) and securities borrowed increased $39 billion or 18%,mainly attributable to increased client activities, partially offset by higher financial netting and the impact of foreign exchangetranslation.
Loans were down $4 billion or 1%, largely due to the impact of foreign exchange translation and the reclassification of certainsecurities in loans and receivables to investment securities as mentioned above. These factors were partially offset by volume growthwhich led to higher wholesale loans and residential mortgages in Canada reflecting increased client activities.
Derivative assets were up $10 billion or 11%, mainly attributable to higher fair values on cross currency interest rate swaps andforeign exchange forward contracts, partially offset by the impact of foreign exchange translation.
Other assets were up $4 billion or 6%, largely reflecting higher cash collateral requirements.Total liabilities increased $65 billion or 6%. Foreign exchange translation decreased total liabilities by $33 billion.Deposits increased $10 billion or 1%, mainly as a result of higher business and retail deposits due to increased client demand,
and higher issuances of fixed-term notes, partially offset by the impact of foreign exchange translation.Derivative liabilities were up $12 billion or 13%, mainly attributable to higher fair values on cross currency interest rate swaps
and foreign exchange forward contracts, partially offset by the impact of foreign exchange translation.Other liabilities increased $42 billion or 17%, mainly attributable to higher obligations related to repurchase agreements
reflecting increased client demand partially offset by higher financial netting, and higher cash collateral requirements. These factorswere partially offset by the impact of foreign exchange translation.
Total equity decreased $1 billion or 1% reflecting foreign exchange translation and our adoption of IFRS 9 which resulted in adecrease in equity of $637 million. These factors were partially offset by earnings, net of dividends and share repurchases. For furtherdetails on the impacts of the adoption of IFRS 9, refer to Note 2 of our Condensed Financial Statements.
22 Royal Bank of Canada First Quarter 2018
Off-balance sheet arrangements
In the normal course of business, we engage in a variety of financial transactions that, for accounting purposes, are not recorded onour Consolidated Balance Sheets. Off-balance sheet transactions are generally undertaken for risk, capital and funding managementpurposes which benefit us and our clients. These include transactions with structured entities and may also include the issuance ofguarantees. These transactions give rise to, among other risks, varying degrees of market, credit, liquidity and funding risk, which arediscussed in the Risk management section. Our significant off-balance sheet transactions include those described on pages 48 to 50of our 2017 Annual Report.
Risk management
Credit risk
Effective November 1, 2017, we adopted IFRS 9, which introduced an expected loss accounting model for credit losses that differssignificantly from the incurred loss model under IAS 39 and results in earlier recognition of credit losses. Under IAS 39, credit lossallowances were applied to loans, acceptances, and commitments. Under IFRS 9, credit loss allowances are applied to all financialassets except for those classified or designated as FVTPL and equity securities designated as FVOCI. A description of the newexpected credit loss impairment model is provided below. For further details on our credit risk management practices, refer to theCredit risk section of our 2017 Annual Report.
Expected credit loss impairment modelUnder IFRS 9, credit loss allowances are measured on each reporting date according to a three-stage expected credit loss impairmentmodel. Changes in the required credit loss allowance are recorded in profit or loss as PCL.
Performing financial assetsStage 1From initial recognition of a financial asset to the date on which an asset has experienced a significant increase in credit risk relativeto its initial recognition, a Stage 1 loss allowance is recognized equal to the credit losses expected to result from its default occurringover the earlier of the next 12 months or its maturity date.
Stage 2Following a significant increase in credit risk relative to the initial recognition of the financial asset, a Stage 2 loss allowance isrecognized equal to the credit losses expected over the remaining lifetime of the asset. The assessment of significant increases incredit risk requires considerable judgment and is based primarily on established thresholds for changes in lifetime probability ofdefault. Thresholds are defined at the product and/or business level and may vary across products and businesses.
The assessment for significant increases in credit risk since initial recognition is performed independently as at each reportingdate. Assets can move in both directions through the stages of the impairment model.
Stage 1 and Stage 2 allowances are held against performing loans. The measurement of expected credit losses is primarily based onthe product of the instrument’s probability of default (PD), loss given default (LGD), and exposure at default (EAD), discounted to thereporting date. The main difference between Stage 1 and Stage 2 allowances is the time horizon. Stage 1 allowances are estimatedusing the PD over a maximum period of 12 months while Stage 2 allowances are estimated using the PD over the remaining lifetime ofthe asset. The remaining lifetime of an asset is generally based on its remaining contractual life; however, for certain revolvingproducts, remaining lifetime is based on the period over which we expect to be exposed to credit losses.
An expected credit loss estimate is produced for each individual exposure; however the relevant parameters are modeled on acollective basis. For the small percentage of our portfolios that lack detailed historical information and/or loss experience, we applysimplified measurement approaches that may differ from what is described above. These approaches have been designed tomaximize the available information that is reliable and supportable for each portfolio and may be collective in nature.
Impaired financial assetsStage 3When a financial asset is considered to be credit-impaired, the allowance continues to represent lifetime expected credit losses;however, interest income is calculated based on the amortized cost of the asset, net of the loss allowance, rather than on its grosscarrying amount. Stage 3 allowances are held against impaired loans and effectively replace the allowance for impaired loans underIAS 39. Our assessment of whether an asset is credit-impaired continues to leverage credit risk management processes that existedunder IAS 39. However, our process for estimating the allowance for impaired loans was updated to reflect the requirements of IFRS 9,such as the consideration of multiple forward-looking scenarios in determining the appropriate allowance. The definition of grossimpaired loans for certain products was also shortened to align with our definition of default under IFRS 9, which is generally 90 dayspast due. Loans are written off when there is no realistic probability of recovery.
Allowances in each stage in the expected credit loss model are impacted by a large number of interrelated variables, including but notlimited to, the credit quality of the borrower or instrument, volumes, forecast macroeconomic conditions and migration betweenstages. The measurement of expected credit losses considers information about past events and current conditions as well asreasonable and supportable forecasts of future events and economic conditions. The use of forward looking information is a keyfeature of the IFRS 9 impairment model and requires significant judgment.
Royal Bank of Canada First Quarter 2018 23
Expected loss models are used for both regulatory capital and accounting purposes. Under both models, expected losses arecalculated as the product of PD, LGD and EAD. However, there are certain key differences under current Basel and IFRS 9 reportingframeworks which could lead to significantly different expected loss estimates, including:
• Basel PDs are based on long-run averages over an entire economic cycle. IFRS 9 PDs are based on current conditions, adjustedfor estimates of future conditions that will impact PD under probability-weighted macroeconomic scenarios.
• Basel PDs consider the probability of default over the next 12 months. IFRS 9 PDs consider the probability of default over thenext 12 months only for instruments in Stage 1. Expected credit losses for instruments in Stage 2 are calculated using lifetimePDs.
• Basel LGDs are based on severe but plausible downturn economic conditions. IFRS 9 LGDs are based on current conditions,adjusted for estimates of future conditions that will impact LGD under probability-weighted macroeconomic scenarios.
For further details on the adoption of IFRS 9, including our updated accounting policies, refer to Note 2 of our Condensed FinancialStatements.
Gross credit risk exposure by portfolio, sector and geographyThe following table presents gross credit risk exposure as calculated based on the definitions provided under the Basel III framework.For further details, refer to pages 59-60 of our 2017 Annual Report.
As at
January 31
2018October 31
2017Lending-related and other Trading-related
(Millions of Canadian dollars) Outstanding (1)Undrawn
(1) Represents outstanding balances on loans and acceptances.(2) Undrawn commitments represent an estimate of the contractual amount that may be drawn upon at the time of default of an obligor.(3) Includes credit equivalent amounts for contingent liabilities such as letters of credit and guarantees, outstanding amounts for debt securities carried at FVOCI, deposits with financial institutions
and other assets.(4) Credit equivalent amount after factoring in master netting agreements.(5) Gross credit risk exposure is before allowance for loan losses. Exposures under Basel III asset classes of qualifying revolving retail and other retail are largely included within Personal and Credit
cards, while home equity lines of credit are included in Personal.(6) For further information, refer to Note 5 of our 2017 Annual Consolidated Financial Statements.(7) Geographic profile is based on country of residence of the borrower.
24 Royal Bank of Canada First Quarter 2018
Q1 2018 vs. Q4 2017Total gross credit risk exposure increased $94 billion or 6% from last quarter, primarily due to growth in wholesale exposure largelyrelated to repo-style transactions, cash and due from banks, interest-bearing deposits with banks, guarantees, as well as derivativesexposures.
Retail exposure increased $1 billion, driven by volume growth in our Canadian residential mortgages and personal lendingportfolios, largely offset by a decrease in credit cards related to undrawn commitments.
Wholesale exposure increased $92 billion or 8%, primarily attributable to growth in repo-style transactions, cash and due frombanks, interest-bearing deposits with banks reflecting higher deposits with central banks, guarantees, as well as derivativesexposures. These increases were partially offset by the impact of foreign exchange translation and a decrease in loans. The decreasein loans was due to the reclassification of certain securities in loans and receivables to investment securities as a result of theadoption of IFRS 9, partially offset by volume growth driven by increased client activities.
The geographic mix of our gross credit risk exposure remained relatively unchanged from the prior quarter. Our exposure inCanada, the U.S., Europe and Other International was 47%, 29%, 17% and 7%, respectively (October 31, 2017 – 49%, 30%, 15% and6%, respectively). Growth in the U.S. and Europe was largely driven by business growth in repo-style transactions and increaseddeposits with central banks, partially offset by the impact of foreign exchange translation.
Net European exposure by country, asset type and client type (1), (2)
As atJanuary 31
2018October 31
2017Asset type Client type
(Millions of Canadian dollars)Loans
Outstanding Securities (3)Repo-style
transactions Derivatives Financials Sovereign Corporate Total Total
Total Other Europe $ 3,371 $ 27,169 $ 244 $ 475 $ 10,478 $ 17,456 $ 3,325 $ 31,259 $ 26,220
Net exposure to Europe (6) $ 14,271 $ 63,692 $ 1,799 $ 3,104 $ 27,375 $ 40,866 $ 14,625 $ 82,866 $ 73,244
(1) Geographic profile is based on country of risk, which reflects our assessment of the geographic risk associated with a given exposure. Typically, this is the residence of the borrower.(2) Exposures are calculated on a fair value basis and net of collateral, which includes $105 billion against repo-style transactions (October 31, 2017 – $77.7 billion) and $13.5 billion against
derivatives (October 31, 2017 – $12.6 billion).(3) Securities include $17.1 billion of trading securities (October 31, 2017 – $20 billion), $34 billion of deposits (October 31, 2017 – $19.7 billion), and $12.6 billion of securities carried at FVOCI,
(October 31, 2017 – $14.8 billion).(4) Gross credit risk exposure to peripheral Europe is comprised of Ireland $26.4 billion (October 31, 2017 – $19.3 billion), Italy $0.3 billion (October 31, 2017 – $0.4 billion), Portugal $nil (October 31,
2017 – $nil), and Spain $1.5 billion (October 31, 2017 – $1.0 billion).(5) Excludes $2.8 billion (October 31, 2017 – $2.7 billion) of exposures to supranational agencies.(6) Reflects $1.6 billion of mitigation through credit default swaps, which are largely used to hedge single name exposures and market risk (October 31, 2017 – $1.4 billion).
Q1 2018 vs. Q4 2017Net credit risk exposure to Europe increased $9.6 billion from last quarter, largely driven by increased exposure in the U.K. andLuxembourg, partially offset by decreased exposure in Germany. Our net exposure to peripheral Europe, which includes Ireland, Italy,Portugal and Spain remained minimal, with total outstanding exposure decreasing $0.2 billion during the quarter to $1.4 billion.
Our European corporate loan book is managed on a global basis with underwriting standards reflecting the same approach to theuse of our balance sheet as we have applied in both Canada and the U.S. Total PCL taken on this portfolio during the quarter was$16 million. The gross impaired loans ratio of this loan book was 170 bps, up from 100 bps last quarter.
Royal Bank of Canada First Quarter 2018 25
Residential mortgages and home equity lines of credit (insured vs. uninsured)Residential mortgages and home equity lines of credit are secured by residential properties. The following table presents a breakdownby geographic region:
As at January 31, 2018
Residential mortgagesHome equity
lines of credit (1)
(Millions of Canadian dollars, exceptpercentage amounts) Insured (2) Uninsured Total Total
(1) Home equity lines of credit include revolving and non-revolving loans.(2) Insured residential mortgages are mortgages whereby our exposure to default is mitigated by insurance through the Canada Mortgage and Housing
Corporation (CMHC) or other private mortgage default insurers.(3) Region is based upon address of the property mortgaged. The Atlantic provinces are comprised of Newfoundland and Labrador, Prince Edward Island,
Nova Scotia and New Brunswick, and B.C. and territories are comprised of British Columbia, Nunavut, Northwest Territories and Yukon.(4) Total consolidated residential mortgages in Canada of $258 billion (October 31, 2017 – $256 billion) is largely comprised of $233 billion (October 31,
2017 – $231 billion) of residential mortgages and $7 billion (October 31, 2017 – $6 billion) of mortgages with commercial clients, of which $4 billion(October 31, 2017 – $4 billion) are insured mortgages, both in Canadian Banking, and $18 billion (October 31, 2017 – $19 billion) of residentialmortgages in Capital Markets held for securitization purposes.
(5) The residential mortgages amounts exclude our third-party mortgage-backed securities (MBS) of $27 million as at October 31, 2017.
Home equity lines of credit are uninsured and reported within the personal loan category. As at January 31, 2018, home equity lines ofcredit in Canadian Banking were $40 billion (October 31, 2017 – $41 billion). Approximately 98% of these home equity lines of credit(October 31, 2017 – 98%) are secured by a first lien on real estate, and only 7% (October 31, 2017 – 7%) of the total homeline clientspay the scheduled interest payment only.
26 Royal Bank of Canada First Quarter 2018
Residential mortgages portfolio by amortization periodThe following table provides a summary of the percentage of residential mortgages that fall within the remaining amortization periodsbased upon current customer payment amounts, which incorporate payments larger than the minimum contractual amount and/orhigher frequency of payments:
As at
January 312018
October 312017
CanadaU.S. and Other
International Total CanadaU.S. and Other
International Total
Amortization period≤ 25 years 72% 43% 70% 73% 43% 71%> 25 years ≤ 30 years 24 57 26 24 57 26> 30 years ≤ 35 years 4 – 4 3 – 3
Total 100% 100% 100% 100% 100% 100%
Average loan-to-value (LTV) ratio for newly originated and acquired uninsured residential mortgages and homeline productsThe following table provides a summary of our average LTV ratio for newly originated and acquired uninsured residential mortgagesand homeline products by geographic region:
For the three months ended
January 31
2018October 31
2017Uninsured Uninsured
Residentialmortgages (1)
Homelineproducts (2)
Residentialmortgages (1)
Homelineproducts (2)
Region (3)
Atlantic provinces 74% 74% 74% 74%Quebec 72 73 72 73Ontario 70 67 70 67Alberta 74 71 73 72Saskatchewan and Manitoba 74 74 74 75B.C. and territories 68 64 69 65U.S. 69 n.m. 74 n.m.Other International 59 n.m. 60 n.m.
Average of newly originated and acquired for the period (4), (5) 70% 68% 70% 68%
Total Canadian Banking residential mortgages portfolio (6) 55% 50% 53% 49%(1) Residential mortgages exclude residential mortgages within the homeline products.(2) Homeline products are comprised of both residential mortgages and home equity lines of credit.(3) Region is based upon address of the property mortgaged. The Atlantic provinces are comprised of Newfoundland and Labrador, Prince Edward Island, Nova Scotia and
New Brunswick, and B.C. and territories are comprised of British Columbia, Nunavut, Northwest Territories and Yukon.(4) The average LTV ratio for newly originated and acquired uninsured residential mortgages and homeline products is calculated on a weighted basis by mortgage
amounts at origination.(5) For newly originated mortgages and homeline products, LTV is calculated based on the total facility amount for the residential mortgage and homeline product divided
by the value of the related residential property.(6) Weighted by mortgage balances and adjusted for property values based on the Teranet – National Bank National Composite House Price Index.n.m. not meaningful
We employ a risk-based approach to property valuation. Property valuation methods include automated valuation models (AVM) andappraisals. An AVM is a tool that estimates the value of a property by reference to market data including sales of comparableproperties and price trends specific to the Metropolitan Statistical Area in which the property being valued is located. Using a risk-based approach, we also employ appraisals which can include drive-by or full on-site appraisals.
We continue to actively manage our entire mortgage portfolio and perform stress testing, based on a combination of increasingunemployment, rising interest rates and a downturn in real estate markets.
Royal Bank of Canada First Quarter 2018 27
Credit quality performanceThe following Credit quality performance tables and analysis provide information on loans, which represents loans, acceptances andcommitments, and other financial assets.
Provision for (recovery of) credit lossIFRS 9 IAS 39
For the three months ended
(Millions of Canadian dollars, except percentage amounts)
January 31
2018October 31
2017January 31
2017
Personal & Commercial Banking $ 312 $ 270 $ 249Wealth Management (2) – 13Capital Markets 25 (38) 32Corporate Support and Other (1) (1) 2 –
(1) Prior period amounts primarily comprised of PCL for loans not yet identified as impaired. For further information, refer to the How we measure and report our business segments section.(2) Represents Stage 1 and 2 PCL on loans, acceptances, and commitments under IFRS 9 and PCL for loans not yet identified as impaired under IAS 39.(3) Represents Stage 3 PCL under IFRS 9 and PCL on impaired loans under IAS 39.(4) PCL ratio – Loans is calculated using PCL on Loans as a percentage of average net loans and acceptances.(5) PCL on impaired loans ratio is calculated using PCL on impaired loans as a percentage of average net loans and acceptances. PCL on impaired loans represents Stage 3 PCL on loans, acceptances,
and commitments under IFRS 9 and PCL on impaired loans under IAS 39.(6) Geographic information is based on residence of borrower.(7) Includes acquired credit-impaired loans.
Q1 2018 vs. Q1 2017Total PCL is $334 million. PCL on loans of $334 million increased $40 million, or 14% from the prior year, mainly due to higherprovisions in Personal & Commercial Banking which were partially offset by lower provisions in Wealth Management and CapitalMarkets. PCL on loans also reflects the adoption of IFRS 9 on November 1, 2017. The PCL ratio on loans of 24 bps increased 2 bps.
PCL on performing loans of $9 million since the adoption of IFRS 9 was due to an increase in provisions in the Canadian PersonalBanking portfolios, largely offset by a decrease in provisions in Capital Markets and Wealth Management during the quarter.
PCL on impaired loans of $325 million is $31 million higher than the prior year, mainly due to higher provisions in Personal &Commercial Banking and fewer recoveries and lower provisions in Capital Markets, partially offset by lower provisions in WealthManagement.
PCL on loans in Personal & Commercial Banking increased $63 million, or 25%, mainly due to the adoption of IFRS 9, which led to newprovisions on performing loans in the Canadian Personal Banking portfolios largely driven by volume growth. There were also higherprovisions on impaired loans in the Canadian Personal Banking and Caribbean Banking portfolios.
PCL on loans in Wealth Management decreased $15 million, due to lower provisions on impaired loans in U.S. WealthManagement (including City National) and a decrease in provisions on performing loans from improvements in economic conditionssince the adoption of IFRS 9.
28 Royal Bank of Canada First Quarter 2018
PCL on loans in Capital Markets decreased $7 million, or 22%, due to a decrease in provisions on performing loans fromimprovements in economic conditions since the adoption of IFRS 9, and lower provisions on impaired loans, largely offset by fewerrecoveries.
Q1 2018 vs. Q4 2017PCL on loans of $334 million increased $100 million, or 43% from the prior quarter, mainly due to higher provisions in Capital Markets andPersonal & Commercial Banking. PCL on loans also reflects the adoption of IFRS 9, as noted above. PCL ratio on loans increased 7 bps.
PCL on performing loans of $9 million since the adoption of IFRS 9 was due to an increase in provisions in the Canadian PersonalBanking portfolios, mainly offset by a decrease in provisions in Capital Markets and Wealth Management during the quarter.
PCL on impaired loans of $325 million increased $91 million from the prior quarter, mainly due to fewer recoveries and higherprovisions in Capital Markets.
PCL on loans in Personal & Commercial Banking increased $42 million, or 16%, mainly due to the adoption of IFRS 9, which led to newprovisions on performing loans in the Canadian Personal Banking portfolios largely driven by volume growth.
PCL on loans in Wealth Management decreased $2 million due to a decrease in provisions on performing loans as a result ofimprovements in economic conditions since the adoption of IFRS 9. This was largely offset by higher provisions on impaired loans inU.S. Wealth Management (including City National).
PCL on loans in Capital Markets increased $63 million, driven by higher PCL on impaired loans mainly due to fewer recoveries andhigher provisions, partially offset by a decrease in provisions on performing loans from improvements in economic conditions sincethe adoption of IFRS 9.
Gross impaired loans (GIL)IFRS 9 IAS 39
As at
(Millions of Canadian dollars, except percentage amounts)
January 31
2018October 31
2017January 31
2017
Personal & Commercial Banking $ 1,713 $ 1,500 $ 1,537Wealth Management (1) 273 549 610Capital Markets 541 527 1,396Investor & Treasury Services – – –Corporate Support and Other – – 16
Total GIL (2) $ 2,527 $ 2,576 $ 3,559
Canada (3)
Retail $ 715 $ 559 $ 639Wholesale 518 426 427
GIL 1,233 985 1,066
U.S. (1), (3)
Retail $ 39 $ 59 $ 50Wholesale 386 736 1,653
GIL 425 795 1,703
Other International (3)
Retail $ 327 $ 345 $ 355Wholesale 542 451 435
GIL 869 796 790
Total GIL (2) $ 2,527 $ 2,576 $ 3,559
Impaired loans, beginning balance $ 2,576 $ 2,896 $ 3,903Classified as impaired during the period (new impaired) (4) 694 525 649Net repayments (4) (126) (313) (434)Amounts written off (321) (384) (336)Other (1), (2), (4), (5) (296) (148) (223)
Impaired loans, balance at end of period $ 2,527 $ 2,576 $ 3,559
GIL ratio (6)
Total GIL ratio 0.45% 0.46% 0.66%Personal & Commercial Banking 0.41% 0.36% 0.39%
Canadian Banking 0.29% 0.24% 0.26%Caribbean Banking 6.44% 6.33% 6.70%
(1) Effective November 1, 2017, GIL excludes $229 million of ACI loans related to our acquisition of City National that have returned to performing status. As at January 31, 2018, $24 million of ACIloans that remain impaired are included in GIL. As at October 31, 2017 and January 31, 2017, GIL includes $256 million and $348 million related to the ACI loans portfolio from our acquisition ofCity National. ACI loans included in GIL added 0 bps, 5 bps and 6 bps to our January 31, 2018, October 31, 2017 and January 31, 2017 GIL ratios, respectively. For further details, refer to Note 5 ofour Condensed Financial Statements.
(2) Effective November 1, 2017, the definition of gross impaired loans has been shortened for certain products to align with a definition of default of 90 days past due under IFRS 9, resulting in anincrease in GIL of $134 million.
(3) Geographic information is based on residence of borrower.(4) Certain GIL movements for Canadian Banking retail and wholesale portfolios are generally allocated to New Impaired, as Return to performing status, Net repayments, Sold, and Exchange and other
movements amounts are not reasonably determinable. Certain GIL movements for Caribbean Banking retail and wholesale portfolios are generally allocated to Net repayments and New Impaired, asReturn to performing status, Sold, and Exchange and other movements amounts are not reasonably determinable.
(5) Includes Return to performing status during the period. Recoveries of loans and advances previously written off, Sold, and Exchange and other movements.(6) GIL as a % of Related loans and acceptances.
Royal Bank of Canada First Quarter 2018 29
Q1 2018 vs. Q1 2017Total GIL decreased $1,032 million or 29% from the prior year, and the total GIL ratio of 45 bps improved 21 bps, largely reflectinglower impaired loans in Capital Markets and Wealth Management, partially offset by higher impaired loans in Personal & CommercialBanking.
GIL in Personal & Commercial Banking increased $176 million or 11%, with $134 million of the increase due to a change in thedefinition of impaired under IFRS 9 for certain products in our Canadian Personal Banking portfolios. Higher impaired loans in ourCanadian Business Banking portfolios also contributed to the increase.
GIL in Wealth Management decreased $337 million or 55%. This mainly reflects fewer impaired loans in U.S. Wealth Management(including City National) due to the exclusion of $229 million in ACI loans that have returned to performing status since ouracquisition of City National and a change in the definition of impaired for certain products.
GIL in Capital Markets decreased $855 million or 61%, mainly due to lower impaired loans compared to prior year.
Q1 2018 vs. Q4 2017Total GIL decreased $49 million or 2% from the prior quarter, and the total GIL ratio of 45 bps improved 1 bp.
GIL in Personal & Commercial Banking increased $213 million or 14% from the prior quarter, mainly due to higher impaired loansin our Canadian Personal Banking portfolios due to the adoption of IFRS 9 as noted above, and higher impaired loans in our CanadianBusiness Banking portfolios.
GIL in Wealth Management decreased $276 million or 50%, mainly reflecting fewer impaired loans in U.S. Wealth Management(including City National) due to the exclusion of ACI loans and a change in the definition of impaired for certain products.
GIL in Capital Markets increased $14 million or 3%, mainly due to higher impaired loans on a couple of accounts, partially offsetby loans returning to performing status and recoveries.
(1) Prior period amounts in Corporate Support primarily comprised of Allowance for loans not yet identified as impaired. Under IFRS 9, Stage 1 and Stage 2 ACL are recorded within the respectivebusiness segment. For further information, refer to the How we measure and report our business segments section.
(2) Represents Stage 1 and Stage 2 ACL on loans, acceptances, and commitments under IFRS 9 and Allowance for loans not yet identified as impaired under IAS 39.(3) Represents Stage 3 ACL on loans, acceptances, and commitments under IFRS 9 and Allowance for impaired loans under IAS 39.(4) Geographic information is based on residence of borrower.
30 Royal Bank of Canada First Quarter 2018
Q1 2018 vs. Q1 2017Total ACL of $3,098 million increased $768 million or 33% from the prior year, which resulted in an increase of $665 million in ACL onloans and the inclusion of $103 million in ACL on other financial assets primarily due to the adoption of IFRS 9.
ACL on performing loans of $2,242 million is $727 million higher than the Allowance for loans not yet identified as impaired of$1,515 million in the prior year. The increase is due to the adoption of IFRS 9, and primarily reflects higher ACL on loans in theCanadian Personal Banking portfolios.
ACL on impaired loans of $753 million decreased $62 million from prior year, mainly due to lower ACL on loans in CapitalMarkets.
Q1 2018 vs. Q4 2017Total ACL of $3,098 million increased $848 million or 38% from the prior quarter, reflecting an increase of $745 million in ACL onloans and the inclusion of $103 million in ACL on other financial assets primarily due to the adoption of IFRS 9, as noted above.
ACL on performing loans is $729 million higher than the Allowance for loans not yet identified as impaired of $1,513 million inthe prior quarter. The increase is due to the adoption of IFRS 9 and primarily reflects higher ACL on loans in the Canadian PersonalBanking portfolios.
ACL on impaired loans of $753 million increased $16 million from prior quarter, primarily due to higher ACL on loans in CapitalMarkets and Personal & Commercial Banking, partially offset by lower ACL on loans in Wealth Management.
For further details, refer to Notes 2 and 5 of our Condensed Financial Statements.
Market risk
Market risk is defined to be the impact of market prices upon our financial condition. This includes potential gains or losses due tochanges in market determined variables such as interest rates, credit spreads, equity prices, commodity prices, foreign exchangerates and implied volatilities. There have been no material changes to our Market Risk Framework from the framework described in our2017 Annual Report. We continue to manage the controls and governance procedures that ensure that our market risk exposure isconsistent with risk appetite constraints set by the Board of Directors. These controls include limits on probabilistic measures ofpotential loss in trading positions, such as Value-at-Risk (VaR) and Stressed Value-at-Risk (SVaR). For further details of our approachto the management of market risk, refer to the Market risk section of our 2017 Annual Report.
Market risk controls are also in place to manage structural interest rate risk (SIRR) arising from traditional banking products.Factors contributing to SIRR include the mismatch between future asset and liability repricing dates, relative changes in asset andliability rates, and product features that could affect the expected timing of cash flows, such as options to pre-pay loans or redeemterm deposits prior to contractual maturity. To monitor and control SIRR, we assess two primary financial metrics, 12-month NetInterest Income (NII) risk and Economic Value of Equity (EVE) risk, under a range of market shocks and scenarios. There has been nomaterial change to the SIRR measurement methodology, controls, or limits from those described in our 2017 Annual Report.
Market risk measures – FVTPL positions
VaR and SVaRThe following table presents our Market risk VaR and Market risk SVaR figures.
January 31, 2018 October 31, 2017 January 31, 2017
As atJan. 31
For thethree months ended As at
Oct. 31
For thethree months ended As at
Jan. 31
For thethree months ended
(Millions of Canadian dollars) Average High Low Average Average
(1) General credit spread risk and funding spread risk associated with uncollateralized derivatives are included under interest rate VaR.(2) Credit specific risk captures issuer-specific credit spread volatility.(3) Market risk VaR is less than the sum of the individual risk factor VaR results due to portfolio diversification.n.m. not meaningful
Royal Bank of Canada First Quarter 2018 31
Q1 2018 vs. Q1 2017Average market risk VaR of $25 million increased $2 million from the prior year, largely due to the change in classification of certainequity and interest rate-sensitive portfolios from available-for-sale to FVTPL as a result of adopting IFRS 9. This was partially offset bythe impact of foreign exchange translation.
Average SVaR of $81 million increased $26 million from the prior year, largely driven by the adoption of IFRS 9 as mentionedabove. Additionally, larger inventories in certain fixed income portfolios were seen in December 2017 due to market pressure arisingfrom tax changes in the U.S. and demands for USD funding. Client-driven activity in our equity derivative trading business alsocontributed to the increase.
Q1 2018 vs. Q4 2017Average market risk VaR of $25 million increased $7 million from the prior quarter, largely driven by the adoption of IFRS 9 asmentioned above. In addition, equity exposures were higher on average in the current quarter due to increased client-driven activity involatile equity derivative markets, as compared to reduced activity in the prior quarter due to subdued market volatility.
Average SVaR of $81 million increased $35 million from the prior quarter, due to the adoption of IFRS 9, client-driven activity inequity derivative markets and higher fixed income inventories as noted above.
The following chart displays a bar graph of our daily trading profit and loss and a line graph of our daily market risk VaR. We incurredno net trading losses in the three months ended January 31, 2018 and October 31, 2017.
-40
-20
0
20
40
Daily Trading Revenue Market Risk VaR
Feb 1, 2
017
Apr 30, 2
017
July
31, 2017
Oct 31, 2
017
Jan 31, 2018
Trading Revenue and VaR (Millions of Canadian dollars)
30
10
-10
-30
Market risk measures for other FVTPL positions – Assets and liabilities of RBC InsuranceWe offer a range of insurance products to clients and hold investments to meet the future obligations to policyholders. Theinvestments which support actuarial liabilities are predominantly fixed income assets designated as FVTPL. Consequently, changes inthe fair values of these assets are recorded in investment income in the consolidated statements of income and are largely offset bychanges in the fair value of the actuarial liabilities, the impact of which is reflected in insurance policyholder benefits and claims. Asat January 31, 2018, we had liabilities with respect to insurance obligations of $10.0 billion, up from $9.7 billion in the prior quarter,and trading securities of $7.9 billion in support of the liabilities, up from $7.7 billion last quarter.
Market risk measures – Structural Interest Rate SensitivitiesThe following table shows the potential before-tax impact of an immediate and sustained 100 bps increase or decrease in interestrates on projected 12-month NII and EVE for our structural balance sheet, assuming no subsequent hedging. Rate floors are appliedwithin the declining rates scenarios, with floor levels set based on rate changes experienced globally. Interest rate risk measures arebased upon interest rate exposures at a specific time and continuously change as a result of business activities and managementactions.
January 31
2018October 31
2017January 31
2017EVE risk NII risk (1)
(Millions of Canadian dollars)
Canadiandollar
impact
U.S.dollar
impact (2) Total
Canadiandollar
impact
U.S.dollar
impact (2) Total EVE risk NII risk (1) EVE risk NII risk (1)
(1) Represents the 12-month NII exposure to an instantaneous and sustained shift in interest rates.(2) Represents the impact on the SIRR portfolios held in our City National and U.S. banking operations.
32 Royal Bank of Canada First Quarter 2018
As at January 31, 2018, an immediate and sustained -100 bps shock would have had a negative impact to our NII of $578 million,down from $604 million last quarter. An immediate and sustained +100 bps shock at the end of January 31, 2018 would have had anegative impact to the Bank’s EVE of $1,224 million, largely consistent with $1,215 million reported last quarter. The quarter-over-quarter decrease in NII risk was mainly attributed to hedging of balance sheet growth. During the first quarter of 2018, NII and EVErisks remained well within approved limits.
Market risk measures for other material non-trading portfolios
Investment securities carried at FVOCIWe held $47.5 billion of investment securities carried at FVOCI as at January 31, 2018. At October 31, 2017, we held $75.9 billion ofavailable-for-sale securities (AFS). The quarter-over-quarter decrease was largely driven by the change in classification of certainportfolios as a result of adopting IFRS 9. We hold debt securities carried at FVOCI primarily as investments, as well as to manageliquidity risk and hedge interest rate risk in our non-trading banking balance sheet. As at January 31, 2018, our portfolio of investmentsecurities carried at FVOCI is interest rate sensitive and would impact OCI by a pre-tax change in value of $8.1 million as measured bythe change in the value of the securities for a one basis point parallel increase in yields. The portfolio also exposes us to credit spreadrisk of a pre-tax change in value of $20.2 million, as measured by the change in value for a one basis point widening of credit spreads.The value of the investment securities carried at FVOCI included in our SIRR measure as at January 31, 2018 was $9.7 billion. Ourinvestment securities carried at FVOCI also include equity exposures of $0.4 billion as at January 31, 2018. At October 31, 2017, ourAFS securities included equity exposures of $1.2 billion.
Derivatives related to non-trading activityDerivatives are also used to hedge market risk exposures unrelated to our trading activity. In aggregate, derivative assets not relatedto trading activity of $3.7 billion as at January 31, 2018 were up from $3.2 billion last quarter, and derivative liabilities of $3.3 billionas at January 31, 2018 were up from $3.2 billion last quarter.
Non-trading derivatives in hedge accounting relationshipsThe derivative assets and liabilities described above include derivative assets in a designated hedge accounting relationship of$1.6 billion as at January 31, 2018, up from $1.3 billion as at October 31, 2017, and derivative liabilities of $1.5 billion as atJanuary 31, 2018, unchanged from $1.5 billion last quarter. These derivative assets and liabilities are included in our SIRR measureand other internal non-trading market risk measures. We use interest rate swaps to manage our investment securities and SIRR. To theextent these swaps are considered effective, changes in their fair value are recognized in other comprehensive income. The interestrate risk for the swaps designated as cash flow hedges, measured as the change in the fair value of the derivatives for a one basispoint parallel increase in yields, was $6.5 million as of January 31, 2018 compared to $7.7 million as of October 31, 2017.
Interest rate swaps are also used to hedge changes in the fair value of certain fixed-rate instruments. Changes in fair value of thehedged instruments that are related to interest rate movements and the corresponding interest rate swaps are reflected in theconsolidated statement of income.
We also use foreign exchange derivatives to manage our exposure to equity investments in subsidiaries that are denominated inforeign currencies, particularly the U.S. dollar, British pound, and Euro. Changes in the fair value of these hedges and the cumulativetranslation adjustment related to our structural foreign exchange risk are reported in other comprehensive income.
Other non-trading derivativesDerivatives, including interest rate swaps and foreign exchange derivatives, that are not in designated hedge accounting relationshipsare used to manage other non-trading exposures. Changes in the fair value of these derivatives are reflected in the consolidatedstatement of income. Derivative assets of $2.1 billion as at January 31, 2018 were up from $1.9 billion as at October 31, 2017, andderivative liabilities of $1.8 billion as at January 31, 2018 were up from $1.7 billion last quarter.
Non-trading foreign exchange rate riskForeign exchange rate risk is the potential adverse impact on earnings and economic value due to changes in foreign currency rates.Our revenue, expenses and income denominated in currencies other than the Canadian dollar are subject to fluctuations as a result ofchanges in the value of the average Canadian dollar relative to the average value of those currencies. Our most significant exposure isto the U.S. dollar, due to our operations in the U.S. and other activities conducted in U.S. dollars. Other significant exposures are tothe British pound and the Euro, due to our activities conducted internationally in these currencies. A strengthening or weakening ofthe Canadian dollar compared to the U.S. dollar, British pound and the Euro could reduce or increase, as applicable, the translatedvalue of our foreign currency denominated revenue, expenses and income and could have a significant effect on the results of ouroperations. We are also exposed to foreign exchange rate risk arising from our investments in foreign operations. For unhedged equityinvestments, when the Canadian dollar appreciates against other currencies, the unrealized translation losses on net foreigninvestments decreases our shareholders’ equity through the other components of equity and decreases the translated value of theRisk-weighted Assets (RWA) of the foreign currency-denominated asset. The reverse is true when the Canadian dollar depreciatesagainst other currencies. Consequently, we consider these impacts in selecting an appropriate level of our investments in foreignoperations to be hedged.
Our overall trading and non-trading market risk objectives, policies and methodologies have not changed significantly from thosedescribed in our 2017 Annual Report.
Royal Bank of Canada First Quarter 2018 33
Linkage of market risk to selected balance sheet itemsThe following table provides the linkages between selected balance sheet items with positions included in our trading market risk andnon-trading market risk disclosures, which illustrates how we manage market risk for our assets and liabilities through different riskmeasures:
As at January 31, 2018
Market risk measure
(Millions of Canadian dollars)Balance sheet
amount Traded risk (1)Non-traded
risk (2)Non-traded risk
primary risk sensitivity
Assets subject to market riskCash and due from banks (3) $ 34,488 $ – $ 34,488 Interest rateInterest-bearing deposits with banks (4) 37,269 18,877 18,392 Interest rateSecurities
Subordinated debentures 8,961 – 8,961 Interest ratePreferred share liabilities – – –Liabilities not subject to market risk (17) 5,206
Total liabilities $ 1,202,951 $ 396,110 $ 801,635
Total equity $ 73,324
Total liabilities and equity $ 1,276,275
(1) Traded risk includes positions that are classified or designated as FVTPL and positions whose revaluation gains and losses are reported in revenue. Market risk measures of VaR and SVaR and stresstesting are used as risk controls for traded risk.
(2) Non-traded risk includes positions used in the management of the SIRR and other non-trading portfolios. Other material non-trading portfolios include positions from RBC Insurance and investmentsecurities, net of applicable allowance, not included in SIRR.
The following footnotes provide additional information on the Non-traded risk amounts:(3) Cash and due from banks includes $22,803 million included in SIRR. An additional $11,685 million is included in other risk controls.(4) Interest-bearing deposits with banks of $18,392 million are included in SIRR.(5) Trading securities include $7,859 million in securities for asset/liability management of RBC Insurance.(6) Includes investment securities carried at FVOCI of $47,543 million and investment securities, net of applicable allowance, carried at amortized cost of $45,358 million. $55,091 million of the total
securities are included in SIRR. An additional $2,053 million are held by RBC Insurance. The remaining $35,757 million are captured in other internal non-trading market risk reporting.(7) Assets purchased under reverse repurchase agreements include $32,684 million reflected in SIRR. An additional $41,896 million is included in other risk controls.(8) Retail loans include $367,702 million reflected in SIRR and $261 million is used for asset/liability management of RBC Insurance. An additional $10,495 million is included in other risk controls.(9) Wholesale loans include $143,449 million reflected in SIRR. An additional $1,741 million is used for asset/liability management of RBC Insurance.(10) Investments for the account of segregated fund holders are included in RBC Insurance risk measures.(11) Other assets include $42,100 million reflected in SIRR and $2,317 million is used for asset/liability management of RBC Insurance. An additional $25,771 million is included in other risk controls.(12) Assets not subject to market risk include $5,274 million of physical and other assets.(13) Deposits include $648,512 million reflected in SIRR. The remaining $68,269 million are captured in other internal non-trading market risk reporting.(14) Insurance and investment contracts for the account of segregated fund holders are included in RBC Insurance risk measures.(15) Obligations related to assets sold under repurchase agreements and securities loaned include $776 million reflected in SIRR. An additional $5,017 million is included in other risk controls.(16) Other liabilities include $38,899 million reflected in SIRR and $10,648 million of RBC Insurance liabilities. An additional $15,987 million is included in other risk controls.(17) Liabilities not subject to market risk include $5,206 million of payroll related and other liabilities.
34 Royal Bank of Canada First Quarter 2018
As at October 31, 2017
Market risk measure
(Millions of Canadian dollars)Balance sheet
amount Traded risk (1)Non-traded
risk (2)Non-traded risk
primary risk sensitivity
Assets subject to market riskCash and due from banks (3) $ 28,407 $ – $ 28,407 Interest rateInterest-bearing deposits with banks (4) 32,662 20,792 11,870 Interest rateSecurities
Subordinated debentures 9,265 – 9,265 Interest ratePreferred share liabilities – – –Liabilities not subject to market risk (17) 7,525
Total liabilities $ 1,138,425 $ 337,767 $ 793,133
Total equity $ 74,428
Total liabilities and equity $ 1,212,853
(1) Traded risk includes positions that are classified or designated as FVTPL and positions whose revaluation gains and losses are reported in revenue. Market risk measures of VaR and SVaR and stresstesting are used as risk controls for traded risk.
(2) Non-traded risk includes positions used in the management of the SIRR and other non-trading portfolios. Other material non-trading portfolios include positions from RBC Insurance and investmentsecurities, net of applicable allowance, not included in SIRR.
The following footnotes provide additional information on the Non-traded risk amounts:(3) Cash and due from banks includes $15,895 million included in SIRR. An additional $12,512 million is included in other risk controls.(4) Interest-bearing deposits with banks of $11,870 million are included in SIRR.(5) Trading securities include $7,706 million in securities for asset/liability management of RBC Insurance. An additional $136 million is included in other risk controls.(6) Includes AFS securities of $75,877 million and held-to-maturity securities of $14,845 million. $51,269 million of the total securities are included in SIRR. An additional $1,946 million are held by
RBC Insurance. The remaining $37,507 million are captured in other internal non-trading market risk reporting.(7) Assets purchased under reverse repurchase agreements include $32,541 million reflected in SIRR. An additional $46,904 million is included in other risk controls.(8) Retail loans include $366,928 million reflected in SIRR and $241 million is used for asset/liability management of RBC Insurance. An additional $10,363 million is included in other risk controls.(9) Wholesale loans include $153,829 million reflected in SIRR. An additional $1,560 million is used for asset/liability management of RBC Insurance.(10) Investments for the account of segregated fund holders are included in RBC Insurance risk measures.(11) Other assets include $37,999 million reflected in SIRR and $2,428 million is used for asset/liability management of RBC Insurance. An additional $26,112 million is included in other risk controls.(12) Assets not subject to market risk include $5,027 million of physical and other assets.(13) Deposits include $650,841 million reflected in SIRR. The remaining $60,600 million are captured in other internal non-trading market risk reporting.(14) Insurance and investment contracts for the account of segregated fund holders are included in RBC Insurance risk measures.(15) Obligations related to assets sold under repurchase agreements and securities loaned include $6,713 million included in other risk controls.(16) Other liabilities include $36,019 million reflected in SIRR and $10,318 million of RBC Insurance liabilities. An additional $14,953 million is included in other risk controls.(17) Liabilities not subject to market risk include $7,525 million of payroll related and other liabilities.
Liquidity and funding risk
Liquidity and funding risk (liquidity risk) is the risk that we may be unable to generate sufficient cash or its equivalents in a timely andcost-effective manner to meet our commitments as they come due. Liquidity risk arises from mismatches in the timing and value ofon-balance sheet and off-balance sheet cash flows.
Our Liquidity Risk Management Framework (LRMF) is designed to ensure sufficient liquidity resources to satisfy current andprospective commitments in both business-as-usual and stressed conditions. There have been no material changes to our LRMF asdescribed in our 2017 Annual Report.
We continue to maintain liquidity and funding that is appropriate for the execution of our strategy. Liquidity risk remains wellwithin our risk appetite.
Royal Bank of Canada First Quarter 2018 35
Liquidity reserveOur liquidity reserve consists of available unencumbered liquid assets as well as uncommitted and undrawn central bank borrowingfacilities that could be accessed under extraordinary circumstances subject to satisfying certain preconditions as set by variousCentral Banks (e.g. BoC, the Fed, Bank of England, and Bank of France).
To varying degrees, unencumbered liquid assets represent a ready source of funding. Unencumbered assets are the differencebetween total and encumbered assets from both on- and off-balance sheet sources. Encumbered assets, in turn, are not considered asource of liquidity in measures of liquidity risk.
Although unused wholesale funding capacity, which is regularly assessed, could be another potential source of liquidity tomitigate stressed conditions, it is excluded in the determination of our liquidity reserve.
As at January 31, 2018
(Millions of Canadian dollars)Bank-owned
liquid assets (1)
Securitiesreceived as
collateral fromsecurities
financing andderivative
transactionsTotal liquid
assetsEncumberedliquid assets
Unencumberedliquid assets
Cash and holding at central banks $ 51,082 $ – $ 51,082 $ 1,982 $ 49,100Deposits in other banks available overnight 3,342 – 3,342 589 2,753Securities issued or guaranteed by sovereigns, central banks or
multilateral development banks (2) 337,749 32,755 370,504 239,467 131,037Other securities 146,100 46,149 192,249 72,845 119,404Liquidity assets eligible at central banks (not included above) (3) 311 – 311 – 311Undrawn credit lines granted by central banks (4) 10,830 – 10,830 – 10,830Other assets eligible as collateral for discount (5) 94,479 – 94,479 – 94,479Other liquid assets (6) 21,633 – 21,633 21,633 –
Cash and holding at central banks $ 46,581 $ – $ 46,581 $ 2,045 $ 44,536Deposits in other banks available overnight 4,004 – 4,004 203 3,801Securities issued or guaranteed by sovereigns, central banks or
multilateral development banks (2) 303,003 27,534 330,537 187,465 143,072Other securities 142,272 44,487 186,759 77,696 109,063Liquidity assets eligible at central banks (not included above) (3) 436 – 436 – 436Undrawn credit lines granted by central banks (4) 12,007 – 12,007 – 12,007Other assets eligible as collateral for discount (5) 94,207 – 94,207 – 94,207Other liquid assets (6) 19,520 – 19,520 19,520 –
Royal Bank of Canada $ 223,165 $ 204,999Foreign branches 60,127 63,283Subsidiaries 124,622 138,840
Total unencumbered liquid assets $ 407,914 $ 407,122
(1) The Bank-owned liquid assets amount includes securities owned outright as well as collateral received through reverse repurchase transactions.(2) Includes liquid securities issued by provincial governments and U.S. government-sponsored entities working under U.S. Federal government’s conservatorship (e.g., Federal National Mortgage
Association and Federal Home Loan Mortgage Corporation).(3) Includes Auction Rate Securities.(4) Includes loans that qualify as eligible collateral for the discount window facility available to us at the Federal Reserve Bank of New York (Federal Reserve Bank). Amounts are face value and would be
subject to collateral margin requirements applied by the Federal Reserve Bank to determine collateral value/borrowing capacity. Access to the discount window borrowing program is conditional onmeeting requirements set by the Federal Reserve Bank and borrowings are typically expected to be infrequent and due to uncommon occurrences requiring temporary accommodation.
(5) Represents our unencumbered Canadian dollar non-mortgage loan book (at face value) that could, subject to satisfying conditions precedent to borrowing and application of prescribed collateralmargin requirements, be pledged to the Bank of Canada for advances under its Emergency Lending Assistance (ELA) program. ELA and other central bank facilities are not considered sources ofavailable liquidity in our normal liquidity risk profile but could in extraordinary circumstances, where normal market liquidity is seriously impaired, allow us and other banks to monetize assetseligible as central bank collateral to meet requirements and mitigate further market liquidity disruption.
(6) Represents pledges related to OTC and exchange-traded derivative transactions.
36 Royal Bank of Canada First Quarter 2018
The liquidity reserve is typically most affected by routine flows of client banking activity where liquid asset portfolios adjust to thechange in cash balances, and additionally from capital markets activities where business strategies and client flows may also affectthe addition or subtraction of liquid assets in the overall calculation of the liquidity reserve. Corporate Treasury also affects liquidityreserves through the management of funding issuances where reserves absorb timing mismatches between debt issuances anddeployment into business activities.
Q1 2018 vs. Q4 2017Total liquid assets increased $50 billion or 7%, primarily due to increases in collateral received under reverse repurchase agreementsand securities financing and derivative transactions.
Asset encumbranceThe table below provides a summary of cash, securities and other assets, distinguishing between those that are encumbered assetsand those available for sale or use as collateral in secured funding transactions. Other assets, such as mortgages and credit cardreceivables can also be monetized, although over a longer timeframe than that required for marketable securities. As at January 31,2018, our Unencumbered assets available as collateral comprised 32% of our total assets (October 31, 2017 – 33%).
(1) Includes assets restricted from use to generate secured funding due to legal or other constraints.(2) Includes loans that could be used to collateralize central bank advances. Our unencumbered Canadian dollar non-mortgage loan book (at face value) could, subject to satisfying conditions for
borrowing and application of prescribed collateral margin requirements, be pledged to the Bank of Canada for advances under its ELA program. We also lodge loans that qualify as eligible collateralfor the discount window facility available to us at the Federal Reserve Bank of New York. ELA and other central bank facilities are not considered sources of available liquidity in our normal liquidityrisk profile. However, banks could monetize assets meeting central bank collateral criteria during periods of extraordinary and severe disruption to market-wide liquidity.
(3) Other unencumbered assets are not subject to any restrictions on their use to secure funding or as collateral but would not be considered readily available since they may not be acceptable atcentral banks or for other lending programs.
(4) Includes bank-owned liquid assets and securities received as collateral from off-balance sheet securities financing, derivative transactions, and margin lending. Includes $23.8 billion (October 31,2017: $21.7 billion) of collateral received through reverse repurchase transactions that cannot be rehypothecated in its current legal form.
(5) The Pledged as collateral amounts relate to OTC and exchange-traded derivative transactions.
FundingFunding strategyCore funding, comprising capital, longer-term wholesale liabilities and a diversified pool of personal and, to a lesser extent,commercial and institutional deposits, is the foundation of our structural liquidity position.
Deposit and funding profileAs at January 31, 2018, relationship-based deposits, which are the primary source of funding for retail loans and mortgages, were$522 billion or 51% of our total funding (October 31, 2017 – $525 billion or 54%). The remaining portion is comprised of short- andlong-term wholesale funding.
Funding for highly liquid assets consists primarily of short-term wholesale funding that reflects the monetization period of thoseassets. Long-term wholesale funding is used mostly to fund less liquid wholesale assets and to support liquidity asset buffers.
For further details on our wholesale funding, refer to the Composition of wholesale funding tables below.
Royal Bank of Canada First Quarter 2018 37
Long-term debt issuanceOur wholesale funding activities are well-diversified by geography, investor segment, instrument, currency, structure and maturity. Wemaintain an ongoing presence in different funding markets, which allows us to continuously monitor market developments andtrends, identify opportunities and risks, and take appropriate and timely actions. We operate longer-term debt issuance registeredprograms. The following table summarizes these programs with their authorized limits by geography.
Programs by geography
Canada U.S. Europe/Asia
• Canadian Shelf Program – $25 billion • SEC Shelf Program – US$40 billion • European Debt Issuance Program – US$40 billion
• Global Covered Bond Program – €32 billion
• Japanese Issuance Programs – ¥1 trillion
We also raise long-term funding using Canadian Deposit Notes, Canadian National Housing Act MBS, Canada Mortgage Bonds, creditcard receivable-backed securities, Kangaroo Bonds (issued in the Australian domestic market by foreign firms) and YankeeCertificates of Deposit (issued in the U.S. domestic market by foreign firms). We continuously evaluate opportunities to expand intonew markets and untapped investor segments since diversification expands our wholesale funding flexibility, minimizes fundingconcentration and dependency, and generally reduces financing costs. As presented in the following charts, our current long-termdebt profile is well-diversified by both currency and product. Maintaining competitive credit ratings is also critical to cost-effectivefunding.
Long-term debt(1) – funding mix by currency of issuance($137 billion as at January 31, 2018)
Euro14%
Other10%
Canadian dollar40%
U.S. dollar36%
Long-term debt(1) – funding mix by product($137 billion as at January 31, 2018)
Cardssecuritization
5%
Covered Bonds27%
MBS/CMB (2)
14%
Unsecured funding54%
(1) Based on original term to maturity greater than 1 year (1) Based on original term to maturity greater than 1 year(2) Mortgage-backed securities and Canada Mortgage Bonds
The following table provides our composition of wholesale funding based on remaining term to maturity:
(1) Excludes bankers’ acceptances and repos.(2) Only includes deposits raised by treasury. Excludes deposits associated with services we provide to these banks (e.g., custody, cash management).(3) Only includes consolidated liabilities, including our collateralized commercial paper program.(4) Includes deposit notes.(5) Includes notes where the payout is tied to movements in foreign exchange, commodities and equities.(6) Includes credit card, auto and mortgage loans.(7) Includes tender option bonds (secured) of $6,085 million (October 31, 2017 – $5,168 million), bearer deposit notes (unsecured) of $4,115 million (October 31, 2017 – $3,342 million) and other
long-term structured deposits (unsecured) of $4,900 million (October 31, 2017 – $5,176 million).
Credit ratingsOur ability to access unsecured funding markets and to engage in certain collateralized business activities on a cost-effective basisare primarily dependent upon maintaining competitive credit ratings. Credit ratings and outlooks provided by rating agencies reflecttheir views and methodologies. Ratings are subject to change, based on a number of factors including, but not limited to, our financialstrength, competitive position, liquidity and other factors not completely within our control.
The following table presents our major credit ratings(1):
Credit ratings
As at February 22, 2018
Short-termdebt
Senior long-term debt Outlook
Moody’s (2) P-1 A1 negativeStandard & Poor’s (3) A-1+ AA- negativeFitch Ratings (4) F1+ AA stableDBRS (5) R-1(high) AA stable
(1) Credit ratings are not recommendations to purchase, sell or hold a financial obligation inasmuch as they do not comment on marketprice or suitability for a particular investor. Ratings are determined by the rating agencies based on criteria established from time to timeby them, and are subject to revision or withdrawal at any time by the rating organization.
(2) On May 10, 2017, Moody’s lowered our senior long-term debt rating one notch, along with our large Canadian peers, due to Moody’schange to Canada’s macroeconomic profile. Moody’s also affirmed our negative outlook.
(3) On June 6, 2016, S&P revised our outlook to negative from stable.(4) On October 27, 2017, Fitch Ratings revised our outlook to stable from negative.(5) On July 31, 2017, DBRS revised our outlook to stable from negative.
Additional contractual obligations for rating downgradesWe are required to deliver collateral to certain counterparties in the event of a downgrade to our current credit rating. The followingtable presents the additional collateral obligations required at the reporting date in the event of a one-, two- or three-notchdowngrade to our credit ratings. These additional collateral obligations are incremental requirements for each successive downgradeand do not represent the cumulative impact of multiple downgrades. The amounts reported change periodically as a result of severalfactors, including the transfer of trading activity to centrally cleared financial market infrastructures and exchanges, the expiration oftransactions with downgrade triggers, the imposition of internal limitations on new agreements to exclude downgrade triggers, as wellas normal course mark-to-market of positions with collateralized counterparties moving from a negative to a positive position. There isno outstanding senior debt issued in the market that contains rating triggers that would lead to early prepayment of principal.
Additional contractual obligations for rating downgrades
(1) Includes GICs issued by our municipal markets business out of New York.
Royal Bank of Canada First Quarter 2018 39
Liquidity Coverage Ratio (LCR)The LCR is a Basel III metric that measures the sufficiency of high-quality liquid assets (HQLA) available to meet liquidity needs over a30-day period in an acute stress scenario. The Basel Committee on Banking Supervision (BCBS) and OSFI regulatory minimumcoverage level for LCR is currently 100%.
OSFI requires Canadian banks to disclose the LCR using the standard Basel disclosure template and calculated using the averageof daily LCR positions during the quarter.
Liquidity coverage ratio common disclosure template (1)
For the three-months ended
January 31
2018October 31
2017
(Millions of Canadian dollars, except percentage amounts)
Unsecured wholesale funding, of which: 265,804 119,121 260,993 117,451Operational deposits (all counterparties) and deposits in networks of cooperative
Outflows related to derivative exposures and other collateral requirements 62,181 43,568 61,901 41,364Outflows related to loss of funding on debt products 5,574 5,574 7,108 7,108Credit and liquidity facilities 163,806 25,960 160,039 25,575
Total HQLA 214,923 211,735Total net cash outflows 176,287 174,255
Liquidity coverage ratio 122% 122%
(1) The LCR is calculated in accordance with OSFI’s LAR guideline, which, in turn, reflects liquidity-related requirements issued by the BCBS. The LCR for the quarter ended January 31, 2018 is calculatedas an average of 62 daily positions.
(2) With the exception of other contingent funding obligations, unweighted inflow and outflow amounts are items maturing or callable in 30 days or less. Other contingent funding obligations alsoinclude debt securities with remaining maturity greater than 30 days.
(3) As defined by the BCBS, stable deposits from retail and small business customers are deposits that are insured and are either held in transactional accounts or the bank has an establishedrelationship with the client making the withdrawal unlikely.
(4) Operational deposits from customers other than retail and small and medium-sized enterprises (SMEs), are deposits which clients need to keep with the bank in order to facilitate their access andability to use payment and settlement systems primarily for clearing, custody and cash management activities.
(5) Other contractual funding obligations primarily include outflows from unsettled securities trades and outflows from obligations related to securities sold short.(6) Other contingent funding obligations include outflows related to other off-balance sheet facilities that carry low LCR runoff factors (0% – 5%).
We manage our LCR position within a target range that reflects our liquidity risk tolerance and takes into account business mix, assetcomposition and funding capabilities. The range is subject to periodic review in light of changes to internal requirements and externaldevelopments.
We maintain HQLAs in major currencies with dependable market depth and breadth. Our treasury management practices ensurethat the levels of HQLA are actively managed to meet target LCR objectives. Our Level 1 assets, as calculated according to OSFI LARand the BCBS LCR requirements, represent 83% of total HQLA. These assets consist of cash, placements with central banks and highlyrated securities issued or guaranteed by governments, central banks and supranational entities.
LCR captures cash flows from on- and off-balance sheet activities that are either expected or could potentially occur within 30days in an acute stress scenario. Cash outflows result from the application of withdrawal and non-renewal factors to demand and termdeposits, differentiated by client type (wholesale, retail and small- and medium-sized enterprises). Cash outflows also arise frombusiness activities that create contingent funding and collateral requirements, such as repo funding, derivatives, short sales ofsecurities and the extension of credit and liquidity commitments to clients. Cash inflows arise primarily from maturing secured loans,interbank loans and non-HQLA securities.
40 Royal Bank of Canada First Quarter 2018
LCR does not reflect any market funding capacity that we believe would be available in a stress situation. All maturing wholesaledebt is assigned 100% outflow in the LCR calculation.
Q1 2018 vs. Q4 2017The average LCR for the quarter ended January 31, 2018 was 122%. This translates into a surplus of approximately $39 billion. As atJanuary 31, 2018, our LCR position was consistent with the position in prior quarter as we continue to manage balance sheet growthand optimize our liquidity position.
Contractual maturities of financial assets, financial liabilities and off-balance sheet itemsThe following tables provide remaining contractual maturity profiles of all our assets, liabilities, and off-balance sheet items at theircarrying value (e.g., amortized cost or fair value) at the balance sheet date. Off-balance sheet items are allocated based on the expirydate of the contract.
Details of contractual maturities and commitments to extend funds are a source of information for the management of liquidityrisk. Among other purposes, these details form a basis for modelling a behavioural balance sheet with effective maturities to calculateliquidity risk measures. For further details, refer to the Risk measurement section of our 2017 Annual Report.
(1) Trading debt securities classified as fair value through profit or loss have been included in the less than 1 month category as there is no expectation to hold these assets to their contractualmaturity.
(2) A major portion of relationship-based deposits are repayable on demand or at short notice on a contractual basis while, in practice, these customer balances form a core base for our operations andliquidity needs, as explained in the preceding Deposit and funding profile section.
(3) Amounts have been revised from those previously presented.
Capital management
We continue to manage our capital in accordance with our Capital Management Framework as described in our 2017 Annual Report. Inaddition, we continue to monitor and prepare for new regulatory capital developments, including the BCBS Basel III reforms, in orderto ensure timely and accurate compliance with these requirements. For additional details on new regulatory developments that relateto our Capital Management Framework, refer to the Capital, liquidity and other regulatory developments section of this Q1 2018Report to Shareholders.
OSFI expects Canadian banks to currently meet the Basel III “all-in” targets for CET1, Tier 1 and Total capital ratios. EffectiveJanuary 1, 2014, OSFI allowed Canadian banks to phase in the Basel III Credit Valuation Adjustment (CVA) risk capital charge over afive-year period ending December 31, 2018. In fiscal 2018, the CVA scalars are 80%, 83% and 86% for CET1, Tier 1 and Total capital,respectively, and will reach 100% for each tier of capital in fiscal 2019.
On November 21, 2017, we were designated as a Global Systemically Important Bank (G-SIB) by the Financial Stability Board(FSB). This designation requires us to maintain a higher loss absorbency requirement (common equity as a percentage of risk-weighted assets) of 1%. OSFI mandates the higher of the Domestic Systematically Important Bank (D-SIB) or G-SIB requirement to beapplied (both of which are currently equivalent at 1% of risk-weighted assets). We provide our G-SIB assessment indicators below.
42 Royal Bank of Canada First Quarter 2018
The following table provides a summary of OSFI’s current regulatory target ratios under Basel III:
Basel IIICapital ratiosand leverage
OSFI regulatory target requirements for large banks under Basel III RBCcapital and
(1) The capital buffers include the capital conservation buffer and the countercyclical capital buffer as prescribed by OSFI.(2) Effective January 1, 2018, a capital surcharge, equal to the higher of our D-SIB surcharge and the BCBS’s G-SIB surcharge, is applicable to risk-weighted capital.n.a. not applicable
The following tables provide details on our regulatory capital, RWA and capital and leverage ratios. Our capital position remainsstrong and our capital and leverage ratios remain well above OSFI regulatory targets:
As at
(Millions of Canadian dollars, except percentage amounts and as otherwise noted)
January 31
2018October 31
2017January 31
2017
Capital (1)
CET1 capital $ 51,145 $ 51,572 $ 48,880Tier 1 capital 57,925 58,361 55,959Total capital 66,984 67,556 65,377
Risk-weighted Assets (RWA) used in calculation of capital ratios (1), (2)
CET1 capital RWA $ 466,758 $ 474,478 $ 442,508Tier 1 capital RWA 466,758 474,478 443,304Total capital RWA 466,758 474,478 443,940
CET1 ratio 11.0% 10.9% 11.0%Tier 1 capital ratio 12.4% 12.3% 12.6%Total capital ratio 14.4% 14.2% 14.7%Leverage ratio 4.2% 4.4% 4.4%Leverage ratio exposure (billions) $ 1,363.9 $ 1,315.5 $ 1,260.0
(1) Capital, RWA, and capital ratios are calculated using OSFI Capital Adequacy Requirements based on the Basel III framework (“all-in” basis). The Leverage ratio is calculated using OSFILeverage Requirements Guideline based on the Basel III framework.
(2) In fiscal 2018, the scalars are 80%, 83% and 86%, respectively. In 2017, the scalars were 72%, 77% and 81%, respectively.(3) Before any capital floor requirement as applicable, there are three different levels of RWAs for the calculation of the CET1, Tier 1, and Total capital ratios arising from the option we
have chosen for the phase-in of the CVA capital charge. Since the introduction of Basel II in 2008, OSFI has prescribed a capital floor requirement for institutions that use theadvanced internal ratings-based (AIRB) approach for credit risk. The capital floor is determined by comparing a capital requirement under Basel I and Basel III, as specified by OSFI. Ifthe capital requirement under the Basel III standards is less than 90% of the capital requirements as calculated under the Basel I standards, the difference is added to the RWAs.
Q1 2018 vs. Q4 2017
Continuity of CET1 ratio (Basel III)
October 31, 2017(1) Internal capitalgeneration(2)
10.9%
38 bps
25 bps (28) bps
(19) bps
(5) bps (1) bps 11.0%
Regulatory flooradjustment
Higher RWA(excluding regulatory
floor adjustmentand FX)
Share repurchases Impact from U.S.Tax Reform
Other January 31, 2018(1)
(1) Represents rounded figures.(2) Internal capital generation of $1.8 billion which represents Net income available to shareholders, less common and preferred shares dividends.
Royal Bank of Canada First Quarter 2018 43
Our CET1 ratio was 11.0%, up 10 bps from last quarter, mainly reflecting internal capital generation and a lower regulatory flooradjustment, partially offset by higher RWA due to business growth and share repurchases.
CET1 capital RWA decreased $8 billion, mainly due to a lower regulatory floor adjustment and the impact of foreign exchangetranslation, partially offset by business growth mostly in trading portfolios, residential mortgages, and underwriting activities.
Our Tier 1 capital ratio of 12.4% was up 10 bps, reflecting the factors noted above under the CET1 ratio.Our Total capital ratio of 14.4% was up 20 bps, reflecting the factors noted above under the CET1 ratio.Our Leverage ratio of 4.2% was down 20 bps from last quarter, primarily due to growth in leverage ratio exposures, mainly in
repo-style transactions, cash & deposits, and securities. Share repurchases also contributed to the decrease. These factors werepartially offset by internal capital generation.
Selected capital management activityThe following table provides our selected capital management activity:
For the three months endedJanuary 31, 2018
(Millions of Canadian dollars, except number of shares)Issuance or
redemption dateNumber of
shares (000s) Amount
Tier 1 capitalCommon shares activity
Issued in connection with share-based compensation plans (1) 464 $ 30Purchased for cancellation (9,297) (113)
Redemption of preferred shares, Series C-1 November 13, 2017 (82) (107)
(1) Amounts include cash received for stock options exercised during the period and includes fair value adjustments to stock options.
On March 9, 2017, we announced a normal course issuer bid (NCIB) to purchase up to 30 million of our common shares, whichcommenced on March 14, 2017 and completed on January 31, 2018. We determine the amount and timing of the purchases under theNCIB, subject to prior consultation with OSFI. Purchases may be made through the TSX, the NYSE and other designated exchanges andalternative Canadian trading systems. The price paid for such repurchased shares has been and will be the prevailing market price atthe time of acquisition. Purchases may also be made through other means permitted by the TSX and applicable securities laws,including under specific share repurchase programs pursuant to issuer bid exemption orders issued by applicable securities regulatoryauthorities. Any purchases made under an exemption order will generally be at a discount to the prevailing market price.
For the three-months ended January 31, 2018, the total number of common shares repurchased under our NCIB program wasapproximately 9 million. The total cost of the shares repurchased was $923 million, comprised of a book value of $113 million and anadditional premium paid on repurchase of $810 million. As at January 31, 2018, all of the 30 million common shares wererepurchased.
Selected share data
As at January 31, 2018
(Millions of Canadian dollars, except number of shares and as otherwise noted)Number of
Non-cumulative Series W (2) 12,000 300 0.31Non-cumulative Series AA 12,000 300 0.28Non-cumulative Series AC 8,000 200 0.29Non-cumulative Series AD 10,000 250 0.28Non-cumulative Series AE 10,000 250 0.28Non-cumulative Series AF 8,000 200 0.28Non-cumulative Series AG 10,000 250 0.28Non-cumulative Series AJ (3) 13,579 339 0.22Non-cumulative Series AK (3) 2,421 61 0.18Non-cumulative Series AL (3) 12,000 300 0.27Non-cumulative Series AZ (3), (4) 20,000 500 0.25Non-cumulative Series BB (3), (4) 20,000 500 0.24Non-cumulative Series BD (3), (4) 24,000 600 0.23Non-cumulative Series BF (3), (4) 12,000 300 0.23Non-cumulative Series BH (4) 6,000 150 0.31Non-cumulative Series BI (4) 6,000 150 0.31Non-cumulative Series BJ (4) 6,000 150 0.33Non-cumulative Series BK (3), (4) 29,000 725 0.34Non-cumulative Series BM (3), (4) 30,000 750 0.34Non-cumulative Series C-2 (5) 20 31 US$16.88
Treasury shares held – preferred (7) –Treasury shares held – common (150) (7)Stock options
Outstanding 9,557Exercisable 4,589
DividendsCommon 1,319Preferred 72
(1) For further details about our capital management activity, refer to Note 9 of our Condensed Financial Statements.(2) Effective February 24, 2010, we have the right to convert these shares into common shares at our option, subject to certain restrictions.(3) Dividend rate will reset every five years.(4) Non-viable contingent capital (NVCC) instruments.(5) Represents 815,400 depositary shares relating to preferred shares Series C-2. Each depositary share represents one-fortieth interest in a
share of Series C-2.
44 Royal Bank of Canada First Quarter 2018
As at February 16, 2018, the number of outstanding common shares and stock options and awards was 1,444,074,005 and9,546,604, respectively, and the number of Treasury shares – preferred and Treasury shares – common was (9,792) and (49,590),respectively.
NVCC provisions require the conversion of the capital instrument into a variable number of common shares in the event that OSFIdeems a bank to be non-viable or a federal or provincial government in Canada publicly announces that a bank has accepted oragreed to accept a capital injection. If a NVCC trigger event were to occur, our NVCC capital instruments, which are the preferredshares Series AZ, preferred shares Series BB, preferred shares Series BD, preferred shares Series BF, preferred shares Series BH,preferred shares Series BI, preferred shares Series BJ, preferred shares Series BK, preferred shares Series BM, subordinateddebentures due on July 17, 2024, subordinated debentures due on September 29, 2026, subordinated debentures due on June 4,2025, subordinated debentures due on January 20, 2026 and subordinated debentures due on January 27, 2026, would be convertedinto RBC common shares pursuant to an automatic conversion formula with a conversion price based on the greater of: (i) acontractual floor price of $5.00, and (ii) the current market price of our common shares at the time of the trigger event (10-dayweighted average). Based on a floor price of $5.00 and including an estimate for accrued dividends and interest, these NVCC capitalinstruments would convert into a maximum of 2,711 million RBC common shares, in aggregate, which would represent a dilutionimpact of 65.25% based on the number of RBC common shares outstanding as at January 31, 2018.
Attributed capitalOur methodology for allocating capital to our business segments is based on the higher of fully diversified economic capital and theBasel III regulatory capital requirements. Risk-based capital attribution provides a uniform base for performance measurement amongbusiness segments, which compares to our overall corporate return objective and facilitates management decisions in resourceallocation in conjunction with other factors.
The following outlines our attributed capital:
For the three months ended
(Millions of Canadian dollars)
January 31
2018October 31
2017January 31
2017
Credit risk $ 21,650 $ 21,500 $ 21,050Market risk (trading and non-trading) 3,850 3,750 3,150Operational risk 5,550 5,150 5,100Business and fixed asset risk 3,350 3,250 3,150Insurance risk 650 700 600Goodwill and other intangibles 15,300 15,250 15,700Regulatory capital allocation 11,450 10,450 11,050
Attributed capital $ 61,800 $ 60,050 $ 59,800Unattributed capital 5,050 5,850 4,850
Average common equity $ 66,850 $ 65,900 $ 64,650
Q1 2018 vs. Q4 2017Attributed capital increased $1.8 billion from the prior quarter, primarily due to business growth mostly in trading portfolios,residential mortgages, and underwriting activities.
We remain well capitalized with current levels of available capital exceeding the attributed capital required to underpin all of ourmaterial risks.
Royal Bank of Canada First Quarter 2018 45
Global systemically important banks (G-SIBs) 12 assessment indicators (1)
The BCBS and FSB use 12 indicators in the assessment methodology for determining the systemic importance of large global banks.As noted previously, on November 21, 2017, the FSB issued the list of G-SIBs and we were identified as a G-SIB. The following tableprovides the 12 indicators used in the G-SIB assessment:
Payment activity 37,964,746 40,663,480Assets under custody 4,061,111 3,798,828Underwritten transactions in debt and equity markets (3) 235,431 196,627
Complexity (7)
Notional amount of over-the-counter derivatives 12,937,404 11,731,898Trading and available-for-sale securities 38,918 50,280Level 3 assets 3,574 4,270
(1) The G-SIBs indicators are prepared based on the methodology prescribed in BCBS guidelines published in July 2013 and instructionsprovided by BCBS in January 2018. The indicators are based on regulatory scope of consolidation, which excludes RBC Insurancesubsidiaries. For our 2017 standalone G-SIB disclosure, please refer to our Regulatory Capital Disclosures at rbc.com/investorrelations.
(2) Represents a bank’s level of interaction outside its domestic jurisdiction.(3) Amounts have been revised from those previously presented.(4) Represents the total on- and off- balance sheet exposures of the bank determined as per the Basel III leverage ratio rules before
regulatory adjustments.(5) Represents transactions with other financial institutions.(6) Represents the extent to which the bank’s services could be substituted by other institutions.(7) Includes the level of complexity and volume of a bank’s trading activities represented through derivatives, trading securities, available-
for-sale securities and level 3 assets.
Q4 2017 vs. Q4 2016During 2017, notional amounts for over-the-counter derivatives increased mainly due to increased trading activity on interest rateswaps and forward rate agreements. Trading and available-for-sale securities decreased due to lower equity trading positions, adecrease in government debt securities reflecting our management of liquidity and funding risk, and the impact of foreign exchangetranslation. Other movements from the prior year primarily reflect normal changes in business activity and the impact of foreigncurrency translation.
Capital, liquidity, and other regulatory developments
Capital treatment proposed or issued in connection with accounting changesOn March 29, 2017, the BCBS issued a standard with details on the interim regulatory treatment of accounting provisions under theBasel III regulatory capital framework. The standard addresses the impact of new expected credit loss accounting requirements underIFRS 9. The standard retains the current Basel lII regulatory treatment of accounting provisions under the standardized and theinternal ratings-based approaches until a longer-term solution is developed. It also sets out transitional arrangements which allow fora phase-in of the impact of the new expected credit loss accounting standard on regulatory capital for up to five years, shouldindividual jurisdictions choose to provide capital relief.
On November 29, 2017, OSFI released the finalized Capital Adequacy Requirements (CAR) Guidelines required to be implementedin the first quarter of 2018. The updated 2018 CAR Guideline retains the current regulatory treatment of accounting provisionsconsistent with the BCBS standard. However, OSFI has elected not to adopt a phase-in approach relating to the regulatory impact ofIFRS 9. Instead, the full transition impact of IFRS 9 is required to be absorbed by Canadian banks in their Q1 2018 capital ratios. Aswell, the updated CAR guidelines include revisions addressing the treatment of ACL on performing financial assets (Stage 1 andStage 2) under IFRS 9 as general allowances for regulatory capital purposes. Similarly, ACL on impaired financial assets (Stage 3)under IFRS 9 are required to be treated as specific allowances for regulatory capital purposes.
As at our transition date, our shortfall of accounting allowances under IAS 39 to Basel expected losses was $1.2 billion. Theimpact of the impairment requirements of IFRS 9 reduced but did not eliminate the shortfall of accounting allowances to Baselexpected losses. Going forward, the regulatory capital impact of further increases in our accounting allowances under IFRS 9 will bemitigated by way of the reduction of our shortfall allowance deduction from CET1 capital.
Basel III reformsOn December 7, 2017, the BCBS finalized the Basel III reforms, with an effective date of January 2022. The reforms are mainlyintended to reduce the variability in bank capital levels and to address a number of weaknesses in the existing capital framework byrevisiting the way capital requirements for credit, market and operational risks are determined. This includes revisions to thestandardized approach for credit risk, constraints on the use of internal ratings-based approaches, an overhaul of the operational riskframework, calibration of standardized output floors, revisions to the CVA framework, and changes to the leverage ratio framework.We continue to review the finalized frameworks and await OSFI’s adoption guidance, including required implementation timelines forCanadian banks.
46 Royal Bank of Canada First Quarter 2018
Regulatory capital floorOn January 12, 2018, OSFI prescribed revisions to the current Basel I regulatory capital floor, effective February 1, 2018, requiring atransition to a new regulatory capital floor of 75% of risk-weighted assets based on the Basel II Standardized Approaches. This newregulatory floor will be transitioned over three quarters reflecting a regulatory capital floor requirement of 70%, 72.5%, and 75% in Q22018, Q3 2018, and Q4 2018, respectively.
Net Stable Funding Ratio (NSFR) implementation timelineWith respect to liquidity measurement, in October 2014, the BCBS released its final Net Stable Funding Ratio (NSFR) standard, whichrequires banks to fund their activities with sufficiently stable sources of funding. The NSFR is intended to reduce structural fundingrisk by requiring banks to have sufficient stable funding to support their business with less reliance on funding maturing in one year.On February 6, 2018, OSFI announced that it would extend the implementation timeline for Canadian banks to comply with the NSFRrequirements from January 1, 2019 to January 1, 2020.
For a discussion on risk factors resulting from these and other regulatory developments which may affect our business andfinancial results, refer to the Risk management – Top and emerging risks and Legal and regulatory environment risk sections of our2017 Annual Report and the Economic, market and regulatory review and outlook section of this Q1 2018 Report to Shareholders. Forfurther details on our framework and activities to manage risks, refer to the risk and Capital management sections of our 2017 AnnualReport and the Risk management and Capital management sections of this Q1 2018 Report to Shareholders.
Accounting and control matters
Summary of accounting policies and estimates
Our Condensed Financial Statements are presented in compliance with International Accounting Standard (IAS) 34 Interim FinancialReporting. Our significant accounting policies are described in Note 2 of our audited 2017 Annual Consolidated Financial Statementsand our Q1 2018 Condensed Financial Statements.
Changes in accounting policies and disclosures
Changes in accounting policiesDuring the current quarter, we adopted IFRS 9 Financial Instruments (IFRS 9). As permitted by the transition provisions of IFRS 9, weelected not to restate comparative period results; accordingly, all comparative period information is presented in accordance with ourprevious accounting policies, as described in our 2017 Annual Report. Adjustments to carrying amounts of financial assets andliabilities at November 1, 2017 were recognized in opening Retained earnings and Other components of equity in the current period.Refer to Note 2 of our Condensed Financial Statements for details of these changes.
Future changes in accounting policies and disclosuresFuture changes in accounting policies and disclosures that are not yet effective for us are described in Note 2 of our audited 2017Annual Consolidated Financial Statements.
Controls and procedures
Disclosure controls and proceduresAs of January 31, 2018, management evaluated, under the supervision of and with the participation of the President and ChiefExecutive Officer and the Chief Financial Officer, the effectiveness of our disclosure controls and procedures as defined under rulesadopted by the U.S. SEC. Based on that evaluation, the President and Chief Executive Officer and the Chief Financial Officer concludedthat our disclosure controls and procedures were effective as of January 31, 2018.
Internal control over financial reportingNo changes were made in our internal control over financial reporting during the quarter ended January 31, 2018 that have materiallyaffected, or are reasonably likely to materially affect, our internal control over financial reporting. On November 1, 2017, we adoptedIFRS 9 and have updated and modified certain internal controls over financial reporting as a result of the new accounting standard.
Related party transactions
In the ordinary course of business, we provide normal banking services and operational services, and enter into other transactionswith associated and other related corporations, including our joint venture entities, on terms similar to those offered to non-relatedparties. We grant loans to directors, officers and other employees at rates normally accorded to preferred clients. In addition, we offerdeferred share and other plans to non-employee directors, executives and certain other key employees. For further information, referto Notes 12 and 28 of our audited 2017 Annual Consolidated Financial Statements.
Royal Bank of Canada First Quarter 2018 47
EDTF recommendations index
We aim to present transparent, high-quality risk disclosures by providing disclosures in our 2017 Annual Report, Q1 2018 Report toShareholders (RTS) and Supplementary Financial information package (SFI), in accordance with recommendations from the FinancialStability Board’s (FSB) Enhanced Disclosure Task Force (EDTF).
The following index summarizes our disclosure by EDTF recommendation:
Location of disclosure
Type of Risk Recommendation DisclosureRTS
pageAnnual
Report pageSFI
page
General
1 Table of contents for EDTF risk disclosure 47 116 12 Define risk terminology and measures 52, 54-57
206-207–
3 Top and emerging risks 53 –4 New regulatory ratios 41-42 92-95 –
Risk governance, riskmanagement andbusiness model
5 Risk management organization 52, 54-57 –6 Risk culture 54-57 –7 Risk in the context of our business activities 100 –8 Stress testing 56-57, 69 –
Capital adequacy andrisk-weightedassets(RWA)
9 Minimum Basel III capital ratios and Domesticsystemically important bank surcharge
42 92-95 –
10 Composition of capital and reconciliation of theaccounting balance sheet to the regulatorybalance sheet
– 22-25
11 Flow statement of the movements in regulatorycapital
– 26
12 Capital strategic planning 92-95 –13 RWA by business segments – 2914 Analysis of capital requirement, and related
measurement model information58-60 27-28
15 RWA credit risk and related risk measurements – 44-4616 Movement of risk-weighted assets by risk type – 2917 Basel back-testing 55, 58 44
Liquidity 18 Quantitative and qualitative analysis of our liquidityreserve
35-36 75-77,81-82
–
Funding
19 Encumbered and unencumbered assets by balancesheet category, and contractual obligations forrating downgrades
36, 38 77, 80 –
20 Maturity analysis of consolidated total assets,liabilities and off-balance sheet commitmentsanalyzed by remaining contractual maturity at thebalance sheet date
40-41 82-83 –
21 Sources of funding and funding strategy 36-38 77-79 –
Market risk
22 Relationship between the market risk measures fortrading and non-trading portfolios and the balancesheet
Interest-bearing deposits with banks 37,269 32,662
Securities (Note 2)
Trading 129,361 127,657Investment, net of applicable allowance (Notes 2 and 4) 92,901 90,722
222,262 218,379
Assets purchased under reverse repurchase agreements and securities borrowed 259,765 220,977
Loans (Notes 2 and 5)
Retail 386,235 385,170Wholesale 154,585 159,606
540,820 544,776Allowance for loan losses (Notes 2 and 5) (2,776) (2,159)
538,044 542,617
Segregated fund net assets 1,270 1,216
OtherCustomers’ liability under acceptances 16,363 16,459Derivatives 105,512 95,023Premises and equipment 2,648 2,670Goodwill 10,736 10,977Other intangibles 4,420 4,507Other assets 43,498 38,959
183,177 168,595
Total assets $ 1,276,275 $ 1,212,853
Liabilities and equityDeposits (Note 6)
Personal $ 261,312 $ 260,213Business and government 517,428 505,665Bank 21,280 23,757
800,020 789,635
Segregated fund net liabilities 1,270 1,216
OtherAcceptances 16,379 16,459Obligations related to securities sold short 30,404 30,008Obligations related to assets sold under repurchase agreements and securities loaned 183,319 143,084Derivatives 104,219 92,127Insurance claims and policy benefit liabilities 9,977 9,676Other liabilities (Note 2) 48,402 46,955
392,700 338,309
Subordinated debentures 8,961 9,265
Total liabilities 1,202,951 1,138,425
Equity attributable to shareholdersPreferred shares (Note 9) 6,306 6,413Common shares (shares issued – 1,443,914,323 and 1,452,534,303) (Note 9) 17,640 17,703Retained earnings 45,764 45,359Other components of equity 3,026 4,354
72,736 73,829Non-controlling interests 588 599
Total equity 73,324 74,428
Total liabilities and equity $ 1,276,275 $ 1,212,853
The accompanying notes are an integral part of these Interim Condensed Consolidated Financial Statements.
Royal Bank of Canada First Quarter 2018 49
Interim Condensed Consolidated Statements of Income (unaudited)
For the three months ended
January 31 January 31
(Millions of Canadian dollars, except per share amounts) 2018 2017
Interest incomeLoans $ 4,973 $ 4,581Securities 1,354 1,221Assets purchased under reverse repurchase agreements and securities borrowed 1,108 603Deposits and other 105 54
7,540 6,459
Interest expenseDeposits and other 1,987 1,504Other liabilities 1,034 565Subordinated debentures 74 66
3,095 2,135
Net interest income 4,445 4,324
Non-interest incomeInsurance premiums, investment and fee income 1,144 497Trading revenue 318 263Investment management and custodial fees 1,325 1,159Mutual fund revenue 885 814Securities brokerage commissions 355 399Service charges 440 438Underwriting and other advisory fees 541 468Foreign exchange revenue, other than trading 281 227Card service revenue 257 236Credit fees 328 356Net gains on investment securities (Notes 2 and 4) 39 27Share of profit in joint ventures and associates 25 251Other 445 187
6,383 5,322
Total revenue 10,828 9,646
Provision for credit losses (Notes 2, 4 and 5) 334 294
Insurance policyholder benefits, claims and acquisition expense 836 183
Income before income taxes 4,047 3,854Income taxes 1,035 827
Net income $ 3,012 $ 3,027
Net income attributable to:Shareholders $ 3,001 $ 3,015Non-controlling interests 11 12
$ 3,012 $ 3,027
Basic earnings per share (in dollars) (Note 10) $ 2.02 $ 1.98Diluted earnings per share (in dollars) (Note 10) 2.01 1.97Dividends per common share (in dollars) 0.91 0.83
The accompanying notes are an integral part of these Interim Condensed Consolidated Financial Statements.
50 Royal Bank of Canada First Quarter 2018
Interim Condensed Consolidated Statements of Comprehensive Income (unaudited)
For the three months ended
(Millions of Canadian dollars)
January 31
2018January 31
2017
Net income $ 3,012 $ 3,027
Other comprehensive income (loss), net of taxesItems that will be reclassified subsequently to income:
Net change in unrealized gains (losses) on available-for-sale securitiesNet unrealized gains (losses) on available-for-sale securities (129)Reclassification of net losses (gains) on available-for-sale securities to income (12)
Net change in unrealized gains (losses) on debt securities and loans at fair value through other comprehensiveincomeNet unrealized gains (losses) on debt securities and loans at fair value through other comprehensive income (24)Provision for credit losses recognized in income 15Reclassification of net losses (gains) on debt securities and loans at fair value through other comprehensive
income to income (28)
(37) (141)
Foreign currency translation adjustmentsUnrealized foreign currency translation gains (losses) (2,006) (1,462)Net foreign currency translation gains (losses) from hedging activities 658 543Reclassification of losses (gains) on foreign currency translation to income – (10)
(1,348) (929)
Net change in cash flow hedgesNet gains (losses) on derivatives designated as cash flow hedges 424 96Reclassification of losses (gains) on derivatives designated as cash flow hedges to income (153) 37
271 133
Items that will not be reclassified subsequently to income:Remeasurements of employee benefit plans (Note 7) 49 597Net fair value change due to credit risk on financial liabilities designated as at fair value through profit or loss (18) (33)
Net gains (losses) on equity securities designated at fair value through other comprehensive income (2)
29 564
Total other comprehensive income (loss), net of taxes (1,085) (373)
Total comprehensive income (loss) $ 1,927 $ 2,654
Total comprehensive income attributable to:Shareholders $ 1,919 $ 2,645Non-controlling interests 8 9
$ 1,927 $ 2,654
The income tax effect on the Interim Condensed Consolidated Statements of Comprehensive Income is shown in the table below.
For the three months ended
(Millions of Canadian dollars)
January 31
2018January 31
2017
Income taxes on other comprehensive incomeNet unrealized gains (losses) on available-for-sale securities $ (68)Reclassification of net losses (gains) on available-for-sale securities to income (4)
Net unrealized gains (losses) on debt securities and loans at fair value through other comprehensive income $ 42Provision for credit losses recognized in income (4)Reclassification of net losses (gains) on debt securities and loans at fair value through other comprehensive
income to income (15)Unrealized foreign currency translation gains (losses) (5) (2)Net foreign currency translation gains (losses) from hedging activities 219 183Net gains (losses) on derivatives designated as cash flow hedges 183 36Reclassification of losses (gains) on derivatives designated as cash flow hedges to income (86) 13Remeasurements of employee benefit plans 20 206Net fair value change due to credit risk on financial liabilities designated as at fair value through profit or loss (7) (13)
Net gains (losses) on equity securities designated at fair value through other comprehensive income (1)
Total income tax expenses (recoveries) $ 346 $ 351
The accompanying notes are an integral part of these Interim Condensed Consolidated Financial Statements.
Royal Bank of Canada First Quarter 2018 51
Inte
rim
Cond
ense
dCo
nsol
idat
edS
tate
men
tsof
Chan
ges
inEq
uity
(una
udit
ed)
Oth
erco
mpo
nent
sof
equi
ty
(Mill
ions
ofCa
nadi
ando
llars
)Pr
efer
red
shar
esCo
mm
onsh
ares
Trea
sury
shar
es-
pref
erre
d
Trea
sury
shar
es-
com
mon
Reta
ined
earn
ings
Ava
ilabl
e-fo
r-sa
lese
curi
ties
FVO
CIse
curi
ties
and
loan
s
Fore
ign
curr
ency
tran
slat
ion
Cash
flow
hedg
es
Tota
loth
erco
mpo
nent
sof
equi
ty
Equi
tyat
trib
utab
leto
shar
ehol
ders
Non
-con
trol
ling
inte
rest
sTo
tale
quit
y
Bala
nce
atO
ctob
er31
,201
6$
6,71
3$
17,9
39$
–$
(80)
$41
,519
$34
0$
4,68
5$
(99)
$4,
926
$71
,017
$59
5$
71,6
12Ch
ange
sin
equi
tyIs
sues
ofsh
are
capi
tal
–96
––
––
––
–96
–96
Com
mon
shar
espu
rcha
sed
for
canc
ella
tion
–(1
37)
––
(814
)–
––
–(9
51)
–(9
51)
Rede
mpt
ion
ofpr
efer
red
shar
es–
––
––
––
––
––
–S
ales
oftr
easu
rysh
ares
––
211,
191
––
––
–1,
212
–1,
212
Purc
hase
sof
trea
sury
shar
es–
–(2
1)(1
,144
)–
––
––
(1,1
65)
–(1
,165
)S
hare
-bas
edco
mpe
nsat
ion
awar
ds–
––
–(1
2)–
––
–(1
2)–
(12)
Div
iden
dson
com
mon
shar
es–
––
–(1
,232
)–
––
–(1
,232
)–
(1,2
32)
Div
iden
dson
pref
erre
dsh
ares
and
othe
r–
––
–(7
5)–
––
–(7
5)(1
7)(9
2)O
ther
––
––
31–
––
–31
(2)
29N
etin
com
e–
––
–3,
015
––
––
3,01
512
3,02
7To
talo
ther
com
preh
ensi
vein
com
e(l
oss)
,ne
toft
axes
––
––
564
(141
)(9
26)
133
(934
)(3
70)
(3)
(373
)
Bala
nce
atJa
nuar
y31
,201
7$
6,71
3$
17,8
98$
–$
(33)
$42
,996
$19
9$
3,75
9$
34$
3,99
2$
71,5
66$
585
$72
,151
Bala
nce
atO
ctob
er31
,201
7$
6,41
3$
17,7
30$
–$
(27)
$45
,359
$37
8$
3,54
5$
431
$4,
354
$73
,829
$59
9$
74,4
28Tr
ansi
tion
adju
stm
ent(
Not
e2)
––
––
(558
)(3
78)
$29
9–
–(7
9)(6
37)
–(6
37)
Bala
nce
atN
ovem
ber1
,201
7$
6,41
3$
17,7
30$
–$
(27)
$44
,801
$–
$29
9$
3,54
5$
431
$4,
275
$73
,192
$59
9$
73,7
91
Chan
ges
ineq
uity
Issu
esof
shar
eca
pita
l–
30–
––
––
––
30–
30Co
mm
onsh
ares
purc
hase
dfo
rca
ncel
lati
on–
(113
)–
–(8
10)
––
––
(923
)–
(923
)Re
dem
ptio
nof
pref
erre
dsh
ares
(107
)–
––
2–
––
–(1
05)
–(1
05)
Sal
esof
trea
sury
shar
es–
–69
1,42
5–
––
––
1,49
4–
1,49
4Pu
rcha
ses
oftr
easu
rysh
ares
––
(69)
(1,4
05)
––
––
–(1
,474
)–
(1,4
74)
Sha
re-b
ased
com
pens
atio
naw
ards
––
––
(3)
––
––
(3)
–(3
)D
ivid
ends
onco
mm
onsh
ares
––
––
(1,3
19)
––
––
(1,3
19)
–(1
,319
)D
ivid
ends
onpr
efer
red
shar
esan
dot
her
––
––
(72)
––
––
(72)
(18)
(90)
Oth
er–
––
–13
5(1
38)
––
(138
)(3
)(1
)(4
)N
etin
com
e–
––
–3,
001
––
––
3,00
111
3,01
2To
talo
ther
com
preh
ensi
vein
com
e(l
oss)
,ne
toft
axes
––
––
29(3
7)(1
,345
)27
1(1
,111
)(1
,082
)(3
)(1
,085
)
Bala
nce
atJa
nuar
y31
,201
8$
6,30
6$
17,6
47$
–$
(7)
$45
,764
$12
4$
2,20
0$
702
$3,
026
$72
,736
$58
8$
73,3
24
The
acco
mpa
nyin
gno
tes
are
anin
tegr
alpa
rtof
thes
eIn
teri
mCo
nden
sed
Cons
olid
ated
Fina
ncia
lSta
tem
ents
.
52 Royal Bank of Canada First Quarter 2018
Interim Condensed Consolidated Statements of Cash Flows (unaudited)
For the three months ended
(Millions of Canadian dollars)
January 31
2018January 31
2017
Cash flows from operating activitiesNet income $ 3,012 $ 3,027Adjustments for non-cash items and others
Provision for credit losses 334 294Depreciation 135 162Deferred income taxes 271 304Amortization and impairment of other intangibles 261 252Net changes in investments in joint ventures and associates (22) (250)Losses (Gains) on investment securities (Note 2) (43) (46)
Impairment of available-for-sale securities 17Adjustments for net changes in operating assets and liabilities
Insurance claims and policy benefit liabilities 195 (379)Net change in accrued interest receivable and payable (132) (186)Current income taxes (1,970) (1,115)Derivative assets (10,489) 21,525Derivative liabilities 12,092 (20,904)Trading securities 1,194 9,073Loans, net of securitizations (3,579) (415)Assets purchased under reverse repurchase agreements and securities borrowed (38,789) (10,983)Deposits, net of securitizations 10,414 (77)Obligations related to assets sold under repurchase agreements and securities loaned 40,235 20,033Obligations related to securities sold short 396 (12,400)Brokers and dealers receivable and payable (166) 5Other 1,225 (561)
Net cash from (used in) operating activities 14,574 7,376
Cash flows from investing activitiesChange in interest-bearing deposits with banks (4,607) 5,471Proceeds from sale of investment securities (Note 2) 5,217 2,234Proceeds from maturity of investment securities (Note 2) 7,132 11,318Purchases of investment securities (Note 2) (13,342) (14,326)Net acquisitions of premises and equipment and other intangibles (357) (257)
Net cash from (used in) investing activities (5,957) 4,440
Cash flows from financing activitiesIssue of common shares 23 96Common shares purchased for cancellation (923) (102)Redemption of preferred shares (105) –Sales of treasury shares 1,494 1,212Purchases of treasury shares (1,474) (1,165)Dividends paid (1,396) (1,309)Dividends/distributions paid to non-controlling interests (18) (17)Change in short-term borrowings of subsidiaries (1) (5)
Net cash from (used in) financing activities (2,400) (1,290)
Effect of exchange rate changes on cash and due from banks (136) (92)
Net change in cash and due from banks 6,081 10,434Cash and due from banks at beginning of period (1) 28,407 14,929
Cash and due from banks at end of period (1) $ 34,488 $ 25,363
Cash flows from operating activities include:Amount of interest paid $ 3,001 $ 2,074Amount of interest received 7,255 6,043Amount of dividend received 410 592Amount of income taxes paid 3,118 2,002
(1) We are required to maintain balances with central banks and other regulatory authorities. The total balances were $2.5 billion as at January 31, 2018 (October 31, 2017 – $2.3 billion; January 31,2017 – $1.7 billion; October 31, 2016 – $3.3 billion).
The accompanying notes are an integral part of these Interim Condensed Consolidated Financial Statements.
Royal Bank of Canada First Quarter 2018 53
Note 1 General information
Our unaudited Interim Condensed Consolidated Financial Statements (Condensed Financial Statements) are presented in compliancewith International Accounting Standard (IAS) 34 Interim Financial Reporting. The Condensed Financial Statements do not include allthe information and disclosures required in the annual financial statements and should be read in conjunction with our audited 2017Annual Consolidated Financial Statements and the accompanying notes included on pages 117 to 204 in our 2017 Annual Report.Tabular information is stated in millions of Canadian dollars, except per share amounts and percentages. On February 22, 2018, theBoard of Directors authorized the Condensed Financial Statements for issue.
Note 2 Summary of significant accounting policies, estimates and judgments
Except as indicated below, the Condensed Financial Statements have been prepared using the same accounting policies andmethods used in preparation of our audited 2017 Annual Consolidated Financial Statements. Our significant accounting policies andfuture changes in accounting policies and disclosures that are not yet effective for us are described in Note 2 of our audited 2017Annual Consolidated Financial Statements.
Changes in accounting policiesDuring the current quarter, we adopted IFRS 9 Financial Instruments (IFRS 9). As a result of the application of IFRS 9, we changed ouraccounting policies in the areas outlined below, and these new policies were applicable from November 1, 2017. As permitted by thetransition provisions of IFRS 9, we elected not to restate comparative period results; accordingly, all comparative period information ispresented in accordance with our previous accounting policies, as described in our 2017 Annual Report. Adjustments to carryingamounts of financial assets and liabilities at the date of initial application (November 1, 2017) were recognized in opening Retainedearnings and Other components of equity in the current period. New or amended interim disclosures have been provided for thecurrent period, where applicable, and comparative period disclosures are consistent with those made in the prior year.
Classification of financial assetsFinancial assets are measured at initial recognition at fair value, and are classified and subsequently measured at fair value throughprofit or loss (FVTPL), fair value through other comprehensive income (FVOCI) or amortized cost based on our business model formanaging the financial instruments and the contractual cash flow characteristics of the instrument.
Debt instruments are measured at amortized cost if both of the following conditions are met and the asset is not designated asFVTPL: (a) the asset is held within a business model that is Held-to-Collect (HTC) as described below, and (b) the contractual terms ofthe instrument give rise to cash flows that are solely payments of principal and interest on the principal amount outstanding (SPPI).
Debt instruments are measured at FVOCI if both of the following conditions are met and the asset is not designated as FVTPL:(a) the asset is held within a business model that is Held-to-Collect-and-Sell (HTC&S) as described below, and (b) the contractualterms of the instrument give rise, on specified dates, to cash flows that are SPPI.
All other debt instruments are measured at FVTPL.Equity instruments are measured at FVTPL, unless the asset is not held for trading purposes and we make an irrevocable election
to designate the asset as FVOCI. This election is made on an instrument-by-instrument basis.
Business model assessmentWe determine our business models at the level that best reflects how we manage portfolios of financial assets to achieve ourbusiness objectives. Judgment is used in determining our business models, which is supported by relevant, objective evidenceincluding:
• How the economic activities of our businesses generate benefits, for example through trading revenue, enhancing yields orhedging funding or other costs and how such economic activities are evaluated and reported to key management personnel;
• The significant risks affecting the performance of our businesses, for example, market risk, credit risk, or other risks asdescribed in the Risk Management section of Management’s Discussion and Analysis, and the activities undertaken to managethose risks;
• Historical and future expectations of sales of the loans or securities portfolios managed as part of a business model; and• The compensation structures for managers of our businesses, to the extent that these are directly linked to the economic
performance of the business model.
Our business models fall into three categories, which are indicative of the key strategies used to generate returns:• HTC: The objective of this business model is to hold loans and securities to collect contractual principal and interest cash
flows. Sales are incidental to this objective and are expected to be insignificant or infrequent.• HTC&S: Both collecting contractual cash flows and sales are integral to achieving the objective of the business model.• Other fair value business models: These business models are neither HTC nor HTC&S, and primarily represent business models
where assets are held-for-trading or managed on a fair value basis.
SPPI assessmentInstruments held within a HTC or HTC&S business model are assessed to evaluate if their contractual cash flows are comprised ofsolely payments of principal and interest. SPPI payments are those which would typically be expected from basic lendingarrangements. Principal amounts include par repayments from lending and financing arrangements, and interest primarily relates tobasic lending returns, including compensation for credit risk and the time value of money associated with the principal amountoutstanding over a period of time. Interest can also include other basic lending risks and costs (for example, liquidity risk, servicing oradministrative costs) associated with holding the financial asset for a period of time, and a profit margin.
54 Royal Bank of Canada First Quarter 2018
Note 2 Summary of significant accounting policies, estimates and judgments (continued)
Where the contractual terms introduce exposure to risk or variability of cash flows that are inconsistent with a basic lendingarrangement, the related financial asset is classified and measured at FVTPL.
SecuritiesTrading securities include all securities that are classified as FVTPL by nature and securities designated as FVTPL. Obligations todeliver trading securities sold but not yet purchased are recorded as liabilities and carried at fair value. Realized and unrealized gainsand losses on these securities are generally recorded as Trading revenue in Non-interest income. Dividends and interest incomeaccruing on Trading securities are recorded in Interest income. Interest and dividends accrued on interest-bearing and equitysecurities sold short are recorded in Interest expense.
Investment securities include all securities classified as FVOCI and amortized cost. All investment securities are initially recordedat fair value and subsequently measured according to the respective classification. Prior to our adoption of IFRS 9, Investmentsecurities were comprised of available-for-sale securities and held-to-maturity securities.
Investment securities carried at amortized cost are measured using the effective interest method, and are presented net of anyallowance for credit losses, calculated in accordance with our policy for Allowance for credit losses, as described below. Interestincome, including the amortization of premiums and discounts on securities measured at amortized cost are recorded in Net interestincome. Impairment gains or losses recognized on amortized cost securities are recorded in Provision for credit losses. When a debtinstrument measured at amortized cost is sold, the difference between the sale proceeds and the amortized cost of the security at thetime of the sale is recorded as a Net gain (loss) on Investment securities in Non-interest income.
Debt securities carried at FVOCI are measured at fair value with unrealized gains and losses arising from changes in fair valueincluded in Other components of equity. Impairment gains and losses are included in Provision for credit losses and correspondinglyreduce the accumulated changes in fair value included in Other components of equity. When a debt instrument measured at FVOCI issold, the cumulative gain or loss is reclassified from Other components of equity to Net gain (loss) on Investment securities inNon-interest income.
Equity securities carried at FVOCI are measured at fair value. Unrealized gains and losses arising from changes in fair value arerecorded in Other components of equity and not subsequently reclassified to profit or loss when realized. Dividends from FVOCI equitysecurities are recognized in Interest income.
We account for all of our securities using settlement date accounting and changes in fair value between the trade date andsettlement date are reflected in income for securities measured at FVTPL, and changes in the fair value of securities measured atFVOCI between the trade and settlement dates are recorded in OCI except for changes in foreign exchange rates on debt securities,which are recorded in Non-interest income.
Fair value optionA financial instrument with a reliably measurable fair value can be designated as FVTPL (the fair value option) on its initial recognitioneven if the financial instrument was not acquired or incurred principally for the purpose of selling or repurchasing. The fair valueoption can be used for financial assets if it eliminates or significantly reduces a measurement or recognition inconsistency that wouldotherwise arise from measuring assets or liabilities, or recognizing related gains and losses on a different basis (an “accountingmismatch”). The fair value option can be elected for financial liabilities if: (i) the election eliminates an accounting mismatch; (ii) thefinancial liability is part of a portfolio that is managed on a fair value basis, in accordance with a documented risk management orinvestment strategy; or (iii) there is an embedded derivative in the financial or non-financial host contract and the derivative is notclosely related to the host contract. These instruments cannot be reclassified out of the FVTPL category while they are held or issued.
Financial assets designated as FVTPL are recorded at fair value and any unrealized gains or losses arising due to changes in fairvalue are included in Trading revenue or Non-interest income – Other, depending on our business purpose for holding the financialasset.
Financial liabilities designated as FVTPL are recorded at fair value and fair value changes attributable to changes in our own creditrisk are recorded in OCI. Own credit risk amounts recognized in OCI are not reclassified subsequently to net income. The remaining fairvalue changes not attributable to changes in our own credit risk are recorded in Trading revenue or Non-interest income – Other,depending on our business purpose for holding the financial liability. Upon initial recognition, if we determine that presenting theeffects of own credit risk changes in OCI would create or enlarge an accounting mismatch in net income, the full fair value change inour debt designated as at FVTPL is recognized in net income. To make that determination, we assess whether we expect that theeffects of changes in the liability’s credit risk will be offset in profit or loss by a change in the fair value of another financial instrumentmeasured at FVTPL. Such an expectation is based on an economic relationship between the characteristics of the liability and thecharacteristics of the other financial instrument. The determination is made at initial recognition and is not reassessed. To determinethe fair value adjustments on our debt instruments designated as at FVTPL, we calculate the present value of the instruments basedon the contractual cash flows over the term of the arrangement by using our effective funding rate at the beginning and end of theperiod.
DerivativesDerivatives are primarily used in trading activities. Derivatives are also used to manage our exposure to interest, currency, credit andother market risks. The most frequently used derivative products are interest rate and foreign exchange swaps, options, futures, andforward rate agreements, equity swaps and credit derivatives. All derivative instruments are recorded on our Consolidated BalanceSheets at fair value.
When derivatives are embedded in other financial instruments or host contracts, such combinations are known as hybridinstruments. Some of the cash flows of a hybrid instrument vary in a way similar to a stand-alone derivative. If the host contract is afinancial asset within the scope of IFRS 9, the classification and measurement criteria are applied to the entire hybrid instrument asdescribed in the Securities section of Note 2. If the host contract is a financial liability or an asset that is not within the scope of
Royal Bank of Canada First Quarter 2018 55
IFRS 9, embedded derivatives are separately recognized if the economic characteristics and risks of the embedded derivative are notclearly and closely related to the host contract, unless an election has been made to elect the fair value option, as described above.The host contract is accounted for in accordance with the relevant standards. When derivatives are used in trading activities, therealized and unrealized gains and losses on these derivatives are recognized in Trading revenue in Non-interest income. Derivativeswith positive fair values are presented as Derivative assets and derivatives with negative fair values are reported as Derivativeliabilities. In accordance with our policy for offsetting financial assets and financial liabilities, the net fair value of certain derivativeassets and liabilities are reported as an asset or liability, as appropriate. Valuation adjustments are included in the fair value ofDerivative assets and Derivative liabilities. Premiums paid and premiums received are part of Derivative assets and Derivativeliabilities, respectively.
When derivatives are used to manage our own exposures, we determine for each derivative whether hedge accounting can beapplied, as discussed in the Hedge accounting section of Note 2 of our 2017 Annual Report.
Hedge accountingWe elected to continue to apply the hedge accounting principles under IAS 39 instead of those under IFRS 9. Our policy for hedgeaccounting is described in Note 2 of our 2017 Annual Report.
LoansLoans are debt instruments recognized initially at fair value and are subsequently measured in accordance with the Classification offinancial assets policy provided above. The majority of our loans are carried at amortized cost using the effective interest method,which represents the gross carrying amount less allowance for credit losses.
Interest on loans is recognized in Interest income – Loans using the effective interest method. The estimated future cash flowsused in this calculation include those determined by the contractual term of the asset and all fees that are considered to be integral tothe effective interest rate. Also included in this amount are transaction costs and all other premiums or discounts. Fees that relate toactivities such as originating, restructuring or renegotiating loans are deferred and recognized as Interest income over the expectedterm of such loans using the effective interest method. Where there is a reasonable expectation that a loan will be originated,commitment and standby fees are also recognized as interest income over the expected term of the resulting loans using the effectiveinterest method. Otherwise, such fees are recorded as other liabilities and amortized into Non-interest income over the commitmentor standby period. Prepayment fees on mortgage loans are not included as part of the effective interest rate at origination. Ifprepayment fees are received on a renewal of a mortgage loan, the fee is included as part of the effective interest rate, and if notrenewed, the prepayment fee is recognized in interest income at the prepayment date.
For loans carried at amortized cost or FVOCI, impairment losses are recognized at each balance sheet date in accordance with thethree-stage impairment model outlined below.
Allowance for credit lossesAn allowance for credit losses (ACL) is established for all financial assets, except for financial assets classified or designated as FVTPLand equity securities designated as FVOCI, which are not subject to impairment assessment. Assets subject to impairmentassessment include certain loans, debt securities, interest-bearing deposits with banks, customers’ liability under acceptances,accounts and accrued interest receivable, and finance and operating lease receivables. ACL on loans is presented in Allowance forloan losses. ACL on debt securities measured at FVOCI is presented in Other components of equity. Other financial assets carried atamortized cost are presented net of ACL on our Consolidated Balance Sheets.
Off-balance sheet items subject to impairment assessment include financial guarantees and undrawn loan commitments. Forcertain retail products, expected credit losses are measured based on the total exposure and are not attributable to the on- andoff-balance sheet components. For these products, ACL is presented in Allowance for loan losses to the extent that ACL does notexceed the related loan balance, and thereafter presented in Other Liabilities – Provisions. For all other off-balance sheet productssubject to impairment assessment, ACL is separately calculated and included in Other Liabilities – Provisions.
We measure the ACL on each balance sheet date according to a three-stage expected credit loss impairment model:• Performing financial assets
• Stage 1 – From initial recognition of a financial asset to the date on which the asset has experienced a significant increasein credit risk relative to its initial recognition, a loss allowance is recognized equal to the credit losses expected to resultfrom defaults occurring over the 12 months following the reporting date.
• Stage 2 – Following a significant increase in credit risk relative to the initial recognition of the financial asset, a lossallowance is recognized equal to the credit losses expected over the remaining lifetime of the asset.
• Impaired financial assets• Stage 3 – When a financial asset is considered to be credit-impaired, a loss allowance is recognized equal to credit losses
expected over the remaining lifetime of the asset. Interest revenue is calculated based on the carrying amount of the asset,net of the loss allowance, rather than on its gross carrying amount.
The ACL is a discounted probability-weighted estimate of the cash shortfalls expected to result from defaults over the relevant timehorizon. For loan commitments, credit loss estimates consider the portion of the commitment that is expected to be drawn over therelevant time period. For financial guarantees, credit loss estimates are based on the expected payments required under theguarantee contract. For finance lease receivables, credit loss estimates are based on cash flows consistent with the cash flows usedin measuring the lease receivable.
Increases or decreases in the required ACL attributable to purchases and new originations, derecognitions or maturities, andremeasurements due to changes in loss expectations or stage migrations are recorded in Provision for credit losses. Write-offs andrecoveries of amounts previously written off are recorded against ACL.
The ACL represents an unbiased estimate of expected credit losses on our financial assets as at the balance sheet date. Judgmentis required in making assumptions and estimations when calculating the ACL, including movements between the three stages and the
56 Royal Bank of Canada First Quarter 2018
Note 2 Summary of significant accounting policies, estimates and judgments (continued)
application of forward looking information. The underlying assumptions and estimates may result in changes to the provisions fromperiod to period that significantly affect our results of operations.
Measurement of expected credit lossesExpected credit losses are based on a range of possible outcomes and consider all available reasonable and supportable informationincluding internal and external ratings, historical credit loss experience, and expectations about future cash flows. The measurementof expected credit losses is based primarily on the product of the instrument’s probability of default (PD), loss given default (LGD),and exposure at default (EAD) discounted to the reporting date. The main difference between Stage 1 and Stage 2 expected creditlosses for performing financial assets is the respective calculation horizon. Stage 1 estimates project PD, LGD and EAD over amaximum period of 12 months while Stage 2 estimates project PD, LGD and EAD over the remaining lifetime of the instrument.
An expected credit loss estimate is produced for each individual exposure. Relevant parameters are modeled on a collective basisusing portfolio segmentation that allows for appropriate incorporation of forward looking information.
For a small percentage of our portfolios which lack detailed historical information and/or loss experience, we apply simplifiedmeasurement approaches that may differ from what is described above. These approaches have been designed to maximize theavailable information that is reliable and supportable for each portfolio and may be collective in nature.
Expected credit losses are discounted to the reporting period date using the effective interest rate.
Expected lifeFor instruments in Stage 2 or Stage 3, loss allowances reflect expected credit losses over the expected remaining lifetime of theinstrument. For most instruments, the expected life is limited to the remaining contractual life.
An exemption is provided for certain instruments with the following characteristics: (a) the instrument includes both a loan andundrawn commitment component; (b) we have the contractual ability to demand repayment and cancel the undrawn commitment;and (c) our exposure to credit losses is not limited to the contractual notice period. For products in scope of this exemption, theexpected life may exceed the remaining contractual life and is the period over which our exposure to credit losses is not mitigated byour normal credit risk management actions. This period varies by product and risk category and is estimated based on our historicalexperience with similar exposures and consideration of credit risk management actions taken as part of our regular credit reviewcycle. Products in scope of this exemption include credit cards, overdraft balances and certain revolving lines of credit. Determiningthe instruments in scope for this exemption and estimating the appropriate remaining life based on our historical experience andcredit risk mitigation practices requires significant judgment.
Assessment of significant increase in credit riskThe assessment of significant increase in credit risk requires significant judgment. Movements between Stage 1 and Stage 2 arebased on whether an instrument’s credit risk as at the reporting date has increased significantly relative to the date it was initiallyrecognized. For the purposes of this assessment, credit risk is based on an instrument’s lifetime PD, not the losses we expect to incur.The assessment is generally performed at the instrument level.
Our assessment of significant increases in credit risk is performed at least quarterly based on three factors. If any of the followingfactors indicates that a significant increase in credit risk has occurred, the instrument is moved from Stage 1 to Stage 2:
(1) We have established thresholds for significant increases in credit risk based on both a percentage and absolute change inlifetime PD relative to initial recognition.
(2) Additional qualitative reviews are performed to assess the staging results and make adjustments, as necessary, to betterreflect the positions whose credit risk has increased significantly.
(3) Instruments which are 30 days past due are generally considered to have experienced a significant increase in credit risk,even if our other metrics do not indicate that a significant increase in credit risk has occurred.
The thresholds for movement between Stage 1 and Stage 2 are symmetrical. After a financial asset has migrated to Stage 2, if itscredit risk is no longer considered to have significantly increased relative to its initial recognition, the financial asset will move back toStage 1.
For certain instruments with low credit risk as at the reporting date, it is presumed that credit risk has not increased significantlyrelative to initial recognition. Credit risk is considered to be low if the instrument has a low risk of default, and the borrower has theability to fulfill their contractual obligations both in the near term and in the longer term, including periods of adverse changes in theeconomic or business environment. Certain interest-bearing deposits with banks, assets purchased under reverse repurchaseagreements, insurance policy loans, and liquidity facilities extended to our multi-seller conduits have been identified as having lowcredit risk.
Use of forward-looking informationThe measurement of expected credit losses for each stage and the assessment of significant increase in credit risk considersinformation about past events and current conditions as well as reasonable and supportable projections of future events andeconomic conditions. The estimation and application of forward-looking information requires significant judgment.
The PD, LGD and EAD inputs used to estimate Stage 1 and Stage 2 credit loss allowances are modelled based on themacroeconomic variables (or changes in macroeconomic variables) that are most closely correlated with credit losses in the relevantportfolio. Each macroeconomic scenario used in our expected credit loss calculation includes a projection of all relevantmacroeconomic variables used in our models for a five year period, subsequently reverting to long-run averages. Macroeconomicvariables used in our expected credit loss models include, but are not limited to, gross domestic product, unemployment rates, bondyields, equity return indices, commercial real estate indices, and commodity prices. Depending on their usage in the models,macroeconomic variables may be projected at a country, province/state or more granular level.
Our estimation of expected credit losses in Stage 1 and Stage 2 is a discounted probability-weighted estimate that considers aminimum of three future macroeconomic scenarios. Our base case scenario is based on macroeconomic forecasts published by our
Royal Bank of Canada First Quarter 2018 57
internal economics group. Upside and downside scenarios vary relative to our base case scenario based on reasonably possiblealternative macroeconomic conditions. Additional and more severe downside scenarios are designed to capture material non-linearityof potential credit losses in portfolios. Scenario design, including the identification of additional downside scenarios, occurs at leaston an annual basis and more frequently if conditions warrant.
Scenarios are designed to capture a wide range of possible outcomes and weighted according to our best estimate of the relativelikelihood of the range of outcomes that each scenario represents. Scenario weights take into account historical frequency, currenttrends, and forward-looking conditions and are updated on a quarterly basis. All scenarios considered are applied to all portfoliossubject to expected credit losses with the same probabilities.
Our assessment of significant increases in credit risk is based on changes in probability-weighted forward-looking lifetime PD asat the reporting date, using the same macroeconomic scenarios as the calculation of expected credit losses.
Definition of defaultThe definition of default used in the measurement of expected credit losses is consistent with the definition of default used for ourinternal credit risk management purposes. Our definition of default may differ across products and consider both quantitative andqualitative factors, such as the terms of financial covenants and days past due. For retail and wholesale borrowers, except as detailedbelow, default occurs when the borrower is more than 90 days past due on any material obligation to us, and/or we consider theborrower unlikely to make their payments in full without recourse action on our part, such as taking formal possession of anycollateral held. For certain credit card balances, default occurs when payments are 180 days past due. For these balances, the use ofa period in excess of 90 days past due is reasonable and supported by observable data on write-off and recovery rates experienced onhistorical credit card portfolios. The definition of default used is applied consistently from period to period and to all financialinstruments unless it can be demonstrated that circumstances have changed such that another definition of default is moreappropriate.
Credit-impaired financial assets (Stage 3)Financial assets are assessed for credit-impairment at each balance sheet date and more frequently when circumstances warrantfurther assessment. Evidence of credit-impairment may include indications that the borrower is experiencing significant financialdifficulty, probability of bankruptcy or other financial reorganization, as well as a measurable decrease in the estimated future cashflows evidenced by the adverse changes in the payments status of the borrower or economic conditions that correlate with defaults.An asset that is in Stage 3 will move back to Stage 2 when, as at the reporting date, it is no longer considered to be credit-impaired.The asset will migrate back to Stage 1 when its credit risk at the reporting date is no longer considered to have increased significantlyfrom initial recognition, which could occur during the same reporting period as the migration from Stage 3 to Stage 2.
When a financial asset has been identified as credit-impaired, expected credit losses are measured as the difference between theasset’s gross carrying amount and the present value of estimated future cash flows discounted at the instrument’s original effectiveinterest rate. For impaired financial assets with drawn and undrawn components, expected credit losses also reflect any credit lossesrelated to the portion of the loan commitment that is expected to be drawn down over the remaining life of the instrument.
When a financial asset is credit-impaired, interest ceases to be recognized on the regular accrual basis, which accrues incomebased on the gross carrying amount of the asset. Rather, interest income is calculated by applying the original effective interest rate tothe amortized cost of the asset, which is the gross carrying amount less the related ACL. Following impairment, interest income isrecognized on the unwinding of the discount from the initial recognition of impairment.
ACL for credit-impaired loans in Stage 3 are established at the borrower level, where losses related to impaired loans areidentified on individually significant loans, or collectively assessed and determined through the use of portfolio-based rates, withoutreference to particular loans.
Individually assessed loans (Stage 3)When individually significant loans are identified as impaired, we reduce the carrying value of the loans to their estimated realizablevalue by recording an individually assessed ACL to cover identified credit losses. The individually assessed ACL reflects the expectedamount of principal and interest calculated under the terms of the original loan agreement that will not be recovered, and the impactof time delays in collecting principal and/or interest (time value of money). The estimated realizable value for each individuallysignificant loan is the present value of expected future cash flows discounted using the original effective interest rate for each loan.When the amounts and timing of future cash flows cannot be estimated with reasonable reliability, the estimated realizable amountmay be determined using observable market prices for comparable loans, the fair value of collateral underlying the loans, and otherreasonable and supported methods based on management judgment.
Individually-assessed allowances are established in consideration of a range of possible outcomes, which may includemacroeconomic or non-macroeconomic scenarios, to the extent relevant to the circumstances of the specific borrower beingassessed. Assumptions used in estimating expected future cash flows reflect current and expected future economic conditions andare generally consistent with those used in Stage 1 and Stage 2 measurement.
Significant judgment is required in assessing evidence of credit-impairment and estimation of the amount and timing of futurecash flows when determining expected credit losses. Changes in the amount expected to be recovered would have a direct impact onthe Provision for credit losses and may result in a change in the ACL.
Collectively assessed loans (Stage 3)Loans that are collectively assessed are grouped on the basis of similar risk characteristics, taking into account loan type, industry,geographic location, collateral type, past due status and other relevant factors.
The collectively-assessed ACL reflects: (i) the expected amount of principal and interest calculated under the terms of the originalloan agreement that will not be recovered, and (ii) the impact of time delays in collecting principal and/or interest (time value ofmoney).
58 Royal Bank of Canada First Quarter 2018
Note 2 Summary of significant accounting policies, estimates and judgments (continued)
The expected principal and interest collection is estimated on a portfolio basis and references historical loss experience ofcomparable portfolios with similar credit risk characteristics, adjusted for the current environment and expected future conditions. Aportfolio specific coverage ratio is applied against the impaired loan balance in determining the collectively-assessed ACL. The timevalue of money component is calculated by using the discount factors applied to groups of loans sharing common characteristics. Thediscount factors represent the expected recovery pattern of the comparable group of loans, and reflect the historical experience ofthese groups adjusted for current and expected future economic conditions and/or industry factors. Significant judgment is requiredin assessing evidence of impairment and estimation of the amount and timing of future cash flows when determining expected creditlosses. Changes in the amount expected to be recovered would have a direct impact on the Provision for credit losses and may resultin a change in the ACL.
Write-off of loansLoans and the related ACL are written off, either partially or in full, when there is no realistic prospect of recovery. Where loans aresecured, they are generally written off after receipt of any proceeds from the realization of collateral. In circumstances where the netrealizable value of any collateral has been determined and there is no reasonable expectation of further recovery, write off may beearlier. For credit cards, the balances and related allowance for credit losses are generally written off when payment is 180 days pastdue. Personal loans are generally written off at 150 days past due.
ModificationsThe original terms of a financial asset may be renegotiated or otherwise modified, resulting in changes to the contractual terms of thefinancial asset that affect the contractual cash flows. The treatment of such modifications is primarily based on the processundertaken to execute the renegotiation and the nature and extent of changes expected to result. Modifications which are performedfor credit reasons, primarily related to troubled debt restructurings, are generally treated as modifications of the original financialasset. Modifications which are performed for other than credit reasons are generally considered to be an expiry of the original cashflows; accordingly, such renegotiations are treated as a derecognition of the original financial asset and recognition of a new financialasset.
If a modification of terms does not result in derecognition of the financial asset, the carrying amount of the financial asset isrecalculated as the present value of the renegotiated or modified contractual cash flows, discounted at the original effective interestrate and a gain or loss is recognized. The financial asset continues to be subject to the same assessments for significant increase incredit risk relative to initial recognition and credit-impairment, as described above. A modified financial asset will migrate out ofStage 3 if the conditions that led to it being identified as credit-impaired are no longer present and relate objectively to an eventoccurring after the original credit-impairment was recognized. A modified financial asset will migrate out of Stage 2 when it no longersatisfies the relative thresholds set to identify significant increases in credit risk, which are based on changes in its lifetime PD, dayspast due and other qualitative considerations.
If a modification of terms results in derecognition of the original financial asset and recognition of the new financial asset, thenew financial asset will generally be recorded in Stage 1, unless it is determined to be credit-impaired at the time of the renegotiation.For the purposes of assessing for significant increases in credit risk, the date of initial recognition for the new financial asset is thedate of the modification.
Impact of adoption of IFRS 9
Mandatory reclassificationsThe combined application of the business model and SPPI tests on adoption of IFRS 9 resulted in the reclassification of the followingfinancial assets and liabilities.
IFRS 9 IAS 39
As at
November 1
2017October 31
2017(Millions of Canadian dollars) Measurement category Carrying amount Previous measurement category Carrying amount
and securities borrowed (4) FVTPL 11,720 Loans and receivables 11,720Loans (2) FVTPL 380 Loans and receivables 405Loans (5) FVOCI 547 Loans and receivables 540Financial liabilities:Other
Obligations related to assets sold under repurchaseagreements and securities loaned (4) FVTPL (designated) $ 2,534 Amortized cost $ 2,534
(1) $833 million of equity securities previously classified as available-for-sale were reclassified to FVTPL by nature. $1,739 million of debt securities previously classified as available-for-sale whosecash flows are not solely payments of principal or interest were reclassified to FVTPL.
(2) Loans and securities whose cash flows are not solely payments of principal or interest were reclassified to FVTPL.(3) Debt securities managed within a HTC business model were reclassified from available-for-sale to amortized cost. As at January 31, 2018, the fair value of these securities was $20,759 million. For
the period ended January 31, 2018, $150 million of losses would have been recognized in OCI if the securities had not been reclassified.(4) Assets purchased under reverse repurchase agreements and securities borrowed previously classified as loans and receivables were reclassified to FVTPL as they are managed on a fair value basis.
Obligations related to assets sold under repurchase agreements and securities loaned, previously measured at amortized cost, were designated as FVTPL as they are similarly managed on a fairvalue basis.
(5) Loans managed under a business model to HTC&S were reclassified to FVOCI.
Royal Bank of Canada First Quarter 2018 59
Items previously designated as FVTPLThe following financial assets previously designated as FVTPL were classified as FVTPL by nature because the assets are managed ona fair value basis or FVOCI as they are managed under a business model to HTC&S.
IFRS 9 IAS 39
As at
November 1
2017October 31
2017(Millions of Canadian dollars) Measurement category Carrying amount Previous Measurement category Carrying amount
Optional designationsIn conjunction with the classification changes required by IFRS 9, the following optional designations have been made on transition toIFRS 9.
IFRS 9 IAS 39
As at
November 1
2017October 31
2017(Millions of Canadian dollars) Measurement category Carrying amount Previous measurement category Carrying amount
(1) Certain equity securities that are not held for trading purposes have been designated as FVOCI.(2) Loans in our insurance business were designated as FVTPL to address an accounting mismatch with the related liabilities.(3) Certain deposits were designated as FVTPL to address an accounting mismatch with the related loans, which were reclassified to FVTPL because their cash flows are not solely payments of principal
or interest.
60 Royal Bank of Canada First Quarter 2018
Note 2 Summary of significant accounting policies, estimates and judgments (continued)
OtherThe following table presents other changes resulting from the adoption of IFRS 9.
IFRS 9 IAS 39
As at
November 1
2017October 31
2017(Millions of Canadian dollars) Measurement category Carrying amount Previous measurement category Carrying amount
Financial assets:Investment Securities (1) Amortized cost $ 7,220 Loans and receivables $ 7,232Investment Securities (1) Amortized cost 14,665 Held to maturity 14,845
(1) Prior to the adoption of IFRS 9, certain financial assets were reclassified from available-for-sale to held-to-maturity or loans and receivables. Upon adoption of IFRS 9, these financial assets wereremeasured as if they had always been carried at amortized cost and reclassified to Investment Securities.
Balance sheet presentationOn November 1, 2017, the balance sheet line item under Securities previously titled Available-for-sale was re-named to ‘Investment’.Investment securities represent all securities other than those measured at FVTPL, which are presented as Trading. For comparativeperiods, Investment securities represent securities previously classified as available-for-sale and held-to-maturity under IAS 39. Forthe current period, Investment securities represent securities classified as FVOCI and amortized cost under IFRS 9.
Allowance for credit lossesThe following table is a comparison of impairment allowances determined in accordance with IAS 39 and IAS 37 to the correspondingimpairment allowance determined in accordance with IFRS 9 as at November 1, 2017.
IAS 39 / IAS 37 as at October 31, 2017 IFRS 9 as at November 1, 2017
(Millions of Canadian dollars)Collectively
assessed (1)Individually
assessed TotalTransition
Adjustments Stage 1 Stage 2 Stage 3 Total
Debt securities at fair value through other comprehensiveincome (2) (3) $ – $ – $ – $ 25 $ 3 $ 22 $ – $ 25
Debt securities at amortized cost (4) – – – 54 9 45 – 54Assets purchased under reverse repurchase agreements and
securities borrowed at amortized cost – – – 1 1 – – 1Loans at amortized cost 1,855 304 2,159 590 845 1,184 720 2,749Customers’ liability under acceptances at amortized cost – – – 20 15 5 – 20Other assets at amortized cost – – – 1 – 1 – 1Off-balance sheet loan commitments and financial
guarantees 91 – 91 143 104 130 – 234
Total allowance for credit losses $ 1,946 $ 304 $2,250 $ 834 $ 977 $1,387 $ 720 $3,084
(1) Includes the allowance for loans not yet identified as impaired and collectively-assessed allowances for impaired loans.(2) The allowance for credit losses on financial assets at FVOCI is presented in Other components of equity.(3) Previously available-for-sale debt securities under IAS 39.(4) Previously held-to-maturity securities under IAS 39.
Royal Bank of Canada First Quarter 2018 61
The table below provides the reconciliations from IAS 39 to IFRS 9 for our Consolidated Balance Sheets, showing separately theimpacts of adopting the IFRS 9 impairment, and classification and measurement, requirements. The related tax impacts are includedin Other assets – Other.
Consolidated Balance Sheets
(Millions of Canadian Dollars)
As atOctober 31,
2017IAS 39
Impact ofclassification
andmeasurement
Impact ofimpairment
TotalImpact
As atNovember 1,
2017IFRS 9
AssetsCash and due from banks $ 28,407 $ – $ – $ – $ 28,407
Interest-bearing deposits with banks 32,662 – – – 32,662
SecuritiesTrading 127,657 2,952 – 2,952 130,609Investment, net of applicable allowance 90,722 4,615 (54) 4,561 95,283
Carrying value and fair value of financial instrumentsThe following tables provide a comparison of the carrying and fair values for each classification of financial instruments. Embeddedderivatives are presented on a combined basis with the host contracts. Refer to Note 2 and Note 3 of our audited 2017 AnnualConsolidated Financial Statements for a description of the valuation techniques and inputs used in the fair value measurement of ourfinancial instruments. There have been no significant changes to our determination of fair value during the quarter.
As at January 31, 2018
Carrying value and fair value Carrying value Fair value
(1) Investment securities include securities measured at FVOCI and amortized cost under IFRS 9 and available-for-sale (AFS) and held-to-maturity securities under IAS 39.(2) Includes Customers’ liability under acceptances and financial instruments recognized in Other assets.(3) Business and government deposits include deposits from regulated deposit-taking institutions other than banks.(4) Bank deposits refer to deposits from regulated deposit-taking institutions.(5) Includes Acceptances and financial instruments recognized in Other liabilities.
64 Royal Bank of Canada First Quarter 2018
Note 3 Fair value of financial instruments (continued)
Fair value of assets and liabilities measured at fair value on a recurring basis and classified using the fair value hierarchyAs at
January 31, 2018 October 31, 2017
Fair value measurements using Totalgross fair
valueNetting
adjustments
Assets/liabilities
at fair value
Fair value measurements using Totalgross fair
valueNetting
adjustments
Assets/liabilities
at fair value(Millions of Canadian dollars) Level 1 Level 2 Level 3 Level 1 Level 2 Level 3
(1) As at January 31, 2018, residential and commercial mortgage-backed securities (MBS) included in all fair value levels of trading securities were $17,500 million and $nil (October 31, 2017 –$17,977 million and $nil), respectively, and in all fair value levels of Investment securities were $4,686 million and $856 million (October 31, 2017 – $13,352 million and $727 million),respectively.
(2) OECD stands for Organisation for Economic Co-operation and Development.(3) CDO stands for collateralized debt obligations.(4) Amounts as of October 31, 2017 exclude $100 million of Investment securities that are carried at cost.
Royal Bank of Canada First Quarter 2018 65
Quantitative information about fair value measurements using significant unobservable inputs (Level 3 Instruments)During the three months ended January 31, 2018, there were no significant changes made to the valuation techniques, sensitivitiesto, and interrelationships between unobservable inputs used in the determination of fair value of Level 3 financial instruments. Duringthe three months ended January 31, 2018, changes in the ranges and weighted averages of unobservable inputs did not have asignificant impact on the unrealized gains (losses) included in earnings for Level 3 financial instruments. Refer to Note 3 of ouraudited 2017 Annual Consolidated Financial Statements for quantitative information about fair value measurements using significantunobservable inputs.
Changes in fair value measurement for instruments measured on a recurring basis and categorized in Level 3The following tables present the changes in fair value measurements on a recurring basis for instruments included in Level 3 of thefair value hierarchy.
For the three months ended January 31, 2018
(Millions of Canadian dollars)
Fair valueat beginningof period (1)
Totalrealized/
unrealizedgains (losses)
includedin earnings
Totalunrealized
gains (losses)included in
OCI (2)
Purchasesof assets/issuances
of liabilities
Sales ofassets/
settlementsof liabilities
and other (3)
Transfersinto
Level 3
Transfersout of
Level 3
Fair valueat end of
period
Changes inunrealized gains(losses) included
in earnings forassets and
liabilities forpositions still held
AssetsSecurities
TradingCanadian government debt
Provincial and municipal $ – $ – $ – $ – $ – $ – $ – $ – $ –U.S. state, municipal and
(1) These amounts reflect certain reclassifications made upon adoption of IFRS 9. Refer to Note 2 for further details.(2) These amounts include the foreign currency translation gains or losses arising on consolidation of foreign subsidiaries relating to the Level 3 instruments, where applicable. The unrealized gains on
Investment securities recognized in OCI were $32 million for the three months ended January 31, 2018 (January 31, 2017 – gains of $21 million), excluding the translation gains or losses arising onconsolidation.
(3) Other includes amortization of premiums or discounts recognized in net income.(4) Net derivatives as at January 31, 2018 included derivative assets of $485 million (January 31, 2017 – $564 million) and derivative liabilities of $1,132 million (January 31, 2017 – $1,206 million).n.a. not applicable
Transfers between fair value hierarchy levels for instruments carried at fair value on a recurring basisTransfers between Level 1 and 2 are dependent on whether fair value is obtained on the basis of quoted market prices in activemarkets (Level 1).
During the three months ended January 31, 2018, transfers out of Level 1 to Level 2 included Trading U.S. state, municipal andagencies debt and Obligations related to securities sold short of $13 million and $47 million, respectively.
Transfers between Level 2 and Level 3 are primarily due to either a change in the market observability for an input, or a change inan unobservable input’s significance to a financial instrument’s fair value.
For the three months ended January 31, 2018, transfers of over-the-counter (OTC) equity options in Other contracts were due tochanges in the market observability of inputs, and transfers relating to Interest rate contracts and Personal deposits were due tochanges in the significance of unobservable inputs to their fair values.
During the three months ended January 31, 2018, significant transfers out of Level 3 to Level 2 primarily included $130 million(net liabilities) of interest rate contracts, comprised of $143 million of derivative-related assets and $13 million of derivative-relatedliabilities. During the three months ended January 31, 2018, significant transfers out of Level 3 to Level 2 in Other contracts included
Royal Bank of Canada First Quarter 2018 67
$27 million (net liabilities) of OTC equity options comprised of $342 million of assets and $369 million of liabilities. In addition,significant transfers out of Level 3 to Level 2 included $117 million of Personal deposits.
Positive and negative fair value movements of Level 3 financial instruments from using reasonably possible alternative assumptionsA financial instrument is classified as Level 3 in the fair value hierarchy if one or more of its unobservable inputs may significantlyaffect the measurement of its fair value. In preparing the financial statements, appropriate levels for these unobservable inputparameters are chosen so that they are consistent with prevailing market evidence or management judgment. Due to theunobservable nature of the prices or rates, there may be uncertainty about the valuation of these Level 3 financial instruments.
The following table summarizes the impacts to fair values of Level 3 financial instruments using reasonably possible alternativeassumptions. This sensitivity disclosure is intended to illustrate the potential impact of the relative uncertainty in the fair value ofLevel 3 financial instruments. In reporting the sensitivities below, we offset balances in instances where: (i) the move in valuationfactor caused an offsetting positive and negative fair value movement, (ii) both offsetting instruments are in Level 3, and(iii) exposures are managed and reported on a net basis. With respect to overall sensitivity, it is unlikely in practice that all reasonablypossible alternative assumptions would simultaneously be realized.
As at
January 31, 2018 October 31, 2017
(Millions of Canadian dollars) Level 3 fair value
Positive fair valuemovement from
using reasonablypossible
alternatives
Negative fair valuemovement from
using reasonablypossible
alternatives Level 3 fair value
Positive fair valuemovement from
using reasonablypossible
alternatives
Negative fair valuemovement from
using reasonablypossible
alternatives
SecuritiesTrading
U.S. state, municipal and agencies debt $ 187 $ 3 $ (7) $ – $ – $ –Asset-backed securities 196 13 (19) – – –Corporate debt and other debt 29 – – 29 – –Equities 975 4 (3) 425 – –
Corporate debt and other debt 24,396 106 (43) 24,459Equities 875 320 (7) 1,188Loan substitute securities 29 – (1) 28
$ 75,497 $ 719 $ (339) $75,877
(1) The majority of the MBS are residential. Cost/Amortized cost, gross unrealized gains, gross unrealized losses and fair value related to commercial MBS are $856 million, $1 million, $1 million and$856 million, respectively as at January 31, 2018 (October 31, 2017 – $727 million, $1 million, $1 million and $727 million).
(2) Excludes $45,358 million of held-to-collect securities as at January 31, 2018 that are carried at amortized cost, net of allowance for credit losses (October 31, 2017 $14,845 million of held-to-maturity securities that are carried at amortized cost).
(3) Includes $42 million of allowance for credit losses on debt securities at fair value through other comprehensive income, recognized in income and retained earnings, as at January 31, 2018.(4) Includes securities issued by U.S. non-agencies backed by government insured assets, MBS and asset-backed securities issued by U.S. government agencies.
Allowance for credit losses on investment securitiesThe following tables reconcile the opening and closing allowance for debt securities at amortized cost and FVOCI by stage. Reconcilingitems include the following:
• Transfers between stages, which are presumed to occur before any corresponding remeasurement of the allowance.• Purchases and originations, which reflect the allowance related to assets newly recognized during the period, including those
assets that were derecognized following a modification of terms.• Derecognitions and maturities, which reflect the allowance related to assets derecognized during the period without a credit
loss being incurred, including those assets that were derecognized following a modification of terms.• Remeasurements, which comprise the impact of changes in model inputs or assumptions, including changes in forward-
looking macroeconomic conditions; partial repayments and additional draws on existing facilities; changes in themeasurement following a transfer between stages; and unwinding of the time value discount due to the passage of time.
• During the three months ended January 31, 2018, there were no significant changes to the models used to estimate expectedcredit losses.
Allowance for credit losses – securities at amortized costIFRS 9
For the three months ended January 31, 2018
Performing Impaired
(Millions of Canadian dollars) Stage 1 Stage 2 Stage 3 Total
Balance at beginning of period $ 9 $ 45 $ – $54Provision for credit losses
Transfers in (out) to Stage 1 3 (3) – –Transfers in (out) to Stage 2 (7) 7 – –Transfers in (out) to Stage 3 – – – –Purchases and originations 1 – – 1Derecognitions and maturities (1) (9) – (10)Remeasurements (1) (2) – (3)
Exchange rate and other – (3) – (3)
Balance at end of period $ 4 $ 35 $ – $39
Royal Bank of Canada First Quarter 2018 69
Allowance for credit losses – securities at FVOCI (1)
IFRS 9
For the three months ended January 31, 2018
Performing Impaired
(Millions of Canadian dollars) Stage 1 Stage 2 Stage 3 Total
Balance at beginning of period $ 3 $ 22 $ – $25Provision for credit losses
Transfers in (out) to Stage 1 – – – –Transfers in (out) to Stage 2 – – – –Transfers in (out) to Stage 3 – – – –Purchases and originations 34 – – 34Derecognitions and maturities – (17) – (17)Remeasurements – 2 – 2
Exchange rate and other – (2) – (2)
Balance at end of period $ 37 $ 5 $ – $42
(1) Expected credit losses on debt securities at FVOCI are not separately recognized on the balance sheet as the related securities are recorded at fair value. The cumulative amount of credit lossesrecognized in profit or loss is presented in Other components of equity.
Credit risk exposure by internal risk ratingThe following table presents the gross carrying amount of securities at amortized cost and the fair value of debt securities at FVOCI.Risk ratings are based on internal ratings as at the reporting date as outlined in the internal ratings maps for Wholesale and Retailfacilities provided on pages 59-60 of our 2017 Annual Report.
IFRS 9
As at January 31, 2018
Performing Impaired
(Millions of Canadian dollars) Stage 1 Stage 2 Stage 3 Total
46,998 139 – 47,137Items not subject to impairment (1) 406
47,543
(1) Investment securities at FVOCI not subject to impairment represent equity securities designated as FVOCI.
Impairment of AFS securities (IAS 39)AFS securities were assessed for objective evidence of impairment at each reporting date and more frequently when conditionswarrant. Depending on the nature of the securities under review, we applied specific methodologies to assess whether the cost/amortized cost of the security would be recovered. As at January 31, 2017, our gross unrealized losses on AFS securities were$386 million. There was no objective evidence of impairment on our AFS securities that were in an unrealized loss position as atJanuary 31, 2017.
Net gains and losses on available-for-sale securities (IAS 39) (1)
(1) Realized gains of $2 million related to our insurance operations are excluded from Net gains and losses on Investment securities and are included in Insurance premiums, investment and feeincome in the Consolidated Statements of Income for the three months ended January 31, 2017. There were no realized losses or impairment losses related to our insurance operations for the threemonths ended January 31, 2017.
70 Royal Bank of Canada First Quarter 2018
Note 4 Securities (continued)
During the three months ended January 31, 2017, $27 million of net gains were recognized in Non-interest income. The period reflectsnet realized gains of $44 million mainly comprised of distributions from, and gains on sales of, certain Equities and Other OECDgovernment debt. Also included in the net gains were $17 million of impairment losses primarily on certain Equities and U.S. state,municipal and agencies debt.
Held-to-maturity securities (IAS 39)Held-to-maturity securities measured at amortized cost were subject to periodic impairment review and were classified as impairedwhen, in management’s opinion, there was no longer reasonable assurance of the timely collection of the full amount of principaland interest. The impairment review of held-to-maturity securities was primarily based on the impairment model for loans. As atJanuary 31, 2017, there was no objective evidence of impairment on our held-to-maturity securities.
WholesaleBusiness, sovereign and bank 1,010 72 (18) (39) 1,025
Customers’ liability under acceptances 20 (3) – (1) 16
$ 2,976 $ 334 $ (250) $ (65) $ 2,995
Presented as:Allowance for loan losses $ 2,749 $ 2,776Other liabilities – Provisions 207 202Customers’ liability under acceptances 20 16Other components of equity – 1
(1) Includes interest income on impaired loans of $17 million for the three months ended January 31, 2018.
The following tables reconcile the opening and closing allowance for loans and commitments, by stage, for each major productcategory. Reconciling items include the following:
• Transfers between stages, which are presumed to occur before any corresponding remeasurement of the allowance.• Purchases and originations, which reflect the allowance related to assets newly recognized during the period, including those
assets that were derecognized following a modification of terms.• Derecognitions and maturities, which reflect the allowance related to assets derecognized during the period without a credit
loss being incurred, including those assets that were derecognized following a modification of terms.• Remeasurements, which comprise the impact of changes in model inputs or assumptions, including changes in forward-
looking macroeconomic conditions; partial repayments and additional draws on existing facilities; changes in themeasurement following a transfer between stages; and unwinding of the time value discount due to the passage of time.
• During the three months ended January 31, 2018, there were no significant changes to the models used to estimate expectedcredit losses.
Allowance for credit losses – Residential mortgagesIFRS 9
For the three months ended January 31, 2018
Performing Impaired
(Millions of Canadian dollars) Stage 1 Stage 2 Stage 3 Total
Balance at beginning of period $ 140 $ 65 $ 173 $ 378Provision for credit losses
Transfers in (out) to Stage 1 22 (22) – –Transfers in (out) to Stage 2 (5) 5 – –Transfers in (out) to Stage 3 – (3) 3 –Purchases and originations 16 – – 16Derecognitions and maturities (3) (3) – (6)Remeasurements (36) 27 12 3
Write-offs – – (14) (14)Recoveries – – 1 1Exchange rate and other (4) (2) (9) (15)
Balance at end of period $ 130 $ 67 $ 166 $ 363
Royal Bank of Canada First Quarter 2018 71
Allowance for credit losses – PersonalIFRS 9
For the three months ended January 31, 2018
Performing Impaired
(Millions of Canadian dollars) Stage 1 Stage 2 Stage 3 Total
Balance at beginning of period $ 278 $ 427 $ 121 $ 826Provision for credit losses
Transfers in (out) to Stage 1 204 (204) – –Transfers in (out) to Stage 2 (42) 42 – –Transfers in (out) to Stage 3 – (43) 43 –Purchases and originations 26 2 – 28Derecognitions and maturities (9) (35) – (44)Remeasurements (180) 271 70 161
Write-offs – – (129) (129)Recoveries – – 27 27Exchange rate and other (2) (1) (5) (8)
Balance at end of period $ 275 $ 459 $ 127 $ 861
Allowance for credit losses – Credit cardsIFRS 9
For the three months ended January 31, 2018
Performing Impaired
(Millions of Canadian dollars) Stage 1 Stage 2 Stage 3 Total
Balance at beginning of period $ 251 $ 442 $ – $ 693Provision for credit losses
Transfers in (out) to Stage 1 228 (228) – –Transfers in (out) to Stage 2 (40) 40 – –Transfers in (out) to Stage 3 – (37) 37 –Purchases and originations 3 1 – 4Derecognitions and maturities (4) (30) – (34)Remeasurements (224) 279 73 128
Write-offs – – (142) (142)Recoveries – – 32 32Exchange rate and other (2) 1 – (1)
Balance at end of period $ 212 $ 468 $ – $ 680
Allowance for credit losses – Small businessIFRS 9
For the three months ended January 31, 2018
Performing Impaired
(Millions of Canadian dollars) Stage 1 Stage 2 Stage 3 Total
Balance at beginning of period $ 15 $ 15 $ 19 $ 49Provision for credit losses
Transfers in (out) to Stage 1 8 (8) – –Transfers in (out) to Stage 2 (2) 2 – –Transfers in (out) to Stage 3 – (3) 3 –Purchases and originations 3 – – 3Derecognitions and maturities (1) (2) – (3)Remeasurements (7) 12 4 9
Write-offs – – (9) (9)Recoveries – – 2 2Exchange rate and other 1 (1) (1) (1)
Balance at end of period $ 17 $ 15 $ 18 $ 50
72 Royal Bank of Canada First Quarter 2018
Note 5 Loans (continued)
Allowance for credit losses – Business, sovereign and bankIFRS 9
For the three months ended January 31, 2018
Performing Impaired
(Millions of Canadian dollars) Stage 1 Stage 2 Stage 3 Total
Balance at beginning of period $ 251 $ 352 $ 407 $ 1,010Provision for credit losses
Transfers in (out) to Stage 1 58 (58) – –Transfers in (out) to Stage 2 (35) 35 – –Transfers in (out) to Stage 3 – (6) 6 –Purchases and originations 52 8 – 60Derecognitions and maturities (41) (52) – (93)Remeasurements (32) 63 74 105
Write-offs – – (27) (27)Recoveries – – 9 9Exchange rate and other (4) (8) (27) (39)Balance at end of period $ 249 $ 334 $ 442 $ 1,025
(1) The allowance for off-balance sheet and other items is reported separately in Other liabilities – Provisions.
Key inputs and assumptionsThe measurement of expected credit losses is a complex calculation that involves a large number of interrelated variables. The keydrivers of changes in expected credit losses include the following:
• Changes in the credit quality of the borrower or instrument, reflected in changes in internal or external risk ratings;• Changes in forward-looking macroeconomic conditions, specifically the variables to which our models are calibrated, which are
those most closely correlated with credit losses in the relevant portfolio;• Changes in scenario design and the weights assigned to each scenario; and• Migration between stages, which can be trigged by changes to any of the above inputs.
Further details on the key inputs and assumptions used as at January 31, 2018 are provided below.
Internal risk ratingsInternal risk ratings are assigned according to the risk management framework outlined in the Credit Risk section of our 2017 AnnualReport. Changes in internal risk ratings are reflected in the PD, LGD and EAD parameters, which are estimated based on our historicalloss experience at the relevant risk segment or risk rating level, adjusted for forward-looking information.
Forward looking macroeconomic variablesThe PD, LGD and EAD inputs used to estimate Stage 1 and Stage 2 credit loss allowances are modelled based on the macroeconomicvariables (or changes in macroeconomic variables) that are most closely correlated with credit losses in the relevant portfolio.Depending on their usage in the models, macroeconomic variables are projected at a country, province/state or more granular level.These include one or more of the real, financial and commodity variables, described below, which differ by portfolio and region.
Our Retail PD and LGD models primarily utilize housing price indices, unemployment rates, prime interest rates and 10-yeargovernment bond yields. Our Wholesale PD and LGD models utilize a broader range of variables, which vary by sector and/or product.These include, amongst other inputs: GDP, unemployment rates, 10-year government bond yields, 10-year corporate bond yields,equity return indices, commercial real estate indices, and commodity prices.
Each macroeconomic scenario used in our expected credit loss calculation includes a projection of all relevant macroeconomicvariables used in our models for a five year period, subsequently reverting to long-run averages.
Royal Bank of Canada First Quarter 2018 73
Scenario designOur estimation of expected credit losses in Stage 1 and Stage 2 considers five distinct future macroeconomic scenarios. Scenarios aredesigned to capture a wide range of possible outcomes and weighted according to our best estimate of the relative likelihood of therange of outcomes that each scenario represents. Scenario weights take into account historical frequency, current trends, andforward-looking conditions. The base case scenario is based on forecasts of the expected rate, value or yield for each of themacroeconomic variables identified above. The upside and downside scenarios are set by adjusting our base projections to constructreasonably possible scenarios that are more optimistic and pessimistic, respectively. Two additional downside scenarios weredesigned for the real estate and energy sectors to capture the non-linear nature of potential credit losses in these portfolios.
Migration between stagesMigration between Stage 1 and Stage 2 is based on the assessment of significant increases in credit risk relative to initial recognition.Refer to Note 2 for further details on our policy for assessing for significant increase in credit risk. The impact of moving from12 months expected credit losses to lifetime expected credit losses, or vice versa, varies by product and is dependent on the expectedremaining life at the date of the transfer. Stage migrations may result in significant fluctuations in expected credit losses.
Credit risk exposure by internal risk ratingThe following table presents the gross carrying amount of loans measured at amortized cost and the full contractual amount ofundrawn loan commitments subject to the impairment requirements of IFRS 9. Risk ratings are based on internal ratings as at thereporting date as outlined in the internal ratings maps for Wholesale and Retail facilities provided on page 59-60 of our 2017 AnnualReport.
IFRS 9
As at January 31, 2018
(Millions of Canadian dollars) Stage 1 Stage 2 Stage 3 (1) Total
(1) Stage 3 includes acquired credit-impaired (ACI) loans. As at January 31, 2018, acquired credit-impaired loans for Retail – Residential Mortgages was $1 million, Retail – Personal was $1 million andWholesale – Business, Sovereign and Bank was $22 million.
(2) Retail Loans outstanding – Residential Mortgages and Wholesale Loans outstanding – Business, Sovereign and Bank items not subject to impairment are loans held at FVTPL.
Gross carrying value of loans individually determined to be impaired (1)
IAS 39
As at
(Millions of Canadian dollars)October 31
2017
Retail (2) $ –Wholesale (2)
Business 1,126Bank –
Acquired credit-impaired loans 256
Total $ 1,382(1) Average balance of gross individually assessed impaired loans for the three months ended October 31, 2017 was $1,658 million.(2) Excludes acquired credit-impaired loans.
Loans past due but not impaired (1)
IFRS 9 IAS 39
As at
January 31, 2018 October 31, 2017
(Millions of Canadian dollars) 1 to 29 days 30 to 89 days90 days
and greater Total 1 to 29 days 30 to 89 days90 days
(1) Amounts presented may include loans past due as a result of administrative processes, such as mortgage loans on which payments are restrained pending payout due to sale or refinancing. Pastdue loans arising from administrative processes are not representative of the borrowers’ ability to meet their payment obligations.
Acquired credit-impaired loansACI loans resulting from the acquisition of City National include Retail, Wholesale and Federal Deposit Insurance Corporation (FDIC)covered loans. The following table provides further details of our ACI loans.
IFRS 9 IAS 39
As at
(Millions of Canadian dollars)January 31
2018October 31
2017
City NationalUnpaid principal balance (1) $ 211 $ 245Credit-related fair value adjustments (5) (5)Interest rate and other related premium/(discount) 15 16
Carrying value 221 256Individually assessed allowance (3) (3)
Carrying value net of related allowance $ 218 $ 253(1) Represents contractual amount owed net of write-offs since the acquisition of the loan.
FDIC covered loansFDIC covered loans are loans that, as at the reporting date, are subject to loss-share agreements with the FDIC under which the FDICreimburses us for 80% of the net losses incurred on the underlying loan portfolio. As at January 31, 2018, the balance of FDIC coveredloans recorded in Loans on the Consolidated Balance Sheet was $6 million (October 31, 2017 – $6 million). As at January 31, 2018,the balances for indemnification assets and clawback liabilities were $nil and $25 million (October 31, 2017 – $nil and $26 million),respectively.
Royal Bank of Canada First Quarter 2018 75
Note 6 Deposits
The following table details our deposit liabilities.
As at
January 31, 2018 October 31, 2017
(Millions of Canadian dollars) Demand (1) Notice (2) Term (3) Total Demand (1) Notice (2) Term (3) Total
(1) Demand deposits are deposits for which we do not have the right to require notice of withdrawal, which includes both savings and chequing accounts.(2) Notice deposits are deposits for which we can legally require notice of withdrawal. These deposits are primarily savings accounts.(3) Term deposits are deposits payable on a fixed date, and include term deposits, guaranteed investment certificates and similar instruments.(4) The geographical splits of the deposits are based on the point of origin of the deposits and where the revenue is recognized. As at January 31, 2018, deposits denominated in U.S. dollars, British
pounds, Euro and other foreign currencies were $291 billion, $18 billion, $39 billion and $27 billion, respectively (October 31, 2017 – $283 billion, $16 billion, $37 billion and $29 billion).(5) Europe includes the United Kingdom, Luxembourg and the Channel Islands.
The following table presents the contractual maturities of our term deposit liabilities.
As at
(Millions of Canadian dollars)January 31
2018October 31
2017
Within 1 year:less than 3 months $ 94,569 $ 71,8413 to 6 months 48,003 41,2216 to 12 months 71,899 82,588
1 to 2 years 46,648 52,0332 to 3 years 44,963 40,4003 to 4 years 24,917 30,0624 to 5 years 23,050 18,745Over 5 years 20,596 23,593
$ 374,645 $ 360,483
Aggregate amount of term deposits in denominations of one hundred thousand dollars or more $ 315,000 $ 328,000
76 Royal Bank of Canada First Quarter 2018
Note 7 Employee benefits – Pension and other post-employment benefits
We offer a number of defined benefit and defined contribution plans which provide pension and post-employment benefits to eligibleemployees. The following tables present the composition of our pension and other post-employment benefit expense and the effectsof remeasurements recorded in other comprehensive income.
Pension and other post-employment benefit expenseFor the three months ended
Pension plans Other post-employment benefit plans
(Millions of Canadian dollars)January 31
2018January 31
2017January 31
2018January 31
2017
Current service costs $ 89 $ 95 $ 10 $ 10Past service costs – (2) – –Net interest expense (income) 2 11 16 17Remeasurements of other long term benefits – – – (4)Administrative expense 4 3 – –
Return on plan assets (excluding interest based on discount rate) (85) 56 – –
$ (67) $ (709) $ (2) $ (94)
(1) Market based assumptions, including Changes in financial assumptions and Return on plan assets, are reviewed on a quarterly basis. All other assumptions are updated during our annual review ofplan assumptions.
Note 8 Income taxes
U.S. Tax ReformIn December 2017, the U.S. H.R. 1 was passed into law. The changes include a reduction in the corporate income tax rate from 35% to21% which resulted in a write-down of $178 million (US$142 million), primarily related to net deferred tax assets. As the reduced taxrates are effective on January 1, 2018, the lower average tax rate applicable to subsidiaries includes the fiscal 2018 blended rate forU.S. subsidiaries. Please refer to the Economic, market and regulatory review and outlook section of the Management’s Discussionand Analysis for further details.
Tax examinations and assessmentsDuring the previous year, we received proposal letters (the Proposals) from the Canada Revenue Agency (CRA), in respect of the 2012taxation year, which suggest that Royal Bank of Canada owes additional income taxes of approximately $250 million, excludinginterest, as the tax deductibility of certain dividends was denied on the basis that they were part of a “dividend rental arrangement”.This Proposal is consistent with reassessments also received during the previous year for approximately $209 million of additionalincome tax and interest for taxation year 2011 and approximately $225 million of tax and interest reassessments received in 2016 fortaxation years 2010 and 2009 in respect of the same matter.
The dividends to which the Proposals and reassessments relate were received in transactions similar to those addressed in the2015 Canadian Federal Budget, which disallowed deduction of these dividends from similar arrangements with prospectiveapplication effective May 1, 2017. It is possible that the CRA will reassess us for significant additional income tax for subsequentyears on the same basis. We are confident that our tax filing position was appropriate and intend to defend ourselves vigorously.
Royal Bank of Canada First Quarter 2018 77
Note 9 Significant capital and funding transactions
Preferred sharesOn November 13, 2017, we redeemed all 82,050 outstanding Non-Cumulative Perpetual First Preferred Shares Series C-1 for cash at aredemption price of US$1,000 per share (equivalent to US$25.00 per related depositary share).
Common shares issued (1)
For the three months ended
January 31, 2018 January 31, 2017
(Millions of Canadian dollars, except number of shares)
Number ofshares
(thousands) Amount
Number ofshares
(thousands) Amount
Issued in connection with share-based compensation plans (2) 464 $ 30 1,479 $ 96Purchased for cancellation (3) (9,297) (113) (11,333) (137)
(8,833) $ (83) (9,854) $ (41)(1) The requirements of our dividend reinvestment plan (DRIP) are satisfied through either open market share purchases or shares issued from treasury. During the three months ended January 31,
2018 and January 31, 2017, our DRIP’s requirements were satisfied through open market share purchases.(2) Amounts include cash received for stock options exercised during the period and the fair value adjustment to stock options.(3) During the three months ended January 31, 2018, we purchased for cancellation common shares at a total fair value of $923 million (average cost of $99.29 per share), with a book value of
$113 million (book value of $12.22 per share). During the three months ended January 31, 2017, we purchased for cancellation common shares at a total fair value of $102 million (average cost of$90.21 per share), with a book value of $13 million (book value of $12.09 per share). During the three months ended January 31, 2017, we also reduced our common shares outstanding by10.2 million shares to reflect the expected number of common shares we were obligated to repurchase.
Note 10 Earnings per share
For the three months ended
(Millions of Canadian dollars, except share and per share amounts)January 31
2018October 31
2017January 31
2017
Basic earnings per shareNet Income $ 3,012 $ 2,837 $ 3,027Preferred share dividends (72) (72) (75)Net income attributable to non-controlling interest (11) (8) (12)Net income available to common shareholders 2,929 2,757 2,940Weighted average number of common shares (in thousands) 1,451,781 1,457,855 1,484,262Basic earnings per share (in dollars) $ 2.02 $ 1.89 $ 1.98
Diluted earnings per shareNet income available to common shareholders $ 2,929 $ 2,757 $ 2,940Dilutive impact of exchangeable shares 4 4 4Net income available to common shareholders including dilutive impact of exchangeable shares 2,933 2,761 2,944Weighted average number of common shares (in thousands) 1,451,781 1,457,855 1,484,262Stock options (1) 3,069 2,936 3,778Issuable under other share-based compensation plans 751 749 739Exchangeable shares (2) 3,113 3,376 3,571Average number of diluted common shares (in thousands) 1,458,714 1,464,916 1,492,350Diluted earnings per share (in dollars) $ 2.01 $ 1.88 $ 1.97
(1) The dilutive effect of stock options was calculated using the treasury stock method. When the exercise price of options outstanding is greater than the average market price of our common shares,the options are excluded from the calculation of diluted earnings per share. For the three months ended January 31, 2018, no outstanding options were excluded from the calculation of dilutedearnings per share. For the three months ended October 31, 2017, no outstanding options were excluded from the calculation of diluted earnings per share. For the three months ended January 31,2017, an average of 191,171 outstanding options with an average exercise price of $90.23 were excluded from the calculation of diluted earnings per share.
(2) Includes exchangeable preferred shares.
Note 11 Legal and regulatory matters
We are a large global institution that is subject to many different complex legal and regulatory requirements that continue to evolve.As a result, we are and have been subject to a variety of legal proceedings, including civil claims and lawsuits, regulatoryexaminations, investigations, audits and requests for information by various governmental regulatory agencies and law enforcementauthorities in various jurisdictions. Some of these matters may involve novel legal theories and interpretations and may be advancedunder criminal as well as civil statutes, and some proceedings could result in the imposition of civil, regulatory enforcement orcriminal penalties. We review the status of all proceedings on an ongoing basis and will exercise judgment in resolving them in suchmanner as we believe to be in our best interest. This is an area of significant judgment and uncertainty and the extent of our financialand other exposure to these proceedings after taking into account current accruals could be material to our results of operations inany particular period.
Our significant legal proceedings and regulatory matters include the matters disclosed in our audited 2017 Annual ConsolidatedFinancial Statements as updated below:
Interchange fees litigationThe Supreme Court of Canada declined the B.C. class action plaintiffs’ request to appeal the decision striking the plaintiff classrepresentative’s cause of action under section 45 of the Competition Act. Additionally, at the plaintiffs’ request, the trial in the Watsonproceeding has been delayed to October 14, 2019.
78 Royal Bank of Canada First Quarter 2018
Note 12 Results by business segment
The following tables present operating result information for our business segments.
For the three months ended January 31, 2018
(Millions of Canadian dollars)
Personal &Commercial
BankingWealth
Management Insurance
Investor &TreasuryServices
CapitalMarkets (1)
CorporateSupport (1) Total
Net interest income (2) (3) $ 2,856 $ 612 $ – $ 128 $ 866 $ (17) $ 4,445Non-interest income (2) 1,309 2,171 1,144 548 1,309 (98) 6,383
(1) Taxable equivalent basis.(2) Inter-segment revenue and share of profits in joint ventures and associates are not material.(3) Interest revenue is reported net of interest expense as we rely primarily on net interest income as a performance measure.(4) Under IFRS 9, PCL on performing (Stages 1 and 2) financial assets are recorded within the respective business segment. Under IAS 39 and prior to November 1, 2017, PCL on loans not yet identified
as impaired was included in Corporate Support. For further information, refer to the How we measure and report our business segments section of Management’s Discussion and Analysis.(5) Effective Q4 2017, service fees and other costs incurred in association with certain commissions and fees earned are presented on a gross basis in non-interest expense. Comparative amounts have
been reclassified to conform with this presentation.(6) Amounts have been revised from those previously presented.
The following tables present total assets and total liabilities for our business segments.
Regulatory capital and capital ratiosOSFI formally establishes risk-based capital and leverage targets for deposit-taking institutions in Canada. During the first quarter of2018, we complied with all capital and leverage requirements imposed by OSFI.
As at
(Millions of Canadian dollars, except Capital ratios and leverage ratios)January 31
2018October 31
2017
Capital (1)
Common Equity Tier 1 capital $ 51,145 $ 51,572Tier 1 capital 57,925 58,361Total capital 66,984 67,556
Risk-weighted assets used in calculation of capital ratios (1) (2)
Common Equity Tier 1 capital ratio 466,758 474,478Tier 1 capital ratio 466,758 474,478Total capital ratio 466,758 474,478
Common Equity Tier 1 capital ratio 11.0% 10.9%Tier 1 capital ratio 12.4% 12.3%Total capital ratio 14.4% 14.2%Leverage ratio 4.2% 4.4%Leverage ratio exposure (billions) $ 1,363.9 $ 1,315.5
(1) Capital, RWA, and capital ratios are calculated using OSFI Capital Adequacy Requirements based on the Basel III framework (“all-in” basis). The leverage ratio is calculated using OSFI LeverageRequirements Guideline based on the Basel III framework.
(2) In fiscal 2018, the scalars were 80%, 83% and 86%, respectively. In 2017, the scalars were 72%, 77% and 81%, respectively.(3) Before any capital floor requirement as applicable, there are three different levels of RWAs for the calculation of the CET1, Tier 1, and Total capital ratios arising from the option we have chosen for
the phase-in of the CVA capital charge. Since the introduction of Basel II in 2008, OSFI has prescribed a capital floor requirement for institutions that use the advanced internal ratings-based (AIRB)approach for credit risk. The capital floor is determined by comparing a capital requirement under Basel I and Basel III, as specified by OSFI. If the capital requirement under the Basel III standards isless than 90% of the capital requirements as calculated under the Basel I standards, the difference is added to the RWAs.
80 Royal Bank of Canada First Quarter 2018
Shareholder Information
Corporate headquartersStreet address:Royal Bank of Canada200 Bay StreetToronto, Ontario M5J 2J5CanadaTel: 1-888-212-5533
Mailing address:P.O. Box 1Royal Bank PlazaToronto, Ontario M5J 2J5Canadawebsite: rbc.com
Transfer Agent and RegistrarMain Agent:Computershare Trust Company ofCanada1500 Robert-Bourassa Blvd.Suite 700Montreal, Quebec H3A 3S8CanadaTel: 1-866-586-7635 (Canada andthe U.S.) or 514-982-7555(International)Fax: 514-982-7580website: computershare.com/rbc
Valuation day priceFor Canadian income tax purposes,Royal Bank of Canada’s commonstock was quoted at $29.52 per shareon the Valuation Day (December 22,1971). This is equivalent to $7.38per share after adjusting for thetwo-for-one stock split of March 1981and the two-for-one stock split ofFebruary 1990. The one-for-one stockdividends in October 2000 andApril 2006 did not affect theValuation Day amount for ourcommon shares.
Shareholder contactsFor dividend information, changein share registration or address,lost stock certificates, tax forms,estate transfers or dividendreinvestment, please contact:Computershare Trust Companyof Canada100 University Avenue, 8th FloorToronto, Ontario M5J 2Y1Canada
Direct deposit serviceShareholders in Canada and theU.S. may have their RBC commonshare dividends deposited directlyto their bank account by electronicfunds transfer. To arrange for thisservice, please contact our TransferAgent and Registrar, ComputershareTrust Company of Canada.
Eligible dividend designationFor purposes of the Income Tax Act(Canada) and any correspondingprovincial and territorial taxlegislation, all dividends (anddeemed dividends) paid by RBC toCanadian residents on both itscommon and preferred shares, aredesignated as “eligible dividends”,unless stated otherwise.
2018 Quarterly earnings releasedatesFirst quarter February 23Second quarter May 24Third quarter August 23Fourth quarter November 28
2018 Annual MeetingThe Annual Meeting of CommonShareholders will be held on Friday,April 6, 2018, at 9:30 a.m. (EasternTime), at the Metro TorontoConvention Centre, 255 Front StreetWest, Toronto, Ontario, Canada
Common shares are listed on:Canada – Toronto StockExchange (TSX)U.S. – New York Stock Exchange(NYSE)Switzerland – Swiss Exchange(SIX)
All preferred shares are listed onthe TSX with the exception of theseries C-2. The related depositoryshares of the series C-2 preferredshares are listed on the NYSE.
Tel: 1-866-586-7635 (Canada andthe U.S.) or 514-982-7555(International)Fax: 1-888-453-0330 (Canada andthe U.S.) or 416-263-9394(International)email: [email protected]
For other shareholder inquiries,please contact:Shareholder RelationsRoyal Bank of Canada200 Bay StreetSouth TowerToronto, Ontario M5J 2J5CanadaTel: 416-955-7806
Financial analysts, portfoliomanagers, institutionalinvestorsFor financial information inquiries,please contact: Investor RelationsRoyal Bank of Canada155 Wellington Street WestToronto, Ontario M5V 3K7CanadaTel: 416-955-7802
or visit our website atrbc.com/investorrelations
Dividend dates for 2018Subject to approval by the Board of Directors
Recorddates
Paymentdates
Common and preferred shares series W, AA,AC, AD, AE, AF, AG, AJ, AK, AL, AZ, BB, BD, BF,BH, BI, BJ, BK and BM
January 25April 25July 26October 25
February 23May 24August 24November 23
Preferred shares series C-2(US$)
January 26April 27July 27October 26
February 7May 7August 7November 7
GovernanceSummaries of the significant ways in which corporate governance practicesfollowed by RBC differ from corporate governance practices required to befollowed by U.S. domestic companies under the NYSE listing standards areavailable on our website at rbc.com/governance.
Information contained in or otherwise accessible through the websites mentioned in this report to shareholders does not form a part of this report. All references to websites are inactive textual referencesand are for your information only.
Trademarks used in this report include the LION & GLOBE Symbol, ROYAL BANK OF CANADA, RBC and RBC INSURANCE which are trademarks of Royal Bank of Canada used by Royal Bank of Canada and/orby its subsidiaries under license. All other trademarks mentioned in this report, which are not the property of Royal Bank of Canada, are owned by their respective holders.