27
© Subsea 7 - 2019 1 subsea7.com First Quarter 2019 Earnings Presentation 2 May 2019

© Subsea 7 - 20191 subsea7.com
First Quarter 2019Earnings Presentation
2 May 2019
© Subsea 7 - 20192 subsea7.com
Forward-looking statements
Certain statements made in this presentation may include ‘forward-looking statements’. These statements maybe identified by the use of words like ‘anticipate’, ‘believe’, ‘could’, ‘estimate’, ‘expect’, ‘forecast’, ‘intend’, ‘may’,‘might’, ‘plan’, ‘predict’, ‘project’, ‘scheduled’, ‘seek’, ‘should’, ‘will’, and similar expressions. The forward-lookingstatements reflect our current views and are subject to risks, uncertainties and assumptions. The principal risksand uncertainties which could impact the Group and the factors which could affect the actual results aredescribed but not limited to those in the ‘Risk Management’ section in the Group’s Annual Report andConsolidated Financial Statements for the year ended 31 December 2018. These factors, and others which arediscussed in our public announcements, are among those that may cause actual and future results and trends todiffer materially from our forward-looking statements: actions by regulatory authorities or other third parties;our ability to recover costs on significant projects; the general economic conditions and competition in themarkets and businesses in which we operate; our relationship with significant clients; the outcome of legal andadministrative proceedings or governmental enquiries; uncertainties inherent in operating internationally; thetimely delivery of vessels on order; the impact of laws and regulations; and operating hazards, including spillsand environmental damage. Many of these factors are beyond our ability to control or predict. Other unknownor unpredictable factors could also have material adverse effects on our future results. Given these factors, youshould not place undue reliance on the forward-looking statements.

© Subsea 7 - 20193 subsea7.com
First Quarter 2019
Jean Cahuzac, CEO
- Highlights
Ricardo Rosa, CFO
- Financial performance
Jean Cahuzac, CEO
- Strategy and outlook
- Q&A
© Subsea 7 - 20194 subsea7.com
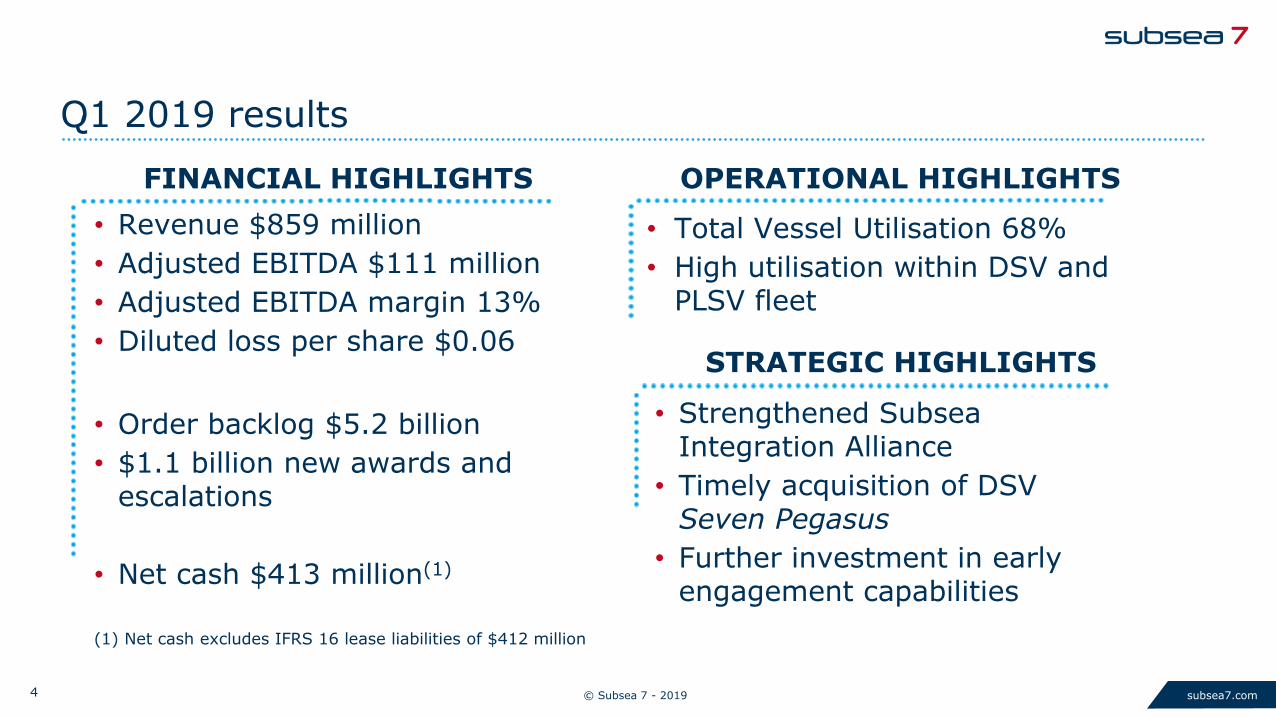
Q1 2019 results
OPERATIONAL HIGHLIGHTS
• Total Vessel Utilisation 68%
• High utilisation within DSV and PLSV fleet
STRATEGIC HIGHLIGHTS
• Strengthened Subsea Integration Alliance
• Timely acquisition of DSV Seven Pegasus
• Further investment in early engagement capabilities
FINANCIAL HIGHLIGHTS
• Revenue $859 million
• Adjusted EBITDA $111 million
• Adjusted EBITDA margin 13%
• Diluted loss per share $0.06
• Order backlog $5.2 billion
• $1.1 billion new awards and escalations
• Net cash $413 million(1)
(1) Net cash excludes IFRS 16 lease liabilities of $412 million

© Subsea 7 - 20195 subsea7.com
Some of our activities
Snorre (Norway) PUPP (Nigeria) Ærfugl (Norway) West Nile Delta (Egypt)
Hasbah (Saudi Arabia) Dolphin Energy ERPS
(Abu Dhabi)PLSVs (Brazil)Hornsea One (UK)

© Subsea 7 - 20196 subsea7.com
Our backlog and order intake
Order backlog includes: - $0.9 billion relating to long-term contracts for PLSVs in Brazil - approximately $50 million favourable foreign exchange movement in the first quarter
SURF and Conventional(2)
$4.4bn
Backlog of $5.2 billion, as at 31 March 2019
2019 $2.5bn
2020$1.9bn
2021+ $0.8bn
Backlog by Execution Date Backlog by Service Capability
Life of Field$0.6bn
SURF and Conventional
$4.2bn
Renewables & Heavy Lifting $0.4bn
First quarter highlights
• $1.1 billion new awards an escalations
• Book-to-bill of 1.3x
• Three announced awards:
– 5 year IRM North Sea (UK)
– Arran (UK)
– Berri-Zuluf (Middle East)
• Early engagement driving potential future awards
– Three FEED awards with Woodside
– HKZ wind farm partnership (Q2)

© Subsea 7 - 20197 subsea7.com
A leader in integrated projects
SNE Phase 1• Integrated award• Offshore Senegal• Flexible riser solution• 23 Horizontal Trees• 58 km CRA BuBi reeled
flowline• Oil field development
Scarborough• Integrated award• Offshore Australia• 14” Lazy wave risers• 13 Trees• 45 km 16” reeled
flowlines• Gas field development
Julimar• Offshore Australia• 22km Tie-back• 18” Insulated CRA
flowline• 4 Trees• Gas field development• Standalone SURF
Woodside FEED awards with commitment to proceed to EPIC pending FID
© Subsea 7 - 20198 subsea7.com
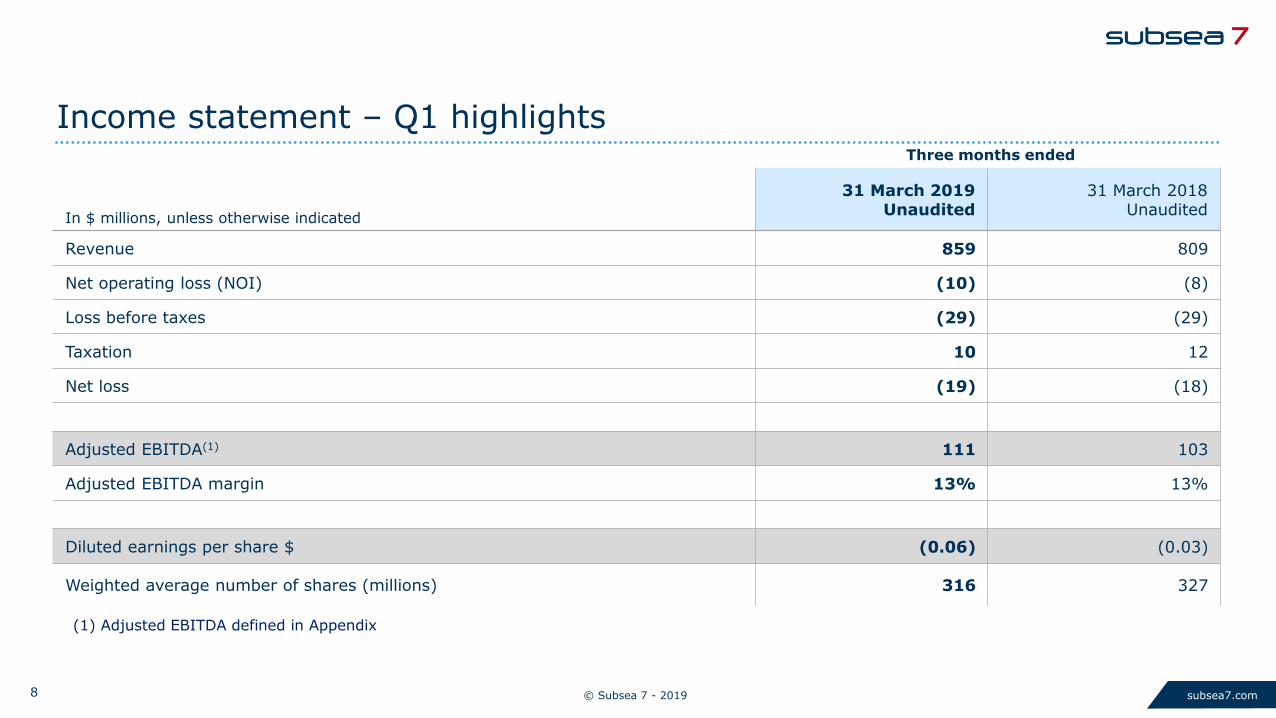
Three months ended
In $ millions, unless otherwise indicated
31 March 2019Unaudited
31 March 2018Unaudited
Revenue 859 809
Net operating loss (NOI) (10) (8)
Loss before taxes (29) (29)
Taxation 10 12
Net loss (19) (18)
Adjusted EBITDA(1) 111 103
Adjusted EBITDA margin 13% 13%
Diluted earnings per share $ (0.06) (0.03)
Weighted average number of shares (millions) 316 327
Income statement – Q1 highlights
(1) Adjusted EBITDA defined in Appendix

© Subsea 7 - 20199 subsea7.com
In $ millions
Three months ended
31 March 2019Unaudited (1)
31 March 2018Unaudited
Administrative expenses (58) (74)
Share of net loss of associates and joint ventures - (7)
Depreciation and amortisation (121) (111)
Net operating loss (10) (8)
Net finance (cost)/income (2) 1
Other gains and losses (17) (23)
Loss before taxes (29) (29)
Taxation 10 12
Net loss (19) (18)
Net loss attributable to:
Shareholders of the parent company (19) (11)
Non-controlling interests - (7)
Income statement – supplementary details
(1) The impact of IFRS 16 on the Consolidated Income Statement, for the three month period ending 31 March 2019, was to reduce operating lease expense by $26.8 million, recognise lease amortisation charges of $23.9 million and lease finance costs of $3.9 million.

© Subsea 7 - 201910 subsea7.com
$747m
$584m
$60m
$52m
$53m
$173m
Q1 2018Q1 2019
$859m
Revenue
$809m
$4m
$13m
$(3)m$(4)m
$(9)m
$(4)m
$(10)m
$(8)m
Net Operating Income
First Quarter Business Unit performance
Q1 2019 Q1 2018
SURF & Conventional
Life of Field
Renewables & Heavy Lifting
Note: Corporate segment (not presented): net operating loss Q1 2019 $2m (net operating loss Q1 2018: $13m)
© Subsea 7 - 201911 subsea7.com
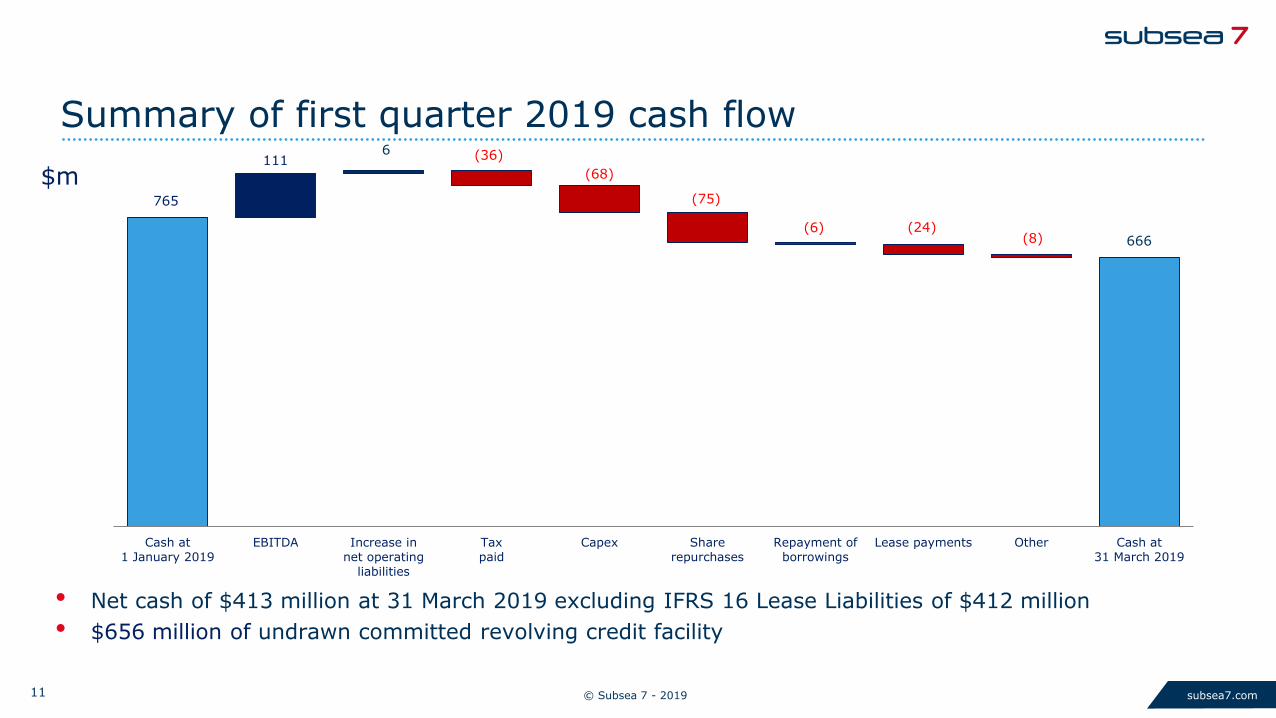
765
1116 (36)
(68)
(75)
(6) (24)(8) 666
Cash at
1 January 2019
EBITDA Increase in
net operating
liabilities
Tax
paid
Capex Share
repurchases
Repayment of
borrowings
Lease payments Other Cash at
31 March 2019
Summary of first quarter 2019 cash flow
• Net cash of $413 million at 31 March 2019 excluding IFRS 16 Lease Liabilities of $412 million
• $656 million of undrawn committed revolving credit facility
$m

© Subsea 7 - 201912 subsea7.com
Financial guidance
Full year 2019 Guidance (including IFRS 16 adjustments)
Revenue Broadly in line with 2018
Adjusted EBITDA (1) Lower than 2018, double digit percentage margin
Net Operating Income Positive for the Group
Administrative expense $260 million - $280 million
Net finance cost $10 million - $20 million
Depreciation and Amortisation $480 million - $500 million
Full year effective tax rate 33% - 35%
Capital expenditure (2) $270 million - $290 million
(1) Adjusted EBITDA is expected to be favourably impacted by between $100 million –$110 million due to the implementation of IFRS 16 ‘Leases’(2) Includes approximately $100 million expenditure related to the new-build reel-lay vessel, Seven Vega
© Subsea 7 - 201913 subsea7.com
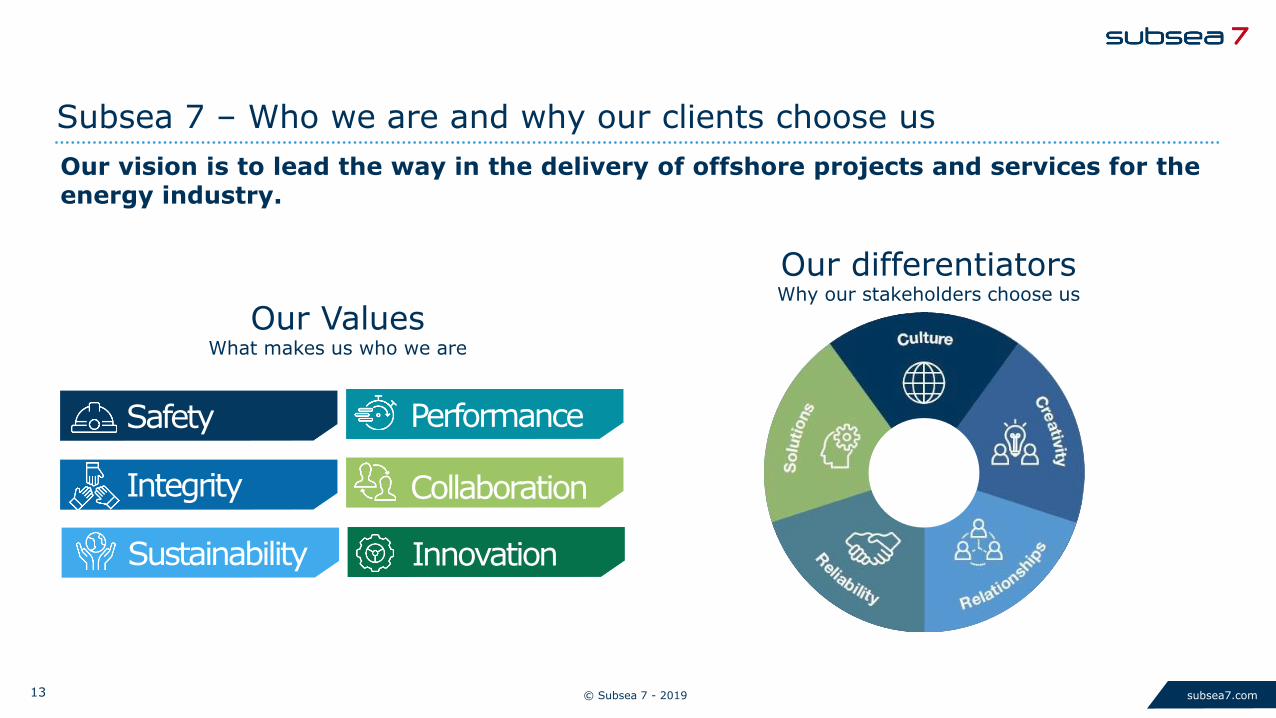
Subsea 7 – Who we are and why our clients choose us
Our vision is to lead the way in the delivery of offshore projects and services for theenergy industry.
ValuesSafety
Integrity
Sustainability
Performance
Collaboration
Innovation
Our differentiatorsWhy our stakeholders choose us
Our ValuesWhat makes us who we are
Safety
Integrity
Sustainability
Performance
Collaboration
Innovation
© Subsea 7 - 201914 subsea7.com
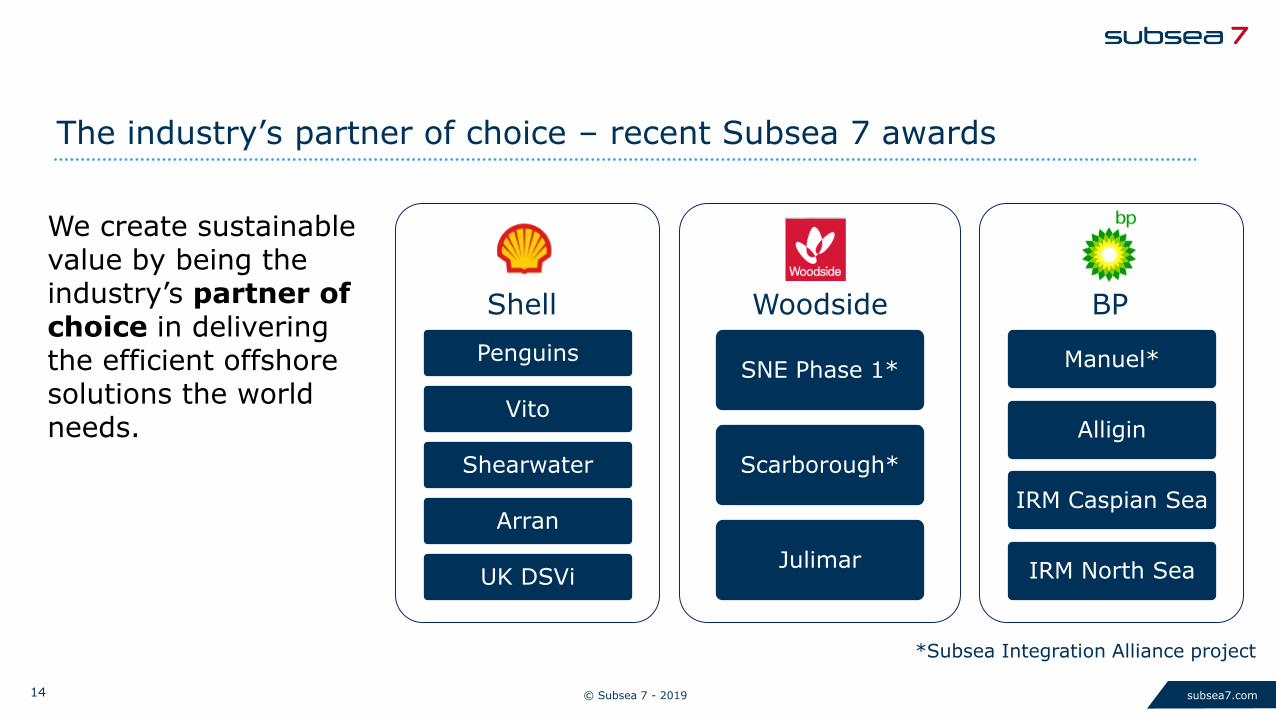
The industry’s partner of choice – recent Subsea 7 awards
Penguins
Vito
Shearwater
Arran
UK DSVi
SNE Phase 1*
Scarborough*
Julimar
Manuel*
Alligin
IRM Caspian Sea
IRM North Sea
WoodsideShell BP
We create sustainable value by being the industry’s partner of choice in delivering the efficient offshore solutions the world needs.
*Subsea Integration Alliance project
© Subsea 7 - 201915 subsea7.com
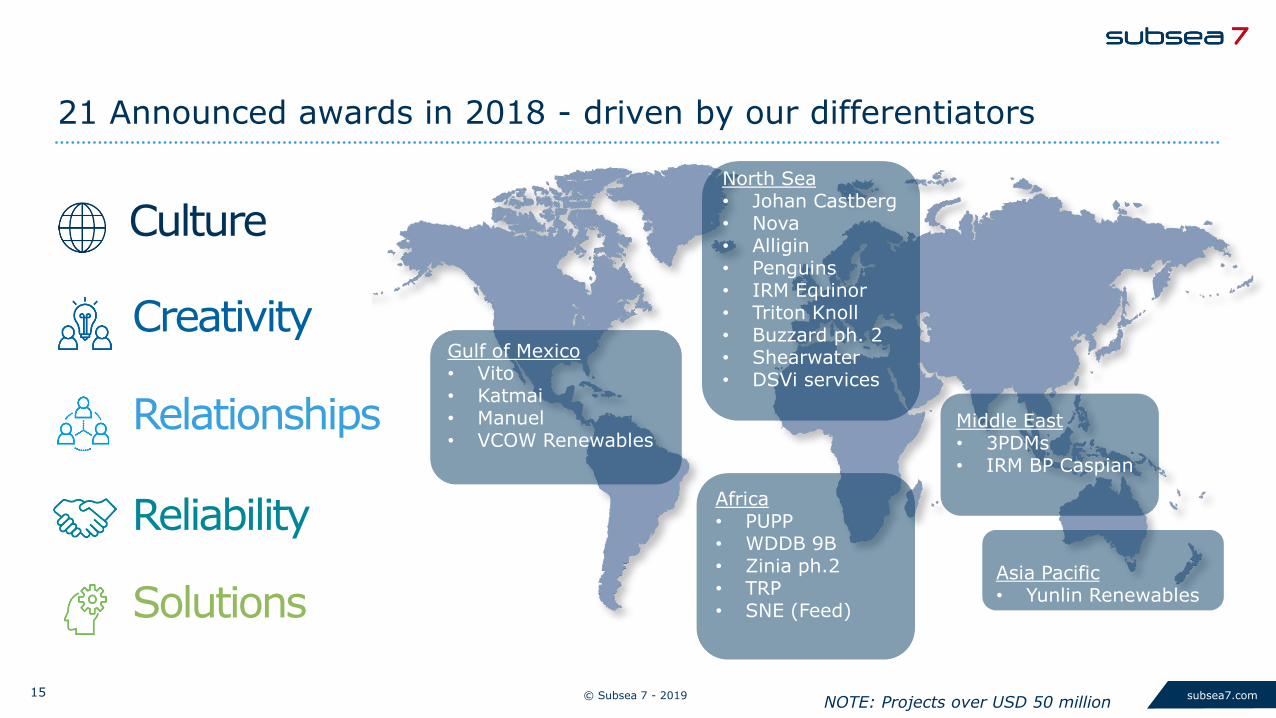
21 Announced awards in 2018 - driven by our differentiators
North Sea• Johan Castberg• Nova• Alligin• Penguins• IRM Equinor• Triton Knoll• Buzzard ph. 2• Shearwater• DSVi services
Asia Pacific• Yunlin Renewables
Africa• PUPP• WDDB 9B• Zinia ph.2• TRP• SNE (Feed)
Gulf of Mexico• Vito• Katmai• Manuel• VCOW Renewables
NOTE: Projects over USD 50 million
Middle East• 3PDMs• IRM BP Caspian
Culture
Creativity
Relationships
Reliability
Solutions

© Subsea 7 - 201916 subsea7.com
The outlook for offshore oil and gas projects is improving
Source: Rystad Energy research and analysis; SubseaCube
-
50
100
150
200
250
300
350
400
450
Number of subsea trees to be installed per year
-
500
1,000
1,500
2,000
2,500
3,000
3,500
4,000
4,500
Length of subsea pipelines to be installed per year, by pipeline type
Tie-back flowlines Infield flowlines Risers

© Subsea 7 - 201917 subsea7.com
Business Unit Outlook
SURF and Conventional─ Tendering and award activity is
increasing─ Further large greenfield market awards
expected second half of the year
Renewables and Heavy Lifting─ Opportunities for T&I work in Taiwan─ EPCI and T&I opportunities in Europe─ Low level of work in backlog for Subsea 7
in 2019
Life of Field─ Increasing demand for IRM services
© Subsea 7 - 201918 subsea7.com

© Subsea 7 - 201919 subsea7.com
Appendix
Major project progression
Track Record
Fleet
Financial summaries

© Subsea 7 - 201920 subsea7.com
Major project progression
• Continuing projects >$100m between 5% and 95% complete as at 31 March 2019 excluding PLSV and Life of Field day-rate contracts
0% 10% 20% 30% 40% 50% 60% 70% 80% 90% 100%
Sonamet (Angola)
WND GFR (Egypt)
Hasbah (Saudi Arabia)
Sole (Australia)
Production Uplift Pipelines (Nigeria)
Snorre Expansion (Norway)
3PDMs (Saudi Arabia)
Aerfugl (Norway)
Nova (Norway)
WDDM 9B (Egypt)
Katmai (USA)
Buzzard Phase 2 (UK)
Mad Dog Phase 2 (USA)
Manuel (USA)
Zinia (Angola)
Penguins Redevelopment (UK)
Sizeable ($50-$150m)
Substantial($150-$300m)
Large($300-$500m)
Very Large($500-$750m)
Major(Over $750m)
Announced size of project

© Subsea 7 - 201921 subsea7.com
• Arran, Shell
• Shearwater, Shell
• Buzzard 2, Nexen
• Culzean, Maersk
• Alligin, BP
• Penguins, Shell
• SCIRM, BP
• DSVi, Various
• Katmai, Fieldwood
• Vito, Shell
• Mad Dog 2, BP
• TVEX, Chevron
• Manuel, BP
• PLSVs, Petrobras
• Zinia 2, Total
• WDDM 9b, Burullus
• West Nile Delta, BP
• PUPP, Mobil Producing Nigeria
• OCTP, ENI
• SNE 1, Woodside
• Jubilee, Tullow
• EPRS, INPEX/Chevron
• G1/G15, Oil & Natural Gas Corp.
• Gorgon 1, Chevron
• Scarborough, Woodside
• Julimar, Woodside
• Sole, Cooper
• West Barracouta, Shell
• Aasta Hansteen, Equinor
• Maria, Wintershall
• Nova, Wintershall
• IRM Services, Equinor
• Johan Castberg, Equinor
• Snorre, Equinor
• Skogul, Aker BP
• Aerfugl, Aker BP
• Beatrice wind farm, BOWL
• Borkum II, Trianel
• Triton Knoll, Innogy
• Hornsea 1, Orstead
• Hasbah, Saudi Aramco
• 17 Cranes, Saudi Aramco
• 3 GDPMs, Saudi Aramco
• Berri & Zuluf, Saudi Aramco
• Yunlin Offshore Windfarm, WPD
• Oil and Gas projects
• Renewables projects
Key
• Coastal Virginia Offshore Wind, Orsted

© Subsea 7 - 201922 subsea7.com
34 Vessels including 31 active vessels at end Q1 ‘19
Under Construction Reel-lay Vessel to be named Seven Vega
Long-term charter from a vessel-owning joint venture
Stacked
Chartered from a third party

© Subsea 7 - 201923 subsea7.com
In $ millions (unaudited) SURF & Conventional Life of FieldRenewables & Heavy Lifting
Corporate TOTAL
Revenue 584 52 173 - 809
Net operating income/(loss) 13 (4) (4) (13) (8)
Finance income 5
Other gains and losses (23)
Finance costs (4)
Loss before taxes (29)
In $ millions (unaudited) SURF & Conventional Life of FieldRenewables & Heavy Lifting
Corporate TOTAL
Revenue 747 60 53 - 859
Net operating income/(loss) 4 (3) (9) (2) (10)
Finance income 4
Other gains and losses (17)
Finance costs (6)
Loss before taxes (29)
Segmental analysis
For the three months ended 31 March 2018
For the three months ended 31 March 2019

© Subsea 7 - 201924 subsea7.com
In $ millions
31 Mar 2019Unaudited
31 Dec 2018Audited
Assets
Non-current assets
Goodwill 793 751
Property, plant and equipment 4,599 4,569
Right-of-use asset 406 -
Other non-current assets 128 153
Total non-current assets 5,926 5,473
Current assets
Trade and other receivables 676 608
Construction contracts - assets 483 495
Other accrued income and prepaidexpenses
169 166
Cash and cash equivalents 666 765
Other current assets 45 62
Total current assets 2,039 2,096
Total assets 7,965 7,569
Summary balance sheet
In $ millions
31 Mar 2019Unaudited
31 Dec 2018Audited
Equity & Liabilities
Total equity 5,682 5,722
Non-current liabilities
Non-current portion of borrowings 228 234
Non-current lease liabilities 313 -
Other non-current liabilities 196 212
Total non-current liabilities 737 446
Current liabilities
Trade and other liabilities 1,030 978
Current portion of borrowings 25 25
Current lease liabilities 99 -
Construction contracts – liabilities 173 168
Deferred revenue 7 5
Other current liabilities 213 225
Total current liabilities 1,547 1,401
Total liabilities 2,283 1,847
Total equity & liabilities 7,965 7,569
© Subsea 7 - 201925 subsea7.com
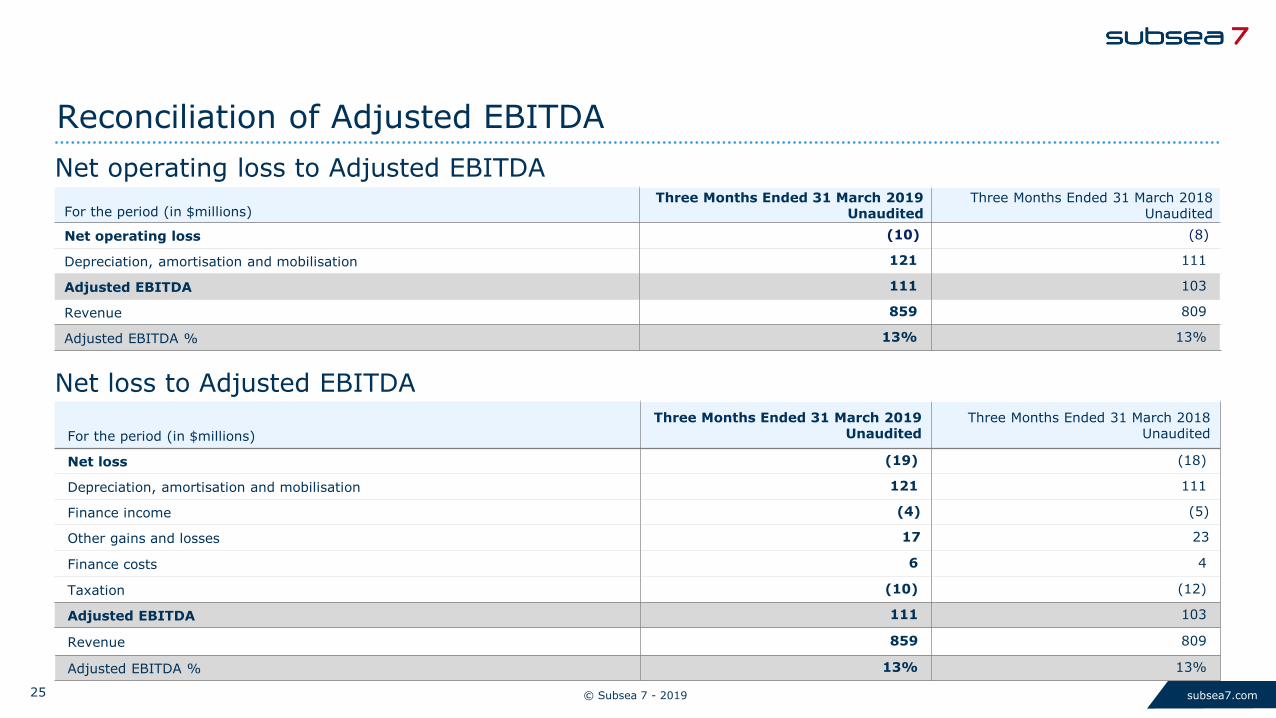
Reconciliation of Adjusted EBITDA
For the period (in $millions)
Three Months Ended 31 March 2019Unaudited
Three Months Ended 31 March 2018Unaudited
Net loss (19) (18)
Depreciation, amortisation and mobilisation 121 111
Finance income (4) (5)
Other gains and losses 17 23
Finance costs 6 4
Taxation (10) (12)
Adjusted EBITDA 111 103
Revenue 859 809
Adjusted EBITDA % 13% 13%
Net loss to Adjusted EBITDA
Net operating loss to Adjusted EBITDA
For the period (in $millions)Three Months Ended 31 March 2019
UnauditedThree Months Ended 31 March 2018
Unaudited
Net operating loss (10) (8)
Depreciation, amortisation and mobilisation 121 111
Adjusted EBITDA 111 103
Revenue 859 809
Adjusted EBITDA % 13% 13%
© Subsea 7 - 201926 subsea7.com
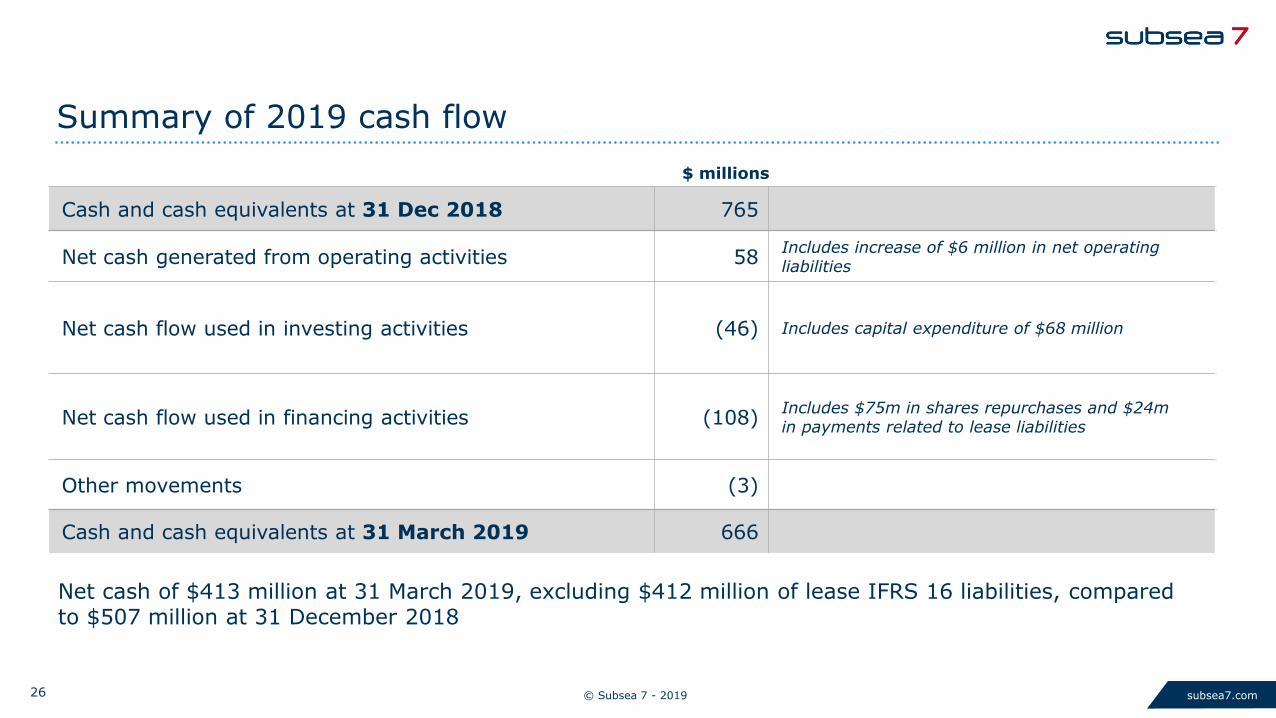
$ millions
Cash and cash equivalents at 31 Dec 2018 765
Net cash generated from operating activities 58Includes increase of $6 million in net operating liabilities
Net cash flow used in investing activities (46) Includes capital expenditure of $68 million
Net cash flow used in financing activities (108)Includes $75m in shares repurchases and $24m in payments related to lease liabilities
Other movements (3)
Cash and cash equivalents at 31 March 2019 666
Summary of 2019 cash flow
Net cash of $413 million at 31 March 2019, excluding $412 million of lease IFRS 16 liabilities, compared to $507 million at 31 December 2018

© Subsea 7 - 201927 subsea7.com


