20
FIRST QUARTER 2020 May 6, 2020
FIRST QUARTER 2020
May 6, 2020
Forward-Looking Statements and Other Matters
2
This presentation (and oral statements made regarding the subjects of this presentation) contains forward-looking statements within the meaning of Section 27A of the Securities Act of 1933 and Section 21E of the Securities Exchange Act of 1934. These are statements, other than statements of historical fact, that give current expectations or forecasts of future events, including, without limitation: the Company's future capital budgets and allocations (including development capital budget and resource play leasing and exploration spend), future performance, free cash flow, corporate-level cash returns on invested capital, business strategy, asset quality, drilling plans, production, guidance, cash margins, asset sales and acquisitions, oil growth, cost and expense estimates, cash flows, uses of excess cash, return of cash to shareholders, returns, leasing and exploration activities, future financial position, tax rates and other plans and objectives for future operations. Words such as “anticipate”, “believe”, “could”, “estimate”, “expect”, “forecast”, “future”, “guidance”, “intend”, “may”, “outlook”, “plan”, “potential”, “project”, “seek”, “should”, “target”, “will”, “would”, or similar words may be used to identify forward-looking statements; however, the absence of these words does not mean that the statements are not forward-looking.
While the Company believes its assumptions concerning future events are reasonable, a number of factors could cause actual results to differ materially from those projected, including, but not limited to: conditions in the oil and gas industry, including supply/demand levels for crude oil and condensate, NGLs and natural gas and the resulting impact on price; changes in expected reserve or production levels; changes in political or economic conditions in the U.S. and Equatorial Guinea, including changes in foreign currency exchange rates, interest rates, inflation rates; actions taken by the members of the Organization of the Petroleum Exporting Countries (OPEC) and Russia affecting the production and pricing of crude oil; and other global and domestic political, economic or diplomatic developments; capital available for exploration and development; our ability to complete our announced acquisitions on the timeline currently anticipated, if at all; risks related to the Company’s hedging activities; voluntary or involuntary curtailments, delays or cancellations of certain drilling activities; well production timing; liability resulting from litigation; drilling and operating risks; lack of, or disruption in, access to storage capacity, pipelines or other transportation methods; availability of drilling rigs, materials and labor, including the costs associated therewith; difficulty in obtaining necessary approvals and permits; non-performance by third parties of contractual obligations; unforeseen hazards such as weather conditions, a health pandemic (including COVID-19), acts of war or terrorist acts and the government or military response thereto; cyber-attacks; changes in safety, health, environmental, tax and other regulations, requirements or initiatives, including initiatives addressing the impact of global climate change, air emissions, or water management; other geological, operating and economic considerations; and the risk factors, forward-looking statements and challenges and uncertainties described in the Company’s 2019 Annual Report on Form 10-K, Quarterly Reports on Form 10-Q and other public filings and press releases, available at www.Marathonoil.com. Except as required by law, the Company undertakes no obligation to revise or update any forward-looking statements as a result of new information, future events or otherwise.
This presentation includes non-GAAP financial measures, including operating cash flow before working capital. Reconciliations of the differences between non-GAAP financial measures used in this presentation and their most directly comparable GAAP financial measures are available at www.Marathonoil.com in the 1Q20 Investor Packet.
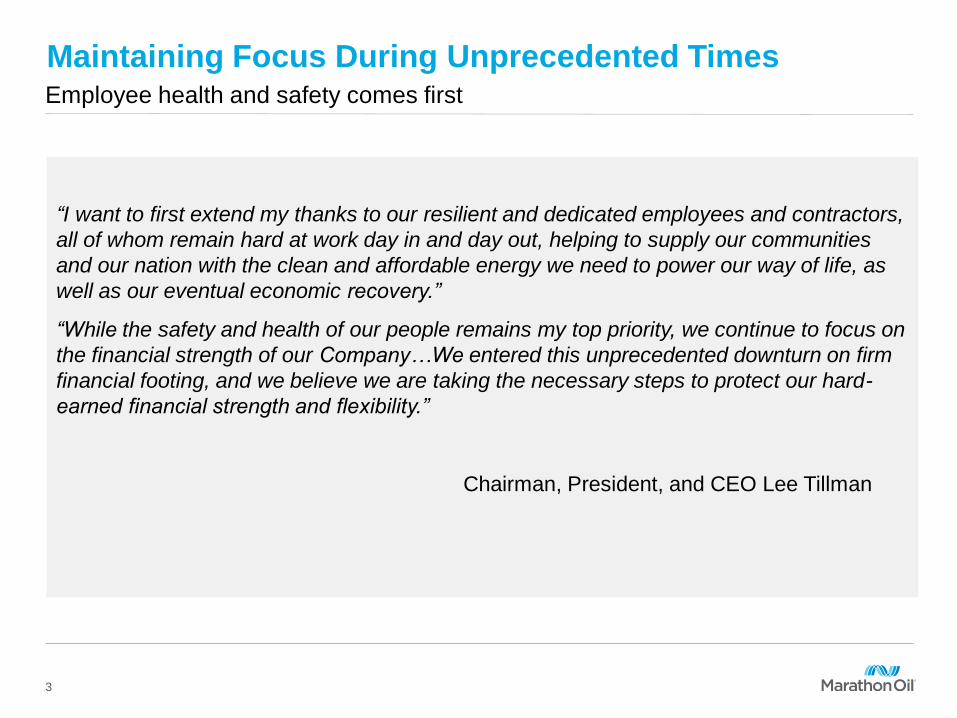
Maintaining Focus During Unprecedented TimesEmployee health and safety comes first
“I want to first extend my thanks to our resilient and dedicated employees and contractors,
all of whom remain hard at work day in and day out, helping to supply our communities
and our nation with the clean and affordable energy we need to power our way of life, as
well as our eventual economic recovery.”
“While the safety and health of our people remains my top priority, we continue to focus on
the financial strength of our Company…We entered this unprecedented downturn on firm
financial footing, and we believe we are taking the necessary steps to protect our hard-
earned financial strength and flexibility.”
Chairman, President, and CEO Lee Tillman
3
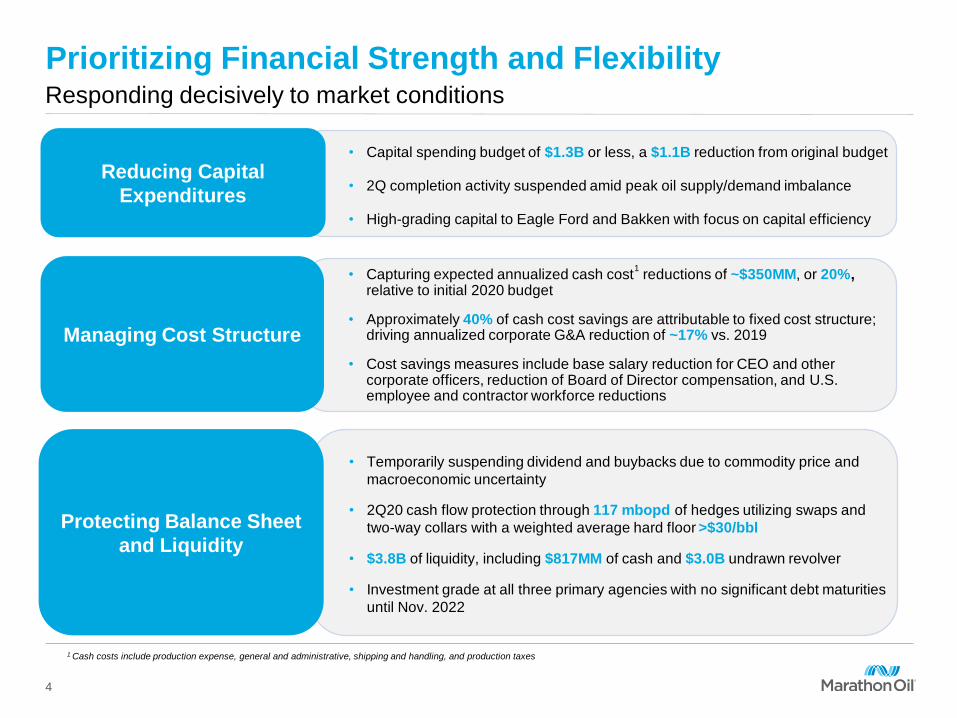
Prioritizing Financial Strength and Flexibility
Reducing Capital
Expenditures
• Capital spending budget of $1.3B or less, a $1.1B reduction from original budget
• 2Q completion activity suspended amid peak oil supply/demand imbalance
• High-grading capital to Eagle Ford and Bakken with focus on capital efficiency
Managing Cost Structure
• Capturing expected annualized cash cost1
reductions of ~$350MM, or 20%, relative to initial 2020 budget
• Approximately 40% of cash cost savings are attributable to fixed cost structure; driving annualized corporate G&A reduction of ~17% vs. 2019
• Cost savings measures include base salary reduction for CEO and other corporate officers, reduction of Board of Director compensation, and U.S. employee and contractor workforce reductions
Protecting Balance Sheet
and Liquidity
• Temporarily suspending dividend and buybacks due to commodity price and
macroeconomic uncertainty
• 2Q20 cash flow protection through 117 mbopd of hedges utilizing swaps and
two-way collars with a weighted average hard floor >$30/bbl
• $3.8B of liquidity, including $817MM of cash and $3.0B undrawn revolver
• Investment grade at all three primary agencies with no significant debt maturities
until Nov. 2022
Responding decisively to market conditions
4
1 Cash costs include production expense, general and administrative, shipping and handling, and production taxes
0
100
1Q20 2Q20e 2H20e
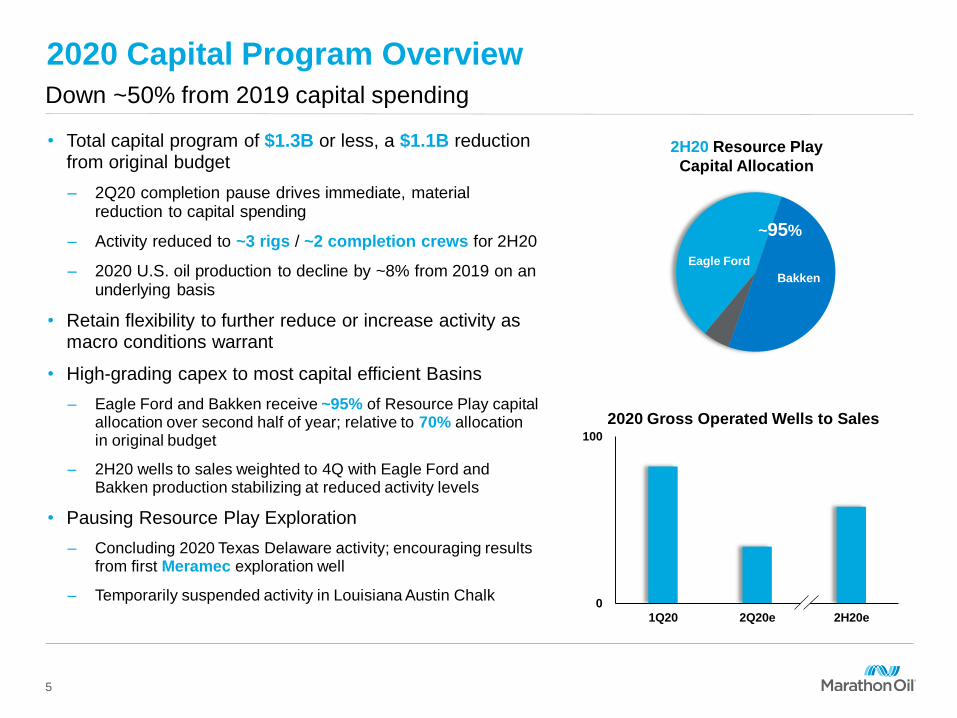
Down ~50% from 2019 capital spending
• Total capital program of $1.3B or less, a $1.1B reduction from original budget
– 2Q20 completion pause drives immediate, material reduction to capital spending
– Activity reduced to ~3 rigs / ~2 completion crews for 2H20
– 2020 U.S. oil production to decline by ~8% from 2019 on an underlying basis
• Retain flexibility to further reduce or increase activity as macro conditions warrant
• High-grading capex to most capital efficient Basins
– Eagle Ford and Bakken receive ~95% of Resource Play capital allocation over second half of year; relative to 70% allocation in original budget
– 2H20 wells to sales weighted to 4Q with Eagle Ford and Bakken production stabilizing at reduced activity levels
• Pausing Resource Play Exploration
– Concluding 2020 Texas Delaware activity; encouraging results from first Meramec exploration well
– Temporarily suspended activity in Louisiana Austin Chalk
2020 Capital Program Overview
5
2H20 Resource Play
Capital Allocation
Eagle Ford
Bakken
~95%
2020 Gross Operated Wells to Sales
0
500
2018 2019 2H20run-rate
0
2,500
2018 2019 2H20run-rate
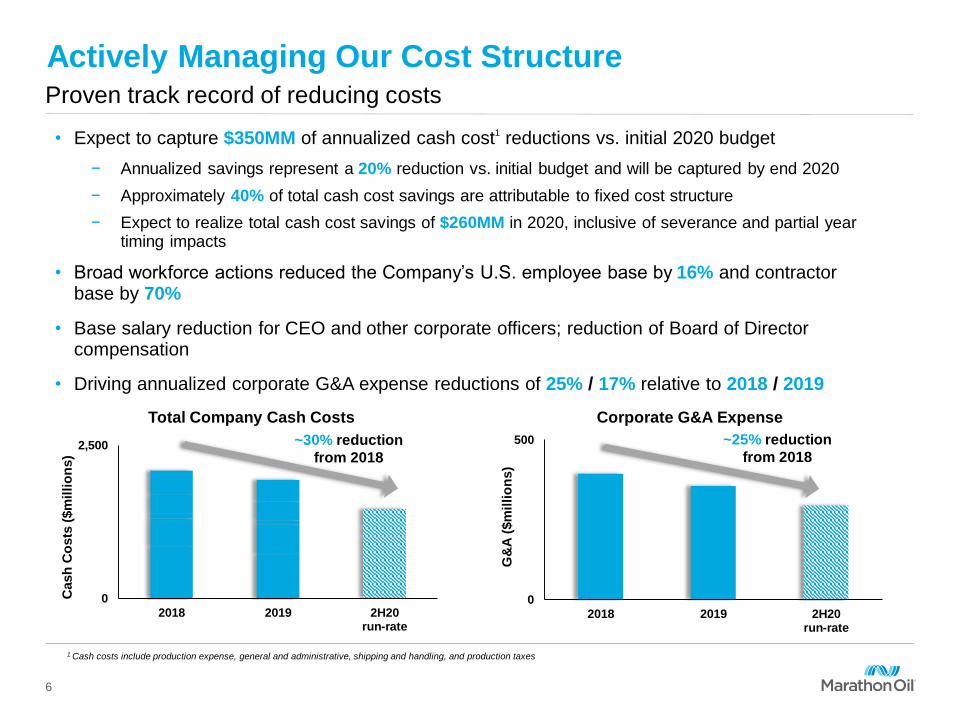
Actively Managing Our Cost StructureProven track record of reducing costs
6
~30% reduction
from 2018
• Expect to capture $350MM of annualized cash cost1 reductions vs. initial 2020 budget
− Annualized savings represent a 20% reduction vs. initial budget and will be captured by end 2020
− Approximately 40% of total cash cost savings are attributable to fixed cost structure
− Expect to realize total cash cost savings of $260MM in 2020, inclusive of severance and partial year timing impacts
• Broad workforce actions reduced the Company’s U.S. employee base by 16% and contractor base by 70%
• Base salary reduction for CEO and other corporate officers; reduction of Board of Director compensation
• Driving annualized corporate G&A expense reductions of 25% / 17% relative to 2018 / 2019
~25% reduction
from 2018
Cash
Co
sts
($m
illi
on
s)
Total Company Cash Costs Corporate G&A Expense
G&
A (
$m
illi
on
s)
1 Cash costs include production expense, general and administrative, shipping and handling, and production taxes
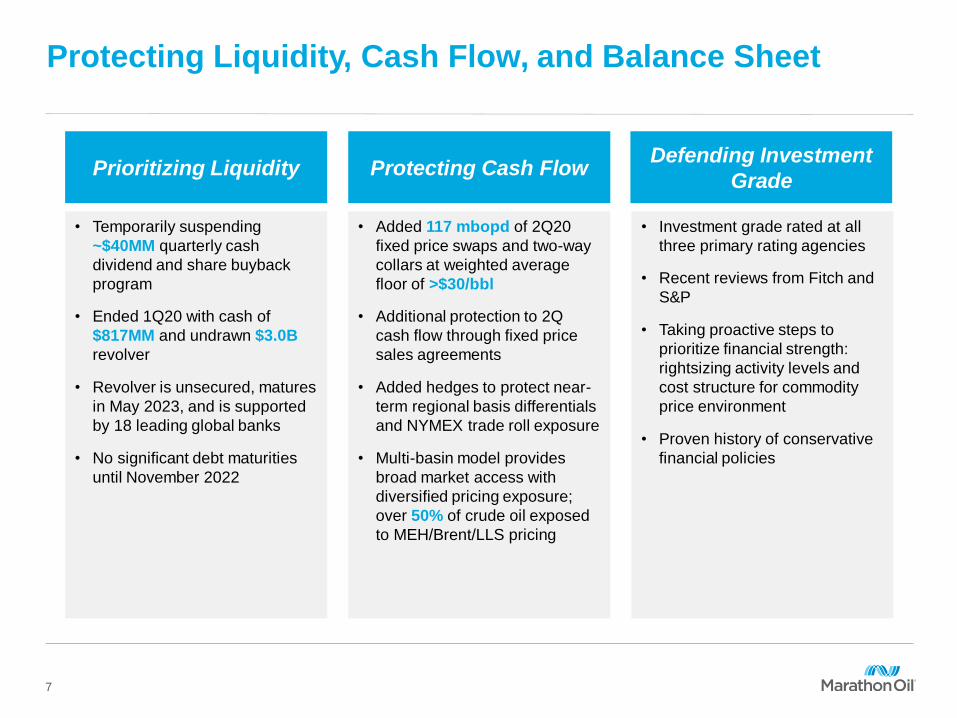
Protecting Liquidity, Cash Flow, and Balance Sheet
7
Protecting Cash FlowPrioritizing LiquidityDefending Investment
Grade
• Added 117 mbopd of 2Q20
fixed price swaps and two-way
collars at weighted average
floor of >$30/bbl
• Additional protection to 2Q
cash flow through fixed price
sales agreements
• Added hedges to protect near-
term regional basis differentials
and NYMEX trade roll exposure
• Multi-basin model provides
broad market access with
diversified pricing exposure;
over 50% of crude oil exposed
to MEH/Brent/LLS pricing
• Temporarily suspending
~$40MM quarterly cash
dividend and share buyback
program
• Ended 1Q20 with cash of
$817MM and undrawn $3.0B
revolver
• Revolver is unsecured, matures
in May 2023, and is supported
by 18 leading global banks
• No significant debt maturities
until November 2022
• Investment grade rated at all
three primary rating agencies
• Recent reviews from Fitch and
S&P
• Taking proactive steps to
prioritize financial strength:
rightsizing activity levels and
cost structure for commodity
price environment
• Proven history of conservative
financial policies
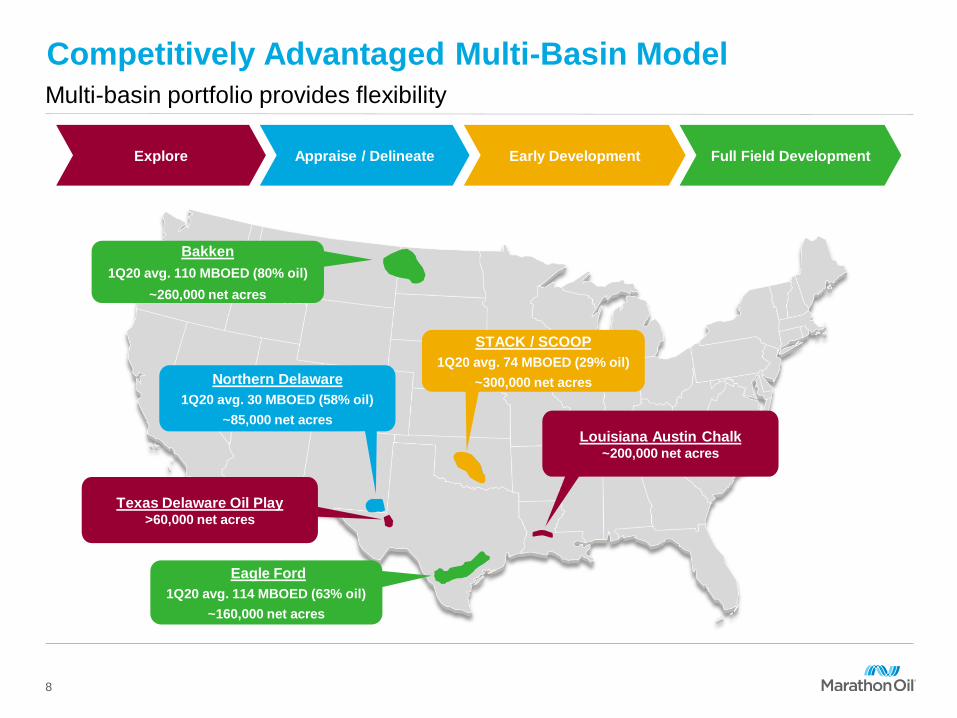
Competitively Advantaged Multi-Basin Model
Multi-basin portfolio provides flexibility
Eagle Ford
1Q20 avg. 114 MBOED (63% oil)
~160,000 net acres
Bakken
1Q20 avg. 110 MBOED (80% oil)
~260,000 net acres
STACK / SCOOP
1Q20 avg. 74 MBOED (29% oil)
~300,000 net acres
8
Appraise / Delineate Early Development Full Field DevelopmentExplore
Northern Delaware
1Q20 avg. 30 MBOED (58% oil)
~85,000 net acres
Texas Delaware Oil Play>60,000 net acres
Louisiana Austin Chalk~200,000 net acres
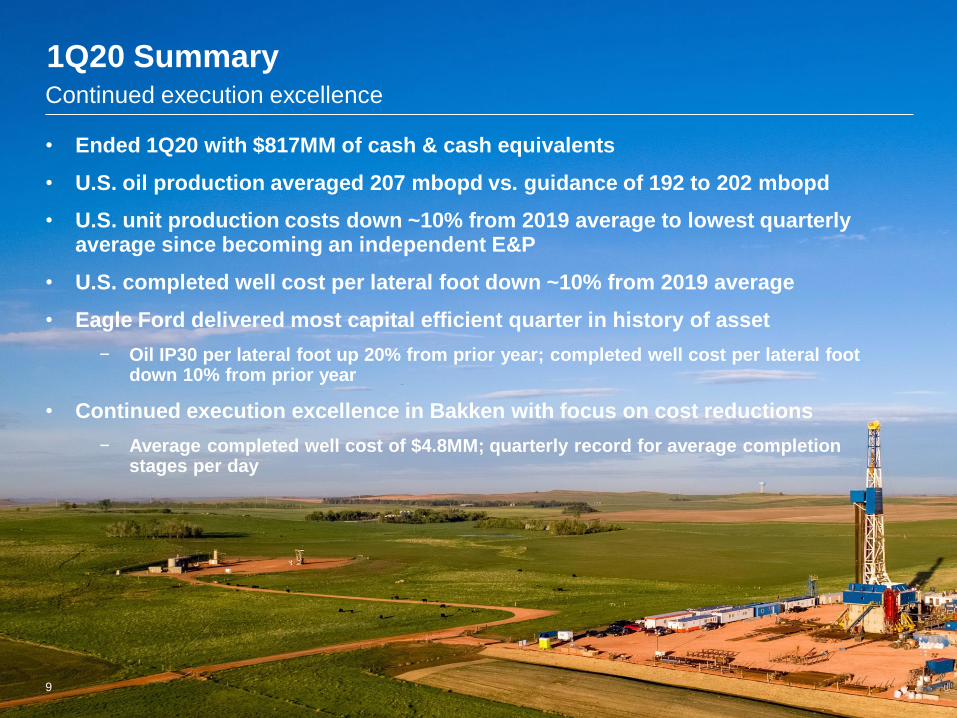
1Q20 Summary
9
• Ended 1Q20 with $817MM of cash & cash equivalents
• U.S. oil production averaged 207 mbopd vs. guidance of 192 to 202 mbopd
• U.S. unit production costs down ~10% from 2019 average to lowest quarterly average since becoming an independent E&P
• U.S. completed well cost per lateral foot down ~10% from 2019 average
• Eagle Ford delivered most capital efficient quarter in history of asset
− Oil IP30 per lateral foot up 20% from prior year; completed well cost per lateral foot down 10% from prior year
• Continued execution excellence in Bakken with focus on cost reductions
− Average completed well cost of $4.8MM; quarterly record for average completion stages per day
Continued execution excellence
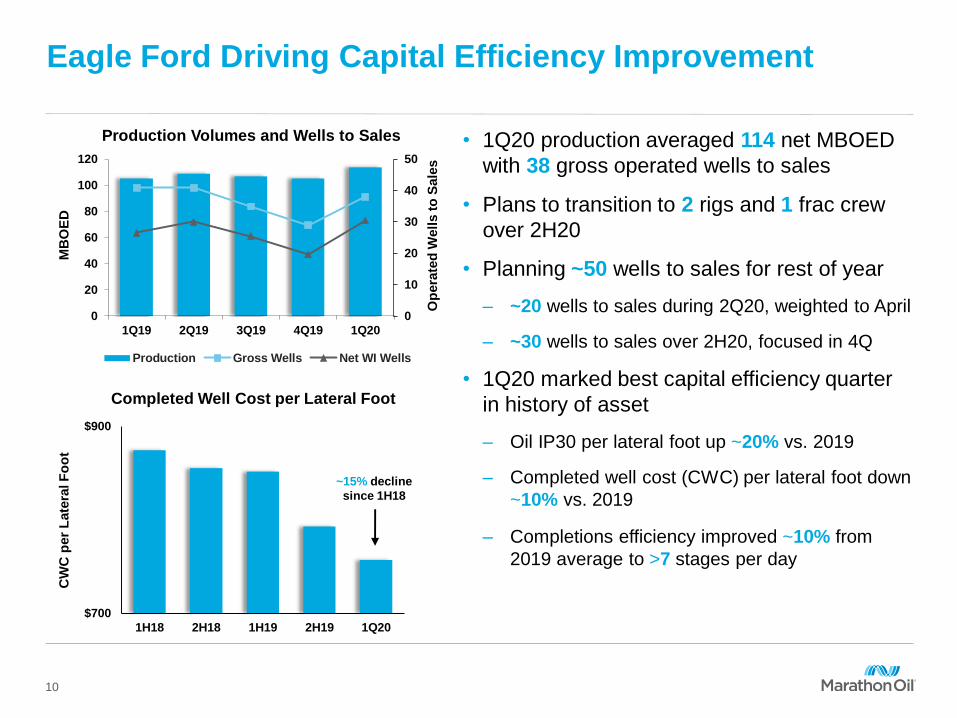
Eagle Ford Driving Capital Efficiency Improvement
Production Volumes and Wells to Sales • 1Q20 production averaged 114 net MBOED
with 38 gross operated wells to sales
• Plans to transition to 2 rigs and 1 frac crew
over 2H20
• Planning ~50 wells to sales for rest of year
– ~20 wells to sales during 2Q20, weighted to April
– ~30 wells to sales over 2H20, focused in 4Q
• 1Q20 marked best capital efficiency quarter
in history of asset
– Oil IP30 per lateral foot up ~20% vs. 2019
– Completed well cost (CWC) per lateral foot down
~10% vs. 2019
– Completions efficiency improved ~10% from
2019 average to >7 stages per day
10
0
10
20
30
40
50
0
20
40
60
80
100
120
1Q19 2Q19 3Q19 4Q19 1Q20
Production Gross Wells Net WI Wells
Op
era
ted
Well
s t
o S
ale
s
MB
OE
D
Completed Well Cost per Lateral Foot
$700
$900
1H18 2H18 1H19 2H19 1Q20
CW
C p
er
Late
ral F
oo
t
~15% decline
since 1H18
0
5
10
15
20
25
30
35
0
20
40
60
80
100
120
1Q19 2Q19 3Q19 4Q19 1Q20
Production Gross Wells Net WI Wells
Improving Capital Efficiency and Returns Through
Well Cost Reductions
Bakken Delivering Execution Excellence
Production Volumes and Wells to Sales
Op
era
ted
Well
s t
o S
ale
s
• 1Q20 production averaged 110 net MBOED
with 25 gross operated wells to sales
• Plans to transition to 1 rig and 1 frac crew
over 2H20
• Remaining 2020 wells to sales concentrated
in Myrmidon
– ~8 planned wells to sales during 2Q20
– ~25 planned wells to sales over 2H20
• Continued execution excellence with focus on
capital efficiency and cost reductions
– 1Q20 average completed well cost of $4.8MM,
down ~5% from 2019 average
– 8 wells during 1Q20 achieved completed well
cost of $4.5MM or less
– Quarterly completions record of ~10 stages per
day during 1Q20
11
MB
OE
D
$2.0
$3.0
$4.0
$5.0
$6.0
$7.0
1H18 2H18 1H19 2H19 1Q20
CW
C (
$M
M)
Best 1Q well:
<$4.3MM
0
4
8
12
16
20
0
20
40
60
80
100
1Q19 2Q19 3Q19 4Q19 1Q20
Production Gross Wells Net WI Wells
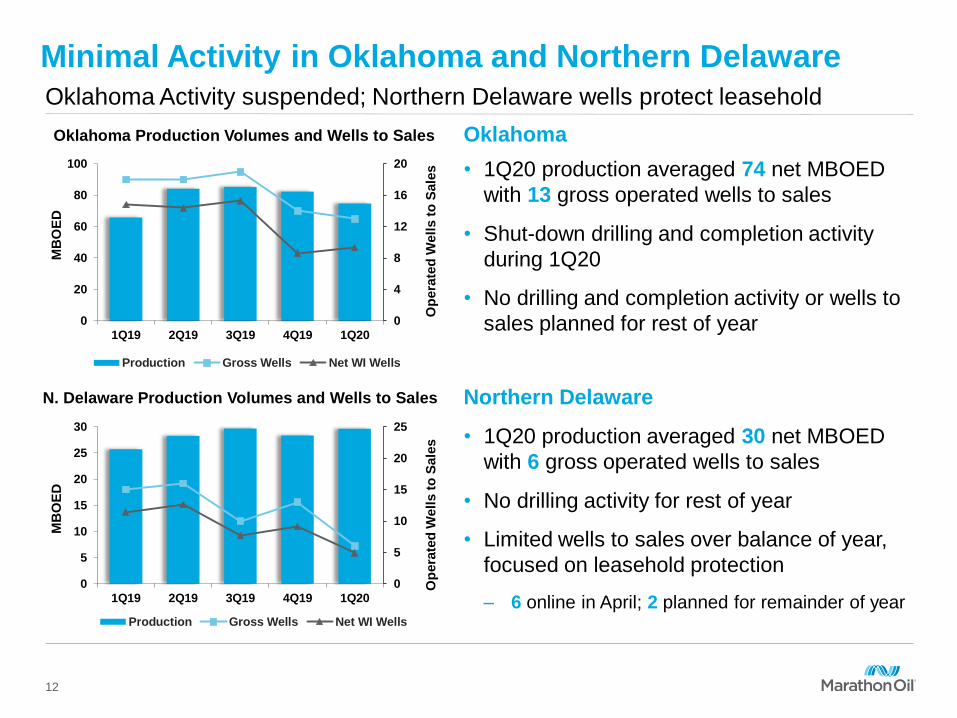
Minimal Activity in Oklahoma and Northern Delaware
Oklahoma Production Volumes and Wells to Sales
Op
era
ted
Well
s t
o S
ale
s
Oklahoma Activity suspended; Northern Delaware wells protect leasehold
Oklahoma
• 1Q20 production averaged 74 net MBOED
with 13 gross operated wells to sales
• Shut-down drilling and completion activity
during 1Q20
• No drilling and completion activity or wells to
sales planned for rest of year
Northern Delaware
• 1Q20 production averaged 30 net MBOED
with 6 gross operated wells to sales
• No drilling activity for rest of year
• Limited wells to sales over balance of year,
focused on leasehold protection
– 6 online in April; 2 planned for remainder of year
12
MB
OE
D
0
5
10
15
20
25
0
5
10
15
20
25
30
1Q19 2Q19 3Q19 4Q19 1Q20
Production Gross Wells Net WI Wells
N. Delaware Production Volumes and Wells to Sales
Op
era
ted
Well
s t
o S
ale
s
MB
OE
D
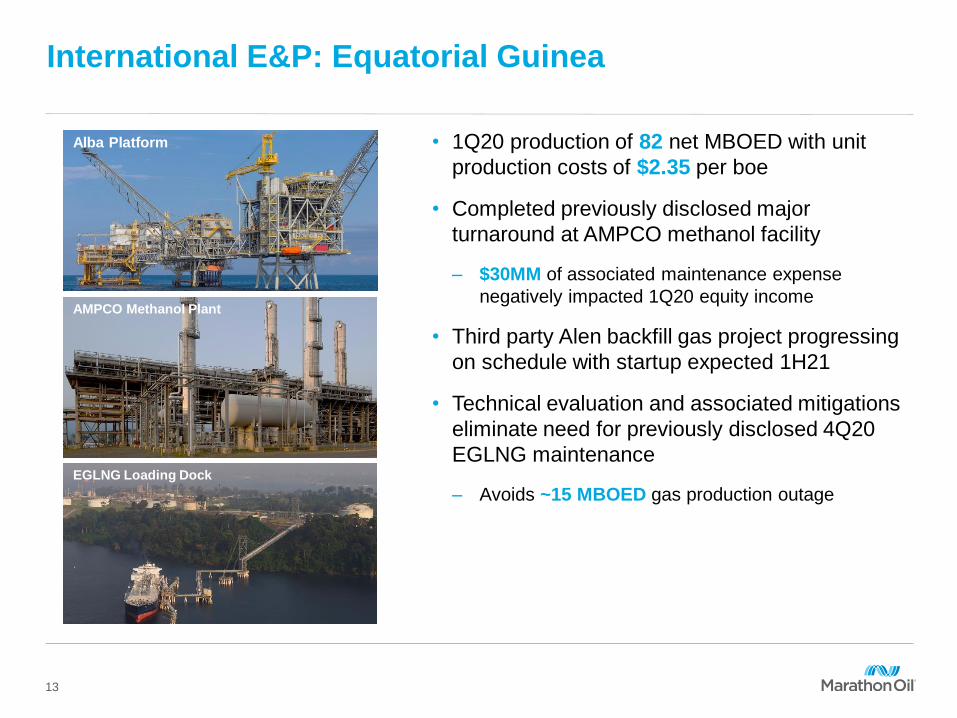
International E&P: Equatorial Guinea
• 1Q20 production of 82 net MBOED with unit
production costs of $2.35 per boe
• Completed previously disclosed major
turnaround at AMPCO methanol facility
– $30MM of associated maintenance expense
negatively impacted 1Q20 equity income
• Third party Alen backfill gas project progressing
on schedule with startup expected 1H21
• Technical evaluation and associated mitigations
eliminate need for previously disclosed 4Q20
EGLNG maintenance
– Avoids ~15 MBOED gas production outage
Alba Platform
AMPCO Methanol Plant
EGLNG Loading Dock
13
Committed to Sustainability
1 Methodology and definitions based on information from online 2018 MRO Sustainability Report
2 Based on Total Recordable Incident Rate 4 Metrics impact short-term incentive plan
3 World Health Organization
The foundation for long-term financial outperformance
Environmental & Safety1 Social Governance
• Leveraging the Bioko Island
Malaria Elimination Project
vaccine lab, endorsed by the
WHO3 to diagnose COVID-19 in
Equatorial Guinea
• Distributed ~8,000 N95 masks to
emergency management and
healthcare organizations in the
U.S.
• Donated more than $75,000 in
emergency relief to benefit food
banks across Texas, Oklahoma,
North Dakota and New Mexico
• Donated laptops to assist Houston-
area students with remote learning
• 2019 marked best safety
performance2 in MRO history
• 2020 starting even stronger2;
16% reduction in Total Recordable
Incident Rate during 1Q20
• 96% total Company gas capture
during 1Q20
• 19% year on year reduction in
methane intensity in 2019; 44%
reduction since 2014
• In response to COVID-19,
Business Continuity and
Emergency Response Plans
enabled uninterrupted field
operations and effective transition
to work from home practices
• 7 of 8 directors are independent
with lead independent director; 25%
of Board is female
• ~5 year average director tenure;
50% of directors joined in last 36
months
• All committees made up of entirely
NYSE independent directors
• GHG intensity metric added to
2020 executive compensation
scorecard4
• Base salary reductions for CEO and
other corporate officers and
reduction of Board of Director
compensation in 2020
14
Prioritizing Financial Strength and Flexibility
Reduction
vs. 2019 spend
2020
Capital Budget
~50%
Significant
Liquidity
$3.8B$817MM of cash and $3B
undrawn revolver
Reducing Capital Expenditures Managing Cost StructureProtecting Balance Sheet and
Liquidity
High-Grading Capital
Investment
~95%of 2H20 capex to
Eagle Ford and Bakken
Cash Flow
Protection
of 2Q20 hedges with
weighted average hard floor
of >$30/bbl
Annualized Cash Cost1
Reduction2
$350MMDown ~20%
vs. original plan
17%
15
~117 mbopd
Annualized G&A
Reduction2
Relative to
2019
1 Cash costs include production expense, general and administrative, shipping and handling, and production taxes
2 Expected reductions based on revised plan

Appendix
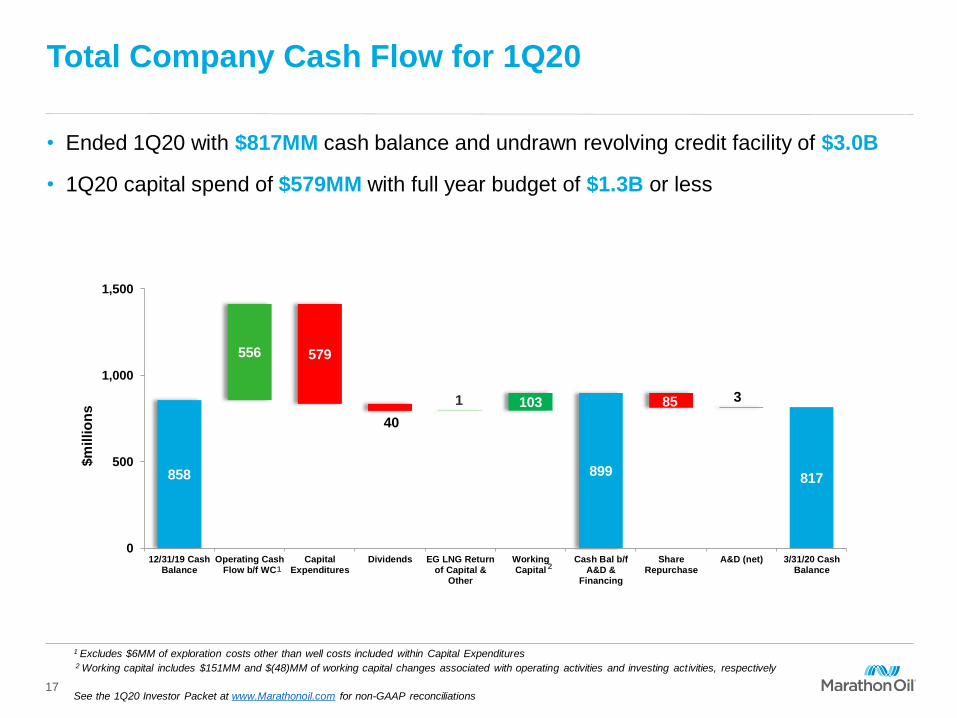
Total Company Cash Flow for 1Q20
• Ended 1Q20 with $817MM cash balance and undrawn revolving credit facility of $3.0B
• 1Q20 capital spend of $579MM with full year budget of $1.3B or less
1 Excludes $6MM of exploration costs other than well costs included within Capital Expenditures2 Working capital includes $151MM and $(48)MM of working capital changes associated with operating activities and investing activities, respectively
See the 1Q20 Investor Packet at www.Marathonoil.com for non-GAAP reconciliations
858 899817
556 579
40
1 103 85 3
0
500
1,000
1,500
12/31/19 CashBalance
Operating CashFlow b/f WC
CapitalExpenditures
Dividends EG LNG Returnof Capital &
Other
WorkingCapital
Cash Bal b/fA&D &
Financing
ShareRepurchase
A&D (net) 3/31/20 CashBalance
$m
illio
ns
1 2
17
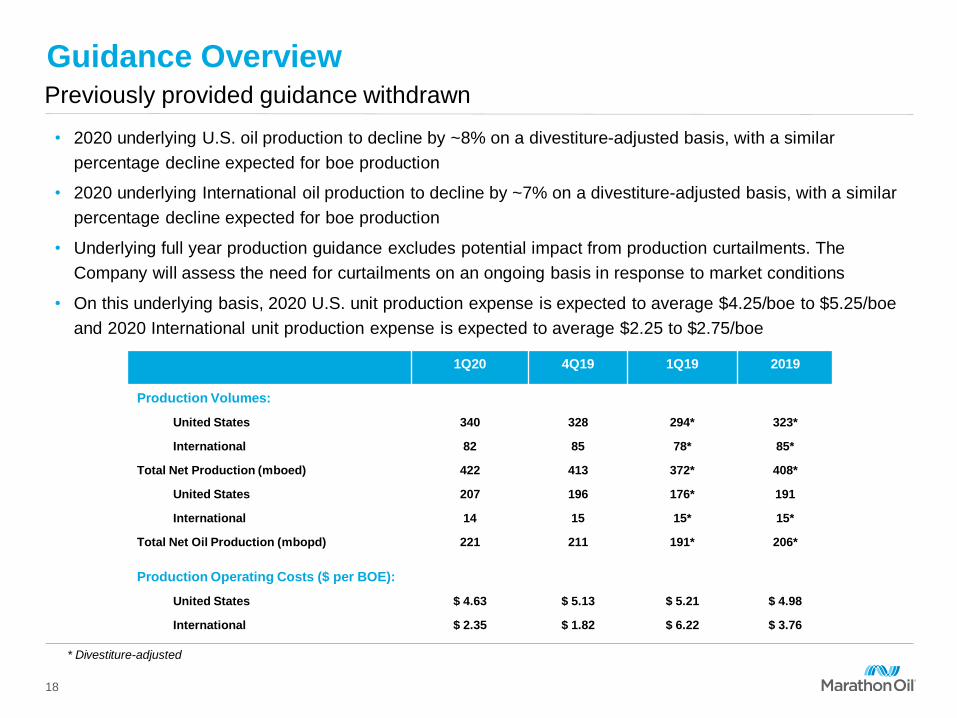
Guidance Overview
1Q20 4Q19 1Q19 2019
Production Volumes:
United States 340 328 294* 323*
International 82 85 78* 85*
Total Net Production (mboed) 422 413 372* 408*
United States 207 196 176* 191
International 14 15 15* 15*
Total Net Oil Production (mbopd) 221 211 191* 206*
Production Operating Costs ($ per BOE):
United States $ 4.63 $ 5.13 $ 5.21 $ 4.98
International $ 2.35 $ 1.82 $ 6.22 $ 3.76
* Divestiture-adjusted
18
Previously provided guidance withdrawn
• 2020 underlying U.S. oil production to decline by ~8% on a divestiture-adjusted basis, with a similar
percentage decline expected for boe production
• 2020 underlying International oil production to decline by ~7% on a divestiture-adjusted basis, with a similar
percentage decline expected for boe production
• Underlying full year production guidance excludes potential impact from production curtailments. The
Company will assess the need for curtailments on an ongoing basis in response to market conditions
• On this underlying basis, 2020 U.S. unit production expense is expected to average $4.25/boe to $5.25/boe
and 2020 International unit production expense is expected to average $2.25 to $2.75/boe
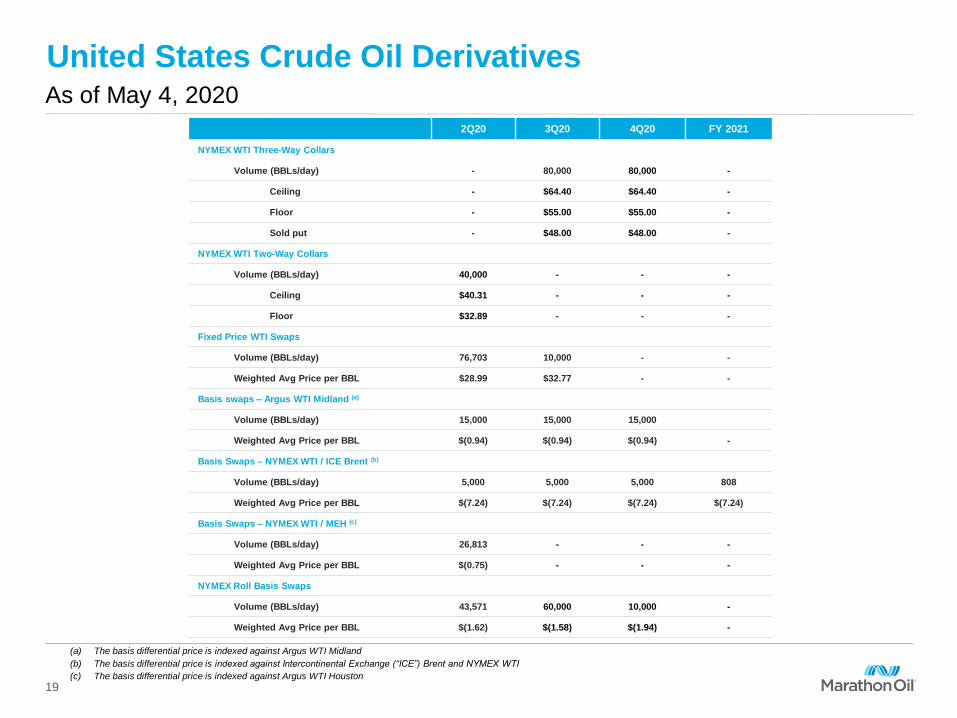
United States Crude Oil DerivativesAs of May 4, 2020
2Q20 3Q20 4Q20 FY 2021
NYMEX WTI Three-Way Collars
Volume (BBLs/day) - 80,000 80,000 -
Ceiling - $64.40 $64.40 -
Floor - $55.00 $55.00 -
Sold put - $48.00 $48.00 -
NYMEX WTI Two-Way Collars
Volume (BBLs/day) 40,000 - - -
Ceiling $40.31 - - -
Floor $32.89 - - -
Fixed Price WTI Swaps
Volume (BBLs/day) 76,703 10,000 - -
Weighted Avg Price per BBL $28.99 $32.77 - -
Basis swaps – Argus WTI Midland (a)
Volume (BBLs/day) 15,000 15,000 15,000
Weighted Avg Price per BBL $(0.94) $(0.94) $(0.94) -
Basis Swaps – NYMEX WTI / ICE Brent (b)
Volume (BBLs/day) 5,000 5,000 5,000 808
Weighted Avg Price per BBL $(7.24) $(7.24) $(7.24) $(7.24)
Basis Swaps – NYMEX WTI / MEH (c)
Volume (BBLs/day) 26,813 - - -
Weighted Avg Price per BBL $(0.75) - - -
NYMEX Roll Basis Swaps
Volume (BBLs/day) 43,571 60,000 10,000 -
Weighted Avg Price per BBL $(1.62) $(1.58) $(1.94) -
(a) The basis differential price is indexed against Argus WTI Midland
(b) The basis differential price is indexed against Intercontinental Exchange (“ICE”) Brent and NYMEX WTI
(c) The basis differential price is indexed against Argus WTI Houston
19
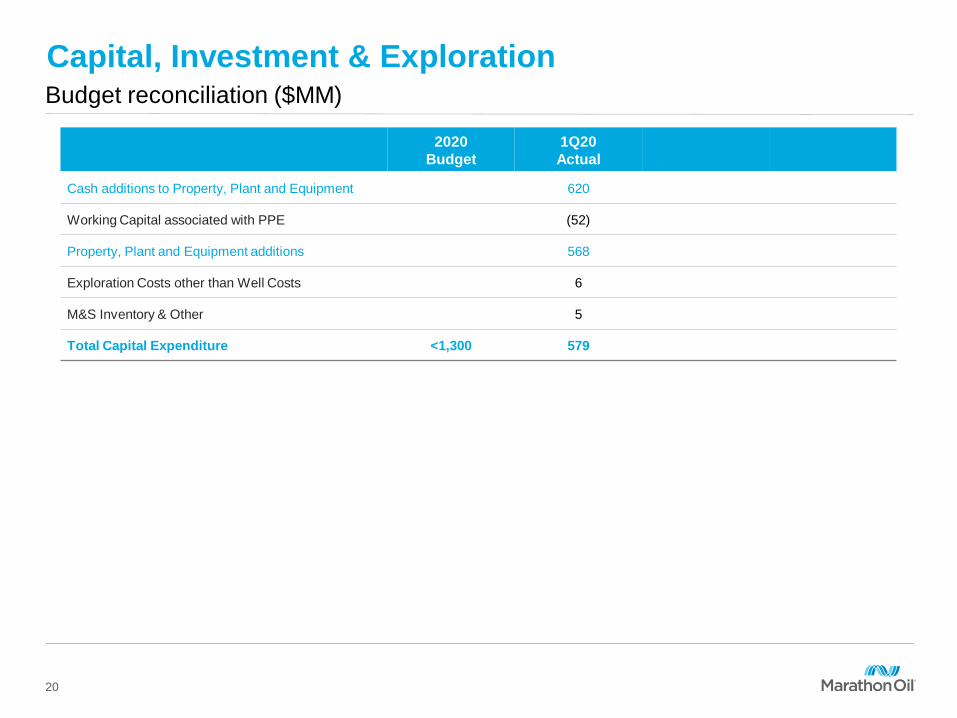
Capital, Investment & ExplorationBudget reconciliation ($MM)
2020
Budget
1Q20
Actual
Cash additions to Property, Plant and Equipment 620
Working Capital associated with PPE (52)
Property, Plant and Equipment additions 568
Exploration Costs other than Well Costs 6
M&S Inventory & Other 5
Total Capital Expenditure <1,300 579
20


