54
First quarter 2021 Presentation April 2021

First quarter 2021Presentation
April 2021

Hilde Merete Aasheim, President & CEO
April 27, 2021

Adjusted EBITDA NOK 5 182 million
Free cash flow NOK -0.8 billion
Improvement program ahead of plan
Investment decision for Alunorte fuel-switch project
Agreement to sell Rolling, closing expected Q2-Q3
Exploring hydrogen, other growth initiatives progressing
Strong demand drives recovery
3
Record EBITDA in Extrusions and Energy

1) TRI includes own employees and contractors2) Average over period
Covid measures adapted to local conditions
2
0
1
5
3
4
Q3’16 Q1’21
3,112)
TRI1) per million hours worked12 months rolling average
2.85
3.35
4
Covid-19 update
• Operations running largely as normal during the quarter
• Initiatives globally to support employees and prevent
infections
• Support to local Brazilian communities in their health efforts

Free cash flow2)
NOK billion
5
1) 2020: restated Adjusted EBITDA2) Free cash flow is defined as net cash provided by (used in) operating activities of continuing operations plus net cash provided by (used in) investing activities of continuing operations, adjusted for
purchases of / proceeds from sales of short-term investments (2020: restated cash flow statement)3) Realized alumina price minus Adjusted EBITDA for B&A, per mt alumina sales4) Realized all-in aluminium price less Adjusted EBITDA margin, incl Qatalum, per mt aluminium sold. Implied primary cost and margin rounded to nearest USD 255) Figures for 1Q20 and 4Q20 as reported (not restated). 1Q21: Capital employed excluding Assets held for sale / Liabilities in disposal groups. 6) Improvement program target and progress excluding Hydro Rolling
3 8103 403
5 182
4Q201Q20 1Q21 -0.8
3.2
1Q214Q201Q20
0.6
1Q21
3.7%3.6%
1Q20 4Q20
5.4%
226 241 243
1 700 1 6501 825
1Q20 1Q214Q20
Adjusted EBITDA 1)
NOK million
Adjusted RoaCE5)
12-month rolling %
Upstream costs3,4)
USD per tonne
Improvement program status6)
NOK billions
Extrusions volumes
Thousand tonnes
Bauxite & Alumina Aluminium Metal
2020 achieved 2021 target 2025 overall target
7.4
5.1
3.7
305 291
338
1Q20 4Q20 1Q21

6Source: Republished under license from CRU International Ltd, Harbor Aluminium
Quarterly market balances, world ex. China and China
Thousand tonnes, primary aluminium
Global balance estimates 2021
Million tonnes, primary aluminium
(2 000)
(1 500)
(1 000)
( 500)
0
500
1 000
1 500
2 000
2 500
Q1
-16
Q2
-16
Q3
-16
Q4
-16
Q1
-17
Q2
-17
Q3
-17
Q4
-17
Q1
-18
Q2
-18
Q3
-18
Q4
-18
Q1
-19
Q2
-19
Q3
-19
Q4
-19
Q1
-20
Q2
-20
Q3
-20
Q4
-20
Q1
-21
Ex. China China Global balance
CRU Harbor
-0.2
0.9
0.7
-0.3
ChinaEx. China
Expecting largely balanced market for 2021

Strengthened trends
• Restrictions on supply growth, especially in China, reduce risk of sustained over-capacity next decade
• Increasing and likely sustained focus on fair trade
• Focus on ESG could phase significant upside for green products
New trends
• Green transition in major regions requires more aluminium, e.g., higher aluminium content in EVs
• Increasing cost of supply towards next decade due to new projects with higher capex based on hydropower
• Higher end-product adaption of aluminium due to recyclability
• Primary aluminum based on renewable power will qualify under the EU taxonomy criteria
• No thresholds have been included for recycling. All secondary aluminium is taxonomy compliant.
7

8
Market performing better than forecast in Q4 2020
Source: CRU
6
36
6
30
Q1 Q2
North America Europe
External market forecasts
2021 vs 2020
Hydro Extrusions segment sales volume
Growth in %
Q1 2021 vs Q1 2020
Hydro Extrusions sales volumes - actual
36
1112
21
34
11
HVAC&RDistribution Hydro Extrusions
Total
B&C TransportIndustrial Automotive
Extrusion market growth per quarterGrowth in %
Share of Q1 2021 Hydro Extrusions sales
19% 12% 30% 20% 18% 2%
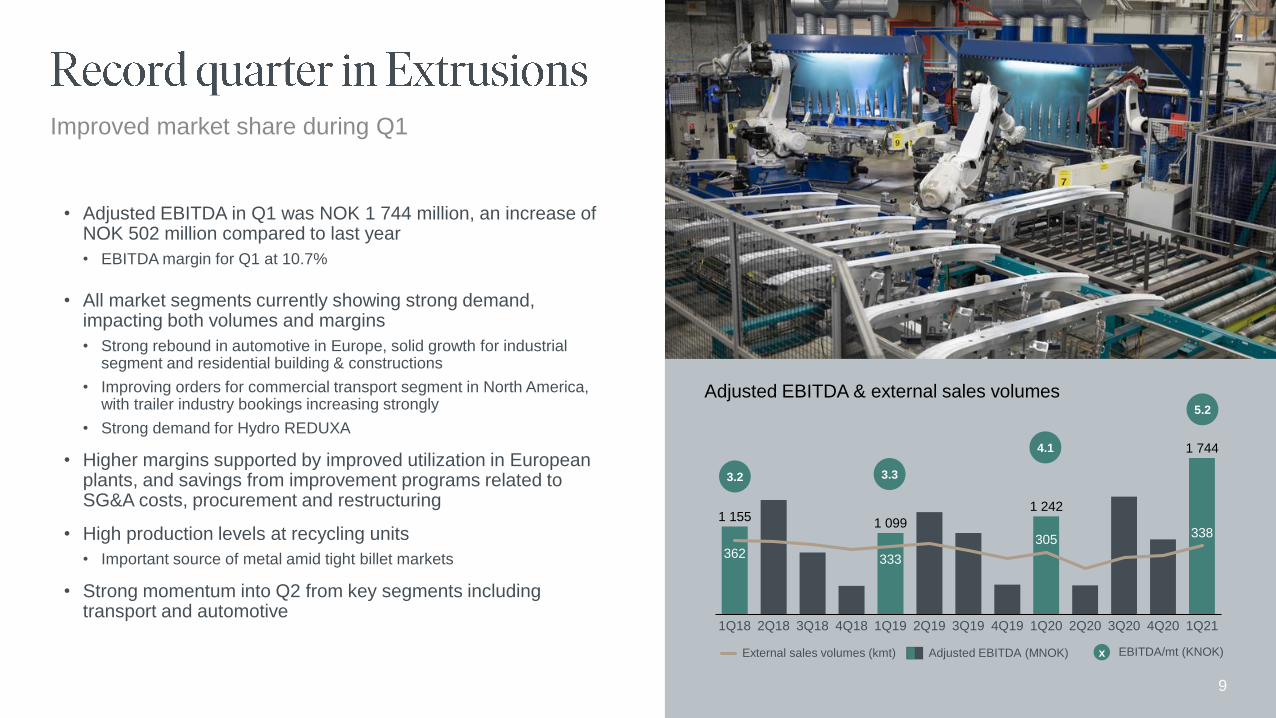
• Adjusted EBITDA in Q1 was NOK 1 744 million, an increase of NOK 502 million compared to last year
• EBITDA margin for Q1 at 10.7%
• All market segments currently showing strong demand, impacting both volumes and margins
• Strong rebound in automotive in Europe, solid growth for industrial segment and residential building & constructions
• Improving orders for commercial transport segment in North America, with trailer industry bookings increasing strongly
• Strong demand for Hydro REDUXA
• Higher margins supported by improved utilization in European plants, and savings from improvement programs related to SG&A costs, procurement and restructuring
• High production levels at recycling units
• Important source of metal amid tight billet markets
• Strong momentum into Q2 from key segments including transport and automotive
9
Adjusted EBITDA & external sales volumes
1 1551 099
1 242
1 744
362 333
305338
3Q19 1Q201Q191Q18 4Q18 2Q192Q18 3Q18 4Q19 2Q20 3Q20 4Q20 1Q21
External sales volumes (kmt) Adjusted EBITDA (MNOK)
3.3
4.1
5.2
x EBITDA/mt (KNOK)
3.2
Improved market share during Q1

Strengthen position in low-carbon aluminium Diversify and grow in new energy
Seizing opportunities where our capabilities match megatrends
1
1
2
10
Renewable energy HydrogenBatteries

2021 target of 5.1 BNOK
accumulated improvements
1) Achieved NOK 0.5 biliion of 1.1 billion 2025 target by 2020, and represented a commercial ambition of NOK 0.5 billion 2) Alunorte and Paragominas ramp-up to full nameplate capacity
2025 accumulated improvement potential by yearNOK billion
11
Additional NOK 1.5 billion in market and customer growth opportunities by 2025
2.0 B&A
1.0
0.0
Extrusions
Corporate
0.6
0.1AM
Energy
2020 accumulated improvement NOK billion
NOK 3.7
billion
Improvement program Commercial ambition
1.5
20%
80%
Ambition
Aluminium Metal
Extrusions
• New products including
greener brands, HyForgeTM
• Market share gains in
dedicated segments
• Margin expansion in new
customer projects
0.5
0.2
20252020A2019A
1.0
2021 2022 2023 2024 Total
2.7
0.6
7.4
0.8
1.4
0.9
0.5
1.0
0.6
4.8
B&A ramp-up2)
Improvements
New improvement target of NOK 7.4 billion by 2025 and commercial ambition of NOK 1.5 billion adjusted for Rolling1)

12Photo: Field Condition1) Excluding Rolling
Google Hudson Square in Hydro
REDUXA facade…… produced at Hydro’s Sunndal
plant in Norway
• 450 tonnes of Hydro REDUXA
• 1.3 million square feet office space
• Hydro REDUXA capacity of ~415 kt, ~20%
of Hydro total
7
~45
~75
FY 2019 FY 2020 Q1 2021
Hydro REDUXA sales1)
k tons
Strong Q1 sales for Hydro REDUXA
• Increased Hydro REDUXA demand in Q1
13
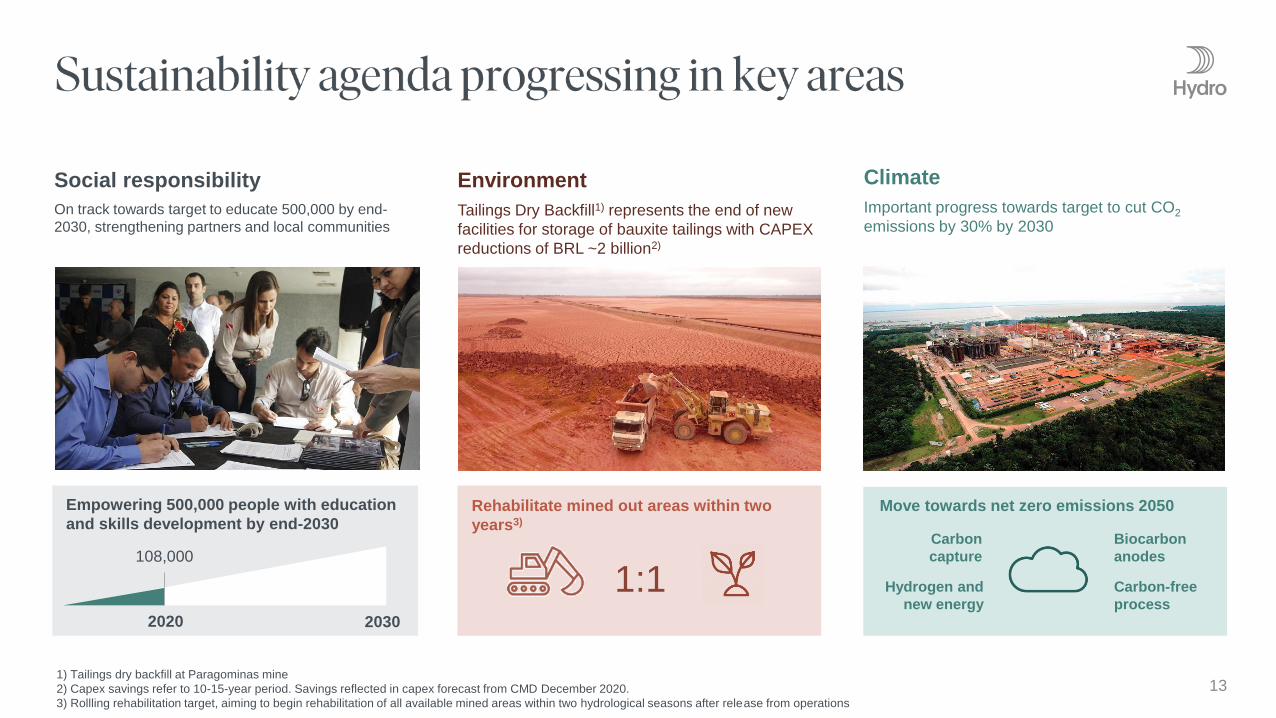
Climate
Important progress towards target to cut CO2
emissions by 30% by 2030
Social responsibility
On track towards target to educate 500,000 by end-
2030, strengthening partners and local communities
Minimize need for new tailings dams
[more specific on ambition/goal??]
Empowering 500,000 people with education
and skills development by end-2030Rehabilitate mined out areas within two
years3)
Environment
Tailings Dry Backfill1) represents the end of new
facilities for storage of bauxite tailings with CAPEX
reductions of BRL ~2 billion2)
1:1
1) Tailings dry backfill at Paragominas mine
2) Capex savings refer to 10-15-year period. Savings reflected in capex forecast from CMD December 2020.
3) Rollling rehabilitation target, aiming to begin rehabilitation of all available mined areas within two hydrological seasons after release from operations
Move towards net zero emissions 2050
Carbon
capture
Hydrogen and
new energy
Biocarbon
anodes
Carbon-free
process
2020 2030
108,000

1) Based on 2018 portfolio excluding Rolling, by 2025 10% reduction and by 2030 30% reduction2) The proposed agreement is subject to reaching commercial agreements and final documentation between the parties
Boiler?
Main enabler to deliver on 2025 CO2 reduction ambition
Accumulated CO2 effects and overall reduction ambitionsOwn emissions in million mt CO2
Fuel switch
0.6
Hydro CO2
reduction ambition
0.4
El-boilers AlunorteCoal elimination potential
Other Hydro initiatives
~3.0
2025 (-10%)
2030 (-30%)
MoU
By ‘30
• Unlocking potential of 600,000 tonnes of CO2 reduction by replacing heavy fuel oil with liquid natural gas
• MoU2) signed with New Fortress Energy to deliver natural gas to Alunorte
• Expected CAPEX of BRL 1.1 billion
• Key enabler to meet the CO2 reduction ambition of 10% by 2025
• Enabler for other LNG installations in the region of Pará
• Installation of three electrical boilers replacing coal with potential of 400 thousand tonnes of CO2 emissions
• Pilot installation planned in 2021
• Elimination of coal by electrifying remaining boilers have a potential of 2 million tonnes of CO2 reduction by 2030
• Fuel switch enabling Hydro REDUXA 3.0
• El boilers required for Hydro REDUXA 2.0
141)

2
9
5
9
Extrusions
~2 Mt recycling capacity currently in operationPCS capacity
‘000 ton
3.0 - 4.5200 - 350
EBITDA uplift3)
MNOK
700 – 1,100
Aluminium metal
Extrusions
Aluminium metal
Projects
underway
Investment
decision possible
in 2021-’22
Early phase
projects
2025 ambition
ex Rolling
InvestmentsBNOK
number of sites
Double post-consumer scrap (PCS)2) use by 2025
1) Ambition across Hydro Extrusion and Aluminium Metal. Rolling excluded in all numbers.2) Post-consumer scrap (PCS): scrap from products that have been in use, e.g., cars, buildings reaching end of life. 3) Recycling is an integrated part of the BAs’ value creation and is reported as part of the BAs’ total financial results. EBITDA uplift also driven by e.g., utilizing pre-consumed low-priced, complex scrap types. Pre-consumer scrap: internal or customer’s/external process scrap.
25 recyclers and 1 sorting plant
North America
Europe
15

16
Exploring hydrogen opportunities
• Explore hydrogen potential
• Equity raise to be evaluated
Strategy
Extensive batteries pipeline with two
investments in operations
• NOK 2.5-3.0 billion investments
• Pro rata EBITDA MNOK 600-700
2025 ambition
Hydro REIN established
• 1GW investment decisions 2021
• Equity rase to be evaluated
Milestones

17
Building on 100+ years of experienceSolar Wind Energy solutions
Brazil
Nordics
Investment decision into at least 1 GW1)2021 target
Hydro
potential 10 TWh repowering need in Hydro by 2025
StorageOn site
generation
Energy
efficiencyGreen
sourcing
Partners
1) 100% basis, average ownership 30 – 50% pre potential farm-down
100+ sites identified in
Hydro’s footprint
Hydro normal annual production vs OSE listed peers
TWh
1.8 2.0
OrklaBonheur Scatec
4.1
Hydro
9.4

8.000 ton
18
Construction phase projects expected to be in operations within 2021-22
1) 50/50 Joint Venture with Northvolt2) Joint Battery Initiative (JBI)3) Capacity at Norwegian plant4) Final Investment Decision (FID)
Operations
ConstructionSOP 2021-22
MoU, FID4) &
Early phase
Hydro
ownership
Cell
production
capacity
Recycling
capacity
System
production
capacity Attractive positioning in the Nordics
1)
350 MWh
32 GWh
Exploring growth options
1%
21%
1%
50%
Giga PlantTBD
European total car sales projection (million) and locations
2025
9%
2020
12%
24%
39%
51%
37%
2030
67%
28%
2035
Electric
Semi-electric
16
Traditional
13
17 17
Electric inc BEV, PHEV, Semi-electric inc. HEV, MHEV, Traditional pure Diesel and Gasoline. Source: BCG
400 MWh3)
5 GWh
200 MWh
Other early phase projects evaluated
2)
Labs
Jeden

Equity raise being evaluated for Hydrogen company
• Currently maturing 3-5 projects in Norway and Europe
• First investment decisions within 12 months
• Plan to raise external capital in short to medium term
• Global project portfolio and long-term robust pipeline
• Partnerships being matured to accelerate growth
Potential for ~4 GW
long-term captive
demand
Vehicle to develop
renewable power
Leveraging Hydro
Energy market and
system support
• There is large hydrogen potential from industrial heating in the Hydro portfolio - approx. 4GW hydrogen production equivalent
• Conversion to hydrogen can give approx. 1 000 0001) t CO2 emission reduction
• Norwegian gas consumption equals to ~120MW of hydrogen production capacity
• A hydrogen business can leverage Hydro’s large global footprint of industrial assets
• Scale and positions in sourcing and production of power
• Strong support schemes being put in place in EU and Norway – supporting aggressive European industrial decarbonization targets.
1) Excluding Alunorte
Electricity price (high-to-low)Co
nve
nti
on
al fu
el p
ric
e in
clu
din
g C
O2
pri
ce
19
Profitable short
term with
optimization
Profitable short term
Clear path to
profitability mid-
term
Hydro has access to a distinct toolkit of
value levers to ‘fast track’ roadmap further
e.g. power sourcing, industrial optimization,
demand-side response
Hydro locations
Hydro Rolling
Captive H2 demand,
Ø = 50 MW
Source: Norsk Hydro, Hydrogen Council
~4 GW in strategic locations
Conversion already attractive at multiple Hydro locations
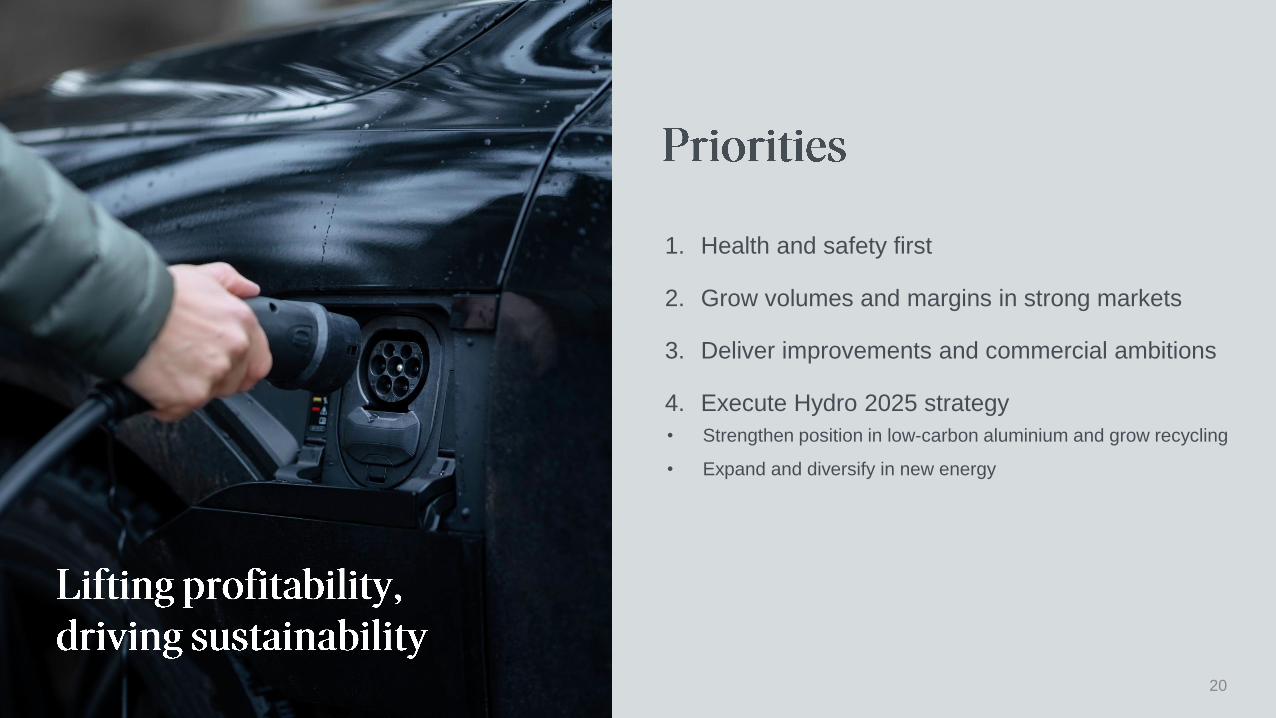
1. Health and safety first
2. Grow volumes and margins in strong markets
3. Deliver improvements and commercial ambitions
4. Execute Hydro 2025 strategy
• Strengthen position in low-carbon aluminium and grow recycling
• Expand and diversify in new energy
20

Pål Kildemo, Executive Vice President and CFO

221) Based on restated financials ex. Hydro Rolling
Q1-2021 vs Q1-2020
Downstream result
0.7
Realized aluminium and alumina price
Adj. EBITDA Q1 2020
0.5
Energy price and volume
1.8
Other inc. eliminations
0.2
Upstream volume
5.2
0.7
Raw material and fixed cost
0.6
Currency
0.6
Adj. EBITDA Q1 2021
3.8
NOK billion
1)

23
NOK million Q1 2021 Q1 2020 Q4 2020 Year 2020
Revenue 31 951 31 609 29 823 114,291
Reported EBITDA
Adjustment to EBITDA
Adjusted EBITDA
4 079
1 103
5 182
4 107
(297)
3 810
8 601
(5 198)
3 403
18 390
(5 284)
13 106
Reported EBIT 2 233 2 228 6 824 9 356
Adjusted EBIT 3 559 1 943 1 678 6 040
Financial income (expense)
Reported Income (loss) before tax
424
2 657
(4 428)
(2 200)
1 248
8 072
(4 552)
4 804
Income taxes (776) 457 (846) (918)
Reported Net income (loss) from continuing operations 1 880 (1 743) 7 226 3 886
Adjusted net income (loss) from continuing operations 2 448 834 1 089 2 848
Earnings per share from continuing operations 0.89 (0.75) 3.40 1.99
Adjusted earnings per share from continuing operations 1.15 0.39 0.47 1.32
Loss from discontinued operations (380) (282) (1 849) (2 226)
Income and expenses in the business to be sold are excluded from such income and expenses in continuing operations and reported separately as Losses for discontinued operations. For further information
and a specification of the result in the discontinued operations, see Note 4 Discontinued operations and assets held for sale to the interim financial statements

9993 817
24
Results down on increased costs from crane repair and raw materials prices
1) Realized alumina price minus Adjusted EBITDA for B&A, per mt alumina sales2) Adjusted RoaCE calculated as Adjusted EBIT last 4 quarters less 25% tax / Average capital employed last 4
quarters3) Realized alumina price
Key figures Q1 2021 Q1 2020 Q4 2020
Alumina production, kmt 1 540 1 531 1 410
Total alumina sales, kmt 2 269 2 140 2 122
Realized alumina price, USD/mt 294 278 272
Implied alumina cost, USD/mt1) 243 226 241
Bauxite production, kmt 2 813 2 585 2 556
Adjusted EBITDA, NOK million 999 1 102 587
Adjusted EBIT, NOK million 556 535 116
Adjusted RoaCE, % LTM2) 6.5% 3.6% 5.9%Results Q1 21 vs Q1 20
• Higher realized alumina price
• Positive currency effects of weaker BRL against USD
• Higher operational costs from crane repairs (NOK ~350 million)
• Higher raw material prices, mainly fuel oil
• High production at Paragominas, and close to nameplate at Alunorte
Outlook Q2 21• Alunorte expected to produce around nameplate capacity
• Crane repair costs NOK ~100 million
• Maintenance at Paragominas
• Higher market prices for fuel oil
1 102 9991 550
578 587
20212020
NOK million
Adjusted EBITDA
Implied alumina cost and margin
USD/mt1)
226 241 243
1Q211Q20 4Q20
52 32 52
278 272 294 Price3)
Implied EBITDA cost per mt1) All-in EBITDA margin per mt

NOK million
Adjusted EBITDA
1 1971754560
404 1 432
Key figures Q1 2021 Q1 2020 Q4 2020
Primary aluminium production, kmt 539 528 532
Total sales, kmt 599 577 547
Realized LME price, USD/mt 1 993 1 758 1 792
Realized LME price, NOK/mt 16 999 16 658 16 364
Realized premium, USD/mt 264 234 224
Implied all-in primary cost, USD/mt 1) 1 825 1 700 1 650
Adjusted EBITDA, NOK million 1 754 1 197 1 432
Adjusted EBITDA including Qatalum 50% pro rata (NOK
million)
2 218 1 599 1 794
Adjusted EBIT, NOK million 1 185 573 844
Adjusted RoaCE, % LTM2) 4.5% 0.4% 2.9%
25
Results up on higher all-in metal prices
1) Realized all-in aluminium price minus Adjusted EBITDA margin, including Qatalum, per mt aluminium sold. IncludingQatalum volumes.
2) Adjusted RoaCE calculated as Adjusted EBIT last 4 quarters less 25% tax / Average capital employed last 4 quarters3) Implied primary cost and margin rounded to nearest USD 254) Realized LME aluminium price less Adjusted EBITDA margin, incl Qatalum, per mt primary aluminium produced
Results Q1 21 vs Q1 20
• Higher LME, premiums and sales volumes
• Negative currency effects and higher raw material prices
• NOK 120 million risk adjusted CO2 compensation included, reflecting 2 months
eligble sales volumes
Outlook Q2 21
• ~65% of primary production for Q2 priced at USD 2 108 per mt 8)
• ~59% of premiums affecting Q2 booked at USD ~333 per mt 8)
• Q2 realized premium expected in the range of USD 275-325 per ton1 7543 593
20212020
All-in implied primary cost and margin
USD/mt1,3)
4Q20
1 700 1 650
Q120
1 4504)
1 825
1 4254)
1Q21
1 5004)
300 350 450
67% 69% 73% % value add products7)
1 758 1 792 1 993 LME6)
1 992 2 015 2 257 All-in5)
All-in Implied EBITDA cost per mt 1) LME Implied EBITDA cost per mt 4) All-in EBITDA margin per mt
5) Realized LME plus realized premiums, including Qatalum6) Realized LME, including Qatalum7) % of volumes extrusion ingot, foundry alloy, sheet ingot, wire rod of total sales volumes 8) Bookings, also including pricing effects from LME strategic hedging program as per 31.03.2021

296
7858 233 287
26
Results down on lower Recycling results and negative currency and inventory valuation effects
1) Includes external and internal sales from primary casthouse operations, remelters and third-party metal sources.2) Adjusted RoaCE calculated as Adjusted EBIT last 4 quarters less 25% tax / Average capital employed last 4 quarters
Results Q1 21 vs Q1 20
• Lower recycling results, mainly due to lower realized sales premiums
• Higher results from commercial activities
• Negative currency and inventory valuation effects
Outlook Q2 21
• Volatile trading and currency effects
78875
20212020
Key figures Q1 2021 Q1 2020 Q4 2020
Remelt production, kmt 143 137 140
Metal products sales, kmt 1) 742 675 672
Adjusted EBITDA Recycling (NOK million) 89 121 137
Adjusted EBITDA Commercial (NOK million) (11) 176 149
Adjusted EBITDA Metal Markets (NOK million) 78 296 287
Adjusted EBITDA excl. currency and inventory valuation
effects161 119 295
Adjusted EBIT (NOK million) 43 261 248
Adjusted RoaCE, % LTM2) 15.8% 28.1% 21.4%
NOK million
Adjusted EBITDA

Key figures Q1 2021 Q1 2020 Q4 2020
External sales volumes, kmt 338 305 291
Adjusted EBITDA, NOK million 1 744 1 242 1 044
Adjusted EBIT, NOK million 1 244 702 511
Adjusted RoaCE, % LTM1) 8.4% 5.7% 6.2%
1 2421744
649
1 4121 044
27
Results up on higher volumes, reduced variable costs and increased margins
Results Q1 21 vs Q1 20
• Higher volumes driven by strong demand
• Increased margins
• Lower variable costs
Outlook Q2 21
• Continued strong demand
• Continued low fixed costs
1 7444 348
20212020
1) Adjusted RoaCE calculated as Adjusted EBIT last 4 quarters less 25% tax / Average capital employed last 4 quarters
NOK million
Adjusted EBITDA

Key figures Q1 2021 Q1 2020 Q4 2020
Power production, GWh 2 857 2 868 3 396
Net spot sales, GWh 1 126 1 169 1 595
Southwest Norway spot price (NO2), NOK/MWh 469 154 137
Adjusted EBITDA, NOK million 841 505 419
Adjusted EBIT, NOK million 792 437 352
Adjusted RoaCE, % LTM1,2) 10.8% 20.5% 8.7%
505841
122200 419
28
Results up on higher prices and changes in contract portfolio
Results Q1 21 vs Q1 20
• Seasonally high production at higher prices due to below normal temperatures and
low wind power output
• Expiry of legacy power supply contract and new internal contract
Outlook Q2 21• Average NO2 spot price ~422 NOK/Mwh in April3)
• Uncertainty on timing of spring thaw
8411 245
20212020
1) Adjusted RoaCE calculated as Adjusted EBIT last 4 quarters less tax/ Average capital employed last 4 quarters2) 80% tax rate applied for full year 2019 and 2020. 55% tax rate applied in Q1 20213) 01.04.2021-25.04.2021
NOK million
Adjusted EBITDA

NOK billion
Net cash flow from operations
NOK 0.5 billion
29
Adj. net debt
Q1-21
(12.3)
Adj. net debt
Q4-20
(22.6)
Change in NOC
(2.4)
Net debt Q4-20
5.2
Other operating cash flow
Adj. EBITDA
(2.3)
(1.3)
Investments (net)
0.7
Other
(1.1)
Net cash used in discontinued
operations
Net debt Q1-20
(7.8)
(9.0)
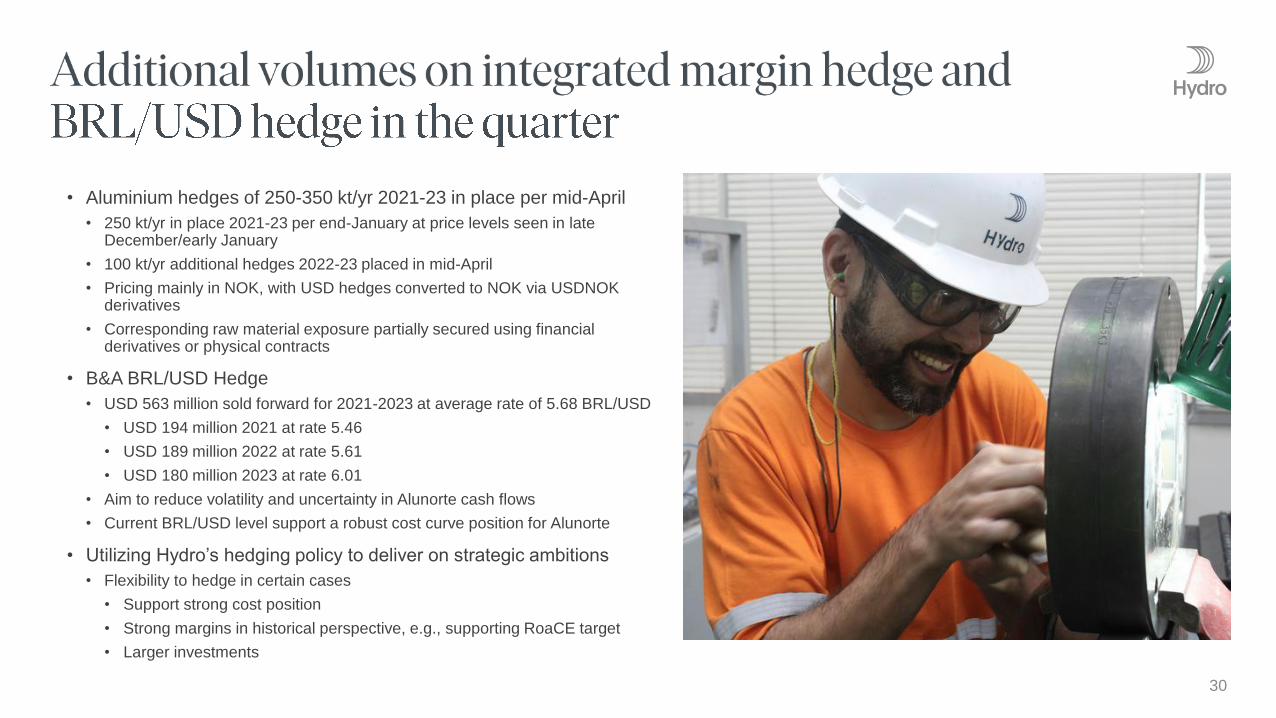
• Aluminium hedges of 250-350 kt/yr 2021-23 in place per mid-April
• 250 kt/yr in place 2021-23 per end-January at price levels seen in late December/early January
• 100 kt/yr additional hedges 2022-23 placed in mid-April
• Pricing mainly in NOK, with USD hedges converted to NOK via USDNOK derivatives
• Corresponding raw material exposure partially secured using financial derivatives or physical contracts
• B&A BRL/USD Hedge
• USD 563 million sold forward for 2021-2023 at average rate of 5.68 BRL/USD
• USD 194 million 2021 at rate 5.46
• USD 189 million 2022 at rate 5.61
• USD 180 million 2023 at rate 6.01
• Aim to reduce volatility and uncertainty in Alunorte cash flows
• Current BRL/USD level support a robust cost curve position for Alunorte
• Utilizing Hydro’s hedging policy to deliver on strategic ambitions
• Flexibility to hedge in certain cases
• Support strong cost position
• Strong margins in historical perspective, e.g., supporting RoaCE target
• Larger investments
30

Certain statements included in this announcement contain forward-looking information, including, without limitation, information relating to (a) forecasts, projections and estimates, (b) statements of Hydro management concerning plans, objectives and strategies, such as planned expansions, investments, divestments, curtailments or other projects, (c) targeted production volumes and costs, capacities or rates, start-up costs, cost reductions and profit objectives, (d) various expectations about future developments in Hydro’s markets, particularly prices, supply and demand and competition, (e) results of operations, (f) margins, (g) growth rates, (h) risk management, and (i) qualified statements such as “expected”, “scheduled”, “targeted”, “planned”, “proposed”, “intended” or similar
Although we believe that the expectations reflected in such forward-looking statements are reasonable, these forward-looking statements are based on a number of assumptions and forecasts that, by their nature, involve risk and uncertainty. Various factors could cause our actual results to differ materially from those projected in a forward-looking statement or affect the extent to which a particular projection is realized. Factors that could cause these differences include, but are not limited to: our continued ability to reposition and restructure our upstream and downstream businesses; changes in availability and cost of energy and raw materials; global supply and demand for aluminium and aluminium products; world economic growth, including rates of inflation and industrial production; changes in the relative value of currencies and the value of commodity contracts; trends in Hydro’s key markets and competition; and legislative, regulatory and political factors.
No assurance can be given that such expectations will prove to have been correct. Hydro disclaims any obligation to update or revise any forward-looking statements, whether as a result of new information, future events or otherwise.
31


1) Consistent with previous target to maintain funds from operations / Adjusted net debt incl EAI > 40% over the cycle
Clear principles for
capital allocation
• Capital allocation in line with
strategic priorities and return
requirements by business area
• Competitive and affordable
sustaining capex
• Strict prioritization, continuous
review and reallocation
Robust shareholder payout
• 50% payout ratio of Net Income
over the cycle
• Dividend floor of 1.25 NOK/share
• Supplementary share buybacks or
extraordinary dividends
Financial strength and flexibility
• Maintain investment grade credit rating
• Currently BBB (S&P), Baa3 (Moody’s)
• Balance sheet ratio
• Target to maintain Adjusted net debt
excl EAI / uEBITDA< 2x over the
cycle 1)
• Strong liquidity
Roadmap to
profitability targets
• URoaCE > 10% over the cycle for
Hydro group
• URoaCE> CoC for business areas
over the cycle
• Differentiated return requirements
by and within business areas
33
Financial ambitions and targets

Evaluate funds available for allocation
Projected funds from operations in several market scenarios
Strong balance sheet
Dividend commitments to shareholders
Excess cash flow
Key considerations affecting growth capital availability
Net operating capitalExtraordinary dividends
Share buybacks
Portfolio review and
divestments
Strategy
PlanningExecution
Review
Sustaining capex
License to operate (HSE, CSR, compliance)
External and internal benchmarking
Affordability
Organic and inorganic growth
Aligned with strategic priorities for each business area
Stringent return requirements by and within business area
Other criteria - risk, market outlook, historical profitability, sustainability impact
34
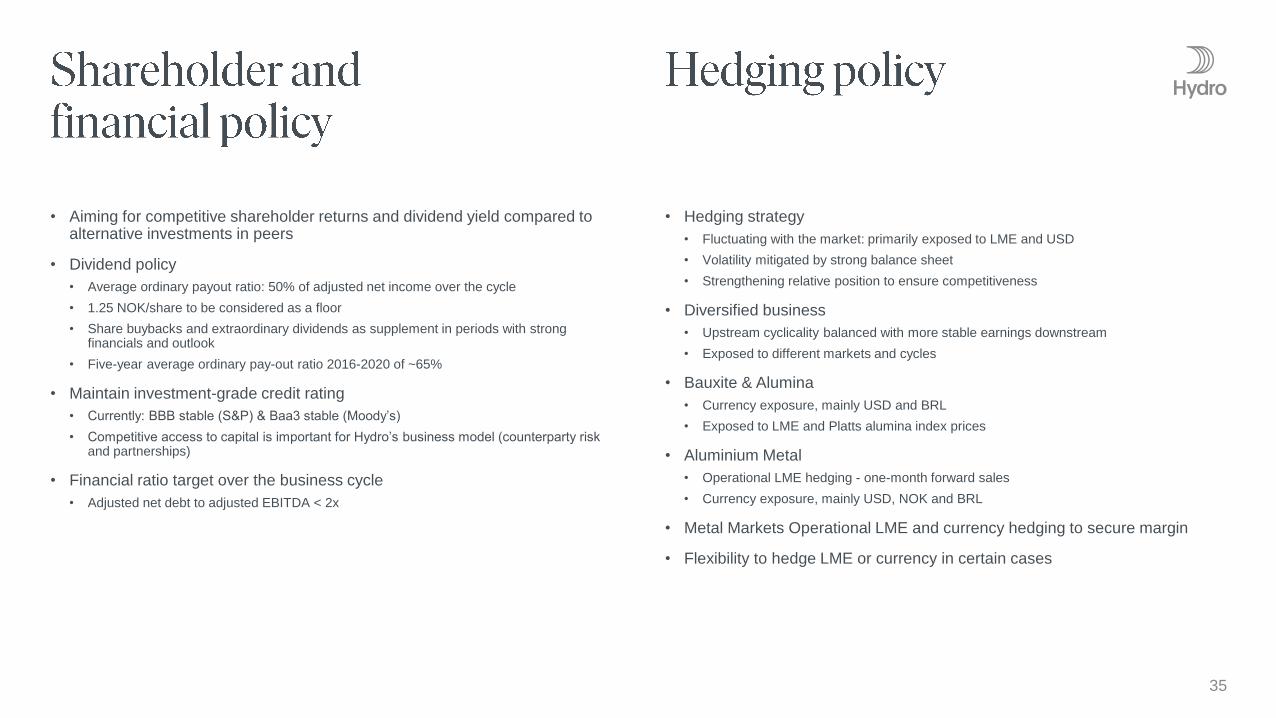
• Aiming for competitive shareholder returns and dividend yield compared to alternative investments in peers
• Dividend policy
• Average ordinary payout ratio: 50% of adjusted net income over the cycle
• 1.25 NOK/share to be considered as a floor
• Share buybacks and extraordinary dividends as supplement in periods with strong financials and outlook
• Five-year average ordinary pay-out ratio 2016-2020 of ~65%
• Maintain investment-grade credit rating
• Currently: BBB stable (S&P) & Baa3 stable (Moody’s)
• Competitive access to capital is important for Hydro’s business model (counterparty risk and partnerships)
• Financial ratio target over the business cycle
• Adjusted net debt to adjusted EBITDA < 2x
• Hedging strategy
• Fluctuating with the market: primarily exposed to LME and USD
• Volatility mitigated by strong balance sheet
• Strengthening relative position to ensure competitiveness
• Diversified business
• Upstream cyclicality balanced with more stable earnings downstream
• Exposed to different markets and cycles
• Bauxite & Alumina
• Currency exposure, mainly USD and BRL
• Exposed to LME and Platts alumina index prices
• Aluminium Metal
• Operational LME hedging - one-month forward sales
• Currency exposure, mainly USD, NOK and BRL
• Metal Markets Operational LME and currency hedging to secure margin
• Flexibility to hedge LME or currency in certain cases
35
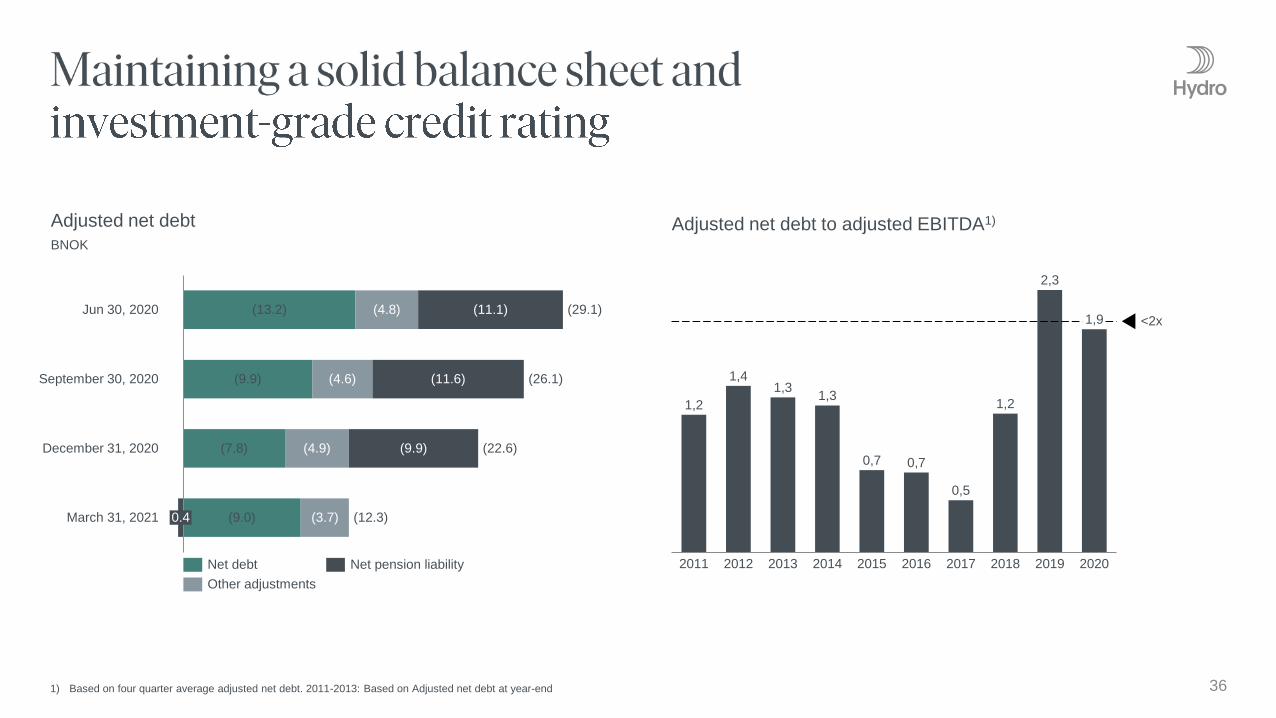
Adjusted net debt to adjusted EBITDA1)
361) Based on four quarter average adjusted net debt. 2011-2013: Based on Adjusted net debt at year-end
Adjusted net debt
BNOK
1,2
1,41,3
1,3
0,7 0,7
0,5
1,2
2,3
1,9
2012 20172011 2013 2014 2015 2016 2018 2019 2020
<2x
September 30, 2020
Jun 30, 2020
(4.6)
(29.1)
December 31, 2020 (22.6)
0.4
(4.9)
March 31, 2021
(26.1)
(12.3)
(11.1)(4.8)(13.2)
(11.6)(9.9)
(9.9)
(3.7)
(7.8)
(9.0)
Net debt
Other adjustments
Net pension liability
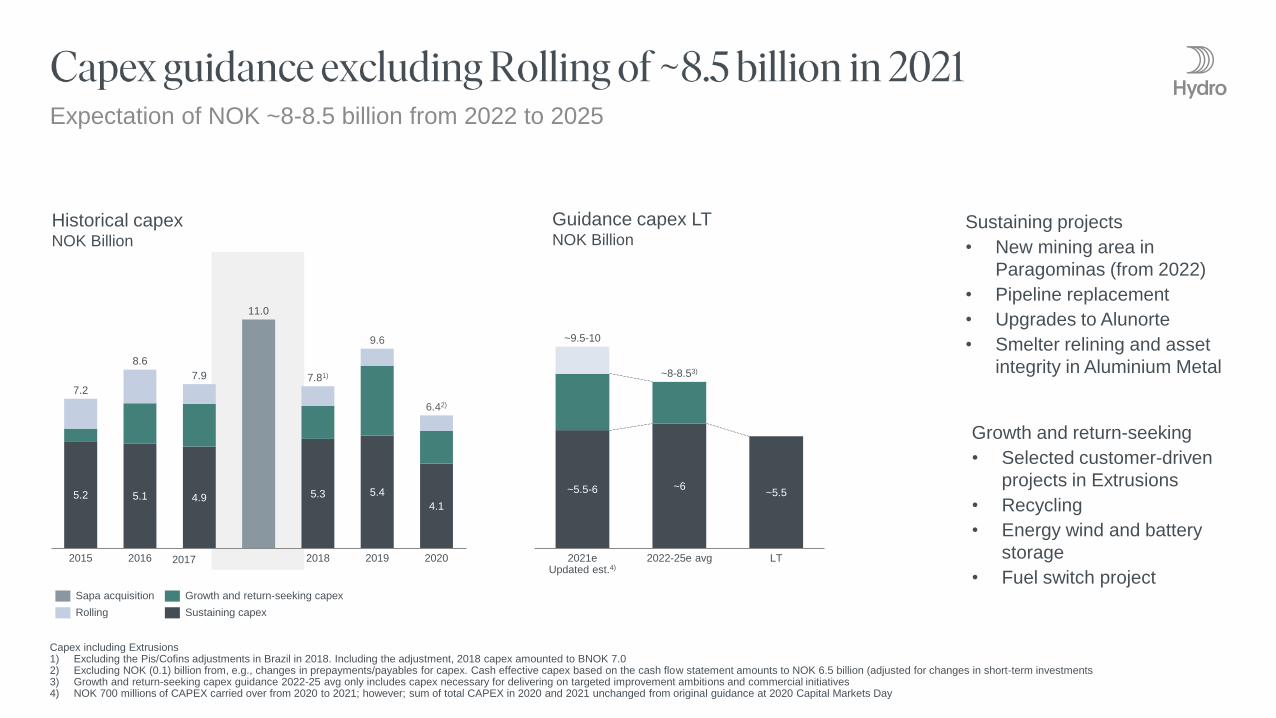
Expectation of NOK ~8-8.5 billion from 2022 to 2025
20192015 2016 2018
7.2
5.2
7.81)
2020
8.6
7.9
9.6
6.42)
5.1 4.9
11.0
5.3 5.4
4.1
Sapa acquisition
Rolling Sustaining capex
Growth and return-seeking capex
Historical capexNOK Billion
2017
~5.5-6 ~6
2021eUpdated est.4)
LT2022-25e avg
~5.5
~8-8.53)
~9.5-10
Guidance capex LT NOK Billion
Sustaining projects
• New mining area in
Paragominas (from 2022)
• Pipeline replacement
• Upgrades to Alunorte
• Smelter relining and asset
integrity in Aluminium Metal
Growth and return-seeking
• Selected customer-driven
projects in Extrusions
• Recycling
• Energy wind and battery
storage
• Fuel switch project
Capex including Extrusions1) Excluding the Pis/Cofins adjustments in Brazil in 2018. Including the adjustment, 2018 capex amounted to BNOK 7.02) Excluding NOK (0.1) billion from, e.g., changes in prepayments/payables for capex. Cash effective capex based on the cash flow statement amounts to NOK 6.5 billion (adjusted for changes in short-term investments3) Growth and return-seeking capex guidance 2022-25 avg only includes capex necessary for delivering on targeted improvement ambitions and commercial initiatives4) NOK 700 millions of CAPEX carried over from 2020 to 2021; however; sum of total CAPEX in 2020 and 2021 unchanged from original guidance at 2020 Capital Markets Day

310630
(240) (330) (130) (100) (40)
Fuel oil PitchCaustic
soda
Standard
ingot
premium1)
Realized
PAX
Pet coke Coal
• Annual adjusted sensitivities based on normal annual business volumes, excluding Hydro Rolling. LME USD 1990 per mt, standard ingot premium 165 USD/mt, PAX 300 USD/mt, fuel oil USD 610 per mt, petroleum coke USD 315 per mt, pitch 570 EUR/t, caustic soda USD 270 per mt, coal USD 65 per mt, USD/NOK 8.53, BRL/NOK 1.56, EUR/NOK 10.26
• Aluminium price sensitivity is net of aluminium price indexed costs and excluding unrealized effectsrelated to operational hedging
• BRL sensitivity calculated on a long-term basis with fuel oil assumed in USD. In the short-term, fuel oilis BRL-denominated
• Excludes effects of priced contracts in currencies different from adjusted currency exposure(transaction exposure)
• Currency sensitivity on financial items includes effects from intercompany positions
• 2021 Platts alumina index (PAX) exposure used
• U NI sensitivity calculated as UEBITDA sensitivity after 30% tax
381) Europe duty paid
Other commodity prices, sensitivity +10%
Aluminium price sensitivity +10% Currency sensitivities +10%NOK million
NOK million
Sustainable effect:
2 980
2 090
Adjusted Net IncomeUEBITDA
NOK million USD BRL EUR
UEBITDA 2 880 (500) ~0
One-off reevaluation effect:
Financial items (330) 610 (3 760)
NOK million USD BRL EUR
UEBITDA 680 (270) -
39
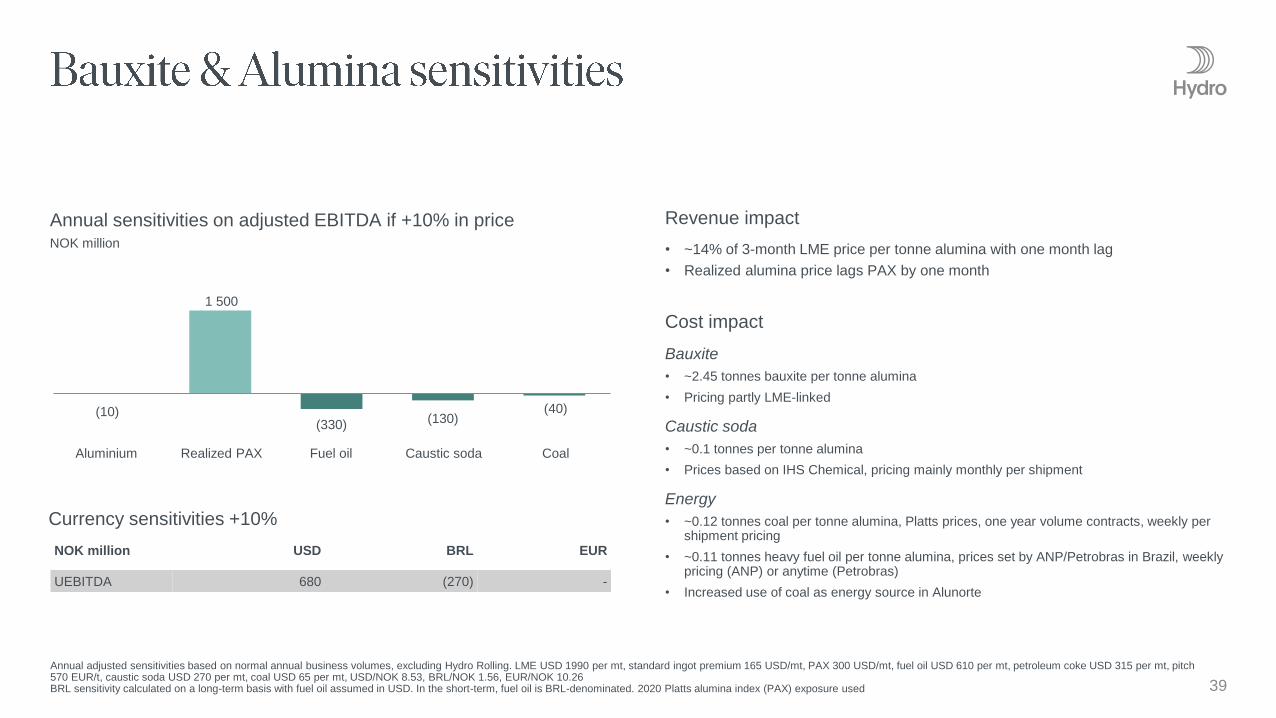
Annual adjusted sensitivities based on normal annual business volumes, excluding Hydro Rolling. LME USD 1990 per mt, standard ingot premium 165 USD/mt, PAX 300 USD/mt, fuel oil USD 610 per mt, petroleum coke USD 315 per mt, pitch570 EUR/t, caustic soda USD 270 per mt, coal USD 65 per mt, USD/NOK 8.53, BRL/NOK 1.56, EUR/NOK 10.26 BRL sensitivity calculated on a long-term basis with fuel oil assumed in USD. In the short-term, fuel oil is BRL-denominated. 2020 Platts alumina index (PAX) exposure used
Annual sensitivities on adjusted EBITDA if +10% in priceNOK million
Currency sensitivities +10%
(10)
1 500
(330) (130)(40)
Caustic soda CoalFuel oilRealized PAXAluminium
Revenue impact
• ~14% of 3-month LME price per tonne alumina with one month lag
• Realized alumina price lags PAX by one month
Cost impact
Bauxite
• ~2.45 tonnes bauxite per tonne alumina
• Pricing partly LME-linked
Caustic soda
• ~0.1 tonnes per tonne alumina
• Prices based on IHS Chemical, pricing mainly monthly per shipment
Energy
• ~0.12 tonnes coal per tonne alumina, Platts prices, one year volume contracts, weekly per shipment pricing
• ~0.11 tonnes heavy fuel oil per tonne alumina, prices set by ANP/Petrobras in Brazil, weeklypricing (ANP) or anytime (Petrobras)
• Increased use of coal as energy source in Alunorte

NOK million USD BRL EUR
UEBITDA 2 080 (230) (540)
40Annual adjusted sensitivities based on normal annual business volumes, excluding Hydro Rolling. LME USD 1990 per mt, standard ingot premium 165 USD/mt, PAX 300 USD/mt, fuel oil USD 610 per mt, petroleum coke USD 315 per mt, pitch570 EUR/t, caustic soda USD 270 per mt, coal USD 65 per mt, USD/NOK 8.53, BRL/NOK 1.56, EUR/NOK 10.26
Annual sensitivities on adjusted EBITDA if +10% in priceNOK million
Currency sensitivities +10%
2 990
310
(870)
(240) (100)
Pet coke PitchRealized PAXStandard ingot
premium
Aluminium
Revenue impact
• Realized price lags LME spot by ~1-2 months
• Realized premium lags market premium by ~2-3 months
Cost impact
Alumina
• ~1.9 tonnes per tonne aluminium
• ~ 2-3 months lag
• Mainly priced on Platts index
Carbon
• ~0.40 tonnes petroleum coke per tonne aluminium, Pace Jacobs Consultancy, 2-3 yearvolume contracts, quarterly or half yearly pricing
• ~0.08 tonnes pitch per tonne aluminium, CRU, 2-3 year volume contracts, quarterly pricing
Power
• 14.0 MWh per tonne aluminium
• Long-term power contracts with indexations

NOK million (+=loss/()=gain) Q1 2020 Q2 2020 Q3 2020 Q4 2020 Q1 2021 Year 2020
Alunorte Agreements – provision Hydro Bauxite & Alumina 129 - - - - 129
Unrealized derivative effects on raw material contracts Hydro Bauxite & Alumina - - - 5 - 5
Unrealized effects on physical raw material contracts Hydro Bauxite & Alumina - - - - (27) -
Total impact Hydro Bauxite & Alumina 129 - - 5 (27) 134
Unrealized derivative effects on LME related contracts Hydro Aluminium Metal (64) 200 (198) (99) 1 256 (160)
Unrealized effects on power contracts Hydro Aluminium Metal (147) 48 165 153 34 218
Net foreign exchange (gain)/loss Hydro Aluminium Metal - - - - (35) -
Other effects Hydro Aluminium Metal - (12) (30) (90) - (131)
Total impact Hydro Aluminium Metal (211) 236 (63) (36) 1 254 (74)
Unrealized derivative effects on LME related contracts Hydro Metal Markets (224) 340 (187) 32 24 (38)
Total impact Hydro Metal Markets (224) 340 (187) 32 24 (38)
Unrealized derivative effects on LME related contracts Hydro Extrusions 114 13 (201) (57) (98) (129)
Significant rationalization charges and closure costs Hydro Extrusions 4 134 (20) 70 - 187
Transaction related effects Hydro Extrusions (57) 6 - 14 - (37)
Other effects Hydro Extrusions - - - 101 - 101
Total impact Hydro Extrusions 61 154 (220) 129 (98) 123
Unrealized derivative effects on power contracts Hydro Energy (17) 33 14 (5) (19) 25
(Gains) / losses on divestments Hydro Energy - - - (5 308) (45) (5 308)
Net foreign exchange (gain)/loss Hydro Energy - - - - 4 -
Total impact Hydro Energy (17) 33 14 (5 313) (59) (5 283)
Unrealized derivative effects on power contracts Other and eliminations (19) (19) (19) (19) - (76)
Unrealized derivative effects on LME related contracts Other and eliminations (16) 18 (7) (2) 1 (8)
(Gains) / losses on divestments Other and eliminations - - (65) 3 - (62)
Net foreign exchange (gain)/loss Other and eliminations - - - - 9 -
Other effects Other and eliminations - - (4) 4 - -
Total impact Other and eliminations (35) (1) (95) (15) 10 (146)
Adjusting items to EBITDA Hydro (297) 762 (551) (5 198) 1 103 (5 284)
Impairment charges Hydro Aluminium Metal - 504 - - - 504
Impairment charges Hydro Extrusions 12 1 483 77 52 122 1 625
Impairment charges Other and eliminations - (161) - - - (161)
Depreciation Hydro Aluminium Metal - - - - 101 -
Adjusting items to EBIT Hydro (285) 2 588 (474) (5 146) 1 326 (3 316)
Net foreign exchange (gain)/loss Hydro 4 184 (563) 1 528 (1 349) (653) 3 800
Other finance (income) expense Hydro - - - (128) - (128)
Adjusting items to income (loss) before tax Hydro 3 899 2 025 1 054 (6 624) 673 355
Calculated income tax effect Hydro (1 322) (221) (336) 486 (106) (1 393)
Adjusting items to net income (loss) Hydro 2 577 1 805 718 (6 138) 567 (1 038) 41

Adjusted EBIT
Adjusted EBITDA
42
NOK million Q1 2020 Q2 2020 Q3 2020 Q4 2020 Q1 2021 Year 2020
Hydro Bauxite & Alumina 535 1 047 108 116 556 1 806
Hydro Aluminium Metal 573 (37) (156) 844 1 185 1 225
Hydro Metal Markets 261 21 198 248 43 728
Hydro Extrusions 702 89 894 511 1 244 2 196
Hydro Energy 437 53 132 352 792 974
Other and Eliminations (565) (173) 242 (393) (261) (889)
Total 1 943 1 000 1 419 1 678 3 559 6 040
NOK million Q1 2020 Q2 2020 Q3 2020 Q4 2020 Q1 2021 Year 2020
Hydro Bauxite & Alumina 1 102 1 550 578 587 999 3 817
Hydro Aluminium Metal 1 197 560 404 1 432 1 754 3 593
Hydro Metal Markets 296 58 233 287 78 875
Hydro Extrusions 1 242 649 1 412 1 044 1 744 4 348
Hydro Energy 505 122 200 419 841 1 245
Other and Eliminations (532) (144) 272 (366) (234) (771)
Total 3 810 2 794 3 100 3 403 5 182 13 106

NOK million Q1 2020 Q2 2020 Q3 2020 Q4 2020 Q1 2021 Year 2020
Hydro Bauxite & Alumina 406 1 047 108 111 583 1 672
Hydro Aluminium Metal 784 (777) (93) 880 (171) 794
Hydro Metal Markets 485 (319) 385 216 19 766
Hydro Extrusions 628 (1 548) 1 038 331 1 220 449
Hydro Energy 454 20 118 5 665 851 6 258
Other and Eliminations (530) (11) 337 (379) (271) (582)
Total 2 228 (1 588) 1 893 6 824 2 233 9 356
NOK million Q1 2020 Q2 2020 Q3 2020 Q4 2020 Q1 2021 Year 2020
Hydro Bauxite & Alumina 973 1 550 578 582 1 026 3 683
Hydro Aluminium Metal 1 408 324 467 1 468 500 3 667
Hydro Metal Markets 521 (282) 420 254 55 913
Hydro Extrusions 1 181 496 1 633 915 1 842 4 225
Hydro Energy 523 88 186 5 732 900 6 529
Other and Eliminations (497) (144) 367 (351) (244) (625)
Total 4 107 2 032 3 651 8 601 4 079 18 390
43
EBIT
EBITDA

44
Total revenue
External revenue
NOK million Q1 2020 Q2 2020 Q3 2020 Q4 2020 Q1 2021 Year 2020
Hydro Bauxite & Alumina 6 029 6 173 5 334 5 503 6 026 23 039
Hydro Aluminium Metal 9 753 7 720 8 228 8 702 8 953 34 404
Hydro Metal Markets 12 912 10 485 11 290 12 178 13 624 46 865
Hydro Extrusions 15 140 11 593 13 372 14 390 16 334 54 496
Hydro Energy 2 115 1 423 1 539 1 890 2 343 6 967
Other and Eliminations (14 340) (12 051) (12 247) (12 842) (15 327) (51 479)
Total 31 609 25 343 27 516 29 823 31 951 114 291
NOK million Q1 2020 Q2 2020 Q3 2020 Q4 2020 Q1 2021 Year 2020
Hydro Bauxite & Alumina 3 249 3 792 3 167 3 173 3 546 13 381
Hydro Aluminium Metal 1 968 1 393 1 632 2 046 762 7 039
Hydro Metal Markets 10 353 8 510 9 242 9 788 10 789 37 893
Hydro Extrusions 15 215 11 581 13 344 14 401 16 203 54 542
Hydro Energy 633 47 137 443 787 1 261
Other and Eliminations 191 20 (7) (29) (136) 175
Total 31 609 25 343 27 516 29 823 31 951 114 291

45
Internal revenue
Share of profit /(loss) in equity accounted investments
NOK million Q1 2020 Q2 2020 Q3 2020 Q4 2020 Q1 2021 Year 2020
Hydro Bauxite & Alumina 2 780 2 380 2 168 2 330 2 479 9 658
Hydro Aluminium Metal 7 785 6 328 6 596 6 656 8 191 27 365
Hydro Metal Markets 2 559 1 975 2 047 2 390 2 835 8 972
Hydro Extrusions (76) 12 28 (11) 131 (47)
Hydro Energy 1 482 1 376 1 402 1 447 1 556 5 706
Other and Eliminations (14 530) (12 070) (12 241) (12 813) (15 191) (51 654)
Total - - - - - -
NOK million Q1 2020 Q2 2020 Q3 2020 Q4 2020 Q1 2021 Year 2020
Hydro Bauxite & Alumina - - - - - -
Hydro Aluminium Metal 40 26 6 185 147 256
Hydro Metal Markets - - - - - -
Hydro Extrusions - - - - - -
Hydro Energy (12) (5) (16) (6) (23) (39)
Other and Eliminations (31) 28 34 (24) 1 7
Total (4) 48 24 155 125 223

46
1) RoaCE at business area level is calculated using 25% tax rate (30% tax rate applied for years prior to 2017). For Hydro Energy, 80% tax rate is used for 2020 and 2019, 70% tax rate is used for 2018, 65% for 2017, 60% for 2016 and 55% for prior years.2) Hydro Extrusions reflected as 50% equity accounted investment Q1-Q3 2017 and fully consolidated from Q4 20173) Hydro Energy reported RoaCE for 2020 higher than previous years due to the Lyse transaction
Return on average capital employed 1) (RoaCE)
Capital employed – upstream focus
NOK million Mar 31, 2021
Hydro Bauxite & Alumina 18 998
Hydro Aluminium Metal 30 798
Hydro Metal Markets 2 821
Hydro Extrusions 23 387
Hydro Energy 7 862
Other and Eliminations (1 966)
Total 81 899
Reported RoaCE Adjusted RoaCE
2020 2019 2018 2017 2016 2015 2014 2020 2019 2018 2017 2016 2015 2014
Hydro Bauxite & Alumina 5.4% 1.9% 4.6% 8.5% 2.7% 5.3% (0.1)% 5.9% 2.5% 6.0% 8.5% 2.8% 5.3% (0.1)%
Hydro Aluminium Metal 1.9% (3.9%) 5.6% 11.8% 5.2% 10.7% 10.4% 2.9% (2.6%) 4.7% 12.6% 5.2% 11.0% 10.4%
Hydro Metal Markets 22.5% 20.7% 25.1% 18.6% 19.6% 5.4% 21.9% 21.4% 27.3% 19.4% 20.9% 15.9% 11.4% 19.4%
Hydro Extrusions 2) 1.3% 3.8% 5.3% 13.4% 6.2% 5.7% 7.2% 6.6%
Hydro Energy 3) 249.5% 13.4% 18.8% 17.5% 18.1% 17.2% 17.4% 8.7% 12.9% 18.8% 17.5% 18.1% 17.3% 17.4%
Hydro Group 7.5% (0.9%) 6.0% 11.2% 6.5% 7.5% 4.9% 3.7% 1.3% 6.6% 9.6% 5.1% 9.2% 5.2%
Graph excludes BNOK (2.0) in capital employed in Other and Eliminations
Bauxite & Alumina23%
Aluminium Metal37%Metal Markets 3%
Extrusions 28%
Energy 9%

NOK million Q1 2020 Q2 2020 Q3 2020 Q4 2020 Q1 2021 Year 2020
Hydro Bauxite & Alumina 567 503 470 472 443 2 011
Hydro Aluminium Metal 655 1 130 589 618 694 2 992
Hydro Metal Markets 36 37 35 40 36 149
Hydro Extrusions 554 2 046 597 587 628 3 785
Hydro Energy 65 65 64 66 49 260
Other and Eliminations 32 (133) 30 27 27 (43)
Total 1 909 3 649 1 786 1 810 1 876 9 153
47
Depreciation, amortization and impairment
Indicative depreciation currency exposure by business area Depreciation by business area 2020, 9.2 BNOK
Percent USD EUR BRL NOK & Other
Hydro Bauxite & Alumina 100%
Hydro Aluminium Metal 30% 5% 15% 50%
Hydro Metal Markets 35% 50% 15%
Hydro Extrusions 50% 35% 15%
Hydro Energy 100%
Other and Eliminations 5% 30% 5% 60%
Other and Eliminations
Hydro Energy
Hydro Bauxite & Alumina
Hydro Aluminium Metal
Hydro Metal Markets
Hydro Extrusions
22%
33%
2%
41%
3%

48
NOK million Q1 2020 Q2 2020 Q3 2020 Q4 2020 Q1 2021 Year 2020
Income (loss) from continuing operations (1 743) (1 487) (111) 7 226 1 880 3 886
Net income (loss) (2 025) (1 471) (221) 5 377 1 500 1 660
Adjusted net income (loss) from continuing operations 834 318 607 1 089 2 448 2 848
Earnings per share from continuing operations (0.75) (0.62) (0.05) 3.40 0.89 1.99
Earnings per share attributable to Hydro shareholders (0.88) (0.61) (0.11) 2.50 0.70 0.90
Adjusted earnings per share from continuing operations 0.39 0.17 0.28 0.47 1.15 1.32
NOK million Q1 2021 Q1 2020 Q4 2020 Year 2020
Revenue
Share of the profit (loss) in equity accounted investments
Other income, net
31 951
125
377
31 609
(4)
426
29 823
155
5 683
114 291
223
7 414
Total revenue and income 32 454 32 031 35 661 121 928
Raw material and energy expense
Employee benefit expense
Depreciation and amortization expense
Impairment of non-current assets
Other expenses
19 126
5 012
1 754
122
4 207
18 701
5 151
1 896
12
4 042
17 875
4 796
1 747
63
4 356
68 953
19 123
7 175
1 979
15 343
Earnings before financial items and tax (EBIT) 2 233 2 228 6 824 9 356
Finance income
Finance expense
39
385
34
(4 462)
101
1 148
290
(4 842)
Income (loss) before tax
Income taxes
2 657
(776)
(2 200)
457
8 072
(846)
4 804
(918)
Income (loss) from continuing operations 1 880 (1 743) 7 226 3 886
Loss from discontinued operations (380) (282) (1 849) (2 226)
Net income (loss) 1 500 (2 025) 5 377 1 660
Net income (loss) attributable to non-controlling interests
Net income (loss) attributable to Hydro shareholders
60
1 441
(214)
(1 811)
252
5 125
(185)
1 845
Earnings per share from continuing operations
Earnings per share from discontinued operations
Earnings per share attributable to Hydro shareholders
0.89
(0.19)
0.70
(0.75)
(0.14)
(0.88)
3.40
(0.90)
2.50
1.99
(1.09)
0.90

49
NOK million Mar 31, 2021 Dec 31, 2020 Sep 30, 2020 Jun 30, 2020 Mar 31, 2020
Cash and cash equivalents
Short-term investments
Trade and other receivables
Inventories
Other current financial assets
15 011
4 348
16 795
14 316
328
17 638
4 091
18 364
19 492
470
17 495
5 399
20 268
19 288
553
15 385
5 110
18 916
20 382
687
12 160
1 641
24 539
22 464
1 119
Assets held for sale 17 069 - - - -
Property, plant and equipment
Intangible assets
Investments accounted for using the equity method
Prepaid pension
Other non-current assets
53 890
8 796
17 227
7 812
6 634
64 245
9 357
17 288
7 064
6 398
68 657
9 903
12 048
5 959
6 295
70 478
10 262
12 619
5 603
6 704
77 909
12 649
13 845
5 242
7 663
Total assets 162 228 164 408 165 865 166 145 179 232
Bank loans and other interest-bearing short-term debt
Trade and other payables
Other current liabilities
4 701
17 462
4 036
4 748
18 948
5 352
6 915
17 865
3 660
7 094
16 693
3 721
7 728
21 558
4 771
Liabilities included in disposal group 12 266 - - - -
Long-term debt
Provisions
Pension liabilities
Deferred tax liabilities
Other non-current liabilities
23 658
4 132
9 341
3 535
5 393
24 811
5 605
19 167
3 059
5 273
25 873
6 144
19 679
2 620
6 215
26 595
6 283
18 933
2 562
5 401
21 290
6 892
19 893
2 838
7 089
Equity attributable to Hydro shareholders
Non-controlling interests
74 745
2 958
74 279
3 165
73 833
3 062
75 633
3 230
83 213
3 959
Total liabilities and equity 162 228 164 408 165 865 166 145 179 232

50
1) Weighted average of own production and third party contracts, excluding hedge results. The majority of the alumina is sold linked to either the LME prices or alumina index with a one month delay. Sourced alumina volumes have been re-calculated, with Q1 2018being adjusted accordingly
2) Implied alumina cost (based on EBITDA and sales volume) replaces previous apparent alumina cash cost3) Paragominas production, on wet basis4) 40 percent MRN offtake from Vale and 5 percent Hydro share on wet basis5) Operating and financial information includes Hydro's proportionate share of production and sales volumes in equity accounted
investments. Realized prices, premiums and exchange rates exclude equity accounted investments
6) Average realized premium above LME for casthouse sales from Hydro Aluminium Metal7) Including strategic hedges /hedge accounting applied8) Realized LME price minus Adjusted EBITDA margin (incl. Qatalum) per mt primary aluminium produced. Includes net earnings
from primary casthouses9) Realized all-in price minus Adjusted EBITDA margin (incl. Qatalum) per mt primary aluminium sold. Includes net earnings from
primary casthouses10) Total sales replaces previous casthouse sales due to change of definition11) Adjusted EBITDA divided by total revenues
Hydro Bauxite & Alumina Q1 2020 Q2 2020 Q3 2020 Q4 2020 Q1 2021 Year 2020
Alumina production (kmt) 1 531 1 442 1 074 1 410 1 540 5 457
Sourced alumina (kmt) 664 667 940 783 698 3 053
Total alumina sales (kmt) 2 140 2 243 1 990 2 122 2 269 8 495
Realized alumina price (USD) 1) 278 261 260 272 294 268
Implied alumina cost (USD) 2) 226 192 228 241 243 221
Bauxite production (kmt) 3) 2 585 2 332 1 167 2 556 2 813 8 640
Sourced bauxite (kmt) 4) 1 514 1 315 2 051 1 351 1 103 6 231
Adjusted EBITDA margin 11) 18.3% 25.1% 10.8% 10.7% 16.6% 16.6%
Hydro Aluminium Metal 5) Q1 2020 Q2 2020 Q3 2020 Q4 2020 Q1 2021 Year 2020
Realized aluminium price LME, USD/mt 1 758 1 579 1 596 1 792 1 993 1 685
Realized aluminium price LME, NOK/mt7) 16 658 15 689 14 712 16 364 16 999 15 870
Realized premium above LME, USD/mt6) 234 212 211 224 264 220
Realized premium above LME, NOK/mt6)7) 2 212 2 106 1 946 2 042 2 253 2 077
Realized NOK/USD exchange rate 7) 9.47 9.93 9.22 9.13 8.53 9.42
Implied primary cost (USD) 8) 1 450 1 400 1 450 1 425 1 500 1 425
Implied all-in primary cost (USD) 9) 1 700 1 600 1 650 1 650 1825 1 650
Hydro Aluminium Metal production, kmt 528 509 522 532 539 2 091
Casthouse production, kmt 504 478 508 523 534 2 013
Total sales, kmt10) 577 510 548 547 599 2 182
Adjusted EBITDA margin 11) 12.3% 7.2% 4.9% 16.4% 19.6% 10.4%
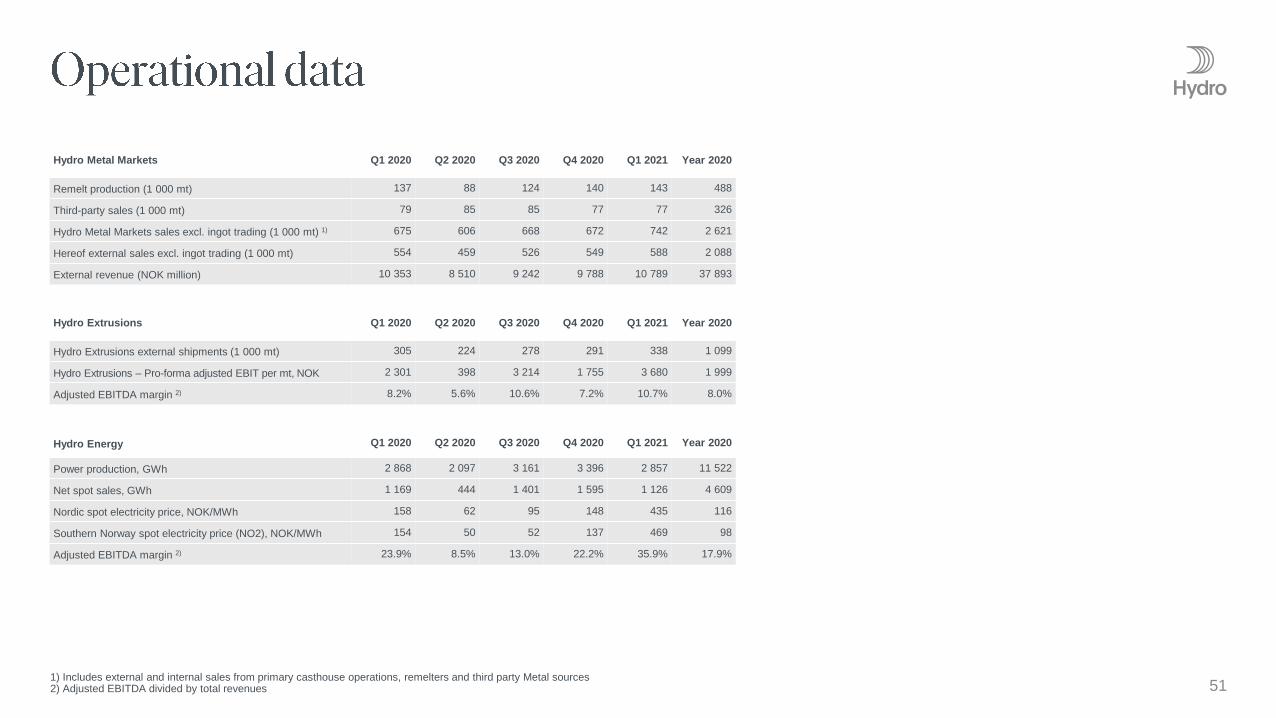
511) Includes external and internal sales from primary casthouse operations, remelters and third party Metal sources2) Adjusted EBITDA divided by total revenues
Hydro Metal Markets Q1 2020 Q2 2020 Q3 2020 Q4 2020 Q1 2021 Year 2020
Remelt production (1 000 mt) 137 88 124 140 143 488
Third-party sales (1 000 mt) 79 85 85 77 77 326
Hydro Metal Markets sales excl. ingot trading (1 000 mt) 1) 675 606 668 672 742 2 621
Hereof external sales excl. ingot trading (1 000 mt) 554 459 526 549 588 2 088
External revenue (NOK million) 10 353 8 510 9 242 9 788 10 789 37 893
Hydro Energy Q1 2020 Q2 2020 Q3 2020 Q4 2020 Q1 2021 Year 2020
Power production, GWh 2 868 2 097 3 161 3 396 2 857 11 522
Net spot sales, GWh 1 169 444 1 401 1 595 1 126 4 609
Nordic spot electricity price, NOK/MWh 158 62 95 148 435 116
Southern Norway spot electricity price (NO2), NOK/MWh 154 50 52 137 469 98
Adjusted EBITDA margin 2) 23.9% 8.5% 13.0% 22.2% 35.9% 17.9%
Hydro Extrusions Q1 2020 Q2 2020 Q3 2020 Q4 2020 Q1 2021 Year 2020
Hydro Extrusions external shipments (1 000 mt) 305 224 278 291 338 1 099
Hydro Extrusions – Pro-forma adjusted EBIT per mt, NOK 2 301 398 3 214 1 755 3 680 1 999
Adjusted EBITDA margin 2) 8.2% 5.6% 10.6% 7.2% 10.7% 8.0%

52
Precision TubingQ1
2020Q2
2020Q3
2020Q4
2020Year 2020
Q12021
Volume (kmt) 29 17 28 33 108 35
Operating revenues (NOKm) 1 487 931 1 360 1 583 5 361 1 718
Adjusted EBITDA (NOKm) 118 139 167 178 602 210
Adjusted EBIT (NOKm) 57 74 113 115 359 157
Building SystemsQ1
2020Q2
2020Q3
2020Q4
2020Year 2020
Q12021
Volume (kmt) 19 17 19 20 74 21
Operating revenues (NOKm) 2 199 1 991 2 032 2 211 8 432 2 315
Adjusted EBITDA (NOKm) 156 206 260 171 792 245
Adjusted EBIT (NOKm) 52 101 155 63 371 149
Extrusion EuropeQ1
2020Q2
2020Q3
2020Q4
2020Year 2020
Q12021
Volume (kmt) 127 94 113 118 451 144
Operating revenues (NOKm) 5 804 4 440 5 068 5 531 20 843 6 529
Adjusted EBITDA (NOKm) 436 142 478 466 1 523 705
Adjusted EBIT (NOKm) 228 (75) 283 266 703 501
Extrusion North AmericaQ1
2020Q2
2020Q3
2020Q4
2020Year 2020
Q12021
Volume (kmt) 130 96 119 121 465 137
Operating revenues (NOKm) 5 885 4 554 5 067 5 288 20 794 5 904
Adjusted EBITDA (NOKm) 599 220 563 310 1 691 663
Adjusted EBIT (NOKm) 435 49 402 151 1 036 518
Other and eliminationsQ1
2020Q2
2020Q3
2020Q4
2020Year 2020
Q12021
Adjusted EBITDA (NOKm) (79) (48) (58) (71) (256) (73)
Adjusted EBIT (NOKm) (82) (52) (61) (74) (269) (77)

53
Next event
Second quarter results
July 23, 2021
For more information see
www.hydro.com/ir
Line Haugetraa
t: +47 41406376
Aud Helen Halvorsen
t: +47 95182741
Christopher Minora
t: +47 90695131


