21
First Quarter Report TSX EQB EQB.PR.C For the three months ended March 31, 2018
1
First QuarterReport
T S X E Q BE Q B . P R . C
For the three months ended March 31, 2018

2
Forward-Looking Statements
Certain forward-looking statements may be made in this presentation, including statements regarding possible future business, financing and growth objectives. Forward-looking statements include, but are not limited to, statements relating to our financial performance objectives, vision and strategic goals, the economic and market review and outlook, the regulatory environment in which we operate, the outlook and priorities for each of our business lines, the risk environment including our liquidity and funding risk, and statements by our Chief Executive Officer and Chief Financial Officer. The forward-looking information contained herein is presented for the purpose of assisting the holders of our securities and financial analysts in understanding our financial position and results of operations as at and for the periods ended on the dates presented, as well as our financial performance objectives, vision and strategic goals, and may not be appropriate for other purposes. Forward-looking statements are typically identified by words such as “believe”, “expect”, “foresee”, “forecast”, “anticipate”, “intend”, “estimate”, “goal”, “plan” and “project” and similar expressions of future or conditional verbs such as “will”, “may”, “should”, “could” or “would”. Investors are cautioned that such forward-looking statements involve risks and uncertainties detailed from time to time in the Company’s periodic reports filed with Canadian regulatory authorities. Many factors could cause actual results, performance or achievements to be materially different from any future results, performance or achievements that may be expressed or implied by such forward-looking statements. Equitable Group Inc. does not undertake to update any forward-looking statements, oral or written, made by itself or on its behalf except in accordance with applicable securities laws.

3
First Quarter Highlights
Solid Quarterly Earnings of $40.2MM
Record Mortgages Under Management of $23.8Bn
2nd Common Share Dividend Increase of 2018
Continued to Enhance and Diverse Our Business
Successfully Expanding Our Role as Canada’s Challenger Bank™
4
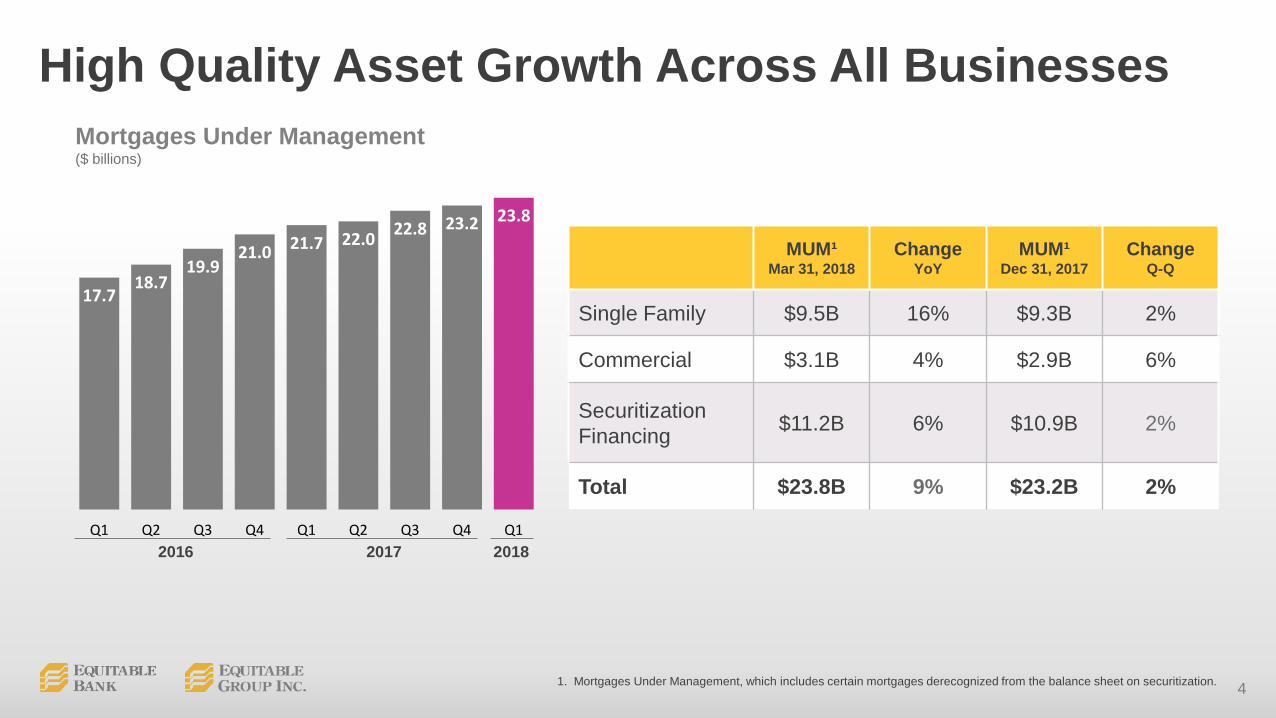
High Quality Asset Growth Across All BusinessesMortgages Under Management($ billions)
17.718.7
19.921.0 21.7 22.0 22.8 23.2 23.8
Q1 Q2 Q3 Q4 Q1 Q2 Q3 Q4 Q12016 2017 2018
MUM¹Mar 31, 2018
ChangeYoY
MUM¹Dec 31, 2017
ChangeQ-Q
Single Family $9.5B 16% $9.3B 2%
Commercial $3.1B 4% $2.9B 6%
Securitization Financing $11.2B 6% $10.9B 2%
Total $23.8B 9% $23.2B 2%
1. Mortgages Under Management, which includes certain mortgages derecognized from the balance sheet on securitization.

5
Alternative Single Family Lending
4.3 4.6 4.95.4 5.7 5.9 6.2 6.4
6.87.2 7.5
7.9 8.2 8.59.1 9.3 9.5
Q1 Q2 Q3 Q4 Q1 Q2 Q3 Q4 Q1 Q2 Q3 Q4 Q1 Q2 Q3 Q4 Q12014 2015 2016 2017 2018
Mortgage Principal($ billions)
Assets Grow Despite Challenging Market Conditions

6
Commercial Lending
4.3 2.3 2.3 2.3 2.3 2.3 2.2 2.2 2.3 2.42.7 2.8
3.02.8 2.9 2.9
3.1
Q1 Q2 Q3 Q4 Q1 Q2 Q3 Q4 Q1 Q2 Q3 Q4 Q1 Q2 Q3 Q4 Q1
Mortgage Principal($ billions)
Record Q1 Originations Reflect Increased Strategic Focus on Commercial
2014 2015 2016 2017 2018
7
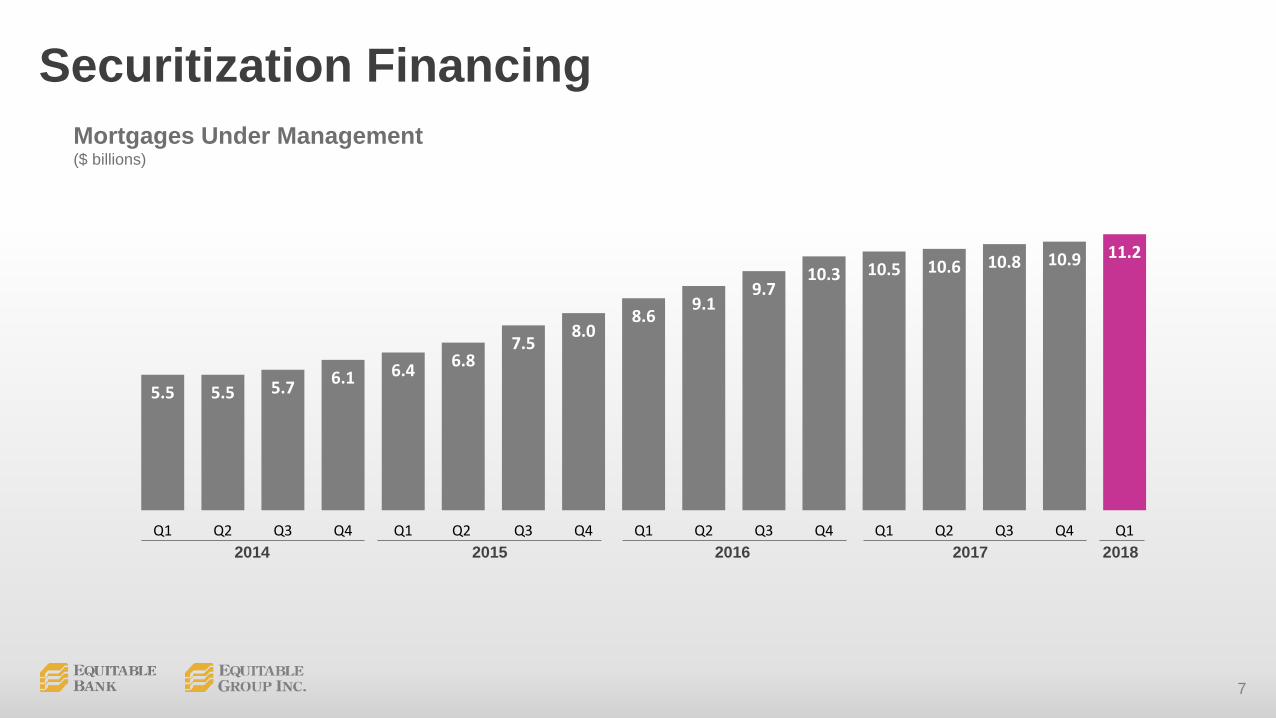
Securitization Financing
5.5 5.5 5.7 6.1 6.4 6.87.5
8.08.6
9.19.7
10.3 10.5 10.6 10.8 10.9 11.2
Q1 Q2 Q3 Q4 Q1 Q2 Q3 Q4 Q1 Q2 Q3 Q4 Q1 Q2 Q3 Q4 Q1
Mortgages Under Management($ billions)
2014 2015 2016 2017 2018
8
0.0%
0.1%
0.2%
0.3%
0.4%
0.5%
2007 2008 2009 2010 2011 2012 2013 2014 2015 2016 2017 Q12018
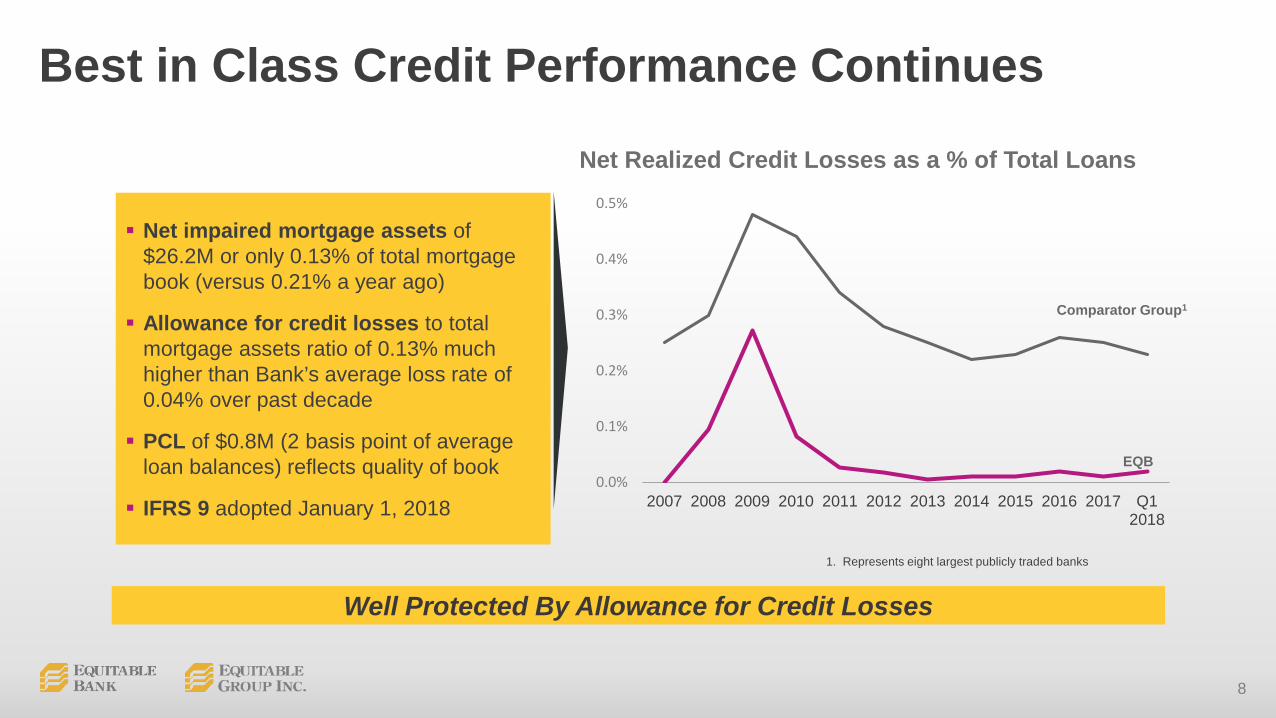
Best in Class Credit Performance Continues
Well Protected By Allowance for Credit Losses
EQB
Comparator Group1
1. Represents eight largest publicly traded banks
Net Realized Credit Losses as a % of Total Loans
Net impaired mortgage assets of$26.2M or only 0.13% of total mortgage book (versus 0.21% a year ago)
Allowance for credit losses to total mortgage assets ratio of 0.13% much higher than Bank’s average loss rate of 0.04% over past decade
PCL of $0.8M (2 basis point of average loan balances) reflects quality of book
IFRS 9 adopted January 1, 2018

9
8.7 9.0 9.29.7 9.9 10.0
10.511.0
11.9
Q1 Q2 Q3 Q4 Q1 Q2 Q3 Q4 Q1
2016 2017 2018
Growing Our Deposit BaseDeposit Principal Balances($ billions)
19% YoY Growth With EQ Bank Ahead 42%
GIC
10
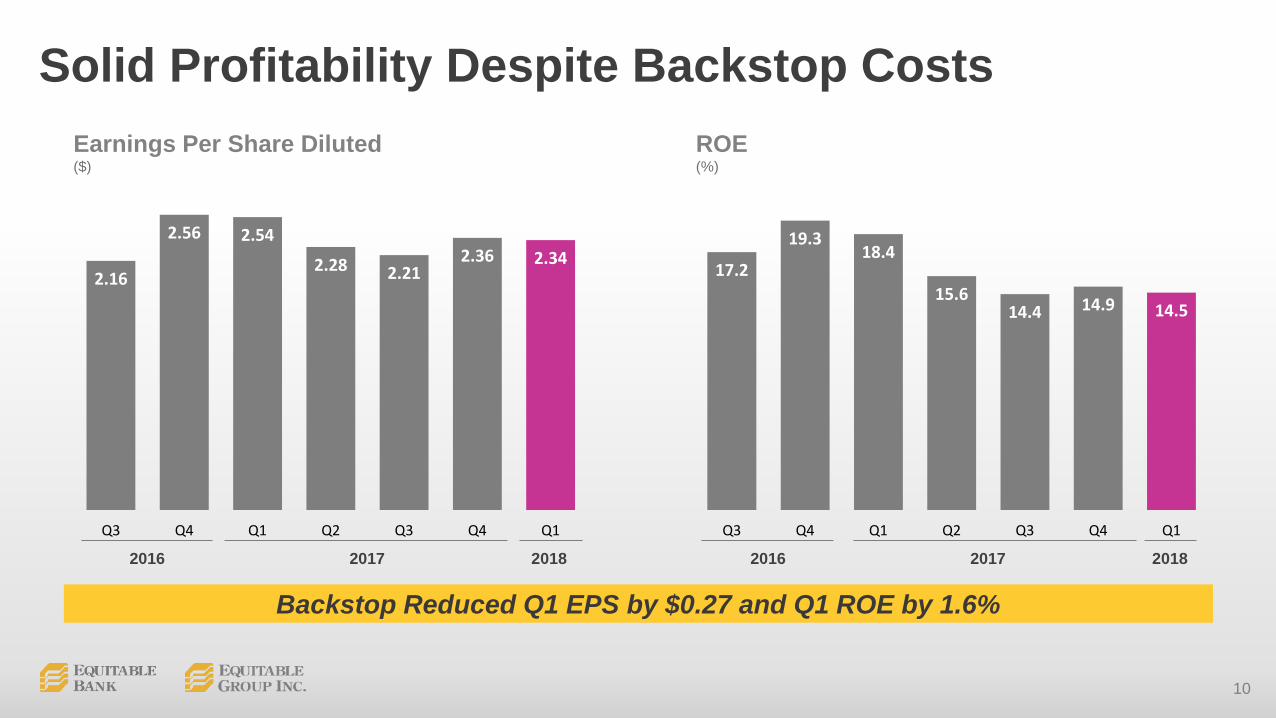
Backstop Reduced Q1 EPS by $0.27 and Q1 ROE by 1.6%
Solid Profitability Despite Backstop Costs
2.16
2.56 2.54
2.28 2.212.36 2.34
Q3 Q4 Q1 Q2 Q3 Q4 Q1
Earnings Per Share Diluted($)
2016 2017 2018
ROE(%)
17.2
19.318.4
15.614.4 14.9 14.5
Q3 Q4 Q1 Q2 Q3 Q4 Q1
2016 2017 2018
11
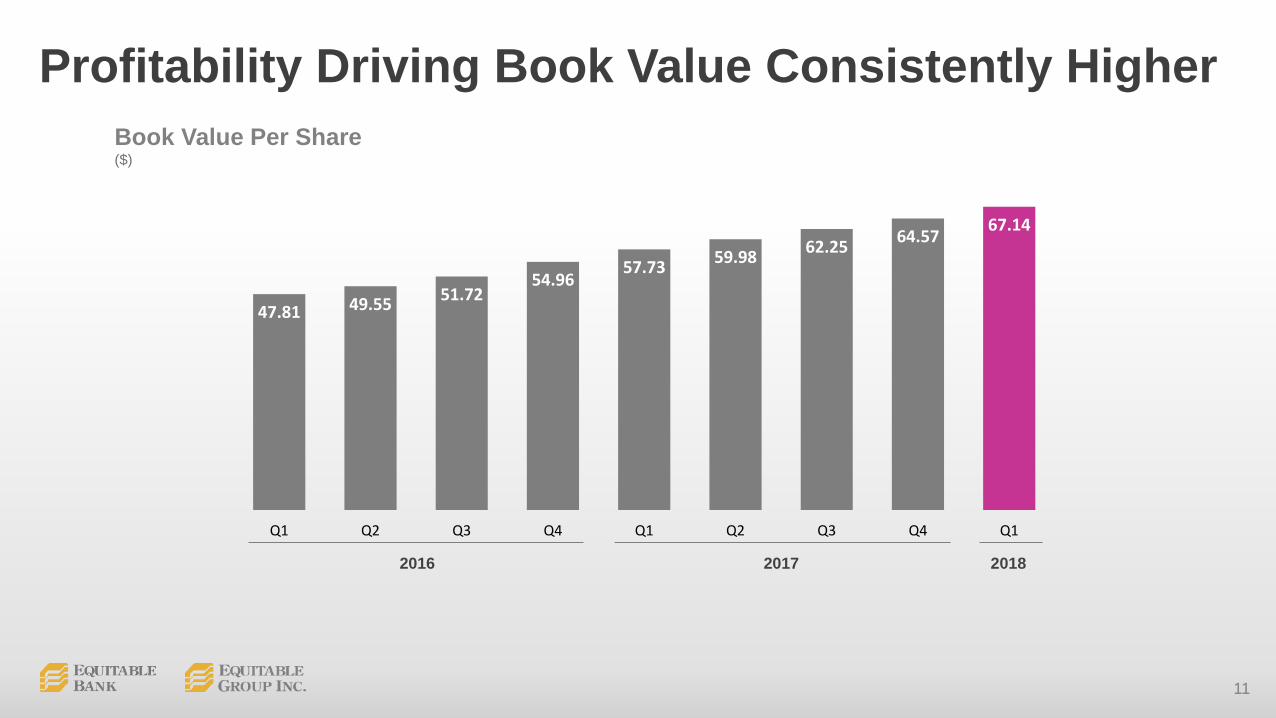
Book Value Per Share ($)
Profitability Driving Book Value Consistently Higher
47.81 49.55 51.7254.96
57.73 59.98 62.25 64.57 67.14
Q1 Q2 Q3 Q4 Q1 Q2 Q3 Q4 Q1
2016 2017 2018
12
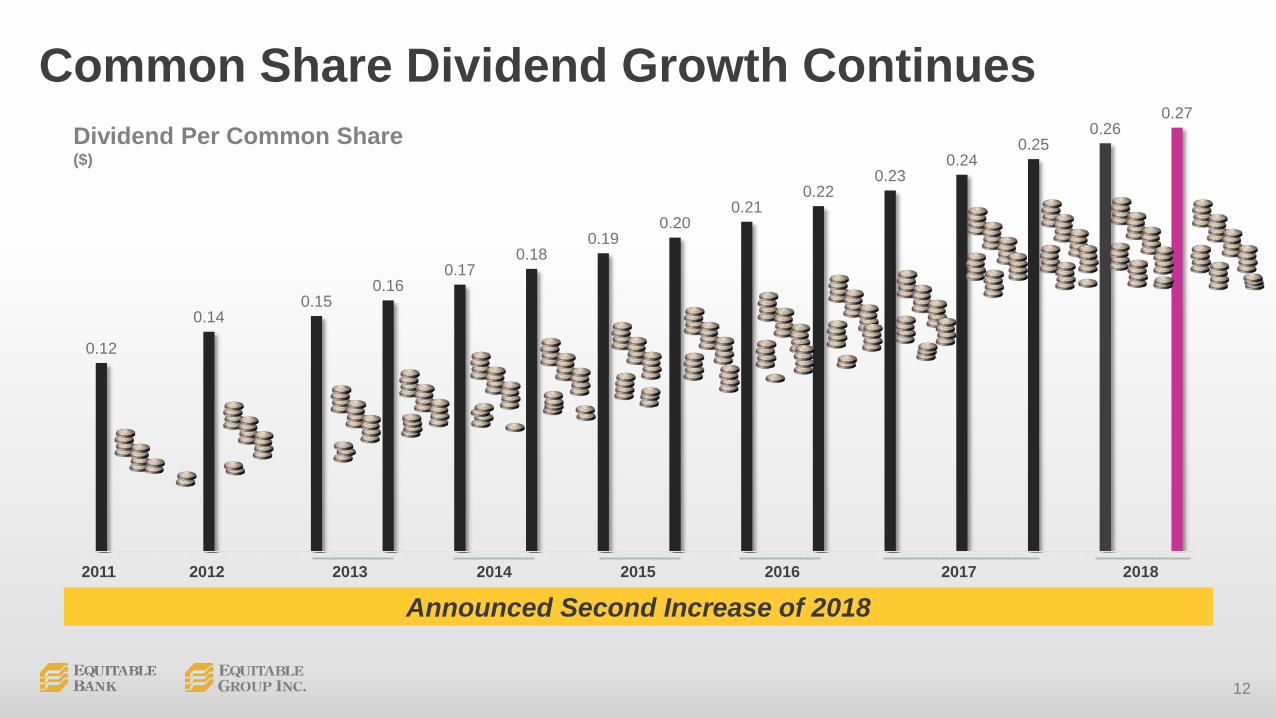
0.270.26
0.250.24
0.230.22
0.210.20
0.190.18
0.170.16
0.150.14
0.12
Common Share Dividend Growth Continues
2011 2012 2013 2014 2015 2016 2017 2018
Dividend Per Common Share($)
Announced Second Increase of 2018

13
5.5
14.716.0
Capital Ratios Exceed Requirements
March 31, 2018 (%)
Basel III minimumTotal Capital level of 10.5%Basel III
minimum CET1 target of 7.0%
Full compliance with new standard
Leverage Ratio CET1 Total Capital

14
Liquidity Action Costs And Maple Continue To Influence Performance
Q1/18EPS Impact
Q4/17 EPS Impact
Q1/17 EPS Impact
Liquidity Events Costs ($0.27) ($0.32) Nil
Maple Asset EPS Benefit $0.06 $0.08 $0.11
Liquidity Event Costs Will Be ~$5M Per Quarter in 2018
15
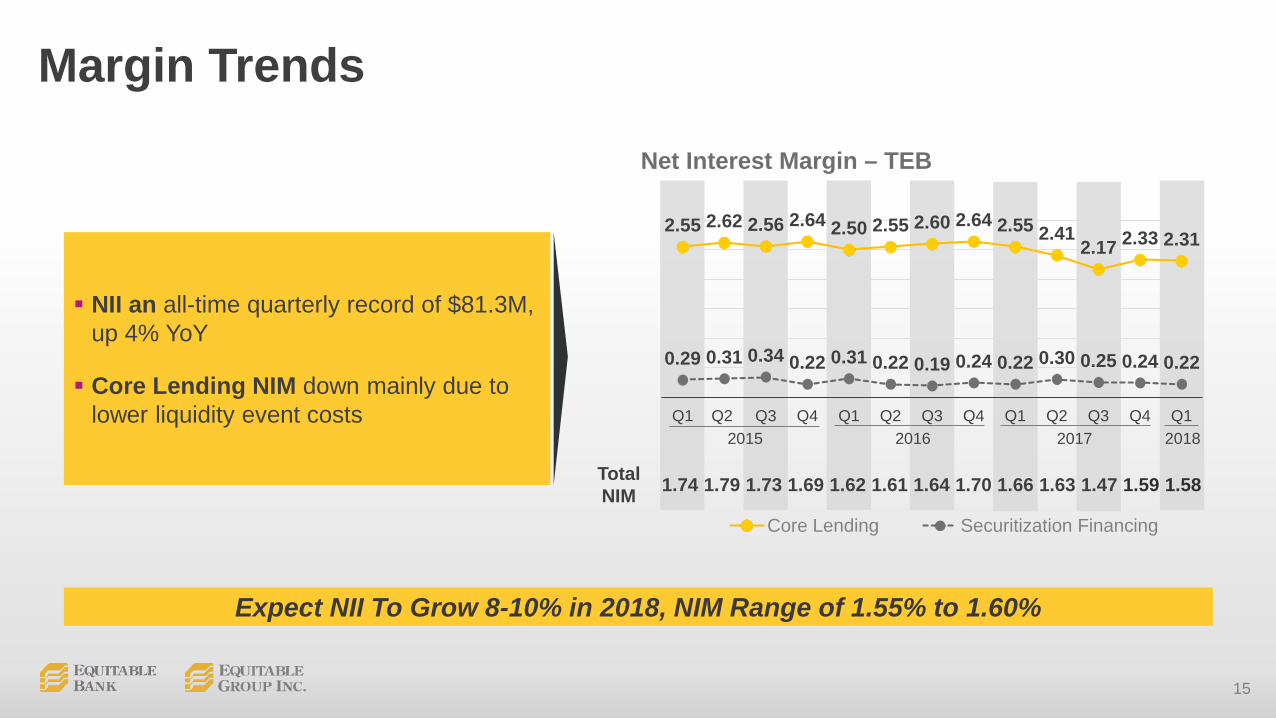
2.55 2.62 2.56 2.64 2.50 2.55 2.60 2.64 2.55 2.412.17 2.33 2.31
0.29 0.31 0.34 0.22 0.31 0.22 0.19 0.24 0.22 0.30 0.25 0.24 0.22
Q1 Q2 Q3 Q4 Q1 Q2 Q3 Q4 Q1 Q2 Q3 Q4 Q1
Core Lending Securitization Financing
Margin Trends
Net Interest Margin – TEB
2015 2016 2017 2018
Expect NII To Grow 8-10% in 2018, NIM Range of 1.55% to 1.60%
TotalNIM 1.74 1.79 1.73 1.69 1.62 1.61 1.64 1.70 1.66 1.63 1.47 1.59 1.58
NII an all-time quarterly record of $81.3M, up 4% YoY
Core Lending NIM down mainly due to lower liquidity event costs
16
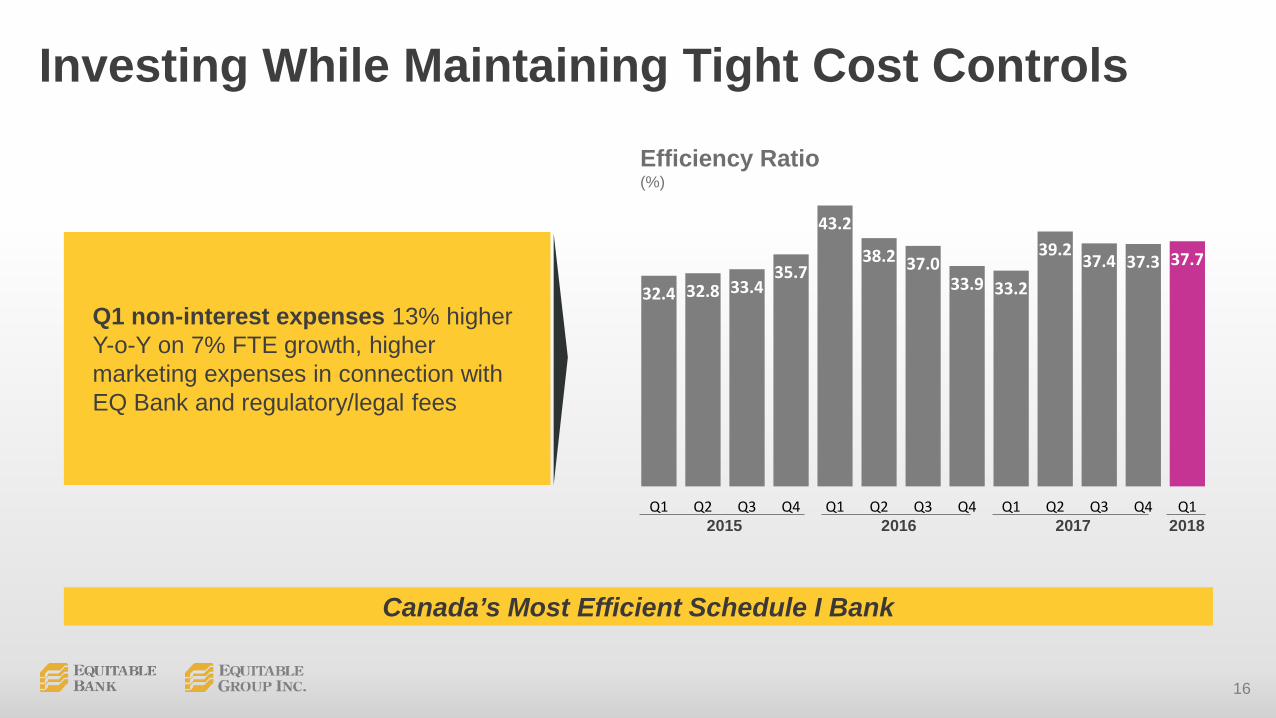
32.4 32.8 33.435.7
43.2
38.2 37.033.9 33.2
39.2 37.4 37.3 37.7
Q1 Q2 Q3 Q4 Q1 Q2 Q3 Q4 Q1 Q2 Q3 Q4 Q12015 2016 2017 2018
Investing While Maintaining Tight Cost Controls
Canada’s Most Efficient Schedule I Bank
Efficiency Ratio(%)
Q1 non-interest expenses 13% higher Y-o-Y on 7% FTE growth, higher marketing expenses in connection with EQ Bank and regulatory/legal fees
17
Strong Operating and Financial Metrics

18
PATH Home Plan Socialization Begins
Target Market
Distribution
Brand
Loan Parameters
• Homeowners 55 years and older• Residents of larger urban centers, such as Toronto or Calgary
• Through Canada’s vibrant mortgage broker community
• Maximum LTV at origination of 40%• Term of up to 5 years• Floating interest rate (based off prime)
• PATH Home Plan branding• Delivers message of reverse mortgages being a natural part of an overall financial plan

19
Deploy capital to grow existing business, with more emphasis on Commercial
Evaluate capital needs relative to opportunities
Consider funding strategies including need, cost of backstop facility post June 2019
2018 Capital And Liquidity Areas Of Focus
Asset Growth Return to Shareholders
P o t e n t i a l C a p i t a l S t r a t e g i e s
20
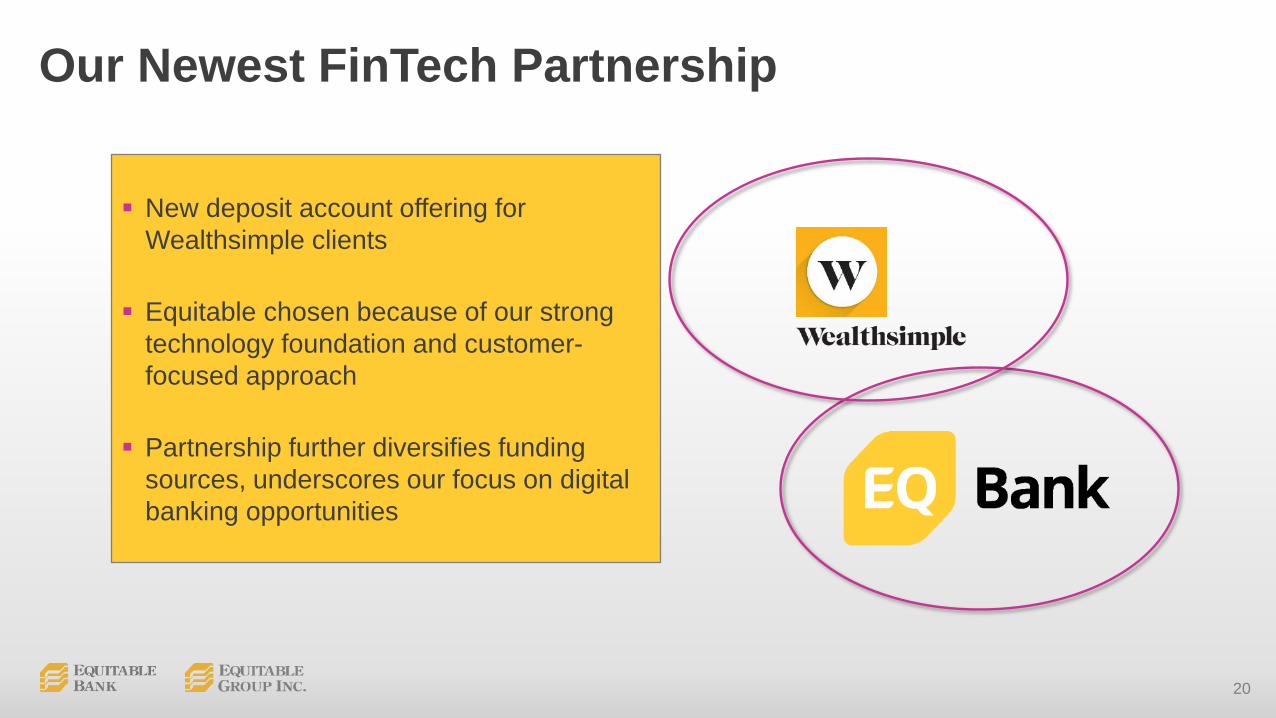
Our Newest FinTech Partnership
New deposit account offering for Wealthsimple clients
Equitable chosen because of our strong technology foundation and customer-focused approach
Partnership further diversifies funding sources, underscores our focus on digital banking opportunities

21
Summary
Solid quarter of asset growth and profitability
Dividend increased for 2nd time in 2018
Launched EQ Bank GICs, Reverse Mortgages
Expect continued asset growth


