EPA 812-R-97-001 January 1997 Office of Water (4101) United States Environmental Protection Agency Drinking Water Infrastructure Needs Survey First Report to Congress Printed on recycled paper
Transcript
EPA 812-R-97-001January 1997
Office of Water(4101)
United StatesEnvironmental ProtectionAgency
Drinking WaterInfrastructure Needs Survey
First Report to Congress
Printed on recycled paper
Cincinnati's surface water treatment plant was upgraded in 1995 to include deep bedcarbon filtration. This process removes organic contaminants found in Cincinnati'ssource, the Ohio River. The treatment plant (1) and untreated water storage (2) areshown in the foreground. The intake (3) is shown on the opposite bank of the river.The city and elevated finished-water storage tanks can be seen in the background.
1
3
2
Jim
Wal
asek
Drinking Water
Infrastructure Needs Survey
First Report to Congress
January 1997
U.S. Environmental Protection AgencyOffice of Water
Office of Ground Water and Drinking WaterImplementation and Assistance Division (4101)
Washington, D.C. 20460
Document is available for sale to the public through:
Educational Resource Information CenterClearinghouse for Science, Mathematics and
National Technical Information Service5285 Port Royal Road, Springfield, VA 22161
1-800-553-NTIS or 1-703-487-4650
Contents
Executive Summary ix
iii
Overview 1
What the Survey Covers 1How the Survey Was Conducted 3
Findings 7
Need for Compliance 7Total 20-Year Need 8Total Need by Category 10Need by System Size 16Need by Safe Drinking Water Act Regulation 21Need for American Indian and Alaska Native Water Systems 27Non-Community Water Systems 34Separate State Estimates 35
Need for Households Not Served by Community Water Systems 37
Appendices
Appendix A — MethodologyAppendix B — Summary of FindingsAppendix C — Future Regulations Not Included in the Total NeedAppendix D — Separate State EstimatesAppendix E — Glossary
Exhibits
Executive Summary
ES-1 Total 20-Year Need by System Size xES-2 Total 20-Year Need by Category xiES-3 Average 20-Year Per-Household Need xii
v
Findings
2 Total 20-Year Need 83 Overview of Need by State 94 Average 20-Year Per-Household Need 165 Overview of Need by System Size 186 Current Safe Drinking Water Act Need 217 Future Safe Drinking Water Act Need 248 Estimated Need for Future Regulations Not
Included in the Total Need 259 Location of American Indian Tribal Lands
and Alaska Native Water Systems 33
Appendices
A-1 Approach to Statistical Survey in the States A-1B-1 Total Need by Category B-3B-2 Current Need by Category B-5B-3 Total Need by System Size B-7B-4 Current Safe Drinking Water Act Need B-9B-5 Total SDWA and SDWA-Related Need B-10B-6 Total Need for American Indian and Alaska Native
Water Systems by EPA Region B-13B-7 Need by Category for American Indian and Alaska
Native Water Systems B-15B-8 Total SDWA and SDWA-Related Need for American
Indian and Alaska Native Water Systems B-17C-1 Estimated Need for Future Regulations Not Included
in the Total Need C-1D-1 Separate State Estimates D-1
Overview
1 Small Drinking Water Systems in the Needs Survey Sample 5
Car
l Am
bros
e, N
ew Y
ork
City
DE
P
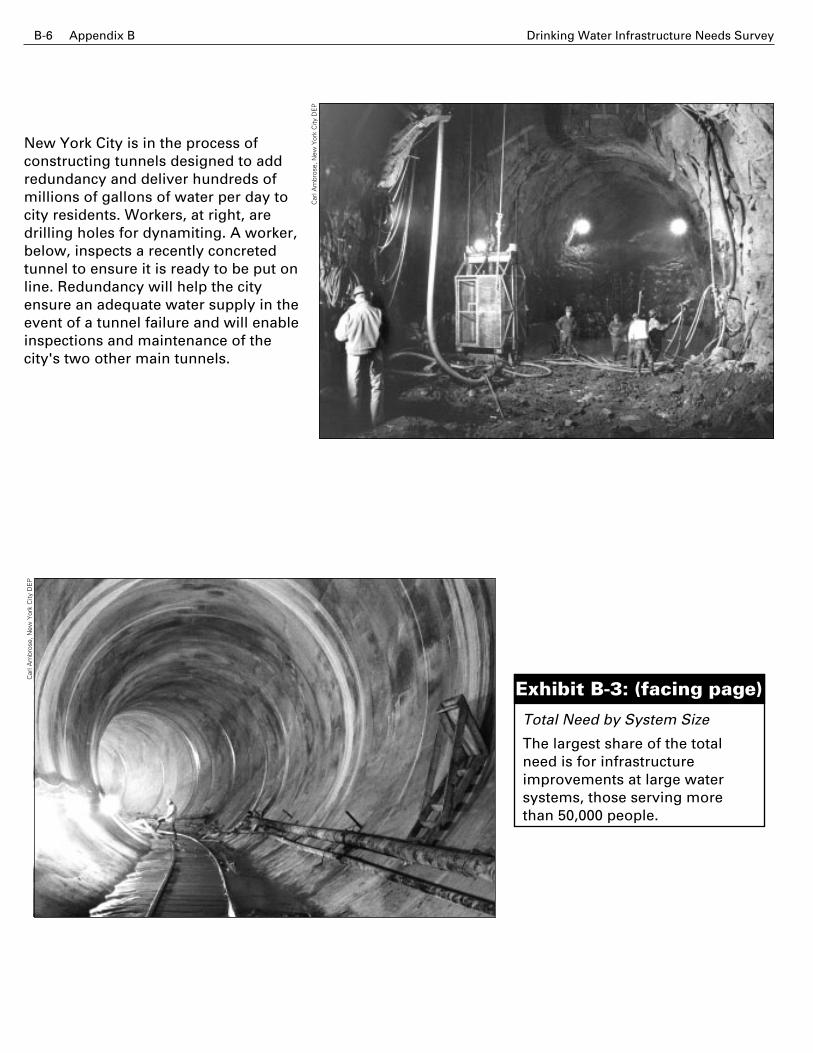
New York City's recently completed Van Cortlandt Park valve chamberregulates the flow of water into the city. The chamber houses 34 valves with atotal capacity of over 1 billion gallons per day.
* EPA thanks individuals who participated in the pilot test conducted to ensure that this survey could be implemented as planned.† EPA thanks individuals who provided information on the cost of infrastructure for smaller water systems.
Cindy Thomas–Alaska Native Health BoardStephen S. Aoyama, Richard Barror, Tom Coolidge, Karl
Powers, Dan Schubert–Indian Health ServiceThomas E. Crawford–Native American Water AssociationYolanda Barney, Max Bighorse, Delfred Gene, Lorenda
Jerome J. Healey, Robert M. Mendoza–EPA Region 1Deborah Ducoff-Barone–ConnecticutDavid DiProfio–MaineJack Hamm–MassachusettsRobert W. Haviland–Rhode IslandRichard Skarinka–New HampshireHoward Reeves–Vermont
R. K. Narang–EPA Region 2Philip Royer–New JerseyLaurence Keefe, Stephen S. Marshall–New York*Frank Rivera Quintana, Oneida Santiago–Puerto RicoDavid Rosoff–Virgin Islands
Don Niehus–EPA Region 3Edward Hallock–DelawareGeorge Rizzo–District of ColumbiaSaied Kasraei–MarylandRenée Bartholemew, Thomas Franklin–Pennsylvania†
Thomas Gray–VirginiaPaul Daniels–West Virginia
David Parker–EPA Region 4James Arnold–AlabamaJohn R. Sowerby–FloridaOnder E. Serefli–GeorgiaDonald Moccia–KentuckyKeith Allen–MississippiSidney L. Harrell–North CarolinaRose R. Stancil–South CarolinaKhaldoun Kailani–Tennessee
Kristine L. Werbach–EPA Region 5Charles R. Bell–IllinoisLance O. Mabry–IndianaDonald J. Greiner, Frederick R. Scarcella–MichiganKarla R. Peterson–MinnesotaHabib Kaake–OhioTerri S. Lloyd–Wisconsin†
Mark McCasland, David Reazin–EPA Region 6Craig Corder–ArkansasT. Jay Ray–LouisianaDavid Gallegos–New MexicoJack Pipkin–OklahomaBill Allen, Wayne Wiley, Cynthia A. Yates–Texas*
Kelly Beard-Tittone–EPA Region 7Roy G. Ney–IowaA. Samuel Sunderraj–KansasRonald G. Burgess–MissouriSteven Rowell–Nebraska
Dale Murphy–EPA Region 8John Payne–ColoradoLinda Hills–MontanaCharles A. Abel–North DakotaGarland Erbele, James L. Wendte–South DakotaRuss Topham–UtahMaureen Doughtie–Wyoming
José T. Caratini–EPA Region 9James A. Maston–ArizonaKarol Enferadi–CaliforniaWilliam Wong–HawaiiJoe Pollock–NevadaSu Cox–Pacific Islands
Gerald Opatz–EPA Region 10James R. Weise–AlaskaAlan Stanford–IdahoDave Phelps–OregonDavid Monthie–Washington*
Prime Contractor–The Cadmus Group, Inc.Ralph T. Jones–Program ManagerPatricia Carroll Hertzler–Project ManagerDan L. Fraser–Small System Site VisitsSpecial thanks to Michelle L. Young, Donna G. Jensen,
Amy M. Blessinger, Elizabeth A. Holland, Robert W.Hughes, Ian P. Kline, and Sheila H. Potter
Acknowledgments
Many dedicated individuals contributed to the Drinking Water Infrastructure Needs Survey. We would like to thank the American Indian,Alaska Native, State, and EPA Needs Survey Coordinators for their active support and continuing interest in the survey. Not listed are theoperators and managers of the approximately 4,000 water systems that spent their valuable time searching through their records andcompleting the questionnaires we sent to them. We thank them for their assistance.
Dea
n C
haus
see
This partially demolished million gallon elevated storage tank had exceeded itsuseful service life. Needs Survey respondents reported that elevated tanks ofthis size would cost an average of $1 million.
Executive Summary
Over the past two years, the U.S.Environmental ProtectionAgency (EPA) has sponsored a
national survey of drinking waterinfrastructure needs. In this unprec-edented study, 4,000 community watersystems documented their infrastruc-ture improvement needs for the next20 years.
SDWA Need
■ The current Safe Drinking Water Act(SDWA) need totals $12.1 billion.1
Current SDWA needs are capitalcosts for projects needed now toensure compliance with existingSDWA regulations.
Treatment for microbiologicalcontaminants under the SDWAaccounts for $10.2 billion—about84 percent of the current SDWAneed. Microbiological contaminants,regulated under the Surface WaterTreatment Rule (SWTR) and TotalColiform Rule (TCR), can lead to
gastrointestinal illness and, inextreme cases, death. The SWTRand TCR need is for construction ofnew infrastructure at systems notnow in compliance and for replace-ment of existing infrastructure thatno longer functions adequately. Inaddition to the need associated withthe SWTR and TCR, almost $0.2 bil-lion is needed to meet standards fornitrate, which causes acute healtheffects in children, and $1.7 billion isneeded for contaminants that posechronic health risks.
It is important to note that thecurrent need attributable to theSDWA is overstated. SDWA projectsoften include components that arenot required for compliance but areundertaken at the same time torealize savings in design andbuilding costs. Anothercomponent of the need wouldexist even in the absence of theSDWA because of State andlocal requirements andcommunities' efforts to providea consistent level of waterquality.
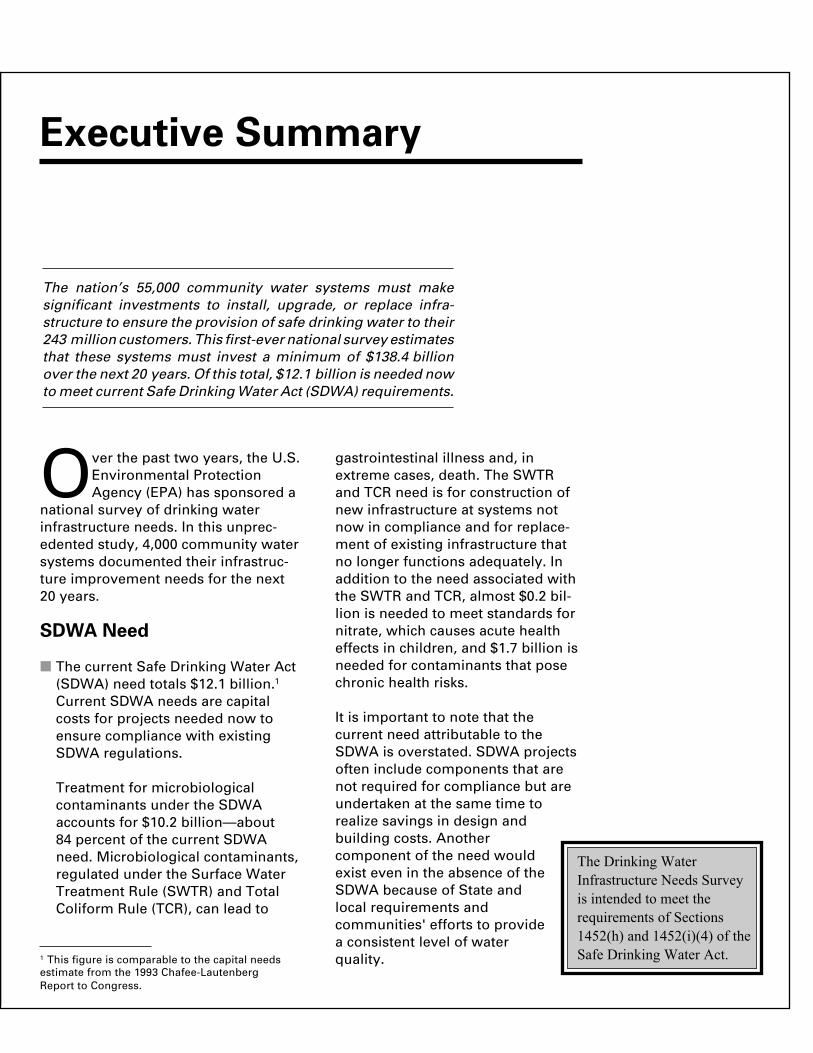
The nation’s 55,000 community water systems must makesignificant investments to install, upgrade, or replace infra-structure to ensure the provision of safe drinking water to their243 million customers. This first-ever national survey estimatesthat these systems must invest a minimum of $138.4 billionover the next 20 years. Of this total, $12.1 billion is needed nowto meet current Safe Drinking Water Act (SDWA) requirements.
1 This figure is comparable to the capital needsestimate from the 1993 Chafee-LautenbergReport to Congress.
The Drinking WaterInfrastructure Needs Surveyis intended to meet therequirements of Sections1452(h) and 1452(i)(4) of theSafe Drinking Water Act.
x Executive Summary Drinking Water Infrastructure Needs Survey
degrade water quality to the extentthat problems would be detectedwithout the TCR.
Total Need
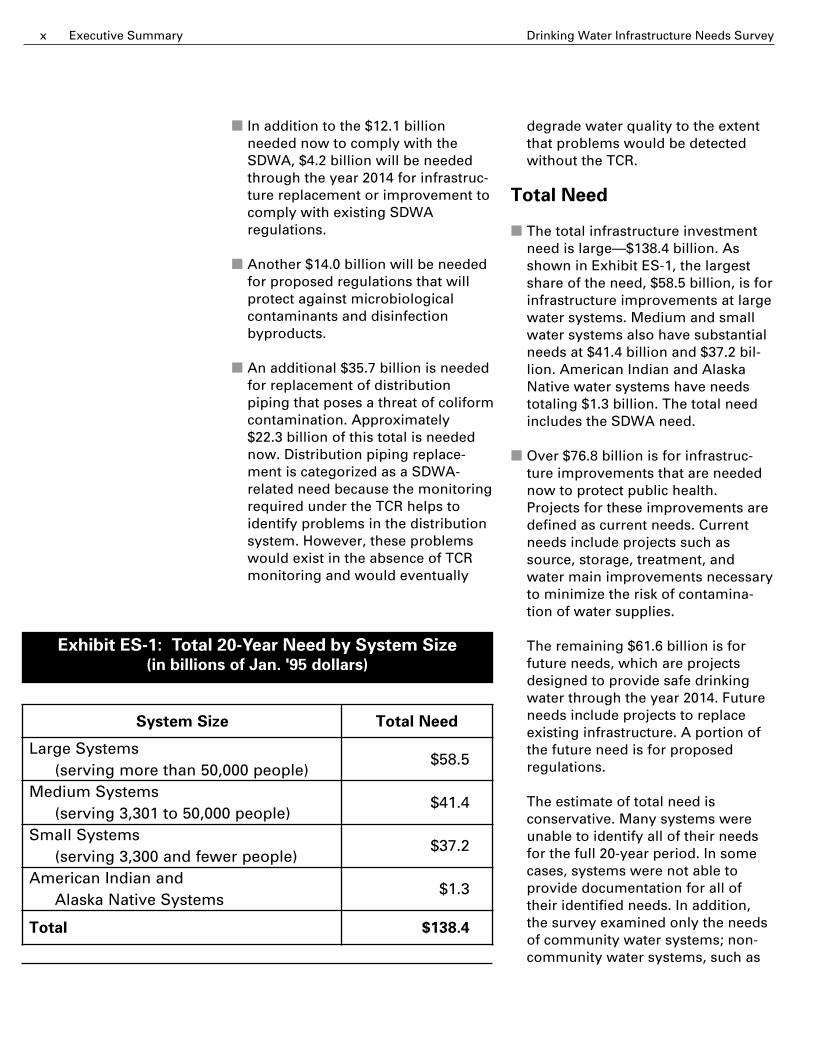
■ The total infrastructure investmentneed is large—$138.4 billion. Asshown in Exhibit ES-1, the largestshare of the need, $58.5 billion, is forinfrastructure improvements at largewater systems. Medium and smallwater systems also have substantialneeds at $41.4 billion and $37.2 bil-lion. American Indian and AlaskaNative water systems have needstotaling $1.3 billion. The total needincludes the SDWA need.
■ Over $76.8 billion is for infrastruc-ture improvements that are needednow to protect public health.Projects for these improvements aredefined as current needs. Currentneeds include projects such assource, storage, treatment, andwater main improvements necessaryto minimize the risk of contamina-tion of water supplies.
The remaining $61.6 billion is forfuture needs, which are projectsdesigned to provide safe drinkingwater through the year 2014. Futureneeds include projects to replaceexisting infrastructure. A portion ofthe future need is for proposedregulations.
The estimate of total need isconservative. Many systems wereunable to identify all of their needsfor the full 20-year period. In somecases, systems were not able toprovide documentation for all oftheir identified needs. In addition,the survey examined only the needsof community water systems; non-community water systems, such as
■ In addition to the $12.1 billionneeded now to comply with theSDWA, $4.2 billion will be neededthrough the year 2014 for infrastruc-ture replacement or improvement tocomply with existing SDWAregulations.
■ Another $14.0 billion will be neededfor proposed regulations that willprotect against microbiologicalcontaminants and disinfectionbyproducts.
■ An additional $35.7 billion is neededfor replacement of distributionpiping that poses a threat of coliformcontamination. Approximately$22.3 billion of this total is needednow. Distribution piping replace-ment is categorized as a SDWA-related need because the monitoringrequired under the TCR helps toidentify problems in the distributionsystem. However, these problemswould exist in the absence of TCRmonitoring and would eventually
Exhibit ES-1: Total 20-Year Need by System Size(in billions of Jan. '95 dollars)
eziSmetsyS deeNlatoT
smetsySegraL5.85$
)elpoep000,05nahteromgnivres(smetsySmuideM
4.14$)elpoep000,05ot103,3gnivres(
smetsySllamS2.73$
)elpoeprewefdna003,3gnivres(dnanaidnInaciremA
3.1$smetsySevitaNaksalA
latoT 4.831$
Drinking Water Infrastructure Needs Survey xiExecutive Summary
schools and churches with their ownwater systems, were not included.Needs associated solely with futuregrowth were also excluded from thissurvey.
Categories of Need
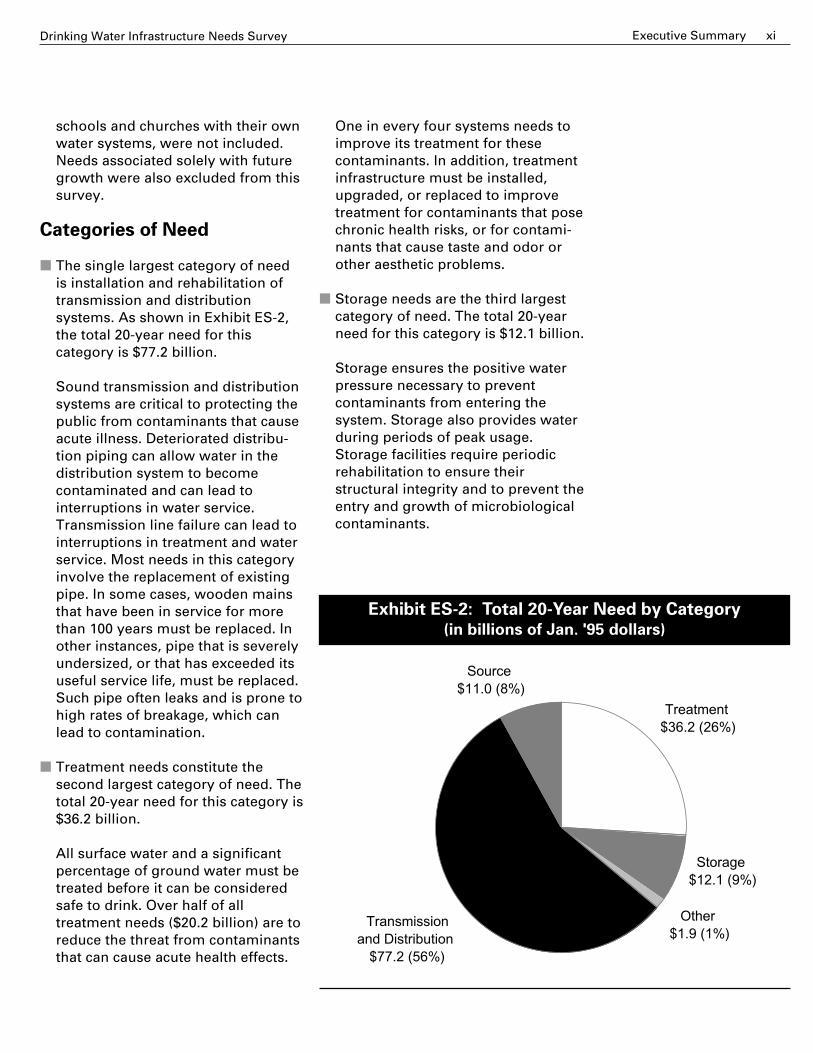
■ The single largest category of needis installation and rehabilitation oftransmission and distributionsystems. As shown in Exhibit ES-2,the total 20-year need for thiscategory is $77.2 billion.
Sound transmission and distributionsystems are critical to protecting thepublic from contaminants that causeacute illness. Deteriorated distribu-tion piping can allow water in thedistribution system to becomecontaminated and can lead tointerruptions in water service.Transmission line failure can lead tointerruptions in treatment and waterservice. Most needs in this categoryinvolve the replacement of existingpipe. In some cases, wooden mainsthat have been in service for morethan 100 years must be replaced. Inother instances, pipe that is severelyundersized, or that has exceeded itsuseful service life, must be replaced.Such pipe often leaks and is prone tohigh rates of breakage, which canlead to contamination.
■ Treatment needs constitute thesecond largest category of need. Thetotal 20-year need for this category is$36.2 billion.
All surface water and a significantpercentage of ground water must betreated before it can be consideredsafe to drink. Over half of alltreatment needs ($20.2 billion) are toreduce the threat from contaminantsthat can cause acute health effects.
Exhibit ES-2: Total 20-Year Need by Category
(in billions of Jan. '95 dollars)
Source $11.0 (8%)
Treatment $36.2 (26%)
Storage $12.1 (9%)
Other $1.9 (1%)
Transmissionand Distribution
$77.2 (56%)
One in every four systems needs toimprove its treatment for thesecontaminants. In addition, treatmentinfrastructure must be installed,upgraded, or replaced to improvetreatment for contaminants that posechronic health risks, or for contami-nants that cause taste and odor orother aesthetic problems.
■ Storage needs are the third largestcategory of need. The total 20-yearneed for this category is $12.1 billion.
Storage ensures the positive waterpressure necessary to preventcontaminants from entering thesystem. Storage also provides waterduring periods of peak usage.Storage facilities require periodicrehabilitation to ensure theirstructural integrity and to prevent theentry and growth of microbiologicalcontaminants.
xii Executive Summary Drinking Water Infrastructure Needs Survey
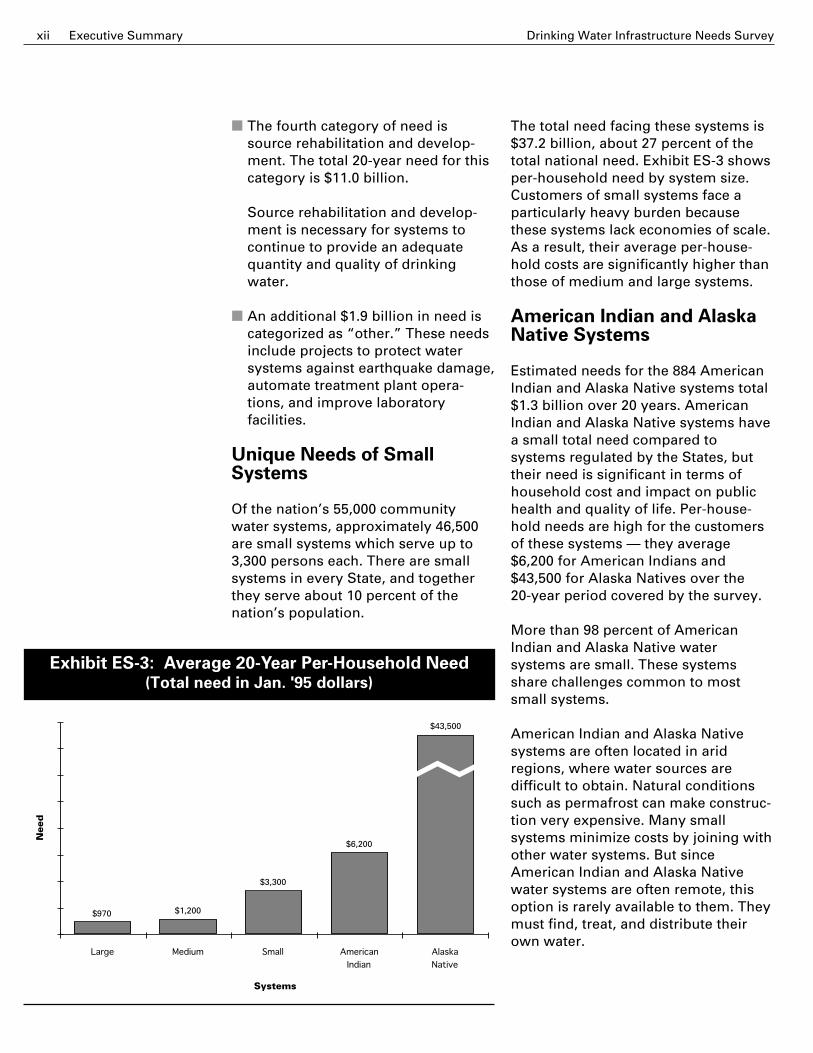
The total need facing these systems is$37.2 billion, about 27 percent of thetotal national need. Exhibit ES-3 showsper-household need by system size.Customers of small systems face aparticularly heavy burden becausethese systems lack economies of scale.As a result, their average per-house-hold costs are significantly higher thanthose of medium and large systems.
American Indian and AlaskaNative Systems
Estimated needs for the 884 AmericanIndian and Alaska Native systems total$1.3 billion over 20 years. AmericanIndian and Alaska Native systems havea small total need compared tosystems regulated by the States, buttheir need is significant in terms ofhousehold cost and impact on publichealth and quality of life. Per-house-hold needs are high for the customersof these systems — they average$6,200 for American Indians and$43,500 for Alaska Natives over the20-year period covered by the survey.
More than 98 percent of AmericanIndian and Alaska Native watersystems are small. These systemsshare challenges common to mostsmall systems.
American Indian and Alaska Nativesystems are often located in aridregions, where water sources aredifficult to obtain. Natural conditionssuch as permafrost can make construc-tion very expensive. Many smallsystems minimize costs by joining withother water systems. But sinceAmerican Indian and Alaska Nativewater systems are often remote, thisoption is rarely available to them. Theymust find, treat, and distribute theirown water.
■ The fourth category of need issource rehabilitation and develop-ment. The total 20-year need for thiscategory is $11.0 billion.
Source rehabilitation and develop-ment is necessary for systems tocontinue to provide an adequatequantity and quality of drinkingwater.
■ An additional $1.9 billion in need iscategorized as “other.” These needsinclude projects to protect watersystems against earthquake damage,automate treatment plant opera-tions, and improve laboratoryfacilities.
Unique Needs of SmallSystems
Of the nation’s 55,000 communitywater systems, approximately 46,500are small systems which serve up to3,300 persons each. There are smallsystems in every State, and togetherthey serve about 10 percent of thenation’s population.
Exhibit ES-3: Average 20-Year Per-Household Need(Total need in Jan. '95 dollars)
Large Medium Small American
Indian
Alaska
Native
$970
$3,300
$43,500
$1,200
$6,200
Systems
Nee
d
Drinking Water Infrastructure Needs Survey xiiiExecutive Summary
Households Not Served byCommunity Water Systems
This survey does not address theneeds of the approximately 16 millionhouseholds not served by communitywater systems. Many of these house-holds have safe sources of runningwater, but an undetermined number donot. Some households that lack saferunning water are close to existingcommunity water systems, and somesurvey respondents estimated costs forconnecting this type of household.Six billion dollars is a partial estimatefor providing water to households thatdo not have a safe source of drinkingwater. Unfortunately, connecting to anexisting community water system isnot an option for all such homes.Further study is necessary to deter-mine the full scope of this problem.
Methodology
The Drinking Water InfrastructureNeeds Survey was a joint effort of thenation’s drinking water utilities, Statedrinking water regulatory agencies,representatives of American Indiansand Alaska Natives, the Indian HealthService (IHS), and EPA. The surveybenefited from the unanimous supportof every organization representingdrinking water utilities.
The survey included community watersystems from every State, Puerto Rico,the District of Columbia, the VirginIslands, American Samoa, the NorthernMariana Islands, and Guam, as well asAmerican Indian and Alaska Nativesystems. The survey’s scope rangedfrom systems serving more than15 million people to those serving only25. Urban and rural water systems,both publicly and privately owned,were surveyed.
Of the 794 large water systems, whichserve more than 50,000 people, 784participated through a mail survey. Allsystems serving more than 110,000people responded to the survey. Of the6,800 medium systems serving apopulation of 3,301 to 50,000, arandom sample of 2,760 systems wasdrawn. Ninety-three percent of thesesystems responded to the mail survey.To ensure an accurate estimate ofinfrastructure needs for the 46,500small systems nationwide, drinkingwater professionals made on-sitedeterminations of need for 537 sys-tems serving 3,300 or fewer people.The small system needs assessmentcovered every State. The results of thestatistical surveys were extrapolated toestimate needs for small and mediumcommunity water systems.
Wis
cons
in D
epar
tmen
t of
Nat
ural
Res
ourc
es
xiv Executive Summary Drinking Water Infrastructure Needs Survey
All 15 medium American Indiansystems responded to the question-naire. Of the 869 small American Indianand Alaska Native systems, needs wereassessed for 77 representativesystems. Needs for these sampledsystems, in conjunction with IHS data,were used to derive needs for Ameri-can Indian and Alaska Native systems.
EPA and State drinking water regula-tors thoroughly reviewed eachsystem’s estimates and supportingdocuments to ensure the validity andaccuracy of the proposed projects andassociated costs. The most commonsources of documentation were capitalimprovement plans and engineers’estimates.
Conclusions
Community water systems need toinvest significant amounts of money ininfrastructure improvements if they areto continue providing water that is safeto drink. Much of the nation’s drinkingwater infrastructure suffers from long-term neglect and serious deterioration.Recent events—including waterbornedisease outbreaks and extended boil-water notices in major cities—havefocused national attention on thedangers associated with contaminationof public water supplies. Current needsfor minimizing health threats frommicrobiological contaminants—thoseneeds associated with the SWTR andthe TCR—are especially critical.
Water systems around the countrymust make immediate investments ininfrastructure to protect public healthand ensure the availability of safedrinking water.
Reu
ters
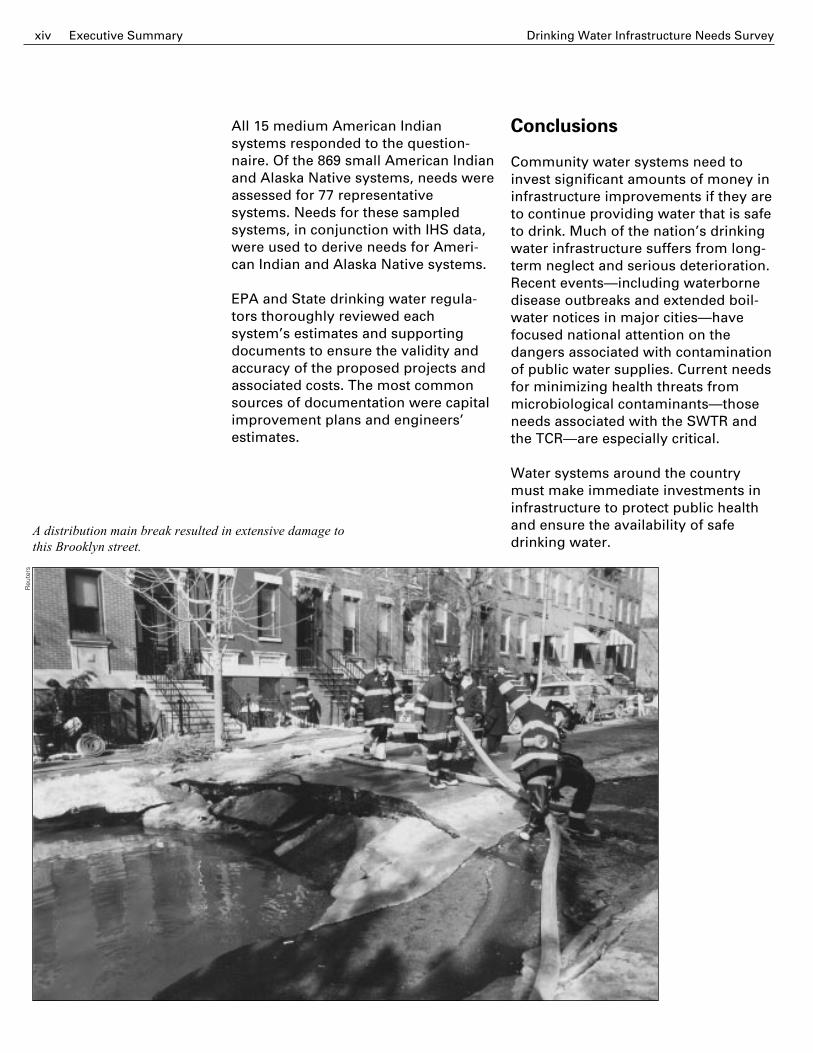
A distribution main break resulted in extensive damage tothis Brooklyn street.
Drinking Water Infrastructure Needs Survey xvExecutive SummaryD
an F
rase
r
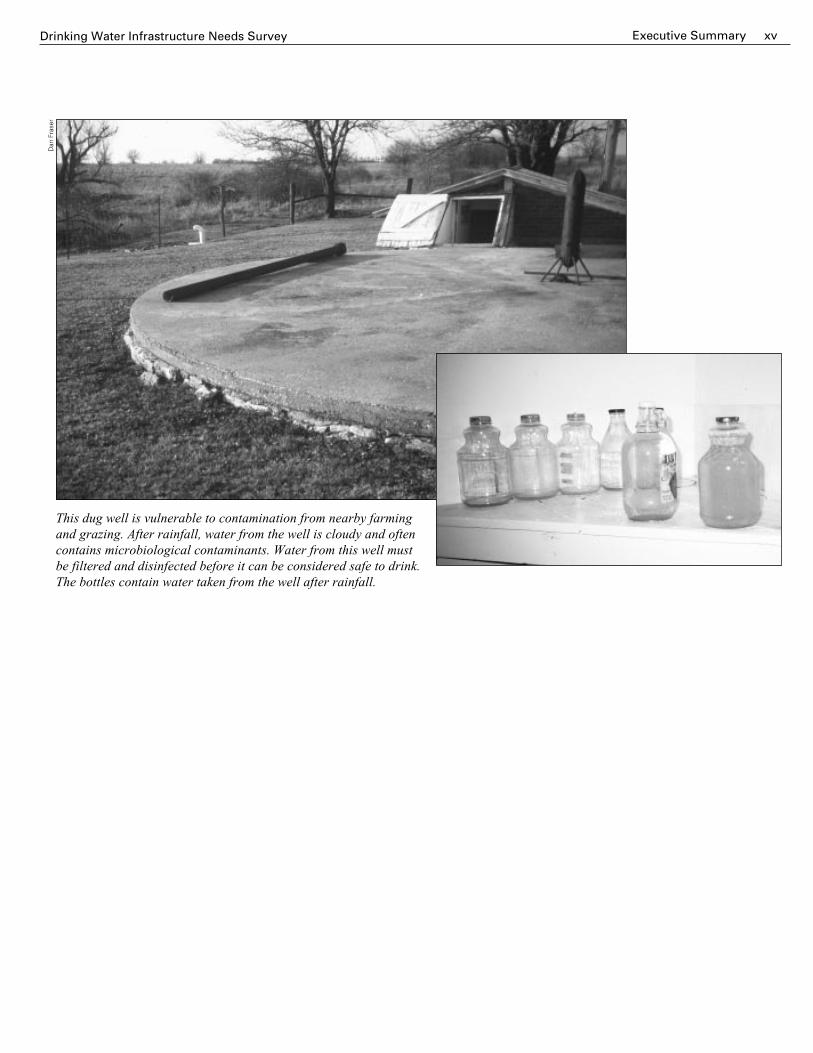
This dug well is vulnerable to contamination from nearby farmingand grazing. After rainfall, water from the well is cloudy and oftencontains microbiological contaminants. Water from this well mustbe filtered and disinfected before it can be considered safe to drink.The bottles contain water taken from the well after rainfall.
Gia
rdia
and
Gia
rdia
sis
Edi
ted
by:
Sta
nley
Erla
ndse
n an
d E
rnes
t M
eyer
, 198
5
Scanning electron micrograph of the pathogen Giardia lamblia in the trophozoite stage of its lifecycle. Giardia is a microbiological contaminant that can cause acute illness. About 84 percent ofcurrent SDWA need is to protect against microbiological contaminants.
Findings
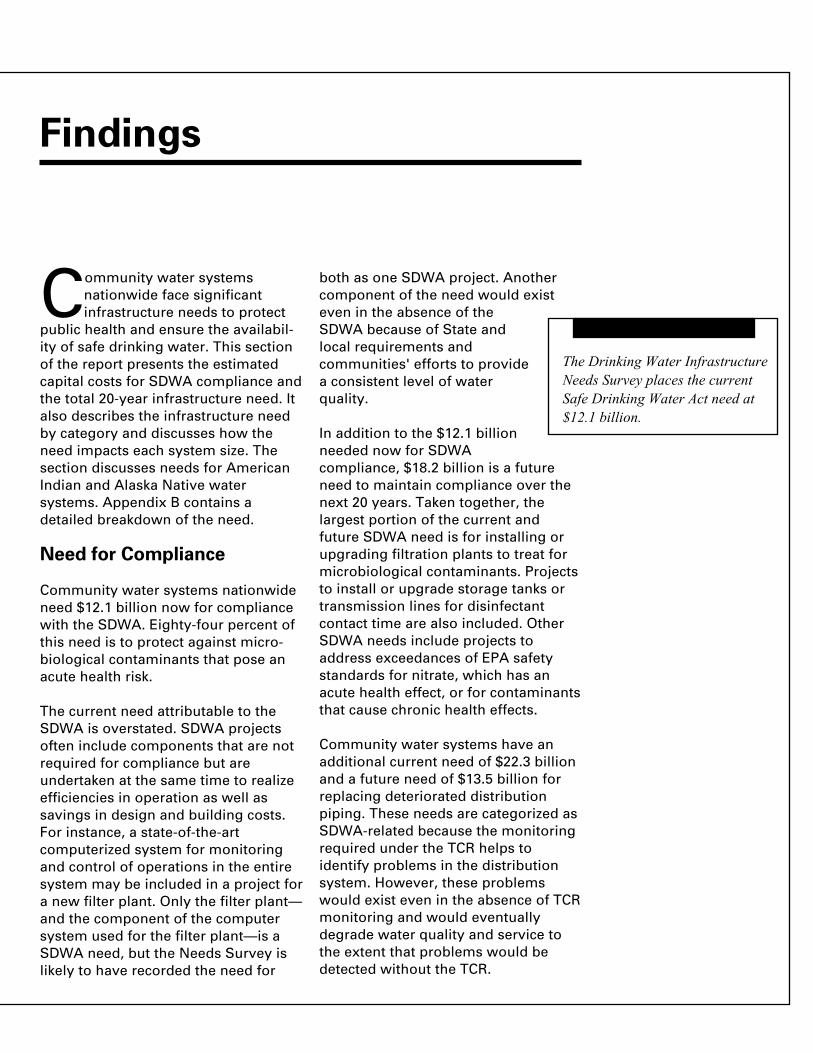
Community water systemsnationwide face significantinfrastructure needs to protect
public health and ensure the availabil-ity of safe drinking water. This sectionof the report presents the estimatedcapital costs for SDWA compliance andthe total 20-year infrastructure need. Italso describes the infrastructure needby category and discusses how theneed impacts each system size. Thesection discusses needs for AmericanIndian and Alaska Native watersystems. Appendix B contains adetailed breakdown of the need.
Need for Compliance
Community water systems nationwideneed $12.1 billion now for compliancewith the SDWA. Eighty-four percent ofthis need is to protect against micro-biological contaminants that pose anacute health risk.
The current need attributable to theSDWA is overstated. SDWA projectsoften include components that are notrequired for compliance but areundertaken at the same time to realizeefficiencies in operation as well assavings in design and building costs.For instance, a state-of-the-artcomputerized system for monitoringand control of operations in the entiresystem may be included in a project fora new filter plant. Only the filter plant—and the component of the computersystem used for the filter plant—is aSDWA need, but the Needs Survey islikely to have recorded the need for
both as one SDWA project. Anothercomponent of the need would existeven in the absence of theSDWA because of State andlocal requirements andcommunities' efforts to providea consistent level of waterquality.
In addition to the $12.1 billionneeded now for SDWAcompliance, $18.2 billion is a futureneed to maintain compliance over thenext 20 years. Taken together, thelargest portion of the current andfuture SDWA need is for installing orupgrading filtration plants to treat formicrobiological contaminants. Projectsto install or upgrade storage tanks ortransmission lines for disinfectantcontact time are also included. OtherSDWA needs include projects toaddress exceedances of EPA safetystandards for nitrate, which has anacute health effect, or for contaminantsthat cause chronic health effects.
Community water systems have anadditional current need of $22.3 billionand a future need of $13.5 billion forreplacing deteriorated distributionpiping. These needs are categorized asSDWA-related because the monitoringrequired under the TCR helps toidentify problems in the distributionsystem. However, these problemswould exist even in the absence of TCRmonitoring and would eventuallydegrade water quality and service tothe extent that problems would bedetected without the TCR.
The Drinking Water InfrastructureNeeds Survey places the currentSafe Drinking Water Act need at$12.1 billion.
8 Findings Drinking Water Infrastructure Needs Survey
Total 20–Year Need
Drinking water infrastructure needs forthe nation's community water systemstotal $138.4 billion. Of this total,$76.8 billion is for current needs toprotect public health. Current needsare projects to treat for contaminantswith acute and chronic health effectsand to prevent contamination of watersupplies. A portion of these needs arefor SDWA compliance.
Of the $138.4 billion total, $61.6 billionis for future need. Projects for futureneed are designed to provide safedrinking water through the year 2014.Future needs include projects forreplacing infrastructure and for theDisinfectants and DisinfectionByproducts Rule (D/DBPR), theEnhanced Surface Water TreatmentRule (ESWTR), and the InformationCollection Rule (ICR).
The needs in this report are conserva-tive because many systems were notable to identify all of their needs ordocument them well enough to meetthe survey's criteria. In addition, needsfor non-community water systems arenot included. Needs associated solelywith future growth were not includedin this survey.
Exhibit 2 shows the total infrastructureneed by category and water systemsize. Exhibit 3 shows need on a State-by-State basis.
Exhibit 2: Total 20-Year Need
Note: Numbers may not total due to rounding.
eziSmetsyS
)srallod59'.naJfosnoillibni(deeNlatoT
noissimsnarT
dna
noitubirtsiD
tnemtaerT egarotS ecruoS rehtO latoT
smetsySegraLnahteromgnivres(
)elpoep000,055.03$ 2.71$ 5.3$ 6.5$ 6.1$ 5.85$
smetsySmuideMot103,3gnivres(
)elpoep000,052.22$ 0.21$ 2.4$ 8.2$ 3.0$ 4.14$
smetsySllamSdna003,3gnivres(
)elpoeprewef8.32$ 7.6$ 2.4$ 5.2$ 40.0$ 2.73$
dnanaidnInaciremAevitaNaksalA
smetsyS6.0$ 3.0$ 3.0$ 1.0$ 30.0$ 3.1$
latoT 2.77$ 2.63$ 1.21$ 0.11$ 9.1$ 4.831$
Drinking Water Infrastructure Needs Survey 9Findings
Exhibit 3: Overview of Need by State†
Puerto Rico
20-year need in mi l l ions ofJan. '95 dol lars
- Less than $1,000- $1,000 - $1,999- $2,000 - $2,999- $3,000 - $10,000- More than $10,000
Virgin Islands *
District ofColumbia
American Samoa *
Guam *
Northern Mariana Is. *
Not to scale
† Needs for American Indian and Alaska Native water systems are not included in this exhibit.* The need for American Samoa, Guam, the Northern Mariana Islands, and the Virgin Islands is less than $1 billion each.
10 Findings Drinking Water Infrastructure Needs Survey
Total Need by Category
There are four major categories ofneed: transmission and distribution,treatment, storage, and source.Exhibit 2 (on page 8) shows the needby category. A portion of each categoryis attributable to the SDWA.
Transmission and Distribution.Transmission and distribution needsaccount for $77.2 billion, more thanhalf of the total need for communitywater systems. Deteriorating distribu-tion infrastructure threatens drinkingwater quality and can cause violationsof the SDWA. Even in systems withexcellent treatment, leaking pipes canlead to a loss of pressure and causeback-siphonage of contaminated water.Leaks also waste water and energy astreated water escapes from thedistribution system. Deterioratingtransmission and distribution infra-structure is common throughout thenation, particularly in older systems.
Tuberculation is a condition that affects the interior of pipes in manywater systems. Tuberculation can decrease water quality and leads toloss of energy and capacity.
Mon
tauk
Ser
vice
s In
c.
Water mains are pressurized to deliver water to residents and tokeep contaminants from entering the water system. Systems canlose pressure or even experience a partial vacuum during fireflows, repairs, or line breaks. Loss of pressure is dangerousbecause it can lead to back-siphonage, where contaminants aredrawn into the water system through leaks. The danger becomesgreater as the condition of the pipe becomes worse, allowing moreleaks and more opportunities for the water to be contaminated.
Back-Siphonage
Drinking Water Infrastructure Needs Survey 11Findings
Niagara Falls, NY—During WorldWar II, the federal governmentinstalled approximately 8 1/2 miles of“victory pipe” as large diametertransmission and distribution mains toensure a reliable water supply fordefense industries in the city. Becauseof demand for metal during the war,this pipe is thin-walled and prone tofrequent and costly line breaks. Thedeteriorating victory pipe constitutesonly 3 percent of the total pipe in thecity, but claims one quarter of the city’sexpenditures for water main repair andreplacement. Breaks and leaks in thevictory pipe could lead to microbiologi-cal contamination of the water supplyand seriously threaten public health.
Transmission and Distribution Needs—Three Examples
Butte, MT—Butte was developed as amining community in the late 1800’sand much of the infrastructure that wasinstalled then remains in place today.The distribution system was con-structed primarily of 6-inch diameterthin-walled steel pipe. Some woodenpipe was also used, but most of it hasbeen replaced. While 30,000 feet of thesteel pipe has been replaced, the watersystem estimates that an additional100,000 feet is still in service. A fourperson “leak gang” works six days aweek in Butte, fixing up to 600 leaksand breaks per year.
Huntington, IN—In December 1995,city residents were forced to boil theirwater for a week when a city watermain broke. The 7-foot crack in themain caused businesses and schools inthe area to close temporarily.
Drinking Water Infrastructure Needs Survey 11FindingsD
an F
rase
r
Three members of the Butte,Montana leak gang.
12 Findings Drinking Water Infrastructure Needs Survey
Treatment. Treatment is the secondlargest category of need, representing$36.2 billion (26 percent) of the totalinfrastructure need for communitywater systems.
About $20.0 billion is needed fortreatment of microbiological contami-nants which can cause acute healtheffects. These contaminants are usuallyassociated with gastrointestinal illnessand, in extreme cases, death. They canstrike in a matter of hours or days. Tominimize the risk of microbiologicalcontamination, 35 percent of systemsthat use surface water sources need toinstall, replace, or upgrade filtrationplants.
A smaller portion of the treatmentneed, approximately $0.2 billion, isassociated with nitrate. Nitrate posesan acute health threat. High levels caninterfere with the ability of an infant’sblood to carry oxygen. This potentiallyfatal condition is called “blue babysyndrome.”
Almost $10.7 billion is needed fortreatment of contaminants with chronichealth effects. These effects includecancer and birth defects. The largestneeds among contaminants withchronic health effects are treatment forbyproducts of disinfection and for lead.Some disinfection byproducts are toxicand some are probable carcinogens.Exposure to lead can impair the mentaldevelopment of children.
Another $5.3 billion is needed fortreatment of secondary contaminants.Secondary contaminants affect thetaste, odor, and color of water.
Car
rie H
anco
ck, C
.H. D
iagn
ostic
s
Scanning electron micrograph of the pathogen Giardia lamblia inthe cyst stage of their life cycle. Giardia is one microbiologicalcontaminant found in surface waters throughout the country.
Drinking Water Infrastructure Needs Survey 13Findings
The Costs of Failed Treatment—Three Examples
Washington, DC—In 1993, the DCmetropolitan area experienced adecrease in source water quality thatcoincided with operational problems.Water not meeting federal standardsentered the distribution system. The
problem wasidentified andEPA and theState ofVirginiaissued a boil-water noticeto arearesidents,preventingany reportedcases ofillness. Butthe lapse intreatment didcarry a cost.
According to conservative estimates,the four-day boil notice cost the cityand its residents approximately$24 million and inconveniencedresidents and tourists who were forcedto find alternative sources of drinkingwater.
Milwaukee, WI—In 1993, Milwaukeeexperienced a decrease in treatedwater quality similar to that inWashington, DC. The consequences forresidents of Milwaukee, however, werefar more serious than for residents ofWashington. Contamination in theMilwaukee water supply led to over400,000 reported cases of illness andsome 100 deaths. Milwaukee has sinceupgraded its filtration facilities.
Ethete, WY—This small AmericanIndian community uses direct pressurefiltration to treat a surface water sourcewhich deteriorates in quality duringspring run-off. The existing plant,though well-maintained andwell-operated, is unable to treat thehighly turbid water adequately, and thecommunity must issue boil-waterorders for extended periods of timeduring the spring and summer. Thecommunity has considered alternativeground water sources, but this optionis not feasible because of quality andquantity problems. Therefore, thecommunity needs to build a moreappropriate treatment plant for theexisting surface water source.
Boiling Tap WaterPurchase Bottled WaterPurchase Alternative BeveragesPurchase Safe Ice*Costs to HospitalsCosts to RestaurantsTotal
Drinking Water Infrastructure Needs Survey 13Findings
Pressure filters at Ethete
Dan
Fra
ser
Cost of the DC Boil Notice(Estimated in '93 dollars)
14 Findings Drinking Water Infrastructure Needs Survey
Storage. Projects to build new storageor rehabilitate existing facilitiesconstitute $12.1 billion, or 9 percent ofthe total need. Storage is criticalbecause it ensures the positive waterpressure necessary to preventcontaminants from entering thesystem. It also provides water forperiods when demand exceeds thecapacity of source and treatmentfacilities. Two-thirds of water systemsreported a need for improvements tostorage facilities.
Storage needs usually include buildingor repairing conventional tanks.Another significant need is associatedwith uncovered finished-waterreservoirs. These large reservoirs arevulnerable to contamination. Coveringthese reservoirs is a priority for mostcities that have them.
Source. Needs for source rehabilita-tion or development account for morethan $11.0 billion, or 8 percent of thetotal need. Source development is asmall portion of the total need, but animportant step in the provision of safedrinking water and compliance withthe SDWA. Poor-quality source watercan threaten public health and force asystem to use expensive treatment.
Adequate source quantity is also animportant consideration. A sourcemust meet demand on a hot summerday or during fire flow to prevent back-siphonage of contaminated water.Back-siphonage results from lowpressure in the distribution system.Source needs range from huge newsurface water reservoirs for largemetropolitan areas, such as LosAngeles, to new wells for very smallsystems.
This rural midwestern well is poorly located. Grazing and farmingaround the well house pose a threat through microbiological andnitrate contamination.
Dan
Fra
ser
Drinking Water Infrastructure Needs Survey 15Findings
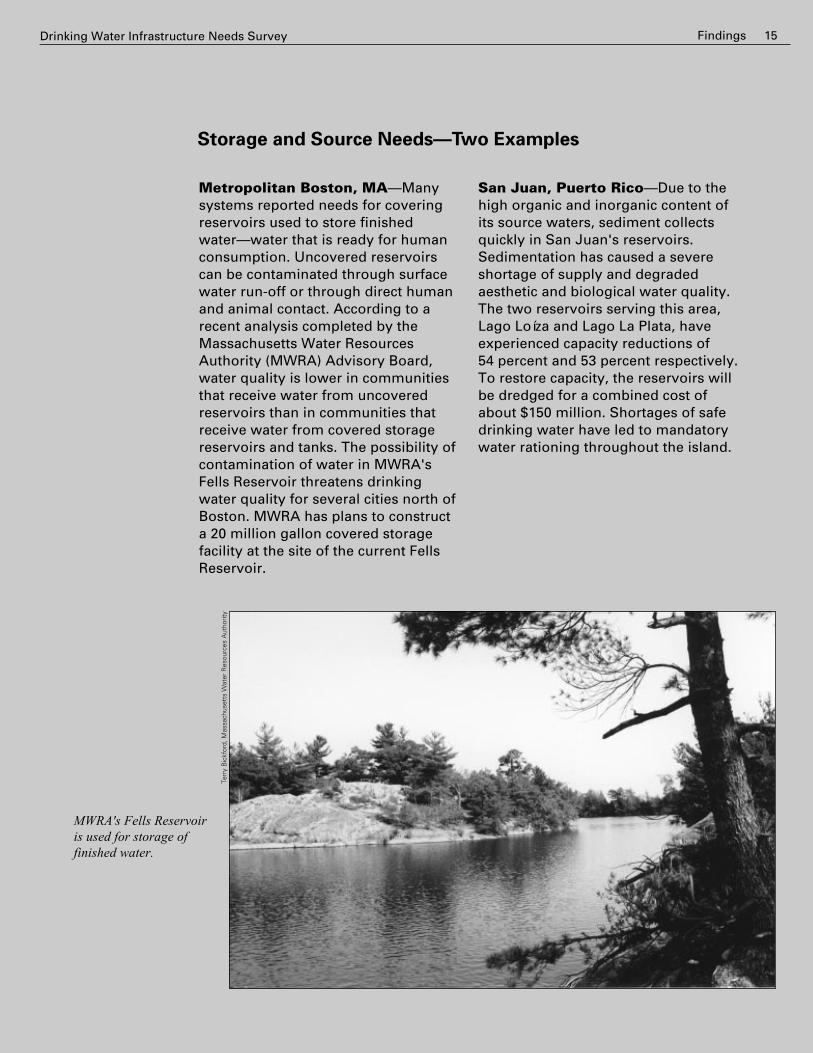
Metropolitan Boston, MA—Manysystems reported needs for coveringreservoirs used to store finishedwater—water that is ready for humanconsumption. Uncovered reservoirscan be contaminated through surfacewater run-off or through direct humanand animal contact. According to arecent analysis completed by theMassachusetts Water ResourcesAuthority (MWRA) Advisory Board,water quality is lower in communitiesthat receive water from uncoveredreservoirs than in communities thatreceive water from covered storagereservoirs and tanks. The possibility ofcontamination of water in MWRA'sFells Reservoir threatens drinkingwater quality for several cities north ofBoston. MWRA has plans to constructa 20 million gallon covered storagefacility at the site of the current FellsReservoir.
San Juan, Puerto Rico—Due to thehigh organic and inorganic content ofits source waters, sediment collectsquickly in San Juan's reservoirs.Sedimentation has caused a severeshortage of supply and degradedaesthetic and biological water quality.The two reservoirs serving this area,Lago Loíza and Lago La Plata, haveexperienced capacity reductions of54 percent and 53 percent respectively.To restore capacity, the reservoirs willbe dredged for a combined cost ofabout $150 million. Shortages of safedrinking water have led to mandatorywater rationing throughout the island.
Storage and Source Needs—Two Examples
Drinking Water Infrastructure Needs Survey 15Findings
Terr
y B
ickf
ord,
Mas
sach
uset
ts W
ater
Res
ourc
es A
utho
rity
MWRA's Fells Reservoiris used for storage offinished water.
16 Findings Drinking Water Infrastructure Needs Survey
The total need for large systems issignificantly higher than the need formedium or small systems—$58.5 bil-lion. On a per-household basis,however, this need is the smallest ofthe three system sizes, as shown inExhibit 4.
Medium systems have the second-largest total need—$41.4 billion. Thesesystems typically serve small metro-politan areas and suburban towns.They serve about a third of thepopulation nationally and providewater to over half of the residents in 10States, including Alabama, Idaho,Maine, Minnesota, Mississippi, NorthDakota, South Carolina, Vermont, WestVirginia, and Wyoming. The smallest ofthe medium systems have operatingand financial characteristics similar tosmall systems.
Unique Needs of Small Systems
The infrastructure need for smallsystems totals $37.2 billion. Althoughthis is the smallest need of the threesystem sizes, it represents the largestper-household need, as shown inExhibit 4. Small systems are locatedthroughout the country. Most Stateshave hundreds of these systems. Someare villages or small towns, others areretirement communities and mobilehome parks. Although many smallsystems are located in rural areas, asignificant number are found inmetropolitan areas.
Need by System Size
The need attributable to large,medium, and small water systems isdifferent in each State. Exhibit 5 (onpages 18 and 19) shows State-by-Stateneed for each system size.
Large drinking water systems consti-tute a small fraction of the communitywater systems in the nation, but theyprovide water to more than half of thepopulation served by community watersystems. Small systems, in contrast,make up the vast majority of systems,but serve only about 10 percent of thepopulation. In spite of their differences,the survey found that all system sizeshad similar types of needs. Forexample, the largest category of needfor all three system sizes was transmis-sion and distribution. This categoryaccounted for over half of the needs foreach system size.
Exhibit 4: Average 20-Year Per-Household Need(Total need in Jan. '95 dollars)
$970$1,200
$3,300
Large Medium Small
Systems
Need
Drinking Water Infrastructure Needs Survey 17Findings
Per-household costs are high for smallsystems because they lack economiesof scale. The fixed costs of infrastruc-ture must be spread over a smallcustomer base, resulting in a highercost for each gallon produced.
In many instances, water from smallsystems poses public health risksbecause system components wereimproperly designed and constructed.Many small systems were built withoutreview of plans and specifications andwere not required to adhere tominimum design and constructionstandards. In some cases, entire watersystems must be replaced.
Eighty-one percent of small systemsneed to upgrade distribution systems.Systems with poorly designeddistribution mains often suffer fromlow pressure problems and theassociated risk of contamination.
Most small systems use ground watersources. In this type of system, theabsence of disinfection can be apressing public health concern.Disinfection minimizes the threat frommicrobiological contaminants that cancause severe gastrointestinal illnessand sometimes lead to death. Over10 percent of small ground watersystems have a current need to installor replace disinfection.
Two-thirds of small systems need toimprove their sources, which areusually wells. Older wells oftenbecome clogged with sediment orencrusted with calcium carbonate oriron bacteria.
Dan
Fra
ser
This water system on the Mexican border serves a minority community of about175 people. The system stores its water in a deteriorated hydropneumatic tank.Small diameter galvanized steel mains make up the distribution system, and servicelines consist of ordinary garden hoses. The condition of this system currentlypresents acute health risks to the residents of this community. The small diametermains pose a threat through back-siphonage. The hoses pose a threat throughaccidental cross-connection or breakage. While one solution to the community'swater problems is to replace all system components, another is to replace thedistribution system and to connect to the city system, which has a main only 50 feetaway. Connecting to the larger system would be the best and most cost effectivesolution.
18 Findings Drinking Water Infrastructure Needs Survey
Total Need for All System Sizes$137.1 billion in Jan. '95 dollars
Large System Need$58.5 billion in Jan. '95 dollars
District ofColumbia
American Samoa *
Guam *
Northern Mariana Is. *
American Samoa *
Guam *
Northern Mariana Is. *
Puerto Rico
Virgin Islands *
Virgin Islands *
Puerto Rico
District ofColumbia
Exhibit 5: Overview of Need by System Size†
Not to scale †Does not include the need for American Indian or Alaska Native water systems.
- Less than 1 percent- 1 to 1.99 percent- 2 to 2.99 percent- 3 percent or more
State need as a percent of the total20-year need for each system size.
Drinking Water Infrastructure Needs Survey 19Findings
Not to scale
Small System Need$37.2 billion in Jan. '95 dollars
Medium System Need$41.4 billion in Jan. '95 dollars
District ofColumbia
District ofColumbia
American Samoa *
Guam *
Northern Mariana Is. *
American Samoa *
Guam *
Northern Mariana Is. *
Virgin Islands *
Puerto Rico
Puerto Rico
Virgin Islands *
Exhibit 5: Overview of Need by System Size (cont.)
- Less than 1 percent- 1 to 1.99 percent- 2 to 2.99 percent- 3 percent or more
State need as a percent of the total20-year need for each system size.
* The need for American Samoa, Guam, the Northern Mariana Islands, and the Virgin Islands is less than 1 percent each.
20 Findings Drinking Water Infrastructure Needs Survey
Poorly constructed wells can also leadto public health risks. Water drawnfrom improperly constructed wellsfaces an increased risk of microbiologi-cal contamination. Poor siting can alsolead to contamination. For example,wells located near sources of contami-nation such as septic systems, feedlots, fuel tanks, or pesticide storage areat risk.
Small systems also have a substantialneed to treat for secondary contami-nants such as iron and manganese.Over 5,000 small systems have a needto treat for these contaminants, at acost of $2.2 billion. Although thesecontaminants do not pose a directhealth risk, they affect taste, odor, andcolor. As a result, consumers may seekalternative drinking water sources thatare aesthetically acceptable, but maycontain contaminants that pose serioushealth risks.
For small systems located near largersystems, the least costly way to resolveinfrastructure needs may be to connectwith a larger system. According to thesurvey, this would be the most costeffective way to protect public healthfor over 13 percent of small systems.
Dan
Fra
ser
This well in New York State supplies water to a small system.The well is located in a pit, making it vulnerable to contamina-tion through flooding. The pit is also an unventilated confinedspace. In such spaces, the atmosphere can become poisonousand dangerous for the operator. The chlorine bottles areevidence that short-term ineffectual attempts have been made tocontrol microbiological contamination. This well should bereconstructed so that it can provide safe water and not pose athreat to the operator.
Drinking Water Infrastructure Needs Survey 21Findings
Need by Safe Drinking WaterAct Regulation
Needs for maintaining compliance withthe SDWA constitute a portion of eachcategory of need. SDWA needs includeprojects for treatment of contaminantsregulated under the Act. SDWA needsalso include projects to replacecontaminated sources and storage orto improve transmission lines thatprovide disinfectant contact time.
Current SDWA Need
Capital costs for projects needed nowto ensure compliance are defined ascurrent SDWA needs. Exhibit 6summarizes the current SDWA andSDWA-related need.
Existing Regulations. Approximately$12.1 billion is needed now forcompliance with the SDWA. Treatmentfor microbiological contaminantsregulated under the SWTR and the TCRaccounts for $10.2 billion—about84 percent of the current SDWA need.These contaminants can lead togastrointestinal illness and, in extremecases, death. Almost $0.2 billion isneeded to meet standards for nitrate,which has acute health effects forchildren, and $1.7 billion is needed forcontaminants that pose chronic healthrisks.
The current SDWA need is overstated.Many SDWA projects include compo-nents that are related but not attribut-able to the SDWA. Also, federalregulations are one of many factorsthat drive investment in drinking water
facilities. States had standards in placeprior to the SDWA that would haveeventually required systems to investin many of the projects included in thesurvey. Regardless of regulations,infrastructure approaching the end ofits useful life must be rehabilitated andreplaced to provide a consistent levelof water quality and service. Theenactment of the SDWA and thepromulgation of its regulations has,however, placed more stringentmonitoring and treatment require-ments on many systems. In manycases, these requirements haveprompted systems to act sooner tosolve their public health problems thanthey would have in the absence of theSDWA. It is impossible to ascertainhow much of the need would exist inthe absence of the SDWA.
Exhibit 6: Current Safe Drinking Water Act Need
(in billions of Jan. '95 dollars)
Note: Numbers may not total due to rounding.* Regulations for contaminants that cause acute health effects.† Includes arsenic, barium, cadmium, chromium, fluoride, mercury, selenium,
combined radium -226, -228, and gross alpha particle activity.
snoitalugeRgnitsixE deeN
*eluRtnemtaerTretaWecafruS 1.01$
*eluRmrofiloClatoT 1.0$
*dradnatSetartiN 2.0$
eluRreppoC&daeL 9.0$
)stnanimatnoclacimehc(seluRV&,II,IesahP 4.0$
dradnatSsenahtemolahirTlatoT 2.0$
sdradnatSrehtO † 2.0$
snoitalugeRgnitsixElatoT 1.21$
deeNdetaleR-AWDS deeN
*)RCT(stnemevorpmInoitubirtsiD 3.22$
deeNdetaleR-AWDSlatoT 3.22$
22 Findings Drinking Water Infrastructure Needs Survey
Existing regulations for microbio-logical contaminants. Regulations tominimize microbiological contamina-tion account for $10.2 billion of thecurrent SDWA need. Microbiologicalcontaminants regulated under theSWTR and the TCR can pose a healthrisk to consumers, especially to thosewith weakened immune systems.According to conservative estimatesfrom the Centers for Disease Controland Prevention (CDC), waterbornedisease outbreaks between 1986 and1992 led to illness in approximately47,600 people.
Almost all of the need for projects tominimize microbiological contamina-tion is associated with the SWTR. Thisregulation accounts for almost$10.1 billion. The SWTR ensures that
water systems using surface watersources treat to minimum standards tocontrol microbiological contaminantssuch as Giardia lamblia, viruses, andLegionella. The SWTR also applies toground water systems with sourcescontaining microbiological contami-nants typically found in surface waters.
Almost 40 percent of water systemscovered by the SWTR reported atreatment need to maintain compliancewith the rule. A portion of this need,approximately $1.9 billion, is forprojects to install filtration plants forwater systems that are currentlyunfiltered. These systems now usedisinfection as the sole treatmentbarrier for microbiological contami-nants. Also included in the SWTR needare upgrades to plants where currentfacilities cannot ensure continuedcompliance with the rule. A fewexamples of cities that need to installor replace filtration plants are offeredin the accompanying sidebar.
Other existing regulations. Nation-wide, an estimated $0.2 billion isneeded for treatment of nitrate. Theentire amount is needed now. Al-though the need for nitrate is a smallpercentage of the total need, the natureof the health threat makes the needsignificant for systems that exceedallowable limits. Exposure to highlevels of nitrate is dangerous to infantsand pregnant women because itcauses “blue baby syndrome.” Inaddition, treating for nitrate ordeveloping alternative sources can beexpensive. Survey respondents withhigh levels of nitrate reported needsaveraging $6.7 million per system totreat existing sources or develop newsources.
Need to Install, Replace, or Upgrade Filtration Plants(in millions of Jan. '95 dollars)
New York City, NY*Metropolitan Boston, MAMetropolitan Los Angeles, CASan Diego, CADetroit, MISacramento, CAOmaha, NEMacon, GASeattle, WATulsa, OKGreenville, SCNewport News, VAKansas City, KS
$533$452$276$210$180$120$109$105$97$76$59$56$55
*Covers only the Croton supply (approximately 10% of total NYC supply)
Drinking Water Infrastructure Needs Survey 23Findings
2 William C. Levine, William T. Stephenson, and Gunther F. Craun, “Waterborne Disease Outbreaks,1986-1988,” CDC Surveillance Summaries, March 1990. MMRW 39(No. SS-1):1; Barbara L. Herwaldt,et al. “Waterborne Disease Outbreaks, 1989-1990,” CDC Surveillance Summaries, December 1991.MMRW 40(No.SS-3):1; Anne C. Moore, et al. “Surveillance for Waterborne Disease Outbreaks—United States, 1991-1992,” CDC Surveillance Summaries, November 1993. MMRW 42(No. SS-3):1-2
Current needs identified by watersystems to address contaminants withchronic health risks total $1.7 billion.Chronic health effects include cancerand, in the case of lead, alterations inthe physical and emotional develop-ment of children. Some of the mostfrequently reported treatment needs inthis category are associated with lead,trihalomethanes, tetrachloroethylene,trichloroethane, and atrazine.
SDWA-Related Need. An additional$22.3 billion is needed now to replacedeteriorated distribution piping thatposes a threat of coliform contamina-tion. Distribution piping replacement iscategorized as a SDWA-related needbecause the monitoring required underthe TCR helps to identify problems inthe distribution system. However,these problems would exist in theabsence of TCR monitoring and wouldeventually degrade water quality andservice to the extent that problemswould be detected without the TCR.
Deteriorated piping can break or leak,allowing fecal matter to enter drinkingwater, carrying disease-causingorganisms. The TCR provides watersystems with a framework for monitor-ing the microbiological status of theirdistribution systems. By early detectionof microbiological contamination,systems can avoid outbreaks of illness.Occasionally, microbiological contami-nation from pipe breaks or leaks can besevere. One extreme case occurred inthe town of Cabool, Missouri, where in1989 four people died when a pipebreak led to contamination of water inthe town’s distribution system.2
This pipe section was replaced because it had sprung numerousleaks, posing a threat of microbiological contamination.
Dan
Fra
ser
24 Findings Drinking Water Infrastructure Needs Survey
Exhibit 7: Future Safe Drinking Water Act Need
(in billions of Jan. '95 dollars)
Future SDWA Need
Future SDWA needs are projectsneeded for compliance over the next20 years. Exhibit 7 summarizes thefuture SDWA and SDWA-related need.
Existing Regulations. In addition tothe $12.1 billion needed now to complywith the SDWA, $4.2 billion will beneeded over the next 20 years forexisting SDWA regulations. This needis for replacing infrastructure thatassures compliance now, but, due toaging and deterioration, will requirereplacement in the next 20 years. Over75 percent of this need, almost$3.3 billion, is to protect againstmicrobiological contaminants. Asmaller portion of this need, $0.8 bil-lion, is for lead service line replace-ment under the Lead and Copper Rule.
Proposed Regulations. An estimated$14.0 billion will be needed to complywith recently promulgated regulationsand proposed regulations that arepriorities for promulgation. Theseregulations include the D/DBPR($8.9 billion), the ESWTR ($5.1 billion)and the recently promulgated ICR($60 million).
The proposed D/DBPR will minimizethe undesirable reaction that occursbetween disinfectants and the organicmaterial and bromide that are presentnaturally in water. The reaction formshundreds of disinfection byproducts.Some of the disinfection byproducts
Faye
r an
d U
nger
, 198
7
Scanning electronmicrograph of sporozoitesof the parasitic protozoanCryptosporidium leavingthe protective shell of theoocyst. Cryptosporidium inthis life-cycle stagecolonizes the smallintestine and can causesevere illness. Crypto-sporidium, a priority forregulation, is much moreresistant to typicaldisinfection practices thanmicrobiological pathogenscurrently regulated underthe SDWA.
Note: Numbers may not total due to rounding.* Includes Surface Water Treatment Rule, Total Coliform Rule, and the Nitrate Standard† Includes lead and copper, Phase I, II, and V Rules, total trihalomethanes, arsenic,
Drinking Water Infrastructure Needs Survey 25Findings
future regulations are not presentedelsewhere in this report because safetystandards, cost estimates, andregulatory approaches have not beenfinalized. New or revised standards forthese contaminants may result inneeds ranging between $1.7 billion and$14.8 billion, depending on how theyare regulated. Exhibit 8 shows theestimated range of cost by regulation.Needs for the Ground Water Disinfec-tion Rule, which is a priority forregulation, are not included in thisreport because cost estimates have notbeen developed. More information onregulations that may be promulgatedin the future is in Appendix C.
SDWA Need by Category
A portion of the total in each categoryof need—transmission and distribu-tion, treatment, storage, and source—isfor compliance with the SDWA. Thelargest portion of the current andfuture SDWA need is for treatment.Also, there is a significant need fordistribution system repair, which isconsidered a SDWA-related need.
are known to be toxic or are probablehuman carcinogens. Under the ESWTR,EPA plans to regulate Cryptospo-ridium, a parasitic protozoan that isresponsible for several waterbornedisease outbreaks and many othercases of acute illness in the UnitedStates. The ICR was designed to gatherdata needed to design the D/DBPR andthe ESWTR.
Cost estimates for these regulationswere taken from the preambles of theFederal Register notices proposing therules. These estimates are based onEPA’s best knowledge of existinginfrastructure and on estimates of thepaths most likely to be taken by watersystems to reach compliance. They arerough cost estimates, and should notbe considered as accurate as the costestimates for existing regulationsderived from the Needs Survey.Estimates for these regulations includeneeds for non-community watersystems, which are not includedelsewhere in this report. Needs fornon-community water systems,however, are a very small portion ofthe projected need for these regula-tions.
SDWA-Related Need. An additional$13.5 billion is needed for futurereplacement of distribution piping.Deterioration of this piping will pose athreat of coliform contamination if it isnot replaced on schedule.
Future Regulations Not Includedin the Total Need
EPA may promulgate additional SDWAregulations. Future regulations beingconsidered under the SDWA are forradon and other radionuclides, arsenic(revision), and sulfate. Needs for these
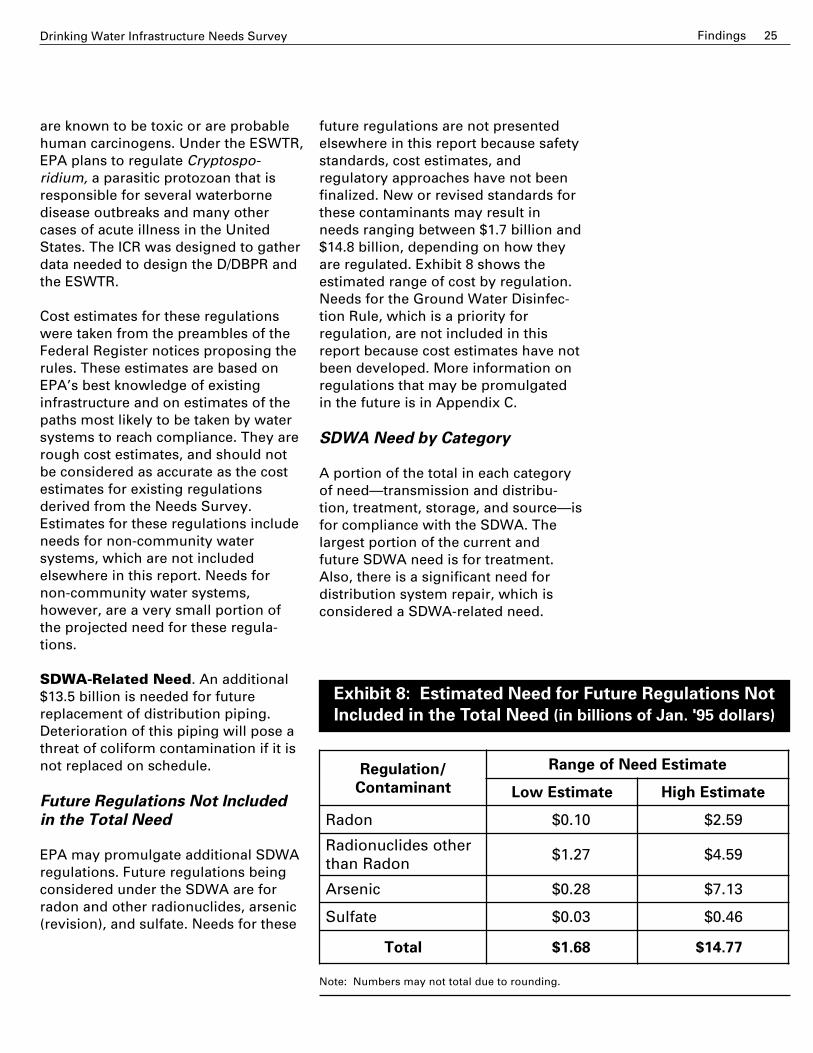
Exhibit 8: Estimated Need for Future Regulations Not
Included in the Total Need (in billions of Jan. '95 dollars)
Note: Numbers may not total due to rounding.
/noitalugeR
tnanimatnoC
etamitsEdeeNfoegnaR
etamitsEwoL etamitsEhgiH
nodaR 01.0$ 95.2$
rehtosedilcunoidaRnodaRnaht
72.1$ 95.4$
cinesrA 82.0$ 31.7$
etafluS 30.0$ 64.0$
latoT 86.1$ 77.41$
26 Findings Drinking Water Infrastructure Needs Survey
Treatment accounts for almost90 percent of the current SDWA need($10.7 billion of $12.1 billion) and over95 percent of the future SDWA need($17.3 billion of $18.2 billion). TheseSDWA treatment needs are fortreatment of contaminants currentlyregulated or proposed for regulationunder the Act. Non-SDWA treatmentneeds include projects for groundwater disinfection, which minimizesthe threat from microbiologicalcontaminants. Non-SDWA treatmentneeds also include treatment forsecondary contaminants and otherunregulated contaminants, installationof fluoridation facilities, and projects toupgrade process control measures attreatment plants.
A significant portion of the transmis-sion and distribution need isSDWA-related. Current SDWA-relatedneeds total $22.3 billion and futureSDWA-related needs total $13.5 billion.These needs are for replacement ofdeteriorated distribution piping, whichcan lead to microbiological contamina-tion. Distribution piping replacement isconsidered a SDWA-related needbecause the monitoring required underthe TCR helps to identify problems inthe distribution system.
In addition to the SDWA-related needfor compliance with the TCR, a smallportion of the transmission anddistribution need is for compliancewith other SDWA rules. About$0.8 billion of the transmission anddistribution need is for current SDWAcompliance, and $0.8 billion is forfuture compliance. This need consistsmainly of transmission lines toimprove disinfectant contact time andreplacement of lead service lines. Non-SDWA needs include transmissionmains to carry water from the sourceto treatment or from treatment to thedistribution system. In addition,distribution lines to extend service toexisting households not currentlyconnected to the water system are notattributed to the SDWA. Although theyare not required for compliance withthe SDWA, these transmission anddistribution needs are essential forensuring a safe supply of water fordrinking and other uses.
Only a small portion of storage andsource needs—$0.6 billion of thecurrent need and $0.1 billion of thefuture need—are attributable to theSDWA. These needs are for projects toreplace contaminated sources orimprove disinfectant contact time.Non-SDWA source and storage needsare for new or rehabilitated wells,surface supplies, or storage facilities.Projects for these needs are to ensurecontinued water service or to providean adequate supply of water duringperiods of peak usage.
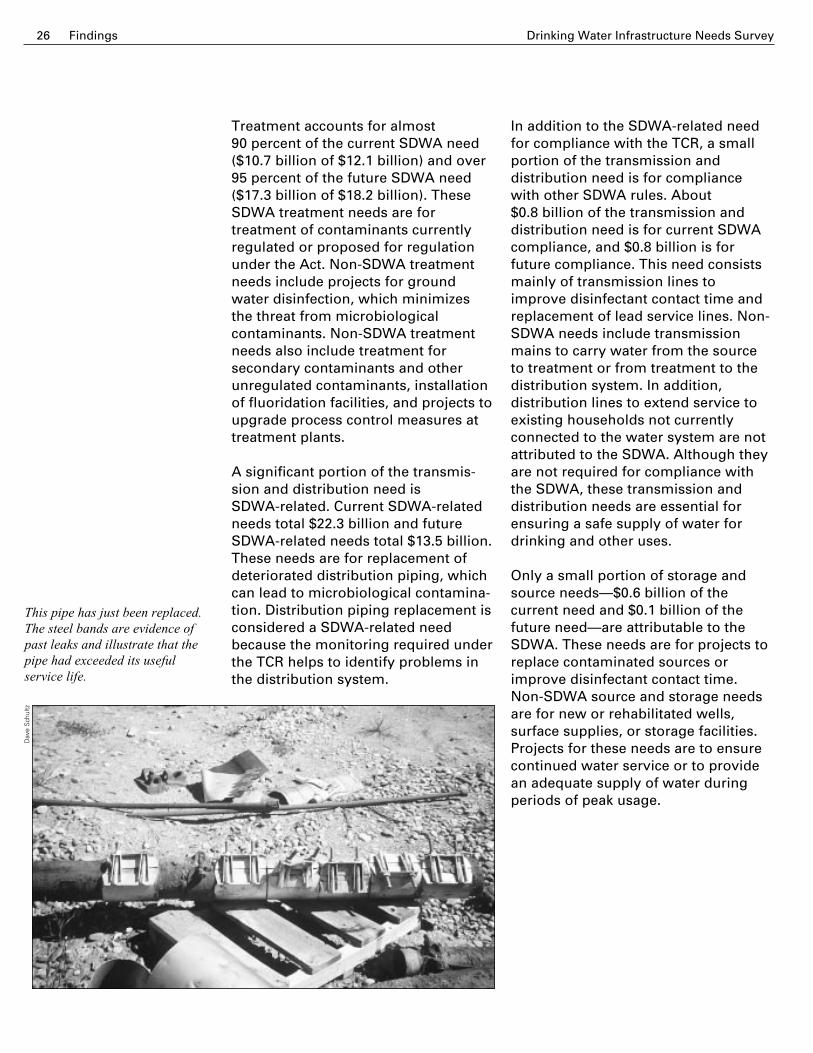
Dav
e S
chul
tz
This pipe has just been replaced.The steel bands are evidence ofpast leaks and illustrate that thepipe had exceeded its usefulservice life.
Drinking Water Infrastructure Needs Survey 27Findings
Need for American Indian andAlaska Native Water Systems
The total 20-year need for the 884American Indian and Alaska Nativewater systems is $1.3 billion; $0.56 bil-lion for American Indian systems and$0.77 billion for Alaska Native systems.Of this total, approximately $1.1 billionis needed now to replace existinginfrastructure or to extend a watersystem's service to nearby householdsthat do not have safe running water.The survey of American Indian andAlaska Native water systems wasconducted in consultation with IHS.American Indian and Alaska Nativerepresentatives participated in surveydesign and implementation.
This section of the report provides anoverall picture of the needs of Ameri-can Indian and Alaska Native watersystems. The IHS Sanitary DeficiencySystem (SDS) provides information onspecific needs and ranks communities'needs based on threats to publichealth.
Needs reported here for AmericanIndian and Alaska Native systems areconservative. Projects solely for futuregrowth were not included, nor wereneeds for non-community watersystems. But more importantly for theAmerican Indian and Alaska Nativesurvey, only needs associated withexisting water systems were collected.Data were not gathered for homes or
groups of homes that do not currentlyhave running water and are too distantfrom existing water systemsfor interconnection. A greaterproportion of American Indianand Alaska Native householdslack running water than dohouseholds in the country as awhole.
Needs for American Indian andAlaska Native water systems are high,averaging almost $43,500 per house-hold for Alaska Native communitiesand over $6,200 per household forAmerican Indian systems for the20-year period covered by the survey.These needs are high for a number ofreasons. Many American Indian andAlaska Native people now carry theirwater from a public watering point at acommunity water system. Providingpiped water to these households ofteninvolves substantial expansion andmodification of existing facilities. Thisis especially true in Alaska Nativecommunities.
The Drinking Water InfrastructureNeeds Survey places the total 20-yearneed for American Indian and AlaskaNative water systems at $1.3 billion.
Indi
an H
ealth
Ser
vice
The remoteness of American Indian and AlaskaNative communities often requires thatcommunities bring in equipment and construc-tion material by unconventional means.
28 Findings Drinking Water Infrastructure Needs Survey
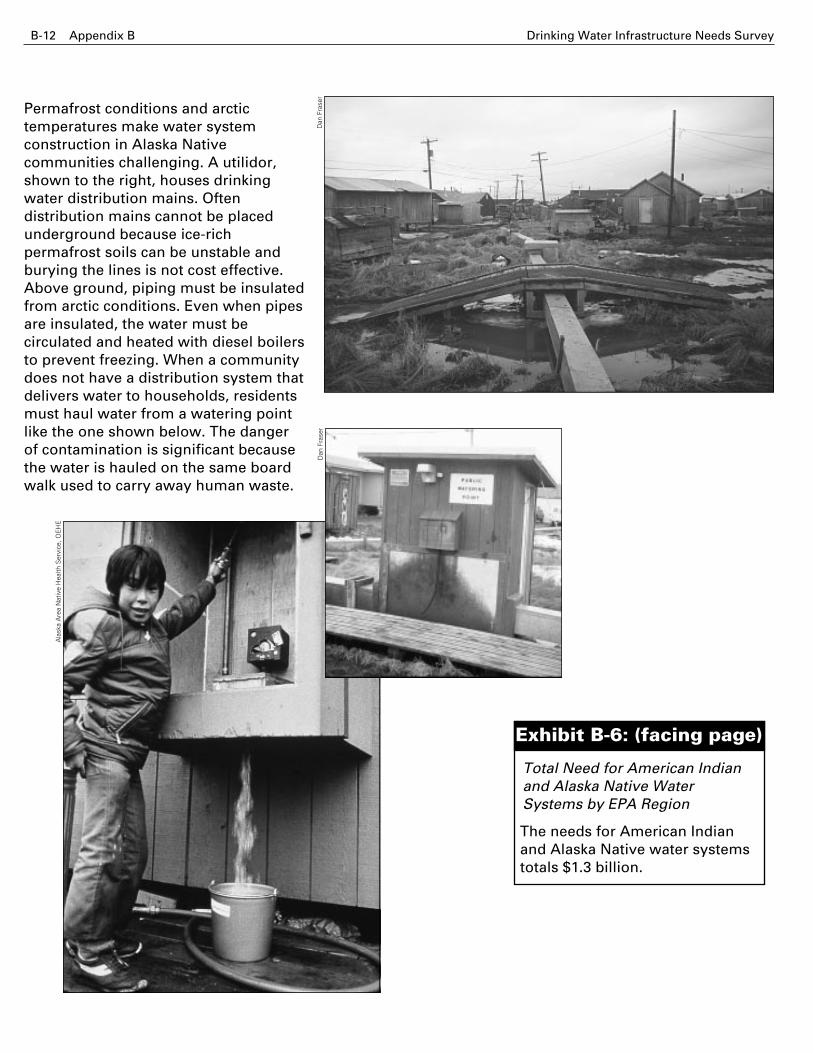
Distribution mains in manyarctic Alaska Native communi-ties must be constructed aboveground because ice-richpermafrost soils are oftenunstable. Water must becirculated and heated so that itdoes not freeze during arcticwinters.
Like other systems throughout thecountry, most needs faced by Ameri-can Indian and Alaska Native systemsare associated with transmission anddistribution and with treatment. AlaskaNative systems, because of the limitedavailability of sources during thewinter, also have high storage costs.These categories and unique aspects ofthe needs of American Indian andAlaska Native water systems arediscussed in greater detail below.
Alaska Native Water Systems
Transmission and Distribution.Transmission and distribution accountfor about half of the total Alaska Nativewater system need. Alaska Nativecommunities often face uniquechallenges in constructing transmis-sion and distribution systems. Becauseof freezing and structural stabilityproblems associated with permafrost,they are frequently unable to useconstruction methods typical of thelower 48 States. This is particularly truefor communities located near or northof the Arctic Circle. Often, the mostcost effective construction methodavailable to these communities isaboveground construction of housedand insulated mains called “utilidors.”To be effective and reliable, mainsmust be constructed in “loops” so thatwater can be heated and continuallycirculated to prevent freezing. For thesame reasons, water must be circu-lated to and from homes throughlooped circulating service lines. Manysystem components, includingcirculation pumps, boilers, andgenerators, must be paired to providethe redundancy necessary to minimizerisk of failures that would result infrozen water lines and pumps. Suchfailures would be certain to causeextended loss of service and requireextensive repair or complete replace-ment of the system.
Because many American Indian andAlaska Native systems are located inareas remote from other communities,tying into a larger water system orjoining with other communities to forma consolidated water system is oftenimpractical. Some of these systemsface significantly higher costs becauseof the difficulty in obtaining andtransporting materials. AmericanIndian and Alaska Native systemsencounter additional problemsbecause of arid or permafrost condi-tions, both of which make watersources difficult to find. Finally, likeother small communities, they oftenlack economies of scale.
These problems are made worse bythe fact that about 30 percent ofAmerican Indians and Alaska Nativeshave incomes below the poverty level.Many American Indian and AlaskaNative people live through traditionalsubsistence farming, hunting, andfishing and do not generate significantcash income.
Dan
Fra
ser
Drinking Water Infrastructure Needs Survey 29Findings
Schematic of an Arctic Alaska Water Systemaaaaaaaaaaaaaaaaaaaaaaaaaaaaaaaaaaaaaaaaaaaaaaaaaaaaaaaaaaaaaaaaaaaaaaaaaaaaaaaaaaaaaaaaaaaaaaaaaaa a aaaaaaaaaaaaaaaaaaaaaaaaaaaaaa a aaaaaaaaaaa a aa aaaaa aaaaaaaaaaaaaaaaaaaaaaaaaaaaaaaaaaaaaaaaaaaaa aaaaaaaaaaaaaaaaaaaaaaaaaaaaaaaaaaaaaaaaaaaa a aaaaaaaaaaaa a a aaaaaaaaaaaaaa aaaaaaaaaaaaaaaaaaaaaaaaaaaaaaaaaaaaaaaaaaaaaaaaaaaaaaaaaaaaaa aaaaaaPilings
Insulatedwater
storagetank
HeatExchangers
ServiceLine
CooledWater-Glycol
Mix
HeatedWater-Glycol
Mix
Redundant Pumps
Cold Water
ReturnLine
FuelStorage
Permafrost
CustomersTreatment Plant/
Washeteria
Generator
WaterDistribution
Line
RedundantBoiler
Boiler
Warmed Water
Cold Water
Warmed Water
29Findings
Supplying water in arctic conditions presents unique engineering challenges. To be structurally sound,heated facilities such as the water treatment facility and storage tank must be constructed on pilings orlarge pads made of imported gravel. In addition to the components diagramed here, the water treatmentplant often houses a washeteria with showers, toilets, and laundry facilities.
Drinking Water Infrastructure Needs Survey
30 Findings Drinking Water Infrastructure Needs Survey
Atqasuk, an Alaska Native water system, is located north of theArctic Circle. Water for the community must be treated and storedfor the winter during a brief “window of opportunity” when icemelts each summer. The cartridge filters below cannot provideadequate treatment and need to be replaced with a conventionalfiltration plant. Also, the water system does not have adequatestorage to provide the community with running water year-round.New insulated storage, like the tank shown, is needed.
Treatment and Storage. Together,projects to install or replace treatmentand storage facilities for Alaska Nativecommunities represent over a third oftheir reported need. Approximately80 percent of Alaska Native watersystems have needs for treatment.Approximately 85 percent of AlaskaNative water systems have needs forstorage.
Approximately half of all Alaska Nativecommunities rely on surface watersources; the rest rely on ground water.Treatment of ground water and surfacewater present very similar problemsand expenses in arctic conditions. Thelimited ground water sources availableare often of poor quality, containingvery high concentrations of iron andmanganese. These contaminants mustbe removed by techniques commonlyassociated with surface water treat-ment as practiced in the lower 48States. As a result, the processesemployed for treating ground water
and surface water sources, and theassociated capital improvement costs,are very similar despite differences inthe contaminants and associatedhealth risks.
Treatment of surface water in arcticconditions can present unusual anddifficult problems. Winter darkness,permafrost, frozen source water,subzero temperatures, and arcticweather conditions can make itimpractical to pump water from asurface water source to the treatmentplant. Some communities in Alaska’sNorth Slope Borough have a “windowof opportunity” for treatment whichlasts only six to eight weeks during thesummer. These communities treat afull year’s supply of water in this shortperiod of time. Successful operation ofthis type of system requires insulatedand heated storage facilities withcapacity of 365 days of water ascompared to the one or two daysstorage common to systems in more
Dan
Fra
ser
Dan
Fra
ser
Drinking Water Infrastructure Needs Survey 31Findings
temperate climates. Compoundingproblems and expenses, facilities mustbe capable of treating and pumpingwater at six or more times the rate thatwould be needed if they could treatdaily. Finally, paired components suchas boilers, pumps, and standbygenerators are necessary to heat andcirculate water to keep storage,treatment, and distribution systemsfrom freezing.
The total capital improvement costs forAlaska Native communities are drivenupward further due to the shortconstruction season and the cost oftransporting equipment and materials.In many cases, materials and equip-ment must be brought in on bargeswhen summer temperatures makerivers navigable. In some cases,airlifting materials becomes necessary.
American Indian Water Systems
Transmission and Distribution.American Indian water systems canalso face problems associated withtheir location. Many American Indiancommunities are distant from othertowns and communities, so they mustconstruct and maintain their own watersystems. The cost-saving option ofconnecting to and purchasing waterfrom an existing system usually is notavailable for these systems becausethey are so remote. Because of therural, widely-dispersed nature of manyAmerican Indian communities, morelinear feet of water transmission anddistribution line is necessary percustomer served. Almost 40 percent ofAmerican Indian needs are fortransmission and distribution.
Treatment. About a third of AmericanIndian needs are for treatment. Watersources can be difficult to find in thearid country in which many AmericanIndian communities are located and,when found, water is often of poor
quality. American Indian communitiesfrequently are forced to use sourcesthat are expensive to treat. Over half ofAmerican Indian systems have needsfor treating their ground water sources,while about 30 percent of similarly-sized ground water systems regulatedby the States have treatment needs.
For many American Indian watersystems, surface waters are the bestsources available. Treatment of surfacewater is usually more expensive thanground water treatment and is crucialbecause of the potential health threatfrom microbiological contaminants.Seventy-five percent of AmericanIndian surface water systems havecapital improvement needs fortreatment, compared to 50 percent ofsimilarly sized surface water systemsregulated by the States.
Exhibit 9 shows the location of Ameri-can Indian Tribal lands and AlaskaNative water systems. A detailedbreakdown of American Indian andAlaska Native need can be found inAppendix B, Exhibits B-6 through B-8.
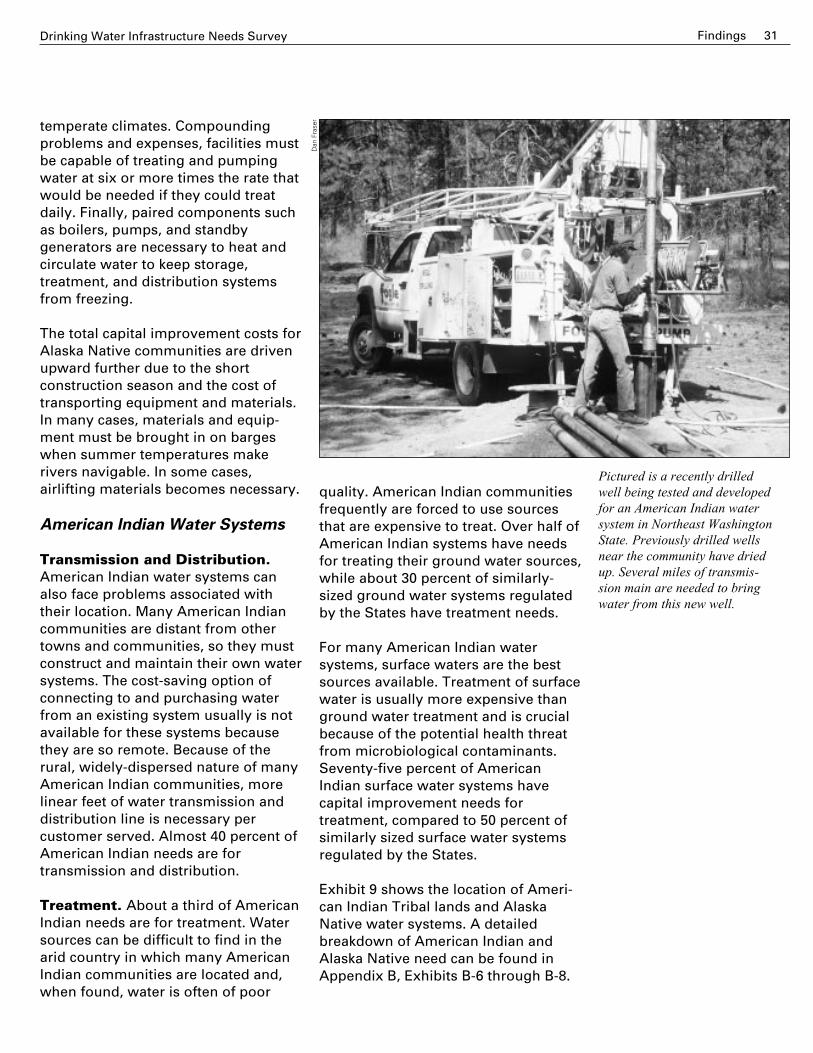
Dan
Fra
ser
Pictured is a recently drilledwell being tested and developedfor an American Indian watersystem in Northeast WashingtonState. Previously drilled wellsnear the community have driedup. Several miles of transmis-sion main are needed to bringwater from this new well.
32 Findings Drinking Water Infrastructure Needs Survey
Top of mesa where thetraditional community islocated.
Chuck Villa, water systemoperator, looking down atthe exposed transmissionmain ascending the face ofthe cliff.
32 Findings Drinking Water Infrastructure Needs Survey
Dan
Fra
ser
Dan
Fra
ser
The Hopi Indian community of Polacca in northeastern Arizona provides water to traditionalAmerican Indian homes located on the top of a mesa. Provision of safe drinking water underthese circumstances presents some unusual and difficult problems. Water from the town's wellsmust be pumped, via an aboveground transmission line, up the rock face of the mesa to thehomes. The exposed transmission line is subject to breaks caused by freezing and corrosion.When the pipe breaks, water pressure in the mesa system can be lost, making the uppercommunity vulnerable to contamination. In addition, the mesa community relies on a hydrop-neumatic tank to provide pressure in the water system. During power failures, water is pulleddown the transmission main by gravity, causing negative pressure in distribution piping on themesa and inviting contamination of the system. To prevent these health risks, the transmissionmain would have to be protected from freezing by being buried below the frost line or by othermethods of insulation and/or heating. Also, standby power or an elevated storage tank wouldhave to be provided on the mesa top.
Drinking Water Infrastructure Needs Survey 33Findings
Exhibit 9: Location of American Indian Tribal Lands and Alaska Native Water Systems
Location of American Indian Tribal Lands- Federal Reservations larger than 50 square miles
- Federal Reservations smaller than 50 square miles andFederal Groups without Reservations
- Location of Alaska Native water systems
Not to scale
34 Findings Drinking Water Infrastructure Needs Survey
Non-Community WaterSystems
Because of resource constraints, theNeeds Survey did not includenon-community water systems.Non-community water systems aremade up of transient non-communitywater systems and non-transientnon-community water systems.Transient non-community watersystems serve at least 25 persons morethan 60 days out of the year, but do notregularly service any given 25 morethan 6 months of the year. Examples ofthese systems are gas stations androad side rest areas. A few are daycamps for children. Non-transientnon-community water systemsregularly serve at least 25 of the samepersons more than 6 months of theyear where those person are notfull-time residents. Examples of thistype of system are factories, schools,and office buildings.
Only those non-community watersystems that are not-for-profit areeligible to receive funding from theDrinking Water State Revolving LoanFund. These are the onlynon-community water systems thatwould be included in the NeedsSurvey. EPA estimates that 10 percentof the roughly 90,000 transientnon-community water systems andthat approximately half of the 20,000non-transient non-community watersystems are not-for-profit organiza-tions. In total, approximately 19,000non-community water systems arenot-for-profit systems.
With the data on hand, it is impossibleto accurately estimate the need ofnot-for-profit non-community watersystems. However, it is likely that their
needs are less than those of commu-nity water systems serving the samenumber of people. Non-communitywater systems usually have fewersources with less capacity, smallerstorage and treatment facilities, andvery limited transmission and distribu-tion systems. Source, storage, andtreatment facilities are smaller fornon-community water systemsbecause the population served is oftennot in full-time residence. The peakdemands faced by community watersystems—due to morning showers andnight-time meal preparation, forexample—do not occur at manynon-community water systems. Also,non-community water systems do nothave to provide capacity for fireprotection or for irrigation of residen-tial lawns. More importantly, mostnon-community water systems consistof one or perhaps a few buildings anddo not have substantial distributionand transmission networks.
A rough estimate that significantlyoverstates the need of not-for-profitnon-community water systems couldbe made by examining the source,storage, and treatment needs of thesmallest community water systems.This methodology results in a need of$125,000 per system. When this need isapplied to the not-for-profitnon-community water systems on aState-by-State basis, the relativedistribution of need among States isnot significantly affected. For thisreason and because resource con-straints prevented EPA from develop-ing a high-quality need estimate fornon-community water systems, anestimate of need for these systems wasnot included in this report.
Drinking Water Infrastructure Needs Survey 35Findings
Separate State Estimates
The Needs Survey did not includeestimates for all types of need. TwoStates felt that it was important toreport costs associated with needs notincluded in the survey. One reportedneeds for anticipated future growth,and the other reported needs forrefinancing existing loans for drinkingwater projects. The need reported bythe States in their separate Stateestimates totals $197 million. A list ofthe estimates is available inAppendix D. Separate State estimateswere not included in estimates of needlisted elsewhere in the report.
Ala
ska
Are
a N
ativ
e H
ealth
Ser
vice
, OE
HE
These Alaska Native children haul water from a public watering point.Many Alaska Native people do not have water in their homes.
Need for Households NotServed by CommunityWater Systems
Hauled water and water from untreatedsurface water sources can be providedas running water, but often it is storedin barrels. Hauled water and waterfrom untreated sources may containmicrobiological contaminants that canmake people ill. A 1984 EPA study ofnational rural water conditions foundthat total coliform bacteria werepresent in the water supplies of78 percent of households that usethese sources.3 Coliform bacteria arean indication that disease-causingmicrobiological contamination couldbe present.
Households without running water areof particular concern because opportu-nities for people to become ill areabundant when running water is notavailable. Running water is importantto basic sanitation. It is needed to flushtoilets, wash hands, prepare food, andbathe. Living conditions for house-holds without running water are belowthose that most of us take for granted.Because of a lack of data, we do notknow how many households do nothave running water, but homeswithout running water can be foundacross the nation.
The Needs Survey was not de-signed to estimate the total needfor households not served by
community water systems. Statisticsfrom the 1990 Census show thatapproximately 16 million householdsin the United States are not served bycommunity water systems. Of these,close to 15 million households areserved by private drilled or dug wellsand over 1 million households taketheir water from other sources such ascisterns, springs, rivers, lakes, or otheruntreated surface water sources. Therisks faced by households not servedby community water systems are notwell understood because of a lack ofinformation, but the available datashow that public health risks aresignificant for many of them.
Hauled Water and UntreatedSurface Water Sources. The morethan 1 million households that takewater directly from cisterns, springs,rivers, lakes, and other untreatedsurface water sources make up justover 1 percent of the total householdsin the nation. Census data show that2 percent of American Indian house-holds on federally recognized Triballands and 20 percent of mainlandAlaska Native households take theirwater from these sources.
3 U.S. EPA. Office of Drinking Water. NationalStatistical Assessment of Rural WaterConditions. EPA 570/9-84-003, June 1984.
Need for Households Not Served by Community Water Systems38 Drinking Water Infrastructure Needs Survey
The pump (insert) draws waterfrom this irrigation pond anddistributes it, without treatment,to this colonias community.
Needs for Households Not Served by Community Water Systems38 Drinking Water Infrastructure Needs Survey
Hauled Water and Untreated Sources—Three Examples
Colonias—Colonias along the Mexicanborder often do not have a safe supplyof running water. In many of thesecommunities, people haul water from acentral watering point or untreatedsurface water source. Even in caseswhere water is piped, many house-holds draw untreated water fromirrigation canals or unsafe groundwater sources that present a significantthreat of disease. In 1995, it wasestimated that 339,000 residents livedin colonias in Texas border countiesalone. Waterborne and communicablediseases are common throughout theborder area. In some towns on theTexas-Mexico border, one-third ofchildren contract hepatitis A by age 8,and nine out of ten adults by age 35.4
In a few border counties, the rate ofhepatitis A is more than triple that ofthe rest of the State. The lack of safepiped water and wastewater disposal isa significant factor contributing to thehigh incidence of disease.
The Navajo Shonto Chapter—Waterfor the Navajo Shonto area is availablefrom one central watering point that isin need of rehabilitation. The areaserved covers approximately a 15-mileradius. A photograph of this wateringpoint is in Appendix B. Although noofficial count has been taken of thepeople served by this watering point, itis estimated that 400 to 500 peoplehaul water from this location to theirhomes. Hauled drinking water faces arisk of contamination during loading,unloading, transport, and storage.
Washeterias Serving AlaskaCommunities—Especially during coldweather, the only drinking wateravailable to many Alaska Nativecommunities is from the communitywasheteria. A washeteria is a singlebuilding with showers, toilets, andwashing machines. The washeteriaoften doubles as a water treatmentplant with heated water storage.Residents haul drinking water back totheir homes from a watering point atthis location. In most cases, water ishauled on a boardwalk that is alsoused to haul sewage to disposal sites.Sewage spills are not uncommon andthe risk of contamination is great.
José
Rod
rique
z
4 Comptroller of the State of Texas, FiscalNotes, July 1995, p.l.
Need for Households Not Served by Community Water SystemsDrinking Water Infrastructure Needs Survey 39
Microbiological contaminants are thegreatest health risk faced by owners ofprivate wells, but other contaminantsalso pose a risk. In January 1996, theMichigan Department of Public Healthrecommended that owners of privatewells in 10 counties test their water forarsenic. State testing indicates thatwater from about 2 percent of wellsState-wide might exceed the currentcommunity water system standardof 50 µg/l.
Communities and households withprivate wells, especially those inagricultural areas, face the additionalrisk of nitrate contamination. Nitratecontamination causes “blue babysyndrome” and can lead to the deathof infants. In 1986, the United StatesGeological Survey performed aNational Water Quality Assessmentcase study of the Delmarva Peninsula,which includes most of Delaware andthe eastern shores of Maryland andVirginia.6 The study covered over 6,000square miles, nearly half of which isused for farming. Fifteen percent of thewells sampled exceeded the EPAmaximum contaminant level of 10 mg/lfor nitrate. Seven other State andnational studies of private rural wellconditions report nitrate concentra-tions in excess of 10 mg/l in 2.4 percentto 23 percent of the wells sampled.
Private Wells. Approximately15 million households in the U.S. areserved by private wells. Most of theseprivate wells provide an adequatequantity of high-quality water. Muchlike community water systems,however, some of these wells produceground water that is not safe to drink.Unlike community water systems, verylittle is known about the degree ofcontamination at private wells.Although private wells are testedoccasionally for microbiologicalcontaminants and nitrate, almost notesting is done for pesticides, solvents,and inorganic chemicals. Often, privatewells are tested only once, immedi-ately after being drilled. According tothe National Ground Water Associa-tion, 24 States do not require privatewells to be tested at all.
Two studies examined the occurrenceof total coliform bacteria in waterproduced by private wells. A 1995 CDCsurvey of more than 5,500 private wellsin nine midwestern States estimatesthat approximately 41 percent of thewells in those States are contaminatedwith total coliform bacteria.5 Evenmore significantly, the CDC studyshows that over 27 percent of theprivate wells produced samples thatwere contaminated with E. Coli. Thepresence of this bacteria indicatesrecent fecal contamination. The resultsof the National Statistical Assessmentof Rural Water Conditions, publishedby EPA in June 1984, support thefindings of the CDC. This nationwidestudy found total coliform bacteria inover 40 percent and fecal coliformbacteria in 20 percent of householdsserved by private wells.
5 Center for Disease Control and Prevention, et.al. A Survey of the Presence of Contaminants in Water inPrivate Wells in Nine Midwestern States. Report in Draft.
6 Hamilton, Pixie and Robert J. Shedlock. Are Fertilizers and Pesticides in the Ground Water? A CaseStudy of the Delmarva Peninsula, Delaware, Maryland, and Virginia. United States Geological SurveyCircular 1080. U.S. Government Printing Office: 1993
Need for Households Not Served by Community Water Systems40 Drinking Water Infrastructure Needs Survey
Cost Estimate$5.4 million$276.4 million$578.9 million$147.9 million$12.1 million$5.4 million
Several States provided partial cost estimates forneeds associated with establishing new watersystems at communities without safe runningwater. These communities include those that lackrunning water and those that depend on contami-nated private wells. Estimates from those Statesare provided below, but are not included in totalselsewhere in the report.
One reason for contaminationat private wells may lie inimproper siting and construc-tion of older wells. Although allStates now have well construc-tion standards, an unknownnumber of private wells wereconstructed before thosestandards were established.Because of space constraints, alack of understanding of healthimplications, and a desire tominimize cost, some olderprivate wells are located tooclose to the home’s septicsystem or other sources ofcontamination.
Possible Solutions. A lack ofinformation makes it impos-sible to understand fully the needs forhouseholds without a safe supply ofrunning water. Many community watersystems are making efforts to addressa portion of this problem by extendingtheir service. Some Needs Surveyrespondents estimated needs forconnecting nearby existing homes thatdo not have a safe or adequate supplyof water. These conservative estimatesshow that the need for connectingthese homes would be at least$6.0 billion.
Counties in Alabama planned to spend $4.3 million in FY1995 for expansions of existing water systems to serve ruralareas. Within Clay county, the city of Ashland has agreed toadd 74,000 feet of water mains, 175 service connections, and30 fire hydrants in an effort to extend transmission linesbeyond city limits. Private wells in this county have shownfecal contamination and contain high levels of iron. Whenthis project is completed, Ashland will have provided serviceto 471 additional people.
Water System Expansion - An Example
Another potential solution for house-holds without a safe supply of runningwater is reconstruction of olderexisting wells. Older existing wellscould be upgraded to modern con-struction standards or replaced by newwells that are drilled away fromsources of contamination. Constructinga new well may be the best solution fora household or group of householdsthat do not have a supply of saferunning water. In many cases, anaquifer is available to provide safedrinking water, but wells must beproperly sited and constructed to makethis solution successful. Further studyis necessary to understand the needsfaced by households not served bycommunity water systems.
Need for Households Not Served by Community Water SystemsDrinking Water Infrastructure Needs Survey 41
Jim
Wen
dte
Some homes without water service from public water systems store drinkingwater in cisterns like the one being filled in the photograph above.
Dea
n C
haus
see
Hydropneumatic storage tanks use compressed air to pressurize smallwater systems. The insert is a close-up of corrosion on this tank. Asthese tanks age, corrosion can cause water quality to deteriorate andeven pose a direct threat to safety. Hydropneumatic tanks can explodeif they lose structural integrity. More than 6,500 small water systemscurrently need new hydropneumatic tanks or need to have their tanksrefurbished.
Appendix A—Methodology
A workgroup was convened in1994 to develop an approach fordetermining the drinking water
infrastructure need for communitywater systems nationwide. Theworkgroup included staff and represen-tatives of State drinking wateragencies, American Indian and AlaskaNative water systems, the IndianHealth Service, and EPA regions andheadquarters. The workgroup met inJanuary 1994, August 1994, June 1995,and September 1995 to develop thesurvey methodology and design theresulting Report to Congress.
The methodology took into account thestrengths and resource constraints ofthe different sizes of drinking watersystems and developed differentprocesses for collecting informationfrom each one. Systems were brokendown into three sizeclassifications: large(those serving more than50,000 people), medium(those serving from 3,301to 50,000 people), andsmall (those serving 3,300and fewer people).Exhibit A-1 shows thedata collection methodused, target precisionlevels, and number ofsystems surveyed foreach size classification.
American Indian and Alaska Nativewater systems were surveyed sepa-rately.
Estimating Needs for WaterSystems in the States: Large andMedium Systems. All 794 largecommunity water systems and 2,760 ofthe 6,800 medium systems in theStates received a mailed questionnairepackage. Systems were asked tocomplete a matrix identifying thosecapital projects needed to continuesupplying safe drinking water to theircustomers. The matrix includeddescriptions of each need, costestimates for the project, and docu-mentation. The questionnaire alsorequested information that could beused to model costs for those infra-structure projects that did not include acost estimate.
Exhibit A-1: Approach to Statistical Survey in the States
Appendix A Drinking Water Infrastructure Needs Survey
State-by-State and national needs forlarge drinking water systems weredetermined by summing the docu-mented costs and modeled costs for alllarge systems. Large systems that didnot respond were assigned a need ofzero. For medium water systems, EPAcalculated each State’s need byextrapolating the results from thesample to the State as a whole. Toassure accurate estimates of total Statecosts, EPA visited States to verify thenumber and size of the water systemsin each State's database. This processallowed EPA to extrapolate withconfidence to arrive at a total medium-system need for each State.
Estimating Needs for Systems inthe States: Small Systems. Theworkgroup estimated small watersystem needs using a nationalstatistical model. To identify needs,EPA staff visited 537 of the over 46,500small water systems to determineneeds through on-site assessments. Inmost cases, State representativesaccompanied EPA staff on the visits.Information collected during theseassessments was reviewed by Stateand EPA staff and then entered into thenational database.
Most small systems did not havedocumented cost estimates for theprojects identified. Because of this,data provided by States, engineeringfirms, and larger systems were used todevelop cost models for small watersystem needs. The costs derived fromthese models were used to extrapolatetotal costs from the systems surveyedto the nation as a whole. Stateinventories of small systems werechecked for accuracy.
All questionnaires completed by watersystems in States were sent to Statedrinking water staff for review. Statestaff reviewed the needs of thesystems to ensure that all documenta-tion was adequate, and forwarded the
questionnaires toEPA headquartersfor final review.Following thisreview, responseswere entered into adatabase containingdrinking waterinfrastructure needsfrom all systemssurveyed.
Many large andmedium drinkingwater systems wereable to providehigh-qualitydocumentedestimates of the costof the infrastructureneed they hadidentified. Ifdocumented costestimates were notprovided, EPA usedcost models togenerate costs fordocumentedprojects. Costmodels weredeveloped from theestimates providedby other large andmedium watersystems. For alimited number ofinfrastructure needs,
the survey collected insufficientinformation to develop cost models.Costs for these needs were modeledbased on engineers' reports for similarprojects around the country. All costswere converted to January 1995dollars.
Acceptable Documentation
The following types of documents were usedto justify the need for projects. Asterisksindicate documents that also provideacceptable cost estimates.
Under Direct Influence DeterminationDocumentation of a Maximum Contaminant
Level Violation, Treatment TechniqueViolation, or Lead and Copper RuleExceedance
Grant or Loan Application Form*Comprehensive Performance Evaluation
ResultsState-Approved Local/County Comprehen-
sive Water and Sewer PlanSanitary SurveySigned and dated statement from State, site-
visit contractor, or system engineerclearly detailing infrastructure needs.
A-2
Drinking Water Infrastructure Needs Survey Appendix A
Estimating Needs for AmericanIndian and Alaska Native WaterSystems. American Indian and AlaskaNative water systems fall into two sizecategories: medium and small. Thereare 15 medium American Indiansystems. All 15 were sent question-naire packages. These systems andtheir Tribal governments completedthe questionnaires in the same manneras the large and medium systems inthe States. The completed question-naires were sent to the appropriateEPA region and then to EPA headquar-ters for review. In cases in whichproject costs were unavailable, EPAestimated costs using models devel-oped for medium systems in theStates. Responses and modeled costsrepresent the total needs for mediumAmerican Indian water systems.
Over 98 percent of American Indianand all Alaska Native systems aresmall. The workgroup's procedure forestimating needs for these systemsused existing IHS databases andinformation collected from a sample ofwater systems. The IHS databasesprovided system-by-system informa-tion on the need, taking into accountthe individual characteristics of eachone. These databases, however, didnot contain information on all theneeds collected by the survey.Therefore, data from sampled systemswere used to develop adjustmentfactors for the IHS data. Theseadjustment factors reflect the differ-ence between the IHS costs and thecosts reported by the systems sur-veyed. Separate adjustment factorswere developed for American Indianand Alaska Native systems. Totalneeds for American Indian and AlaskaNative water systems were derivedfrom the IHS data and the adjustmentfactors.
For small American Indian systems,information was collected from 57 ofthe 682 systems nationwide. EPA staffor contractors, often accompanied byTribal representatives, EPA regionalIndian Coordinators, and Indian HealthService representatives, made on-siteassessments at each of these systemsand identified needs. Project costswere estimated using the modelsdeveloped for small systems in theStates.
Drinking water infrastructure needs forthe 187 Alaska Native communitieswere estimated by a roundtable of theAlaska Native Health Board, the AlaskaArea Native Health Service (part of theIHS), the Alaska Department ofEnvironmental Conservation (VillageSafe Water), and EPA. This groupselected 20 representative AlaskaNative water systems and identifiedneeds for those systems. Five of the 20systems were then visited to verify theaccuracy of the needs assigned by theroundtable.
Needs Associated with the SafeDrinking Water Act. A portion of theneeds collected in the survey areattributable to the SDWA. For existingregulations, systems were able toidentify projects needed for compli-ance. In these cases, survey responseswere used to derive the SDWA need.However, most systems were unable toidentify projects needed to complywith proposed and recently promul-gated regulations. Needs for theseSDWA regulations are based on thenational cost estimates published inthe Federal Register when the regula-tions were proposed. Needs for otherfuture regulations were taken frompreliminary economic analysesprepared in anticipation of promulgat-ing regulations.
A-3
Ala
ska
Are
a N
ativ
e H
ealth
Ser
vice
, OE
HE
Rudimentary roof catchments provide drinking water for some householdsin the United States.
Appendix B—Summary of Findings
Needs for Water Systems in the States*
Exhibit B-1—Total Need by CategoryExhibit B-2—Current Need by CategoryExhibit B-3—Total Need by System SizeExhibit B-4—Current Safe Drinking Water Act NeedExhibit B-5—Total SDWA and SDWA-Related Need
Needs for American Indian and Alaska Native Water Systems
Exhibit B-6—Total Need for American Indian and Alaska Native Water Systems by EPA RegionExhibit B-7—Need by Category for American Indian and Alaska Native Water SystemsExhibit B-8—Total SDWA and SDWA-Related Need for American Indian and Alaska Native Water
Systems
* Needs for water systems in the States do not include needs for American Indian and Alaska Native water systems. Needs for Palau (approximately $17.2 million) are not included in this report because Palau is not eligible to participate in the Drinking Water State Revolving Fund.
Appendix B Drinking Water Infrastructure Needs Survey
Distribution and transmission linebreaks result in loss of service andcan lead to contamination. Breakscan sometimes be dramatic. Theroad collapsed under these cars, atright, after a water main break inFort Lauderdale. Below, a workcrew repairs a water main break inSan Francisco.
San
Fra
ncis
co C
hron
icle
Cou
rtes
y of
the
For
t La
uder
dale
Sun
-Sen
tinel
The total infrastructure need forwater systems regulated by theStates is $137.1 billion.
Total Need by Category
Exhibit B-1: (facing page)
B-2
Drinking Water Infrastructure Needs Survey Appendix B
Appendix B Drinking Water Infrastructure Needs Survey
Exhibit B-2: (facing page)
Current Need by Category
Approximately $75.7 billion is forprojects needed now to protectpublic health at water systemsregulated by the States.
Dan
Fra
ser
John
Con
rady
Periodically, storage tanks must bedrained, sandblasted, and covered withepoxy paint. If this refurbishment is notdone, water quality can deteriorate andmicrobiological contamination canoccur. Pictured above is an outside viewof a storage tank needing rehabilitation.The insert is an underwater photo of theinside wall of a water storage tank thatis overdue for rehabilitation. These arerust deposits that can harbor bacteriaand lower water quality. Over one thirdof the water systems in the country needto rehabilitate storage tanks.
B-4
Drinking Water Infrastructure Needs Survey Appendix B
Appendix B Drinking Water Infrastructure Needs Survey
New York City is in the process ofconstructing tunnels designed to addredundancy and deliver hundreds ofmillions of gallons of water per day tocity residents. Workers, at right, aredrilling holes for dynamiting. A worker,below, inspects a recently concretedtunnel to ensure it is ready to be put online. Redundancy will help the cityensure an adequate water supply in theevent of a tunnel failure and will enableinspections and maintenance of thecity's two other main tunnels.
Car
l Am
bros
e, N
ew Y
ork
City
DE
P
Car
l Am
bros
e, N
ew Y
ork
City
DE
P
Total Need by System Size
The largest share of the totalneed is for infrastructureimprovements at large watersystems, those serving morethan 50,000 people.
Exhibit B-3: (facing page)
B-6
Drinking Water Infrastructure Needs Survey Appendix B
Appendix B Drinking Water Infrastructure Needs Survey
Sludge Removal
Rapid Mix
TREATMENT OF SURFACE WATER
2 3 4
Lake, River, or Holding Basin
Intake(Pump Station)
Flocculation Sedimentation
Disinfectant Addition
5 Filters
6
ClearwellDetention7
Pump
Customers
Chemical Addition1
Usually, surface water is treated using aconventional filtration process designed toremove suspended solids, organic andinorganic contaminants, pathogenicorganisms, and tastes and odors. Almost40 percent of water systems with surfacewater sources have a need to build, rebuild,or improve surface water treatment plants.This schematic shows how these plantswork.
1. Chemical Addition: Chemicals, usuallycoagulants and disinfectants, are addedto untreated surface water to makecontaminants, including pathogenicorganisms, easier to remove.
2. Rapid Mix: In this stage, chemicals arequickly blended with untreated water tofacilitate chemical reactions.
3. Flocculation: The water is slowly mixedin flocculation basins. The slow, gentlemixing allows chemically destabilizedparticles to come into contact with eachother so that larger, more easilyremovable "floc" particles are formed.
4. Sedimentation: "Floc" particles areallowed to settle out of the water andare subsequently removed as "sludge."Many of the contaminants from the
Exhibit B-4: (facing page)
Current Safe Drinking Water ActNeed
Approximately $12.1 billion isneeded now to meet currentSDWA requirements. Eighty-fourpercent of this need is to protectagainst microbiological contami-nants that pose an acute risk tohealth.
Exhibit B-5: (pages B-10and B-11)
Total SDWA and SDWA-RelatedNeed
Over the next 20 years, approxi-mately $16.2 billion is for compli-ance with existing SDWAregulations, and $14.0 billion is forcompliance with proposed SDWAregulations. Another $35.7 billionis for SDWA-related need.
source water and chemicalsadded in Step 1 are removedin this process. The cleaner,"clarified" water is thentransferred to the filters.
5. Filters: The remaining "floc"particles are removed as thewater passes through thegranular media of the filters.The clean, filtered water iscollected in piping manifoldsbeneath the filters.
6. Disinfectant Addition:Disinfectant (usuallychlorine) is added to thefiltered water as it istransferred to the clearwellor finished water storage.
7. Clearwell Detention: Thewater is held in the clearwelllong enough to allow thedisinfectant to inactivate anyremaining pathogens. Adisinfectant residual ismaintained in the distribu-tion system to protectagainst contamination thatmight occur after the waterhas left the treatment plant.
B-8
Drinking Water Infrastructure Needs Survey Appendix B
* Includes arsenic, barium, cadmium, chromium, fluoride, mercury, selenium, combined radium-226, -228, and gross alpha particle activity.
Appendix B Drinking Water Infrastructure Needs Survey
Permafrost conditions and arctictemperatures make water systemconstruction in Alaska Nativecommunities challenging. A utilidor,shown to the right, houses drinkingwater distribution mains. Oftendistribution mains cannot be placedunderground because ice-richpermafrost soils can be unstable andburying the lines is not cost effective.Above ground, piping must be insulatedfrom arctic conditions. Even when pipesare insulated, the water must becirculated and heated with diesel boilersto prevent freezing. When a communitydoes not have a distribution system thatdelivers water to households, residentsmust haul water from a watering pointlike the one shown below. The dangerof contamination is significant becausethe water is hauled on the same boardwalk used to carry away human waste.
Dan
Fra
ser
Ala
ska
Are
a N
ativ
e H
ealth
Ser
vice
, OE
HE
Dan
Fra
ser
Exhibit B-6: (facing page)
Total Need for American Indianand Alaska Native WaterSystems by EPA Region
The needs for American Indianand Alaska Native water systemstotals $1.3 billion.
B-12
Drinking Water Infrastructure Needs Survey Appendix B
1 There are no American Indian water systems in EPA Region 3.2 Navajo water systems are located in EPA Regions 6, 8, and 9, but for the purposes of this report, all Navajo needs are shown in EPA Region 9.3 Needs for Alaska Native water systems are not included in the EPA Region 10 total.
Appendix B Drinking Water Infrastructure Needs Survey
Many American Indians get theirdrinking water from watering points.The Shonto watering point, pictured tothe right, provides water to over 400Navajo people. Residents use trucks tohaul water to their homes up to 15miles away. The sign at the wateringpoint states that there is a watershortage and asks that the water beused for household purposes only.Hauled water is vulnerable tomicrobiological contamination. The fillhose, as well as containers for storageand transport, can cause contamination.The pump jack at Burnham, shownbelow, operates a watering point thatserves 150 Navajo people. The pumpjack is solar powered, but has a dieselbackup for cloudy days. Fuel stored inthe metal tank poses a direct threat ofcontamination to the aquifer and thewell. The Navajo Nation EPA is workingwith both communities to improvesanitary conditions and safetyprecautions.
Nav
ajo
Nat
ion
EP
A
Nav
ajo
Nat
ion
EP
A
Exhibit B-7: (facing page)
Need by Category for AmericanIndian and Alaska Native WaterSystems
Approximately $1.1 billion isneeded now to address problemsthat pose public health risks.Almost $0.2 billion is needed inthe future to ensure the availabil-ity of safe drinking water overthe next 20 years.
B-14
Drinking Water Infrastructure Needs Survey Appendix B
Appendix B Drinking Water Infrastructure Needs Survey
If adequate storage is not available, thedistribution system can lose pressure.This condition is dangerous because itcan lead to contaminants being drawninto the distribution system. Theelevated tank, shown to the right, isseverely corroded and should bereplaced. In some cases, systemsreplace elevated storage tanks withstand pipes, pictured below. These standpipes have recently been constructed ona hillside at Polacca, a Hopi communityin Arizona. Even without the hillsidelocation, these cost-effective tanks canbe tall enough to pressurize a watersystem and hold substantial reserves ofwater.
Dea
n C
haus
see
Dan
Fra
ser
Exhibit B-8: (facing page)
Total SDWA and SDWA-RelatedNeed for American Indian andAlaska Native Water Systems
For American Indian and AlaskaNative water systems, the needfor compliance with existingSDWA regulations is $96.6 mil-lion, approximately $75.6 millionof which is needed now. A total of$26 million is for compliance withproposed SDWA regulations.Another $185 million is for SDWA-related need.
B-16
Drinking Water Infrastructure Needs Survey Appendix B
1 Regulations for contaminants with acute health effects include the Surface Water Treatment Rule,the Total Coliform Rule, and the nitrate standard.
2 Regulations for contaminants with chronic health effects include the Lead and Copper Rule, thePhase I, II, and V rules, and safety standards for TTHMs, arsenic, barium, cadmium, chromium,fluoride, mercury, selenium, combined radium-226, -228, and gross alpha particle activity.
3 No capital costs are associated with the ICR for American Indian and Alaska Native water systems.
B-17
Por
tland
Wat
er B
urea
u
The Bull Run watershed is Portland, Oregon's drinking water source.
Appendix C—FutureRegulations Not Included inthe Total Need
In the future, EPA may set new orrevised safety standards foradditional contaminants. Future
regulations being considered under theSDWA are for radon and other radionu-clides, arsenic (revision), and sulfate.Needs for these future regulations arenot included as part of the total need inthis report because regulatory sce-narios and cost estimates have notbeen finalized. New or revised stan-dards for these contaminants mayresult in needs ranging between$1.7 billion and $14.8 billion, dependingon how they are regulated. Exhibit C-1shows the estimated range of need byregulation. Needs for the Ground WaterDisinfection Rule, which is a priority forregulation, are not included in thisreport because cost estimates have notbeen developed.
Exhibit C-1: Estimated Need for Future Regulations Not Included in the Total Need(in millions of Jan. ’95 dollars)
Appendix C Drinking Water Infrastructure Needs Survey
EPA has analyzed a range of alterna-tives for regulating radon and the otherradionuclides—radium-226, radium-228, uranium, adjusted gross alpha,and beta and photon emitters. Thehigh and low cost estimates inExhibit C-1 reflects costs for regulatingradon at 200 pCi/l and 3,000 pCi/l.Exhibit C-1 also shows cost estimatesfor regulating radium-226 and radium-228 at 5 pCi/l and 20 pCi/l, uranium at20 µg/l and 80 µg/l, and adjusted grossalpha at 15 pCi/l. No capital costs areexpected to be associated with betaand photon emitters.
Arsenic is currently regulated at50 µg/l, but EPA has analyzed the costof regulating this contaminant at amore stringent level. Exhibit C-1 showsestimated costs for regulating arsenicat levels of 2 µg/l and 20 µg/l.
EPA has proposed four alternatives forregulating sulfate at 500 mg/l. The leastcapital-intensive options (reflected inthe low cost on Exhibit C-1) requirewater systems with high sulfate levelsto provide alternative sources of waterto infants and, under one scenario,provide public education to exposedadults. The most capital-intensiveoption (reflected in the high cost onExhibit C-1) requires central treatment,which is usually reverse osmosis.
C-2
Drinking Water Infrastructure Needs Survey Appendix C
Dea
n C
haus
see
The small system operator shown above is flushing iron from thewater system's distribution system. More than 3,100 small systemshave an unmet need to treat for iron and manganese. Thesesecondary contaminants make water reddish-brown and stain sinksand laundry.
Appendix D—SeparateState Estimates
The Drinking Water Infrastructure Needs Survey did not include some types of need. Two States feltit was important to report costs associated with these needs. In response, EPA provided Stateswith the opportunity to submit separate estimates of need that include these costs. Exhibit D-1
shows each State's estimate. Maine's estimate is for refinancing existing loans for filtration plants. NewMexico's need estimate is for planned growth in Albuquerque. These estimates were not included inestimates of need listed elsewhere in the report.
Exhibit D-1: Separate State Estimates
etatSetamitsEetatSetarapeS
)snoillimni(
eniaM 2.79$
ocixeMweN 1.001$
Nitrate contamination can cause “blue baby syndrome” and lead to the death of infants. When their well became contami-nated with nitrate, residents of Sil Nakya, a Tohono O'Odham community, were forced to find another source of water. Thepictured transmission line now brings water from a neighboring community 11 miles away.
Indi
an H
ealth
Ser
vice
Indi
an H
ealth
Ser
vice
Appendix E–Glossary
Acute health effects: health effects resulting from exposure to a contaminant that causes severesymptoms to occur quickly—often within a matter of hours or days. Examples include gastrointestinal illnessand “blue baby syndrome.”
“Blue baby syndrome”: a potentially fatal condition for infants where nitrate reduces the blood’s ability tocarry oxygen.
Capital improvement plan (CIP): a document produced by a local government, utility, or water systemthat thoroughly outlines, for a specified period of time, all needed capital projects, the reason for eachproject, and their costs.
Chafee-Lautenberg Report to Congress: a Report to Congress prepared in response to a request inEPA's 1993 Appropriation Act. The Chafee-Lautenberg Report included a figure of $8.6 billion in 1991 dollarsfor capital costs for SDWA compliance. Inflated to the 1995 dollars used in the Needs Survey, this equates to$9.7 billion. (EPA Publication Number 10-R-93-000, September 1993)
Chronic health effects: health effects resulting from long-term exposure to low concentrations of certaincontaminants. Cancer is one such health effect.
Coliform bacteria: a group of bacteria whose presence in a water sample indicates the water may containdisease-causing organisms.
Community water system: a public water system that serves at least 15 connections used by year-roundresidents or that regularly serves at least 25 residents year-round. Examples include cities, towns, andcommunities such as retirement homes.
Cryptosporidium parvum: a protozoan parasite (often referred to as Cryptosporidium) that causes thedisease cryptosporidiosis. This pathogenic organism is ubiquitous in surface water, including surface waterused as a drinking water source. Cryptosporidium lives in the digestive tract of warm-blooded animals andmost often reaches surface water bodies through contamination from sewage, agriculture (e.g., run-off fromcattle feed lots and pastures), or wildlife activity.
Current infrastructure needs: new facilities or deficiencies in existing facilities identified by the State orsystem. Water systems should begin construction for current needs as soon as possible to avoid a threat topublic health.
Engineer's report: a document produced by a professional engineer that outlines the need and cost for aspecific infrastructure project.
Existing regulations: drinking water regulations promulgated under the authority of the Safe DrinkingWater Act by EPA before publication of this report; existing regulations can be found in the Code of FederalRegulations (CFR) at 40 CFR 141.
Appendix E Drinking Water Infrastructure Needs Survey
Finished water: water that is considered safe and suitable for delivery to customers.
Future infrastructure needs: infrastructure deficiencies that a system expects to address in the next20 years due to predictable deterioration of facilities. Future infrastructure needs do not include currentinfrastructure needs. Examples are storage facility and treatment plant replacement where the facilitycurrently performs adequately, but will reach the end of its useful life in the next 20 years. Needs solely toaccommodate future growth are not included in the report.
Giardia lamblia: a protozoan parasite (often referred to as Giardia) that causes the disease giardiasis. Thispathogenic organism is ubiquitous in surface water, including surface water used as a drinking water source.Giardia lives in the digestive tract of warm-blooded animals and most often enters surface water bodiesthrough contamination from sewage, run-off from cattle feed lots, or wildlife activity.
Ground water: any water obtained from a source beneath the surface of the ground.
Ground water under the direct influence of surface water: any water obtained from a source beneaththe surface of the ground that has vulnerabilities to contamination similar to surface water. For regulatorypurposes, direct influence is determined for individual sources in accordance with State law, regulation, andpolicy.
Growth: expansions of population, service area, or industrial uses projected to occur after the time of thesurvey. Capital improvement needs planned solely to accommodate projected future growth are notincluded in the survey. Projects can, however, be designed for growth expected during the design-life of theproject. For example, the survey would allow a treatment plant needed now and expected to treat water for20 years. Such a plant could be designed for the population anticipated to be served at the end of the 20-yearperiod.
Infrastructure needs: the capital costs associated with ensuring the continued protection of public healththrough rehabilitating or building facilities needed for provision of safe drinking water. Categories of needinclude source development and rehabilitation, treatment, storage, and transmission and distribution.Operation and maintenance needs are not considered infrastructure needs and are not included in thisreport. A portion of infrastructure needs is for SDWA compliance.
Large water system: in this report, this phrase refers to a community water system serving more than50,000 people.
Medium water system: in this report, this phrase refers to a community water system serving from 3,301to 50,000 people.
Microbiological contamination: the significant occurrence in a water supply of protozoan, bacteriologi-cal, or viral contaminants.
Non-community water system: a public water system that is not a community water system and thatserves a non-residential population of at least 25 individuals or 15 service connections daily for at least 60days of the year. Examples include schools and churches.
Pathogen: a disease causing organism.
Public water system: a system for the provision of water for human consumption, if the system has atleast 15 service connections or regularly serves an average of at least 25 individuals daily at least 60 days outof the year.
E-2
Drinking Water Infrastructure Needs Survey Appendix E
Safe Drinking Water Act (SDWA): a law passed by Congress in 1974 and amended in 1986 and 1996 toensure that public water systems provide safe drinking water to consumers. (42 U.S.C.A. §§300f to 300j-26)
SDWA need: a capital expenditure required for compliance with SDWA regulations.
SDWA-related need: a capital expenditure required for distribution piping replacement. Distribution pipingreplacement is considered a SDWA-related need because the monitoring required under the TCR helps toidentify problems in the distribution system.
Small water system: in this report, this phrase refers to a community water system serving 3,300 peopleor fewer. This definition was chosen based on resource constraints and system capabilities. Other definitionshave been used. For example, the SDWA at §1452(a)(2) defines a small system as a system that serves fewerthan 10,000 people.
Source rehabilitation and development: a category of need that includes the costs involved in develop-ing or improving sources of water for communities.
State: in this report, this term refers to all 50 States of the United States, Puerto Rico, the District ofColumbia, American Samoa, Guam, the Northern Mariana Islands, and the Virgin Islands. (See definition of“Water systems in the States.”)
Storage: a category of need that addresses finished water storage needs faced by community watersystems.
Surface water: all water which is open to the atmosphere and subject to surface run-off including streams,rivers, and lakes.
Transmission and distribution: a category of need that includes replacement or rehabilitation oftransmission or distribution lines which carry drinking water from the source to the treatment plant or fromthe treatment plant to the home.
Treatment: a category of need that includes conditioning water or removing microbiological and chemicalcontaminants. Filtration of surface water sources, pH adjustment, softening, and disinfection are examples oftreatment.
Waterborne disease outbreak: the significant occurrence of acute infectious illness, epidemiologicallyassociated with the ingestion of water from a public water system.
Water systems in the States: in this report, this phrase refers to water systems regulated by any of the 50States of the United States, Puerto Rico, the District of Columbia, American Samoa, Guam, the NorthernMariana Islands, and the Virgin Islands. This includes those States and territories for which the EPA serves asthe primary regulatory body. This group does not include American Indian or Alaska Native water systems.
Watering point: a central source from which people without piped water can draw drinking water andtransport it to their homes.