48
First year practicals Lab 3: The Navon (1977) task Seeing the forest before the trees

First year practicalsLab 3: The Navon (1977) task
Seeing the forest before the trees
In this class you will learn about;◦ Writing a report (mimicking a journal article)◦ Navon’s study (1977) of global versus local
processing in perception
Objectives of this class

Why write a report?One aspect of the lab course is to develop skills in
experimental design, data analysis, interpretation etc.
However we need to be able to express these ideas/skills within a written form◦ The lab report!
By writing reports in your 1st year you will develop a better writing style and through feedback, will learn how to structure a good report. ◦ This will be invaluable for your 2nd & 3rd years.
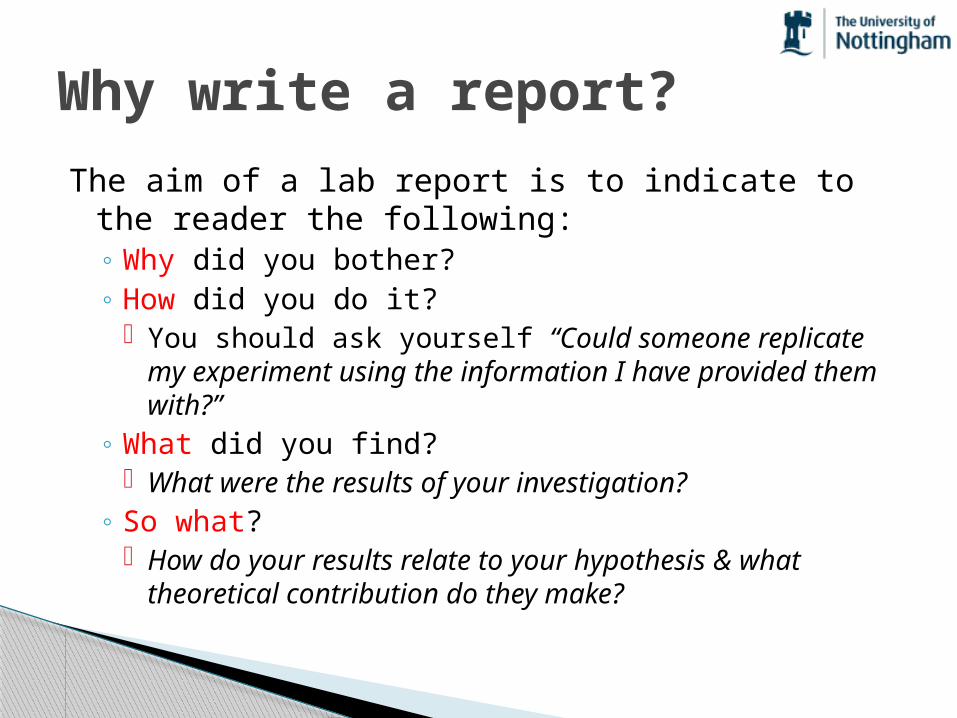
Why write a report?The aim of a lab report is to indicate to the reader
the following:◦ Why did you bother?◦ How did you do it?
You should ask yourself “Could someone replicate my experiment using the information I have provided them with?”
◦ What did you find? What were the results of your investigation?
◦ So what? How do your results relate to your hypothesis & what
theoretical contribution do they make?

Standard approachSometimes reports (certainly some published
papers!) can be lengthy. To reduce the time looking for specific information we rely on a standard structure for a report.
Not every published paper contains all of the following sections/sub-sections, but you should include them if they are relevant.

Sections of a lab reportTitleAbstractIntroductionMethod
◦ Design◦ Participants◦ Apparatus & Materials (optional)◦ Procedure◦ Scoring (optional)
ResultsDiscussionReferencesAppendix (optional)
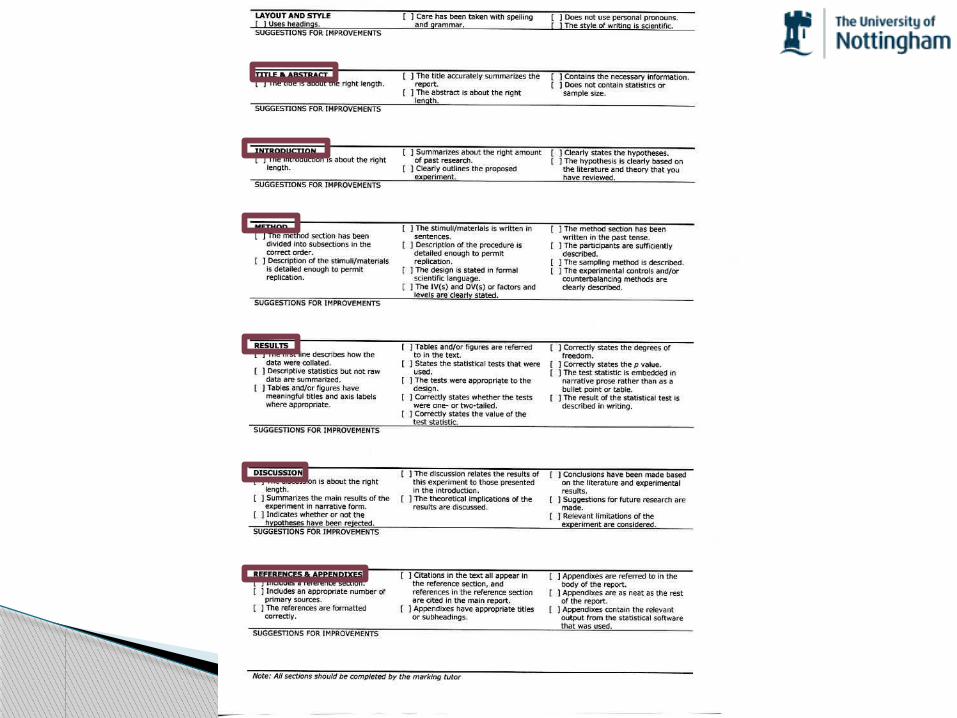
You will see these sections referred to on the feedback coversheet which markers use to help
you to improve your reports!
TitleThis is the first thing someone reads and so should
summarise the content of the report using no more than 20 words
Gives some indication of the overall theme of the work that is to be reported
Catchy titles should generally be avoided, as should titles using superfluous words◦ An Empirical Investigation into Obsessive Compulsive
Disorder in Children with High Socioeconomic Status Parents.
◦ Obsessive Compulsive Disorder in Children with High Socioeconomic Status Parents.
NB: Capitalize major words & centre the title at the top of the page
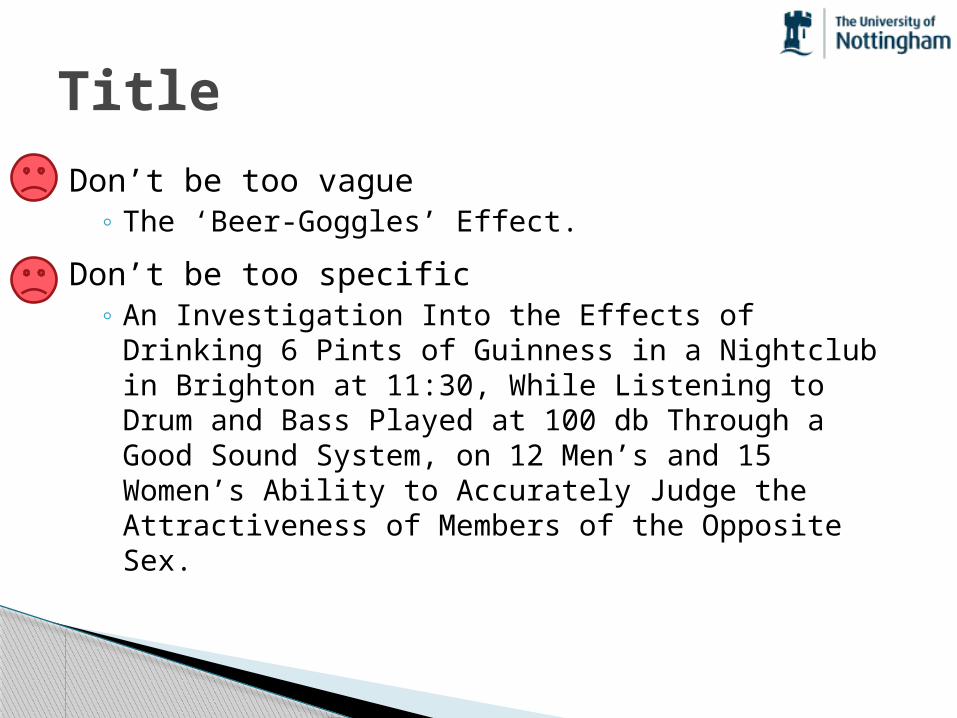
TitleDon’t be too vague
◦ The ‘Beer-Goggles’ Effect.Don’t be too specific
◦ An Investigation Into the Effects of Drinking 6 Pints of Guinness in a Nightclub in Brighton at 11:30, While Listening to Drum and Bass Played at 100 db Through a Good Sound System, on 12 Men’s and 15 Women’s Ability to Accurately Judge the Attractiveness of Members of the Opposite Sex.

TitleAbout right
◦ The ‘Beer-Goggles Effect’: The Effects of Alcohol on Attractiveness Ratings of the Opposite Gender.
Sometimes it is useful to refer to the things you are manipulating (the IV) & what you are measuring (DV) within the title
The example above does just this◦ IV = Alcohol (as levels are manipulated in this study)◦ DV = Ratings of attractiveness
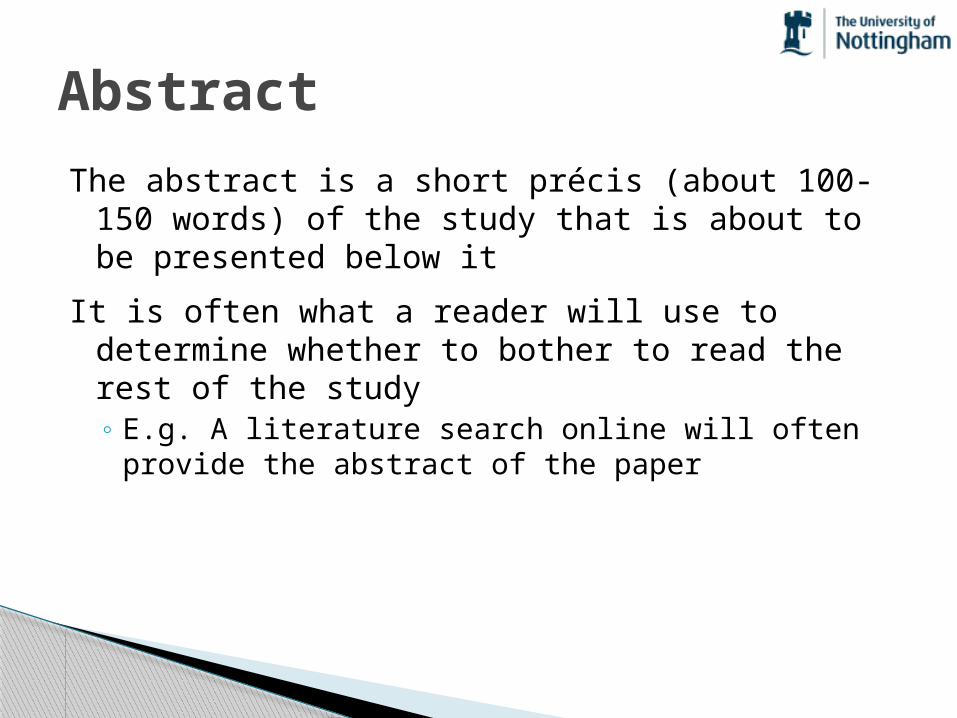
AbstractThe abstract is a short précis (about 100-150
words) of the study that is about to be presented below it
It is often what a reader will use to determine whether to bother to read the rest of the study◦ E.g. A literature search online will often provide the
abstract of the paper
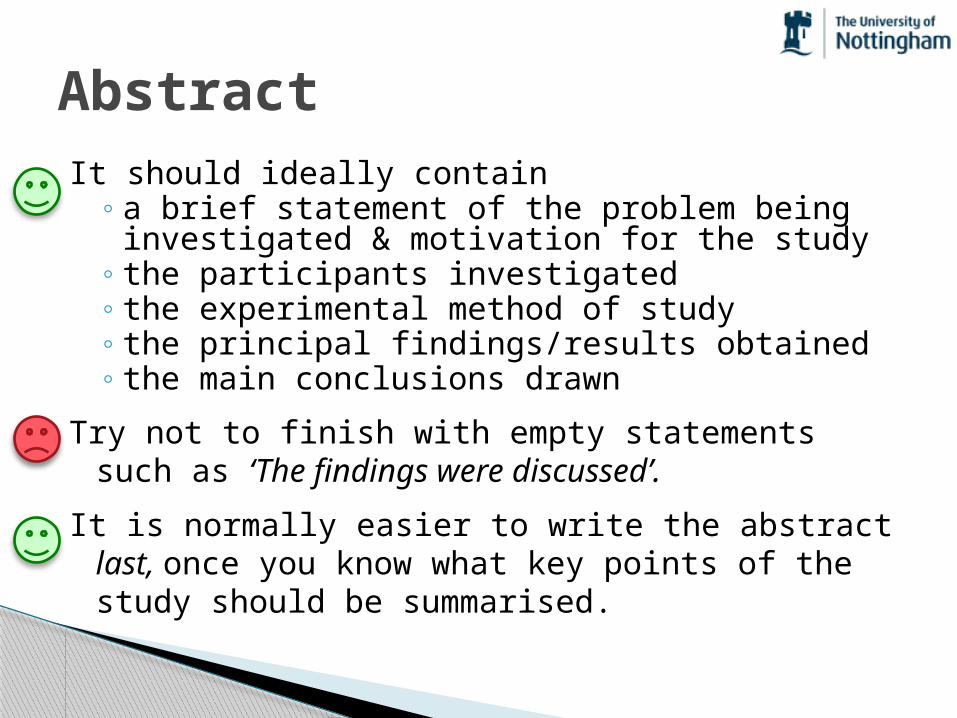
AbstractIt should ideally contain
◦ a brief statement of the problem being investigated & motivation for the study
◦ the participants investigated◦ the experimental method of study◦ the principal findings/results obtained◦ the main conclusions drawn
Try not to finish with empty statements such as ‘The findings were discussed’.
It is normally easier to write the abstract last, once you know what key points of the study should be summarised.

Beer-Goggles example abstract
You can see that this abstract is short, but summarises what was done and why, and finishes with what was found from the results and how this fits with previous studies/theories.
Ugly (1993) has shown that the propensity to misclassify members of the opposite sex as attractive is increased in nightclub settings. This study was designed to ascertain whether this effect is due to the dim lighting employed in these venues, or the consumption of alcohol in this setting. Ratings of the attractiveness of a set of stooge participants were taken in both a well-lit and dimly-lit nightclub by both sober and drunk participants. A 2 way ANOVA revealed a significant effect of alcohol consumption, but not of the lighting used. The results suggest that, contrary to Ugly’s hypothesis, dim lighting does not contribute to the inflated attractiveness of opposite- ‐gender mates; instead these ratings are influenced solely by alcohol intake.

IntroductionAn introduction is a little like writing an essayIt should try to answer the following questions:
◦ Broadly introduce the area you are investigating. You may need some definitions
◦ What has been done in this area of psychology before? In other words, review the current literature (theories/findings) about the topic you are investigating. Are their any inconsistencies/problems in the research so far?
◦ What was the point/purpose of your study?

Introduction◦ State your hypothesis explicitly (but informally)
towards the end of your introduction. This often means making reference to the IV(s) & DV (but informally) E.g. ‘This study looks at whether the amount of alcohol
drunk and the gender of the consumer has an effect on the attractiveness of the mate selected.’
◦ What do you expect or predict may happen? If you have an expectation then say so. E.g. ‘Based on previous research discussed earlier, it is
predicted that attractiveness ratings will increase as alcohol amount increases, but only for males. Attractiveness ratings made by female participants are not expected to be influenced by alcohol consumption.’
Introduction – Providing a rationalePossible reasons/rationale for a study
◦ To support/test a specific theory/idea◦ To replicate/confirm an existing finding
A replication with a different sample◦ To extend the findings of previous research
Often a replication with a change in method State what differences are between your study and an existing
study◦ To distinguish between different theories or resolve an
anomaly (e.g. Contradictory results from previous studies)◦ To plug as gap in existing knowledge
The introduction doesn’t need a separate headingTIP: Do not state the null hypothesis in the introduction. You can assume that the reader knows what a null
hypothesis is.

MethodSomeone should be able to repeat your experiment
by reading this section!Include enough information for replication of the
study, but avoid superfluous information◦ E.g. ‘A pencil and paper were used to record the
participant’s gender’.◦ The Method always has clearly labelled sub-sections,
but these do vary according to the type of experiment and the Journal type E.g. You may not always need an apparatus section
(unless, for example, you used a MRI scanner and wanted to report the details about it)
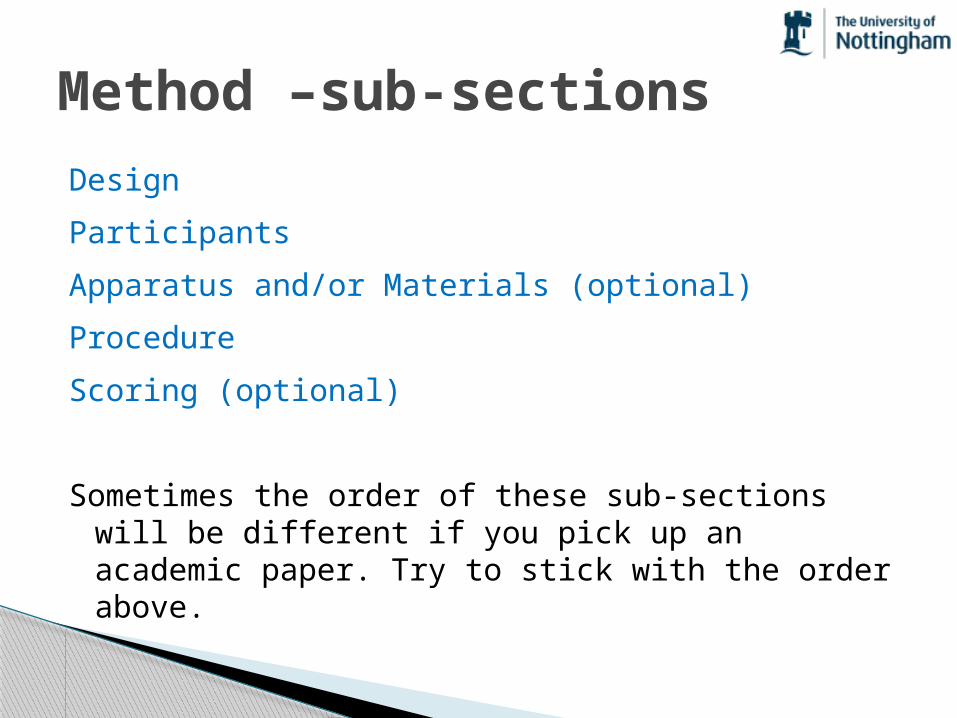
Method –sub-sectionsDesignParticipantsApparatus and/or Materials (optional)ProcedureScoring (optional)
Sometimes the order of these sub-sections will be different if you pick up an academic paper. Try to stick with the order above.

Design sub-sectionHere you should formally describe the type of design
being used (using psychological design language)◦ This is more often the case for an experimental design
where IVs are manipulated and DVs measured. Not all designs (e.g. correlational) have IVs!
Directly mention and define all IV(s)/DV(s). ◦ Remember to report units of measurement for DVs!
Conditions of the design should be mentioned and how they were manipulated◦ E.g. Design type might be a between-subjects design
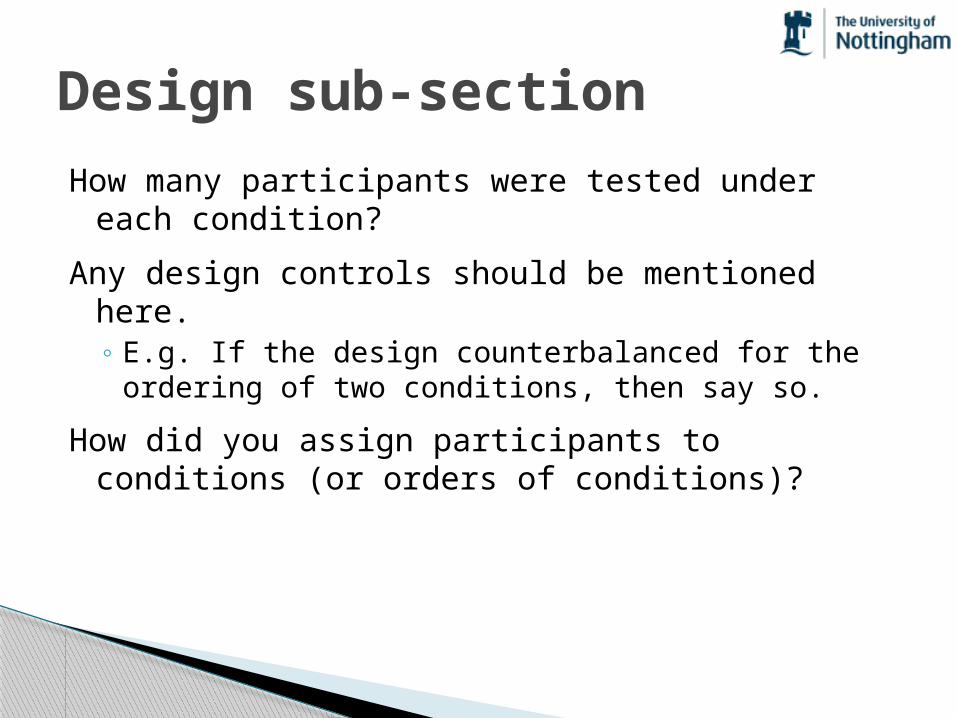
Design sub-sectionHow many participants were tested under each
condition?Any design controls should be mentioned here.
◦ E.g. If the design counterbalanced for the ordering of two conditions, then say so.
How did you assign participants to conditions (or orders of conditions)?

Design sub-sectionExample:‘A repeated measures design was used. There were
two independent variables: the lighting used in the nightclub (bright or dim) and the level of alcohol consumed (none or 6 pints). There were two dependent variables that were analysed separately: the participant’s ratings of physical attractiveness (the COAR scale) and their ratings of the attractiveness of personality (the CRAPS scale). Participants took part in all four conditions of the experiment.’

Participants sub-sectionSo who were tested in your experiment?What age and gender were they?How did you select them?
◦ A random sample?◦ A snowball sample?◦ A convenience sample?
How many of them were there?Were there specific characteristics (selection criteria) of
the people you tested that should be mentioned?◦ E.g. All participants were right handed and bilingual.◦ Only mention such things if they are important to your
study
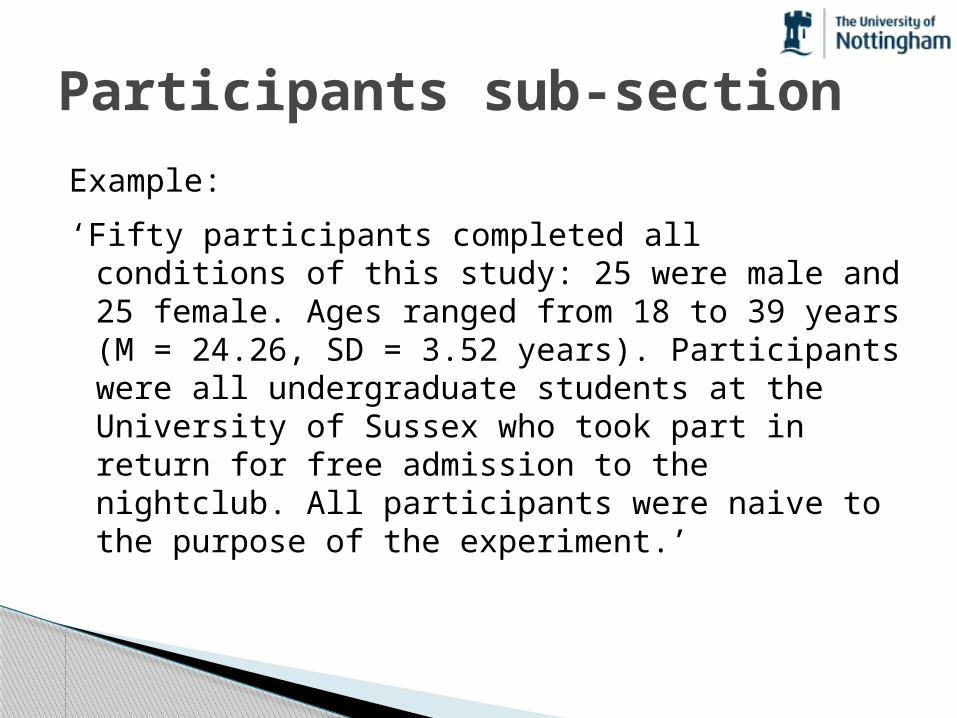
Participants sub-sectionExample:‘Fifty participants completed all conditions of this
study: 25 were male and 25 female. Ages ranged from 18 to 39 years (M = 24.26, SD = 3.52 years). Participants were all undergraduate students at the University of Sussex who took part in return for free admission to the nightclub. All participants were naive to the purpose of the experiment.’

Apparatus / Materials sub-sectionThis section describes the apparatus and materials used in
testing the participantsApparatus includes specialist equipment e.g. An Apple
Mackintosh computer running E-Prime.Clear sentences should be used to describe
apparatus/materials and not bulleted lists!Sometimes a Stimuli section is used to describe the stimulus
materials that participants responded to◦ E.g. Stimuli were four geometric shapes, each containing the
letter A-D. Shapes were approximately 2cm wide by 2cm high and were presented in red.
◦ Sometimes you might find it easier to give some visual examples of stimuli if relevant within a figure, which you can make reference to in your write-up.
An Example Figure
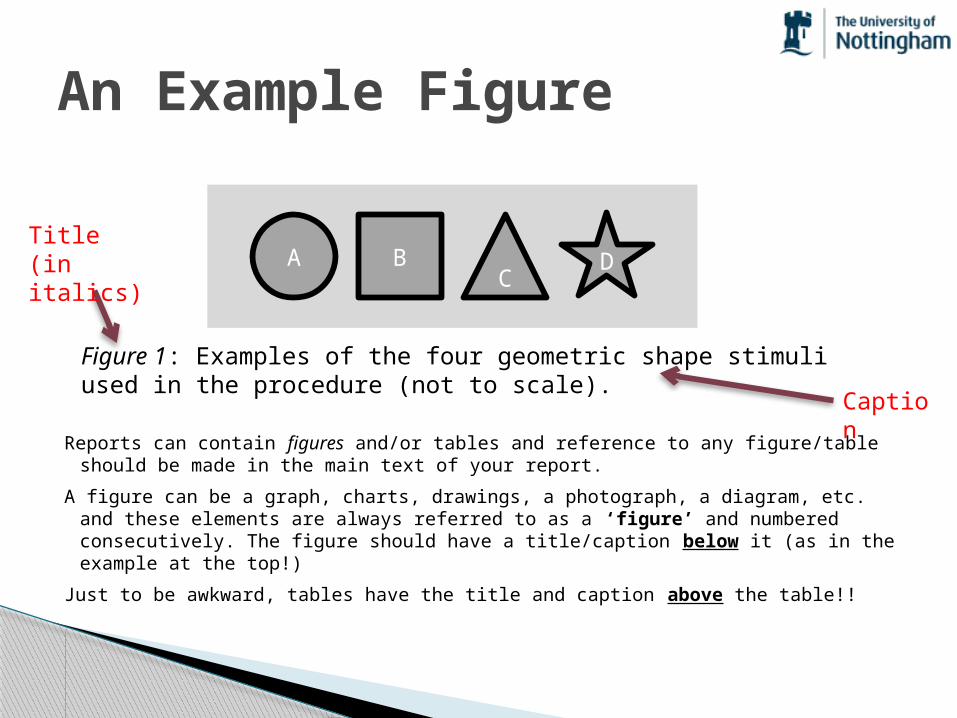
Reports can contain figures and/or tables and reference to any figure/table should be made in the main text of your report.
A figure can be a graph, charts, drawings, a photograph, a diagram, etc. and these elements are always referred to as a ‘figure’ and numbered consecutively. The figure should have a title/caption below it (as in the example at the top!)
Just to be awkward, tables have the title and caption above the table!!
A B C D
Figure 1: Examples of the four geometric shape stimuli used in the procedure (not to scale).
Title (in italics)
Caption
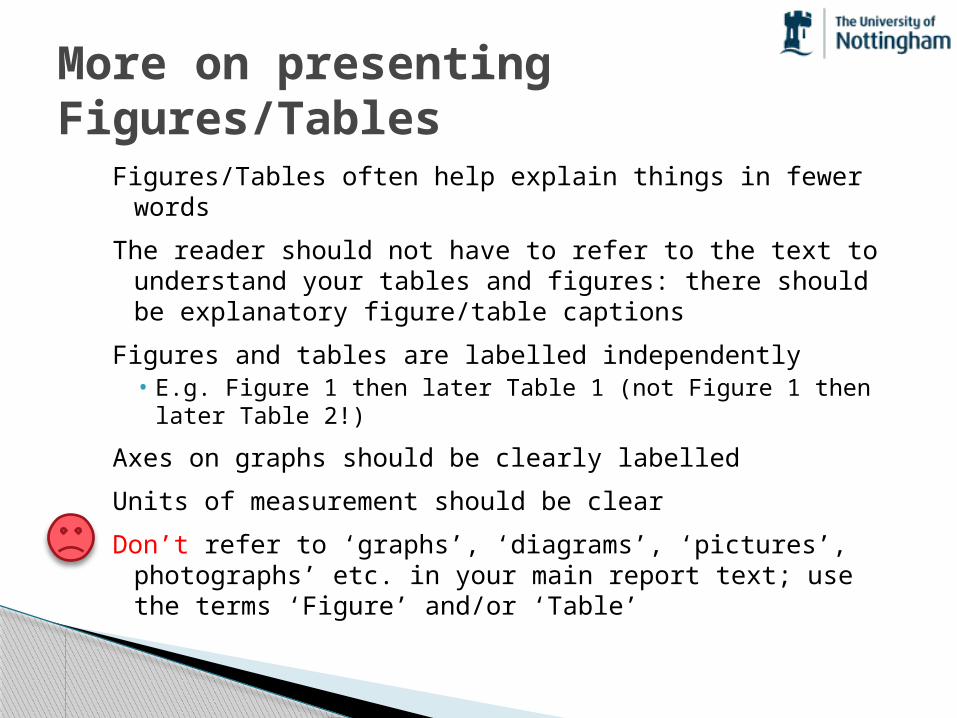
More on presenting Figures/Tables
Figures/Tables often help explain things in fewer wordsThe reader should not have to refer to the text to
understand your tables and figures: there should be explanatory figure/table captions
Figures and tables are labelled independently• E.g. Figure 1 then later Table 1 (not Figure 1 then later
Table 2!)Axes on graphs should be clearly labelledUnits of measurement should be clearDon’t refer to ‘graphs’, ‘diagrams’, ‘pictures’,
photographs’ etc. in your main report text; use the terms ‘Figure’ and/or ‘Table’
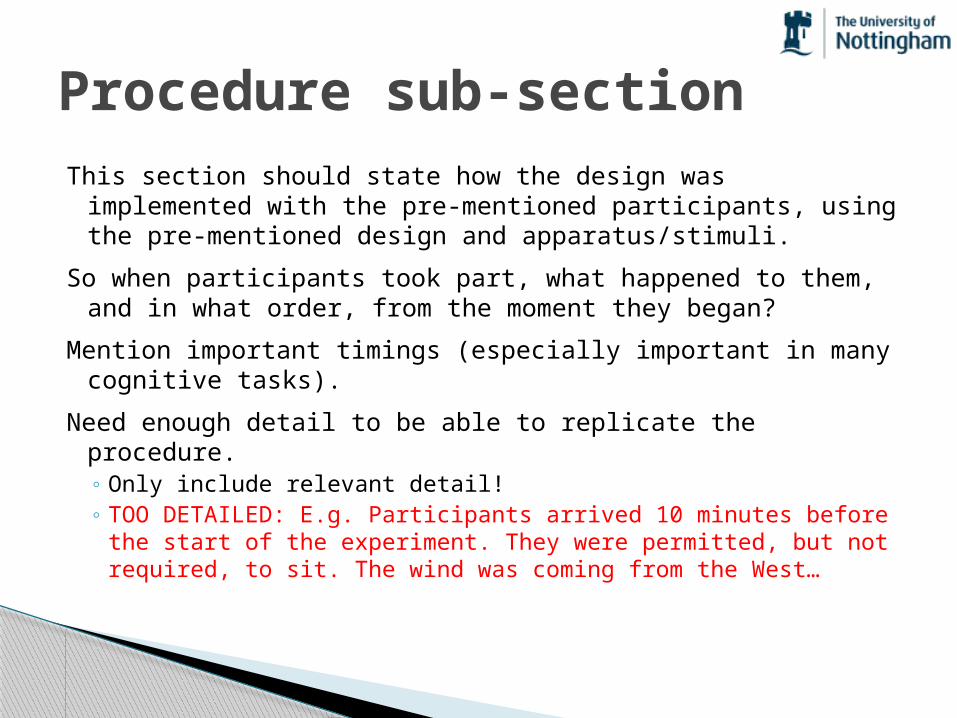
Procedure sub-sectionThis section should state how the design was
implemented with the pre-mentioned participants, using the pre-mentioned design and apparatus/stimuli.
So when participants took part, what happened to them, and in what order, from the moment they began?
Mention important timings (especially important in many cognitive tasks).
Need enough detail to be able to replicate the procedure.◦ Only include relevant detail!◦ TOO DETAILED: E.g. Participants arrived 10 minutes before
the start of the experiment. They were permitted, but not required, to sit. The wind was coming from the West…
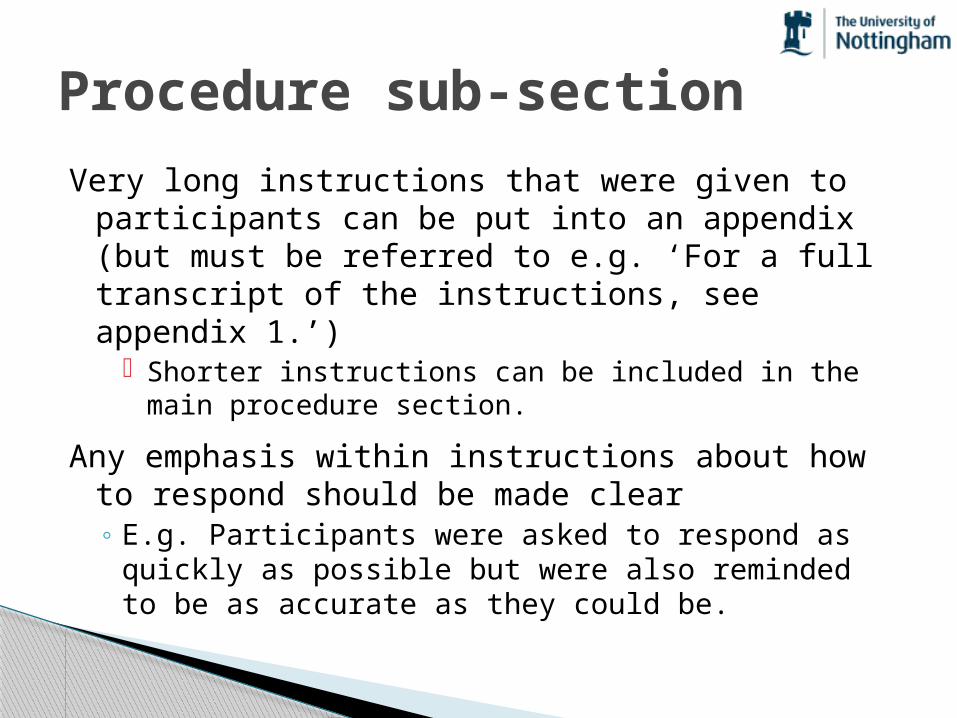
Procedure sub-sectionVery long instructions that were given to
participants can be put into an appendix (but must be referred to e.g. ‘For a full transcript of the instructions, see appendix 1.’)
Shorter instructions can be included in the main procedure section.
Any emphasis within instructions about how to respond should be made clear◦ E.g. Participants were asked to respond as quickly as
possible but were also reminded to be as accurate as they could be.
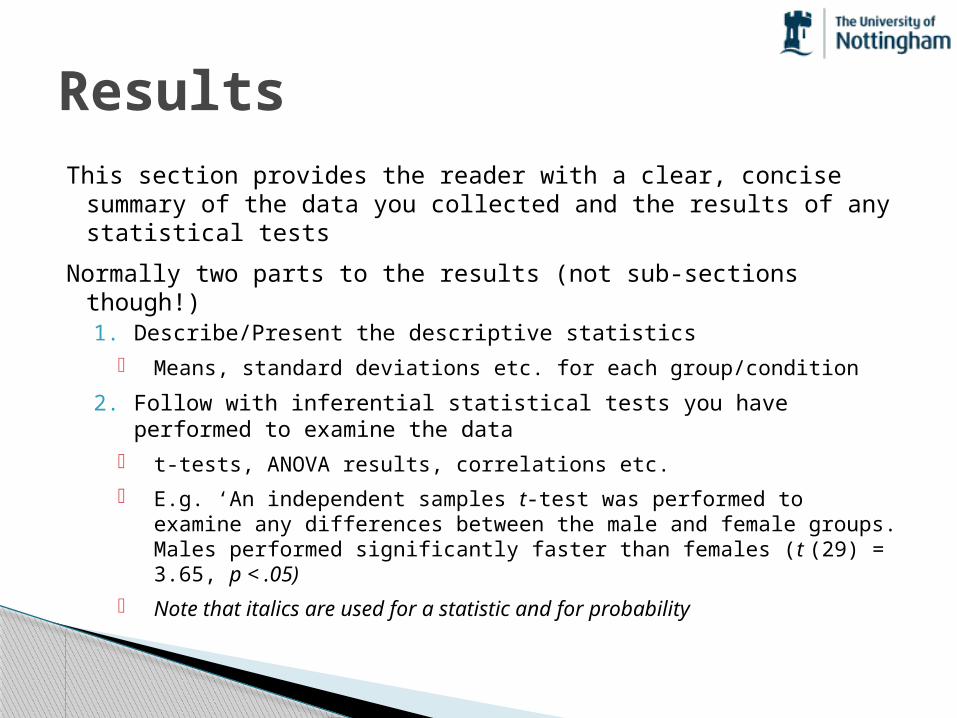
ResultsThis section provides the reader with a clear, concise summary
of the data you collected and the results of any statistical tests
Normally two parts to the results (not sub-sections though!)1. Describe/Present the descriptive statistics
Means, standard deviations etc. for each group/condition2. Follow with inferential statistical tests you have performed to
examine the data t-tests, ANOVA results, correlations etc. E.g. ‘An independent samples t-test was performed to examine
any differences between the male and female groups. Males performed significantly faster than females (t (29) = 3.65, p < .05)
Note that italics are used for a statistic and for probability
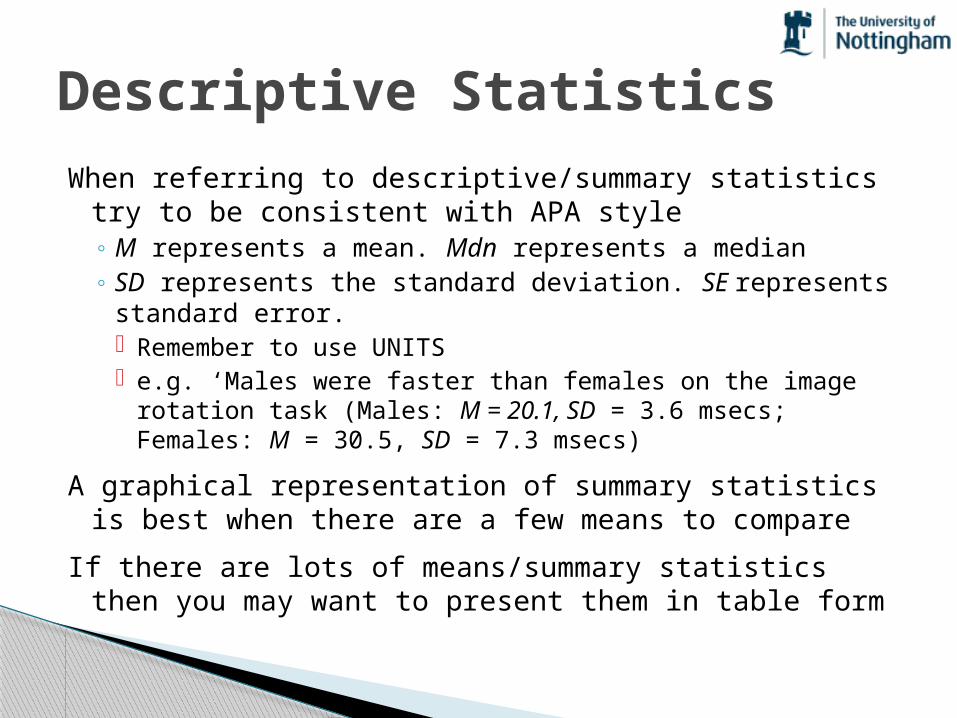
Descriptive StatisticsWhen referring to descriptive/summary statistics try to be
consistent with APA style◦ M represents a mean. Mdn represents a median◦ SD represents the standard deviation. SE represents
standard error. Remember to use UNITS e.g. ‘Males were faster than females on the image rotation
task (Males: M = 20.1, SD = 3.6 msecs; Females: M = 30.5, SD = 7.3 msecs)
A graphical representation of summary statistics is best when there are a few means to compare
If there are lots of means/summary statistics then you may want to present them in table form
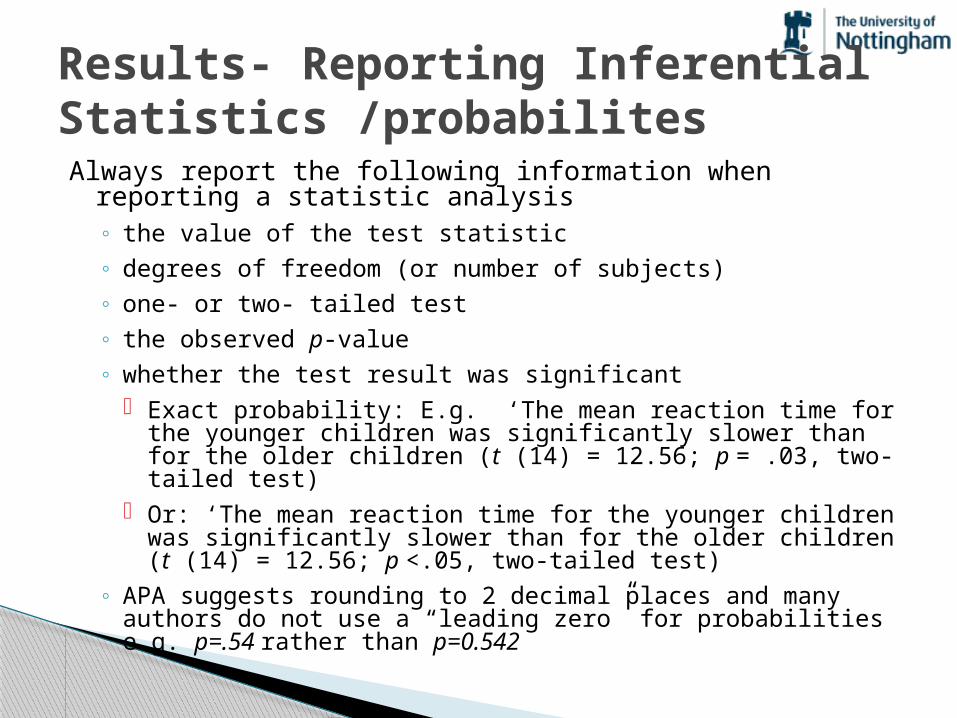
Results- Reporting Inferential Statistics /probabilitesAlways report the following information when reporting a
statistic analysis◦ the value of the test statistic◦ degrees of freedom (or number of subjects)◦ one- or two- tailed test◦ the observed p-value◦ whether the test result was significant
Exact probability: E.g. ‘The mean reaction time for the younger children was significantly slower than for the older children (t (14) = 12.56; p = .03, two-tailed test)
Or: ‘The mean reaction time for the younger children was significantly slower than for the older children (t (14) = 12.56; p <.05, two-tailed test)
◦ APA suggests rounding to 2 decimal places and many authors do not use a “leading zero” for probabilities e.g. p=.54 rather than p=0.542
ResultsRemember:
◦ Descriptive statistics should be reported in sentence form or in a table (not a list)
◦ Statistical tests should be reported in the standard format for that test. You might want to check your C81MST lectures for
tips on this too!◦ Explain what these tests mean in relation to your
experiment and the predictions

Results – What not to doDon’t cut and paste tables from SPSS into your results sectionDon’t include statistical calculations (by hand or computer)Don’t include raw data in the results section (You can put it in the
appendix if necessary)Don’t try to complicate your results- this section is often best to be
left as clear and straightforward as possibleDon’t interpret your results at this stage – save that for the
Discussion. But you should state your results in an understandable form. e.g.:
‘Males were faster than females’ is a statement about your results
‘Males were faster than females which supports the findings of Calder (1989), but is in opposition to Broad’s (1990) theory which posited that the female brain was more developed for knitting skills’ is a discussion & doesn't belong in the results section.

DiscussionThis section is where you can interpret your
findings and relate them to previous research/predictions.
Often you will make reference to material you raised in your introduction.
General structure:◦ State what the results are by providing a précis (in
words) of the results. ◦ Account for the findings. ◦ Explore the implications of the findings.

Discussion – State main resultsWhat were the key findings?Were there any significant differences between
conditions?◦ If so, then what direction were those differences in?
Do they support the hypothesis/hypotheses?
Discussion – Account for the results Discuss what these results mean
◦ You will either have 1. Rejected the null hypothesis (in favour of the
experimental hypothesis) , or2. Failed to reject the null hypothesis
◦ If 1. then are you sure that the effect was due to your manipulation of the IV or could confounding variables explain the result?
◦ If 2. then try to convince the reader that there is no relationship between the IV and DV.
◦ Either way, try your best to explain the findings

Discussion - ImplicationsAre there any implications based on your results?Are there any weaknesses of your study that may
suggest factors to be improved?◦ Don’t tear apart your study! Constructive criticism is
OKThis may pave the way to discuss any future
research
Finally, conclude with a short paragraph summarising the main findings / implications
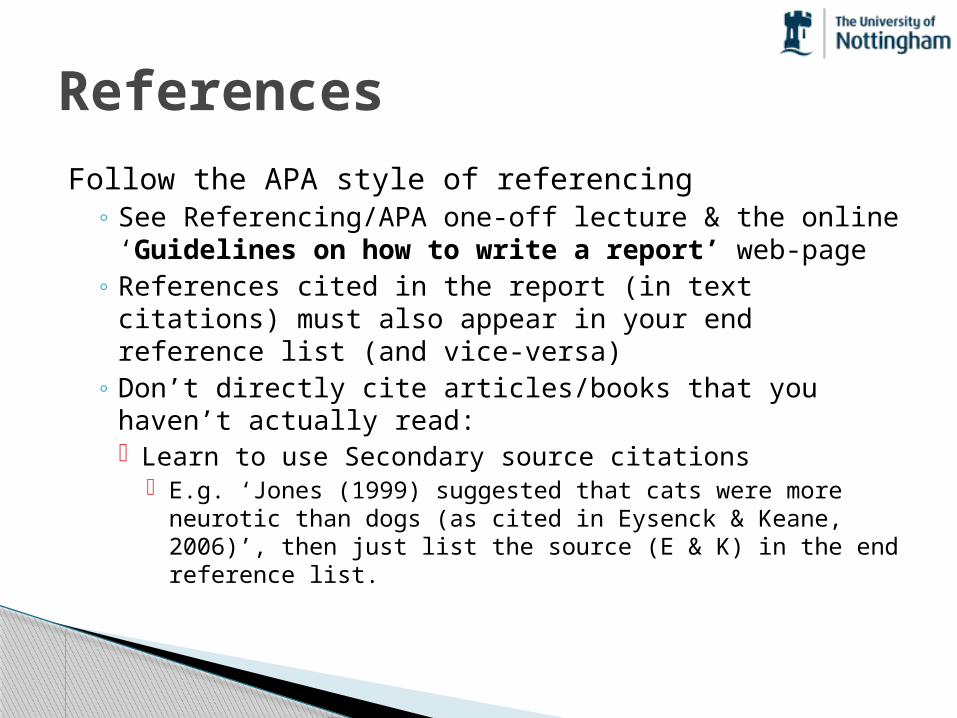
ReferencesFollow the APA style of referencing
◦ See Referencing/APA one-off lecture & the online ‘Guidelines on how to write a report’ web-page
◦ References cited in the report (in text citations) must also appear in your end reference list (and vice-versa)
◦ Don’t directly cite articles/books that you haven’t actually read: Learn to use Secondary source citations
E.g. ‘Jones (1999) suggested that cats were more neurotic than dogs (as cited in Eysenck & Keane, 2006)’, then just list the source (E & K) in the end reference list.

References (in text)Example 1: ‘Evidence suggests that old people
cause more road traffic accidents than new drivers (Killers, 2005).’
Example 2: ‘A study by Killers (2005) highlighted that road traffic accidents were more likely to be caused by older drivers than drivers who had only recently passed their test.’

Marking SchemeWhen assessing the practical reports the markers
consider five broad issues: ◦ Content (does the report suitably motivate, justify, analyse and
evaluate the conducted research?) ◦ Global Structure (does the report adhere to the format
specified in the School’s document on writing reports?) ◦ Local Structure (does each section of the report contain the
relevant information?) ◦ Reasoning (is there a convincing line of argument for the
research conducted and a suitable conclusion drawn?) ◦ Evaluation of evidence (is the relevant literature evaluated
appropriately?)
You may also want to take a look at the Practicals Feedback Sheet (available from the School Office)

Final TipsA good book
◦ Andy Field & Graham Hole (2003). How to design and report experiments. Sage: London. Chapter 9, p. 287 onwards
Write in the past-tense throughout (apart from any predictions made in the intro can be phrased in the future tense)
Avoid personal grammar (‘I’, ‘We’ etc.)
Thanks to Andy Field from whom much of this material has been stolen!
Navon’s study of Global vs Local Perceptual
processing

Global and local perception

Forest Before Trees: The Precedence of Global Features in Visual Perception
In a series of experiments David Navon (1977) explored the relationship between global and local perception.
Theoretical claim: “…Perceptual processes are temporally organised so that they proceed from global structuring toward more and more fine grained analysis”.
This is known as Global Precedence

Navon’s method-Exp. 3 of paperRequired participants to respond to either the local
or global level of the stimuli. Location of presentation varied to prevent
participants from using strategies. 2 conditions: Local-directed & Global-directedIndependent variable: ConsistencyDependent variable: Reaction time in milliseconds
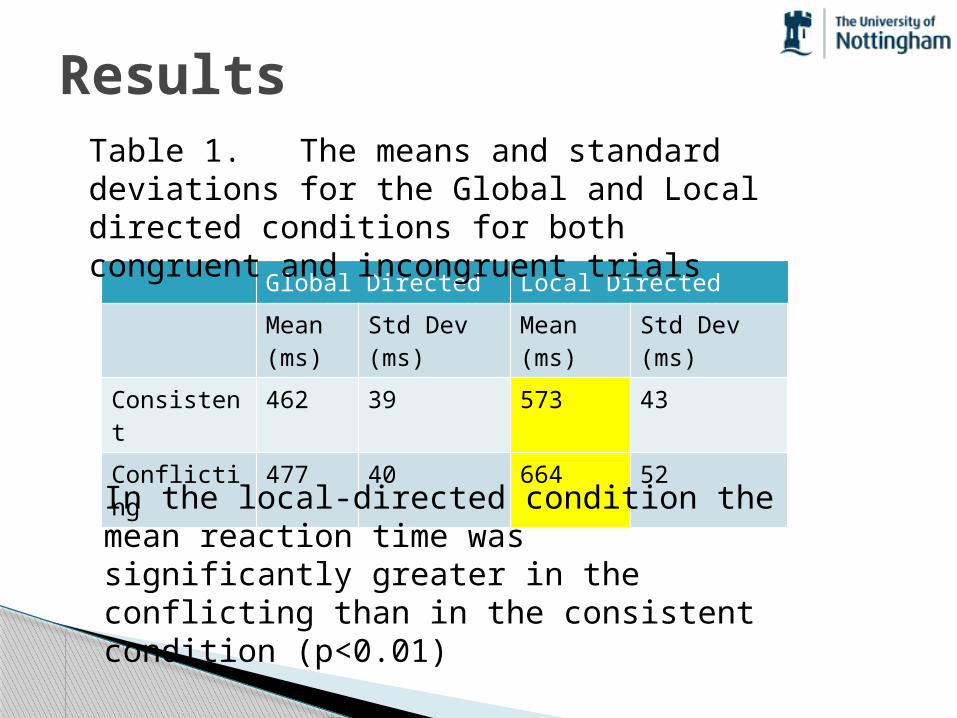
Results
Global Directed Local DirectedMean(ms)
Std Dev(ms)
Mean (ms)
Std Dev(ms)
Consistent 462 39 573 43Conflicting 477 40 664 52
Table 1. The means and standard deviations for the Global and Local directed conditions for both congruent and incongruent trials
In the local-directed condition the mean reaction time was significantly greater in the conflicting than in the consistent condition (p<0.01)

Conclusions“The results of this experiment suggests that the global
pattern is responded to faster than the local components. Moreover, whereas people can voluntarily attend to the global pattern without being affected by the local features, they are not able to process the local features without being aware of the whole”(pg. 371, Cognitive Psychology, 9, 1977)
Navon argues that the finding that attention cannot be efficiently diverted from the whole may be interpreted as support to the notion that global processing is a necessary stage of perception prior to more fine-grained analysis.
Your experiment Aims to replicate Navon’s findings for the Local
Directed condition ONLY. Same stimuli as Navon usedVaries the location that stimuli are presented on
screen (top left, top right, bottom left, bottom right) making the task harder
I.V – Congruence of small/large lettersD.V. – Reaction time (seconds)


![XII (Intermediate-2nd year) COMPUTER PRACTICALS · XII (Intermediate-2nd year) COMPUTER PRACTICALS C/C++:Language Databases [MOHSIN AHMED KHAN GHORI: Lecturer], Pakistan ShipOwners’](https://static.documents.pub/doc/80x56/606e0904cd53ae136e371ebf/xii-intermediate-2nd-year-computer-xii-intermediate-2nd-year-computer-practicals.jpg)


