124
FISCAL 2014 ANNUAL REPORT

FISCAL 2014 ANNUAL REPORT

GUESSHamburg, GERMANY
GUESSViareggio, ITALY

GUESSSydney, AUSTRALIA
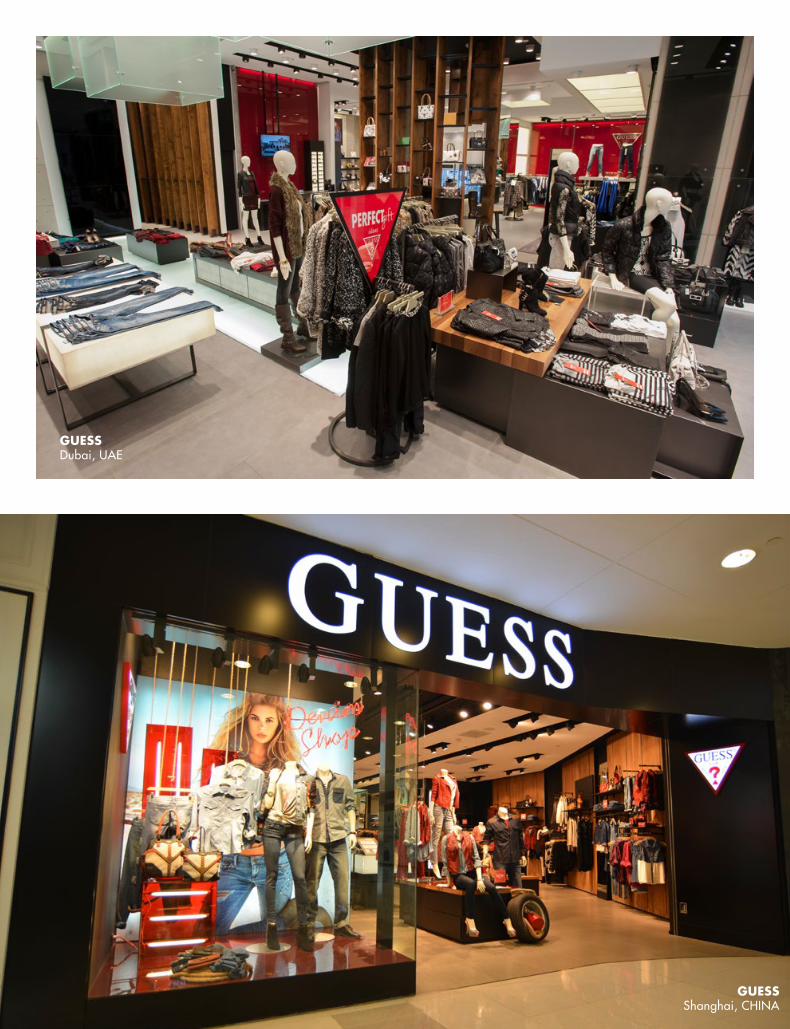
GUESSDubai, UAE
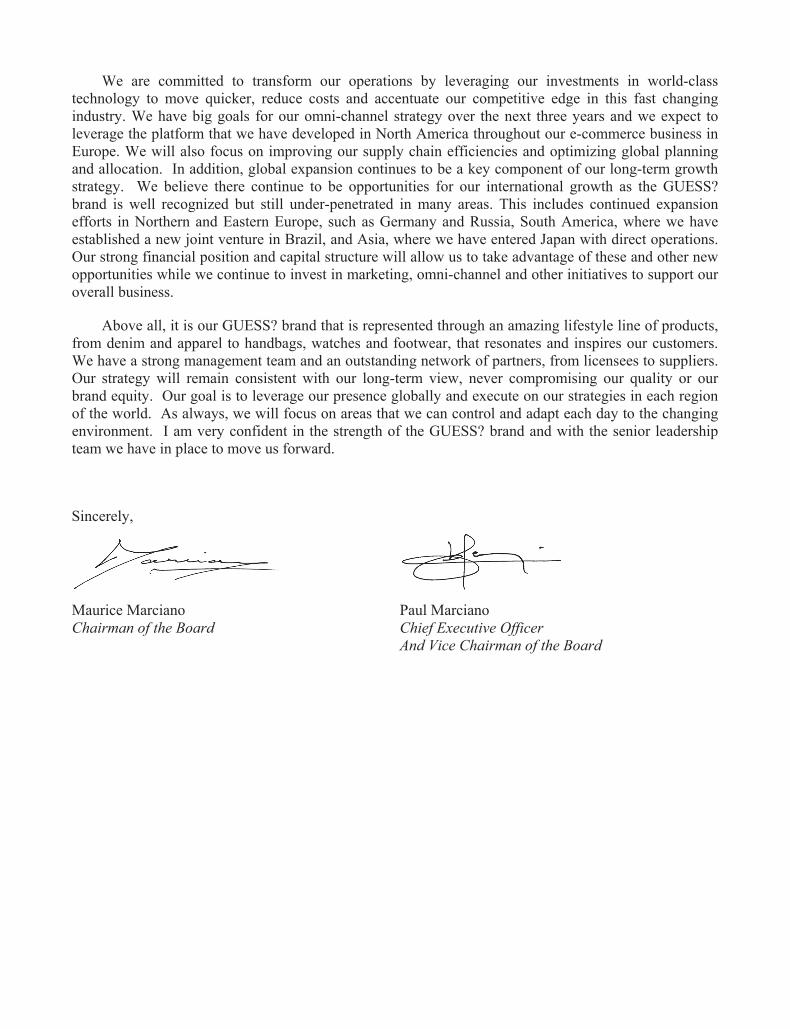
GUESSShanghai, CHINA

CHAIRMAN AND CEO’S LETTER TO OUR SHAREHOLDERS
Dear Shareholders:
During fiscal 2014, we made significant progress with expanding on our omni-channel strategy and improving our product assortment as we returned to our denim roots. However, fiscal 2014 was a challenging year impacted by continued softness in Southern Europe as well as a very promotional environment in North America. Despite these challenges, we continued to deliver strong cash flows through management of working capital and disciplined deployment of capital expenditures. Overall, we stayed focused on what we can control, such as inventory where trends improved quarter over quarter throughout the year, and expenses which declined in total versus last year. We ended the year with over $500 million in cash and cash equivalents and virtually no debt while returning $90 million to our shareholders through the payment of dividends and repurchases of the Company’s common stock. Beginning in the first quarter of fiscal 2015, our Board of Directors approved a 12.5% increase of our quarterly cash dividend to $0.225 per share. We are pleased with the strength of our balance sheet and our ability to generate strong cash flows and we wanted to reward our shareholders with an increase in our quarterly cash dividend.
As we look back on the year, e-commerce in North America was our fastest channel of growth, increasing by 28% during fiscal 2014 compared to the prior year as we have made significant progress with the development of our omni-channel strategy. However, we were disappointed in the performance of our North American Retail business outside of e-commerce where we faced a highly promotional competitive environment in addition to lower traffic and adverse weather conditions. We plan to increase retail sales and profitability over the long-term by improving the productivity and performance of our existing stores and by leveraging the full potential of our supply chain to improve the efficiency of our speed to market. During fiscal 2015, we expect to continue with reduced store openings as well as the closure of certain under-performing stores as lease terms permit. However, we will always look for opportunities to secure prime locations with strong economics that will benefit the GUESS? brand.
During fiscal 2014, we continued to be challenged by our business in Southern Europe, particularly in our wholesale operations. However, our retail operations in Europe showed signs of improvement during the second half of the year where our property stores posted positive comparable store sales during the fourth quarter of fiscal 2014 for the first time after ten consecutive quarters of comparable store sale declines. Our long-term strategy continues to include the development of new markets in Northern and Eastern Europe. During fiscal 2015, we expect to continue our store expansion in these regions, but we expect the resulting growth to be mostly offset by the closure of certain under-performing stores, mainly in Southern Europe, as lease terms permit.
In Asia, we are excited about the launch of our directly operated business in Japan, where we opened our first store in the first quarter of fiscal 2015. We also continue to see growth opportunities in South Korea, which is our largest market in the Asian region. In China during fiscal 2014, the economy has shown some signs of slowing and we have seen evidence of a more cautious customer. Throughout Asia, we and our partners opened 67 new stores and closed 38 stores during fiscal 2014, ending the year with 499 stores and 492 concessions in the region. Asia is a priority for us and we will continue to invest capital there to support additional growth and development in the region.
We are committed to transform our operations by leveraging our investments in world-class technology to move quicker, reduce costs and accentuate our competitive edge in this fast changing industry. We have big goals for our omni-channel strategy over the next three years and we expect to leverage the platform that we have developed in North America throughout our e-commerce business in Europe. We will also focus on improving our supply chain efficiencies and optimizing global planning and allocation. In addition, global expansion continues to be a key component of our long-term growth strategy. We believe there continue to be opportunities for our international growth as the GUESS? brand is well recognized but still under-penetrated in many areas. This includes continued expansion efforts in Northern and Eastern Europe, such as Germany and Russia, South America, where we have established a new joint venture in Brazil, and Asia, where we have entered Japan with direct operations. Our strong financial position and capital structure will allow us to take advantage of these and other new opportunities while we continue to invest in marketing, omni-channel and other initiatives to support our overall business.
Above all, it is our GUESS? brand that is represented through an amazing lifestyle line of products, from denim and apparel to handbags, watches and footwear, that resonates and inspires our customers. We have a strong management team and an outstanding network of partners, from licensees to suppliers. Our strategy will remain consistent with our long-term view, never compromising our quality or our brand equity. Our goal is to leverage our presence globally and execute on our strategies in each region of the world. As always, we will focus on areas that we can control and adapt each day to the changing environment. I am very confident in the strength of the GUESS? brand and with the senior leadership team we have in place to move us forward.
Maurice Marciano Chairman of the Board
Paul Marciano Chief Executive Officer And Vice Chairman of the Board
Sincerely,
UNITED STATESSECURITIES AND EXCHANGE COMMISSION
Washington, D.C. 20549
FORM 10-K Annual Report Pursuant to Section 13 or 15(d) of the Securities Exchange Act of 1934
For the Fiscal Year Ended February 1, 2014 OR
Transition Report Pursuant to Section 13 or 15(d) of the Securities Exchange Act of 1934For the transition period from to
Commission File Number 1-11893
GUESS?, INC.(Exact name of registrant as specified in its charter)
Delaware 95-3679695(State or other jurisdiction of incorporation or organization) (I.R.S. Employer Identification Number)
1444 South Alameda StreetLos Angeles, California 90021
(213) 765-3100 (Address, including zip code, and telephone number, including area code)
Securities registered pursuant to Section 12(b) of the Act:Title of Each Class Name of Each Exchange on Which Registered
common stock, par value $0.01 per share New York Stock ExchangeSecurities registered pursuant to Section 12(g) of the Act: None
Indicate by check mark if the registrant is a well-known seasoned issuer, as defined in Rule 405 of the Securities Act. Yes No Indicate by check mark if the registrant is not required to file reports pursuant to Section 13 or Section 15(d) of the Act. Yes No Indicate by check mark whether the registrant (1) has filed all reports required to be filed by Section 13 or 15(d) of the Securities Exchange Act of 1934 during the preceding 12 months (or for such shorter period that the registrant was required to file such reports), and (2) has been subject to such filing requirements for the past 90 days. Yes No Indicate by check mark whether the registrant has submitted electronically and posted on its corporate Web site, if any, every Interactive Data File required to be submitted and posted pursuant to Rule 405 of Regulation S-T (§232.405 of this chapter) during the preceding 12 months (or for such shorter period that the registrant was required to submit and post such files). Yes No Indicate by check mark if disclosure of delinquent filers pursuant to Item 405 of Regulation S-K (§229.405 of this chapter) is not contained herein, and will not be contained, to the best of registrant’s knowledge, in definitive proxy or information statements incorporated by reference in Part III of this Form 10-K or any amendment to this Form 10-K. Indicate by check mark whether registrant is a large accelerated filer, an accelerated filer, a non-accelerated filer, or a smaller reporting company. See the definitions of “large accelerated filer,” “accelerated filer” and “smaller reporting company” in Rule 12b-2 of the Exchange Act.
Large accelerated filer Accelerated filer Non-accelerated filer (Do not check if a smaller reporting company) Smaller reporting company
Indicate by check mark whether the registrant is a shell company (as defined in Rule 12b-2 of the Exchange Act). Yes No As of the close of business on August 3, 2013, the last business day of the registrant’s most recently completed second fiscal quarter, the aggregate market value of the voting and non-voting common equity stock held by non-affiliates of the registrant was $2,031,021,093 based upon the closing price of $34.16 on the New York Stock Exchange composite tape on such date. For this computation, the registrant has excluded the market value of all shares of its common stock reported as beneficially owned by executive officers and directors of the registrant. Such exclusion shall not be deemed to constitute an admission that any such person is an “affiliate” of the registrant.As of the close of business on March 24, 2014, the registrant had 84,978,559 shares of common stock outstanding.
DOCUMENTS INCORPORATED BY REFERENCEPortions of the proxy statement for the registrant’s 2014 Annual Meeting of Stockholders are incorporated by reference into Part III herein.

(This page has been left blank intentionally.)
i
TABLE OF CONTENTS
Item Description PagePART I
1 Business ........................................................................................................................................ 11A Risk Factors .................................................................................................................................. 121B Unresolved Staff Comments ......................................................................................................... 22
2 Properties ...................................................................................................................................... 233 Legal Proceedings ........................................................................................................................ 244 Mine Safety Disclosures ............................................................................................................... 25
PART II5 Market for Registrant’s Common Equity, Related Stockholder Matters and Issuer Purchases
Equity Securities ....................................................................................................................... 266 Selected Financial Data ................................................................................................................ 297 Management’s Discussion and Analysis of Financial Condition and Results of Operations ........ 30
7A Quantitative and Qualitative Disclosures About Market Risk ...................................................... 528 Financial Statements and Supplementary Data ............................................................................ 549 Changes in and Disagreements With Accountants on Accounting and Financial Disclosure ....... 55
9A Controls and Procedures ............................................................................................................... 559B Other Information ......................................................................................................................... 57
PART III10 Directors, Executive Officers and Corporate Governance ............................................................ 5711 Executive Compensation .............................................................................................................. 5712 Security Ownership of Certain Beneficial Owners and Management and Related Stockholder
Matters .......................................................................................................................................... 5713 Certain Relationships and Related Transactions, and Director Independence .............................. 5714 Principal Accountant Fees and Services ....................................................................................... 57
PART IV15 Exhibits, Financial Statement Schedules ...................................................................................... 58

ii
IMPORTANT FACTORS REGARDING FORWARD-LOOKING STATEMENTS
Throughout this Annual Report on Form 10-K, including documents incorporated by reference herein, we make “forward-looking” statements, which are not historical facts, but are forward-looking statements within the meaning of the Private Securities Litigation Reform Act of 1995. Forward-looking statements may also be in our other reports filed under the Securities Exchange Act of 1934, as amended, in our press releases and in other documents. In addition, from time-to-time, we, through our management, may make oral forward-looking statements. These statements relate to analyses and other information based on forecasts of future results and estimates of amounts not yet determinable. These statements also relate to our goals, future prospects and proposed new products, services, developments or business strategies. These forward-looking statements are identified by their use of terms and phrases such as “anticipate,” “believe,” “continue,” “could,” “estimate,” “expect,” “goal,” “intend,” “may,” “outlook,” “pending,” “plan,” “predict,” “project,” “strategy,” “will,” “would,” and other similar terms and phrases, including references to assumptions.
Although we believe that the expectations reflected in any of our forward-looking statements are reasonable, actual results could differ materially from those projected or assumed. These forward-looking statements may include, among other things, statements relating to our expected results of operations, the accuracy of data relating to, and anticipated levels of, future inventory and gross margins, anticipated cash requirements and sources, cost containment efforts, restructuring charges, estimated charges, plans regarding store openings and closings, plans regarding business growth and international expansion, e-commerce, business seasonality, results of litigation, industry trends, consumer demands and preferences, competition, currency fluctuations, estimated tax rates, results of tax audits and other regulatory proceedings, raw material and other inflationary cost pressures, consumer confidence and general economic conditions. We do not intend, and undertake no obligation, to update our forward-looking statements to reflect future events or circumstances. Such statements involve risks and uncertainties, which may cause actual results to differ materially from those set forth in these statements. Important factors that could cause or contribute to such difference include those discussed under “Part I, Item 1A. Risk Factors” contained herein.

1
PART I
ITEM 1. Business.General
Unless the context indicates otherwise, the terms “we,” “us,” “our” or the “Company” in this Form 10-K refer to Guess?, Inc. (“GUESS?”) and its subsidiaries on a consolidated basis.
We design, market, distribute and license one of the world’s leading lifestyle collections of contemporary apparel and accessories for men, women and children that reflect the American lifestyle and European fashion sensibilities. Our apparel is marketed under numerous trademarks including GUESS, GUESS?, GUESS U.S.A., GUESS Jeans, GUESS? and Triangle Design, MARCIANO, Question Mark and Triangle Design, a stylized G and a stylized M, GUESS Kids, Baby GUESS, YES, G by GUESS, GUESS by MARCIANO and Gc. The lines include full collections of clothing, including jeans, pants, skirts, dresses, shorts, blouses, shirts, jackets, knitwear and intimate apparel. We also selectively grant licenses to manufacture and distribute a broad range of products that complement our apparel lines, including eyewear, watches, handbags, footwear, kids’ and infants’ apparel, outerwear, swimwear, fragrance, jewelry and other fashion accessories.
Our products are sold through direct-to-consumer, wholesale and licensing distribution channels. Our core customer is a style-conscious consumer primarily between the ages of 20 and 35. These consumers are part of a highly desirable demographic group that we believe, historically, has had significant disposable income. We also appeal to customers outside this group through specialty product lines that include MARCIANO, a more sophisticated fashion line targeted to women and men, and GUESS Kids, targeted to boys and girls ages 6 to 12.
We were founded in 1981 and currently operate as a Delaware corporation.The Company operates on a 52/53-week fiscal year calendar, which ends on the Saturday nearest to
January 31 of each year. All references herein to “fiscal 2014”, “fiscal 2013”, and “fiscal 2012” represent the results of the 52-week fiscal year ended February 1, 2014, the 53-week fiscal year ended February 2, 2013 and the 52-week fiscal year ended January 28, 2012, respectively. The additional week in fiscal 2013 occurred during the fourth quarter ended February 2, 2013. References to “fiscal 2015” represent the 52-week fiscal year ending January 31, 2015. Business Strengths
We believe we have several business strengths that set us apart from our competition, including:Brand Equity. The GUESS? brand is an integral part of our business, a significant strategic asset and a
primary source of sustainable competitive advantage. The GUESS? brand communicates a distinctive image that is fun, fashionable and sexy. We have developed and maintained this image worldwide through our consistent emphasis on innovative and distinctive product designs and through our award-winning advertising, under the creative leadership and vision of Paul Marciano, our Chief Executive Officer. Brand loyalty, name awareness, perceived quality, strong brand images, public relations, publicity, promotional events and trademarks all contribute to the reputation and integrity of the GUESS? brand.
Global Diversification. The global success of the GUESS? brand has reduced our reliance on any particular geographic region. This geographic diversification provides broad opportunities for growth, even during regional economic slowdowns. The percentage of our revenue generated from outside of the U.S. and Canada has grown from one-fifth of our total revenues for the year ended December 31, 2005 to approximately half of our revenue for the year ended February 1, 2014. We and our licensees and distributors now operate 1,214 stores in 88 countries outside the U.S. and Canada. This compares with 494 directly operated stores in the U.S. and Canada as of February 1, 2014.
We believe there continue to be opportunities for our international growth as the GUESS? brand is well recognized but still under-penetrated in many areas. In Europe, over the long-term, we will continue to focus on developing new markets in Northern and Eastern Europe. In Asia, our business has continued to grow, fueled by
2
the strength of our brand in South Korea. We are also in the process of establishing our direct operations in Japan where we opened our first store in the first quarter of fiscal 2015. During fiscal 2014, we entered into a new majority-owned joint venture in Brazil which is expected to increase our presence in South America. We also expect to continue to expand in less mature markets like Germany, Mexico, the Middle East and Russia.
Multiple Store Concepts. We and our network of licensee partners sell our products around the world primarily through six different store concepts, namely our GUESS? full-price retail stores, our GUESS? factory outlet stores, our G by GUESS stores, our GUESS? Accessories stores, our MARCIANO stores and our GUESS? Kids stores. We also have a small number of footwear, Gc watch and underwear concept stores. This allows us to target the various demographics in each region through dedicated store concepts that market each brand or concept specifically to the desired customer population. Having multiple store concepts also allows us to target our newer brands and concepts in different markets than our flagship GUESS? store concept. For instance, we can target mall locations for G by GUESS stores where we would not ordinarily operate any of our full-price GUESS? stores.
Multiple Distribution Channels. We use direct-to-consumer, wholesale and licensing distribution channels to sell our products. This allows us to maintain a critical balance as our operating results do not depend solely on the performance of any single channel. The use of multiple channels also allows us to adapt quickly to changes in the distribution environment in any particular region.
Direct-to-Consumer. Our direct-to-consumer network is made up of both directly operated brick-and-mortar retail stores as well as integrated e-commerce sites that create a seamless shopping experience for our customers with shared product inventories.
Directly operated retail stores and concessions. At February 1, 2014, we directly operated a total of 494 stores in the U.S. and Canada and 346 stores outside of the U.S. and Canada, plus an additional 243 smaller-sized concessions in Asia and Europe. Distribution through our directly operated retail stores and concessions allows us to influence the merchandising and presentation of our products, enhance our brand image, build brand equity and test new product design concepts. As part of our omni-channel initiative, U.S. stores sales may also be fulfilled from our e-commerce inventory.
e-Commerce. At February 1, 2014, we operated retail websites in the U.S., Canada, Europe and South Korea. Our websites act as virtual storefronts that both sell our products and promote our brands. Designed as customer shopping centers, these sites showcase our products in an easy-to-navigate format, allowing customers to see and purchase our collections of apparel and accessories. These virtual stores have not only expanded our direct-to-consumer distribution channel, but they have also improved customer relations and are fun and entertaining alternative-shopping environments. Our U.S. and Canadian online sites contain “find the right fit” product recommendations and integration with our customer relationship management (“CRM”) system and loyalty programs. Omni-channel initiatives that we have already deployed in the U.S. include “reserve on-line, pick-up in stores” as well as mobile optimized commerce sites and smartphone applications. In addition, U.S. e-commerce orders may be fulfilled from our e-commerce distribution center, or from our retail stores, or both. We have e-commerce available to 36 countries and in eight languages around the world.
Wholesale Distribution. We sell through both domestic and international wholesale distribution channels as well as licensee operated retail stores and concessions.
Wholesale. U.S. and Canadian wholesale customers consist primarily of better department stores, including Macy’s, Bloomingdales and The Bay, and select specialty retailers and upscale boutiques, which have the image and merchandising expertise that we require for the effective presentation of our products. In Europe, our products are sold in stores ranging from large, well known department stores like El Corte Inglès, Galeries Lafayette and Printemps to small upscale multi-brand boutiques. Because our European wholesale business is more fragmented, we generally rely on a large number of smaller regional distributors and agents to distribute our products. Through our foreign subsidiaries

3
and our network of international distributors, our products are also available in major cities throughout Canada, Africa, Asia, Australia, the Middle East and Central and South America.
Licensee stores and concessions. At February 1, 2014, our international licensees and distributors operated 868 stores located outside the U.S. and Canada, plus 253 smaller-sized licensee operated concessions located in Asia. This licensed retail store and concession approach allows us to expand our international operations with a lower level of capital investment while still closely monitoring store designs and merchandise programs in order to protect the reputation of the GUESS? brand.
Licensing Operations. The desirability of the GUESS? brand name among consumers has allowed us to selectively expand our product offerings and global markets through trademark licensing arrangements, with minimal capital investment or on-going operating expenses. Our international licenses and distribution agreements allow for the sale of GUESS? branded products in better department stores and upscale specialty retail stores. We currently have 15 domestic and international licenses that include eyewear, watches, handbags, footwear, kids’ and infants’ apparel, outerwear, swimwear, fragrance, jewelry and other fashion accessories; and include licenses for the manufacture of GUESS? branded products in markets which include Africa, Asia, Australia, Europe, the Middle East, Central America, North America and South America.
Business Segments The Company’s businesses are grouped into five reportable segments for management and internal financial
reporting purposes: North American Retail, Europe, Asia, North American Wholesale and Licensing. Management evaluates segment performance based primarily on revenues and earnings from operations before restructuring charges, if any. The Company believes this segment reporting reflects how its five business segments are managed and each segment’s performance is evaluated. The North American Retail segment includes the Company’s retail and e-commerce operations in North America and its retail operations in Central and South America. The Europe segment includes the Company’s wholesale, retail and e-commerce operations in Europe and the Middle East. The Asia segment includes the Company’s wholesale, retail and e-commerce operations in Asia. The North American Wholesale segment includes the Company’s wholesale operations in North America and export sales to Central and South America. The Licensing segment includes the worldwide licensing operations of the Company. The business segment operating results exclude corporate overhead costs, which consist of shared costs of the organization, and restructuring charges. These costs are presented separately and generally include, among other things, the following unallocated corporate costs: accounting and finance, executive compensation, facilities, global advertising and marketing, human resources, information technology and legal.

4
The following table presents our net revenue and earnings from operations by segment for the last three fiscal years:
Year Ended Year Ended Year EndedFeb 1, 2014 Feb 2, 2013 Jan 28, 2012
(dollars in thousands)Net revenue:
North American Retail...................... $ 1,075,475 41.9% $ 1,116,836 42.1% $ 1,117,643 41.6%Europe............................................... 903,791 35.1 939,599 35.3 1,010,896 37.6Asia ................................................... 292,714 11.4 290,655 10.9 250,727 9.3North American Wholesale............... 179,600 7.0 194,373 7.3 187,362 7.0
Net revenue from product sales.... 2,451,580 95.4 2,541,463 95.6 2,566,628 95.5Licensing........................................... 118,206 4.6 117,142 4.4 121,420 4.5
Total net revenue .......................... $ 2,569,786 100.0% $ 2,658,605 100.0% $ 2,688,048 100.0%Earnings (loss) from operations:
North American Retail...................... $ 39,540 17.8% $ 78,285 28.5% $ 133,184 33.5%Europe............................................... 97,231 43.7 103,975 37.9 167,014 42.0Asia ................................................... 25,592 11.5 26,525 9.6 28,463 7.2North American Wholesale............... 38,771 17.4 45,008 16.4 47,162 11.9Licensing........................................... 107,805 48.4 101,182 36.9 108,638 27.3Corporate Overhead.......................... (73,910) (33.2) (80,450) (29.3) (87,226) (21.9)Restructuring Charges....................... (12,442) (5.6) — — — —
Total earnings from operations..... $ 222,587 100.0% $ 274,525 100.0% $ 397,235 100.0%
Additional segment information, together with certain geographical information, is included in Note 17 to the Consolidated Financial Statements contained herein.
North American Retail Segment In our North American Retail segment, we sell our products through a network of directly operated retail and factory outlet stores in North America and through our on-line stores. In fiscal 2014, our North American Retail segment accounted for approximately 41.9% of our revenue and 17.8% of our earnings from operations. Our North American Retail stores build brand awareness and contribute to market penetration and the growth of our brand, which also drives e-commerce and licensee sales. This segment benefits from the strength of our brand, the quality of our product assortment, the development of a motivated team of sales professionals to service our customers and provide a favorable shopping experience, quality real estate in high-traffic shopping centers and a diversified mix of store concepts.

5
Below is a summary of store statistics for the U.S. and Canada, followed by details regarding each of our store concepts. In addition to the stores listed below, at February 1, 2014, we also directly operated 34 GUESS? branded stores in Mexico and two GUESS? branded stores in Brazil through our majority-owned joint ventures.
Feb 1,2014
Feb 2,2013
Jan 28,2012
GUESS? Retail Stores:U.S. ........................................................................ 121 128 141Canada................................................................... 55 56 56
176 184 197GUESS? Factory Outlet Stores:U.S. ........................................................................ 113 113 109Canada................................................................... 21 19 19
134 132 128G by GUESS Stores:U.S. ........................................................................ 82 85 63
82 85 63GUESS? Accessories Stores:U.S. ........................................................................ 34 41 42Canada................................................................... 18 18 19
52 59 61MARCIANO Stores:U.S. ........................................................................ 29 31 34Canada................................................................... 21 21 21
50 52 55Total....................................................................... 494 512 504Square footage at fiscal year end .......................... 2,329,000 2,371,000 2,338,000
GUESS? Retail Stores. Our full-price U.S. and Canada GUESS? retail stores carry a full assortment of men’s and women’s GUESS? merchandise, including most of our licensed product categories. At February 1, 2014, these stores occupied approximately 893,000 square feet and ranged in size from approximately 1,500 to 13,000 square feet, with most stores between 4,000 and 5,500 square feet. In fiscal 2014, we opened two new retail stores and we closed ten stores.
GUESS? Factory Outlet Stores. Our U.S. and Canada factory outlet stores are located primarily in outlet malls generally operating outside the shopping radius of our wholesale customers and our full-price retail stores. These stores sell selected styles of men’s and women’s GUESS? apparel and accessories at lower price points. At February 1, 2014, our U.S. and Canada factory outlet stores occupied approximately 775,000 square feet and ranged in size from approximately 2,000 to 11,000 square feet, with most stores between 4,500 and 6,500 square feet. In fiscal 2014, we opened seven new factory stores and we closed five stores.
G by GUESS Stores. Our G by GUESS store concept, launched in fiscal 2008, targets a market demographic that shops price points below our GUESS? retail stores and carries apparel for both men and women and a full line of accessories and footwear. G by GUESS stores have a fresh feel, directed toward a full customer experience, with fashion-forward merchandise. At February 1, 2014, our G by GUESS stores occupied approximately 410,000 square feet and ranged in size from approximately 4,000 to 10,000 square feet, with most stores between 4,500 and 5,000 square feet. In fiscal 2014, we opened three new G by GUESS stores and we closed six stores.
GUESS? Accessories Stores. Our GUESS? Accessories store concept sells GUESS? and MARCIANO labeled accessory products. This concept enables us to utilize a smaller store floor space, dedicated to our full range of accessory products, that can co-exist in the same malls as our other concepts. At February 1, 2014, our GUESS? Accessories concept stores occupied approximately 108,000 square feet and ranged in size from approximately 1,000 to 4,000 square feet, with most stores between 1,500 and 2,500 square feet. In fiscal 2014, we closed seven GUESS? Accessories stores.

6
MARCIANO Stores. Our MARCIANO stores in the U.S. and Canada offer a fashion-forward women’s collection designed for the stylish, trend-setting woman. These stores have higher price points than our traditional GUESS stores and appeal to a slightly older, more sophisticated customer. At February 1, 2014, our MARCIANO stores occupied approximately 143,000 square feet and ranged in size from approximately 2,000 to 6,500 square feet, with most stores between 2,500 and 3,000 square feet. In fiscal 2014, we opened one new MARCIANO store and we closed three stores.
e-Commerce. Our North American Retail segment also includes our U.S. and Canada retail websites, including www.guess.com, www.gbyguess.com, www.guessbymarciano.com, www.marciano.com, www.guessfactory.com, www.guesskids.com, www.guess.ca and www.guessbymarciano.ca. These websites operate as virtual storefronts that, combined with our retail stores, provide a seamless shopping experience to the consumer to sell our products and promote our brands. They also provide fashion information and a mechanism for customer feedback while promoting customer loyalty and enhancing our brand identity through interactive content online and through smartphone applications. All websites and mobile sites are integrated with our CRM system and loyalty programs. In addition, U.S. e-commerce orders may be fulfilled from our e-commerce distribution center, or from our retail stores, or both.
Europe SegmentIn our Europe segment, we sell our products in 90 countries through wholesale, retail and e-commerce
channels, primarily throughout Europe and the Middle East. In fiscal 2014, our Europe segment accounted for approximately 35.1% of our revenues and 43.7% of our earnings from operations.
European Wholesale Distribution. Our European wholesale business generally relies on a large number of smaller regional distributors and agents to distribute our products primarily to smaller independent multi-brand boutiques. Our products are also sold directly to large, well known department stores like El Corte Inglès, Galeries Lafayette and Printemps. Overall, we have thousands of customers with no single customer representing more than 1% of our consolidated net revenue. The type of customer varies from region to region depending on both the prominence of the GUESS? brand in each region and the dominance of a particular type of retail channel in each region. In countries where the brand is well known, we operate through showrooms where agents and distributors can view our line and place orders. We currently have showrooms in key cities such as Barcelona, Dusseldorf, Florence, London, Lugano, Munich and Paris. In countries where the brand is less prominent, we may use one large distributor for the entire region. Revenues from sales to our licensee operated stores (see European Retail Network below) are recognized as wholesale sales within our European wholesale operations. We sell both our apparel and certain accessories products under our GUESS? and MARCIANO brand concepts through our wholesale channel, operating primarily through two seasons, Spring/Summer and Fall/Winter. Generally our Spring/Summer sales campaign is from May to September with the related shipments occurring primarily from November to April. The Fall/Winter sales campaign is from January to April with the related shipments occurring primarily from May to October. The Company’s goal is to take advantage of early-season demand and potential reorders by offering a pre-collection assortment which ships at the beginning of each season. Customers retain the ability to request early shipment of backlog orders or delay shipment of orders depending on their needs.
European Retail Network. Our European retail network is comprised of a mix of directly operated and licensee operated GUESS? and MARCIANO retail and outlet stores, GUESS? Kids stores, GUESS? Accessories stores, GUESS? Footwear stores and Gc stores. At February 1, 2014, we had 263 directly operated stores and 364 licensee stores, excluding four smaller-sized concessions in Europe. During fiscal 2014, we opened 32 new directly operated stores and 57 licensee stores and closed nine directly operated stores and 75 licensee stores. In addition, we acquired ten additional stores from certain of our European licensees during fiscal 2014. Our store locations vary country by country depending on the type of locations available. Our typical GUESS? Accessories stores average approximately 800 square feet, MARCIANO stores average approximately 1,100 square feet and full-price GUESS? stores generally average 2,300 square feet. Certain of our European stores require initial investments in the form of key money to secure prime store locations. These amounts are paid to landlords or existing lessees in certain circumstances.
7
Asia SegmentIn our Asia segment, we sell our products through wholesale, retail and e-commerce channels throughout
Asia. In fiscal 2014, our Asia segment accounted for approximately 11.4% of our revenue and 11.5% of our earnings from operations. Our growth in Asia has been fueled by our businesses in South Korea, where we began operating directly in 2007. Our Asia retail business includes both licensee and directly operated stores, including GUESS?, G by GUESS, MARCIANO, GUESS? Kids, GUESS? Accessories, Gc and GUESS? Underwear stores. For the year ended February 1, 2014, we and our partners opened 67 new stores and closed 38 stores in Asia, ending the year with 499 stores, 47 of which we operated directly and 452 of which were operated by licensees or distributors. This store count does not include 492 smaller-sized jean and accessory concessions. Concessions are widely used in Asia and generally represent directly managed shop-in-shops within a department store setting. Our Asia wholesale customer base is comprised primarily of a small number of selected distributors with which we have contractual distribution arrangements. We and our partners have flagship stores in key cities such as Beijing, Hong Kong, Seoul and Shanghai, and we have partnered with licensees to develop our business in the second-tier and third-tier cities in this region. We are also in the process of establishing our direct operations in Japan where we opened our first store in the first quarter of fiscal 2015.
North American Wholesale SegmentIn our North American Wholesale segment, we sell our products through wholesale channels in North
America and to third party distributors based in Central and South America. We are also in the process of developing our wholesale channel in Brazil through a majority-owned joint venture which was established during fiscal 2014. Our North American Wholesale business generally experiences stronger performance from July through November. In fiscal 2014, our North American Wholesale segment accounted for approximately 7.0% of our revenue and 17.4% of our earnings from operations. Our North American Wholesale customers consist primarily of better department stores, select specialty retailers and upscale boutiques. As of February 1, 2014, our products were sold to consumers through 969 major doors in the U.S. and Canada as well as through our customer’s e-commerce sites. This compares to 1,006 major doors at February 2, 2013. These locations include 496 shop-in-shops, an exclusive selling area within a department store that offers a wide array of our products and incorporates GUESS? signage and fixture designs. These shop-in-shops, managed by the department stores, allow us to reinforce the GUESS? brand image with our customers. Many department stores have more than one shop-in-shop, with each one featuring women’s or men’s apparel.
Our North American Wholesale merchandising strategy is to focus on trend-right products supported by key fashion basics. We have sales representatives in New York, Los Angeles, Toronto, Montreal and Vancouver who coordinate with customers to determine the inventory level and product mix that should be carried in each store. Additionally, we use merchandise coordinators who work with the stores to ensure that our products are displayed appropriately. During fiscal 2014, Macy’s, Inc. was our largest domestic wholesale customer, accounting for approximately 2.3% of our consolidated net revenue.
Licensing SegmentOur Licensing segment includes the worldwide licensing operations of the Company. In fiscal 2014, our
licensing segment royalties accounted for approximately 4.6% of our revenue and 48.4% of our earnings from operations.
The desirability of the GUESS? brand name among consumers has allowed us to selectively expand our product offerings and global markets through trademark licensing arrangements, with minimal capital investment or on-going operating expenses. We currently have 15 domestic and international licenses that include eyewear, watches, handbags, footwear, kids’ and infants’ apparel, outerwear, swimwear, fragrance, jewelry and other fashion accessories; and include licenses for the manufacture of GUESS? branded products in markets which include Africa, Asia, Australia, Europe, the Middle East, Central America, North America and South America.
Our trademark license agreements customarily provide for a three- to five-year initial term with a possible option to renew prior to expiration for an additional multi-year period. The typical license agreement requires that the licensee pay us the greater of a royalty based on a percentage of the licensee’s net sales of licensed products

8
or a guaranteed annual minimum royalty that typically increases over the term of the license agreement. In addition, several of our key license agreements provide for specified, fixed cash rights payments over and above our normal, ongoing royalty payments. Generally, licensees are required to spend a percentage of the net sales of licensed products for advertising and promotion of the licensed products and in many cases we place the ads on behalf of the licensee and are reimbursed. In addition, to protect and increase the value of our trademarks, our license agreements include strict quality control and manufacturing standards. Our licensing personnel in the U.S., Europe and Asia meet regularly with licensees to ensure consistency with our overall merchandising and design strategies in order to protect the GUESS? trademarks and brand. As part of this process, our licensing department reviews in advance all GUESS? third party licensed products, advertising and promotional materials.
We constantly examine opportunities to broaden our licensee portfolio by developing new license arrangements that can expand our brand penetration and complement the GUESS? image. We also strategically reposition our existing licensing portfolio by monitoring and evaluating the performance of our licensees worldwide. We have also successfully renegotiated license agreements with our existing licensees for watches, handbags and eyewear on terms that were significantly improved over our prior arrangements. We believe these were important steps in expanding our presence both domestically and globally.Acquisitions and Alliances
We evaluate strategic acquisitions and alliances and pursue those that we believe will support and contribute to our overall growth initiatives. For instance, between 2005 and 2013, we acquired several of our European apparel licensees. As a result, we now directly manage our adult and children’s apparel businesses in Europe. We believe the combination of the manufacture and distribution of all our European apparel lines under the GUESS? umbrella allows us to take advantage of economies of scale and provides an opportunity to further expand our wholesale and retail operations in this region.
In addition to the above acquisitions, in 2006, we entered into a majority-owned joint venture in Mexico to oversee the revitalization and expansion of the GUESS?, GUESS? Kids and G by GUESS brands in this region. The joint venture currently distributes primarily through four major department store chains, Liverpool, El Palacio de Hierro, Gran Chapur and Sears, with 401 major door locations and 34 free-standing GUESS? stores.
In fiscal 2010, we entered into majority-owned joint ventures in France and the Canary Islands with licensee partners to open new free standing retail stores in these regions. During fiscal 2013, we entered into a majority-owned joint venture in Portugal with a licensee partner to further expand in this region. We currently operate 11 stores in France, eight stores in the Canary Islands and 13 stores in Portugal through these joint ventures.
In fiscal 2014, we entered into a new majority-owned joint venture which will oversee the development of our retail and wholesale channels in Brazil. We currently operate two free-standing GUESS? stores through this joint venture and are represented in 250 specialty points of sale throughout Brazil.
In fiscal 2013, we acquired 26 stores from one of our European licensees. During fiscal 2014, we acquired ten additional stores from certain of our European licensees.Design
GUESS?, G by GUESS and MARCIANO apparel products are designed by their own separate in-house design teams located in Los Angeles, California and in Florence and Milan, Italy. The U.S. and Italy teams work closely to share ideas for products that can be sold throughout our global markets and are inspired by our GUESS? heritage. Our design teams seek to identify global fashion trends and interpret them for the style-conscious consumer while retaining the distinctive GUESS? image. They travel throughout the world in order to monitor fashion trends and discover new fabrics. These fabrics, together with the trends observed by our designers, serve as the primary source of inspiration for our lines and collections. We also maintain a fashion library consisting of vintage and contemporary garments as another source of creative concepts. In addition, our design teams work closely with members of our sales, merchandising and retail operations teams to further refine our products to meet the particular needs of our markets.
9
Advertising and MarketingOur advertising, public relations and marketing strategy is designed to promote a consistent high impact
image which endures regardless of changing consumer trends. While our advertising promotes products, the primary emphasis is on brand image.
Since our inception, Paul Marciano has had principal responsibility for the GUESS? brand image and creative vision. Under the direction of Mr. Marciano, our Los Angeles-based advertising department is responsible for overseeing all worldwide advertising. Throughout our history, we have maintained a high degree of consistency in our advertisements by using similar themes and images, including our signature black and white print advertisements and iconic logos.
We deploy a variety of media with an emphasis on print advertising focused on national and international contemporary fashion/beauty, lifestyle and celebrity publications. In recent years, we have also expanded our media efforts into digital advertising platforms including leading fashion and beauty websites, Facebook, Twitter and global search engines. In fiscal 2014, we launched a new smartphone application with e-commerce capability that merges social loyalty with traditional loyalty by rewarding brand ambassador customers who share our campaigns and promotions through their social networks.
We also require our licensees and distributors to invest a percentage of their net sales of licensed products and net purchases of GUESS? products in Company-approved advertising, promotion and marketing. By retaining control over our advertising programs, we are able to maintain the integrity of our brands while realizing substantial cost savings compared to outside agencies.
We will continue to regularly assess and implement marketing initiatives that we believe will build brand equity and grow our business by investing in marketing programs to build awareness and drive customer traffic to our stores and websites. We plan to further strengthen communications with customers through our websites, loyalty programs, direct catalog and marketing mailings, and other social media outlets, which enable us to provide timely information in an entertaining fashion to consumers about our history, products, special events, promotions and store locations, and allow us to receive and respond directly to customer feedback.
As part of these initiatives, we currently have loyalty programs in North America with over seven million members covering four of our brands. These programs reward our members who earn points for purchases that can be redeemed on future purchases. We also use these programs to promote new products to our customers which in turn increases traffic in the stores and online. We believe that the loyalty programs generate substantial repeat business that might otherwise go to competing brands. We continue to enhance our loyalty program offerings and strategically market to this large and growing customer base. Global Sourcing and Supply Chain
We source products through numerous suppliers, many of whom have established long-term relationships with us. We seek to achieve efficient and timely delivery of our products, combining global and local sourcing. Almost all of our products are acquired as package purchases where we design and source product and the vendor delivers the finished product.
In fiscal 2014, we continued to execute our strategy of deploying a global sourcing and product development plan to support worldwide growth in our e-commerce, retail, and wholesale channels. Key activities in global sourcing included our continued efforts to streamline our vendor base and achieve geographic balance. We believe that our balanced global supply chain, with deep vendor partnerships, provides us with a competitive advantage where we have the flexibility to respond to increased demand throughout the world. Our sourcing strategy provides us with the opportunity to leverage costs and improve speed to market.
As an ongoing strategic initiative, we have left a larger portion of our buys open prior to each season to improve the efficiency of our speed to market by allowing us to design and produce closer to market delivery. This allows us to better react to emerging fashion trends in the market. Additionally, offering an assortment of global core products continues to be an area of focus. As a global brand, we maintain skilled sourcing teams in North America, Europe and Asia.
10
We are committed to sourcing our products in a responsible manner, respecting both the countries in which we conduct business and the business partners that produce our products. As a part of this commitment, we have implemented a global social compliance program that applies to our business partners. Although local customs vary in different regions of the world, we believe that the issues of business ethics, human rights, health, safety and environmental stewardship transcend geographical boundaries.
To support and ensure our social compliance, we communicate our expectations to our partners throughout our global supply chain and conduct compliance audits. If deficiencies are discovered, personnel in each region are empowered to work with the respective business partner to take a corrective course of action. Additionally, the goal of this process is to educate individuals, build strategic relationships and improve business practices over the long-term.Quality Control
Our quality control program is designed to ensure that products meet our high quality standards. We test the quality of our raw materials prior to production and inspect prototypes of each product before production runs commence. We also perform random in-line quality control checks during and after production before the garments leave the contractor. Final random inspections occur when the garments are received in our distribution centers. We believe that our policy of inspecting our products is important to maintain the quality, consistency and reputation of our products.Logistics
We utilize distribution centers at strategically located sites. The Company’s primary U.S. distribution center is based in Louisville, Kentucky. At this 506,000 square-foot facility, we use fully integrated and automated distribution systems. The bar code scanning of merchandise, picking tickets and distribution cartons, together with radio frequency communications, provide timely, controlled, accurate and instantaneous updates to the distribution information systems. Distribution of our products in Canada is handled primarily from a Company operated distribution center in Montreal, Quebec. Distribution of our products in Europe is handled primarily through a third party distribution center in Piacenza, Italy. Additionally, we utilize several third party operated distribution warehouses in Hong Kong, South Korea and China that service the Asia region.Competition
The apparel industry is highly competitive and fragmented and is subject to rapidly changing consumer demands and preferences. We believe that our success depends in large part upon our ability to anticipate, gauge and respond to changing consumer demands and fashion trends in a timely manner and upon the continued appeal to consumers of the GUESS? brand. We compete with numerous apparel manufacturers and distributors, both domestically and internationally, as well as several well-known designers. Our retail and factory outlet stores face competition from other retailers. Our licensed apparel and accessories also compete with a substantial number of well-known brands. Although the level and nature of competition differ among our product categories and geographic regions, we believe that we differentiate ourselves from our competitors by offering a global lifestyle brand on the basis of our global brand image and wide product assortment comprising both apparel and accessories. We also believe that our geographic diversification, multiple distribution channels and multiple store concepts help to set us apart from our competition.Information Systems
We believe that high levels of automation and technology are essential to maintain our competitive position and support our strategic objectives and we continue to invest in and update computer hardware, system applications and networks. Our computer information systems consist of a full range of financial, distribution, merchandising, point-of-sales, customer relationship management, supply chain and other systems. During fiscal 2014, we continued to enhance our financial and operational systems globally to align with our global IT standards, accommodate future growth and provide operating efficiencies. Key initiatives included the further development of mobile-based initiatives to support both our wholesale and retail businesses (including the launch of our new smartphone application), various multi-channel initiatives (including the ability to ship online orders through stores in the U.S.) and continued enhancements of our product lifecycle management (“PLM”) system to facilitate

11
vendor collaboration and increase the efficiency of the supply chain. In Europe, we implemented a planning system with wholesale demand planning and retail merchandise and assortment planning capabilities.Trademarks
We own numerous trademarks, including GUESS, GUESS?, GUESS U.S.A., GUESS Jeans, GUESS? and Triangle Design, MARCIANO, Question Mark and Triangle Design, a stylized G and a stylized M, GUESS Kids, Baby GUESS, YES, G by GUESS, GUESS by MARCIANO and Gc. As of February 1, 2014, we had approximately 4,000 U.S. and internationally registered trademarks or trademark applications pending with the trademark offices in approximately 184 countries around the world, including the U.S. From time-to-time, we adopt new trademarks in connection with the marketing of our product lines. We consider our trademarks to have significant value in the marketing of our products and act aggressively to register and protect our trademarks worldwide.
Like many well-known brands, our trademarks are subject to infringement. We have staff devoted to the monitoring and aggressive protection of our trademarks worldwide.Wholesale Backlog
We generally receive orders for fashion apparel three to six months prior to the time the products are delivered to our customers’ stores. The backlog of wholesale orders at any given time is affected by various factors, including seasonality, cancellations, the scheduling of market weeks, the timing of the receipt of orders and the timing of the shipment of orders and may include orders for multiple seasons. Accordingly, a comparison of backlogs of wholesale orders from period to period is not necessarily meaningful and may not be indicative of eventual actual shipments.
U.S. and Canada Backlog. Our U.S. and Canadian wholesale backlog as of March 22, 2014, consisting primarily of orders for fashion apparel, was $70.2 million, compared to $68.5 million in constant currency at March 23, 2013, an increase of 2.5%.
Europe Backlog. As of March 23, 2014, the European wholesale backlog was €213.9 million, compared to €242.6 million at March 25, 2013, a decrease of 11.8%. The backlog as of March 23, 2014 is comprised of sales orders for the Spring/Summer 2014 and Fall/Winter 2014 seasons.
EmployeesAs of February 2014, we had approximately 14,600 associates, both full and part-time, consisting of
approximately 8,700 in the U.S. and 5,900 in foreign countries. The number of our employees fluctuates during the year based on seasonal needs. In some international markets, local laws provide for employee representation by organizations similar to unions and some of our international employees are covered by trade-sponsored or governmental bargaining arrangements. We consider our relationship with our associates to be good.Environmental Matters
We and our licensing partners and suppliers are subject to federal, state, local and foreign laws, regulations and ordinances that govern activities or operations that may have adverse environmental effects (such as emissions to air, discharges to water, and the generation, handling, storage and disposal of solid and hazardous wastes). We are also subject to laws, regulations and ordinances that impose liability for the costs of clean up or other remediation of contaminated property, including damages from spills, disposals or other releases of hazardous substances or wastes, in certain circumstances without regard to fault. Certain of our operations and those of our licensing partners and suppliers routinely involve the handling of chemicals and wastes, some of which are or may become regulated as hazardous substances. We have not incurred, and do not expect to incur, any significant expenditures or liabilities for environmental matters. As a result, we believe that our environmental obligations will not have a material adverse effect on our consolidated financial condition or results of operations.
12
Website Access to Our Periodic SEC ReportsOur investor website can be found at http://investors.guess.com. Our annual reports on Form 10-K, quarterly
reports on Form 10-Q, current reports on Form 8-K, and amendments to those reports filed or furnished to the Securities and Exchange Commission (“SEC”) pursuant to Section 13(a) or 15(d) of the Exchange Act, are available at out investor website, free of charge, as soon as reasonably practicable after we electronically file them with, or furnish them to, the SEC. In addition, the charters of our Board of Directors’ Audit, Compensation and Nominating and Governance Committees, as well as the Board of Directors’ Governance Guidelines and our Code of Ethics are posted on our investor website. We may from time-to-time provide important disclosures to our investors, including amendments or waivers to our Code of Ethics, by posting them on our investor website, as permitted by SEC rules. Printed copies of these documents may also be obtained by writing or telephoning us at: Guess?, nc., 1444 South Alameda Street, Los Angeles, California 90021, Attention: Investor Relations, (213) 765-5578.
We have included our Internet website addresses throughout this filing as textual references only. The information contained within these websites is not incorporated into this Annual Report on Form 10-K.
ITEM 1A. Risk Factors. You should carefully consider the following factors and other information in this Annual Report on
Form 10-K. Additional risks which we do not presently consider material, or of which we are not currently aware, may also have an adverse impact on us. Please also see “Important Factors Regarding Forward-Looking Statements” on page (ii).Demand for our merchandise may decrease and the appeal of our brand image may diminish if we fail to identify and rapidly respond to consumers’ fashion tastes.
The apparel industry is subject to rapidly evolving fashion trends and shifting consumer demands. Accordingly, our brand image and our profitability are heavily dependent upon both the priority our target customers place on fashion and our ability to anticipate, identify and capitalize upon emerging fashion trends. Current fashion tastes place significant emphasis on a fashionable look. In the past, this emphasis has increased and decreased through fashion cycles. If we fail to anticipate, identify or react appropriately, or in a timely manner, to fashion trends, we could experience reduced consumer acceptance of our products and a diminished brand image. These factors could result in higher wholesale markdowns, lower average unit retail prices, lower product margins and decreased sales volumes for our products and could have a material adverse effect on our results of operations and financial condition.The apparel industry is highly competitive, and we may face difficulties competing successfully in the future.
We operate in a highly competitive and fragmented industry with low barriers to entry. We compete with many apparel manufacturers and distributors, both domestically and internationally, as well as many well-known designers. Our retail and factory outlet stores compete with many other retailers, including department stores, some of whom are our major wholesale customers. Our licensed apparel and accessories compete with many well-known brands. Within each of our geographic markets, we also face significant competition from global and regional branded apparel companies, as well as retailers that market apparel under their own labels. These and other competitors pose significant challenges to our market share in our existing major domestic and foreign markets and to our ability to successfully develop new markets. Some of our competitors have competitive advantages over us, including greater financial and marketing resources, higher wage rates, lower prices, more desirable store locations, greater online presence and faster speed to market. In addition, our larger competitors may be better equipped than us to adapt to changing conditions that affect the competitive market and newer competitors may be viewed as more desirable by fashion conscious consumers. Also, in most countries, the industry’s low barriers to entry allow the introduction of new products or new competitors at a fast pace. In other countries, high import duties may favor locally produced products. Any of these competition-related factors could result in reductions in sales or prices of our products and could have a material adverse effect on our results of operations and financial condition.

13
Poor or uncertain economic conditions, and the resulting negative impact on consumer confidence and spending, have had and could continue to have an adverse effect on the apparel industry and on our operating results.
The apparel industry is cyclical in nature and is particularly affected by adverse trends in the general economy. Purchases of apparel and related merchandise are generally discretionary and therefore tend to decline during recessionary periods and also may decline at other times. The global economic environment began to deteriorate significantly in 2008, with declining values in real estate, increased unemployment and volatility in the global financial markets resulting in reduced credit lending by banks, solvency concerns of major financial institutions and sovereign debt issues. Economic and market conditions have continued to be volatile and uncertain in many markets around the world and consumer behavior remains cautious. In North America, the relatively weaker levels of consumer confidence and the highly promotional conditions among retailers may persist for some time. In Europe, sovereign debt issues, government austerity programs and bank credit issues have impacted the capital markets of numerous European countries, resulting in reduced consumer confidence and discretionary spending in those countries. These circumstances have had, and could in the future have, a negative impact on our business.We also see evidence of a more cautious consumer in China, where the economy has shown clear signs of slowing, as well as a more volatile environment in South Korea. If the global economy or significant regional economies continue to be weak or deteriorate further, there will likely be a negative impact on our revenues, operating margins and earnings.
In addition to the factors contributing to the current economic environment, there are a number of other factors that could contribute to reduced levels of consumer spending, such as increases in interest rates, inflation, unemployment, taxation rates, energy prices and austerity measures. Similarly, natural disasters, labor unrest, actual or potential terrorist acts and other conflicts can also create significant instability and uncertainty in the world, causing consumers to defer purchases or preventing our suppliers and service providers from providing required services or materials to us. These or other factors could materially and adversely affect our operating results.Difficulties in the credit markets could have a negative impact on our customers, suppliers and business partners, which, in turn could materially and adversely affect our results of operations and liquidity.
The credit crisis that began in 2008 has had a significant negative impact on businesses around the world. We believe that our cash provided by operations and existing cash and investment balances, supplemented by borrowings under our credit facilities, will provide us with sufficient liquidity for the foreseeable future. However, the impact of difficult credit conditions on our customers, business partners, suppliers, insurance providers and financial institutions with which we do business cannot be predicted and may be quite severe. The inability of our manufacturers to ship our products could impair our ability to meet delivery date requirements. A disruption in the ability of our significant customers, distributors or licensees to access liquidity could cause serious disruptions or an overall deterioration of their businesses. A disruption in the ability of a large group of our smaller customers to access liquidity could have similar adverse effects, particularly in our important multi-brand wholesale channel in Southern Europe, where many customers tend to be relatively small and not well capitalized. These conditions could lead to significant reductions in future orders of our products and the inability or failure on our customers’ part to meet their payment obligations to us, any of which could have a material adverse effect on our results of operations and liquidity.
Similarly, a failure on the part of our insurance providers to meet their obligations for claims made by us could have a material adverse effect on our results of operations and liquidity. Continued market difficulties or additional deterioration could jeopardize our ability to rely on those financial institutions that are parties to our various bank facilities and foreign exchange contracts. We could be exposed to a loss if the counterparty fails to meet its obligations upon our exercise of foreign exchange contracts. In addition, instability or other distress in the financial markets could impair the ability of one or more of the banks participating in our credit agreements from honoring its commitments. This could have an adverse effect on our business if we were not able to replace those commitments or to locate other sources of liquidity on acceptable terms.
14
Sovereign debt issues and devaluation of foreign currencies could have a material adverse effect on our business, prospects, operating results, financial condition and cash flows.
A number of European countries experienced sovereign debt issues over the last several years that negatively impacted the capital markets in Europe and caused the value of the euro to deteriorate. These conditions resulted in reduced consumer confidence and spending in many countries in Europe, particularly Southern Europe. A significant portion of our revenues and earnings are derived from our business in Europe, including Southern Europe, where Italy is our largest market and countries like France and Spain are also important to our business. In addition, most of our European transactions and assets, including cash reserves and receivables, are denominated in euros. While conditions have generally improved or stabilized in most countries, these issues may continue to negatively impact our European business, as well as the businesses of our European customers, suppliers and partners.
If conditions in Europe, or economic regions in which we do business, worsen or fail to further improve, these negative impacts could also worsen. In addition, if the conditions ultimately lead to a significant devaluation of the euro or other foreign currencies, the value of our financial assets that are denominated in these currencies would be significantly reduced when translated to U.S. dollars for financial reporting purposes. Similarly, a sovereign default could also impact any tax or other refunds owed to us by that country or how aggressively that country pursues additional tax revenues. Any of these conditions could ultimately harm our overall business, prospects, operating results, financial condition and cash flows.Domestic and foreign currency fluctuations could adversely impact our financial condition, results of operations and earnings.
Since the majority of our international purchases are conducted in currencies other than the U.S. dollar (primarily the euro, Canadian dollar and Korean won), currency fluctuations can have a significant impact on the translation of our international revenues and earnings into U.S. dollar amounts. These amounts could be materially affected by the strengthening of the U.S. dollar, negatively impacting our results of operations, earnings and our ability to generate revenue growth. Furthermore, we also source products in U.S. dollars outside of the U.S. As a result, the cost of these products may be affected by changes in the value of the applicable local currencies. Changes in currency exchange rates may also affect the U.S. dollar value of the foreign currency denominated prices at which our international businesses sell products.
Although we hedge certain exposures to changes in foreign currency exchange rates, we cannot assure that foreign currency fluctuations will not have a material adverse effect on our financial condition or results of operations. Furthermore, since some of our hedging activities are designed to reduce volatility of fluctuating exchange rates, they not only reduce the negative impact of a stronger U.S. dollar, but they also reduce the positive impact of a weaker U.S. dollar. Our future financial results could be significantly affected by the value of the U.S. dollar in relation to the foreign currencies in which we conduct business. In addition, while the hedges are designed to reduce volatility over the forward contract period, these contracts can create volatility during the period. The degree to which our financial results are affected for any given time period will depend in part upon our hedging activities.Fluctuations in the price or availability of quality raw materials and commodities could increase costs and negatively impact profitability.
The raw materials used to manufacture our merchandise are subject to availability constraints and price volatility caused by high demand for fabrics, currency fluctuations, crop yields, weather patterns, supply conditions, government regulations, labor conditions, energy costs, transportation or freight costs, economic climate, market speculation and other unpredictable factors. The presence of any of these conditions in the future could increase costs and negatively impact profitability.

15
Changes in tax laws, significant shifts in the relative source of our earnings, or other unanticipated tax liabilities could adversely affect our effective income tax rate and profitability and may result in volatility in our financial results.
We are subject to income taxes in the U.S. and numerous foreign jurisdictions. We record tax expense based on our estimate of future payments, which include reserves for uncertain tax positions in multiple tax jurisdictions. Our effective income tax rate in the future could be adversely affected by a number of other factors, including: changes in tax laws, the outcome of income tax audits in various jurisdictions around the world, the resolution of uncertain tax positions, and any repatriation of non-U.S. earnings for which we have not previously provided for U.S. taxes. We and our subsidiaries are engaged in a number of intercompany transactions across multiple tax jurisdictions. Although we believe that these transactions reflect arm’s length terms and that the proper transfer pricing documentation is in place, these transfer pricing terms and conditions may be scrutinized by local tax authorities during an audit and any resulting changes may impact our mix of earnings in countries with differing statutory tax rates. In addition, the relative level of earnings in the various taxing jurisdictions to which our earnings are subject can also create volatility in our effective income tax rate. Any one of these factors could adversely impact our income tax rate and our profitability and could create ongoing variability in our quarterly or annual tax rates.Changes in subjective assumptions, estimates and judgments by management related to complex tax matters, including those resulting from regulatory reviews, could adversely affect our financial results.
We are subject to routine tax audits on various tax matters around the world in the ordinary course of business (including income tax, customs and Value Added Tax (“VAT”) matters). We regularly assess the adequacy of our uncertain tax positions and other reserves, which requires a significant amount of judgment. Although we accrue for uncertain tax positions and other reserves, the results of regulatory audits and negotiations with taxing authorities may be in excess of our accruals, resulting in the payment of additional taxes, duties, penalties and interest. See Note 11 to the Consolidated Financial Statements for further discussion of our tax matters, including reserves for uncertain tax positions.
From time-to-time, we make VAT and other tax related refund claims with various foreign tax authorities that are audited by those authorities for compliance. Failure by these foreign governments to approve or ultimately pay these claims could have a material adverse effect on our results of operations and liquidity.We are subject to periodic litigation and other regulatory proceedings, which could result in unexpected obligations, as well as the diversion of time and resources.
We are involved from time-to-time in various U.S. and foreign lawsuits and regulatory proceedings relating to our business, including purported class action lawsuits and intellectual property claims. Due to the inherent uncertainties of litigation and regulatory proceedings, we cannot accurately predict the ultimate outcome of any such proceedings. Should management's evaluation of any such claims or proceedings prove incorrect, our exposure could materially exceed expectations, adversely impacting our business, financial condition and results of operations. In addition, any significant litigation or regulatory matters, regardless of the merits, could divert management’s attention from our operations and result in substantial legal fees. See also “Item 3. Legal Proceedings” for further discussion of our legal matters.We could find that we are carrying excess inventories if we fail to shorten lead-times, anticipate consumer demand, if our international vendors do not supply quality products on a timely basis, if our merchandising strategies fail or if we do not open new and remodel existing stores on schedule.
Although we have begun to shorten lead-times for the design, production and development of a portion of our product lines, we expect to continue to place orders with our vendors for most of our products a season or more in advance. If we are not successful in our efforts to shorten lead-times or if we fail to correctly anticipate fashion trends or consumer demand, we could end up carrying excess inventories. Even if we effectively shorten lead-times and correctly anticipate consumer fashion trends and demand, our vendors could fail to supply the quality products and materials we require at the time we need them. Moreover, we could fail to effectively market or merchandise these products once we receive them. In addition, we could fail to open new or remodeled stores

16
on schedule, and inventory purchases made in anticipation of such store openings could remain unsold. Any of the above factors could cause us to experience excess inventories, which may result in inventory write-downs and more markdowns, which in turn could have a material adverse effect on our results of operations and financial condition.Our success depends on the strength of our relationships with our suppliers and manufacturers.
We do not own or operate any production facilities, and we depend on independent factories to supply our fabrics and to manufacture our products to our specifications. We do not have long-term contracts with any suppliers or manufacturers, and our business is dependent on our partnerships with our vendors. If manufacturing costs were to rise significantly, our product margins and results of operations could be negatively affected. In addition, very few of our vendors manufacture our products exclusively. As a result, we compete with other companies for the production capacity of independent contractors. If our vendors fail to ship our fabrics or products on time or to meet our quality standards or are unable to fill our orders, we might not be able to deliver products to our retail stores and wholesale customers on time or at all.
Moreover, our suppliers have at times been unable to deliver finished products in a timely fashion. This has led, from time-to-time, to an increase in our inventory, creating potential markdowns and a resulting decrease in our profitability. As there are a finite number of skilled manufacturers that meet our requirements, it could take significant time to identify and qualify suitable alternatives, which could result in our missing retailing seasons or our wholesale customers canceling orders, refusing to accept deliveries or requiring that we lower selling prices. Since we prefer not to return merchandise to our manufacturers, we could also have a considerable amount of unsold merchandise. Any of these problems could harm our financial condition and results of operations.Our North American Wholesale business is highly concentrated. If any of our large customers decrease their purchases of our products or experience financial difficulties, our results of operations and financial condition could be adversely affected.
In fiscal 2014, 2.3% of our consolidated net revenue came from Macy’s, Inc. No other single customer or group of related customers in any of our segments accounted for more than 1.0% of our consolidated net revenue in fiscal 2014. Continued consolidation in the retail industry could further decrease the number of, or concentrate the ownership of, stores that carry our and our licensees’ products. Also, as we expand the number of our retail stores, we run the risk that our wholesale customers will perceive that we are increasingly competing directly with them, which may lead them to reduce or terminate purchases of our products. In addition, in recent years there has been a significant increase in the number of designer brands seeking placement in department stores, which makes any one brand potentially less attractive to department stores. If any one of our major wholesale customers decides to decrease purchases from us, to stop carrying GUESS? products or to carry our products only on terms less favorable to us, our sales and profitability could significantly decrease. Similarly, some retailers have recently experienced significant financial difficulties, which in some cases have resulted in bankruptcy, liquidation and store closures. Financial difficulties of one of our major customers could result in reduced business and higher credit risk with respect to that customer. Any of these circumstances could ultimately have a material adverse effect on our results of operations and financial condition.Our failure to protect our reputation could have a material adverse effect on our brand.
Our ability to maintain our reputation is critical to our brand. Our reputation could be jeopardized if we or our third party providers fail to maintain high standards for merchandise quality and integrity. Any negative publicity about these types of concerns may reduce demand for our merchandise. Failure by us or our third party providers to comply with ethical, social, product, labor, health and safety or environmental standards could also jeopardize our reputation and potentially lead to various adverse consumer actions, including boycotts. Public perception about our products or our stores, whether justified or not, could impair our reputation, involve us in litigation, damage our brand and have a material adverse effect on our business. Failure to comply with local laws and regulations, to maintain an effective system of internal controls or to provide accurate and timely financial statement information could also hurt our reputation. Damage to our reputation or loss of consumer confidence

17
for any of these or other reasons could have a material adverse effect on our results of operations and financial condition, as well as require additional resources to rebuild our reputation.Since we do not control our licensees’ actions and we depend on our licensees for a substantial portion of our earnings from operations, their conduct could harm our business.
We license to others the rights to produce and market certain products that are sold with our trademarks. While we retain significant control over our licensees’ products and advertising, we rely on our licensees for, among other things, operational and financial control over their businesses. If the quality, focus, image or distribution of our licensed products diminish, consumer acceptance of and demand for the GUESS? brands and products could decline. This could materially and adversely affect our business and results of operations. In fiscal 2014, approximately 80% of our net royalties were derived from our top five licensed product lines. A decrease in customer demand for any of these product lines could have a material adverse effect on our results of operations and financial condition. Although we believe that in most circumstances we could replace existing licensees if necessary, our inability to do so for any period of time could adversely affect our revenues and results of operations.We depend on our intellectual property, and our methods of protecting it may not be adequate.
Our success and competitive position depend significantly upon our trademarks and other proprietary rights. We take steps to establish and protect our trademarks worldwide. Despite any precautions we may take to protect our intellectual property, policing unauthorized use of our intellectual property is difficult, expensive and time consuming, and we may be unable to adequately protect our intellectual property or to determine the extent of any unauthorized use, particularly in those foreign countries where the laws do not protect proprietary rights as fully as in the United States. We also place significant value on our trade dress and the overall appearance and image of our products. However, we cannot assure you that we can prevent imitation of our products by others or prevent others from seeking to block sales of GUESS? products for purported violations of their trademarks and proprietary rights. We also cannot assure you that others will not assert rights in, or ownership of, trademarks and other proprietary rights of GUESS?, that our proprietary rights would be upheld if challenged or that we would, in that event, not be prevented from using our trademarks, any of which could have a material adverse effect on our financial condition and results of operations. Further, we could incur substantial costs in legal actions relating to our use of intellectual property or the use of our intellectual property by others. Even if we are successful in such actions, the costs we incur could have a material adverse effect on us.If we fail to successfully execute growth initiatives, including acquisitions and alliances, our business and results of operations could be harmed.
As part of our business growth strategy, we continue to expand our global retail store base. In addition to the store growth, we also regularly evaluate strategic acquisitions and alliances and pursue those that we believe will support and contribute to our overall growth initiatives. We completed the acquisition of our former European jeanswear licensee in 2005, the acquisition of our former European licensee of children’s apparel in 2008 and the acquisition of our European licensee of MARCIANO apparel in 2012. In addition, we have entered into joint venture relationships with partners in Brazil, the Canary Islands, France, Mexico and Portugal and have been directly operating our South Korea and China businesses since 2007, our international jewelry business since 2010 and our Japan business starting in 2013.
These expansion efforts place increased demands on our managerial, operational and administrative resources that could prevent or delay the successful opening of new stores and the identification of suitable licensee partners, adversely impact the performance of our existing stores and adversely impact our overall results of operations. In addition, acquired businesses and additional store openings may not provide us with increased business opportunities, or result in the growth that we anticipate, particularly during economic downturns. Furthermore, integrating acquired operations is a complex, time-consuming and expensive process. Failing to acquire and successfully integrate complementary businesses, or failing to achieve the business synergies or other anticipated benefits of acquisitions, could materially adversely affect our business and results of operations.

18
We may be unsuccessful in implementing our plans to open and operate new stores, which could harm our business and negatively affect our results of operations.
To open and operate new stores successfully, we must:• identify desirable locations, the availability of which is out of our control;• negotiate acceptable lease terms, including desired tenant improvement allowances;• efficiently build and equip the new stores;• source sufficient levels of inventory to meet the needs of the new stores;• hire, train and retain competent store personnel;• successfully integrate the new stores into our existing operations; and• satisfy the fashion preferences of customers in the new geographic areas.
Any of these challenges could delay our store openings, prevent us from completing our store opening plans or hinder the operations of stores we do open. Once open, we cannot be sure that our new stores will be profitable. Such things as unfavorable economic and business conditions and changing consumer preferences could also interfere with our store opening plans.Failure to successfully develop and manage our newer store concepts could adversely affect our results of operations.
In addition to our core GUESS? retail and factory stores, we continue to develop and refine the MARCIANO, GUESS? Accessories and G by GUESS store concepts. The introduction and growth of several new store concepts as part of our overall growth strategy could strain our financial and management resources. Additionally, successfully developing new brands is subject to a number of risks, including customer acceptance, product differentiation, competition and obtaining desirable locations. These risks may be compounded during the current difficult economic climate or any future economic downturn. There can be no assurance that these concepts will achieve or maintain sales and profitability levels that justify the required investments. If we are unable to successfully develop and manage these multiple store concepts, or if consumers are not receptive to the products or store concepts, our results of operations and financial results could be adversely affected. In addition, the failure of one or more of these concepts to achieve acceptable results could lead to store closures and/or impairment and other charges, which could adversely affect our results of operations and ability to grow. Cost savings initiatives may not produce the savings expected and may negatively impact our other initiatives and efforts to grow our business.
During fiscal 2014, we implemented certain measures aimed at improving our profitability and maintaining flexibility in our capital resources, including the introduction of a cost reduction initiative. These measures included workforce reductions and other cost and spend reductions, including year-over-year reductions in planned capital expenditures. We have forecasted cost savings from these initiatives based on a number of assumptions and expectations which, if achieved, would improve our profitability and cash flows from operating activities. However, there can be no assurance the expected results will be achieved. In addition, these and any future spend reductions, if any, may negatively impact our other initiatives or our efforts to grow our business, which may negatively impact our future results of operations and increase the burden on existing management, systems and resources. Our business is global in scope and can be impacted by factors beyond our control.
During fiscal 2014, we sourced most of our finished products with partners and suppliers outside the U.S. and we continued to design and purchase fabrics globally. In addition, we have been increasing our international sales of product outside of the United States. In fiscal 2014, approximately half of our consolidated net revenue was generated by sales from outside of the U.S. and Canada. We anticipate that these international revenues will continue to grow as a percentage of our total business over time. Further, as a global company, our effective tax rate is highly dependent upon the geographic composition of worldwide earnings and tax regulations governing each region.

19
As a result of our increasing international operations, we face the possibility of greater losses from a number of risks inherent in doing business in international markets and from a number of factors which are beyond our control. Such factors that could harm our results of operations and financial condition include, among other things:
• political instability or acts of terrorism, which disrupt trade with the countries where we operate orin which our contractors, suppliers or customers are located;
• recessions in foreign economies;• inflationary pressures and volatility in foreign economies;• reduced global demand resulting in the closing of manufacturing facilities;• challenges in managing broadly dispersed foreign operations;• local business practices that do not conform to legal or ethical guidelines;• adoption of additional or revised quotas, restrictions or regulations relating to imports or exports;• additional or increased customs duties, tariffs, taxes and other charges on imports or exports;• delays in receipts due to our distribution centers as a result of increasing security requirements at U.S.
or other ports;• significant fluctuations in the value of the dollar against foreign currencies;• increased difficulty in protecting our intellectual property rights in foreign jurisdictions;• social, labor, legal or economic instability in the foreign markets in which we do business, which
could influence our ability to sell our products in, or distribute our products from, these internationalmarkets;
• restrictions on the transfer of funds between the United States and foreign jurisdictions;• our ability and the ability of our international licensees and distributors to locate and continue to open
desirable new retail locations; and• natural disasters in areas in which our contractors, suppliers, or customers are located.
Further, our international presence means that we are subject to certain U.S. laws, including the Foreign Corrupt Practices Act, as well as the laws of the foreign countries in which we operate. If any of our international operations, or our employees or agents, violates such laws, we could become subject to sanctions or other penalties that could negatively affect our reputation, business and operating results.
In addition to the above factors, the United States and the countries in which our products are produced or sold may also, from time-to-time, impose new quotas, duties, tariffs or other restrictions, or adversely adjust prevailing quota, duty or tariff levels. If we are unable to obtain our raw materials and finished apparel from the countries where we wish to purchase them, either because of capacity constraints or visa availability under the required quota category or for any other reason, or if the cost of doing so should increase, it could have a material adverse effect on our results of operations and financial condition.Changes in the regulatory or compliance landscape could adversely affect our business and results of operations.
Laws and regulations at the state, federal and international levels frequently change, and the ultimate cost of compliance cannot be precisely estimated. In addition, we cannot predict the impact that may result from changes in the regulatory landscape. Any changes in regulations, the imposition of additional regulations, or the enactment of any new or more stringent legislation including those related to health care, taxes, transportation and logistics, privacy, environmental issues, trade, conflict minerals, product safety or employment and labor, could adversely affect our business and results of operations. Violation of labor, environmental and other laws and practices by our licensees or suppliers could harm our business.
We require our licensing partners and suppliers to operate in compliance with applicable laws and regulations. While our internal and vendor operating guidelines, code of conduct and monitoring programs promote ethical business practices and compliance with laws, we do not control our licensees or suppliers or their labor, environmental, safety or other business practices. The violation of labor, environmental, safety or other laws by any of our licensees or suppliers, or divergence of a licensee’s or supplier’s business practices or social responsibility standards from ours or from those generally accepted as ethical in the United States, could interrupt

20
or otherwise disrupt the shipment of our products, harm the value of our trademarks, damage our reputation or expose us to potential liability for their wrongdoings.Our business could suffer if our computer systems and websites are disrupted or cease to operate effectively.
The efficient operation of our business is very dependent on our computer and information systems. In particular, we rely heavily on our merchandise management and ERP systems used to track sales and inventory and manage our supply chain. In addition, we have e-commerce and other Internet websites in the U.S. and an increasing number of other countries. Given the complexity of our business and the significant number of transactions that we engage in on an annual basis, it is imperative that we maintain constant operation of our computer hardware and software systems. Despite our preventative efforts, our systems are vulnerable from time-to-time to damage or interruption from, among other things, ineffective upgrades or support from third party vendors, difficulties in replacing or integrating new systems, security breaches, computer viruses, natural disasters and power outages. Any such problems or interruptions could result in incorrect information being supplied to management, inefficient ordering and replenishment of products, loss of orders, significant expenditures, disruption of our operations and other adverse impacts to our business.A privacy breach could damage our reputation and customer relationships, expose us to litigation risk and adversely affect our business.
As part of our normal operations, we collect, process, transmit and where appropriate, retain certain sensitive and confidential employee and customer information, including credit card information. There is significant concern by consumers and employees over the security of personal information, consumer identity theft and user privacy. Despite the security measures we have in place, our facilities and systems, and those of our third party service providers, may be vulnerable to security breaches, cyber-attacks, acts of vandalism, computer viruses, misplaced or lost data, programming and/or human errors, or other similar events. Any security breach involving the misappropriation, loss or other unauthorized disclosure of confidential information, whether by us or our vendors, could severely damage our reputation and our customer relationships, harm sales, expose us to risks of litigation and liability and result in a material adverse effect on our business, financial condition and results of operations. In addition, as a result of recent security breaches at a number of prominent retailers, the media and public scrutiny of information security and privacy has become more intense and the regulatory environment has become more uncertain. As a result, we may incur significant costs to comply with laws regarding the protection and unauthorized disclosure of personal information.A significant disruption at any of our distribution facilities could have a material adverse impact on our sales and operating results.
Our U.S. business relies primarily on a single distribution center located in Louisville, Kentucky to receive, store and distribute merchandise to all of our U.S. stores and wholesale customers. Distribution of our products in Canada is handled primarily from a single distribution center in Montreal, Quebec. Distribution of our products in Europe is handled primarily through a single third party distribution center in Piacenza, Italy. Additionally, we utilize several third party operated distribution warehouses in Hong Kong, South Korea and China that service the Asia region. Any significant interruption in the operation of any of our distribution centers due to natural disasters, weather conditions, accidents, system failures, labor issues, relationships with our third party warehouse operators or landlords or other unforeseen causes could have a material adverse effect on our ability to replace inventory and fill orders, negatively impacting our sales and operating results.Our reliance on third parties to deliver merchandise to our stores and wholesale customers could lead to disruptions to our business.
The efficient operation of our global retail and wholesale businesses depends on the timely receipt of merchandise from our regional distribution centers. We deliver merchandise to our stores and wholesale customers using independent third parties. The independent third parties have employees which may be represented by labor unions. Disruptions in the delivery of merchandise or work stoppages by employees or contractors of any of these third parties could delay the timely receipt of merchandise. There can be no assurance that such stoppages or

21
disruptions will not occur in the future. Any failure by a third party to respond adequately to our distribution needs could disrupt our operations and negatively impact our financial condition or results of operations.
Abnormally harsh or inclement weather conditions could have a material adverse impact on our sales, inventory levels and operating results.
Extreme weather conditions in areas in which our retail stores and wholesale doors are located, particularly in markets where we have a concentration of locations, could adversely affect our business. For example, heavy snowfall, rainfall or other extreme weather conditions over a prolonged period might make it difficult for our customers to travel to our stores and thereby reduce our sales and profitability. Our business is also susceptible to unseasonable weather conditions. For example, extended periods of unseasonably warm temperatures during the winter season or cool weather during the summer season could render a portion of our inventory incompatible with those unseasonable conditions. Reduced sales from extreme or prolonged unseasonable weather conditions could have a material adverse effect on our results of operations, financial condition and cash flows.
Our results of operations could be affected by natural events in the locations in which we or our customers or suppliers operate.
Our corporate headquarters, as well as other key operational locations, including retail, distribution and warehousing facilities, are located in areas that are subject to natural disasters such as severe weather and geological events that could disrupt our operations. Many of our suppliers and customers also have operations in these locations. The occurrence of such natural events may result in sudden disruptions in business conditions of the local economies affected, as well as of the regional and global economies. Such disruptions could result in decreased demand for our products and disruptions in our management functions, sales channels and manufacturing and distribution networks, which could have a material adverse effect on our business, financial condition and results of operations. Our Chairman of the Board and our Chief Executive Officer own a significant percentage of our common stock. Their interests may differ from the interests of our other stockholders.
Maurice Marciano, our non-executive Chairman of the Board, and Paul Marciano, Chief Executive Officer, collectively beneficially own approximately 28% of our outstanding shares of common stock. The sale or prospect of the sale of a substantial number of these shares could have an adverse impact on the market price of our common stock. Moreover, these individuals may have different interests than our other stockholders and, accordingly, they may direct the operations of our business in a manner contrary to the interests of our other stockholders. As long as these individuals own a significant percentage of our common stock, they may effectively be able to:
• elect our directors;• amend or prevent amendment of our Restated Certificate of Incorporation or Bylaws;• effect or prevent a merger, sale of assets or other corporate transaction; and• control the outcome of any other matter submitted to our stockholders for vote.
Their stock ownership, together with the anti-takeover effects of certain provisions of applicable Delaware law and our Restated Certificate of Incorporation and Bylaws, may discourage acquisition bids or allow the Marcianos to delay or prevent a change in control that may be favored by our other stockholders, which in turn could reduce our stock price or prevent our stockholders from realizing a premium over our common stock price.Our failure to retain our existing senior management team or to retain or attract other key personnel could adversely affect our business.
Our business requires disciplined execution at all levels of our organization in order to ensure the timely delivery of desirable merchandise in appropriate quantities to our stores and other customers. This execution requires experienced and talented management in various areas of our business including: advertising, design, finance, merchandising, operations, and production. Our success depends upon the personal efforts and abilities of our senior management, particularly Paul Marciano, and other key personnel. Although we believe we have a strong management team with relevant industry expertise, the extended loss of the services of Paul Marciano or
22
other key personnel could materially harm our business. We are the beneficiary of a $10 million “key man” insurance policy on the life of Paul Marciano, but we do not have any other “key man” insurance with respect to other key employees, and any of them may leave us at any time, which could severely disrupt our business and future operating results.Fluctuations in quarterly performance including comparable store sales, sales per square foot, timing of wholesale orders, royalty net revenue or other factors could have a material adverse effect on our earnings and our stock price.
Our quarterly results of operations for each of our business segments have fluctuated in the past and can be expected to fluctuate in the future. Further, if our retail store expansion plans, both domestically and internationally, fail to meet our expected results, our overhead and other related expansion costs would increase without an offsetting increase in sales and net revenue. This could have a material adverse effect on our results of operations and financial condition.
Our net revenue and operating results have historically been lower in the first half of our fiscal year due to general seasonal trends in the apparel and retail industries. Our comparable store sales, quarterly results of operations and other income are also affected by a variety of other factors, including:
• shifts in consumer tastes and fashion trends;• the timing of new store openings and the relative proportion of new stores to mature stores;• calendar shifts of holiday or seasonal periods;• the timing of seasonal wholesale shipments;• the effectiveness of our inventory management;• changes in our merchandise mix;• changes in our mix of revenues by segment;• the timing of promotional events;• actions by competitors;• weather conditions;• changes in the business environment;• inflationary changes in prices and costs;• changes in currency exchange rates;• population trends;• changes in patterns of commerce such as the expansion of electronic commerce;• the level of pre-operating expenses associated with new stores; and• volatility in securities’ markets which could impact the value of our investments in non-operating
assets.An unfavorable change in any of the above factors could have a material adverse effect on our results of
operations and our stock price.
ITEM 1B. Unresolved Staff Comments.None.

23
ITEM 2. Properties.Certain information concerning our principal facilities, all of which were leased at February 1, 2014, is
set forth below:
Location Use
ApproximateArea in
Square Feet
Los Angeles, California Principal executive and administrative offices, designfacilities, sales offices, distribution and warehousefacilities, and sourcing used by our North AmericanWholesale, North American Retail and Licensingsegments, and our Corporate groups
355,000
Louisville, Kentucky Distribution and warehousing facility used by our NorthAmerican Wholesale and North American Retail segments
506,000
New York, New York Administrative offices, public relations, and showroomsused by our North American Wholesale segment
13,400
Montreal/Toronto/Vancouver,Canada
Administrative offices, showrooms and warehousefacilities used by our North American Wholesale and NorthAmerican Retail segments
111,700
Paris, France Administrative office and showrooms used by our Europesegment
11,100
Dusseldorf/Hamburg/Munich,Germany
Showrooms used by our Europe segment 19,700
Crevalcore/Florence/Milan,Italy
Administrative offices, showrooms and warehousefacilities used by our Europe segment
188,000
Warsaw, Poland Showrooms used by our Europe segment 10,200Lisbon, Portugal Showroom and warehouse used by our Europe segment 6,000Lugano, Switzerland Administrative, sales and marketing offices, and
showrooms used by our Europe segment103,600
Barcelona, Spain Administrative, sales and marketing offices, showroomsand warehouse facilities used by our Europe segment
10,500
London, U.K. Showrooms used by our Europe segment 7,800Shanghai/Beijing, China Administrative offices, showrooms and warehouse facility
used by our Asia segment33,200
Kowloon, Hong Kong Administrative offices, showrooms and licensingcoordination facilities used primarily by our Asia segmentand sourcing offices used by all trading segments
18,500
Seoul, South Korea Administrative offices and showrooms used by our Asiasegment
45,100
Tokyo, Japan Administrative offices used by our Asia segment 1,500
Our corporate, wholesale and retail headquarters and certain warehouse facilities are located in Los Angeles, California, consisting of four buildings totaling approximately 355,000 square feet. These facilities are leased by us from limited partnerships in which the sole partners are trusts controlled by and for the benefit of Maurice Marciano and Paul Marciano (the “Principal Stockholders”), Armand Marciano, their brother and former executive of the Company, and their families pursuant to a lease that expires in July 2020. The total lease payments to these limited partnerships are approximately $0.3 million per month with aggregate minimum lease commitments to these partnerships at February 1, 2014 totaling approximately $19.9 million.
In addition, the Company, through a wholly-owned Canadian subsidiary, leases warehouse and administrative facilities in Montreal, Quebec from a partnership affiliated with the Principal Stockholders. The lease expires in December 2015. The monthly lease payment is $48,000 Canadian (US$43,100) with aggregate minimum lease

24
commitments through the term of the lease totaling approximately $1.1 million Canadian (US$1.0 million) at February 1, 2014.
The Company, through a French subsidiary, leases a showroom and office space located in Paris, France from an entity that is owned in part by an affiliate of the Principal Stockholders. The aggregate minimum lease commitments through the term of the lease totaled approximately $6.4 million at February 1, 2014.
See Note 13 to the Consolidated Financial Statements for further information regarding related party transactions.
Our primary U.S. distribution center is a fully automated leased facility based in Louisville, Kentucky. Distribution of our products in Canada is handled primarily from a leased facility based in Montreal, Quebec. Distribution of our products in Europe is handled primarily through a single third party distribution center in Piacenza, Italy. Additionally, we utilize several third party operated distribution warehouses in Hong Kong, South Korea and China that service the Asia region.
We lease our showrooms, advertising, licensing, sales and merchandising offices, remote distribution and warehousing facilities and retail and factory outlet store locations under non-cancelable operating lease agreements expiring on various dates through September 2031. These facilities, located mainly in North America but with a growing presence in Europe and Asia, had aggregate minimum lease commitments at February 1, 2014 totaling approximately $995.1 million, excluding related party commitments. In addition, in 2005 we started leasing a building in Florence, Italy for our Italian operations under a capital lease agreement. The capital lease obligation, including build-outs, amounted to $8.6 million as of February 1, 2014.
The terms of our store and concession leases, excluding renewal options and kick-out clauses, as of February 1, 2014, expire as follows:
Number of Stores and Concessions
Years Lease Terms ExpireU.S. andCanada Asia Europe
Mexicoand Brazil
Fiscal 2015-2017......................................................................... 132 274 44 19Fiscal 2018-2020......................................................................... 145 12 89 14Fiscal 2021-2023......................................................................... 150 — 77 3Fiscal 2024-2026......................................................................... 64 — 38 —Thereafter .................................................................................... 3 — 19 —
494 286 267 36
We believe our existing facilities are well maintained, in good operating condition and are adequate to support our present level of operations. See Note 14 to the Consolidated Financial Statements for further information regarding current lease obligations.
ITEM 3. Legal Proceedings.
On May 6, 2009, Gucci America, Inc. filed a complaint in the U.S. District Court for the Southern District of New York against Guess?, Inc. and certain third-party licensees for the Company asserting, among other things, trademark and trade dress law violations and unfair competition. The complaint sought injunctive relief, compensatory damages, including treble damages, and certain other relief. Complaints similar to those in the above action have also been filed by Gucci entities against the Company and certain of its subsidiaries in the Court of Milan, Italy, the Court of Paris, France and the Intermediate People’s Court of Nanjing, China. The three week bench trial in the U.S. matter concluded on April 19, 2012, with the court issuing a preliminary ruling on May 21, 2012 and a final ruling on July 19, 2012. Although the plaintiff was seeking compensation in the U.S. matter in the form of damages of $26 million and an accounting of profits of $99 million, the final ruling provided for monetary damages of $2.3 million against the Company and $2.3 million against certain of its licensees. The court also granted narrow injunctions in favor of the plaintiff for certain of the claimed infringements. On August 20, 2012, the appeal period expired without any party having filed an appeal, rendering the judgment final. On May 2, 2013, the Court of Milan ruled in favor of the Company in the Milan, Italy matter. In the ruling, the Court
25
rejected all of the plaintiff’s claims and ordered the cancellation of three of the plaintiff’s Italian and four of the plaintiff’s European Community trademark registrations. On June 10, 2013, the plaintiff appealed the Court’s ruling in the Milan matter. In the China matter, the Intermediate People’s Court of Nanjing, China issued a ruling on November 8, 2013 granting an injunction in favor of the plaintiff for certain of the claimed infringements on handbags and small leather goods and awarding the plaintiff statutory damages in the amount of approximately $80,000. The Company strongly disagrees with the Court’s decision and has appealed the ruling. The judgment in the China matter is stayed pending the appeal.
On August 25, 2006, Franchez Isaguirre, a former employee of the Company, filed a complaint in the Superior Court of California, County of Los Angeles alleging violations by the Company of California wage and hour laws. The complaint was subsequently amended, adding a second former employee as an additional named party. The plaintiffs purport to represent a class of similarly situated employees in California who allegedly had been injured by not being provided adequate meal and rest breaks. The complaint seeks unspecified compensatory damages, statutory penalties, attorney’s fees and injunctive and declaratory relief. On June 9, 2009, the Court certified the class but immediately stayed the case pending the resolution of a separate California Supreme Court case on the standards of class treatment for meal and rest break claims. Following the Supreme Court ruling, the Superior Court denied the Company’s motions to decertify the class and to narrow the class in January 2013 and June 2013, respectively. The Company filed a writ petition in July 2013 challenging the Court’s decision not to narrow the class definitions. In January 2014, the Court of Appeals denied the writ petition. In February 2014, the Company petitioned the California Supreme Court for review of the Court of Appeals decision and is awaiting a ruling. No trial date has been set.
Although the Company believes that it has a strong position and will continue to vigorously defend each of these remaining matters, it is unable to predict with certainty whether or not these efforts will ultimately be successful or whether the outcomes will have a material impact on the Company’s financial position or results of operations.
The Company is also involved in various other claims and other matters incidental to the Company’s business, the resolution of which is not expected to have a material adverse effect on the Company’s financial position or results of operations. No material amounts were accrued as of February 1, 2014 or February 2, 2013 related to any of the Company’s legal proceedings.
ITEM 4. Mine Safety Disclosures.
Not applicable.
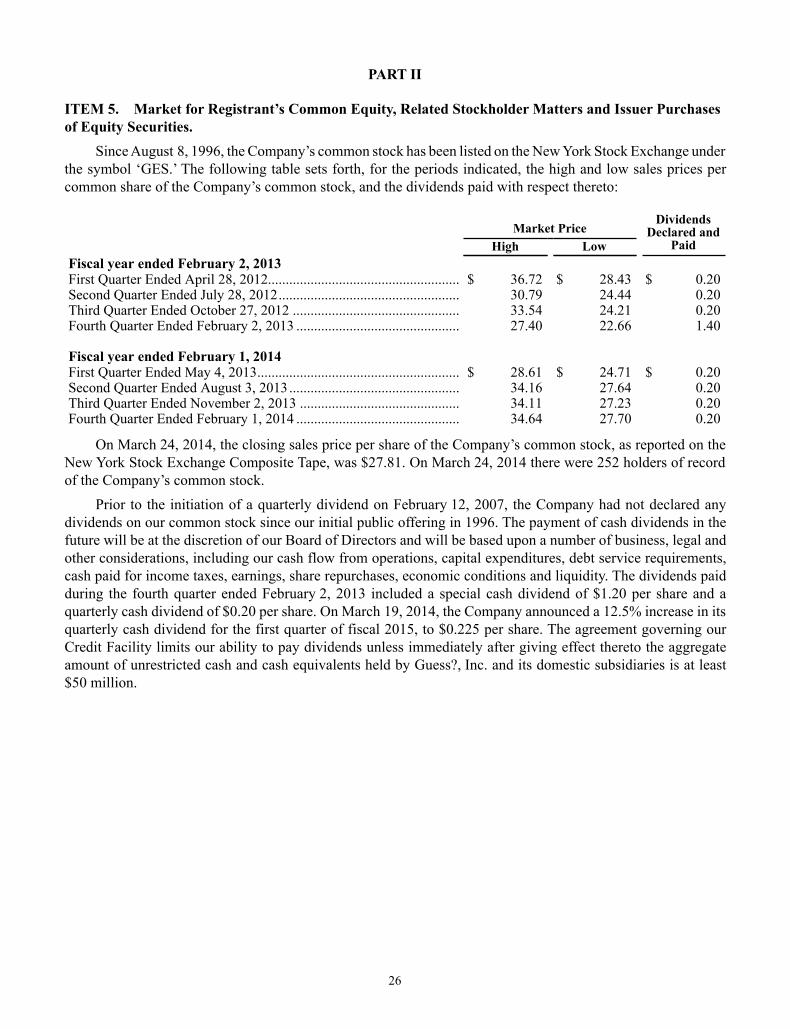
26
PART II
ITEM 5. Market for Registrant’s Common Equity, Related Stockholder Matters and Issuer Purchases of Equity Securities.
Since August 8, 1996, the Company’s common stock has been listed on the New York Stock Exchange under the symbol ‘GES.’ The following table sets forth, for the periods indicated, the high and low sales prices per common share of the Company’s common stock, and the dividends paid with respect thereto:
Market PriceDividends
Declared andPaidHigh Low
Fiscal year ended February 2, 2013First Quarter Ended April 28, 2012...................................................... $ 36.72 $ 28.43 $ 0.20Second Quarter Ended July 28, 2012................................................... 30.79 24.44 0.20Third Quarter Ended October 27, 2012 ............................................... 33.54 24.21 0.20Fourth Quarter Ended February 2, 2013 .............................................. 27.40 22.66 1.40
Fiscal year ended February 1, 2014First Quarter Ended May 4, 2013......................................................... $ 28.61 $ 24.71 $ 0.20Second Quarter Ended August 3, 2013................................................ 34.16 27.64 0.20Third Quarter Ended November 2, 2013 ............................................. 34.11 27.23 0.20Fourth Quarter Ended February 1, 2014 .............................................. 34.64 27.70 0.20
On March 24, 2014, the closing sales price per share of the Company’s common stock, as reported on the New York Stock Exchange Composite Tape, was $27.81. On March 24, 2014 there were 252 holders of record of the Company’s common stock.
Prior to the initiation of a quarterly dividend on February 12, 2007, the Company had not declared any dividends on our common stock since our initial public offering in 1996. The payment of cash dividends in the future will be at the discretion of our Board of Directors and will be based upon a number of business, legal and other considerations, including our cash flow from operations, capital expenditures, debt service requirements, cash paid for income taxes, earnings, share repurchases, economic conditions and liquidity. The dividends paid during the fourth quarter ended February 2, 2013 included a special cash dividend of $1.20 per share and a quarterly cash dividend of $0.20 per share. On March 19, 2014, the Company announced a 12.5% increase in its quarterly cash dividend for the first quarter of fiscal 2015, to $0.225 per share. The agreement governing our Credit Facility limits our ability to pay dividends unless immediately after giving effect thereto the aggregate amount of unrestricted cash and cash equivalents held by Guess?, Inc. and its domestic subsidiaries is at least $50 million.

27
Performance GraphThe Stock Price Performance Graph below compares the cumulative stockholder return of the Company
with that of the S&P 500 Index (a broad equity market index) and the S&P 1500 Apparel Retail Index (a published industry index) over the five fiscal year period beginning January 31, 2009. The return on investment is calculated based on an investment of $100 on January 31, 2009, with dividends, if any, reinvested. Past performance is not necessarily indicative of future performance.
COMPARISON OF FIVE YEAR TOTAL RETURNAMONG GUESS?, INC.,
S&P 500 INDEX AND S&P 1500 APPAREL RETAIL INDEX
Period Ending
Company/Market/Peer Group 1/31/2009 1/30/2010 1/29/2011 1/28/2012 2/2/2013 2/1/2014Guess?, Inc. ......................................................... $ 100.00 $ 250.68 $ 281.66 $ 200.47 $ 201.76 $ 213.26S&P 1500 Apparel Retail Index.......................... $ 100.00 $ 193.34 $ 244.55 $ 303.07 $ 392.34 $ 443.54S&P 500 Index..................................................... $ 100.00 $ 133.14 $ 161.44 $ 170.04 $ 199.98 $ 240.58
$0
$50
$100
$150
$200
$250
$300
$350
$400
$450
$500
1/31/2009 1/30/2010 1/29/2011 1/28/2012 2/2/2013 2/1/2014
DO
LLA
RS
Guess?, Inc. S&P 1500 Apparel Retail Index S&P 500 Index
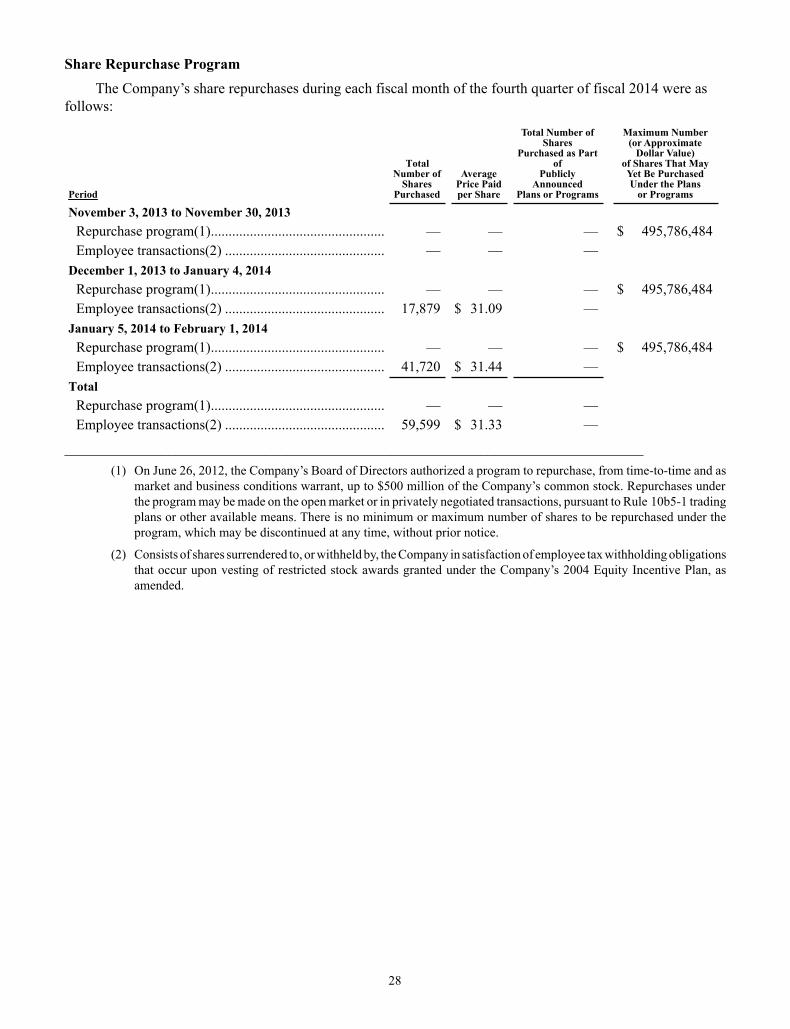
28
Share Repurchase ProgramThe Company’s share repurchases during each fiscal month of the fourth quarter of fiscal 2014 were as
follows:
Period
TotalNumber of
SharesPurchased
Average Price Paidper Share
Total Number of Shares
Purchased as Part of
Publicly Announced
Plans or Programs
Maximum Number (or Approximate
Dollar Value)of Shares That MayYet Be PurchasedUnder the Plans
or Programs
November 3, 2013 to November 30, 2013Repurchase program(1)................................................. — — — $ 495,786,484Employee transactions(2) ............................................. — — —
December 1, 2013 to January 4, 2014Repurchase program(1)................................................. — — — $ 495,786,484Employee transactions(2) ............................................. 17,879 $ 31.09 —
January 5, 2014 to February 1, 2014Repurchase program(1)................................................. — — — $ 495,786,484Employee transactions(2) ............................................. 41,720 $ 31.44 —
TotalRepurchase program(1)................................................. — — —Employee transactions(2) ............................................. 59,599 $ 31.33 —
______________________________________________________________________________(1) On June 26, 2012, the Company’s Board of Directors authorized a program to repurchase, from time-to-time and as
market and business conditions warrant, up to $500 million of the Company’s common stock. Repurchases under the program may be made on the open market or in privately negotiated transactions, pursuant to Rule 10b5-1 trading plans or other available means. There is no minimum or maximum number of shares to be repurchased under the program, which may be discontinued at any time, without prior notice.
(2) Consists of shares surrendered to, or withheld by, the Company in satisfaction of employee tax withholding obligations that occur upon vesting of restricted stock awards granted under the Company’s 2004 Equity Incentive Plan, as amended.
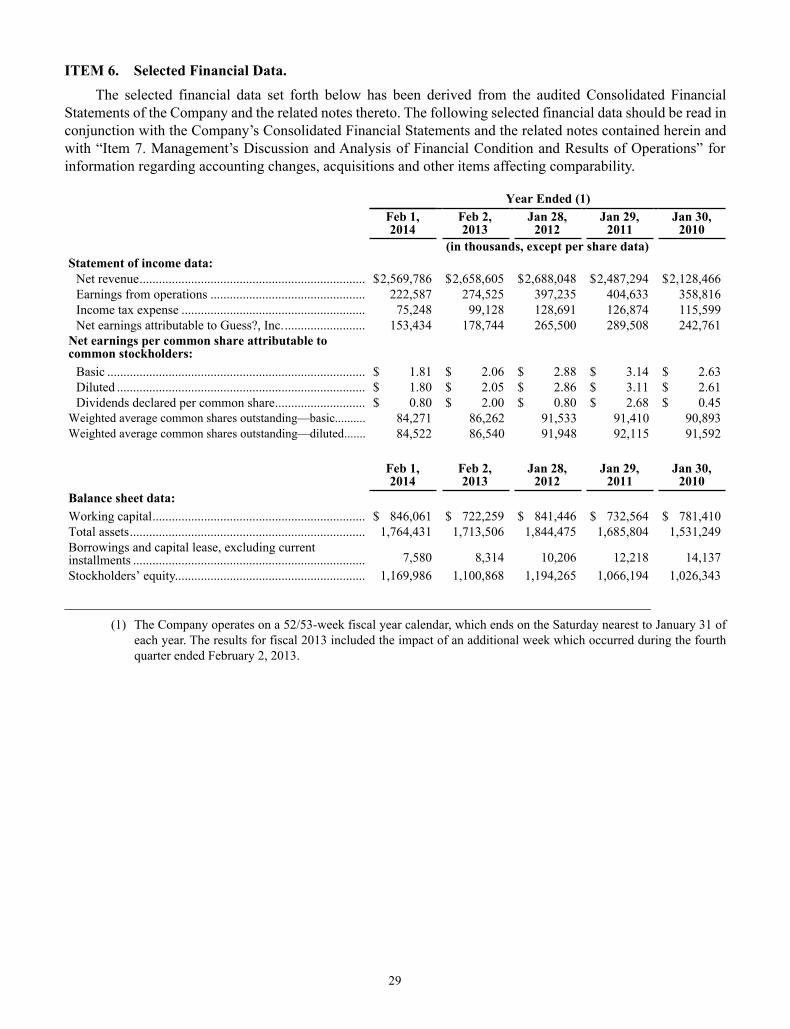
29
ITEM 6. Selected Financial Data.The selected financial data set forth below has been derived from the audited Consolidated Financial
Statements of the Company and the related notes thereto. The following selected financial data should be read in conjunction with the Company’s Consolidated Financial Statements and the related notes contained herein and with “Item 7. Management’s Discussion and Analysis of Financial Condition and Results of Operations” for information regarding accounting changes, acquisitions and other items affecting comparability.
Year Ended (1)Feb 1,2014
Feb 2,2013
Jan 28,2012
Jan 29,2011
Jan 30,2010
(in thousands, except per share data)Statement of income data:
Net revenue...................................................................... $2,569,786 $2,658,605 $2,688,048 $2,487,294 $2,128,466Earnings from operations ................................................ 222,587 274,525 397,235 404,633 358,816Income tax expense ......................................................... 75,248 99,128 128,691 126,874 115,599Net earnings attributable to Guess?, Inc. ......................... 153,434 178,744 265,500 289,508 242,761
Net earnings per common share attributable tocommon stockholders:
Basic ................................................................................ $ 1.81 $ 2.06 $ 2.88 $ 3.14 $ 2.63Diluted ............................................................................. $ 1.80 $ 2.05 $ 2.86 $ 3.11 $ 2.61Dividends declared per common share............................ $ 0.80 $ 2.00 $ 0.80 $ 2.68 $ 0.45
Weighted average common shares outstanding—basic.......... 84,271 86,262 91,533 91,410 90,893Weighted average common shares outstanding—diluted....... 84,522 86,540 91,948 92,115 91,592
Feb 1,2014
Feb 2,2013
Jan 28,2012
Jan 29,2011
Jan 30,2010
Balance sheet data:Working capital.................................................................. $ 846,061 $ 722,259 $ 841,446 $ 732,564 $ 781,410Total assets......................................................................... 1,764,431 1,713,506 1,844,475 1,685,804 1,531,249Borrowings and capital lease, excluding currentinstallments ........................................................................ 7,580 8,314 10,206 12,218 14,137Stockholders’ equity........................................................... 1,169,986 1,100,868 1,194,265 1,066,194 1,026,343
_______________________________________________________________________________(1) The Company operates on a 52/53-week fiscal year calendar, which ends on the Saturday nearest to January 31 of
each year. The results for fiscal 2013 included the impact of an additional week which occurred during the fourth quarter ended February 2, 2013.

30
ITEM 7. Management’s Discussion and Analysis of Financial Condition and Results of Operations.
GeneralUnless the context indicates otherwise, when we refer to “we,” “us,” “our” or the “Company” in this
Form 10-K, we are referring to Guess?, Inc. and its subsidiaries on a consolidated basis.Business Segments
The Company’s businesses are grouped into five reportable segments for management and internal financial reporting purposes: North American Retail, Europe, Asia, North American Wholesale and Licensing. Management evaluates segment performance based primarily on revenues and earnings from operations before restructuring charges, if any. The Company believes this segment reporting reflects how its five business segments are managed and each segment’s performance is evaluated. The North American Retail segment includes the Company’s retail and e-commerce operations in North America and its retail operations in Central and South America. The Europe segment includes the Company’s wholesale, retail and e-commerce operations in Europe and the Middle East. The Asia segment includes the Company’s wholesale, retail and e-commerce operations in Asia. The North American Wholesale segment includes the Company’s wholesale operations in North America and export sales to Central and South America. The Licensing segment includes the worldwide licensing operations of the Company. The business segment operating results exclude corporate overhead costs, which consist of shared costs of the organization, and restructuring charges. These costs are presented separately and generally include, among other things, the following unallocated corporate costs: accounting and finance, executive compensation, facilities, global advertising and marketing, human resources, information technology and legal. Information regarding these segments is summarized in Note 17 to the Consolidated Financial Statements. Products
We derive our net revenue from the sale of GUESS?, G by GUESS, GUESS Kids and MARCIANO apparel and our licensees’ products through our worldwide network of retail stores, wholesale customers and distributors, as well as our on-line sites. We also derive royalty revenues from worldwide licensing activities.Global Economic Conditions
Economic and market conditions have continued to be volatile and uncertain in many markets around the world and consumer behavior remains cautious. In North America, the relatively weaker levels of consumer confidence and the highly promotional conditions among retailers may persist for some time. In Europe, sovereign debt issues, government austerity programs and bank credit issues have impacted the capital markets of numerous European countries, resulting in reduced consumer confidence and discretionary spending in those countries. These circumstances have had, and could in the future have, a negative impact on our business, particularly in our more mature markets in Southern Europe. The impact could be greater in our multi-brand wholesale channel, particularly in Italy, where many customers are relatively small and not well capitalized. We also see evidence of a more cautious consumer in China, where the economy has shown clear signs of slowing, as well as a more volatile environment in South Korea. Foreign Currency Volatility
Since the majority of our international operations are conducted in currencies other than the U.S. dollar (primarily the euro, Canadian dollar and Korean won), currency fluctuations can have a significant impact on the translation of our international revenues and earnings into U.S. dollar amounts.
During fiscal 2014, the average U.S. dollar rate was weaker against the euro and the Korean won and stronger against the Canadian dollar compared to the average rate in fiscal 2013. This had an overall positive impact on the translation of our international revenues and earnings for the fiscal year ended February 1, 2014 compared to the prior fiscal year.
In addition, some of our transactions that occur primarily in Canada, Europe and South Korea are denominated in U.S. dollars, Swiss francs or British pounds, exposing them to exchange rate fluctuations when converted to

31
their functional currencies. Fluctuations in exchange rates can impact the operating margins of our foreign operations and reported earnings and are largely dependent on the transaction timing and magnitude during the period that the currency fluctuates. If the euro weakens versus the U.S. dollar at the time U.S. dollar denominated inventory is purchased relative to the purchases of the comparable period, our product margins in Europe could be unfavorably impacted. Our product margins in Europe for the fiscal year ended February 1, 2014 were not significantly impacted as a result of exchange rate fluctuations compared to the prior fiscal year.
The Company enters into derivative financial instruments to offset some but not all of the exchange risk on foreign currency transactions. For additional discussion regarding our exposure to foreign currency risk, forward contracts designated as hedging instruments and forward contracts not designated as hedging instruments, refer to “Item 7A. Quantitative and Qualitative Disclosures About Market Risk.”Strategy
International Growth. Global expansion continues to be a key component of our long-term growth strategy. Our combined revenue outside of the U.S. and Canada represented approximately half of the total Company’s revenue in fiscal 2014, compared to one-fifth in fiscal 2005. We expect to continue to expand in our existing international markets, particularly in less mature markets like Germany, Mexico, the Middle East and Russia. At the same time, we plan to develop in newer key markets such as Brazil and Japan.
Productivity Improvements. One of our goals is to drive growth by enhancing the productivity of our existing operations. We will continue to focus on expanding on our omni-channel strategy, improving supply chain efficiencies and optimizing global planning and allocation. In addition, we will continue to be opportunistic with our store openings and optimize our existing store portfolio by closing select under-performing stores as lease terms expire or through kick-out clauses. During the first quarter of fiscal 2014, the Company implemented plans to streamline its operational structure and reduce expenses in both Europe and North America. During the second quarter of fiscal 2014, the Company expanded these plans to include the consolidation and streamlining of certain operations in Europe and Asia. We will continue to regularly assess and implement initiatives that we believe will build brand equity, grow our business and enhance long-term profitability in each region.
North American Retail. In North American Retail, we plan to increase retail sales and profitability over the long-term by improving the productivity and performance of our existing stores and by leaving a larger portion of our buys open prior to each season to improve the efficiency of our speed to market by allowing us to design and produce closer to market delivery. We will also continue to emphasize our e-commerce channel as we execute our omni-channel strategy. In fiscal 2014, we reduced our store openings in the U.S. and Canada as compared to fiscal 2013 as we focused on improving the performance of existing stores. During fiscal 2015, we currently expect to continue with reduced store openings as well as the closure of certain under-performing stores as lease terms expire or through kick-out clauses. In addition, we plan to remodel key existing locations as part of the roll-out of our new store designs.
Europe. In Europe, over the long-term, we will continue to focus on developing new markets in Northern and Eastern Europe where our brand is well known but still under-penetrated. We have flagship stores in key cities such as Barcelona, Dusseldorf, London, Milan, Munich and Paris. During fiscal 2014, we strategically reduced our store openings in Southern Europe as compared to fiscal 2013 so we can focus on improving the performance of existing stores. During fiscal 2015, we plan to continue our retail store expansion primarily in Northern and Eastern Europe as well as the Middle East, but we expect this to be mostly offset by the closure of certain under-performing stores mainly in Southern Europe as lease terms expire or through kick-out clauses.
Asia. We see significant long-term market opportunities in Asia and we have dedicated capital and human resources to support the region’s growth and development. We and our partners have flagship stores in key cities such as Beijing, Hong Kong, Seoul and Shanghai, and we have partnered with licensees to develop our business in the second-tier and third-tier cities in this region. In China, where the economy has shown some signs of slowing, we have begun to see evidence of a more cautious consumer. Our strategy in South Korea, with a combined 419 stores and concessions at February 1, 2014, is to improve productivity and expand distribution for both our GUESS? and G by GUESS branded locations. We are also in the process of establishing our direct

32
operations in Japan where we opened our first store in the first quarter of fiscal 2015. For the year ended February 1, 2014, we and our partners opened 67 new stores and closed 38 stores in Asia, ending the year with 499 stores and 492 concessions.We and our partners plan to open between 90 and 95 retail stores and concessions in total across all concepts in Asia during fiscal 2015.Capital Allocation
The Company’s investments in capital for the full fiscal year 2015 are planned between $75 million and $85 million (after deducting estimated lease incentives of approximately $5 million). The planned investments in capital are primarily for store remodeling programs in North American Retail, new store openings in North America and expansion of our retail business in Europe. Comparable Store Sales
The Company has reported National Retail Federation (“NRF”) calendar comparable store sales on a quarterly basis for our physical stores in the U.S. and Canada excluding the results of our e-commerce sites. A store is considered comparable after it has been open for 13 full months. If a store remodel results in a square footage change of more than 15%, or involves a relocation or a change in store concept, the store is removed from the comparable store base until it has been opened at its new size, in its new location or under its new concept for 13 full months.
As a result of our omni-channel strategy, there is less distinction between our brick-and-mortar retail stores and our e-commerce sites and we believe the inclusion of e-commerce sales in our comparable store sales metric is becoming a more meaningful representation of these results. Therefore, beginning in the first quarter of fiscal 2015, the Company will report NRF calendar comparable store sales for our stores in the U.S. and Canada including our e-commerce sites as well as separately disclose the impact of e-commerce sales on our comparable store sales metric. An e-commerce site is considered comparable after it has been operational in a country for 13 full months and would exclude any related revenue from shipping fees.
The comparable store sales for each of the fiscal years presented have been adjusted to compare to the appropriate week in the comparable prior-year period as a result of the additional week included in fiscal 2013.
Definitions and calculations of comparable store sales differ among companies in the apparel retail industry, and therefore comparable store sales disclosed by us may not be comparable to the comparable same store sales metric disclosed by other companies.
Executive SummaryOverview
Net earnings attributable to Guess?, Inc. decreased 14.2% to $153.4 million, or diluted earnings of $1.80 per common share, for fiscal 2014, compared to net earnings attributable to Guess?, Inc. of $178.7 million, or diluted earnings of $2.05 per common share, in fiscal 2013. During the first quarter of fiscal 2014, the Company implemented plans to streamline its structure and reduce expenses in both Europe and North America. During the second quarter of fiscal 2014, the Company expanded these plans to include the consolidation and streamlining of certain operations in Europe and Asia. These actions resulted in restructuring charges for fiscal 2014 of $12.4 million (or $9.0 million after considering the $3.4 million reduction to income tax expense as a result of the charges), or an unfavorable after-tax impact of $0.11 per share. In the fourth quarter of fiscal 2013, the Company settled a tax audit dispute in Italy, resulting in a charge of $12.8 million in excess of amounts previously reserved, which was partially offset by unrelated tax benefits of $4.0 million, or a net impact of $0.10 per share. Adjusted diluted earnings, excluding the impact of these charges and the related tax impact, were $1.91 and $2.15 per common share for fiscal years 2014 and 2013, respectively. References to financial results excluding the impact of these charges are non-GAAP measures and are addressed below under “Non-GAAP Measures.”

33
Highlights of the Company’s performance for fiscal 2014 compared to the prior year are presented below, followed by a more comprehensive discussion under “Results of Operations”:
Operations• Total net revenue decreased 3.3% to $2.57 billion for fiscal 2014, from $2.66 billion in the prior year.
In constant currency, net revenue decreased by 4.4%.• Gross margin (gross profit as a percentage of total net revenue) declined 210 basis points to 38.0%
for fiscal 2014, compared to 40.1% in the prior year.• Selling, general and administrative (“SG&A”) expenses decreased 6.5% to $741.1 million for fiscal
2014, compared to $792.6 million in the prior year. SG&A expenses as a percentage of revenue(“SG&A rate”) decreased by 90 basis points to 28.9% for fiscal 2014, compared to 29.8% in the prioryear.
• The Company incurred $12.4 million in restructuring charges during fiscal 2014.• Earnings from operations decreased 18.9% to $222.6 million for fiscal 2014, compared to $274.5
million in the prior year. Operating margin declined 160 basis points to 8.7% for fiscal 2014, comparedto 10.3% in the prior year. The restructuring charges of $12.4 million negatively impacted the operatingmargin for fiscal 2014 by 40 basis points.
• Other income, net (including interest income and expense), totaled $10.4 million for fiscal 2014,compared to other income, net, of $6.1 million in the prior year.
• The effective income tax rate decreased 300 basis points to 32.3% for fiscal 2014, compared to 35.3%in the prior year. The effective tax rate for fiscal 2013 included the unfavorable impact of the $12.8million Italian tax settlement charge, partially offset by unrelated tax benefits of $4.0 million.
Key Balance Sheet Accounts• The Company had $508.1 million in cash and cash equivalents and short-term investments as of
February 1, 2014, up $172.2 million, compared to $335.9 million as of February 2, 2013.The Company invested $22.1 million to repurchase approximately 0.9 million of its common shares during fiscal 2014. In fiscal 2013, the Company invested $140.1 million to repurchase approximately 5.0 million shares of its common stock. Dividends paid to shareholders during fiscal 2014 were $68.2 million compared to $172.8 million during fiscal 2013, which included a special dividend of $1.20 per common share paid during the fourth quarter of fiscal 2013.
• Accounts receivable, which relates primarily to the Company’s wholesale business in Europe, and toa lesser extent, to its wholesale businesses in North America and Asia and its international licensingbusiness, decreased by $40.3 million, or 12.7%, to $276.6 million at February 1, 2014, compared to$316.9 million at February 2, 2013. On a constant currency basis, accounts receivable decreased $37.7million, or 11.9%.
• Inventory decreased by $18.8 million, or 5.1%, to $350.9 million as of February 1, 2014, comparedto $369.7 million as of February 2, 2013. When measured in terms of finished goods units, inventoryvolumes were flat as of February 1, 2014, when compared to February 2, 2013.
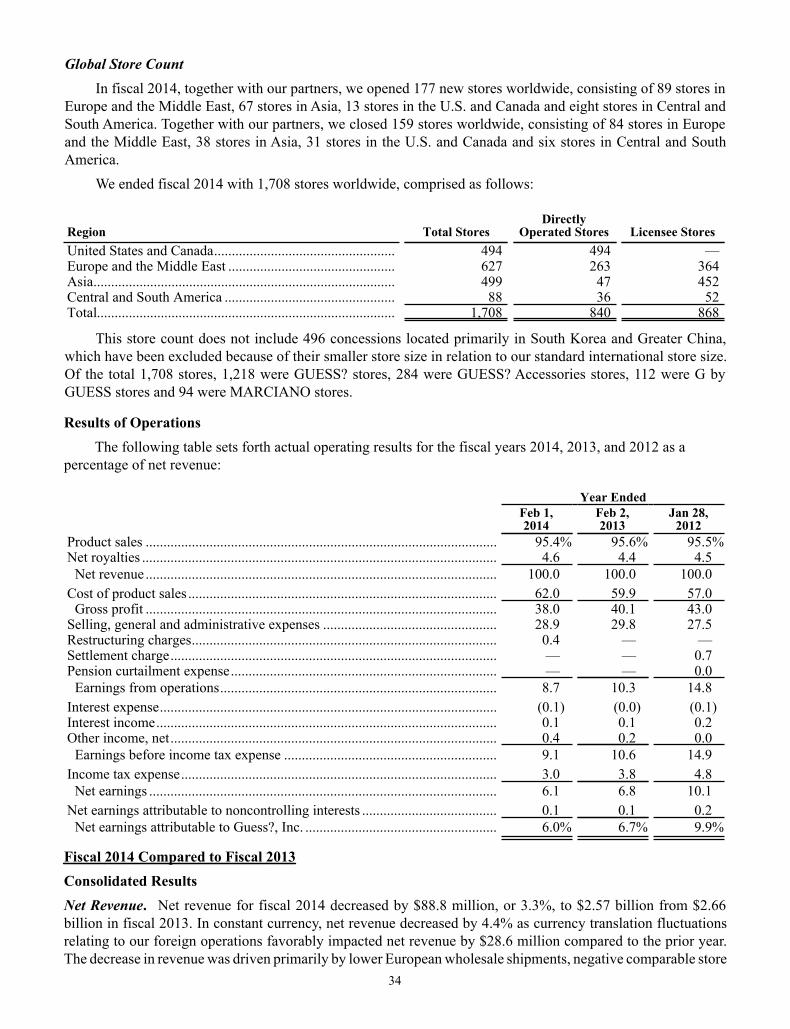
34
Global Store CountIn fiscal 2014, together with our partners, we opened 177 new stores worldwide, consisting of 89 stores in
Europe and the Middle East, 67 stores in Asia, 13 stores in the U.S. and Canada and eight stores in Central and South America. Together with our partners, we closed 159 stores worldwide, consisting of 84 stores in Europe and the Middle East, 38 stores in Asia, 31 stores in the U.S. and Canada and six stores in Central and South America.
We ended fiscal 2014 with 1,708 stores worldwide, comprised as follows:
Region Total StoresDirectly
Operated Stores Licensee StoresUnited States and Canada................................................... 494 494 —Europe and the Middle East ............................................... 627 263 364Asia..................................................................................... 499 47 452Central and South America ................................................ 88 36 52Total.................................................................................... 1,708 840 868
This store count does not include 496 concessions located primarily in South Korea and Greater China, which have been excluded because of their smaller store size in relation to our standard international store size. Of the total 1,708 stores, 1,218 were GUESS? stores, 284 were GUESS? Accessories stores, 112 were G by GUESS stores and 94 were MARCIANO stores.
Results of OperationsThe following table sets forth actual operating results for the fiscal years 2014, 2013, and 2012 as a
percentage of net revenue:
Year EndedFeb 1,2014
Feb 2,2013
Jan 28,2012
Product sales ................................................................................................... 95.4% 95.6% 95.5%Net royalties .................................................................................................... 4.6 4.4 4.5
Net revenue ................................................................................................... 100.0 100.0 100.0Cost of product sales ....................................................................................... 62.0 59.9 57.0
Gross profit ................................................................................................... 38.0 40.1 43.0Selling, general and administrative expenses ................................................. 28.9 29.8 27.5Restructuring charges...................................................................................... 0.4 — —Settlement charge............................................................................................ — — 0.7Pension curtailment expense........................................................................... — — 0.0
Earnings from operations.............................................................................. 8.7 10.3 14.8Interest expense............................................................................................... (0.1) (0.0) (0.1)Interest income................................................................................................ 0.1 0.1 0.2Other income, net............................................................................................ 0.4 0.2 0.0
Earnings before income tax expense ............................................................ 9.1 10.6 14.9Income tax expense......................................................................................... 3.0 3.8 4.8
Net earnings .................................................................................................. 6.1 6.8 10.1Net earnings attributable to noncontrolling interests ...................................... 0.1 0.1 0.2
Net earnings attributable to Guess?, Inc. ...................................................... 6.0% 6.7% 9.9%
Fiscal 2014 Compared to Fiscal 2013 Consolidated ResultsNet Revenue. Net revenue for fiscal 2014 decreased by $88.8 million, or 3.3%, to $2.57 billion from $2.66 billion in fiscal 2013. In constant currency, net revenue decreased by 4.4% as currency translation fluctuations relating to our foreign operations favorably impacted net revenue by $28.6 million compared to the prior year. The decrease in revenue was driven primarily by lower European wholesale shipments, negative comparable store
35
sales in North American Retail and Europe and the impact on revenue from the additional week in the prior year, partially offset by the favorable impact on revenue from expansion of our retail business in Europe. Gross Profit. Gross profit decreased by $91.0 million, or 8.5%, to $976.1 million for fiscal 2014, from $1.07 billion in fiscal 2013, due primarily to the unfavorable impact from lower wholesale sales in Europe, negative comparable store sales in North American Retail and Europe and lower overall product margins, partially offset by the favorable impact from retail expansion in Europe, net of higher occupancy costs, and currency translation.
Gross margin decreased 210 basis points to 38.0% for fiscal 2014, from 40.1% in fiscal 2013, due to a higher occupancy rate and lower overall product margins. The higher occupancy rate was driven by negative comparable store sales in North American Retail and lower wholesale shipments in Europe. Product margins declined due primarily to more markdowns in North American Retail.
The Company’s gross margin may not be comparable to other entities since some entities include all of the costs related to their distribution in cost of product sales and others, like the Company, generally exclude the wholesale-related distribution costs from gross margin, including them instead in SG&A expenses. Additionally, some entities include retail store occupancy costs in SG&A expenses and others, like the Company, include retail store occupancy costs, including rent and depreciation, in cost of product sales. Selling, General and Administrative Expenses. SG&A expenses decreased by $51.5 million, or 6.5%, to $741.1 million for fiscal 2014, from $792.6 million in fiscal 2013. The decrease in SG&A expenses, which included the unfavorable impact of currency translation, was due primarily to lower selling and merchandising expenses in Europe and lower investments in advertising and marketing.
The Company’s SG&A rate decreased by 90 basis points to 28.9% for fiscal 2014, compared to 29.8% in fiscal 2013. The SG&A rate was favorably impacted by lower selling and merchandising expenses in Europe resulting from productivity improvements and lower investments in advertising and marketing, partially offset by the negative impact on the Company’s fixed cost structure resulting from a decline in European wholesale shipments and negative comparable store sales in North American Retail.Restructuring Charges. During the first quarter of fiscal 2014, the Company implemented plans to streamline its structure and reduce expenses in both Europe and North America. During the second quarter of fiscal 2014, the Company expanded these plans to include the consolidation and streamlining of certain operations in Europe and Asia. These actions resulted in restructuring charges of $12.4 million incurred during fiscal 2014. Earnings from Operations. Earnings from operations decreased by $51.9 million, or 18.9%, to $222.6 million for fiscal 2014, from $274.5 million in fiscal 2013. Currency translation fluctuations relating to our foreign operations favorably impacted earnings from operations by $4.4 million.
Operating margin decreased 160 basis points to 8.7% for fiscal 2014, compared to 10.3% in fiscal 2013. Operating margin was negatively impacted by lower overall gross margins and the negative impact of the restructuring charges, partially offset by a lower SG&A rate. The restructuring charges of $12.4 million negatively impacted the operating margin for fiscal 2014 by 40 basis points.Interest Income, Net. Interest income, net was $0.1 million for fiscal 2014, compared to interest income, net of $0.4 million in fiscal 2013 and includes the impact of hedge ineffectiveness of foreign currency forward contracts designated as cash flow hedges. Other Income, Net. Other income, net was $10.3 million for fiscal 2014, compared to other income, net of $5.7 million in fiscal 2013. Other income, net in fiscal 2014 consisted primarily of net unrealized and realized gains on non-operating assets and net realized and unrealized mark-to-market gains on foreign currency contracts and other foreign currency balances. Other income, net in fiscal 2013 consisted primarily of net unrealized gains on non-operating assets and net realized mark-to-market revaluation gains on foreign currency contracts and other foreign currency balances.Income Tax Expense. Income tax expense for fiscal 2014 was $75.2 million, or a 32.3% effective tax rate, compared to income tax expense of $99.1 million, or a 35.3% effective tax rate, in fiscal 2013. The effective income tax rate in fiscal 2014 included the impact of restructuring charges of $12.4 million and a $3.4 million

36
reduction to income tax expense as a result of the charges, or a negative impact of 20 basis points on the effective tax rate. In fiscal 2013, the Company settled a tax audit dispute in Italy, resulting in a charge of $12.8 million in excess of amounts previously reserved, which was partially offset by unrelated tax benefits of $4.0 million. These adjustments increased the income tax expense by $8.8 million and negatively impacted the effective tax rate for fiscal 2013 by 310 basis points. Excluding the impact of these respective adjustments, the effective income tax rate was 32.1% for fiscal 2014, compared to 32.2% for fiscal 2013. References to financial results excluding the impact of these charges are non-GAAP measures and are addressed below under “Non-GAAP Measures.”Net Earnings Attributable to Noncontrolling Interests. Net earnings attributable to noncontrolling interests for fiscal 2014 was $4.3 million, net of taxes, compared to $2.7 million, net of taxes, in fiscal 2013. Net Earnings Attributable to Guess?, Inc. Net earnings attributable to Guess?, Inc. decreased by $25.3 million, or 14.2%, to $153.4 million for fiscal 2014, from $178.7 million in fiscal 2013. Diluted earnings per common share decreased to $1.80 per share for fiscal 2014, compared to $2.05 per share in fiscal 2013. The results for fiscal 2014 included the unfavorable $0.11 per share after-tax impact of the restructuring charges. The results for fiscal 2013 included the unfavorable $0.10 per share Italian tax settlement charge net of unrelated tax benefits. Adjusted diluted earnings, excluding the impact of these charges and the related tax impact, were $1.91 and $2.15 per common share for fiscal years 2014 and 2013, respectively. References to financial results excluding the impact of these charges are non-GAAP measures and are addressed below under “Non-GAAP Measures.” Information by Business Segment The following table presents our net revenue and earnings from operations by segment for the last two fiscal years:
Fiscal 2014 Fiscal 2013 Change % Change(dollars in thousands)
Net revenue:North American Retail.............................................. $ 1,075,475 $ 1,116,836 $ (41,361) (3.7%)Europe....................................................................... 903,791 939,599 (35,808) (3.8)Asia ........................................................................... 292,714 290,655 2,059 0.7North American Wholesale....................................... 179,600 194,373 (14,773) (7.6)Licensing................................................................... 118,206 117,142 1,064 0.9
Total net revenue .................................................. $ 2,569,786 $ 2,658,605 $ (88,819) (3.3%)Earnings (loss) from operations:
North American Retail.............................................. $ 39,540 $ 78,285 $ (38,745) (49.5%)Europe....................................................................... 97,231 103,975 (6,744) (6.5)Asia ........................................................................... 25,592 26,525 (933) (3.5)North American Wholesale....................................... 38,771 45,008 (6,237) (13.9)Licensing................................................................... 107,805 101,182 6,623 6.5Corporate Overhead.................................................. (73,910) (80,450) 6,540 (8.1)Restructuring Charges............................................... (12,442) — (12,442)
Total earnings from operations............................. $ 222,587 $ 274,525 $ (51,938) (18.9%)Operating margins:
North American Retail.............................................. 3.7% 7.0%Europe....................................................................... 10.8% 11.1%Asia ........................................................................... 8.7% 9.1%North American Wholesale....................................... 21.6% 23.2%Licensing................................................................... 91.2% 86.4%
Total Company ..................................................... 8.7% 10.3%
North American RetailNet revenue from our North American Retail operations decreased by $41.4 million, or 3.7%, to $1.08 billion
for fiscal 2014, from $1.12 billion in fiscal 2013. The decrease in revenue was driven by negative comparable store sales of 5.3% for our combined U.S. and Canadian stores excluding the results of our e-commerce sites
37
(negative 4.4% in constant currency, which also excludes the unfavorable translation impact of currency fluctuations relating to our Canadian retail stores) and the impact on revenue from the additional week in the prior year, partially offset by the favorable impact on revenue from new store openings and growth in our e-commerce business. Comparable store sales for our U.S. and Canadian stores including the results of our e-commerce sites were negative 3.7% (negative 2.8% in constant currency, which excludes the unfavorable translation impact of currency fluctuations relating to our Canadian retail stores). The inclusion of our e-commerce sales improved the comparable store sale percentage by 1.6% in U.S. dollars and constant currency. The store base for the U.S. and Canada decreased by an average of three net stores in fiscal 2014 compared to the prior year while average square footage was relatively flat compared to the prior year. In fiscal 2014, we opened 13 new stores in the U.S. and Canada and closed 31 stores. At February 1, 2014, we directly operated 494 stores in the U.S. and Canada compared to 512 stores as of February 2, 2013. Currency translation fluctuations relating to our non-U.S. retail stores unfavorably impacted net revenue in our North American Retail segment by $8.4 million.
Earnings from operations for the North American Retail segment decreased by $38.7 million, or 49.5%, to $39.5 million for fiscal 2014, compared to $78.3 million in fiscal 2013. The decrease reflects the impact on earnings from negative comparable store sales and lower product margins.
Operating margin declined 330 basis points to 3.7% for fiscal 2014, compared to 7.0% fiscal 2013. The decrease was driven by the negative impact on the fixed cost structure resulting from negative comparable store sales and lower product margins due primarily to more markdowns.Europe
Net revenue from our Europe operations decreased by $35.8 million, or 3.8%, to $903.8 million for fiscal 2014, from $939.6 million for fiscal 2013. In local currency, net revenue decreased by 7.2% versus the prior year. The decrease in revenue resulting primarily from lower shipments in our European wholesale business, a percentage decline in the low single digits for comparable store sales in our directly operated retail stores versus the prior year and the impact on revenue from the additional week in the prior year was partially offset by the favorable impact on revenue from the expansion of our directly operated retail business. We grew our business in newer markets, including Germany and Russia, though this growth was more than offset by declines in more mature markets such as Italy and France. At February 1, 2014, we directly operated 263 stores in Europe compared to 240 stores at February 2, 2013, excluding concessions, which represents an 9.6% increase over the prior year. Currency translation fluctuations relating to our European operations favorably impacted net revenue by $32.4 million.
Earnings from operations from our Europe segment decreased by $6.7 million, or 6.5%, to $97.2 million for fiscal 2014, compared to $104.0 million in fiscal 2013. The decrease resulted primarily from the negative impact on earnings from lower wholesale shipments, partially offset by lower SG&A expenses and higher profits from the growth in retail stores, net of higher occupancy costs. Currency translation fluctuations relating to our European operations favorably impacted earnings from operations by $5.0 million.
Operating margin declined 30 basis points to 10.8% for fiscal 2014, compared to 11.1% for fiscal 2013. The decrease in operating margin was driven primarily by the negative impact on the fixed cost structure resulting from lower wholesale shipments, partially offset by lower selling and merchandising expenses resulting from productivity improvements. Asia
Net revenue from our Asia operations increased by $2.1 million, or 0.7%, to $292.7 million for fiscal 2014, from $290.7 million for fiscal 2013. In constant currency, net revenue decreased by 1.2% versus the prior year. The decrease was due to lower revenue in our Greater China business due primarily to lower wholesale shipments, partially offset by growth in our South Korea business driven primarily by retail expansion. We continued to grow our operations in Asia, where we and our partners operated 499 stores and 492 concessions at February 1, 2014 compared to 470 stores and 397 concessions as of February 2, 2013. Currency translation fluctuations relating to our Asia operations favorably impacted net revenue by $5.6 million.
38
Earnings from operations for the Asia segment decreased by $0.9 million, or 3.5%, to $25.6 million for fiscal 2014, compared to $26.5 million in fiscal 2013. The decrease was driven by the unfavorable impact on earnings from lower overall gross margins, partially offset by lower SG&A expenses.
Operating margin declined 40 basis points to 8.7% for fiscal 2014, compared to 9.1% in fiscal 2013. The decrease in operating margin was driven by lower overall gross margins, partially offset by a lower SG&A rate due primarily to lower investments in advertising and marketing.North American Wholesale
Net revenue from our North American Wholesale operations decreased by $14.8 million, or 7.6%, to $179.6 million for fiscal 2014, from $194.4 million in fiscal 2013. In constant currency, net revenue decreased by 7.1% compared to the prior year. This decrease was driven by lower revenue in our U.S. and Canadian wholesale businesses, partially offset by higher revenue in our Mexican wholesale business. Currency translation fluctuations relating to our non-U.S. wholesale businesses unfavorably impacted net revenue in our North American Wholesale segment by $1.0 million.
Earnings from operations from our North American Wholesale segment decreased by $6.2 million, or 13.9%, to $38.8 million for fiscal 2014, compared to $45.0 million in fiscal 2013. The decrease was due primarily to the unfavorable impact to earnings from lower revenue and higher SG&A expenses.
Operating margin declined 160 basis points to 21.6% for fiscal 2014, compared to 23.2% for fiscal 2013, due primarily to a higher SG&A rate driven by an overall deleveraging of expenses and investments in our Brazilian wholesale business which was established during fiscal 2014.Licensing
Net royalty revenue from Licensing operations increased by $1.1 million, or 0.9%, to $118.2 million for fiscal 2014, from $117.1 million in fiscal 2013.
Earnings from operations from our Licensing segment increased by $6.6 million, or 6.5%, to $107.8 million for fiscal 2014, compared to $101.2 million for fiscal 2013. The increase was driven primarily by lower advertising and marketing expenses, lower performance-based compensation and higher revenue. Corporate Overhead
Unallocated corporate overhead decreased by $6.5 million to $73.9 million for fiscal 2014, compared to $80.5 million in fiscal 2013. The decrease was driven primarily by lower charitable contributions, legal fees and advertising and marketing expenses.
Fiscal 2013 Compared to Fiscal 2012Consolidated Results Net Revenue. Net revenue for fiscal 2013 decreased by $29.4 million, or 1.1%, to $2.66 billion from $2.69 billion in fiscal 2012. In constant currency, revenue increased by 1.6% as currency translation fluctuations relating to our foreign operations unfavorably impacted net revenue by $72.7 million. The increases in revenue from expansion of our retail businesses in Europe and North America, growth in our Asian operations and the favorable impact on revenue from the additional week in the current year were offset by the negative comparable store sales in North America and Europe and lower European wholesale shipments. Gross Profit. Gross profit decreased by $89.1 million, or 7.7%, to $1.07 billion for fiscal 2013, from $1.16 billion in fiscal 2012, due primarily to the unfavorable impact of currency translation on gross profit, lower wholesale sales in Europe and lower overall product margins.
Gross margin decreased 290 basis points to 40.1% for fiscal 2013, from 43.0% in fiscal 2013, due to a higher occupancy rate and lower overall product margins. The higher occupancy rate was driven by negative comparable store sales in North America and retail expansion in Europe. Product margins declined due primarily to more
39
retail markdowns in Europe and North America, the unfavorable impact of currencies on product costs and pricing changes in Canada. Selling, General and Administrative Expenses. SG&A expenses increased by $54.3 million, or 7.4%, to $792.6 million for fiscal 2013, from $738.3 million in fiscal 2012. The increase in SG&A expenses, which included the favorable impact of currency translation, was due primarily to higher selling expenses and higher global advertising and marketing expenses, partially offset by lower performance-based compensation costs.
The Company’s SG&A rate increased by 230 basis points to 29.8% for fiscal 2013, compared to 27.5% in fiscal 2012. The SG&A rate was negatively impacted by deleveraging of expenses resulting from negative comparable store sales in North America and Europe and a decline in European wholesale shipments, increased investments in advertising and marketing and higher store selling expenses due to our international retail expansion, partially offset by lower performance-based compensation costs. Settlement Charge. During fiscal 2012, the Company experienced a temporary disruption in service with a former third party logistics service provider in Europe and subsequently entered into a settlement agreement with this service provider to facilitate a transition to a new service provider. As a result, the Company recorded a $19.5 million settlement charge in fiscal 2012 related to amounts paid in connection with this agreement. The Company did not have any expenses related to this settlement in fiscal 2013. Pension Curtailment Expense. During fiscal 2012, the Company recorded a SERP curtailment expense of $1.2 million that did not occur in fiscal 2013. Earnings from Operations. Earnings from operations decreased by $122.7 million, or 30.9%, to $274.5 million for fiscal 2013, from $397.2 million in fiscal 2012. Currency translation fluctuations relating to our foreign operations unfavorably impacted earnings from operations by $6.8 million.
Operating margin decreased 450 basis points to 10.3% for fiscal 2013, compared to 14.8% in fiscal 2012. Operating margin was negatively impacted by lower overall gross margins and a higher SG&A rate, partially offset by the negative impact in the prior year of the $19.5 million settlement charge. Interest Income, Net. Interest income, net was $0.4 million for fiscal 2013, compared to interest income, net of $1.1 million in fiscal 2012 and includes the impact of hedge ineffectiveness of foreign currency forward contracts designated as cash flow hedges. The decrease in interest income, net for fiscal 2013 compared to the prior year was due primarily to lower average invested cash balances. Other Income, Net. Other income, net was $5.7 million for fiscal 2013, compared to other income, net of $1.0 million in fiscal 2012. Other income, net in fiscal 2013 consisted primarily of net unrealized gains on non-operating assets and net realized mark-to-market revaluation gains on foreign currency contracts and other foreign currency balances. Other income, net in fiscal 2012 consisted primarily of net unrealized mark-to-market revaluation gains on foreign currency contracts and other foreign currency balances. Income Tax Expense. Income tax expense for fiscal 2013 was $99.1 million, or a 35.3% effective tax rate, compared to income tax expense of $128.7 million, or a 32.2% effective tax rate, in fiscal 2012. In fiscal 2013, the Company settled a tax audit dispute in Italy, resulting in a charge of $12.8 million in excess of amounts previously reserved, which was partially offset by unrelated tax benefits of $4.0 million. These adjustments increased the income tax expense by $8.8 million and negatively impacted the effective tax rate for fiscal 2013 by 310 basis points. The effective income tax rate in fiscal 2012 included the discrete impact of a $19.5 million European supply chain settlement charge and a $1.9 million reduction to income tax expense as a result of the charge. These adjustments unfavorably impacted the mix of taxable income among the Company’s tax jurisdictions and increased the effective tax rate for the prior year by 100 basis points. Excluding the impact of these respective adjustments, the effective income tax rate was 32.2% for fiscal 2013, compared to 31.2% for fiscal 2012. References to financial results excluding the impact of the net settlement charges are non-GAAP measures and are addressed below under "Non-GAAP Measures." Net Earnings Attributable to Noncontrolling Interests. Net earnings attributable to noncontrolling interests in subsidiaries for fiscal 2013 was $2.7 million, net of taxes, compared to $5.2 million, net of taxes, in fiscal 2012.

40
The decrease was due to the purchase of the remaining 25% interest in one of our now wholly-owned subsidiaries in Italy during fiscal 2013 and lower earnings in our majority-owned European subsidiaries. Net Earnings Attributable to Guess?, Inc. Net earnings attributable to Guess?, Inc. decreased by $86.8 million, or 32.7%, to $178.7 million for fiscal 2013, from $265.5 million in fiscal 2012. Diluted earnings per common share decreased to $2.05 per share for fiscal 2013, compared to $2.86 per share in fiscal 2012. The results for fiscal 2013 included the $0.10 per share Italian tax settlement charge net of unrelated tax benefits. The results for fiscal 2012 included the $0.19 per share European supply chain settlement charge. Adjusted diluted earnings, excluding the net settlement charges, were $2.15 and $3.05 per common share for fiscal years 2013 and 2012, respectively. References to financial results excluding the impact of the net settlement charges are non-GAAP measures and are addressed below under "Non-GAAP Measures." Information by Business Segment The following table presents our net revenue and earnings from operations by segment for fiscal 2013 and fiscal 2012:
Fiscal 2013 Fiscal 2012 Change % Change(dollars in thousands)
Net revenue:North American Retail.............................................. $ 1,116,836 $ 1,117,643 $ (807) (0.1%)Europe....................................................................... 939,599 1,010,896 (71,297) (7.1)Asia ........................................................................... 290,655 250,727 39,928 15.9North American Wholesale....................................... 194,373 187,362 7,011 3.7Licensing................................................................... 117,142 121,420 (4,278) (3.5)
Total net revenue .................................................. $ 2,658,605 $ 2,688,048 $ (29,443) (1.1%)Earnings (loss) from operations:
North American Retail.............................................. $ 78,285 $ 133,184 $ (54,899) (41.2%)Europe....................................................................... 103,975 167,014 (63,039) (37.7)Asia ........................................................................... 26,525 28,463 (1,938) (6.8)North American Wholesale....................................... 45,008 47,162 (2,154) (4.6)Licensing................................................................... 101,182 108,638 (7,456) (6.9)Corporate Overhead.................................................. (80,450) (87,226) 6,776 (7.8)
Total earnings from operations............................. $ 274,525 $ 397,235 $ (122,710) (30.9%)Operating margins:
North American Retail.............................................. 7.0% 11.9%Europe....................................................................... 11.1% 16.5%Asia ........................................................................... 9.1% 11.4%North American Wholesale....................................... 23.2% 25.2%Licensing................................................................... 86.4% 89.5%
Total Company ..................................................... 10.3% 14.8%
North American Retail Net revenue from our North American Retail operations remained relatively flat at $1.12 billion for fiscal
2013 compared to fiscal 2012. The favorable impact on revenue from a larger store base, the additional week and growth in our e-commerce business was offset by negative comparable store sales of 6.6% for our combined U.S. and Canadian stores. Currency translation fluctuations relating to our non-U.S. retail stores unfavorably impacted net revenue by $1.8 million. The store base increased by an average of 18 net additional stores in fiscal 2013 compared to the prior year, resulting in a net 4.9% increase in average square footage. In fiscal 2013, we opened 33 new stores in the U.S. and Canada and closed 25 stores. At February 2, 2013, we directly operated 512 stores in the U.S. and Canada compared to 504 stores as of January 28, 2012.
Earnings from operations for the North American Retail segment decreased by $54.9 million, or 41.2%, to $78.3 million for fiscal 2013, compared to $133.2 million in fiscal 2012. The decrease reflects the impact on

41
profits from negative comparable store sales, lower product margins and increased investments in advertising and marketing.
Operating margin declined 490 basis points to 7.0% for fiscal 2013, compared to 11.9% fiscal 2012. The decrease was driven by a higher SG&A rate and lower gross margins. The higher SG&A rate was driven mainly by an overall deleveraging of expenses resulting from the negative comparable store sales and increased investments in advertising and marketing. Gross margins were negatively impacted by a higher occupancy rate, given the negative comparable store sales, and pricing changes in Canada as well as more markdowns and increased product costs. Europe
Net revenue from our Europe operations decreased by $71.3 million, or 7.1%, to $939.6 million for fiscal 2013, from $1.01 billion for fiscal 2012. In local currency, revenue was relatively flat compared to the prior year. The increase in revenue from the expansion of our directly operated retail business was offset by lower revenue from our European wholesale business and a percentage decline in the high single digits for comparable store sales versus the prior year. The decrease in our wholesale business was due mainly to lower apparel sales. We grew our business in newer markets, including Russia and Germany, though this growth was more than offset by declines in more mature markets such as Italy and France. At February 2, 2013, we directly operated 240 stores in Europe compared to 179 stores at January 28, 2012, excluding concessions, which represents a 34.1% increase over the prior year. Currency translation fluctuations relating to our European operations unfavorably impacted net revenue by $69.7 million.
Earnings from operations from our Europe segment decreased by $63.0 million, or 37.7%, to $104.0 million for fiscal 2013, compared to $167.0 million in fiscal 2012. The decrease resulted from lower wholesale shipments, the unfavorable impact to earnings from lower product margins and increased investments in advertising and marketing. These decreases were partially offset by the negative impact in the prior year resulting from the $19.5 million supply chain settlement charge and higher profits from the growth in retail stores, net of higher store selling expenses and higher occupancy costs. Currency translation fluctuations related to our Europe segment unfavorably impacted earnings from operations by $6.5 million.
Operating margin declined 540 basis points to 11.1% for fiscal 2013, compared to 16.5% for fiscal 2012. Operating margin for fiscal 2012 included the negative impact from the supply chain settlement charge of 190 basis points. The decline in operating margin was driven by a higher SG&A rate and lower gross margins. The higher SG&A rate was driven mainly by higher store selling expenses due to retail expansion, deleveraging of expenses resulting from a decline in European wholesale shipments and increased investments in advertising and marketing. The lower gross margin was driven primarily by a higher occupancy rate due to retail expansion, more retail markdowns and the negative impact of the relatively weaker euro on product margins. Asia
Net revenue from our Asia operations increased by $40.0 million, or 15.9%, to $290.7 million for fiscal 2013, from $250.7 million for fiscal 2012. The increase in revenue was driven by growth in our South Korea and Greater China businesses due primarily to retail expansion. We continued to grow our operations in the region, where we and our partners opened 80 stores and 105 concessions during the year ended February 2, 2013.
Earnings from operations for the Asia segment decreased by $2.0 million, or 6.8%, to $26.5 million for fiscal 2013, compared to $28.5 million in fiscal 2012. The favorable impact to earnings due to higher revenue and improved product margins was more than offset by higher occupancy and store selling costs due to a larger retail store base.
Operating margin declined 230 basis points to 9.1% for fiscal 2013, compared to 11.4% in fiscal 2012. The decrease in operating margin was driven primarily by a higher occupancy rate resulting from a greater mix of retail business in South Korea and a higher SG&A rate due to higher store selling expenses given our retail expansion in this region.

42
North American Wholesale Net revenue from our North American Wholesale operations increased by $7.0 million, or 3.7%, to $194.4
million for fiscal 2013, from $187.4 million in fiscal 2012. In constant currency, net revenue increased 4.5% versus the prior year, driven primarily by our U.S. and Mexican wholesale businesses. Currency translation fluctuations relating to our non-U.S. wholesale businesses unfavorably impacted net revenue in our North American Wholesale segment by $1.3 million.
Earnings from operations from our North American Wholesale segment decreased by $2.2 million, or 4.6%, to $45.0 million for fiscal 2013, compared to $47.2 million in fiscal 2012. The decrease was due primarily to the unfavorable impact to earnings from lower gross margins and increased investments in advertising and marketing.
Operating margin declined 200 basis points to 23.2% for fiscal 2013, compared to 25.2% for fiscal 2012, due primarily to lower gross margins driven by the unfavorable impact of currency fluctuations on product margins and pricing changes in Canada and a higher SG&A rate driven by increased investments in advertising and marketing. Licensing
Net royalty revenue from Licensing operations decreased by $4.3 million, or 3.5%, to $117.1 million for fiscal 2013, from $121.4 million in fiscal 2012. The decrease was driven by lower sales by our licensees in our handbag and watch categories.
Earnings from operations from our Licensing segment decreased by $7.4 million, or 6.9%, to $101.2 million for fiscal 2013, compared to $108.6 million for fiscal 2012. The decrease was driven by lower revenue and higher advertising and marketing expenses. Corporate Overhead
Unallocated corporate overhead decreased by $6.7 million to $80.5 million for fiscal 2013, compared to $87.2 million in fiscal 2012. The decrease was driven primarily by lower performance-based compensation costs, partially offset by increased investments in advertising and marketing.
Non-GAAP MeasuresThe Company’s reported financial results are presented in accordance with GAAP. The reported net earnings
attributable to Guess?, Inc., diluted earnings per common share and the effective tax rate in fiscal 2014, fiscal 2013 and fiscal 2012 reflect the impact of restructuring and settlement charges which affect the comparability of those reported results. Those financial results are also presented on a non-GAAP basis, as defined in Section 10(e) of Regulation S-K of the SEC, to exclude the effect of these items. The Company has excluded these charges, and the related tax impacts, from its adjusted financial measures primarily because it does not believe such charges reflect the Company’s ongoing operating results or future outlook. The Company believes that these “non-GAAP” or “adjusted” financial measures are useful as an additional means for investors to evaluate the comparability of the Company’s operating results when reviewed in conjunction with the Company’s GAAP financial statements. The non-GAAP measures are provided in addition to, and not as alternatives for, the Company’s reported GAAP results.
The adjusted measures for fiscal 2014 exclude the impact of restructuring charges. During the first quarter of fiscal 2014, the Company implemented plans to streamline its structure and reduce expenses in both Europe and North America. During the second quarter of fiscal 2014, the Company expanded these plans to include the consolidation and streamlining of certain operations in Europe and Asia. These actions resulted in restructuring charges of $12.4 million (or $9.0 million after considering a $3.4 million reduction to income tax as a result of the charges), or an unfavorable after-tax impact of $0.11 per share during fiscal 2014. Net earnings attributable to Guess?, Inc. for fiscal 2014 was $153.4 million, diluted earnings per common share for fiscal 2014 was $1.80 and the effective tax rate for fiscal 2014 was 32.3%. Excluding the impact of the restructuring charges and the related tax impacts, adjusted net earnings attributable to Guess?, Inc. for fiscal 2014 was $162.5 million, adjusted diluted earnings per common share for fiscal 2014 was $1.91 and the adjusted effective tax rate for fiscal 2014 was 32.1%.
43
The adjusted measures for fiscal 2013 exclude the impact of a tax settlement charge incurred during fiscal 2013. In January 2013, the Company settled a tax audit dispute in Italy, resulting in a charge of $12.8 million in the fourth quarter of fiscal 2013 in excess of amounts previously reserved, which was partially offset by unrelated tax benefits of $4.0 million, or a net impact of $0.10 per share. Net earnings attributable to Guess?, Inc. for fiscal 2013 was $178.7 million, diluted earnings per common share for fiscal 2013 was $2.05 and the effective tax rate for fiscal 2013 was 35.3%. Excluding the net impact of the tax settlement charge and the unrelated tax benefits, adjusted net earnings attributable to Guess?, Inc. for fiscal 2013 was $187.5 million, adjusted diluted earnings per common share for fiscal 2013 was $2.15 and the adjusted effective tax rate for fiscal 2013 was 32.2%.
The adjusted measures for fiscal 2012 exclude the impact of a settlement charge incurred during fiscal 2012. Near the end of the second quarter of fiscal 2012, the Company experienced a temporary disruption with a former third party logistics provider in Europe. Following this disruption in service, the Company entered into a settlement agreement with this service provider to facilitate a transition to a new service provider, resulting in a pre-tax settlement charge of $19.5 million (or $17.6 million after considering a $1.9 million reduction to income tax as a result of the charge), or $0.19 per share, in fiscal 2012 related to amounts paid in connection with this agreement. Net earnings attributable to Guess?, Inc. for fiscal 2012 was $265.5 million, diluted earnings per common share for fiscal 2012 was $2.86 and the effective tax rate for fiscal 2012 was 32.2%. Excluding the impact of the settlement charge and the related tax impact, adjusted net earnings attributable to Guess?, Inc. for fiscal 2012 was $283.1 million, adjusted diluted earnings per common share for fiscal 2012 was $3.05 and the adjusted effective tax rate for fiscal 2012 was 31.2%.
Our discussion and analysis herein also includes certain constant currency financial information. Foreign currency exchange rate fluctuations affect the amount reported from translating the Company’s foreign revenues and expenses into U.S. dollars. These rate fluctuations can have a significant effect on reported operating results under GAAP. The Company provides constant currency information to enhance the visibility of underlying business trends, excluding the effects of changes in foreign currency translation rates. To calculate revenues and earnings from operations on a constant currency basis, operating results for the current-year period are translated into U.S. dollars at the average exchange rates in effect during the comparable period of the prior year. The constant currency calculations do not adjust for the impact of revaluing specific transactions denominated in a currency that is different to the functional currency of that entity when exchange rates fluctuate. The constant currency information presented may not be comparable to similarly titled measures reported by other companies.
Liquidity and Capital ResourcesWe need liquidity primarily to fund our working capital, the expansion and remodeling of our retail stores,
shop-in-shop programs, concessions, systems, infrastructure, other existing operations, international growth, potential acquisitions, potential share repurchases and payment of dividends to our stockholders. During the fiscal year ended February 1, 2014, the Company relied primarily on trade credit, available cash, real estate leases, short-term lines of credit, and internally generated funds to finance our operations and expansion. The Company anticipates that we will be able to satisfy our ongoing cash requirements during the next twelve months for working capital, capital expenditures, interest and principal payments on our debt, potential acquisitions, potential share repurchases and any dividend payments to stockholders, primarily with cash flow from operations and existing cash balances supplemented by borrowings, as necessary, under our existing Credit Facility and bank facilities in Europe, as described below under “—Credit Facilities.”
As of February 1, 2014, the Company had cash and cash equivalents of $502.9 million and short-term investments of $5.1 million. Approximately 67% of the Company’s cash and cash equivalents were held outside of the U.S. As of February 1, 2014, we have not provided for U.S. federal and state income taxes on the undistributed earnings of our foreign subsidiaries, since such earnings are considered indefinitely reinvested outside the United States. If in the future we decide to repatriate such earnings, we would incur incremental U.S. federal and state income tax, reduced by allowable foreign tax credits. However, our intent is to keep these funds indefinitely reinvested outside of the United States and our current plans do not indicate a need to repatriate them to fund our U.S. operations. That portion of accumulated undistributed earnings of foreign subsidiaries as of February 1, 2014 and February 2, 2013 was approximately $747 million and $689 million, respectively. Due to

44
the complexities associated with the hypothetical calculation, including the availability of foreign tax credits, it is not practicable to determine the unrecognized deferred tax liability related to the undistributed earnings.
Excess cash and cash equivalents, which represent the majority of our outstanding cash and cash equivalents balance, are held primarily in overnight deposit and short-term time deposit accounts and four diversified money market funds. The money market funds are AAA rated by national credit rating agencies and are generally comprised of high-quality, liquid investments. Please see “Part I, Item 1A. Risk Factors” for a discussion of risk factors which could reasonably be likely to result in a decrease of internally generated funds available to finance capital expenditures and working capital requirements.
The Company has presented below the cash flow performance comparison of the year ended February 1, 2014, versus the year ended February 2, 2013.Operating Activities
Net cash provided by operating activities was $327.9 million for the fiscal year ended February 1, 2014, compared to $268.9 million for the fiscal year ended February 2, 2013, or an increase of $59.0 million. The increase was driven primarily by the favorable impact of changes in working capital, partially offset by lower non-cash adjustments and lower net earnings for fiscal 2014 versus the prior year. The change in working capital was driven primarily by the favorable impact from timing of inventory receipts and payments to purchase inventory, the receipt of refundable multi-year value-added tax payments from European taxing authorities and the receipt of an upfront royalty payment from one of our licensees during fiscal 2014.Investing Activities
Net cash used in investing activities was $63.1 million for the fiscal year ended February 1, 2014, compared to $120.3 million for the fiscal year ended February 2, 2013. Cash used in investing activities related primarily to capital expenditures incurred on existing store remodeling programs in North America Retail, expansion of our retail business in Europe and new store openings in North America. In addition, purchases of investments or proceeds from the sale or maturity of investments, the settlement of forward currency contracts designated as hedging instruments and the cost of any business acquisitions are also included in cash flows used in investing activities.
The decrease in cash used in investing activities was driven primarily by a lower level of spending on new store expansion in North American Retail, lower investments in business acquisitions in our European business, timing of cash receipts from other assets and lower purchases of investments during the fiscal year ended February 1, 2014 compared to the prior year. During the fiscal year ended February 1, 2014, the Company opened 59 directly operated stores compared to 83 directly operated stores that were opened in the prior year. During the fiscal year ended February 1, 2014, we acquired ten additional stores from certain of our European licensees compared to 26 stores that were acquired from one of our European licensees in the prior year.Financing Activities
Net cash used in financing activities was $84.8 million for the fiscal year ended February 1, 2014, compared to $318.3 million for the fiscal year ended February 2, 2013. The decrease in net cash used in financing activities in fiscal 2014 compared to fiscal 2013 was due primarily to higher repurchases of shares of the Company’s common stock during fiscal 2013 and the payment of a special dividend in fiscal 2013 of $1.20 per common share. Effect of Exchange Rates on Cash
During the fiscal year ended February 1, 2014, changes in foreign currency translation rates decreased our reported cash and cash equivalents balance by $6.1 million. This compares to an increase of $6.9 million in cash and cash equivalents driven by changes in foreign currency translation rates during the fiscal year ended February 2, 2013.
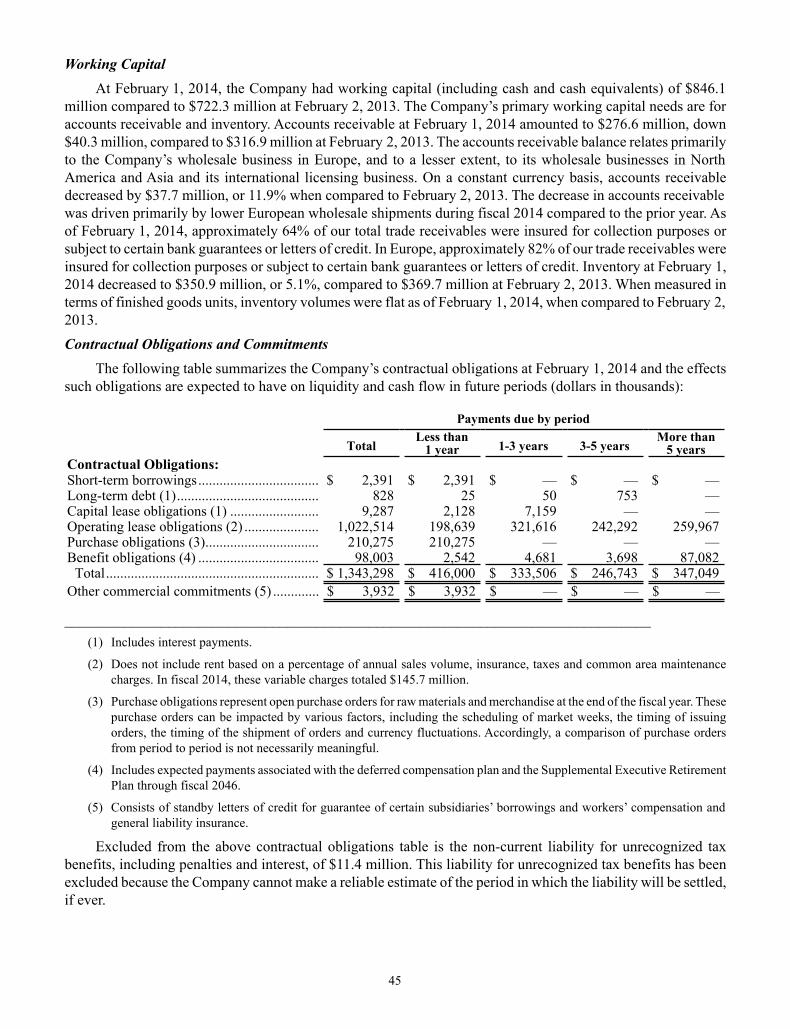
45
Working CapitalAt February 1, 2014, the Company had working capital (including cash and cash equivalents) of $846.1
million compared to $722.3 million at February 2, 2013. The Company’s primary working capital needs are for accounts receivable and inventory. Accounts receivable at February 1, 2014 amounted to $276.6 million, down $40.3 million, compared to $316.9 million at February 2, 2013. The accounts receivable balance relates primarily to the Company’s wholesale business in Europe, and to a lesser extent, to its wholesale businesses in North America and Asia and its international licensing business. On a constant currency basis, accounts receivable decreased by $37.7 million, or 11.9% when compared to February 2, 2013. The decrease in accounts receivable was driven primarily by lower European wholesale shipments during fiscal 2014 compared to the prior year. As of February 1, 2014, approximately 64% of our total trade receivables were insured for collection purposes or subject to certain bank guarantees or letters of credit. In Europe, approximately 82% of our trade receivables were insured for collection purposes or subject to certain bank guarantees or letters of credit. Inventory at February 1, 2014 decreased to $350.9 million, or 5.1%, compared to $369.7 million at February 2, 2013. When measured in terms of finished goods units, inventory volumes were flat as of February 1, 2014, when compared to February 2, 2013.Contractual Obligations and Commitments
The following table summarizes the Company’s contractual obligations at February 1, 2014 and the effects such obligations are expected to have on liquidity and cash flow in future periods (dollars in thousands):
Payments due by period
TotalLess than
1 year 1-3 years 3-5 yearsMore than
5 yearsContractual Obligations:Short-term borrowings.................................. $ 2,391 $ 2,391 $ — $ — $ —Long-term debt (1)........................................ 828 25 50 753 —Capital lease obligations (1) ......................... 9,287 2,128 7,159 — —Operating lease obligations (2) ..................... 1,022,514 198,639 321,616 242,292 259,967Purchase obligations (3)................................ 210,275 210,275 — — —Benefit obligations (4) .................................. 98,003 2,542 4,681 3,698 87,082
Total............................................................ $ 1,343,298 $ 416,000 $ 333,506 $ 246,743 $ 347,049Other commercial commitments (5) ............. $ 3,932 $ 3,932 $ — $ — $ —
_______________________________________________________________________________(1) Includes interest payments.
(2) Does not include rent based on a percentage of annual sales volume, insurance, taxes and common area maintenance charges. In fiscal 2014, these variable charges totaled $145.7 million.
(3) Purchase obligations represent open purchase orders for raw materials and merchandise at the end of the fiscal year. These purchase orders can be impacted by various factors, including the scheduling of market weeks, the timing of issuing orders, the timing of the shipment of orders and currency fluctuations. Accordingly, a comparison of purchase orders from period to period is not necessarily meaningful.
(4) Includes expected payments associated with the deferred compensation plan and the Supplemental Executive Retirement Plan through fiscal 2046.
(5) Consists of standby letters of credit for guarantee of certain subsidiaries’ borrowings and workers’ compensation and general liability insurance.
Excluded from the above contractual obligations table is the non-current liability for unrecognized tax benefits, including penalties and interest, of $11.4 million. This liability for unrecognized tax benefits has been excluded because the Company cannot make a reliable estimate of the period in which the liability will be settled, if ever.
46
Off-Balance Sheet ArrangementsOther than certain obligations and commitments included in the table above, we did not have any off-balance
sheet arrangements as of February 1, 2014.Dividends
During the first quarter of fiscal 2008, the Company announced the initiation of a quarterly cash dividend of $0.06 per share of the Company’s common stock. Since that time, the Company has continued to pay a quarterly cash dividend, which has subsequently increased to $0.225 per common share.
During the fourth quarter of fiscal 2013, the Company paid a special cash dividend of $1.20 per share of the Company’s common stock, totaling approximately $102 million, and a regular quarterly cash dividend of $0.20 per share. For the years ended February 1, 2014, February 2, 2013 and January 28, 2012, the Company paid dividends of $68.2 million, $172.8 million and $74.4 million, respectively.
On March 19, 2014, the Company announced a 12.5% increase in its quarterly cash dividend for the first quarter of fiscal 2015, to $0.225 per share. The cash dividend will be paid on April 18, 2014 to shareholders of record as of the close of business on April 2, 2014.
The payment of cash dividends in the future will be at the discretion of our Board of Directors and will be based upon a number of business, legal and other considerations, including our cash flow from operations, capital expenditures, debt service requirements, cash paid for income taxes, earnings, share repurchases, economic conditions and liquidity.Capital Expenditures
Gross capital expenditures totaled $75.4 million, before deducting lease incentives of $4.1 million, for the fiscal year ended February 1, 2014. This compares to gross capital expenditures of $99.6 million, before deducting lease incentives of $10.9 million, for the fiscal year ended February 2, 2013. The Company’s investments in capital for the full fiscal year 2015 are planned between $75 million and $85 million (after deducting estimated lease incentives of approximately $5 million). The planned investments in capital are primarily for store remodeling programs in North American Retail, new store openings in North America and expansion of our retail business in Europe.
In addition, we periodically evaluate strategic acquisitions and alliances and pursue those that we believe will support and contribute to our overall growth initiatives.Credit Facilities
On July 6, 2011, the Company entered into a five-year senior secured revolving credit facility with JPMorgan Chase Bank, N.A., Bank of America, N.A. and the other lenders party thereto (the “Credit Facility”) which provided for a $200 million revolving multicurrency line of credit. The Credit Facility is available for direct borrowings and the issuance of letters of credit, subject to certain letters of credit sublimits. It may be used for working capital and other general corporate purposes.
On August 31, 2012, the Company increased its borrowing capacity under the Credit Facility from $200 million to $300 million by exercising the accordion feature in the Credit Facility pursuant to a Lender Joinder Agreement with the lenders party thereto. Also on August 31, 2012, the Company entered into an Amendment to the Credit Facility with the lenders party thereto to provide for (i) greater flexibility in certain of the Company’s covenants under the Credit Facility and (ii) access to a new $100 million accordion feature, subject to certain conditions and the willingness of existing or new lenders to assume such increased amount.
All obligations under the Credit Facility are unconditionally guaranteed by certain of the Company’s domestic subsidiaries and are secured by substantially all of the personal assets of the Company and such domestic subsidiaries, including a pledge of 65% of the equity interests of certain of the Company’s foreign subsidiaries.
Direct borrowings under the Credit Facility will be made, at the Company’s option, as (a) Eurodollar Rate Loans, which shall bear interest at the published LIBOR rate for the respective interest period plus an applicable margin (varying from 1.15% to 1.65%) based on the Company’s leverage ratio at the time, or (b) Base Rate Loans,

47
which shall bear interest at the higher of (i) 0.50% in excess of the federal funds rate, (ii) the rate of interest as announced by JP Morgan as its “prime rate,” or (iii) 1.0% in excess of the one month adjusted LIBOR rate, plus an applicable margin (varying from 0.15% to 0.65%) based on the Company’s leverage ratio at the time. The Company is also obligated to pay certain commitment, letter of credit and other fees customary for a credit facility of this size and type. At February 1, 2014, the Company had $3.9 million in outstanding standby letters of credit, no outstanding documentary letters of credit and no outstanding borrowings under the Credit Facility.
The Credit Facility requires the Company to comply with a leverage ratio and a fixed charge coverage ratio. In addition, the Credit Facility contains customary covenants, including covenants that limit or restrict the Company and its subsidiaries’ ability to: incur liens, incur indebtedness, make investments, dispose of assets, make certain restricted payments, merge or consolidate and enter into certain transactions with affiliates. The Credit Facility also limits the Company’s ability to pay dividends unless immediately after giving effect thereto the aggregate amount of unrestricted cash and cash equivalents held by Guess?, Inc. and its domestic subsidiaries is at least $50 million. The Company may need to borrow against this facility periodically to ensure it will continue to meet the requirements of this covenant. Upon the occurrence of an event of default under the Credit Facility, the lenders may cease making loans, terminate the Credit Facility and declare all amounts outstanding to be immediately due and payable. The Credit Facility specifies a number of events of default (some of which are subject to applicable grace or cure periods), including, among other things, non-payment defaults, covenant defaults, cross-defaults to other material indebtedness, bankruptcy and insolvency defaults and material judgment defaults. The Credit Facility allows for both secured and unsecured borrowings outside of the Credit Facility up to specified amounts.
The Company, through its European subsidiaries, maintains short-term uncommitted borrowing agreements, primarily for working capital purposes, with various banks in Europe. The majority of the borrowings under these agreements are secured by specific accounts receivable balances. Based on the applicable accounts receivable balances at February 1, 2014, the Company could have borrowed up to $143.6 million under these agreements. At February 1, 2014, the Company had no outstanding borrowings and $0.5 million in outstanding documentary letters of credit under these agreements. The agreements are denominated primarily in euros and provide for annual interest rates ranging from 0.5% to 3.1%. The maturities of any short-term borrowings under these agreements are generally linked to the credit terms of the underlying accounts receivable that secure the borrowings. With the exception of one facility for up to $47.2 million that has a minimum net equity requirement, there are no other financial ratio covenants.
The Company entered into a capital lease in December 2005 for a new building in Florence, Italy. At February 1, 2014, the capital lease obligation was $8.6 million. The Company entered into a separate interest rate swap agreement designated as a non-hedging instrument that resulted in a swap fixed rate of 3.55%. This interest rate swap agreement matures in 2016 and converts the nature of the capital lease obligation from Euribor floating-rate debt to fixed-rate debt. The fair value of the interest rate swap liability at February 1, 2014 was approximately $0.6 million.
From time-to-time, the Company will obtain other financing in foreign countries for working capital to finance its local operations. Share Repurchases
On March 14, 2011, the Company’s Board of Directors authorized a program to repurchase, from time-to-time and as market and business conditions warrant, up to $250 million of the Company’s common stock (the “2011 Share Repurchase Program”). On June 26, 2012, the Company’s Board of Directors authorized a new program to repurchase, from time-to-time and as market and business conditions warrant, up to $500 million of the Company’s common stock (the “2012 Share Repurchase Program”). The 2012 Share Repurchase Program was in addition to the 2011 Share Repurchase Program. Repurchases under programs may be made on the open market or in privately negotiated transactions, pursuant to Rule 10b5-1 trading plans or other available means. There is no minimum or maximum number of shares to be repurchased under programs and programs may be discontinued at any time, without prior notice. During fiscal 2014, the Company repurchased 882,551 shares under the 2011 and 2012 Share Repurchase Programs at an aggregate cost of $22.1 million. During fiscal 2013,

48
the Company repurchased 5,036,418 shares under the 2011 Share Repurchase Program at an aggregate cost of $140.1 million. There were no share repurchases under the 2012 Share Repurchase Program during fiscal 2013. During fiscal 2012, the Company repurchased 3,216,514 shares under the 2011 Share Repurchase Program at an aggregate cost of $92.0 million. At February 1, 2014, the Company had remaining authority under the 2012 Share Repurchase Program to purchase $495.8 million of its common stock and no remaining authority to purchase shares under the 2011 Share Repurchase Program. OtherSupplemental Executive Retirement Plan
On August 23, 2005, the Board of Directors of the Company adopted a Supplemental Executive Retirement Plan (“SERP”) which became effective January 1, 2006. The SERP provides select employees who satisfy certain eligibility requirements with certain benefits upon retirement, termination of employment, death, disability or a change in control of the Company, in certain prescribed circumstances. Paul Marciano, Chief Executive Officer and Vice Chairman of the Board, is the only active employee participating in the SERP.
As a non-qualified pension plan, no dedicated funding of the SERP is required; however, the Company has made, and expects to continue to make, periodic payments into insurance policies held in a rabbi trust to fund the expected obligations arising under the non-qualified SERP. The amount of future payments into the insurance policies may vary, depending on any changes to the estimates of final annual compensation levels and investment performance of the trust. The cash surrender values of the insurance policies were $51.4 million and $47.9 million as of February 1, 2014 and February 2, 2013, respectively, and were included in other assets in the Company’s consolidated balance sheets. As a result of changes in the value of the insurance policy investments, the Company recorded unrealized gains (losses) of $3.6 million, $3.4 million and ($0.2) million in other income and expense during fiscal 2014, fiscal 2013 and fiscal 2012, respectively. Employee Stock Purchase Plan
In January 2002, the Company established a qualified employee stock purchase plan (“ESPP”), the terms of which allow for qualified employees (as defined) to participate in the purchase of designated shares of the Company’s common stock at a price equal to 85% of the lower of the closing price at the beginning or end of each quarterly stock purchase period. On January 23, 2002, the Company filed with the SEC a Registration Statement on Form S-8 registering 4,000,000 shares of common stock for the ESPP. Effective March 12, 2012, the ESPP was amended and restated to extend the term for an additional ten years. During the year ended February 1, 2014, 43,265 shares of the Company’s common stock were issued pursuant to the ESPP at an average price of $22.64 per share for a total of $1.0 million.
Inflation
The Company does not believe that inflation trends in the U.S. and internationally over the last three years have had a significant effect on net revenue or profitability.
SeasonalityThe Company’s business is impacted by the general seasonal trends characteristic of the apparel and retail
industries. The U.S., European and Canadian retail operations are generally stronger during the second half of the fiscal year, and the North American wholesale operations generally experience stronger performance from July through November. The European wholesale businesses operate with two primary selling seasons: the Spring/Summer season, which ships from November to April and the Fall/Winter season, which ships from May to October. The Company’s goal in the European wholesale business is to take advantage of early-season demand and potential reorders by offering a pre-collection assortment which ships at the beginning of each season. Customers retain the ability to request early shipment of backlog orders or delay shipment of orders depending on their needs.

49
Critical Accounting Policies and EstimatesThe Consolidated Financial Statements are prepared in conformity with accounting principles generally
accepted in the U.S., which require management to make estimates and assumptions that affect the reported amounts of the assets and liabilities and disclosures of contingent assets and liabilities as of the date of the financial statements and the reported amounts of revenue and expenses during the reporting period. Management bases its estimates and judgments on its historical experience and other relevant factors, the results of which form the basis for making judgments about the carrying values of assets and liabilities that are not readily apparent from other sources. Management evaluates its estimates and judgments on an ongoing basis including those related to the accounts receivable allowances, sales return allowances, gift card and loyalty accruals, valuation of inventories, share-based compensation, recoverability of deferred taxes, unrecognized tax benefits, the useful life of assets for depreciation, evaluation of asset impairment, pension obligations, workers compensation and medical self-insurance expense and accruals, litigation reserves and restructuring expense and accruals.
The Company believes that the following significant accounting policies involve a higher degree of judgment and complexity. In addition to the accounting policies mentioned below, see Note 1 to the Consolidated Financial Statements for other significant accounting policies.
Accounts Receivable ReservesIn the normal course of business, the Company grants credit directly to certain wholesale customers after a
credit analysis is performed based on financial and other criteria. Accounts receivable are recorded net of an allowance for doubtful accounts. The Company maintains allowances for doubtful accounts for estimated losses that result from the inability of its wholesale customers to make their required payments. The Company bases its allowances on analysis of the aging of accounts receivable at the date of the financial statements, assessments of historical collection trends, an evaluation of the impact of current economic conditions and whether the Company has obtained credit insurance or other guarantees.
Costs associated with customer markdowns are recorded as a reduction to revenues, and any unapplied amounts are included in the allowance for accounts receivable. Historically, these markdown allowances resulted from seasonal negotiations with the Company’s wholesale customers, as well as historical trends and the evaluation of the impact of economic conditions.
Sales Returns ReservesThe Company accrues for estimated sales returns in the period in which the related revenue is recognized.
To recognize the financial impact of sales returns, the Company estimates the amount of goods that will be returned based on historical experience and reduces sales and cost of sales accordingly. The Company’s policy allows retail customers in certain regions a grace period to return merchandise following the date of sale. Substantially all of these returns are considered to be resalable at a price that exceeds the cost of the merchandise.
Gift Card BreakageGift card breakage is income recognized due to the non-redemption of a portion of gift cards sold by the
Company for which a liability was recorded in prior periods. Gifts cards are not utilized outside the U.S. and Canada. The Company issues gift cards through one of its subsidiaries and is not required by law to escheat the value of unredeemed gift cards to the state in which the subsidiary is domiciled. Estimated breakage amounts are accounted for under the redemption recognition method and are classified as additional net revenues as the gift cards are redeemed. The Company determined a gift card breakage rate based upon historical redemption patterns, which represented the cumulative estimated amount of gift card breakage from the inception of the electronic gift card program in late 2002. Any future revisions to the estimated breakage rate may result in changes in the amount of breakage income recognized in future periods. See Note 1 to the Consolidated Financial Statements for further information regarding the recognition of gift card breakage.
Loyalty ProgramsThe Company launched customer loyalty programs for its GUESS? factory outlet, G by GUESS, GUESS?,
and MARCIANO stores in March 2013, July 2009, August 2008 and September 2007, respectively. The GUESS?

50
and MARCIANO loyalty programs were merged in May 2009. Under the programs, customers accumulate points based on purchase activity. Once a loyalty program member achieves a certain point level, the member earns awards that may only be redeemed for merchandise. In all of the programs, unredeemed points generally expire after six months without additional purchase activity and unredeemed awards generally expire after two months. The Company uses historical redemption rates to estimate the value of future award redemptions which are accrued in current liabilities and recorded as a reduction of net revenue in the period which the related revenue is recognized. The aggregate dollar value of the loyalty program accruals included in accrued expenses was $4.2 million and $2.9 million at February 1, 2014 and February 2, 2013, respectively. Future revisions to the estimated liability may result in changes to net revenue.
Inventory ReservesInventories are valued at the lower of cost (primarily weighted average method) or market. The Company
continually evaluates its inventories by assessing slow moving product as well as prior seasons’ inventory. Market value of aged inventory is estimated based on historical sales trends for each product line category, the impact of market trends, an evaluation of economic conditions, available liquidation channels and the value of current orders relating to the future sales of this type of inventory. The Company closely monitors off-price sales to ensure the actual results closely match initial estimates. Estimates are regularly updated based upon this continuing review.
Share-Based CompensationThe Company recognizes compensation expense for all share-based awards granted based on the grant date
fair value. The fair value of each stock option is estimated on the grant date using the Black-Scholes option-pricing model and involves several assumptions, including the risk-free interest rate, expected volatility, dividend yield, expected life and forfeiture rate. The risk-free interest rate is based on the U.S. Treasury yield curve in effect for the expected term of the option at the time of grant. The expected volatility is determined based on an average of both historical volatility and implied volatility. Implied volatility is derived from exchange traded options on the Company’s common stock. The expected dividend yield is based on the Company’s history and expectations of dividend payouts. The expected life is determined based on historical trends. The expected forfeiture rate is determined based on historical data. Compensation expense for nonvested stock options and stock awards is recognized on a straight-line basis over the vesting period.
In addition, the Company has granted certain nonvested stock awards/units and stock options in the past that require the recipient to achieve certain minimum performance targets in order for these awards to vest. If the minimum performance targets have not been achieved or are not expected to be achieved, no expense is recognized during the period.
Hedge AccountingThe Company operates in foreign countries, which exposes it to market risk associated with foreign currency
exchange rate fluctuations. The Company has entered into certain forward contracts to hedge the risk of foreign currency rate fluctuations. The Company has elected to apply the hedge accounting rules in accordance with authoritative guidance for certain of these hedges.
The Company’s primary objective is to hedge the variability in forecasted cash flows due to the foreign currency risk. Various transactions that occur primarily in Canada, Europe and South Korea are denominated in U.S. dollars and British pounds and thus are exposed to earnings risk as a result of exchange rate fluctuations when converted to their functional currencies. These types of transactions include U.S. dollar denominated purchases of merchandise and U.S. dollar and British pound denominated intercompany liabilities. In addition, certain operating expenses and tax liabilities are denominated in Swiss francs and are exposed to earnings risk as a result of exchange rate fluctuations when converted to the functional currency. The Company enters into derivative financial instruments, including forward exchange contracts, to offset some but not all of the exchange risk on certain of these anticipated foreign currency transactions. Changes in the fair value of forward contracts designated as cash flow hedges are recorded as a component of accumulated other comprehensive income (loss) within stockholders’ equity and are recognized in cost of product sales or other income and expenses in the period
51
which approximates the time the hedged merchandise inventory is sold or the hedged intercompany liability is incurred.
Periodically, the Company may also use foreign currency forward contracts to hedge the translation and economic exposures related to its net investments in certain of its international subsidiaries. Changes in the fair value of these U.S. dollar forward contracts, designated as net investment hedges, are recorded in foreign currency translation adjustment as a component of accumulated other comprehensive income (loss) within stockholders’ equity and are not recognized in income until the sale or liquidation of the hedged net investment.
The Company also has foreign currency contracts that are not designated as hedging instruments for accounting purposes. Changes in fair value of foreign currency contracts not qualifying as cash flow hedges or net investment hedges are reported in net earnings as part of other income and expense.
Income TaxesThe Company adopted authoritative guidance which clarifies the accounting for uncertainty in income taxes
recognized in an enterprise’s financial statements and prescribes a recognition threshold and measurement attribute for the financial statement recognition and measurement of a tax position taken or expected to be taken in a tax return. For those benefits to be recognized, a tax position must be more likely than not to be sustained upon examination by taxing authorities. Guidance was also provided on derecognition, classification, interest and penalties, accounting in interim periods, disclosure and transition. The Company’s continuing practice is to recognize interest and penalties related to income tax matters in income tax expense. As required under applicable accounting rules, the Company accrues an amount for its estimate of additional income tax liability which the Company, more likely than not, could incur as a result of the ultimate resolution of income tax audits (“uncertain tax positions”). The Company reviews and updates the estimates used in the accrual for uncertain tax positions as more definitive information becomes available from taxing authorities, upon completion of tax audits, upon expiration of statutes of limitation, or upon occurrence of other events. The results of operations and financial position for future periods could be impacted by changes in assumptions or resolutions of tax audits.
Deferred tax assets and liabilities are determined based on differences between financial reporting bases and tax bases of assets and liabilities and are measured using the enacted tax rates expected to apply to taxable income in the periods in which the deferred tax asset or liability is expected to be realized or settled. Deferred tax assets are reduced by valuation allowances if we believe it is more likely than not that some portion or the entire asset will not be realized. As all earnings from the Company’s wholly-owned foreign operations are permanently reinvested and not distributed, the Company’s income tax provision does not include additional U.S. taxes on foreign operations.
Valuation of Goodwill, Intangible and Other Long-Lived AssetsThe Company assesses the impairment of its long-lived assets (i.e., goodwill, intangible assets and property
and equipment), which requires the Company to make assumptions and judgments regarding the carrying value of these assets on an annual basis, or more frequently if events or changes in circumstances indicate that the assets might be impaired. For goodwill, determination of impairment is made at the reporting unit level which may be either an operating segment or one level below an operating segment if discrete financial information is available. Two or more reporting units may be aggregated for impairment testing if they have similar economic characteristics. The Company has identified its North American Retail and North American Wholesale segments and its European wholesale and European retail components of its Europe segment as separate reporting units for goodwill impairment testing since each have different economic characteristics. For long-lived assets (other than goodwill), the Company considers each individual store as an asset group for impairment testing, which is the lowest level at which individual cash flows can be identified. The asset group includes store leasehold improvements, furniture, fixtures and equipment, computer hardware and software and certain long-term security deposits and lease acquisition costs. The Company reviews retail stores for impairment risk once the locations have been opened for at least one year, or sooner as changes in circumstances require. The Company believes that waiting one year allows a store to reach a maturity level where a more comprehensive analysis of financial performance can be performed.

52
An asset is considered to be impaired if the Company determines that the carrying value may not be recoverable based upon its assessment of the asset’s ability to continue to generate income from operations and positive cash flow in future periods or if significant changes in the Company’s strategic business objectives and utilization of the assets occurred. If the assets (other than goodwill) are assessed to be recoverable, they are depreciated or amortized over the periods benefited. If the assets are considered to be impaired, an impairment charge is recognized representing the amount by which the carrying value of the assets exceeds the fair value of those assets. Fair value is determined based upon the discounted cash flows derived from the underlying asset. The Company uses various assumptions in determining current fair market value of these assets, including future expected cash flows and discount rates. Future expected cash flows for store assets are based on management’s estimates of future cash flows over the remaining lease period or expected life, if shorter. The Company considers historical trends, expected future business trends and other factors when estimating each store’s future cash flow. The Company also considers factors such as: the local environment for each store location, including mall traffic and competition; the Company’s ability to successfully implement strategic initiatives; and the ability to control variable costs such as cost of sales and payroll, and in some cases, renegotiate lease costs. If actual results are not consistent with the assumptions and judgments used in estimating future cash flows and asset fair values, there may be additional exposure to future impairment losses that could be material to the Company’s results of operations. See Notes 1 and 5 to the Consolidated Financial Statements for further discussion.
Pension Benefit Plan Actuarial AssumptionsThe Company’s pension obligations and related costs are calculated using actuarial concepts, within the
authoritative guidance framework. The life expectancy, estimated retirement age, discount rate and estimated future compensation are important elements of expense and/or liability measurement. We evaluate these critical assumptions annually which enables us to state expected future payments for benefits as a present value on the measurement date. Refer to Note 12 to the Consolidated Financial Statements for Supplemental Executive Retirement Plan related information.
Litigation ReservesEstimated amounts for claims that are probable and can be reasonably estimated are recorded as liabilities
in the consolidated balance sheets. The likelihood of a material change in these estimated reserves would be dependent on new claims as they may arise and the expected probable favorable or unfavorable outcome of each claim. As additional information becomes available, the Company assesses the potential liability related to new claims and existing claims and revises estimates as appropriate. As new claims arise or existing claims evolve, such revisions in estimates of the potential liability could materially impact the results of operations and financial position.
Recently Issued Accounting Guidance In July 2013, the Financial Accounting Standards Board (“FASB”) issued authoritative guidance which
requires that an unrecognized tax benefit be presented in the financial statements as a reduction to a deferred tax asset for a net operating loss carryforward, a similar loss or a tax credit carryforward, if specific criteria are met. This guidance is effective for fiscal periods beginning after December 15, 2013. The adoption of this guidance is not expected to have a material impact on the Company’s consolidated financial statements.
ITEM 7A. Quantitative and Qualitative Disclosures About Market Risk.Exchange Rate Risk
More than half of product sales and licensing revenue recorded for the year ended February 1, 2014 were denominated in currencies other than the U.S. dollar. The Company’s primary exchange rate risk relates to operations in Europe, Canada and South Korea. Changes in currencies affect our earnings in various ways. For further discussion on currency related risk, please refer to our risk factors under “Part I, Item 1A. Risk Factors.”
Various transactions that occur primarily in Canada, Europe and South Korea are denominated in U.S. dollars and British pounds and thus are exposed to earnings risk as a result of exchange rate fluctuations when converted
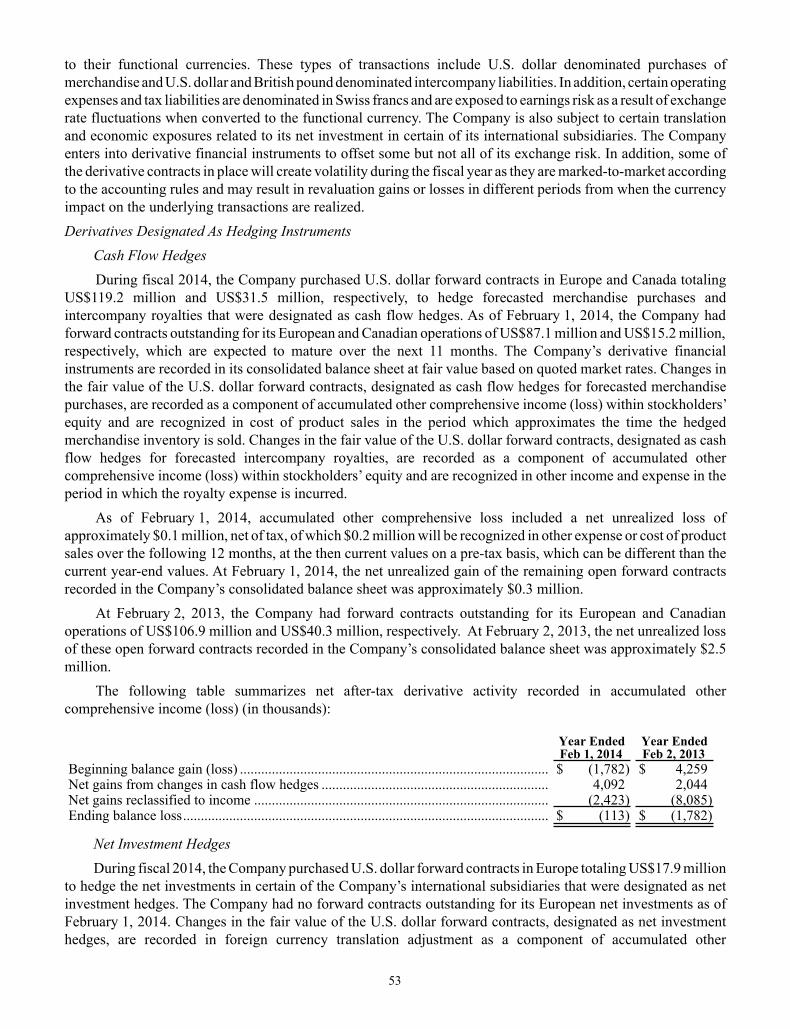
53
to their functional currencies. These types of transactions include U.S. dollar denominated purchases of merchandise and U.S. dollar and British pound denominated intercompany liabilities. In addition, certain operating expenses and tax liabilities are denominated in Swiss francs and are exposed to earnings risk as a result of exchange rate fluctuations when converted to the functional currency. The Company is also subject to certain translation and economic exposures related to its net investment in certain of its international subsidiaries. The Company enters into derivative financial instruments to offset some but not all of its exchange risk. In addition, some of the derivative contracts in place will create volatility during the fiscal year as they are marked-to-market according to the accounting rules and may result in revaluation gains or losses in different periods from when the currency impact on the underlying transactions are realized.Derivatives Designated As Hedging Instruments
Cash Flow HedgesDuring fiscal 2014, the Company purchased U.S. dollar forward contracts in Europe and Canada totaling
US$119.2 million and US$31.5 million, respectively, to hedge forecasted merchandise purchases and intercompany royalties that were designated as cash flow hedges. As of February 1, 2014, the Company had forward contracts outstanding for its European and Canadian operations of US$87.1 million and US$15.2 million, respectively, which are expected to mature over the next 11 months. The Company’s derivative financial instruments are recorded in its consolidated balance sheet at fair value based on quoted market rates. Changes in the fair value of the U.S. dollar forward contracts, designated as cash flow hedges for forecasted merchandise purchases, are recorded as a component of accumulated other comprehensive income (loss) within stockholders’ equity and are recognized in cost of product sales in the period which approximates the time the hedged merchandise inventory is sold. Changes in the fair value of the U.S. dollar forward contracts, designated as cash flow hedges for forecasted intercompany royalties, are recorded as a component of accumulated other comprehensive income (loss) within stockholders’ equity and are recognized in other income and expense in the period in which the royalty expense is incurred.
As of February 1, 2014, accumulated other comprehensive loss included a net unrealized loss of approximately $0.1 million, net of tax, of which $0.2 million will be recognized in other expense or cost of product sales over the following 12 months, at the then current values on a pre-tax basis, which can be different than the current year-end values. At February 1, 2014, the net unrealized gain of the remaining open forward contracts recorded in the Company’s consolidated balance sheet was approximately $0.3 million.
At February 2, 2013, the Company had forward contracts outstanding for its European and Canadian operations of US$106.9 million and US$40.3 million, respectively. At February 2, 2013, the net unrealized loss of these open forward contracts recorded in the Company’s consolidated balance sheet was approximately $2.5 million.
The following table summarizes net after-tax derivative activity recorded in accumulated other comprehensive income (loss) (in thousands):
Year EndedFeb 1, 2014
Year EndedFeb 2, 2013
Beginning balance gain (loss) ....................................................................................... $ (1,782) $ 4,259Net gains from changes in cash flow hedges ................................................................ 4,092 2,044Net gains reclassified to income ................................................................................... (2,423) (8,085)Ending balance loss....................................................................................................... $ (113) $ (1,782)
Net Investment Hedges During fiscal 2014, the Company purchased U.S. dollar forward contracts in Europe totaling US$17.9 million
to hedge the net investments in certain of the Company’s international subsidiaries that were designated as net investment hedges. The Company had no forward contracts outstanding for its European net investments as of February 1, 2014. Changes in the fair value of the U.S. dollar forward contracts, designated as net investment hedges, are recorded in foreign currency translation adjustment as a component of accumulated other

54
comprehensive income (loss) within stockholders’ equity and are not recognized in income until the sale or liquidation of the hedged net investment.
The Company recognized gains, net of tax, of $0.2 million in the foreign currency translation adjustment component of accumulated other comprehensive income (loss) during fiscal 2014.
There were no forward contracts that were designated as net investment hedges during fiscal 2013. Derivatives Not Designated As Hedging Instruments
The Company also has foreign currency contracts that are not designated as hedging instruments for accounting purposes. Changes in fair value of foreign currency contracts not qualifying as cash flow hedges or net investment hedges are reported in net earnings as part of other income and expense. For the year ended February 1, 2014, the Company recorded a net gain of $1.8 million for its Canadian dollar, euro and British pound foreign currency contracts not designated as hedges, which has been included in other income. As of February 1, 2014, the Company had euro foreign currency contracts to purchase US$111.8 million expected to mature over the next 11 months and Canadian dollar foreign currency contracts to purchase US$13.8 million expected to mature over the next three months. At February 1, 2014, the net unrealized gain of these open forward contracts recorded in the Company’s consolidated balance sheet was approximately $0.1 million.
As of February 2, 2013, the Company had euro foreign currency contracts to purchase US$90.2 million, Canadian dollar foreign currency contracts to purchase US$39.7 million and GBP£4.7 million of foreign currency contracts to purchase euros. At February 2, 2013, the net unrealized loss of these open forward contracts recorded in the Company’s consolidated balance sheet was approximately $1.7 million.Sensitivity Analysis
At February 1, 2014, a sensitivity analysis of changes in the foreign currencies when measured against the U.S. dollar indicates that, if the U.S. dollar had uniformly weakened by 10% against all of the U.S. dollar denominated foreign exchange derivatives totaling US$227.9 million, the fair value of the instruments would have decreased by $25.3 million. Conversely, if the U.S. dollar uniformly strengthened by 10% against all of the U.S. dollar denominated foreign exchange derivatives, the fair value of these instruments would have increased by $20.7 million. Any resulting changes in the fair value of the hedged instruments may be partially offset by changes in the fair value of certain balance sheet positions (primarily U.S. dollar denominated liabilities in our foreign operations) impacted by the change in the foreign currency rate. The ability to reduce the exposure of currencies on earnings depends on the magnitude of the derivatives compared to the balance sheet positions during each reporting cycle.Interest Rate Risk
At February 1, 2014, approximately 74% of the Company’s total indebtedness related to a capital lease obligation, which is covered by a separate interest rate swap agreement with a swap fixed interest rate of 3.55% that matures in 2016. Changes in the related interest rate that result in an unrealized gain or loss on the fair value of the swap are reported in other income or expense. The change in the unrealized fair value of the interest swap increased other income, net by $0.2 million during fiscal year 2014. The majority of the Company’s remaining indebtedness is at variable rates of interest. Accordingly, changes in interest rates would impact the Company’s results of operations in future periods. A 100 basis point increase in interest rates would have had an insignificant effect on interest expense for the year ended February 1, 2014.
The fair value of the Company’s debt instruments are based on the amount of future cash flows associated with each instrument discounted using the Company’s incremental borrowing rate. At February 1, 2014 and February 2, 2013, the carrying value of all financial instruments was not materially different from fair value, as the interest rate on the Company’s debt approximates rates currently available to the Company.
ITEM 8. Financial Statements and Supplementary Data.The information required by this Item is incorporated herein by reference to the Consolidated Financial
Statements and Supplementary Data listed in “Item 15” of Part IV of this report.

55
ITEM 9. Changes in and Disagreements With Accountants on Accounting and Financial Disclosure.None.
ITEM 9A. Controls and Procedures.Conclusion Regarding the Effectiveness of Disclosure Controls and Procedures
Under the supervision and with the participation of our management, including our principal executive officer and principal financial officer, we conducted an evaluation of our disclosure controls and procedures, as such term is defined under Rule 13a-15(e) and 15d-15(e) promulgated under the Securities Exchange Act of 1934, as amended (the “Exchange Act”). Based on this evaluation, our principal executive officer and our principal financial officer concluded that our disclosure controls and procedures were effective as of the end of the period covered by this annual report.Management’s Report on Internal Control Over Financial Reporting
The SEC, as directed by Section 404 of the Sarbanes-Oxley Act of 2002, adopted rules which require the Company to include in its Annual Reports on Form 10-K, an assessment by management of the effectiveness of the Company’s internal control over financial reporting as defined in Rule 13a-15(f) under the Exchange Act. In addition, the Company’s independent auditors must attest to and report on the effectiveness of the Company’s internal control over financial reporting.
Management of the Company is responsible for establishing and maintaining adequate internal control over financial reporting as defined in Rule 13a-15(f) under the Exchange Act. The Company’s internal control over financial reporting is designed to provide reasonable assurance to the Company’s management and Board of Directors regarding the preparation and fair presentation of published financial statements.
Because of its inherent limitations, internal control over financial reporting may not prevent or detect all misstatements. Therefore, even those systems determined to be effective can provide only reasonable assurance with respect to financial statement preparation and presentation.
The Company’s management carried out an evaluation, under the supervision and with the participation of the Company’s principal executive officer and principal financial officer, of the effectiveness of the Company’s internal control over financial reporting based on the framework in Internal Control—Integrated Framework issued by the Committee of Sponsoring Organizations of the Treadway Commission (1992 Framework). Based upon this evaluation, under the framework in Internal Control—Integrated Framework, our management concluded that our internal control over financial reporting was effective as of February 1, 2014.
Ernst & Young LLP, the independent registered public accounting firm that audited the Company’s financial statements as of and for the fiscal year ended February 1, 2014 included in this Annual Report on Form 10-K has issued an attestation report on the Company’s internal control over financial reporting, which is set forth below.Changes in Internal Control Over Financial Reporting
There has been no change in our internal control over financial reporting during the fourth quarter of fiscal 2014 that has materially affected, or is reasonably likely to materially affect, our internal control over financial reporting.
56
REPORT OF INDEPENDENT REGISTERED PUBLIC ACCOUNTING FIRM
The Board of Directors and Stockholders of Guess?, Inc. and subsidiaries
We have audited Guess?, Inc. and subsidiaries’ internal control over financial reporting as of February 1, 2014, based on criteria established in Internal Control—Integrated Framework issued by the Committee of Sponsoring Organizations of the Treadway Commission (1992 framework) (the COSO criteria). Guess?, Inc. and subsidiaries’ management is responsible for maintaining effective internal control over financial reporting, and for its assessment of the effectiveness of internal control over financial reporting included in the accompanying Management’s Report on Internal Control Over Financial Reporting. Our responsibility is to express an opinion on the company’s internal control over financial reporting based on our audit.
We conducted our audit in accordance with the standards of the Public Company Accounting Oversight Board (United States). Those standards require that we plan and perform the audit to obtain reasonable assurance about whether effective internal control over financial reporting was maintained in all material respects. Our audit included obtaining an understanding of internal control over financial reporting, assessing the risk that a material weakness exists, testing and evaluating the design and operating effectiveness of internal control based on the assessed risk, and performing such other procedures as we considered necessary in the circumstances. We believe that our audit provides a reasonable basis for our opinion.
A company’s internal control over financial reporting is a process designed to provide reasonable assurance regarding the reliability of financial reporting and the preparation of financial statements for external purposes in accordance with generally accepted accounting principles. A company’s internal control over financial reporting includes those policies and procedures that (1) pertain to the maintenance of records that, in reasonable detail, accurately and fairly reflect the transactions and dispositions of the assets of the company; (2) provide reasonable assurance that transactions are recorded as necessary to permit preparation of financial statements in accordance with generally accepted accounting principles, and that receipts and expenditures of the company are being made only in accordance with authorizations of management and directors of the company; and (3) provide reasonable assurance regarding prevention or timely detection of unauthorized acquisition, use, or disposition of the company’s assets that could have a material effect on the financial statements.
Because of its inherent limitations, internal control over financial reporting may not prevent or detect misstatements. Also, projections of any evaluation of effectiveness to future periods are subject to the risk that controls may become inadequate because of changes in conditions, or that the degree of compliance with the policies or procedures may deteriorate.
In our opinion, Guess?, Inc. and subsidiaries maintained, in all material respects, effective internal control over financial reporting as of February 1, 2014, based on the COSO criteria.
We also have audited, in accordance with the standards of the Public Company Accounting Oversight Board (United States), the consolidated balance sheets of Guess?, Inc. and subsidiaries as of February 1, 2014 and February 2, 2013, and the related consolidated statements of income, comprehensive income, stockholders’ equity and cash flows for each of the three years in the period ended February 1, 2014 and our report dated March 28, 2014 expressed an unqualified opinion thereon.
/s/ ERNST & YOUNG LLP
Los Angeles, CaliforniaMarch 28, 2014
57
ITEM 9B. Other Information.None.
PART III
ITEM 10. Directors, Executive Officers and Corporate Governance.The information required by this item can be found under the captions “Directors and Executive Officers,”
“Corporate Governance and Board Matters,” and “Section 16(a) Beneficial Ownership Reporting Compliance” in the Company’s Proxy Statement (the “Proxy Statement”) to be filed with the Securities and Exchange Commission not later than 120 days after the end of our fiscal year and is incorporated herein by reference.
ITEM 11. Executive Compensation.The information required by this item can be found under the caption “Executive and Director
Compensation,” excluding the Compensation Committee Report on Executive Compensation, in the Proxy Statement and is incorporated herein by reference.
ITEM 12. Security Ownership of Certain Beneficial Owners and Management and Related Stockholder Matters.
The information required by this item can be found under the captions “Equity Compensation Plan Information” and “Security Ownership of Certain Beneficial Owners and Management” in the Proxy Statement and is incorporated herein by reference.
ITEM 13. Certain Relationships and Related Transactions, and Director Independence.The information required by this item can be found under the captions “Certain Relationships and Related
Transactions” and “Corporate Governance and Board Matters—Board Independence, Structure and Committee Composition” in the Proxy Statement and is incorporated herein by reference.
ITEM 14. Principal Accountant Fees and Services.The information required by this item can be found under the caption “Relationship with Independent
Registered Public Accountant” in the Proxy Statement and is incorporated herein by reference.
58
PART IV
ITEM 15. Exhibits, Financial Statement Schedules.(a) Documents Filed with Report
(1) Consolidated Financial StatementsThe Report of Independent Registered Public Accounting Firm and financial statements listed on the accompanying Index to Consolidated Financial Statements and Financial Statement Schedule are filed as part of this report.
(2) Consolidated Financial Statement ScheduleThe financial statement schedule listed on the accompanying Index to Consolidated Financial Statements and Financial Statement Schedule is filed as part of this report.All other schedules for which provision is made in the applicable accounting regulations of the SEC are not required under the related instructions or are inapplicable and therefore have been omitted.
(3) ExhibitsThe exhibits listed on the accompanying Exhibit Index are filed or incorporated by reference as part of this report.

F-1
Guess?, Inc.Form 10-K
Index to Consolidated Financial Statements and Financial Statement Schedule
1 Report of Independent Registered Public Accounting Firm ................................................................ F-2
2 Consolidated Financial Statements
Consolidated Balance Sheets at February 1, 2014 and February 2, 2013 ................................... F-3
Consolidated Statements of Income for the Years Ended February 1, 2014, February 2, 2013 and January 28, 2012 ................................................................................................................... F-4
Consolidated Statements of Comprehensive Income for the Years Ended February 1, 2014, February 2, 2013 and January 28, 2012 ...................................................................................... F-5
Consolidated Statements of Stockholders’ Equity for the Years Ended February 1, 2014, February 2, 2013 and January 28, 2012 ...................................................................................... F-6
Consolidated Statements of Cash Flows for the Years Ended February 1, 2014, February 2, 2013 and January 28, 2012 .......................................................................................................... F-7
Notes to Consolidated Financial Statements ............................................................................... F-8
3 Consolidated Financial Statement Schedule—Valuation and Qualifying Accounts for the Years Ended February 1, 2014, February 2, 2013 and January 28, 2012 ...................................................... F-46
F-2
REPORT OF INDEPENDENT REGISTERED PUBLIC ACCOUNTING FIRM
The Board of Directors and Stockholders of Guess?, Inc.
We have audited the accompanying consolidated balance sheets of Guess?, Inc. and subsidiaries as of February 1, 2014 and February 2, 2013, and the related consolidated statements of income, comprehensive income, stockholders’ equity and cash flows for each of the three years in the period ended February 1, 2014. Our audits also included the financial statement schedule listed in the Index at ITEM 15(a)(2). These financial statements and schedule are the responsibility of the Company’s management. Our responsibility is to express an opinion on these financial statements and schedule based on our audits.
We conducted our audits in accordance with the standards of the Public Company Accounting Oversight Board (United States). Those standards require that we plan and perform the audit to obtain reasonable assurance about whether the financial statements are free of material misstatement. An audit includes examining, on a test basis, evidence supporting the amounts and disclosures in the financial statements. An audit also includes assessing the accounting principles used and significant estimates made by management, as well as evaluating the overall financial statement presentation. We believe that our audits provide a reasonable basis for our opinion.
In our opinion, the financial statements referred to above present fairly, in all material respects, the consolidated financial position of Guess?, Inc. and subsidiaries at February 1, 2014 and February 2, 2013, and the consolidated results of their operations and their cash flows for each of the three years in the period ended February 1, 2014, in conformity with U.S. generally accepted accounting principles. Also, in our opinion, the related financial statement schedule, when considered in relation to the consolidated financial statements taken as a whole, presents fairly in all material respects the information set forth therein.
We also have audited, in accordance with the standards of the Public Company Accounting Oversight Board (United States), Guess?, Inc.’s internal control over financial reporting as of February 1, 2014, based on criteria established in Internal Control—Integrated Framework issued by the Committee of Sponsoring Organizations of the Treadway Commission (1992 framework) and our report dated March 28, 2014 expressed an unqualified opinion thereon.
/s/ ERNST & YOUNG LLP
Los Angeles, CaliforniaMarch 28, 2014

F-3
GUESS?, INC. AND SUBSIDIARIESCONSOLIDATED BALANCE SHEETS
(in thousands, except share data)
February 1,2014
February 2,2013
ASSETSCurrent assets:
Cash and cash equivalents .......................................................................................... $ 502,945 $ 329,021Short-term investments ............................................................................................... 5,123 6,906Accounts receivable, net ............................................................................................. 276,565 316,863Inventories................................................................................................................... 350,899 369,712Deferred tax assets ...................................................................................................... 24,400 21,053Other current assets..................................................................................................... 56,154 63,670Total current assets...................................................................................................... 1,216,086 1,107,225
Property and equipment, net ......................................................................................... 324,606 355,729Goodwill........................................................................................................................ 38,992 39,287Other intangible assets, net ........................................................................................... 13,143 16,032Long-term deferred tax assets ....................................................................................... 54,973 43,063Other assets ................................................................................................................... 116,631 152,170
$ 1,764,431 $ 1,713,506LIABILITIES AND STOCKHOLDERS’ EQUITYCurrent liabilities:
Current portion of capital lease obligations and borrowings ...................................... $ 4,160 $ 1,901Accounts payable ........................................................................................................ 191,532 191,143Accrued expenses........................................................................................................ 174,333 191,922Total current liabilities ................................................................................................ 370,025 384,966
Capital lease obligations and other long-term debt....................................................... 7,580 8,314Deferred rent and lease incentives ................................................................................ 90,492 94,218Other long-term liabilities ............................................................................................. 120,518 121,996
588,615 609,494Redeemable noncontrolling interests ............................................................................ 5,830 3,144
Commitments and contingencies (Note 14)
Stockholders’ equity:Preferred stock, $.01 par value. Authorized 10,000,000 shares; no shares issuedand outstanding ........................................................................................................... — —Common stock, $.01 par value. Authorized 150,000,000 shares; issued139,245,729 and 138,812,082 shares, outstanding 84,962,345 and 85,367,984shares, at February 1, 2014 and February 2, 2013, respectively................................. 850 853Paid-in capital ............................................................................................................. 439,742 423,387Retained earnings........................................................................................................ 1,247,180 1,162,982Accumulated other comprehensive loss...................................................................... (13,801) (2,461)Treasury stock, 54,283,384 and 53,444,098 shares at February 1, 2014 andFebruary 2, 2013, respectively.................................................................................... (519,457) (497,769)Guess?, Inc. stockholders’ equity................................................................................ 1,154,514 1,086,992Nonredeemable noncontrolling interests .................................................................... 15,472 13,876
Total stockholders’ equity............................................................................................. 1,169,986 1,100,868$ 1,764,431 $ 1,713,506
See accompanying notes to consolidated financial statements.
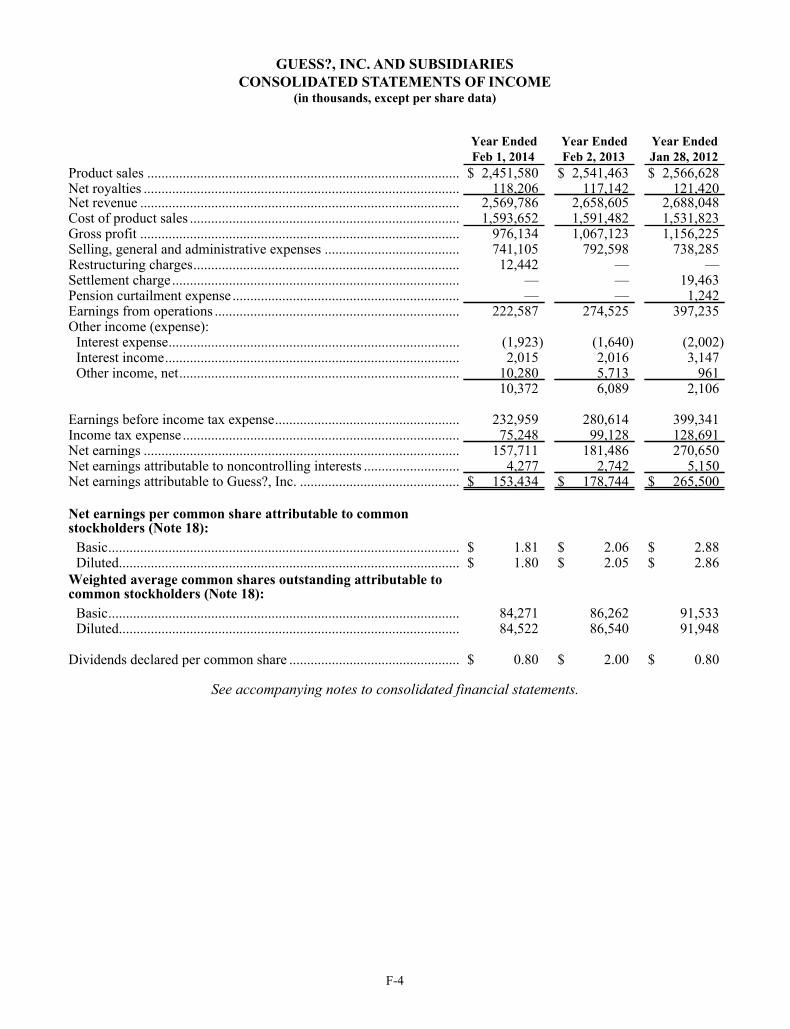
F-4
GUESS?, INC. AND SUBSIDIARIESCONSOLIDATED STATEMENTS OF INCOME
(in thousands, except per share data)
Year Ended Year Ended Year EndedFeb 1, 2014 Feb 2, 2013 Jan 28, 2012
Product sales ........................................................................................ $ 2,451,580 $ 2,541,463 $ 2,566,628Net royalties ......................................................................................... 118,206 117,142 121,420Net revenue .......................................................................................... 2,569,786 2,658,605 2,688,048Cost of product sales ............................................................................ 1,593,652 1,591,482 1,531,823Gross profit .......................................................................................... 976,134 1,067,123 1,156,225Selling, general and administrative expenses ...................................... 741,105 792,598 738,285Restructuring charges........................................................................... 12,442 — —Settlement charge................................................................................. — — 19,463Pension curtailment expense ................................................................ — — 1,242Earnings from operations ..................................................................... 222,587 274,525 397,235Other income (expense):
Interest expense.................................................................................. (1,923) (1,640) (2,002)Interest income................................................................................... 2,015 2,016 3,147Other income, net............................................................................... 10,280 5,713 961
10,372 6,089 2,106
Earnings before income tax expense.................................................... 232,959 280,614 399,341Income tax expense .............................................................................. 75,248 99,128 128,691Net earnings ......................................................................................... 157,711 181,486 270,650Net earnings attributable to noncontrolling interests ........................... 4,277 2,742 5,150Net earnings attributable to Guess?, Inc. ............................................. $ 153,434 $ 178,744 $ 265,500
Net earnings per common share attributable to commonstockholders (Note 18):
Basic................................................................................................... $ 1.81 $ 2.06 $ 2.88Diluted................................................................................................ $ 1.80 $ 2.05 $ 2.86
Weighted average common shares outstanding attributable tocommon stockholders (Note 18):
Basic................................................................................................... 84,271 86,262 91,533Diluted................................................................................................ 84,522 86,540 91,948
Dividends declared per common share ................................................ $ 0.80 $ 2.00 $ 0.80
See accompanying notes to consolidated financial statements.
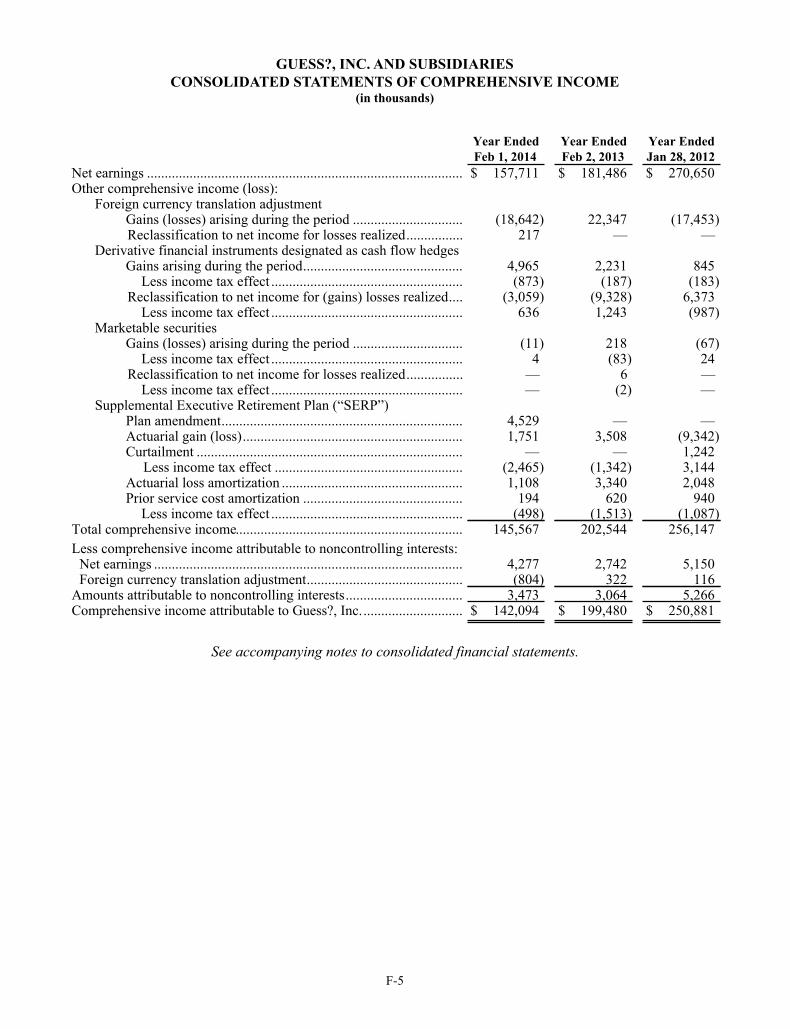
F-5
GUESS?, INC. AND SUBSIDIARIESCONSOLIDATED STATEMENTS OF COMPREHENSIVE INCOME
(in thousands)
Year Ended Year Ended Year EndedFeb 1, 2014 Feb 2, 2013 Jan 28, 2012
Net earnings ......................................................................................... $ 157,711 $ 181,486 $ 270,650Other comprehensive income (loss):
Foreign currency translation adjustmentGains (losses) arising during the period ............................... (18,642) 22,347 (17,453) Reclassification to net income for losses realized................ 217 — —
Derivative financial instruments designated as cash flow hedgesGains arising during the period............................................. 4,965 2,231 845
Less income tax effect ...................................................... (873) (187) (183) Reclassification to net income for (gains) losses realized.... (3,059) (9,328) 6,373
Less income tax effect ...................................................... 636 1,243 (987)Marketable securities
Gains (losses) arising during the period ............................... (11) 218 (67)Less income tax effect ...................................................... 4 (83) 24
Reclassification to net income for losses realized................ — 6 —Less income tax effect ...................................................... — (2) —
Supplemental Executive Retirement Plan (“SERP”)Plan amendment.................................................................... 4,529 — —Actuarial gain (loss).............................................................. 1,751 3,508 (9,342)Curtailment ........................................................................... — — 1,242
Less income tax effect ..................................................... (2,465) (1,342) 3,144Actuarial loss amortization ................................................... 1,108 3,340 2,048Prior service cost amortization ............................................. 194 620 940
Less income tax effect ...................................................... (498) (1,513) (1,087)Total comprehensive income................................................................ 145,567 202,544 256,147Less comprehensive income attributable to noncontrolling interests:
Net earnings ....................................................................................... 4,277 2,742 5,150Foreign currency translation adjustment............................................ (804) 322 116
Amounts attributable to noncontrolling interests................................. 3,473 3,064 5,266Comprehensive income attributable to Guess?, Inc. ............................ $ 142,094 $ 199,480 $ 250,881
See accompanying notes to consolidated financial statements.

F-6
GUESS?, INC. AND SUBSIDIARIESCONSOLIDATED STATEMENTS OF STOCKHOLDERS' EQUITY
(in thousands)Guess?, Inc. Stockholders’ Equity
CommonStock
Paid-inCapital
RetainedEarnings
AccumulatedOther
ComprehensiveIncome (Loss)
TreasuryStock
NonredeemableNoncontrolling
Interests TotalBalance at January 29, 2011....................... $ 923 $ 368,225 $ 960,460 $ (8,578) $ (266,154) $ 11,318 $ 1,066,194Net earnings................................................ — — 265,500 — — 5,150 270,650Foreign currency translation adjustment .... — — — (17,569) — 116 (17,453)Gain on derivative financial instrumentsdesignated as cash flow hedges .................. — — — 6,048 — — 6,048Loss on marketable securities..................... — — — (43) — — (43)SERP prior service cost amortization,curtailment and actuarial valuation lossand related amortization ............................. — — — (3,055) — — (3,055)Issuance of common stock under stockcompensation plans including tax effect .... 5 2,918 — — — — 2,923Issuance of stock under Employee StockPurchase Plan ............................................. — 1,084 — — 293 — 1,377Share-based compensation ......................... — 27,919 181 — — — 28,100Dividends.................................................... — — (74,166) — — — (74,166)Share repurchases ....................................... (32) 32 — — (92,082) — (92,082)Redeemable noncontrolling interestredemption value adjustment...................... — — 3,721 — — 2,051 5,772Balance at January 28, 2012....................... $ 896 $ 400,178 $ 1,155,696 $ (23,197) $ (357,943) $ 18,635 $ 1,194,265Net earnings................................................ — — 178,744 — — 2,742 181,486Foreign currency translation adjustment .... — — — 22,025 — 322 22,347Loss on derivative financial instrumentsdesignated as cash flow hedges .................. — — — (6,041) — — (6,041)Gain on marketable securities .................... — — — 139 — — 139SERP prior service cost amortization andactuarial valuation gain (loss) and relatedamortization................................................ — — — 4,613 — — 4,613Issuance of common stock under stockcompensation plans including tax effect .... 7 1,355 — — — — 1,362Issuance of stock under Employee StockPurchase Plan ............................................. — 750 — — 436 — 1,186Share-based compensation ......................... — 16,197 88 — — — 16,285Dividends.................................................... — — (172,792) — — — (172,792)Share repurchases ....................................... (50) 50 — — (140,262) — (140,262)Purchase of redeemable noncontrollinginterest ........................................................ — 4,857 — — — (4,857) —Noncontrolling interest capitalcontribution ................................................ — — — — — 1,488 1,488Noncontrolling interest capital distribution — — — — — (4,237) (4,237)Redeemable noncontrolling interestredemption value adjustment...................... — — 1,246 — — (217) 1,029Balance at February 2, 2013....................... $ 853 $ 423,387 $ 1,162,982 $ (2,461) $ (497,769) $ 13,876 $ 1,100,868Net earnings................................................ — — 153,434 — — 4,277 157,711Foreign currency translation adjustment .... — — — (17,621) — (804) (18,425)Gain on derivative financial instrumentsdesignated as cash flow hedges .................. — — — 1,669 — — 1,669Loss on marketable securities..................... — — — (7) — — (7)SERP plan amendment, prior service costamortization and actuarial valuation gain(loss) and related amortization ................... — — — 4,619 — — 4,619Issuance of common stock under stockcompensation plans including tax effect .... 6 2,398 — — — — 2,404Issuance of stock under Employee StockPurchase Plan ............................................. — 569 — — 411 — 980Share-based compensation ......................... — 13,379 570 — — — 13,949Dividends.................................................... — — (68,215) — — — (68,215)Share repurchases ....................................... (9) 9 — — (22,099) — (22,099)Noncontrolling interest capital distribution — — — — — (1,877) (1,877)Redeemable noncontrolling interestredemption value adjustment...................... — — (1,591) — — — (1,591)Balance at February 1, 2014....................... $ 850 $ 439,742 $ 1,247,180 $ (13,801) $ (519,457) $ 15,472 $ 1,169,986
See accompanying notes to consolidated financial statements.
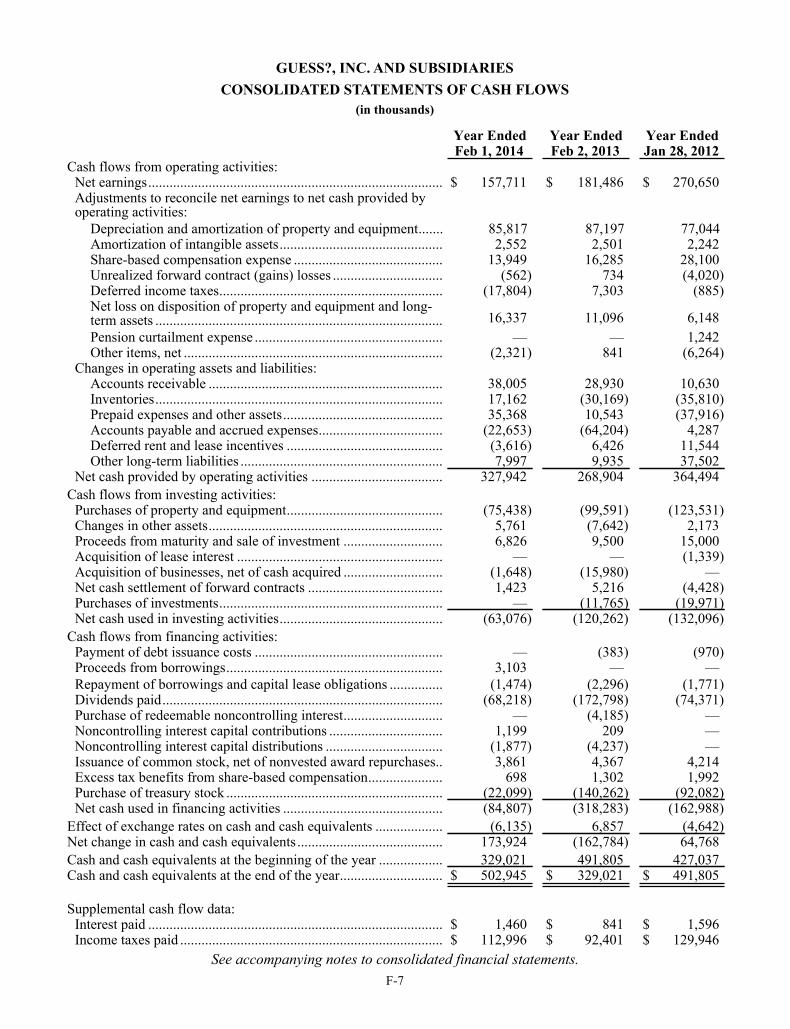
F-7
GUESS?, INC. AND SUBSIDIARIESCONSOLIDATED STATEMENTS OF CASH FLOWS
(in thousands)
Year Ended Year Ended Year EndedFeb 1, 2014 Feb 2, 2013 Jan 28, 2012
Cash flows from operating activities:Net earnings................................................................................... $ 157,711 $ 181,486 $ 270,650Adjustments to reconcile net earnings to net cash provided byoperating activities:
Depreciation and amortization of property and equipment....... 85,817 87,197 77,044Amortization of intangible assets.............................................. 2,552 2,501 2,242Share-based compensation expense .......................................... 13,949 16,285 28,100Unrealized forward contract (gains) losses ............................... (562) 734 (4,020)Deferred income taxes............................................................... (17,804) 7,303 (885)Net loss on disposition of property and equipment and long-term assets ................................................................................. 16,337 11,096 6,148Pension curtailment expense ..................................................... — — 1,242Other items, net ......................................................................... (2,321) 841 (6,264)
Changes in operating assets and liabilities:Accounts receivable .................................................................. 38,005 28,930 10,630Inventories................................................................................. 17,162 (30,169) (35,810)Prepaid expenses and other assets............................................. 35,368 10,543 (37,916)Accounts payable and accrued expenses................................... (22,653) (64,204) 4,287Deferred rent and lease incentives ............................................ (3,616) 6,426 11,544Other long-term liabilities ......................................................... 7,997 9,935 37,502
Net cash provided by operating activities ..................................... 327,942 268,904 364,494Cash flows from investing activities:
Purchases of property and equipment............................................ (75,438) (99,591) (123,531)Changes in other assets.................................................................. 5,761 (7,642) 2,173Proceeds from maturity and sale of investment ............................ 6,826 9,500 15,000Acquisition of lease interest .......................................................... — — (1,339)Acquisition of businesses, net of cash acquired ............................ (1,648) (15,980) —Net cash settlement of forward contracts ...................................... 1,423 5,216 (4,428)Purchases of investments............................................................... — (11,765) (19,971)Net cash used in investing activities.............................................. (63,076) (120,262) (132,096)
Cash flows from financing activities:Payment of debt issuance costs ..................................................... — (383) (970)Proceeds from borrowings............................................................. 3,103 — —Repayment of borrowings and capital lease obligations ............... (1,474) (2,296) (1,771)Dividends paid............................................................................... (68,218) (172,798) (74,371)Purchase of redeemable noncontrolling interest............................ — (4,185) —Noncontrolling interest capital contributions ................................ 1,199 209 —Noncontrolling interest capital distributions ................................. (1,877) (4,237) —Issuance of common stock, net of nonvested award repurchases.. 3,861 4,367 4,214Excess tax benefits from share-based compensation..................... 698 1,302 1,992Purchase of treasury stock ............................................................. (22,099) (140,262) (92,082)Net cash used in financing activities ............................................. (84,807) (318,283) (162,988)
Effect of exchange rates on cash and cash equivalents ................... (6,135) 6,857 (4,642)Net change in cash and cash equivalents ......................................... 173,924 (162,784) 64,768Cash and cash equivalents at the beginning of the year .................. 329,021 491,805 427,037Cash and cash equivalents at the end of the year............................. $ 502,945 $ 329,021 $ 491,805
Supplemental cash flow data:Interest paid ................................................................................... $ 1,460 $ 841 $ 1,596Income taxes paid .......................................................................... $ 112,996 $ 92,401 $ 129,946
See accompanying notes to consolidated financial statements.
F-8
GUESS?, INC. AND SUBSIDIARIESNOTES TO CONSOLIDATED FINANCIAL STATEMENTS
(1) Description of the Business and Summary of Significant Accounting Policies and Practices Description of the Business
Guess?, Inc. (the “Company” or “GUESS?”) designs, markets, distributes and licenses a leading lifestyle collection of contemporary apparel and accessories for men, women and children that reflect the American lifestyle and European fashion sensibilities. The Company’s designs are sold in GUESS? owned stores, to a network of wholesale accounts that includes better department stores, selected specialty retailers and upscale boutiques and through the Internet. GUESS? branded products, some of which are produced under license, are also sold internationally through a series of licensees and distributors.Fiscal Year End
The Company operates on a 52/53-week fiscal year calendar, which ends on the Saturday nearest to January 31 of each year. All references herein to “fiscal 2014”, “fiscal 2013”, and “fiscal 2012” represent the results of the 52-week fiscal year ended February 1, 2014, the 53-week fiscal year ended February 2, 2013 and the 52-week fiscal year ended January 28, 2012, respectively. The additional week in fiscal 2013 occurred during the fourth quarter ended February 2, 2013. References to “fiscal 2015” represent the 52-week fiscal year ending January 31, 2015. Reclassifications
The Company has made certain reclassifications to the consolidated financial statements for the year ended February 2, 2013 to conform to classifications in the current year. These reclassifications had no impact on previously reported results from operations or net cash provided by operating activities.
For the year ended January 28, 2012, the Company also reclassified certain retail distribution costs from selling, general and administrative expenses to cost of product sales to conform to current period presentation. This reclassification had no impact on previously reported earnings from operations, net earnings or net earnings per share. Principles of Consolidation
The consolidated financial statements include the accounts of Guess?, Inc., its wholly-owned direct and indirect subsidiaries and its majority-owned subsidiaries. Accordingly, all references herein to “Guess?, Inc.” include the consolidated results of the Company and its subsidiaries. All intercompany accounts and transactions are eliminated during the consolidation process.Use of Estimates
The preparation of the financial statements in conformity with accounting principles generally accepted in the United States requires management to make estimates and assumptions that affect the amounts reported in the financial statements and disclosed in the accompanying notes. Significant areas requiring the use of management estimates relate to the accounts receivable allowances, sales return allowances, gift card and loyalty accruals, valuation of inventories, share-based compensation, recoverability of deferred taxes, unrecognized tax benefits, the useful life of assets for depreciation, evaluation of asset impairment, pension obligations, workers compensation and medical self-insurance expense and accruals, litigation reserves and restructuring expense and accruals. Actual results could differ from those estimates.Business Segment Reporting
Where applicable, the Company reports information about business segments and related disclosures about products and services, geographic areas and major customers. The Company’s businesses are grouped into five reportable segments for management and internal financial reporting purposes: North American Retail, Europe, Asia, North American Wholesale and Licensing. Management evaluates segment performance based primarily on revenues and earnings from operations before restructuring charges, if any. The Company believes this segment reporting reflects how its five business segments are managed and each segment’s performance is evaluated. The
F-9
North American Retail segment includes the Company’s retail and e-commerce operations in North America and its retail operations in Central and South America. The Europe segment includes the Company’s wholesale, retail and e-commerce operations in Europe and the Middle East. The Asia segment includes the Company’s wholesale, retail and e-commerce operations in Asia. The North American Wholesale segment includes the Company’s wholesale operations in North America and export sales to Central and South America. The Licensing segment includes the worldwide licensing operations of the Company. The business segment operating results exclude corporate overhead costs, which consist of shared costs of the organization, and restructuring charges. These costs are presented separately and generally include, among other things, the following unallocated corporate costs: accounting and finance, executive compensation, facilities, global advertising and marketing, human resources, information technology and legal. Information regarding these segments is summarized in Note 17.Revenue Recognition
GeneralThe Company recognizes retail operations revenue at the point of sale and wholesale operations revenue
from the sale of merchandise when products are shipped and the customer takes title and assumes risk of loss, collection of the relevant receivable is reasonably assured, pervasive evidence of an arrangement exists, and the sales price is fixed or determinable. Revenue from our e-commerce operations, including shipping fees, is recognized based on the estimated customer receipt date. The Company accrues for estimated sales returns and other allowances in the period in which the related revenue is recognized. To recognize the financial impact of sales returns, the Company estimates the amount of goods that will be returned based on historical experience and reduces sales and cost of sales accordingly. Sales taxes and value added taxes collected from customers and remitted directly to governmental authorities are excluded from net revenues.
Net Royalty RevenueRoyalty revenue is based upon a percentage, as defined in the underlying agreement, of the licensee’s actual
net sales or minimum net sales, whichever is greater. The Company may receive special payments in consideration of the grant of license rights. These payments are recognized ratably as revenue over the term of the license agreement. The unrecognized portion of upfront payments is included in deferred royalties in accrued expenses and other long-term liabilities depending on the short or long-term nature of the payments to be recognized. As of February 1, 2014, the Company had $15.4 million and $44.1 million, respectively, of deferred royalties included in accrued expenses and other long-term liabilities. This compares to $12.9 million and $34.9 million, respectively, of deferred royalties included in accrued expenses and other long-term liabilities as of February 2, 2013.
Gift Cards Gift card breakage is income recognized due to the non-redemption of a portion of gift cards sold by the
Company for which a liability was recorded in prior periods. Gifts cards are not utilized outside the U.S. and Canada. The Company issues gift cards through one of its subsidiaries and is not required by law to escheat the value of unredeemed gift cards to the state in which the subsidiary is domiciled. Estimated breakage amounts are accounted for under the redemption recognition method and are classified as additional net revenues as the gift cards are redeemed. The Company’s gift card breakage rate is approximately 5.2% and 4.5% for the U.S. retail business and Canadian retail business, respectively, based upon historical redemption patterns, which represents the cumulative estimated amount of gift card breakage from the inception of the electronic gift card program in late 2002. Based upon historical redemption trends, the Company recognizes estimated gift card breakage as a component of net revenue in proportion to actual gift card redemptions, over the period that remaining gift card values are redeemed. In fiscal 2014, fiscal 2013 and fiscal 2012, the Company recognized $0.8 million, $0.5 million and $0.7 million of gift card breakage to revenue, respectively. Any future revisions to the estimated breakage rate may result in changes in the amount of breakage income recognized in future periods.
GUESS?, INC. AND SUBSIDIARIESNOTES TO CONSOLIDATED FINANCIAL STATEMENTS (Continued)

F-10
Loyalty Programs The Company launched customer loyalty programs for its GUESS? factory outlet, G by GUESS, GUESS?,
and MARCIANO stores in March 2013, July 2009, August 2008 and September 2007, respectively. The GUESS? and MARCIANO loyalty programs were merged in May 2009. Under the programs, customers accumulate points based on purchase activity. Once a loyalty program member achieves a certain point level, the member earns awards that may only be redeemed for merchandise. In all of the programs, unredeemed points generally expire after six months without additional purchase activity and unredeemed awards generally expire after two months. The Company uses historical redemption rates to estimate the value of future award redemptions which are accrued in current liabilities and recorded as a reduction of net revenue in the period which the related revenue is recognized. The aggregate dollar value of the loyalty program accruals included in accrued expenses was $4.2 million and $2.9 million at February 1, 2014 and February 2, 2013, respectively. Future revisions to the estimated liability may result in changes to net revenue.Classification of Certain Costs and Expenses
The Company includes inbound freight charges, purchasing costs and related overhead, retail store occupancy costs including rent and depreciation and a portion of the Company’s distribution costs related to its retail business in cost of product sales. Distribution costs related primarily to the wholesale business are included in selling, general and administrative (“SG&A”) expenses and amounted to $31.7 million, $36.2 million and $40.4 million for fiscal 2014, fiscal 2013 and fiscal 2012, respectively. The Company also includes store selling, selling and merchandising, advertising, design and other corporate overhead costs as a component of selling, general and administrative expenses.
The Company classifies amounts billed to customers for shipping fees as revenues and classifies costs related to shipping as cost of product sales in the accompanying consolidated statements of income.Fiscal 2012 Settlement Charge
During fiscal 2012, the Company experienced a temporary disruption in service with a former third party logistics service provider in Europe. On July 29, 2011, the Company entered into a settlement agreement with this service provider to facilitate a transition to a new service provider and recorded a settlement charge of $19.5 million related to amounts paid in connection with this agreement. The settlement charge is included within operating expenses of the Europe segment for fiscal 2012. Advertising and Marketing Costs
The Company expenses the cost of advertising as incurred. Advertising and marketing expenses charged to operations for fiscal 2014, fiscal 2013 and fiscal 2012 were $45.0 million, $59.1 million and $41.0 million, respectively.Share-Based Compensation
The Company recognizes compensation expense for all share-based awards granted based on the grant date fair value. The fair value of each stock option is estimated on the grant date using the Black-Scholes option-pricing model and involves several assumptions, including the risk-free interest rate, expected volatility, dividend yield, expected life and forfeiture rate. The risk-free interest rate is based on the U.S. Treasury yield curve in effect for the expected term of the option at the time of grant. The expected volatility is determined based on an average of both historical volatility and implied volatility. Implied volatility is derived from exchange traded options on the Company’s common stock. The expected dividend yield is based on the Company’s history and expectations of dividend payouts. The expected life is determined based on historical trends. The expected forfeiture rate is determined based on historical data. Compensation expense for nonvested stock options and stock awards is recognized on a straight-line basis over the vesting period.
In addition, the Company has granted certain nonvested stock awards/units and stock options in the past that require the recipient to achieve certain minimum performance targets in order for these awards to vest. If the
GUESS?, INC. AND SUBSIDIARIESNOTES TO CONSOLIDATED FINANCIAL STATEMENTS (Continued)

F-11
minimum performance targets have not been achieved or are not expected to be achieved, no expense is recognized during the period. Foreign Currency
Foreign Currency Translation AdjustmentThe local selling currency is typically the functional currency for all of the Company’s significant
international operations. In accordance with authoritative guidance, assets and liabilities of the Company’s foreign operations are translated from foreign currencies into U.S. dollars at period-end rates, while income and expenses are translated at the weighted-average exchange rates for the period. The related translation adjustments are reflected as a foreign currency translation adjustment in accumulated other comprehensive income (loss) within stockholders’ equity. In addition, the Company records foreign currency translation adjustments related to its noncontrolling interests within stockholders’ equity. Periodically, the Company may also use foreign currency forward contracts to hedge the translation and economic exposures related to its net investments in certain of its international subsidiaries (see below). Changes in the fair values of these foreign currency forward contracts designated as net investment hedges are included as a foreign currency translation adjustment in accumulated other comprehensive income (loss) within stockholders’ equity. The total foreign currency translation adjustment decreased stockholders’ equity by $18.4 million, from an accumulated foreign currency translation gain of $10.7 million as of February 2, 2013 to an accumulated foreign currency translation loss of $7.7 million as of February 1, 2014.
Foreign Currency Transaction Gains and LossesTransaction gains and losses that arise from exchange rate fluctuations on transactions denominated in a
currency other than the functional currency, including gains and losses on foreign currency contracts (see below), are included in the consolidated statements of income. Net foreign currency transaction gains (losses) included in the determination of net earnings were $6.3 million, $8.6 million and $(6.8) million for fiscal 2014, fiscal 2013 and fiscal 2012, respectively.
Forward Contracts Designated As Hedging InstrumentsThe Company operates in foreign countries, which exposes it to market risk associated with foreign currency
exchange rate fluctuations. Various transactions that occur primarily in Canada, Europe and South Korea are denominated in U.S. dollars and British pounds and thus are exposed to earnings risk as a result of exchange rate fluctuations when converted to their functional currencies. These types of transactions include U.S. dollar denominated purchases of merchandise and U.S. dollar and British pound denominated intercompany liabilities. In addition, certain operating expenses and tax liabilities are denominated in Swiss francs and are exposed to earnings risk as a result of exchange rate fluctuations when converted to the functional currency. The Company has entered into certain forward contracts to hedge the risk of a portion of these anticipated foreign currency transactions against foreign currency rate fluctuations. The Company has elected to apply the hedge accounting rules in accordance with authoritative guidance for certain of these hedges. The Company does not hedge all transactions denominated in foreign currency. The Company may also hedge the translation and economic exposures related to its net investments in certain of its international subsidiaries.
Changes in the fair value of the U.S. dollar/euro and U.S. dollar/Canadian dollar forward contracts for anticipated U.S. dollar merchandise purchases designated as cash flow hedges are recorded as a component of accumulated other comprehensive income (loss) within stockholders’ equity and are recognized in cost of product sales in the period which approximates the time the hedged merchandise inventory is sold. Changes in the fair value of U.S. dollar/euro forward contracts for U.S. dollar intercompany royalties designated as cash flow hedges are recorded as a component of accumulated other comprehensive income (loss) within stockholders’ equity and are recognized in other income and expense in the period in which the royalty expense is incurred. Changes in the fair value of the U.S. dollar/euro dollar forward contracts designated as net investment hedges are recorded in foreign currency translation adjustment as a component of accumulated other comprehensive income (loss)
GUESS?, INC. AND SUBSIDIARIESNOTES TO CONSOLIDATED FINANCIAL STATEMENTS (Continued)

F-12
within stockholders’ equity and are not recognized in income until the sale or liquidation of the hedged net investment.
Forward Contracts Not Designated as Hedging InstrumentsThe Company also has forward contracts that are not designated as hedging instruments for accounting
purposes. Changes in fair value of forward contracts not qualifying as cash flow hedges or net investment hedges are reported in net earnings as part of other income and expense. Income Taxes
The Company uses the asset and liability method of accounting for income taxes. Under this method, deferred income taxes are recognized for the future tax consequences attributable to differences between the financial statement carrying amounts of existing assets and liabilities and their respective tax bases. Deferred tax assets and liabilities are measured using enacted tax rates expected to be applied to taxable income in the years in which those temporary differences are expected to be recovered or settled. The effect on deferred taxes of a change in tax rates is recognized in income in the period that includes the enactment date.
The Company accounts for uncertainty in income taxes in accordance with authoritative guidance, which prescribes a recognition threshold and measurement attribute for the financial statement recognition and measurement of a tax position taken or expected to be taken in a tax return. The Company also follows authoritative guidance on derecognition, classification, interest and penalties, accounting in interim periods, disclosure and transition. Earnings Per Share
Basic earnings per share represents net earnings attributable to common stockholders divided by the weighted-average number of common shares outstanding for the period. Diluted earnings per share represents net earnings attributable to common stockholders divided by the weighted-average number of common shares outstanding, inclusive of the dilutive impact of common equivalent shares outstanding during the period. However, nonvested restricted stock awards (referred to as participating securities) are excluded from the dilutive impact of common equivalent shares outstanding in accordance with authoritative guidance under the two-class method since the nonvested restricted stockholders are entitled to participate in dividends declared on common stock as if the shares were fully vested and hence are deemed to be participating securities. Under the two-class method, earnings attributable to nonvested restricted stockholders are excluded from net earnings attributable to common stockholders for purposes of calculating basic and diluted earnings per common share.Comprehensive Income
Comprehensive income consists of net earnings, foreign currency translation adjustments, the effective portion of the change in the fair value of cash flow hedges, unrealized gains or losses on available-for-sale investments and Supplemental Executive Retirement Plan (“SERP”) impact from plan amendment, prior service cost amortization, curtailment and actuarial valuation gains or losses and related amortization. Comprehensive income is presented in the consolidated statements of comprehensive income.Cash and Cash Equivalents
Cash and cash equivalents consist of cash on hand and marketable securities with original maturities of three months or less.Investment Securities
The Company accounts for its investment securities in accordance with authoritative guidance which requires investments to be classified into one of three categories based on management’s intent: held-to-maturity securities, available-for-sale securities and trading securities. Held-to-maturity securities are recorded at their amortized cost. Available-for-sale securities are recorded at fair value with unrealized gains and losses reported as a separate component of stockholders’ equity. Trading securities are recorded at market value with unrealized gains and
GUESS?, INC. AND SUBSIDIARIESNOTES TO CONSOLIDATED FINANCIAL STATEMENTS (Continued)
F-13
losses reported in net earnings. The appropriate classification of investment securities is determined at the time of purchase and reevaluated at each balance sheet date. The Company currently accounts for its short-term investment securities as available-for-sale. The short-term investment securities will mature during fiscal 2015. There were no long-term investment securities as of February 1, 2014.
The Company periodically evaluates investment securities for impairment using both qualitative and quantitative criteria such as the length of time and extent to which fair value has been below cost basis, the financial condition of the issuer and the Company’s ability and intent to hold the investment for a period of time which may be sufficient for anticipated recovery in market value.Concentration of Credit and Liquidity Risk
Cash used primarily for working capital purposes is maintained with various major financial institutions. The Company performs evaluations of the relative credit standing of these financial institutions in order to limit the amount of asset and liquidity exposure with any institution. Excess cash and cash equivalents, which represent the majority of the Company’s outstanding cash and cash equivalents balance, are held primarily in overnight deposit and short-term time deposit accounts and four diversified money market funds. The money market funds are AAA rated by national credit rating agencies and are generally comprised of high-quality, liquid investments.
The Company is also exposed to concentrations of credit risk through its accounts receivable balances. The Company extends credit to corporate customers based upon an evaluation of the customer’s financial condition and credit history and generally requires no collateral but does obtain credit insurance when considered appropriate. As of February 1, 2014, approximately 64% of total trade accounts receivable was insured or supported by bank guarantees or letters of credit. In Europe, approximately 82% of our trade receivables were insured for collection purposes or subject to certain bank guarantees or letters of credit. The Company maintains allowances for doubtful accounts for estimated losses that result from the inability of its wholesale customers to make their required payments. The Company bases its allowances on analysis of the aging of accounts receivable at the date of the financial statements, assessments of historical collection trends, an evaluation of the impact of current economic conditions and whether the Company has obtained credit insurance or other guarantees. The Company’s corporate customers are principally located throughout Europe, North America and Asia, and their ability to pay amounts due to the Company may be dependent on the prevailing economic conditions of their geographic region. However, such credit risk is considered limited due to the Company’s large customer base. Management performs regular evaluations concerning the ability of its customers to satisfy their obligations and records a provision for doubtful accounts based on these evaluations. The Company’s credit losses for the periods presented were immaterial and did not significantly exceed management’s estimates. One of the Company’s domestic wholesale customers accounted for approximately 2.3%, 2.7%, and 2.7% of the Company’s consolidated net revenue in fiscal 2014, fiscal 2013 and fiscal 2012, respectively. Inventories
Inventories are valued at the lower of cost (primarily weighted average method) or market. The Company continually evaluates its inventories by assessing slow moving product as well as prior seasons’ inventory. Market value of aged inventory is estimated based on historical sales trends for each product line category, the impact of market trends, an evaluation of economic conditions, available liquidation channels and the value of current orders relating to the future sales of this type of inventory.
GUESS?, INC. AND SUBSIDIARIESNOTES TO CONSOLIDATED FINANCIAL STATEMENTS (Continued)

F-14
Depreciation and AmortizationDepreciation and amortization of property and equipment, which includes depreciation of the property under
the capital lease, and purchased intangibles are provided using the straight-line method over the following useful lives:
Building and building improvements including properties under capital lease ............................. 10 to 33 yearsLand improvements ....................................................................................................................... 5 yearsFurniture, fixtures and equipment ................................................................................................. 2 to 10 yearsPurchased intangibles .................................................................................................................... 4 to 20 years
Leasehold improvements are amortized over the lesser of the estimated useful life of the asset or the term of the lease, unless the renewal is reasonably assured. Construction in progress is not depreciated until the related asset is completed and placed in service.Long-Lived Assets
Long-lived assets, such as property, plant, and equipment, and purchased intangibles subject to amortization, are reviewed for impairment quarterly or whenever events or changes in circumstances indicate that the carrying amount of an asset may not be recoverable. The Company considers each individual store as an asset group for impairment testing, which is the lowest level at which individual cash flows can be identified. The asset group includes store leasehold improvements, furniture, fixtures and equipment, computer hardware and software and certain long-term security deposits and lease acquisition costs. The Company reviews retail stores for impairment risk once the locations have been opened for at least one year, or sooner as changes in circumstances require. The Company believes that waiting one year allows a store to reach a maturity level where a more comprehensive analysis of financial performance can be performed.
An asset is considered to be impaired if the Company determines that the carrying value may not be recoverable based upon its assessment of the asset’s ability to continue to generate income from operations and positive cash flow in future periods or if significant changes in the Company’s strategic business objectives and utilization of the assets occurred. If the carrying amount of an asset exceeds its estimated undiscounted future cash flows, an impairment charge is recognized in the amount by which the carrying amount of the asset exceeds the estimated fair value, which is determined based on discounted future cash flows. The impairment loss calculations require management to apply judgment in estimating future cash flows and the discount rates that reflect the risk inherent in future cash flows. Future expected cash flows for store assets are based on management’s estimates of future cash flows over the remaining lease period or expected life, if shorter. The Company considers historical trends, expected future business trends and other factors when estimating each store’s future cash flow. The Company also considers factors such as: the local environment for each store location, including mall traffic and competition; the Company’s ability to successfully implement strategic initiatives; and the ability to control variable costs such as cost of sales and payroll, and in some cases, renegotiate lease costs. The estimated cash flows used for this nonrecurring fair value measurement are considered a Level 3 input as defined in Note 20. If actual results are not consistent with the assumptions and judgments used in estimating future cash flows and asset fair values, there may be additional exposure to future impairment losses that could be material to the Company’s results of operations.
See Note 5 for further details on asset impairments.Goodwill
Goodwill is tested annually for impairment or more frequently if events and circumstances indicate that the asset might be impaired. An impairment loss is recognized to the extent that the carrying amount exceeds the asset’s fair value. This determination is made at the reporting unit level which may be either an operating segment or one level below an operating segment if discrete financial information is available. Two or more reporting units may be aggregated for impairment testing if they have similar economic characteristics. The Company has
GUESS?, INC. AND SUBSIDIARIESNOTES TO CONSOLIDATED FINANCIAL STATEMENTS (Continued)
F-15
identified its North American Retail and North American Wholesale segments and its European wholesale and European retail components of its Europe segment as separate reporting units for goodwill impairment testing since each have different economic characteristics. In accordance with authoritative accounting guidance, the Company first assesses qualitative factors relevant in determining whether it is more likely than not that the fair value of its reporting units are less than their carrying amounts. Based on this analysis, the Company determines whether it is necessary to perform a quantitative impairment test. If it is more likely than not that the fair value of a reporting unit is less than its carrying amount, the amount of any impairment loss to be recognized for that reporting unit is determined using two steps. First, the Company determines the fair value of the reporting unit using a discounted cash flow analysis, which requires unobservable inputs (Level 3) within the fair value hierarchy as defined in Note 20. These inputs include selection of an appropriate discount rate and the amount and timing of expected future cash flows. Second, if the carrying amount of a reporting unit exceeds its fair value, an impairment loss is recognized for any excess of the carrying amount of the reporting unit’s goodwill and other intangibles over the implied fair value. The implied fair value is determined by allocating the fair value of the reporting unit in a manner similar to a purchase price allocation, in accordance with authoritative accounting guidance.Supplemental Executive Retirement Plan
In accordance with authoritative accounting guidance for defined benefit pension and other postretirement plans, an asset for a plan’s overfunded status or a liability for a plan’s underfunded status is recognized in the consolidated balance sheets; plan assets and obligations that determine the plan’s funded status are measured as of the end of the Company’s fiscal year; and changes in the funded status of defined benefit postretirement plans are recognized in the year in which they occur. Such changes are reported in other comprehensive income (loss) and as a separate component of stockholders’ equity. Deferred Rent and Lease Incentives
When a lease includes lease incentives (such as a rent holiday) or requires fixed escalations of the minimum lease payments, rental expense is recognized on a straight-line basis over the term of the lease and the difference between the average rental amount charged to expense and amounts payable under the lease is included in deferred rent and lease incentives in the accompanying consolidated balance sheets. For construction allowances, the Company records a deferred lease credit on the consolidated balance sheets and amortizes the deferred lease credit as a reduction of rent expense in the consolidated statements of income over the term of the leases.Litigation Reserves
Estimated amounts for claims that are probable and can be reasonably estimated are recorded as liabilities in the consolidated balance sheets. The likelihood of a material change in these estimated reserves would be dependent on new claims as they may arise and the expected probable favorable or unfavorable outcome of each claim. As additional information becomes available, the Company assesses the potential liability related to new claims and existing claims and revises estimates as appropriate. As new claims arise or existing claims evolve, such revisions in estimates of the potential liability could materially impact the results of operations and financial position.
(2) New Accounting GuidanceIn February 2013, the Financial Accounting Standards Board (“FASB”) issued authoritative guidance that
requires an entity to provide information about the amounts reclassified out of accumulated other comprehensive income (loss) by component. In addition, an entity is required to present, either on the face of the statement where net income is presented or in the notes, significant amounts reclassified out of accumulated other comprehensive income (loss) by the respective line items of net income but only if the amount reclassified is required under GAAP to be reclassified to net income in its entirety in the same reporting period. For other amounts that are not required under GAAP to be reclassified in their entirety to net income, an entity is required to cross-reference to other disclosures required under GAAP that provide additional detail about those amounts. The Company adopted
GUESS?, INC. AND SUBSIDIARIESNOTES TO CONSOLIDATED FINANCIAL STATEMENTS (Continued)

F-16
this guidance effective February 3, 2013 and accordingly has presented the required comprehensive income disclosures in the accompanying notes to the consolidated financial statements.
In July 2013, the FASB issued authoritative guidance which requires that an unrecognized tax benefit be presented in the financial statements as a reduction to a deferred tax asset for a net operating loss carryforward, a similar loss or a tax credit carryforward, if specific criteria are met. This guidance is effective for fiscal periods beginning after December 15, 2013. The adoption of this guidance is not expected to have a material impact on the Company’s consolidated financial statements. (3) Accounts Receivable
Accounts receivable is summarized as follows (in thousands):
Feb 1, 2014 Feb 2, 2013Trade ....................................................................................................................... $ 291,411 $ 338,365Royalty ................................................................................................................... 16,372 8,766Other ....................................................................................................................... 8,174 8,391
315,957 355,522Less allowance for doubtful accounts ..................................................................... 39,392 38,659
$ 276,565 $ 316,863
Accounts receivable consists of trade receivables relating primarily to the Company’s wholesale business in Europe, and to a lesser extent, to its wholesale businesses in North America and Asia, and royalty receivables relating to its licensing operations. The accounts receivable allowance includes allowances for doubtful accounts, wholesale sales returns and wholesale markdowns. Retail sales returns allowances are included in accrued expenses.
(4) InventoriesInventories consist of the following (in thousands):
Feb 1, 2014 Feb 2, 2013Raw materials................................................................................................................ $ 10,585 $ 14,706Work in progress ........................................................................................................... 977 1,765Finished goods .............................................................................................................. 339,337 353,241
$ 350,899 $ 369,712
As of February 1, 2014 and February 2, 2013, the Company had an allowance to write-down inventories to the lower of cost or market of $23.4 million and $20.4 million, respectively.
GUESS?, INC. AND SUBSIDIARIESNOTES TO CONSOLIDATED FINANCIAL STATEMENTS (Continued)
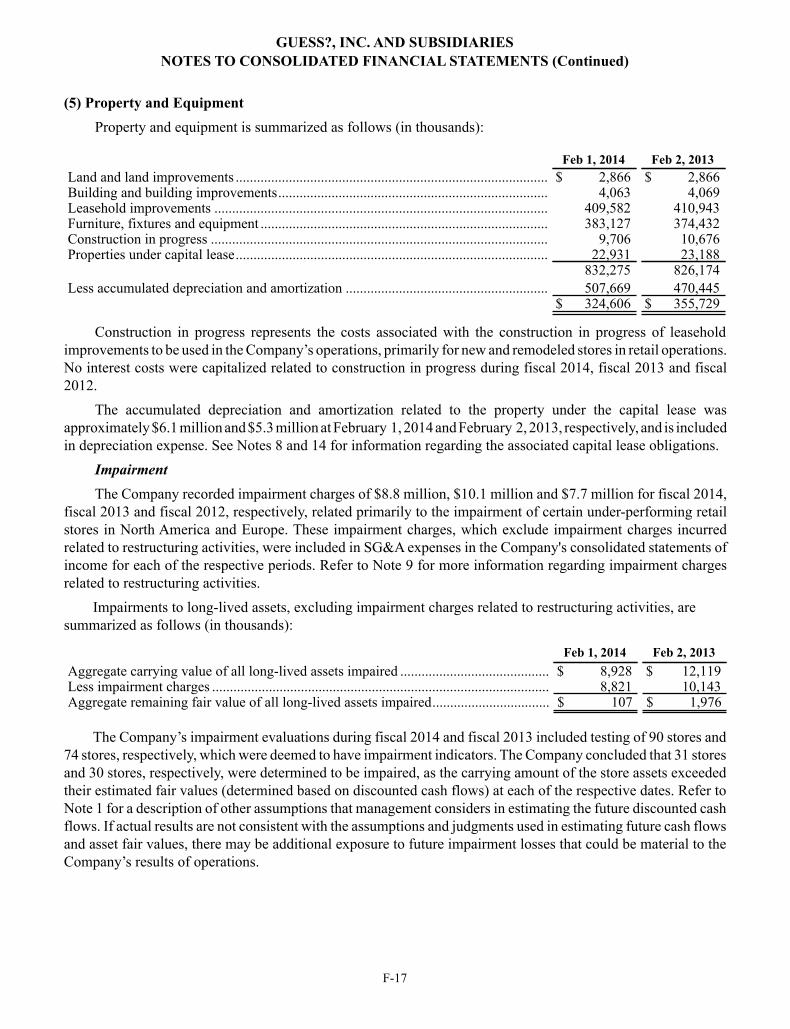
F-17
(5) Property and EquipmentProperty and equipment is summarized as follows (in thousands):
Feb 1, 2014 Feb 2, 2013Land and land improvements ........................................................................................ $ 2,866 $ 2,866Building and building improvements............................................................................ 4,063 4,069Leasehold improvements .............................................................................................. 409,582 410,943Furniture, fixtures and equipment ................................................................................. 383,127 374,432Construction in progress ............................................................................................... 9,706 10,676Properties under capital lease........................................................................................ 22,931 23,188
832,275 826,174Less accumulated depreciation and amortization ......................................................... 507,669 470,445
$ 324,606 $ 355,729
Construction in progress represents the costs associated with the construction in progress of leasehold improvements to be used in the Company’s operations, primarily for new and remodeled stores in retail operations. No interest costs were capitalized related to construction in progress during fiscal 2014, fiscal 2013 and fiscal 2012.
The accumulated depreciation and amortization related to the property under the capital lease was approximately $6.1 million and $5.3 million at February 1, 2014 and February 2, 2013, respectively, and is included in depreciation expense. See Notes 8 and 14 for information regarding the associated capital lease obligations.
ImpairmentThe Company recorded impairment charges of $8.8 million, $10.1 million and $7.7 million for fiscal 2014,
fiscal 2013 and fiscal 2012, respectively, related primarily to the impairment of certain under-performing retail stores in North America and Europe. These impairment charges, which exclude impairment charges incurred related to restructuring activities, were included in SG&A expenses in the Company's consolidated statements of income for each of the respective periods. Refer to Note 9 for more information regarding impairment charges related to restructuring activities.
Impairments to long-lived assets, excluding impairment charges related to restructuring activities, are summarized as follows (in thousands):
Feb 1, 2014 Feb 2, 2013Aggregate carrying value of all long-lived assets impaired .......................................... $ 8,928 $ 12,119Less impairment charges ............................................................................................... 8,821 10,143Aggregate remaining fair value of all long-lived assets impaired................................. $ 107 $ 1,976
The Company’s impairment evaluations during fiscal 2014 and fiscal 2013 included testing of 90 stores and 74 stores, respectively, which were deemed to have impairment indicators. The Company concluded that 31 stores and 30 stores, respectively, were determined to be impaired, as the carrying amount of the store assets exceeded their estimated fair values (determined based on discounted cash flows) at each of the respective dates. Refer to Note 1 for a description of other assumptions that management considers in estimating the future discounted cash flows. If actual results are not consistent with the assumptions and judgments used in estimating future cash flows and asset fair values, there may be additional exposure to future impairment losses that could be material to the Company’s results of operations.
GUESS?, INC. AND SUBSIDIARIESNOTES TO CONSOLIDATED FINANCIAL STATEMENTS (Continued)

F-18
(6) Goodwill and Intangible AssetsGoodwill activity is summarized by business segment as follows (in thousands):
North American
Retail Europe
North American Wholesale Total
Goodwill balance at January 28, 2012 .......................................... $ 907 $ 17,150 $ 11,013 $ 29,070Adjustments:
Acquisition .................................................................................. — 9,360 — 9,360Translation Adjustments.............................................................. 4 852 1 857
Goodwill balance at February 2, 2013 .......................................... 911 27,362 11,014 39,287Adjustments:
Translation Adjustments.............................................................. (85) (195) (15) (295)Goodwill balance at February 1, 2014 .......................................... $ 826 $ 27,167 $ 10,999 $ 38,992
The Company has no accumulated impairment related to goodwill.On May 3, 2012, the Company acquired 26 retail stores and certain related assets and liabilities from one of
its European licensees for $16.0 million in cash. This transaction resulted in goodwill and other intangible assets of $9.4 million and $5.2 million, respectively. The other intangible assets consisted of lease and license acquisition costs of $4.5 million and $0.7 million, respectively. The Company amortizes these costs on a straight-line basis over the expected useful life which was estimated to be approximately 7.6 years on a combined basis as of the acquisition date, with the lease and license acquisition costs separately amortized over original weighted-average periods of approximately 8.1 years and 4.7 years, respectively. The net assets were recorded at their estimated fair values and operating results were included in the Company’s financial statements from the date of acquisition.
Other intangible assets as of February 1, 2014 consisted primarily of lease and license acquisition costs related to European acquisitions. Gross intangible assets were $37.7 million and $38.1 million at February 1, 2014 and February 2, 2013, respectively. The accumulated amortization of intangible assets with finite useful lives was $24.6 million and $22.1 million at February 1, 2014 and February 2, 2013, respectively. For these assets, amortization expense over the next five years is expected to be approximately $3.3 million in fiscal 2015, $2.5 million in fiscal 2016, $2.0 million in fiscal 2017, $1.3 million in fiscal 2018 and $1.0 million in fiscal 2019.
(7) Accrued ExpensesAccrued expenses are summarized as follows (in thousands):
Feb 1, 2014 Feb 2, 2013Accrued compensation and benefits ................................................................................ $ 68,354 $ 65,905Sales and use taxes, property taxes and other indirect taxes ........................................... 23,126 26,766Deferred royalties and other revenue............................................................................... 15,787 12,924Income taxes .................................................................................................................... 11,823 30,342Store credits, loyalty and gift cards ................................................................................. 9,738 8,904Accrued rent..................................................................................................................... 9,607 9,338Advertising ...................................................................................................................... 7,853 7,830Professional fees .............................................................................................................. 5,871 5,627Restructuring charges ...................................................................................................... 4,578 —Construction costs............................................................................................................ 3,714 3,593Derivative financial instruments...................................................................................... 1,712 5,552Other ................................................................................................................................ 12,170 15,141
$ 174,333 $ 191,922
GUESS?, INC. AND SUBSIDIARIESNOTES TO CONSOLIDATED FINANCIAL STATEMENTS (Continued)
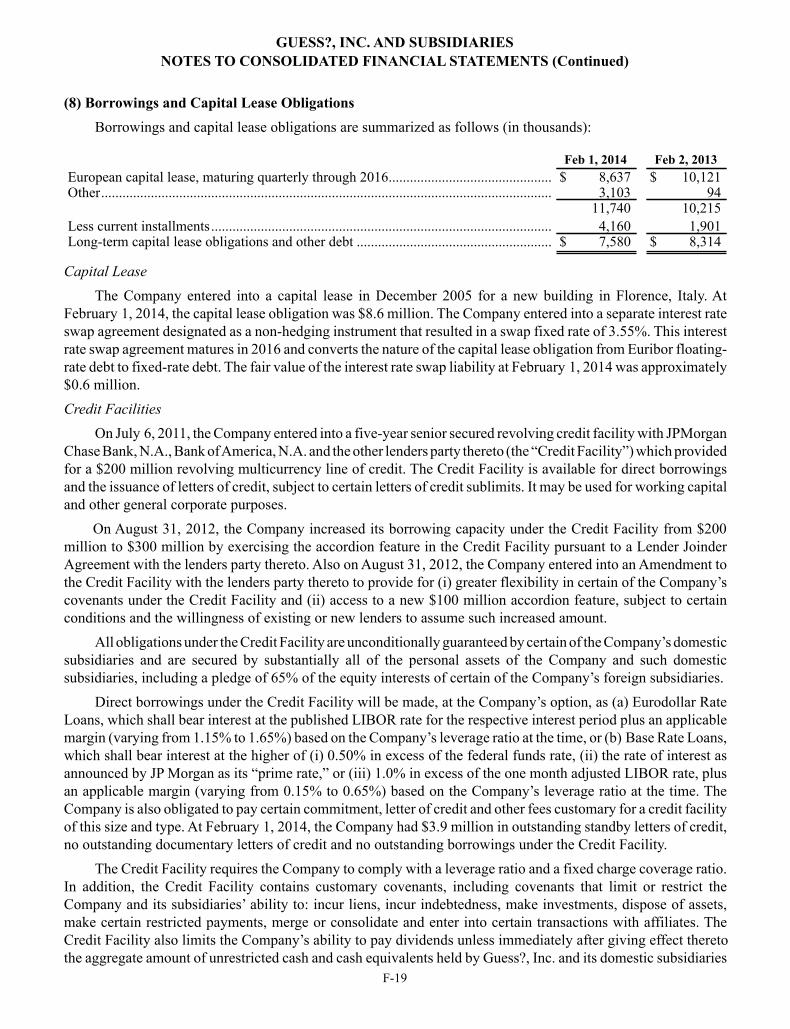
F-19
(8) Borrowings and Capital Lease ObligationsBorrowings and capital lease obligations are summarized as follows (in thousands):
Feb 1, 2014 Feb 2, 2013European capital lease, maturing quarterly through 2016.............................................. $ 8,637 $ 10,121Other............................................................................................................................... 3,103 94
11,740 10,215Less current installments................................................................................................ 4,160 1,901Long-term capital lease obligations and other debt ....................................................... $ 7,580 $ 8,314
Capital LeaseThe Company entered into a capital lease in December 2005 for a new building in Florence, Italy. At
February 1, 2014, the capital lease obligation was $8.6 million. The Company entered into a separate interest rate swap agreement designated as a non-hedging instrument that resulted in a swap fixed rate of 3.55%. This interest rate swap agreement matures in 2016 and converts the nature of the capital lease obligation from Euribor floating-rate debt to fixed-rate debt. The fair value of the interest rate swap liability at February 1, 2014 was approximately $0.6 million. Credit Facilities
On July 6, 2011, the Company entered into a five-year senior secured revolving credit facility with JPMorgan Chase Bank, N.A., Bank of America, N.A. and the other lenders party thereto (the “Credit Facility”) which provided for a $200 million revolving multicurrency line of credit. The Credit Facility is available for direct borrowings and the issuance of letters of credit, subject to certain letters of credit sublimits. It may be used for working capital and other general corporate purposes.
On August 31, 2012, the Company increased its borrowing capacity under the Credit Facility from $200 million to $300 million by exercising the accordion feature in the Credit Facility pursuant to a Lender Joinder Agreement with the lenders party thereto. Also on August 31, 2012, the Company entered into an Amendment to the Credit Facility with the lenders party thereto to provide for (i) greater flexibility in certain of the Company’s covenants under the Credit Facility and (ii) access to a new $100 million accordion feature, subject to certain conditions and the willingness of existing or new lenders to assume such increased amount.
All obligations under the Credit Facility are unconditionally guaranteed by certain of the Company’s domestic subsidiaries and are secured by substantially all of the personal assets of the Company and such domestic subsidiaries, including a pledge of 65% of the equity interests of certain of the Company’s foreign subsidiaries.
Direct borrowings under the Credit Facility will be made, at the Company’s option, as (a) Eurodollar Rate Loans, which shall bear interest at the published LIBOR rate for the respective interest period plus an applicable margin (varying from 1.15% to 1.65%) based on the Company’s leverage ratio at the time, or (b) Base Rate Loans, which shall bear interest at the higher of (i) 0.50% in excess of the federal funds rate, (ii) the rate of interest as announced by JP Morgan as its “prime rate,” or (iii) 1.0% in excess of the one month adjusted LIBOR rate, plus an applicable margin (varying from 0.15% to 0.65%) based on the Company’s leverage ratio at the time. The Company is also obligated to pay certain commitment, letter of credit and other fees customary for a credit facility of this size and type. At February 1, 2014, the Company had $3.9 million in outstanding standby letters of credit, no outstanding documentary letters of credit and no outstanding borrowings under the Credit Facility.
The Credit Facility requires the Company to comply with a leverage ratio and a fixed charge coverage ratio. In addition, the Credit Facility contains customary covenants, including covenants that limit or restrict the Company and its subsidiaries’ ability to: incur liens, incur indebtedness, make investments, dispose of assets, make certain restricted payments, merge or consolidate and enter into certain transactions with affiliates. The Credit Facility also limits the Company’s ability to pay dividends unless immediately after giving effect thereto the aggregate amount of unrestricted cash and cash equivalents held by Guess?, Inc. and its domestic subsidiaries
GUESS?, INC. AND SUBSIDIARIESNOTES TO CONSOLIDATED FINANCIAL STATEMENTS (Continued)

F-20
is at least $50 million. The Company may need to borrow against this facility periodically to ensure it will continue to meet the requirements of this covenant. Upon the occurrence of an event of default under the Credit Facility, the lenders may cease making loans, terminate the Credit Facility and declare all amounts outstanding to be immediately due and payable. The Credit Facility specifies a number of events of default (some of which are subject to applicable grace or cure periods), including, among other things, non-payment defaults, covenant defaults, cross-defaults to other material indebtedness, bankruptcy and insolvency defaults and material judgment defaults. The Credit Facility allows for both secured and unsecured borrowings outside of the Credit Facility up to specified amounts.
The Company, through its European subsidiaries, maintains short-term uncommitted borrowing agreements, primarily for working capital purposes, with various banks in Europe. The majority of the borrowings under these agreements are secured by specific accounts receivable balances. Based on the applicable accounts receivable balances at February 1, 2014, the Company could have borrowed up to $143.6 million under these agreements. At February 1, 2014, the Company had no outstanding borrowings and $0.5 million in outstanding documentary letters of credit under these agreements. The agreements are denominated primarily in euros and provide for annual interest rates ranging from 0.5% to 3.1%. The maturities of any short-term borrowings under these agreements are generally linked to the credit terms of the underlying accounts receivable that secure the borrowings. With the exception of one facility for up to $47.2 million that has a minimum net equity requirement, there are no other financial ratio covenants.
OtherFrom time-to-time, the Company will obtain other financing in foreign countries for working capital to
finance its local operations. Maturities of debt and capital lease obligations at February 1, 2014 are as follows (in thousands):
CapitalLease Debt Total
Fiscal 2015 ........................................................................................... $ 1,769 $ 2,391 $ 4,160Fiscal 2016 ........................................................................................... 1,853 — 1,853Fiscal 2017 ........................................................................................... 5,015 — 5,015Fiscal 2018 ........................................................................................... — — —Fiscal 2019 ........................................................................................... — 712 712Thereafter ............................................................................................. — — —Total...................................................................................................... $ 8,637 $ 3,103 $ 11,740
(9) Restructuring Charges
During the first quarter of fiscal 2014, the Company implemented plans to streamline its structure and reduce expenses in both Europe and North America. During the second quarter of fiscal 2014, the Company expanded these plans to include the consolidation and streamlining of certain operations in Europe and Asia. These actions resulted in restructuring charges related primarily to severance, impairment and lease termination costs of $12.4 million during fiscal 2014. As of February 1, 2014, the Company had a balance of approximately $4.6 million in accrued expenses for amounts expected to be paid during fiscal 2015. The Company has substantially completed its actions under these plans and does not expect significant future cash-related severance and lease termination costs to be incurred during fiscal 2015.
GUESS?, INC. AND SUBSIDIARIESNOTES TO CONSOLIDATED FINANCIAL STATEMENTS (Continued)
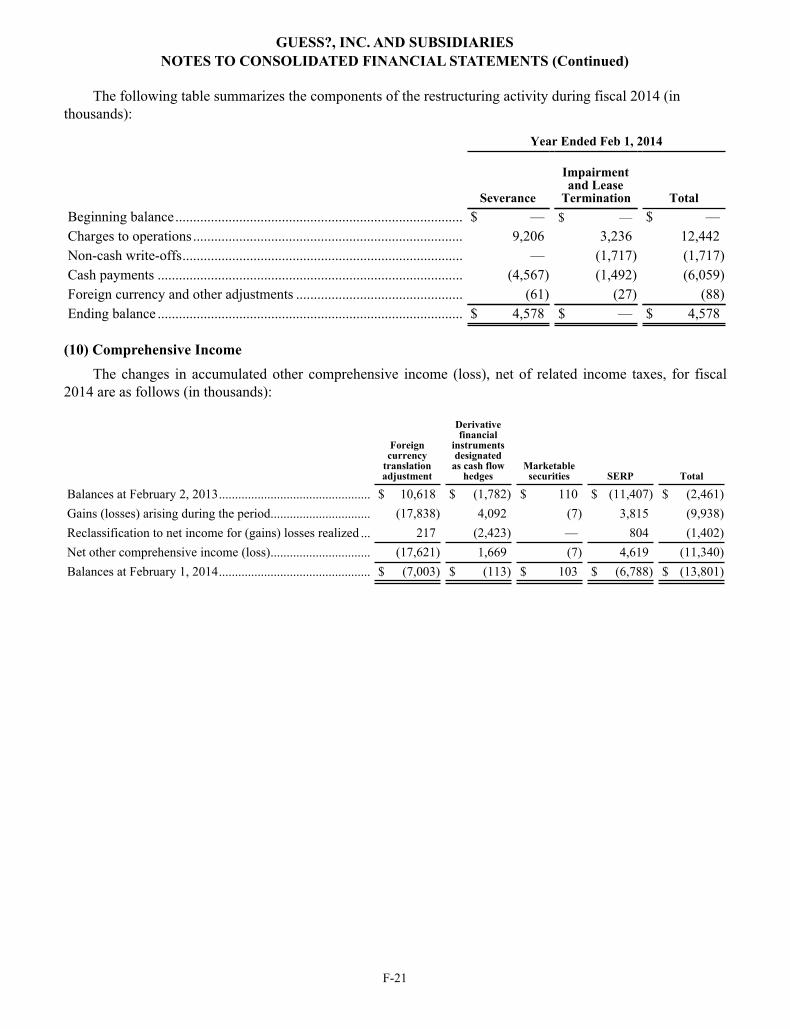
F-21
The following table summarizes the components of the restructuring activity during fiscal 2014 (in thousands):
Year Ended Feb 1, 2014
Severance
Impairmentand Lease
Termination TotalBeginning balance................................................................................. $ — $ — $ —Charges to operations............................................................................ 9,206 3,236 12,442Non-cash write-offs............................................................................... — (1,717) (1,717)Cash payments ...................................................................................... (4,567) (1,492) (6,059)Foreign currency and other adjustments ............................................... (61) (27) (88)Ending balance ...................................................................................... $ 4,578 $ — $ 4,578
(10) Comprehensive IncomeThe changes in accumulated other comprehensive income (loss), net of related income taxes, for fiscal
2014 are as follows (in thousands):
Foreigncurrency
translationadjustment
Derivativefinancial
instrumentsdesignated
as cash flowhedges
Marketablesecurities SERP Total
Balances at February 2, 2013............................................... $ 10,618 $ (1,782) $ 110 $ (11,407) $ (2,461)Gains (losses) arising during the period............................... (17,838) 4,092 (7) 3,815 (9,938)Reclassification to net income for (gains) losses realized ... 217 (2,423) — 804 (1,402)Net other comprehensive income (loss)............................... (17,621) 1,669 (7) 4,619 (11,340)Balances at February 1, 2014............................................... $ (7,003) $ (113) $ 103 $ (6,788) $ (13,801)
GUESS?, INC. AND SUBSIDIARIESNOTES TO CONSOLIDATED FINANCIAL STATEMENTS (Continued)

F-22
Details on reclassifications out of accumulated other comprehensive income (loss) to net income during fiscal 2014 are as follows (in thousands):
Year EndedLocation of (Gain)/Loss
Reclassified fromAccumulated OCI
into IncomeFeb 1, 2014
Foreign currency translation adjustment: Liquidation of investment in a foreign entity ....................................................... $ 217 Restructuring charges
217Derivative financial instruments designated as cash flow hedges: Foreign exchange currency contracts.................................................................... (3,050) Cost of sales Foreign exchange currency contracts.................................................................... (9) Other income/expense Less income tax effect ....................................................................................... 636 Income tax expense
(2,423)SERP: Actuarial loss amortization ................................................................................... 1,108 (1)
Prior service cost amortization.............................................................................. Less income tax effect .......................................................................................
194 (1)
(498) Income tax expense804
Total reclassifications during the period ended February 1, 2014........................... $ (1,402)__________________________________
(1) These accumulated other comprehensive income (loss) components are included in the computation of net periodic pension cost. Refer to Note 12 for further information.
(11) Income TaxesIncome tax expense (benefit) is summarized as follows (in thousands):
Year Ended Year Ended Year EndedFeb 1, 2014 Feb 2, 2013 Jan 28, 2012
Federal:Current................................................................................................ $ 61,239 $ 42,365 $ 84,994Deferred.............................................................................................. (20,294) 10,943 (3,136)
State:Current................................................................................................ 6,202 5,853 11,607Deferred.............................................................................................. (1,627) 1,494 (193)
Foreign:Current................................................................................................ 25,611 30,775 32,975Deferred.............................................................................................. 4,117 7,698 2,444
Total...................................................................................................... $ 75,248 $ 99,128 $ 128,691
Except where required by U.S. tax law, no provision was made for U.S. income taxes on the undistributed earnings of the foreign subsidiaries as the Company intends to utilize those earnings in the foreign operations for an indefinite period of time or repatriate such earnings only when tax-effective to do so. That portion of accumulated undistributed earnings of foreign subsidiaries as of February 1, 2014 and February 2, 2013 was approximately $747 million and $689 million, respectively.
GUESS?, INC. AND SUBSIDIARIESNOTES TO CONSOLIDATED FINANCIAL STATEMENTS (Continued)

F-23
Actual income tax expense differs from expected income tax expense obtained by applying the statutory federal income tax rate to earnings before income taxes as follows (in thousands):
Year Ended Year Ended Year EndedFeb 1, 2014 Feb 2, 2013 Jan 28, 2012
Computed “expected” tax expense....................................................... $ 81,536 $ 98,215 $ 139,769State taxes, net of federal benefit ......................................................... 2,974 4,776 7,419Incremental foreign taxes less than federal statutory tax rate .............. (10,107) (13,307) (19,457)Net tax settlements ............................................................................... — 12,832 —Unrecognized tax benefit...................................................................... 6,856 147 147Prior year tax adjustments .................................................................... (3,489) (2,300) (1,152)Other ..................................................................................................... (2,522) (1,235) 1,965Total...................................................................................................... $ 75,248 $ 99,128 $ 128,691
Total income tax expense (benefit) was allocated as follows (in thousands):
Year Ended Year Ended Year EndedFeb 1, 2014 Feb 2, 2013 Jan 28, 2012
Operations ............................................................................................ $ 75,248 $ 99,128 $ 128,691Stockholders’ equity............................................................................. 3,673 3,703 (208)Total income taxes................................................................................ $ 78,921 $ 102,831 $ 128,483
The tax effects of the components of other comprehensive income were allocated as follows (in thousands):
Year Ended Year Ended Year EndedFeb 1, 2014 Feb 2, 2013 Jan 28, 2012
Derivative financial instruments designated as cash flow hedges........ $ 237 $ (1,056) $ 1,170Marketable securities............................................................................ (4) 85 (24)SERP..................................................................................................... 2,963 2,855 (2,057)Total income tax expense (benefit)....................................................... $ 3,196 $ 1,884 $ (911)
Total earnings before income tax expense and noncontrolling interests were comprised of the following (in thousands):
Year Ended Year Ended Year EndedFeb 1, 2014 Feb 2, 2013 Jan 28, 2012
Domestic operations ............................................................................. $ 140,153 $ 169,755 $ 245,554Foreign operations ................................................................................ 92,806 110,859 153,787Earnings before income tax expense and noncontrolling interests ...... $ 232,959 $ 280,614 $ 399,341
GUESS?, INC. AND SUBSIDIARIESNOTES TO CONSOLIDATED FINANCIAL STATEMENTS (Continued)

F-24
The tax effects of temporary differences that give rise to significant portions of current and non-current deferred tax assets and deferred tax liabilities at February 1, 2014 and February 2, 2013 are presented below (in thousands):
Feb 1, 2014 Feb 2, 2013Deferred tax assets:
SERP ........................................................................................................................ $ 21,716 $ 22,719Rent expense ............................................................................................................ 14,986 14,680Fixed assets bases difference ................................................................................... 12,358 5,695Deferred income....................................................................................................... 11,261 1,642Deferred compensation ............................................................................................ 10,692 8,483Bad debt reserve....................................................................................................... 9,526 7,006Accrued bonus.......................................................................................................... 2,954 —Uniform capitalization ............................................................................................. 2,162 2,096Net operating losses ................................................................................................. 2,133 2,413Other......................................................................................................................... 13,111 17,014Total deferred assets................................................................................................. 100,899 81,748
Deferred tax liabilities:Lease incentives ....................................................................................................... (13,488) (10,819)Goodwill amortization ............................................................................................. (3,693) (3,189)Other......................................................................................................................... (492) (278)
Valuation allowance................................................................................................... (3,853) (3,346)Net deferred tax assets................................................................................................ $ 79,373 $ 64,116
Included above at February 1, 2014 and February 2, 2013, were $24.4 million and $21.1 million for current deferred tax assets, respectively, and $55.0 million and $43.1 million for non-current deferred tax assets, respectively. Based on the historical earnings of the Company and projections of future taxable income, management believes it is more likely than not that the results of operations will not generate sufficient taxable earnings to realize net deferred tax assets. Therefore, the Company has recorded a valuation allowance of $3.9 million, which is an increase of $0.5 million from the prior year.
At February 1, 2014, the Company’s U.S. and certain European retail operations had net operating loss carryforwards of $4.0 million and capital loss carryforwards of $0.2 million. These are comprised of $1.7 million of foreign operating loss carryforwards that expire between fiscal 2015 and fiscal 2023, $2.3 million of state operating loss carryforwards that expire between fiscal 2015 and fiscal 2018 and $0.2 million of U.S. capital loss carryforwards that expire in 2020. Based on the historical earnings of these operations, management believes that it is more likely than not that some of the operations will not generate sufficient income or capital gains to utilize all of the net operating loss and the capital loss. As of February 1, 2014 and February 2, 2013, the Company had a valuation allowance of $0.7 million and $0.9 million, respectively, related to its net operating loss carryforwards.
The Company accrues an amount for its estimate of additional income tax liability which the Company, more likely than not, could incur as a result of the ultimate resolution of income tax audits (“uncertain tax positions”). The Company reviews and updates the estimates used in the accrual for uncertain tax positions as more definitive information becomes available from taxing authorities, upon completion of tax audits, upon expiration of statutes of limitation, or upon occurrence of other events.
GUESS?, INC. AND SUBSIDIARIESNOTES TO CONSOLIDATED FINANCIAL STATEMENTS (Continued)

F-25
A reconciliation of the beginning and ending amount of gross unrecognized tax benefit (excluding interest and penalties) is as follows (in thousands):
Year Ended Year Ended Year EndedFeb 1, 2014 Feb 2, 2013 Jan 28, 2012
Beginning Balance ............................................................................... $ 4,527 $ 16,045 $ 10,828Additions:
Tax positions related to the prior year................................................ — — 4,782Tax positions related to the current year ............................................ 7,501 — 78
Reductions:Tax positions related to the prior year................................................ (1,128) (568) 357Settlements ......................................................................................... — (10,950) —Expiration of statutes of limitation..................................................... — — —
Ending Balance..................................................................................... $ 10,900 $ 4,527 $ 16,045
The amount of unrecognized tax benefit at February 1, 2014 includes $9.6 million (net of federal benefit on state issues) which, if ultimately recognized, may reduce our future annual effective tax rate. As of February 1, 2014 and February 2, 2013, the Company had $11.4 million and $5.0 million, respectively, of aggregate accruals for uncertain tax positions, including penalties and interest.
The Company’s practice is to recognize interest and/or penalties related to income tax matters in income tax expense. There were minimal interest and penalties related to uncertain tax positions included in net income tax expense for fiscal 2014. The Company included benefits from interest and penalties related to uncertain tax positions of $0.9 million and $5.8 million in net income tax expense for fiscal 2013 and fiscal 2012, respectively. Total interest and penalties related to uncertain tax positions was $0.5 million for each of the years ended February 1, 2014 and February 2, 2013.
The Company and its subsidiaries are subject to U.S. federal and foreign income tax as well as income tax of multiple state and foreign local jurisdictions. From time-to-time, the Company is subject to routine income tax audits on various tax matters around the world in the ordinary course of business. Although the Company has substantially concluded all U.S. federal, foreign, state and foreign local income tax matters for years through fiscal 2009, as of February 1, 2014, several income tax audits were underway in multiple jurisdictions for various periods after fiscal 2009. The Company does not believe that the resolution of open matters will have a material effect on the Company’s financial position or liquidity. Italian Tax Settlement
In January 2013, to avoid a potentially long and costly litigation process, the Company reached an agreement with the Italian tax authority regarding an ongoing audit of one of the Company’s Italian subsidiaries. The agreement covered fiscal years 2008 through 2013 (with fiscal year 2013 remaining subject to final documentation). As a result of the agreement during the fourth quarter of fiscal 2013, the Company recorded a settlement charge of $12.8 million (including penalty and interest and net of related offsets in other tax jurisdictions) in excess of prior uncertain tax position reserves of $11.7 million. As part of the agreement, a portion of the amount payable to the Italian tax authority will be payable in three installments during fiscal 2015. At February 1, 2014, there were no amounts included in other long-term liabilities in the Company’s consolidated balance sheet related to this agreement. At February 2, 2013, the Company included €9.1 million (US$12.4 million) in other long-term liabilities related to this agreement.
GUESS?, INC. AND SUBSIDIARIESNOTES TO CONSOLIDATED FINANCIAL STATEMENTS (Continued)

F-26
The Company was advised by its Italian counsel that tax audits like this one in Italy involving proposed income adjustments greater than €2 million are automatically referred for review by a public prosecutor who may seek to pursue charges or close the matter, and that resulting criminal charges, if any, would be instituted against individuals rather than against the affected companies under Italian law. Consistent with this process, a review proceeding by a prosecutor in Italy was initiated with respect to one current and two former members of the Guess European management team and the Company’s former President (as the signing officer for certain Italian tax returns covering the relevant periods). In July 2013, the matter was closed based on the prosecutor’s recommendation.
(12) Supplemental Executive Retirement PlanOn August 23, 2005, the Board of Directors of the Company adopted a Supplemental Executive Retirement
Plan (“SERP”) which became effective January 1, 2006. The SERP provides select employees who satisfy certain eligibility requirements with certain benefits upon retirement, termination of employment, death, disability or a change in control of the Company, in certain prescribed circumstances. Paul Marciano, Chief Executive Officer and Vice Chairman of the Board, is the only active employee participating in the SERP. Maurice Marciano, non-executive Chairman of the Board of Directors, was an active participant in the SERP until his retirement effective on January 28, 2012. Mr. Maurice Marciano will be eligible to receive vested SERP benefits in the future in accordance with the terms of the SERP.
In July 2013, the Company amended the SERP to limit the amount of eligible wages under the plan that count toward the SERP benefit for the active participant. As a result, the projected benefit obligation and unrecognized prior service cost were reduced by $4.5 million during fiscal 2014.
During the year ended January 28, 2012, the Company recorded a SERP curtailment expense of $1.2 million before taxes related to the accelerated amortization of prior service cost resulting from the retirement of Mr. Maurice Marciano as an employee and executive officer, effective upon the expiration of his employment agreement on January 28, 2012. Mr. Maurice Marciano did not receive or earn any additional SERP-related benefits in connection with his retirement and, as of the date of his retirement, ceased vesting or accruing any additional benefits under the terms of the SERP. Mr. Maurice Marciano’s retirement resulted in a significant reduction in the total expected remaining years of future service of all SERP participants combined, resulting in the pension curtailment during fiscal 2012.
As a non-qualified pension plan, no dedicated funding of the SERP is required; however, the Company has made, and expects to continue to make, periodic payments into insurance policies held in a rabbi trust to fund the expected obligations arising under the non-qualified SERP. The amount of future payments into the insurance policies may vary, depending on any changes to the estimates of final annual compensation levels and investment performance of the trust. The cash surrender values of the insurance policies were $51.4 million and $47.9 million as of February 1, 2014 and February 2, 2013, respectively, and were included in other assets in the Company’s consolidated balance sheets. As a result of changes in the value of the insurance policy investments, the Company recorded unrealized gains (losses) of $3.6 million, $3.4 million and ($0.2) million in other income and expense during fiscal 2014, fiscal 2013 and fiscal 2012, respectively.
In accordance with authoritative accounting guidance for defined benefit pension and other postretirement plans, an asset for a plan’s overfunded status or a liability for a plan’s underfunded status is recognized in the consolidated balance sheets; plan assets and obligations that determine the plan’s funded status are measured as of the end of the Company’s fiscal year; and changes in the funded status of defined benefit postretirement plans are recognized in the year in which they occur. Such changes are reported in other comprehensive income (loss) and as a separate component of stockholders’ equity.
GUESS?, INC. AND SUBSIDIARIESNOTES TO CONSOLIDATED FINANCIAL STATEMENTS (Continued)

F-27
The components of net periodic pension cost to comprehensive income for fiscal 2014, fiscal 2013 and fiscal 2012 were as follows (in thousands):
Year Ended Year Ended Year EndedFeb 1, 2014 Feb 2, 2013 Jan 28, 2012
Interest cost .......................................................................................... $ 2,345 $ 2,392 $ 2,641Net amortization of unrecognized prior service cost ........................... 194 620 940Net amortization of actuarial losses ..................................................... 1,108 3,340 2,048Curtailment expense............................................................................. — — 1,242Net periodic defined benefit pension cost............................................ $ 3,647 $ 6,352 $ 6,871Unrecognized prior service cost charged to comprehensive income... $ 194 $ 620 $ 940Unrecognized net actuarial loss charged to comprehensive income.... 1,108 3,340 2,048Actuarial gains (losses) ........................................................................ 1,751 3,508 (9,342)Plan amendment ................................................................................... 4,529 — —Curtailment expense............................................................................. — — 1,242Related tax impact................................................................................ (2,963) (2,855) 2,057Total periodic costs and other charges to comprehensive income....... $ 4,619 $ 4,613 $ (3,055)
Included in accumulated other comprehensive income (loss), before tax, as of February 1, 2014 and February 2, 2013 were the following amounts that have not yet been recognized in net periodic benefit cost (in thousands):
Feb 1, 2014 Feb 2, 2013Unrecognized prior service (credit) cost (1) ................................................................. $ (1,981) $ 2,742Unrecognized net actuarial loss .................................................................................... 12,974 15,832Total included in accumulated other comprehensive income (loss) ............................. $ 10,993 $ 18,574
_______________________________________________________________________________(1) During fiscal 2014, the Company amended the SERP to limit the amount of eligible wages under the plan that count
toward the SERP benefit for the active participant. As a result, unrecognized prior service cost was reduced by $4.5 million during fiscal 2014.
The following chart summarizes the SERP’s funded status and the amounts recognized in the Company’s consolidated balance sheets (in thousands):
Feb 1, 2014 Feb 2, 2013Projected benefit obligation .......................................................................................... $ (54,704) $ (58,639)Plan assets at fair value (1)............................................................................................ — —Net liability (included in other long-term liabilities) .................................................... $ (54,704) $ (58,639)
_______________________________________________________________________________(1) The SERP is a non-qualified pension plan and hence the insurance policies are not considered to be plan assets.
Accordingly, the table above does not include the insurance policies with cash surrender values of $51.4 million and $47.9 million at February 1, 2014 and February 2, 2013, respectively.
GUESS?, INC. AND SUBSIDIARIESNOTES TO CONSOLIDATED FINANCIAL STATEMENTS (Continued)
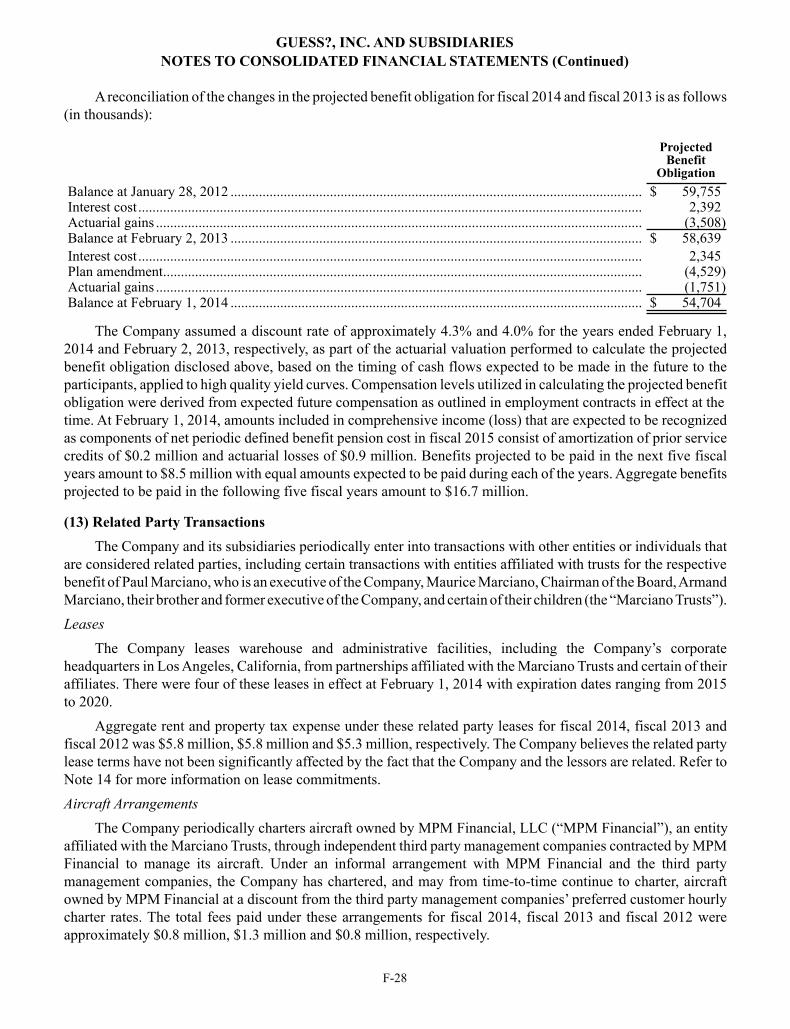
F-28
A reconciliation of the changes in the projected benefit obligation for fiscal 2014 and fiscal 2013 is as follows (in thousands):
Projected Benefit
ObligationBalance at January 28, 2012 .................................................................................................................... $ 59,755Interest cost .............................................................................................................................................. 2,392Actuarial gains ......................................................................................................................................... (3,508)Balance at February 2, 2013 .................................................................................................................... $ 58,639Interest cost .............................................................................................................................................. 2,345Plan amendment....................................................................................................................................... (4,529)Actuarial gains ......................................................................................................................................... (1,751)Balance at February 1, 2014 .................................................................................................................... $ 54,704
The Company assumed a discount rate of approximately 4.3% and 4.0% for the years ended February 1, 2014 and February 2, 2013, respectively, as part of the actuarial valuation performed to calculate the projected benefit obligation disclosed above, based on the timing of cash flows expected to be made in the future to the participants, applied to high quality yield curves. Compensation levels utilized in calculating the projected benefit obligation were derived from expected future compensation as outlined in employment contracts in effect at the time. At February 1, 2014, amounts included in comprehensive income (loss) that are expected to be recognized as components of net periodic defined benefit pension cost in fiscal 2015 consist of amortization of prior service credits of $0.2 million and actuarial losses of $0.9 million. Benefits projected to be paid in the next five fiscal years amount to $8.5 million with equal amounts expected to be paid during each of the years. Aggregate benefits projected to be paid in the following five fiscal years amount to $16.7 million.
(13) Related Party TransactionsThe Company and its subsidiaries periodically enter into transactions with other entities or individuals that
are considered related parties, including certain transactions with entities affiliated with trusts for the respective benefit of Paul Marciano, who is an executive of the Company, Maurice Marciano, Chairman of the Board, Armand Marciano, their brother and former executive of the Company, and certain of their children (the “Marciano Trusts”).Leases
The Company leases warehouse and administrative facilities, including the Company’s corporate headquarters in Los Angeles, California, from partnerships affiliated with the Marciano Trusts and certain of their affiliates. There were four of these leases in effect at February 1, 2014 with expiration dates ranging from 2015 to 2020.
Aggregate rent and property tax expense under these related party leases for fiscal 2014, fiscal 2013 and fiscal 2012 was $5.8 million, $5.8 million and $5.3 million, respectively. The Company believes the related party lease terms have not been significantly affected by the fact that the Company and the lessors are related. Refer to Note 14 for more information on lease commitments.Aircraft Arrangements
The Company periodically charters aircraft owned by MPM Financial, LLC (“MPM Financial”), an entity affiliated with the Marciano Trusts, through independent third party management companies contracted by MPM Financial to manage its aircraft. Under an informal arrangement with MPM Financial and the third party management companies, the Company has chartered, and may from time-to-time continue to charter, aircraft owned by MPM Financial at a discount from the third party management companies’ preferred customer hourly charter rates. The total fees paid under these arrangements for fiscal 2014, fiscal 2013 and fiscal 2012 were approximately $0.8 million, $1.3 million and $0.8 million, respectively.
GUESS?, INC. AND SUBSIDIARIESNOTES TO CONSOLIDATED FINANCIAL STATEMENTS (Continued)
F-29
Consulting ArrangementAfter serving for over 30 years as an executive and leader for Guess?, co-founder Maurice Marciano elected
to retire from his position as executive Chairman of the Board and as an employee of the Company upon the expiration of his employment agreement on January 28, 2012. Mr. Marciano continues to serve the Company as its non-executive Chairman of the Board. In addition, under the terms of his previously existing employment agreement, the Company and Mr. Marciano entered into a two-year consulting agreement (the “Marciano Consulting Agreement”) under which Mr. Marciano provided certain consulting services to the Company, including advice and counsel to the Company’s Chief Executive Officer and other senior executives. The Marciano Consulting Agreement, which had a two-year term that commenced on January 28, 2012, provided for consulting fees of $500,000 per year and continued automobile use in a manner consistent with past practice. In January 2014, the Company extended the Marciano Consulting Agreement for an additional one-year period. Total expenses incurred with respect to the Marciano Consulting Agreement were approximately $0.6 million for each of fiscal 2014 and fiscal 2013. There were no expenses incurred with respect to the Marciano Consulting Agreement in prior periods.Other Transactions
From time-to-time, the Company utilizes a third-party agent named Harmony Collection, LLC to produce specific apparel products on behalf of the Company. Armand Marciano, brother of Maurice and Paul Marciano, is part owner and an executive of the parent company of Harmony Collection, LLC. The total payments made by the Company under this arrangement for fiscal 2014, fiscal 2013 and fiscal 2012 were approximately $2.2 million, $0.6 million and $0.1 million, respectively. The Company believes that the price and transaction terms have not been significantly affected by the relationship between the parties.
(14) Commitments and ContingenciesLeases
The Company leases its showrooms and retail store locations under operating lease agreements expiring on various dates through September 2031. Some of these leases require the Company to make periodic payments for property taxes, utilities and common area operating expenses. Certain retail store leases provide for rents based upon the minimum annual rental amount and a percentage of annual sales volume, generally ranging from 3% to 12%, when specific sales volumes are exceeded. Some leases include lease incentives, rent abatements and fixed rent escalations, which are amortized and recorded over the initial lease term on a straight-line basis. The Company also leases some of its equipment under operating lease agreements expiring at various dates through October 2018. As discussed in further detail in Note 8, the Company leases a building in Florence, Italy under a capital lease.
GUESS?, INC. AND SUBSIDIARIESNOTES TO CONSOLIDATED FINANCIAL STATEMENTS (Continued)

F-30
Future minimum property and equipment lease payments under the capital lease and non-cancelable operating leases at February 1, 2014 are as follows (in thousands):
Operating LeasesCapitalLease
Non-RelatedParties
RelatedParties Total
Fiscal 2015 .............................................................. $ 2,128 $ 193,964 $ 4,675 $ 200,767Fiscal 2016 .............................................................. 2,130 166,378 4,570 173,078Fiscal 2017 .............................................................. 5,029 146,578 4,090 155,697Fiscal 2018 .............................................................. — 128,829 4,090 132,919Fiscal 2019 .............................................................. — 105,282 4,091 109,373Thereafter ................................................................ — 254,087 5,880 259,967Total minimum lease payments............................... $ 9,287 $ 995,118 $ 27,396 $ 1,031,801Less interest ............................................................ (650)Capital lease obligations ......................................... $ 8,637Less current portion ................................................ (1,769)Long-term capital lease obligations ........................ $ 6,868
Rental expense for all property and equipment operating leases during fiscal 2014, fiscal 2013 and fiscal 2012 aggregated $283.5 million, $273.4 million and $252.4 million, respectively, including percentage rent of $68.7 million, $81.4 million and $71.7 million, respectively.Purchase Commitments
Inventory purchase commitments as of February 1, 2014 were $210.3 million. These purchase commitments can be impacted by various factors, including the scheduling of market weeks, the timing of issuing orders, the timing of the shipment of orders and currency fluctuations. Accordingly, a comparison of purchase orders from period to period is not necessarily meaningful.Incentive Bonuses
Certain officers and key employees of the Company are eligible to receive annual cash incentive bonuses based on the achievement of certain performance criteria. These bonuses are based on performance measures such as earnings per share and earnings from operations of the Company or particular segments thereof, as well as other objective and subjective criteria as determined by the Compensation Committee of the Board of Directors. In addition to such annual incentive opportunities, Paul Marciano, Chief Executive Officer and Vice Chairman of the Company, received a $3.5 million special cash bonus in January 2012 related to the Company’s receipt of a fixed cash rights payment of $35.0 million from one of its licensees. Litigation
On May 6, 2009, Gucci America, Inc. filed a complaint in the U.S. District Court for the Southern District of New York against Guess?, Inc. and certain third-party licensees for the Company asserting, among other things, trademark and trade dress law violations and unfair competition. The complaint sought injunctive relief, compensatory damages, including treble damages, and certain other relief. Complaints similar to those in the above action have also been filed by Gucci entities against the Company and certain of its subsidiaries in the Court of Milan, Italy, the Court of Paris, France and the Intermediate People’s Court of Nanjing, China. The three week bench trial in the U.S. matter concluded on April 19, 2012, with the court issuing a preliminary ruling on May 21, 2012 and a final ruling on July 19, 2012. Although the plaintiff was seeking compensation in the U.S. matter in the form of damages of $26 million and an accounting of profits of $99 million, the final ruling provided for monetary damages of $2.3 million against the Company and $2.3 million against certain of its licensees. The court also granted narrow injunctions in favor of the plaintiff for certain of the claimed infringements. On August 20, 2012, the appeal period expired without any party having filed an appeal, rendering the judgment final. On May 2, 2013, the Court of Milan ruled in favor of the Company in the Milan, Italy matter. In the ruling, the Court rejected all of the plaintiff’s claims and ordered the cancellation of three of the plaintiff’s Italian and four of the
GUESS?, INC. AND SUBSIDIARIESNOTES TO CONSOLIDATED FINANCIAL STATEMENTS (Continued)

F-31
plaintiff’s European Community trademark registrations. On June 10, 2013, the plaintiff appealed the Court’s ruling in the Milan matter. In the China matter, the Intermediate People’s Court of Nanjing, China issued a ruling on November 8, 2013 granting an injunction in favor of the plaintiff for certain of the claimed infringements on handbags and small leather goods and awarding the plaintiff statutory damages in the amount of approximately $80,000. The Company strongly disagrees with the Court’s decision and has appealed the ruling. The judgment in the China matter is stayed pending the appeal.
On August 25, 2006, Franchez Isaguirre, a former employee of the Company, filed a complaint in the Superior Court of California, County of Los Angeles alleging violations by the Company of California wage and hour laws. The complaint was subsequently amended, adding a second former employee as an additional named party. The plaintiffs purport to represent a class of similarly situated employees in California who allegedly had been injured by not being provided adequate meal and rest breaks. The complaint seeks unspecified compensatory damages, statutory penalties, attorney’s fees and injunctive and declaratory relief. On June 9, 2009, the Court certified the class but immediately stayed the case pending the resolution of a separate California Supreme Court case on the standards of class treatment for meal and rest break claims. Following the Supreme Court ruling, the Superior Court denied the Company’s motions to decertify the class and to narrow the class in January 2013 and June 2013, respectively. The Company filed a writ petition in July 2013 challenging the Court’s decision not to narrow the class definitions. In January 2014, the Court of Appeals denied the writ petition. In February 2014, the Company petitioned the California Supreme Court for review of the Court of Appeals decision and is awaiting a ruling. No trial date has been set.
Although the Company believes that it has a strong position and will continue to vigorously defend each of these remaining matters, it is unable to predict with certainty whether or not these efforts will ultimately be successful or whether the outcomes will have a material impact on the Company’s financial position or results of operations.
The Company is also involved in various other claims and other matters incidental to the Company’s business, the resolution of which is not expected to have a material adverse effect on the Company’s financial position or results of operations. No material amounts were accrued as of February 1, 2014 or February 2, 2013 related to any of the Company’s legal proceedings. Redeemable Noncontrolling Interests
The Company is party to a put arrangement with respect to the common securities that represent the remaining noncontrolling interest from the acquisition of its majority-owned subsidiary, Guess Sud SAS (“Guess Sud”). The put arrangement for Guess Sud, representing 40% of the total outstanding equity interest of that subsidiary, may be exercised at the discretion of the noncontrolling interest holders by providing written notice to the Company any time after January 30, 2012. The put arrangement is recorded on the balance sheet at its expected redemption value and classified as a redeemable noncontrolling interest outside of permanent equity. On May 15, 2012, the Company and the noncontrolling interest holders executed an amendment to the Guess Sud put arrangement which modified the put price to be based on a method which approximates fair value instead of being based on a multiple of Guess Sud’s earnings before interest, taxes, depreciation and amortization. The redemption value of the Guess Sud redeemable put arrangement was $4.7 million and $3.1 million at February 1, 2014 and February 2, 2013, respectively.
During fiscal 2014, the Company entered into a new majority-owned joint venture to establish Guess Brasil Comércio e Distribuição S.A. ("Guess Brazil"). The Company funded $1.8 million to obtain a 60% interest in Guess Brazil and is subject to a put arrangement with respect to the common securities that represent the remaining noncontrolling interest. The put arrangement may be exercised at the discretion of the noncontrolling interest holder by providing written notice to the Company beginning in fiscal 2020, or sooner in certain limited circumstances, and every third anniversary thereafter subject to certain time restrictions. The redemption value of the Guess Brazil put arrangement is based on a multiple of Guess Brazil's earnings before interest, taxes,
GUESS?, INC. AND SUBSIDIARIESNOTES TO CONSOLIDATED FINANCIAL STATEMENTS (Continued)

F-32
depreciation and amortization subject to certain adjustments. The redemption value of the Guess Brazil redeemable put arrangement was $1.1 million at February 1, 2014.
The Company was previously party to a put arrangement in connection with its now wholly-owned subsidiary, Focus Europe S.r.l. (“Focus”). Under the terms of this put arrangement, which represented 25% of the total outstanding interest of that subsidiary, the noncontrolling interest holder had the option to exercise the put arrangement at its discretion by providing written notice to the Company no later than June 27, 2012. The redemption value of the put arrangement was determined based on a multiple of Focus’s net earnings. In June 2012, the noncontrolling interest holder notified the Company of its intent to exercise the put arrangement. On July 9, 2012, the Company paid $4.2 million to the noncontrolling interest holder to acquire the remaining 25% interest in Focus. This amount was determined based on a multiple of Focus’s net earnings in accordance with the terms of the put arrangement.
A reconciliation of the total carrying amount of redeemable noncontrolling interests for fiscal 2014 and fiscal 2013 is as follows (in thousands):
Year Ended Year EndedFeb 1, 2014 Feb 2, 2013
Beginning balance......................................................................................................... $ 3,144 $ 8,293Foreign currency translation adjustment ....................................................................... (104) 65Noncontrolling interest capital contribution ................................................................. 1,199 —Purchase of redeemable noncontrolling interest ........................................................... — (4,185)Redeemable noncontrolling interest redemption value adjustment .............................. 1,591 (1,029)Ending balance .............................................................................................................. $ 5,830 $ 3,144
(15) Savings PlansThe Company established the Guess?, Inc. Savings Plan (the “Savings Plan”) under Section 401(k) of the
Internal Revenue Code. Under the Savings Plan, employees (“associates”) may contribute up to 100% of their compensation per year subject to the elective limits as defined by IRS guidelines, and the Company may make matching contributions in amounts not to exceed 3.0% of the associates’ annual compensation. Investment selections consist of mutual funds and do not include any Company common stock. The Company’s contributions to the Savings Plan for fiscal 2014, fiscal 2013 and fiscal 2012 amounted to $1.3 million, $1.3 million and $1.2 million, respectively.
Effective January 1, 2006, the Company adopted a Non-qualified Deferred Compensation Plan (the “DCP”). Under the DCP, select employees who satisfy certain eligibility requirements and members of the Board of Directors may make annual irrevocable elections to defer a portion of their base compensation and/or bonuses. The deferred amounts and earnings thereon are payable to participants at specified future distribution dates, upon termination of employment, retirement, disability, death or change in control of the Company, in a lump sum or installments, pursuant to elections under the rules of the DCP. The participants to the DCP have an unsecured contractual commitment by the Company to pay the amounts due under the DCP. The Company has purchased corporate-owned life insurance, which is held in a rabbi trust, to offset this liability. The assets held in the rabbi trust are not available for general corporate purposes except in the event of bankruptcy of the Company. All earnings and expenses of the rabbi trust are reported in the Company’s consolidated statement of income in other income and expenses. For fiscal 2014, fiscal 2013 and fiscal 2012, the Company incurred gains (losses) of $0.6 million, $0.4 million and $(0.1) million, respectively, related to the change in the value of the insurance policy investments. The deferred compensation liability as of February 1, 2014 and February 2, 2013 was $7.5 million and $7.6 million, respectively. The related long-term asset as of February 1, 2014 and February 2, 2013 was $9.1 million and $8.5 million, respectively.
GUESS?, INC. AND SUBSIDIARIESNOTES TO CONSOLIDATED FINANCIAL STATEMENTS (Continued)

F-33
(16) Quarterly Information (Unaudited)The following is a summary of the unaudited quarterly financial information for fiscal 2014 and fiscal
2013 (in thousands, except per share data):
Quarterly Periods Ended (1)
Year ended February 1, 2014May 4,2013
Aug 3,2013
Nov 2,2013
Feb 1,2014
Net revenue .......................................................................... $ 548,914 $ 639,012 $ 613,497 $ 768,363Gross profit .......................................................................... 197,426 248,532 228,227 301,949Net earnings ......................................................................... 11,100 40,703 34,811 71,097Net earnings attributable to Guess?, Inc. ............................. 9,916 39,866 34,020 69,632Net earnings per common share attributable to commonstockholders: (2) (3)
Basic................................................................................... $ 0.12 $ 0.47 $ 0.40 $ 0.82Diluted................................................................................ $ 0.12 $ 0.47 $ 0.40 $ 0.82
Quarterly Periods Ended (1)
Year ended February 2, 2013Apr 28,
2012Jul 28,2012
Oct 27,2012
Feb 2,2013
Net revenue ...................................................................... $ 579,266 $ 635,393 $ 628,828 $ 815,118Gross profit ...................................................................... 235,076 251,560 247,609 332,878Net earnings ..................................................................... 27,213 42,949 37,459 73,865Net earnings attributable to Guess?, Inc. ......................... 26,646 42,899 36,647 72,552Net earnings per common share attributable to commonstockholders: (2) (4)
Basic .............................................................................. $ 0.30 $ 0.49 $ 0.43 $ 0.85Diluted ........................................................................... $ 0.30 $ 0.49 $ 0.43 $ 0.85
___________________________________________________________________________(1) All fiscal quarters presented consisted of 13 weeks with the exception of the quarter ended February 2, 2013 which
consisted of 14 weeks.
(2) Per common share amounts for the quarters and full years have been calculated separately. Accordingly, quarterly amounts may not add to the annual amount because of differences in the average common shares outstanding during each period.
(3) During the first quarter of fiscal 2014, the Company implemented plans to streamline its structure and reduce expenses in both Europe and North America. During the second quarter of fiscal 2014, the Company expanded these plans to include the consolidation and streamlining of certain operations in Europe and Asia. These actions resulted in restructuring charges of $2.3 million, $6.1 million, $1.9 million and $2.1 million, respectively, during the first, second, third and fourth quarters of fiscal 2014. Refer to Note 9 for further detail regarding the restructuring charges.
(4) In January 2013, the Company settled a tax audit dispute in Italy, resulting in a charge of $12.8 million in the fourth quarter of fiscal 2013 in excess of amounts previously reserved, which was partially offset by unrelated tax benefits of $4.0 million. Refer to Note 11 for further detail regarding the tax settlement charge.
GUESS?, INC. AND SUBSIDIARIESNOTES TO CONSOLIDATED FINANCIAL STATEMENTS (Continued)
F-34
(17) Segment InformationThe Company’s reportable business segments and respective accounting policies of the segments are the
same as those described in Note 1. Management evaluates segment performance based primarily on revenues and earnings from operations before restructuring charges, if any. Corporate overhead, restructuring charges, interest income, interest expense and other income and expense are evaluated on a consolidated basis and not allocated to the Company’s business segments.
Segment information is summarized as follows (in thousands):
Year Ended Year Ended Year EndedFeb 1, 2014 Feb 2, 2013 Jan 28, 2012
Net revenue:North American Retail ....................................................................... $ 1,075,475 $ 1,116,836 $ 1,117,643Europe ................................................................................................ 903,791 939,599 1,010,896Asia .................................................................................................... 292,714 290,655 250,727North American Wholesale................................................................ 179,600 194,373 187,362Licensing............................................................................................ 118,206 117,142 121,420
$ 2,569,786 $ 2,658,605 $ 2,688,048Total net revenueEarnings (loss) from operations:
North American Retail ....................................................................... $ 39,540 $ 78,285 $ 133,184Europe ................................................................................................ 97,231 103,975 167,014Asia .................................................................................................... 25,592 26,525 28,463North American Wholesale................................................................ 38,771 45,008 47,162Licensing............................................................................................ 107,805 101,182 108,638Corporate Overhead ........................................................................... (73,910) (80,450) (87,226)Restructuring Charges........................................................................ (12,442) — —
$ 222,587 $ 274,525 $ 397,235Total earnings from operationsCapital expenditures:
North American Retail ....................................................................... $ 29,980 $ 49,759 $ 65,329Europe ................................................................................................ 30,994 31,930 38,818Asia .................................................................................................... 7,150 8,614 10,696North American Wholesale................................................................ 4,870 2,725 1,541Licensing............................................................................................ 39 40 24Corporate Overhead ........................................................................... 2,405 6,523 7,123
Total capital expenditures $ 75,438 $ 99,591 $ 123,531
Feb 1, 2014 Feb 2, 2013Total assets:
North American Retail ....................................................................... $ 333,479 $ 353,875Europe ................................................................................................ 819,999 873,988Asia .................................................................................................... 158,798 144,825North American Wholesale................................................................ 141,482 111,373Licensing............................................................................................ 14,458 6,945Corporate Overhead ........................................................................... 296,215 222,500
Total assets $ 1,764,431 $ 1,713,506
GUESS?, INC. AND SUBSIDIARIESNOTES TO CONSOLIDATED FINANCIAL STATEMENTS (Continued)
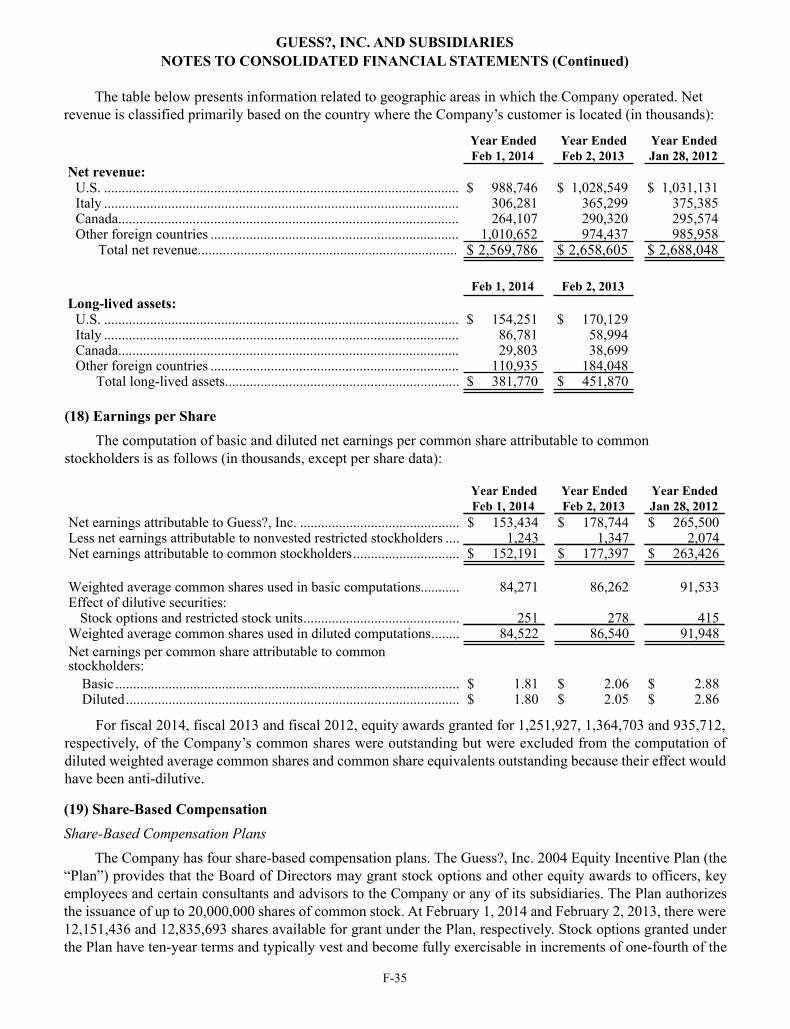
F-35
The table below presents information related to geographic areas in which the Company operated. Net revenue is classified primarily based on the country where the Company’s customer is located (in thousands):
Year Ended Year Ended Year EndedFeb 1, 2014 Feb 2, 2013 Jan 28, 2012
Net revenue:U.S. .................................................................................................... $ 988,746 $ 1,028,549 $ 1,031,131Italy .................................................................................................... 306,281 365,299 375,385Canada................................................................................................ 264,107 290,320 295,574Other foreign countries ...................................................................... 1,010,652 974,437 985,958
Total net revenue $ 2,569,786 $ 2,658,605 $ 2,688,048
Feb 1, 2014 Feb 2, 2013Long-lived assets:
U.S. .................................................................................................... $ 154,251 $ 170,129Italy .................................................................................................... 86,781 58,994Canada................................................................................................ 29,803 38,699Other foreign countries ...................................................................... 110,935 184,048
Total long-lived assets $ 381,770 $ 451,870
(18) Earnings per ShareThe computation of basic and diluted net earnings per common share attributable to common
stockholders is as follows (in thousands, except per share data):
Year Ended Year Ended Year EndedFeb 1, 2014 Feb 2, 2013 Jan 28, 2012
Net earnings attributable to Guess?, Inc. ............................................. $ 153,434 $ 178,744 $ 265,500Less net earnings attributable to nonvested restricted stockholders .... 1,243 1,347 2,074Net earnings attributable to common stockholders.............................. $ 152,191 $ 177,397 $ 263,426
Weighted average common shares used in basic computations........... 84,271 86,262 91,533Effect of dilutive securities:
Stock options and restricted stock units............................................ 251 278 415Weighted average common shares used in diluted computations........ 84,522 86,540 91,948Net earnings per common share attributable to commonstockholders:
Basic ................................................................................................. $ 1.81 $ 2.06 $ 2.88Diluted.............................................................................................. $ 1.80 $ 2.05 $ 2.86
For fiscal 2014, fiscal 2013 and fiscal 2012, equity awards granted for 1,251,927, 1,364,703 and 935,712, respectively, of the Company’s common shares were outstanding but were excluded from the computation of diluted weighted average common shares and common share equivalents outstanding because their effect would have been anti-dilutive.
(19) Share-Based CompensationShare-Based Compensation Plans
The Company has four share-based compensation plans. The Guess?, Inc. 2004 Equity Incentive Plan (the “Plan”) provides that the Board of Directors may grant stock options and other equity awards to officers, key employees and certain consultants and advisors to the Company or any of its subsidiaries. The Plan authorizes the issuance of up to 20,000,000 shares of common stock. At February 1, 2014 and February 2, 2013, there were 12,151,436 and 12,835,693 shares available for grant under the Plan, respectively. Stock options granted under the Plan have ten-year terms and typically vest and become fully exercisable in increments of one-fourth of the
GUESS?, INC. AND SUBSIDIARIESNOTES TO CONSOLIDATED FINANCIAL STATEMENTS (Continued)

F-36
shares granted on each anniversary from the date of grant. Stock awards/units granted under the Plan typically vest in increments of one-fourth of the shares granted on each anniversary from the date of grant. The three most recent annual grants for stock options and other equity awards had initial vesting periods of nine months followed by three annual vesting periods. The Guess?, Inc. Employee Stock Purchase Plan (“ESPP”) allows for qualified employees to participate in the purchase of designated shares of the Company’s common stock at a price equal to 85% of the lower of the closing price at the beginning or end of each quarterly stock purchase period. The Guess?, Inc. 2006 Non-Employee Directors’ Stock Grant and Stock Option Plan (the “Director Plan”) provides for the grant of equity awards to non-employee directors. The Director Plan authorizes the issuance of up to 2,000,000 shares of common stock which consists of 1,000,000 shares that were initially approved for issuance on July 30, 1996 plus an additional 1,000,000 shares that were approved for issuance effective May 9, 2006. At February 1, 2014 and February 2, 2013, there were 860,432 and 899,931 shares available for grant under this plan, respectively. In addition, the Guess?, Inc. 1996 Equity Incentive Plan, under which equity grants have not been permitted since the approval of the Plan in 2004, continues to govern outstanding awards previously made thereunder.Performance Awards
On July 11, 2013, the Company granted 100,000 nonvested stock units to Paul Marciano, the Company’s Chief Executive Officer and Vice Chairman of the Board, in connection with a new employment agreement entered into between the Company and Mr. Paul Marciano. The nonvested stock units have an initial vesting period of seven months followed by two annual vesting periods, which were subject to the achievement of performance-based vesting conditions for the last three quarters of fiscal 2014. The Company also granted a target of 143,700 nonvested stock units to Mr. Paul Marciano, of which approximately 84% are expected to vest based on the achievement of performance-based conditions for the last three quarters of fiscal 2014. Such shares are scheduled to vest on February 1, 2016.
On May 1, 2008, the Company granted an aggregate of 167,000 nonvested stock awards to certain employees which were subject to certain annual performance-based vesting conditions over a five-year period. On October 30, 2008, the Company granted an aggregate of 563,400 nonvested stock options to certain employees scheduled to vest over a four-year period, which were subject to the achievement of performance-based vesting conditions for fiscal 2010. During the first quarter of fiscal 2010, the Compensation Committee determined that the performance goals established in the prior year were no longer set at an appropriate level to incentivize and help retain employees given the greater than previously anticipated deterioration of the economy that had occurred since the goals were established. Therefore, in April 2009, the Compensation Committee modified the performance goals of that year’s tranche of the outstanding performance-based stock awards and options to address the challenges associated with the economic environment. During first quarter of fiscal 2011, fiscal 2012 and fiscal 2013, the Compensation Committee modified the performance goals of the respective year’s tranche of the outstanding performance-based stock awards to address the continuing challenges associated with the economic environment. None of the modifications had a material impact on the consolidated financial statements of the Company.Consulting Arrangement
On June 18, 2011, Maurice Marciano, the Company’s then-serving executive Chairman of the Board of Directors, notified the Company of his decision to retire as an employee and executive officer effective January 28, 2012, the end of fiscal 2012. Mr. Maurice Marciano continues to serve as non-executive Chairman of the Board of Directors. In accordance with the terms of Mr. Maurice Marciano’s employment agreement, the Company and Mr. Maurice Marciano entered into a two-year consulting agreement, under which Mr. Maurice Marciano provided certain consulting services to the Company through January 2014. In January 2014, the consulting agreement was extended for an additional one-year period. In connection with the ongoing services to be provided, Mr. Maurice Marciano’s outstanding equity awards were modified to provide that all awards that would have otherwise been unvested and forfeited at January 28, 2012, will continue to vest in accordance with the original vesting terms for as long as Mr. Maurice Marciano continues to serve as a member of the Board of Directors of the Company. The
GUESS?, INC. AND SUBSIDIARIESNOTES TO CONSOLIDATED FINANCIAL STATEMENTS (Continued)

F-37
original grant date fair value of the modified equity awards aggregated $4.7 million while the modified grant date fair value aggregated $5.0 million. As a result of the modification, compensation expense of $2.5 million was accelerated and recorded in fiscal 2012.Share-Based Compensation Expense
Compensation expense for nonvested stock options and stock awards is recognized on a straight-line basis over the vesting period. The Company estimates forfeitures in calculating the expense relating to share-based compensation as opposed to recognizing forfeitures as an expense reduction as they occur.
The following table summarizes the share-based compensation expense recognized under all of the Company’s stock plans during fiscal 2014, fiscal 2013 and fiscal 2012 (in thousands):
Year Ended Year Ended Year EndedFeb 1, 2014 Feb 2, 2013 Jan 28, 2012
Stock options........................................................................................ $ 2,490 $ 4,633 $ 7,123Nonvested stock awards/units .............................................................. 11,225 11,337 20,584ESPP..................................................................................................... 234 315 393Total share-based compensation expense............................................. $ 13,949 $ 16,285 $ 28,100
Stock optionsThe following table summarizes the stock option activity under all of the Company’s stock plans during
fiscal 2014:
Number ofShares
Weighted-AverageExercise
Price
Weighted-Average
RemainingContractualTerm (Years)
AggregateIntrinsic
Value($000’s)
Options outstanding at February 2, 2013 .................................. 1,814,466 $ 30.57Granted.................................................................................... 583,500 26.87Exercised................................................................................. (245,350) 20.47Forfeited .................................................................................. (370,690) 31.98Expired .................................................................................... — —
Options outstanding at February 1, 2014 .................................. 1,781,926 $ 30.46 6.71 $ 4,675Exercisable at February 1, 2014................................................ 1,150,655 $ 30.99 5.57 $ 3,923Options exercisable and expected to vest at February 1, 2014 . 1,718,223 $ 30.52 6.62 $ 4,597
The fair value of each stock option was estimated on the grant date using the Black-Scholes option-pricing model with the following weighted-average assumptions used for grants during fiscal 2014, fiscal 2013 and fiscal 2012:
Year Ended Year Ended Year EndedValuation Assumptions Feb 1, 2014 Feb 2, 2013 Jan 28, 2012Risk-free interest rate....................................................................... 0.5% 0.4% 1.1%Expected stock price volatility......................................................... 39.7% 46.8% 48.5%Expected dividend yield .................................................................. 3.0% 2.6% 2.2%Expected life of stock options in years ............................................ 3.7 3.6 3.7
The risk-free interest rate is based on the U.S. Treasury yield curve in effect for the expected term of the option at the time of grant. The expected volatility is determined based on an average of both historical volatility and implied volatility. Implied volatility is derived from exchange traded options on the Company’s common stock. The expected dividend yield is based on the Company’s history and expectations of dividend payouts. The expected life is determined based on historical trends. The expected forfeiture rate is determined based on historical data.
GUESS?, INC. AND SUBSIDIARIESNOTES TO CONSOLIDATED FINANCIAL STATEMENTS (Continued)

F-38
The weighted-average grant-date fair value of options granted was $6.38, $8.92 and $11.58 during fiscal 2014, fiscal 2013 and fiscal 2012, respectively. The total intrinsic value of stock options exercised during fiscal 2014, fiscal 2013 and fiscal 2012 was $2.2 million, $3.4 million and $5.9 million, respectively. The intrinsic value of stock options is defined as the difference between the Company’s stock price on the exercise date and the grant-date exercise price. The total cash received from option exercises was $5.0 million, $5.1 million and $7.2 million during fiscal 2014, fiscal 2013 and fiscal 2012, respectively.
The excess tax benefit realized for the tax deductions from option exercises for fiscal 2014 was $0.3 million and has been included in cash flows from financing activities for fiscal 2014. The excess tax shortfall of $0.8 million was included in cash flows from operating activities for fiscal 2014. The compensation expense included in SG&A expense recognized was $2.5 million before the recognized income tax benefit of $0.9 million during fiscal 2014. As of February 1, 2014, there was approximately $3.9 million of unrecognized compensation cost, adjusted for estimated forfeitures, related to nonvested stock options. This cost is expected to be recognized over a weighted-average period of 1.7 years.Nonvested stock awards/units
The following table summarizes the nonvested stock awards/units activity under all of the Company’s stock plans during fiscal 2014:
Number ofShares/Units
Weighted-Average
Grant-DateFair Value
Nonvested at February 2, 2013......................................................................................... 721,497 $ 33.17Granted ........................................................................................................................... 819,966 28.34Vested............................................................................................................................. (268,788) 33.39Forfeited ......................................................................................................................... (309,020) 30.79
Nonvested at February 1, 2014......................................................................................... 963,655 $ 29.76
The weighted-average grant-date fair value of nonvested stock awards/units granted was $28.34, $29.71 and $38.98 during fiscal 2014, fiscal 2013 and fiscal 2012, respectively. The total fair value at grant date of previously nonvested stock awards/units that were vested during fiscal 2014, fiscal 2013 and fiscal 2012 was $9.0 million, $17.5 million and $19.4 million, respectively. During fiscal 2014, fiscal 2013 and fiscal 2012, the total intrinsic value of nonvested stock awards/units that vested was $8.3 million, $15.0 million and $19.3 million, respectively.
The excess tax benefit realized for the tax deductions from vested shares and dividends paid on unvested shares for fiscal 2014 was $0.4 million and has been included in cash flows from financing activities for fiscal 2014. The excess tax shortfall of $0.3 million was included in cash flows from operating activities for fiscal 2014. The total intrinsic value of nonvested stock awards/units outstanding and unvested at February 1, 2014 was $27.0 million. The compensation expense included in SG&A expense recognized during fiscal 2014 was $11.2 million before the recognized income tax benefit of $3.8 million. As of February 1, 2014, there was approximately $20.6 million of total unrecognized compensation cost, adjusted for estimated forfeitures, related to nonvested stock awards/units. This cost is expected to be recognized over a weighted-average period of 1.8 years.ESPP
In January 2002, the Company established an ESPP, the terms of which allow for qualified employees (as defined) to participate in the purchase of designated shares of the Company’s common stock at a price equal to 85% of the lower of the closing price at the beginning or end of each quarterly stock purchase period. Prior to March 4, 2009, the ESPP was a straight purchase plan with no holding period requirement. Effective March 4, 2009, the ESPP was amended to require participants to hold any shares purchased under the ESPP after April 1, 2009 for a minimum period of six months after purchase. In addition, all Company employees are subject to the terms of the Company’s securities trading policy which generally prohibits the purchase or sale of any Company securities during the two weeks before the end of each fiscal quarter through two days after the public announcement
GUESS?, INC. AND SUBSIDIARIESNOTES TO CONSOLIDATED FINANCIAL STATEMENTS (Continued)

F-39
by the Company of its earnings for that period. On January 23, 2002, the Company filed with the SEC a Registration Statement on Form S-8 registering 4,000,000 shares of common stock for the ESPP. Effective March 12, 2012, the ESPP was amended and restated to extend the term for an additional ten years.
During fiscal 2014, fiscal 2013 and fiscal 2012, 43,265 shares, 50,013 shares and 47,456 shares of the Company’s common stock were issued pursuant to the ESPP at an average price of $22.64, $23.72 and $29.00 per share, respectively.
The fair value of stock compensation expense associated with the Company’s ESPP was estimated on the date of grant using the Black-Scholes option-pricing valuation model with the following weighted-average assumptions used for grants during fiscal 2014, fiscal 2013 and fiscal 2012.
Year Ended Year Ended Year EndedValuation Assumptions Feb 1, 2014 Feb 2, 2013 Jan 28, 2012Risk-free interest rate ........................................................................... 0.1% 0.1% 0.1%Expected stock price volatility ............................................................. 29.7% 46.4% 49.0%Expected dividend yield....................................................................... 3.1% 2.8% 2.2%Expected life of ESPP options (in months).......................................... 3 3 3
The weighted-average grant-date fair value of ESPP options granted during fiscal 2014, fiscal 2013 and fiscal 2012 was $5.46, $6.84 and $9.35, respectively.
(20) Fair Value MeasurementsAuthoritative guidance defines fair value as the price that would be received to sell an asset or paid to transfer
a liability in an orderly transaction between market participants at the measurement date. The guidance establishes a fair value hierarchy, which prioritizes the inputs used in measuring fair value into three broad levels as follows:
Level 1—Inputs are unadjusted quoted prices in active markets for identical assets or liabilities that can be accessed at the measurement date.
Level 2—Inputs include quoted prices for similar assets and liabilities in active markets, quoted prices for identical or similar assets or liabilities in markets that are not active, inputs other than quoted prices that are observable for the asset or liability (i.e. interest rates, yield curves, etc.), and inputs that are derived principally from or corroborated by observable market data by correlation or other means (market corroborated inputs).
Level 3—Unobservable inputs that reflect assumptions about what market participants would use in pricing the asset or liability. These inputs would be based on the best information available, including the Company’s own data.
GUESS?, INC. AND SUBSIDIARIESNOTES TO CONSOLIDATED FINANCIAL STATEMENTS (Continued)

F-40
The following table presents the fair value hierarchy for those assets and liabilities measured at fair value on a recurring basis as of February 1, 2014 and February 2, 2013 (in thousands):
Recurring Fair Value Measures
Fair Value Measurements at Feb 2,
Level 1 Level 2 Level 3 Total Level 1 Level 2 Level 3 TotalAssets:
Foreign exchange currency contracts ... $ — $ 2,116 $ — $ 2,116 $ — $ 1,358 $ — $ 1,358Available-for-sale securities................. 5,732 — — 5,732 12,630 — — 12,630Total...................................................... $ 5,732 $ 2,116 $ — $ 7,848 $12,630 $ 1,358 $ — $13,988
Liabilities:Foreign exchange currency contracts ... $ — $ 1,712 $ — $ 1,712 $ — $ 5,552 $ — $ 5,552Interest rate swap.................................. — 581 — 581 — 852 — 852Deferred compensation obligations...... — 7,498 — 7,498 — 7,574 — 7,574Total...................................................... $ — $ 9,791 $ — $ 9,791 $ — $13,978 $ — $13,978
There were no transfers of financial instruments between the three levels of fair value hierarchy during fiscal 2014 and fiscal 2013.
The fair values of the Company’s available-for-sale securities are based on quoted prices. The fair value of interest rate swaps are based on inputs corroborated by observable market data. Foreign exchange forward contracts are entered into by the Company principally to hedge the future payment of inventory and intercompany transactions by non-U.S. subsidiaries. Periodically, the Company may also use foreign currency forward contracts to hedge the translation and economic exposures related to its net investments in certain of its international subsidiaries. The fair values of the Company’s foreign exchange forward contracts are based on quoted foreign exchange forward rates at the reporting date. Deferred compensation obligations to employees are adjusted based on changes in the fair value of the underlying employee-directed investments. Fair value of these obligations is based upon inputs corroborated by observable market data.
Available-for-sale securities are recorded at fair value and are included in short-term investments and other assets in the accompanying consolidated balance sheets depending on their respective maturity dates. At February 1, 2014, available-for-sale securities consisted of $5.1 million of corporate bonds which mature in September 2014 and $0.6 million of marketable equity securities. At February 2, 2013, available-for-sale securities consisted of $10.3 million of corporate bonds, $1.8 million of certificates of deposit and $0.5 million of marketable equity securities. Corporate bonds of $5.5 million, which were classified as available-for-sale securities, were sold during fiscal 2013. The cost of securities sold is based on the specific identification method. Gains recognized during fiscal 2013 were minimal as a result of this sale and were included in other income and expense. Unrealized gains (losses), net of taxes, are included as a component of stockholders’ equity and comprehensive income (loss). The accumulated unrealized gains, net of taxes, included in accumulated other comprehensive income (loss) related to available-for-sale securities owned by the Company were $0.1 million for each of the years ended February 1, 2014 and February 2, 2013.
The carrying amount of the Company’s remaining financial instruments, which principally include cash and cash equivalents, trade receivables, accounts payable and accrued expenses, approximates fair value due to the relatively short maturity of such instruments. The fair values of the Company’s debt instruments (see Note 8) are based on the amount of future cash flows associated with each instrument discounted using the Company’s incremental borrowing rate. At February 1, 2014 and February 2, 2013, the carrying value of all financial instruments was not materially different from fair value, as the interest rates on variable-rate debt including the capital lease obligation approximated rates currently available to the Company.
GUESS?, INC. AND SUBSIDIARIESNOTES TO CONSOLIDATED FINANCIAL STATEMENTS (Continued)

F-41
(21) Derivative Financial InstrumentsHedging Strategy
The Company operates in foreign countries, which exposes it to market risk associated with foreign currency exchange rate fluctuations. The Company has entered into certain forward contracts to hedge the risk of foreign currency rate fluctuations. The Company has elected to apply the hedge accounting rules in accordance with authoritative guidance for certain of these hedges.
The Company’s primary objective is to hedge the variability in forecasted cash flows due to the foreign currency risk. Various transactions that occur primarily in Canada, Europe and South Korea are denominated in U.S. dollars and British pounds and thus are exposed to earnings risk as a result of exchange rate fluctuations when converted to their functional currencies. These types of transactions include U.S. dollar denominated purchases of merchandise and U.S. dollar and British pound denominated intercompany liabilities. In addition, certain operating expenses and tax liabilities are denominated in Swiss francs and are exposed to earnings risk as a result of exchange rate fluctuations when converted to the functional currency. The Company enters into derivative financial instruments, including forward exchange contracts, to offset some but not all of the exchange risk on certain of these anticipated foreign currency transactions.
Periodically, the Company may also use foreign currency forward contracts to hedge the translation and economic exposures related to its net investments in certain of its international subsidiaries.
The impact of the credit risk of the counterparties to the derivative contracts is considered in determining the fair value of the foreign currency forward contracts. As of February 1, 2014, credit risk has not had a significant effect on the fair value of the Company’s foreign currency contracts.
The Company also has interest rate swap agreements, which are not designated as hedges for accounting purposes, to effectively convert its floating-rate debt to a fixed-rate basis. The principal objective of these contracts is to eliminate or reduce the variability of the cash flows in interest payments associated with the Company’s variable-rate capital lease obligation, thus reducing the impact of interest rate changes on future interest payment cash flows. For fiscal 2014, the Company recorded a net gain of $0.2 million in other income related to the interest rate swaps. Refer to Note 8 for further information.Hedge Accounting Policy
U.S. dollar forward contracts are used to hedge forecasted merchandise purchases over specific months. Changes in the fair value of these U.S. dollar forward contracts, designated as cash flow hedges, are recorded as a component of accumulated other comprehensive income (loss) within stockholders’ equity and are recognized in cost of product sales in the period which approximates the time the hedged merchandise inventory is sold. The Company also hedges forecasted intercompany royalties over specific months. Changes in the fair value of these U.S. dollar forward contracts, designated as cash flow hedges, are recorded as a component of accumulated other comprehensive income (loss) within stockholders’ equity and are recognized in other income and expense in the period in which the royalty expense is incurred.
U.S. dollar forward contracts are also used to hedge the net investments of certain of the Company’s international subsidiaries over specific months. Changes in the fair value of these U.S. dollar forward contracts, designated as net investment hedges, are recorded in foreign currency translation adjustment as a component of accumulated other comprehensive income (loss) within stockholders’ equity and are not recognized in income until the sale or liquidation of the hedged net investment.
The Company also has foreign currency contracts that are not designated as hedging instruments for accounting purposes. Changes in fair value of foreign currency contracts not qualifying as cash flow hedges or net investment hedges are reported in net earnings as part of other income and expense.
GUESS?, INC. AND SUBSIDIARIESNOTES TO CONSOLIDATED FINANCIAL STATEMENTS (Continued)

F-42
Summary of Derivative InstrumentsThe fair value of derivative instruments in the consolidated balance sheets as of February 1, 2014 and
February 2, 2013 was as follows (in thousands):
DerivativeBalance Sheet
Location
Fair Valueat Feb 1,
2014
Fair Valueat Feb 2,
2013ASSETS:Derivatives designated as hedging instruments:
Foreign exchange currency contracts:Cash flow hedges............................................................. Other current assets $ 977 $ 387
Derivatives not designated as hedging instruments:Foreign exchange currency contracts ................................... Other current assets 1,139 971
Total........................................................................................ $ 2,116 $ 1,358LIABILITIES:Derivatives designated as hedging instruments:
Foreign exchange currency contracts:Cash flow hedges............................................................. Current liabilities $ 672 $ 2,904
Derivatives not designated as hedging instruments:Foreign exchange currency contracts ................................... Current liabilities 1,040 2,648Interest rate swaps ................................................................ Long-term liabilities 581 852Total derivatives not designated as hedging instruments ..... 1,621 3,500
Total........................................................................................ $ 2,293 $ 6,404
Derivatives Designated As Hedging Instruments Cash Flow Hedges During fiscal 2014, the Company purchased U.S. dollar forward contracts in Europe and Canada totaling
US$119.2 million and US$31.5 million, respectively, to hedge forecasted merchandise purchases and intercompany royalties that were designated as cash flow hedges. As of February 1, 2014, the Company had forward contracts outstanding for its European and Canadian operations of US$87.1 million and US$15.2 million, respectively, which are expected to mature over the next 11 months. At February 2, 2013, the Company had forward contracts outstanding for its European and Canadian operations of US$106.9 million and US$40.3 million, respectively.
GUESS?, INC. AND SUBSIDIARIESNOTES TO CONSOLIDATED FINANCIAL STATEMENTS (Continued)

F-43
The following table summarizes the gains (losses) before taxes recognized on the derivative instruments designated as cash flow hedges in OCI and net earnings for fiscal 2014, fiscal 2013 and fiscal 2012 (in thousands):
Gain/(Loss)Recognized in
OCILocation ofGain/(Loss)
Reclassified fromAccumulated OCI
into Income (1)
Gain/(Loss)Reclassified
fromAccumulated
OCI into Income
Year EndedFeb 1, 2014
Year EndedFeb 1, 2014
Derivatives designated as cash flow hedges:Foreign exchange currency contracts ............................................... $ 4,595 Cost of sales $ 3,050
Foreign exchange currency contracts ............................................... $ 370Other income/
expense $ 9
Gain/(Loss)Recognized in
OCILocation ofGain/(Loss)
Reclassified fromAccumulated OCI
into Income (1)
Gain/(Loss)Reclassified
fromAccumulated
OCI into Income
Year EndedFeb 2, 2013
Year EndedFeb 2, 2013
Derivatives designated as cash flow hedges:Foreign exchange currency contracts ............................................... $ 2,126 Cost of sales $ 8,700
Foreign exchange currency contracts ............................................... $ 105Other income/
expense $ 628
Gain/(Loss)Recognized in
OCILocation ofGain/(Loss)
Reclassified fromAccumulated OCI
into Income (1)
Gain/(Loss)Reclassified
fromAccumulated
OCI into Income
Year EndedJan 28, 2012
Year EndedJan 28, 2012
Derivatives designated as cash flow hedges:Foreign exchange currency contracts ............................................... $ 935 Cost of sales $ (6,641)
Foreign exchange currency contracts ............................................... $ (90)Other income/
expense $ 268
___________________________________________________________________________(1) The ineffective portion was immaterial during fiscal 2014, fiscal 2013 and fiscal 2012 and was recorded in net
earnings and included in interest income/expense.
As of February 1, 2014, accumulated other comprehensive loss included a net unrealized loss of approximately $0.1 million, net of tax, of which $0.2 million will be recognized in other expense or cost of product sales over the following 12 months, at the then current values on a pre-tax basis, which can be different than the current year-end values.
The following table summarizes net after-tax derivative activity recorded in accumulated other comprehensive income (loss) (in thousands):
Year EndedFeb 1, 2014
Year EndedFeb 2, 2013
Beginning balance gain (loss).................................................................................... $ (1,782) $ 4,259Net gains from changes in cash flow hedges ............................................................. 4,092 2,044Net gains reclassified to income ................................................................................ (2,423) (8,085)Ending balance loss.................................................................................................... $ (113) $ (1,782)
GUESS?, INC. AND SUBSIDIARIESNOTES TO CONSOLIDATED FINANCIAL STATEMENTS (Continued)
F-44
Net Investment Hedges During fiscal 2014, the Company purchased U.S. dollar forward contracts in Europe totaling US$17.9 million
to hedge the net investments in certain of the Company’s international subsidiaries that were designated as net investment hedges. The Company had no forward contracts outstanding for its European net investments as of February 1, 2014. There were no forward contracts that were designated as net investment hedges during fiscal 2013.
The Company recognized gains, net of tax, of $0.2 million in the foreign currency translation adjustment component of accumulated other comprehensive income (loss) during fiscal 2014. There were no amounts that were recognized or reclassified into net income during the fiscal 2014. Derivatives Not Designated As Hedging Instruments
As of February 1, 2014, the Company had euro foreign currency contracts to purchase US$111.8 million expected to mature over the next 11 months and Canadian dollar foreign currency contracts to purchase US$13.8 million expected to mature over the next three months.
As of February 2, 2013, the Company had euro foreign currency contracts to purchase US$90.2 million, Canadian dollar foreign currency contracts to purchase US$39.7 million and GBP£4.7 million of foreign currency contracts to purchase euros.
The following table summarizes the gains (losses) before taxes recognized on the derivative instruments not designated as hedging instruments in other income and expense for fiscal 2014, fiscal 2013 and fiscal 2012 (in thousands):
Location ofGain/(Loss)
Recognized inIncome
Gain/(Loss) Recognized in IncomeYear EndedFeb 1, 2014
Year EndedFeb 2, 2013
Year EndedJan 28, 2012
Derivatives not designated as hedging instruments:
Foreign exchange currency contracts.......................Other income/
expense $ 1,843 $ (20) $ 4,254
Interest rate swaps....................................................Other income/
expense $ 238 $ 166 $ (171)
(22) Share Repurchase ProgramOn March 14, 2011, the Company’s Board of Directors authorized a program to repurchase, from time-to-
time and as market and business conditions warrant, up to $250 million of the Company’s common stock (the “2011 Share Repurchase Program”). On June 26, 2012, the Company’s Board of Directors authorized a new program to repurchase, from time-to-time and as market and business conditions warrant, up to $500 million of the Company’s common stock (the “2012 Share Repurchase Program”). The 2012 Share Repurchase Program was in addition to the 2011 Share Repurchase Program. Repurchases under programs may be made on the open market or in privately negotiated transactions, pursuant to Rule 10b5-1 trading plans or other available means. There is no minimum or maximum number of shares to be repurchased under programs and programs may be discontinued at any time, without prior notice. During fiscal 2014, the Company repurchased 882,551 shares under the 2011 and 2012 Share Repurchase Programs at an aggregate cost of $22.1 million. During fiscal 2013, the Company repurchased 5,036,418 shares under the 2011 Share Repurchase Program at an aggregate cost of $140.1 million. There were no share repurchases under the 2012 Share Repurchase Program during fiscal 2013. During fiscal 2012, the Company repurchased 3,216,514 shares under the 2011 Share Repurchase Program at an aggregate cost of $92.0 million. At February 1, 2014, the Company had remaining authority under the 2012 Share Repurchase Program to purchase $495.8 million of its common stock and no remaining authority to purchase shares under the 2011 Share Repurchase Program.
GUESS?, INC. AND SUBSIDIARIESNOTES TO CONSOLIDATED FINANCIAL STATEMENTS (Continued)

F-45
(23) Subsequent Events
On March 19, 2014, the Company announced a 12.5% increase in its quarterly cash dividend for the first quarter of fiscal 2015, to $0.225 per share. The cash dividend will be paid on April 18, 2014 to shareholders of record as of the close of business on April 2, 2014.
GUESS?, INC. AND SUBSIDIARIESNOTES TO CONSOLIDATED FINANCIAL STATEMENTS (Continued)

F-46
SCHEDULE IIGUESS?, INC. & SUBSIDIARIES
VALUATION AND QUALIFYING ACCOUNTSYears ended February 1, 2014, February 2, 2013 and January 28, 2012
(in thousands)
Balance atbeginningof period
Costscharged /
credited toexpenses
Deductionsand
write-offs
Balanceat end ofperiod
DescriptionAs of February 1, 2014
Allowance for accounts receivable ............................... $ 20,588 $ 32,339 $ (32,809) $ 20,118Allowance for royalties receivable................................ 294 190 (75) 409Allowance for sales returns........................................... 20,757 98,112 (98,585) 20,284
Total.............................................................................. $ 41,639 $ 130,641 $ (131,469) $ 40,811As of February 2, 2013
Allowance for accounts receivable ............................... $ 19,423 $ 39,322 $ (38,157) $ 20,588Allowance for royalties receivable................................ 402 (108) — 294Allowance for sales returns........................................... 18,306 83,007 (80,556) 20,757
Total.............................................................................. $ 38,131 $ 122,221 $ (118,713) $ 41,639As of January 28, 2012
Allowance for accounts receivable ............................... $ 15,993 $ 35,934 $ (32,504) $ 19,423Allowance for royalties receivable................................ 763 (361) — 402Allowance for sales returns........................................... 16,514 84,663 (82,871) 18,306
Total.............................................................................. $ 33,270 $ 120,236 $ (115,375) $ 38,131

SIGNATURESPursuant to the requirements of Section 13 or 15(d) of the Securities Exchange Act of 1934, the Registrant
has duly caused this report to be signed on its behalf by the undersigned, thereunto duly authorized.
Guess?, Inc.
By: /s/ PAUL MARCIANOPaul Marciano
Chief Executive Officer andVice Chairman of the Board
Date: March 28, 2014
Pursuant to the requirements of the Securities Exchange Act of 1934, this report has been signed by the following persons on behalf of the Registrant and in the capacities and on the dates indicated.
/s/ PAUL MARCIANO Chief Executive Officer,Vice Chairman of the Board and Director(Principal Executive Officer) March 28, 2014Paul Marciano
/s/ SANDEEP REDDY Chief Financial Officer(Principal Financial Officer andChief Accounting Officer) March 28, 2014Sandeep Reddy
/s/ MAURICE MARCIANO
Chairman of the Board of Directors March 28, 2014Maurice Marciano
/s/ GIANLUCA BOLLA
Director March 28, 2014Gianluca Bolla
/s/ ANTHONY CHIDONI
Director March 28, 2014Anthony Chidoni
/s/ KAY ISAACSON-LEIBOWITZ
Director March 28, 2014Kay Isaacson-Leibowitz
s/ ALEX YEMENIDJIAN
Director March 28, 2014Alex Yemenidjian

(This page has been left blank intentionally.)

Exhibit Index
ExhibitNumber Description
3.1. Restated Certificate of Incorporation of the Registrant (incorporated by reference from Amendment No. 3 to the Registrant’s Registration Statement on Form S-1 (Registration No. 333-4419) filed on July 30, 1996).
3.2. Second Amended and Restated Bylaws of the Registrant (incorporated by reference from the Registrant’s Current Report on Form 8-K filed December 4, 2007).
4.1. Specimen Stock Certificate (incorporated by reference from Amendment No. 3 to the Registrant’s Registration Statement on Form S-1 (Registration No. 333-4419) filed on July 30, 1996).
*10.1. 1996 Equity Incentive Plan (incorporated by reference from Amendment No. 3 to the Registrant’sRegistration Statement on Form S-1 (Registration No. 333-4419) filed on July 30, 1996).
*10.2. First Amendment to the 1996 Equity Incentive Plan (incorporated by reference from the Registrant’s AnnualReport on Form 10-K for the year ended February 2, 2008).
*10.3. 2004 Equity Incentive Plan (Amended and Restated as of April 15, 2011) (incorporated by reference fromthe Registrant’s Current Report on Form 8-K filed April 21, 2011).
*10.4. 2006 Non-Employee Directors’ Stock Grant and Stock Option Plan (As Amended and Restated EffectiveSeptember 13, 2010) (incorporated by reference from the Registrant’s Quarterly Report on Form 10-Q for the quarter ended October 30, 2010).
*10.5. Annual Incentive Bonus Plan (As Amended and Restated May 17, 2010) (incorporated by reference fromAppendix A to the Registrant’s Definitive Proxy Statement on Form 14A filed May 25, 2010).
*10.6. 2002 Employee Stock Purchase Plan (Amended and Restated Effective March 4, 2009) (incorporated byreference from the Registrant’s Quarterly Report on Form 10-Q for the quarter ended May 1, 2010).
*10.7. 2002 Employee Stock Purchase Plan (Amended and Restated March 12, 2012) (incorporated by referencefrom the Registrant’s Annual Report on Form 10-K for the year ended January 28, 2012).
*10.8. Consulting Agreement dated June 20, 2011 between the Registrant and Maurice Marciano (incorporatedby reference from the Registrant’s Current Report on Form 8-K filed June 20, 2011).
*†10.9. Amendment to Consulting Agreement dated January 28, 2014 among the Registrant, Maurice Marciano and Maurice Marciano Consulting.
*10.10. Amended and Restated Executive Employment Agreement dated December 18, 2008 between theRegistrant and Maurice Marciano (incorporated by reference from the Registrant’s Annual Report on Form 10-K for the year ended January 31, 2009).
*10.11. Executive Employment Agreement dated July 11, 2013 between the Registrant and Paul Marciano(Incorporated by reference from the Registrant’s Quarterly Report on Form 10-Q for the quarter ended August 3, 2013).
*10.12. Restricted Stock Unit Agreement dated as of July 11, 2013 between the Registrant and Paul Marciano(Incorporated by reference from the Registrant’s Quarterly Report on Form 10-Q for the quarter ended August 3, 2013).
*10.13. Performance Share Award Agreement dated as of July 11, 2013 between the Registrant and Paul Marciano(Incorporated by reference from the Registrant’s Quarterly Report on Form 10-Q for the quarter ended August 3, 2013).
*10.14. Employment Letter Agreement dated August 21, 2013 between the Registrant and Michael Relich(Incorporated by reference from the Registrant’s Quarterly Report on Form 10-Q for the quarter ended August 3, 2013).
*10.15. Employment Letter Agreement dated July 18, 2013 between the Registrant and Sandeep Reddy(Incorporated by reference from the Registrant’s Quarterly Report on Form 10-Q for the quarter ended August 3, 2013).
*10.16. Form of Nonqualified Stock Option Agreement (incorporated by reference from the Registrant’s CurrentReport on Form 8-K filed May 16, 2005).
*10.17. Form of Restricted Stock Award Agreement (incorporated by reference from the Registrant’s Current Reporton Form 8-K filed May 16, 2005).
*10.18. Indemnification Agreements between the Registrant and certain executives and directors (incorporated byreference from the Registrant’s Annual Report on Form 10-K for the year ended December 31, 1996).
*10.19. Nonqualified Deferred Compensation Plan (Amended and Restated Effective as of December 18, 2008)(incorporated by reference from the Registrant’s Annual Report on Form 10-K for the year ended January 31, 2009).

ExhibitNumber Description
*10.20. Supplemental Executive Retirement Plan (Amended and Restated Effective as of December 18, 2008)(incorporated by reference from the Registrant’s Annual Report on Form 10-K for the year ended January 31, 2009).
*10.21. Amendment 2013-I to the Supplemental Executive Retirement Plan of the Registrant dated as of July 11,2013 (Incorporated by reference from the Registrant’s Quarterly Report on Form 10-Q for the quarter ended August 3, 2013).
10.22. Lease Agreement between the Registrant and Robert Pattillo Properties, Inc. (incorporated by reference from the Registrant’s Annual Report on Form 10-K for the year ended December 31, 1999).
10.23. First Amendment to Lease Agreement between the Registrant and 1444 Partners, Ltd. with respect to the Registrant’s corporate headquarters (including original lease agreement) (incorporated by reference from the Registrant’s Quarterly Report on Form 10-Q for the quarter ended May 1, 2010).
10.24. Second Amendment to Lease Agreement between the Registrant and 1444 Partners, Ltd. with respect to the Registrant’s corporate headquarters (incorporated by reference from the Registrant’s Quarterly Report on Form 10-Q for the quarter ended July 31, 2010).
10.25. Licensing Contribution Agreement dated as of April 28, 2003, by and between Guess? Licensing, Inc. and Guess? IP Holder L.P. (incorporated by reference from the Registrant’s Quarterly Report on Form 10-Q for the quarter ended March 29, 2003).
10.26. Guess? License Agreement dated as of April 28, 2003, by and between Guess? IP Holder L.P. and the Registrant (incorporated by reference from the Registrant’s Quarterly Report on Form 10-Q for the quarter ended March 29, 2003).
10.27. Credit Agreement dated as of July 6, 2011 among the Registrant, the lenders party thereto and JPMorgan Chase Bank, N.A., as administrative agent (incorporated by reference from the Registrant’s Current Report on Form 8-K filed July 6, 2011).
10.28. Amendment No. 1 to Credit Agreement dated as of August 31, 2012 among Registrant and the lenders party thereto and acknowledged by JPMorgan Chase Bank, N.A., as administrative agent (incorporated by reference from the Registrant’s Current Report on Form 8-K filed August 31, 2012).
10.29. Lender Joinder Agreement dated as of August 31, 2012 among the Registrant, the lenders party thereto and JPMorgan Chase Bank, N.A., as administrative agent (incorporated by reference from the Registrant’s Current Report on Form 8-K filed August 31, 2012).
†21.1. List of Subsidiaries.†23.1. Consent of Ernst & Young LLP, Independent Registered Public Accounting Firm.†31.1. Certification of Chief Executive Officer and Vice Chairman of the Board pursuant to Section 302 of the
Sarbanes-Oxley Act of 2002.†31.2. Certification of Chief Financial Officer pursuant to Section 302 of the Sarbanes-Oxley Act of 2002.†32.1. Certification of Chief Executive Officer and Vice Chairman of the Board pursuant to Section 906 of the
Sarbanes-Oxley Act of 2002.†32.2. Certification of Chief Financial Officer pursuant to Section 906 of the Sarbanes-Oxley Act of 2002.
†101.INS XBRL Instance Document†101.SCH XBRL Taxonomy Extension Schema Document†101.CAL XBRL Taxonomy Extension Calculation Linkbase Document†101.DEF XBRL Taxonomy Extension Definition Linkbase Document†101.LAB XBRL Taxonomy Extension Label Linkbase Document†101.PRE XBRL Taxonomy Extension Presentation Linkbase Document
_______________________________________________________________________________
* Management Contract or Compensatory Plan† Filed herewith

(This page has been left blank intentionally.)

Executive Officers and Directors Corporate HeadquartersMaurice Marciano Guess?, Inc.Chairman of the Board of Directors 1444 South Alameda Street
Los Angeles, CA 90021Paul Marciano Telephone: (213) 765-3100Chief Executive Officer, Vice Chairman www.guessinc.comof the Board and Director
Chief Financial Officer
Transfer Agent and RegistrarComputershare P.O. Box
, Telephone: (877) 282-1168 www.computershare.com/investor
Michael RelichChief Officer
Stock ExchangeGuess?, Inc. stock is listed on the New York StockExchange under the symbol GES
Independent Registered Public Accounting FirmErnst & Young LLP725 South Figueroa Street, S-500
Gianluca Bolla
Los Angeles, CA 90017
Director
Anthony ChidoniDirector
Kay Isaacson-LeibowitzDirector
Investor RelationsYou may obtain copies of our annual reports onForm 10-K, quarterly reports on Form 10-Q andcurrent reports on Form 8-K, free of charge, on our website at gues .com or bycontacting us as follows:
Guess?, Inc.Alex YemenidjianDirector
Attn: Investor Relations1444 South Alameda StreetLos Angeles, CA 90021Telephone: (213) 765-5578Fax: (213) 765-5927Email: [email protected]
Officer


GUESS AccessoriesLausanne, SWITZERLAND

MarcianoLas Vegas, NEVADA


![Guess Lazily! [2 ]making a program guess, and guess well …okmij.org/ftp/kakuritu/StrangeLoop.pdf · · 2012-09-30making a program guess, and guess well ... and I give it away](https://static.documents.pub/doc/80x56/5b0d543c7f8b9ab7658c3d8a/guess-lazily-2-making-a-program-guess-and-guess-well-okmijorgftpkakuritu.jpg)


