36
Fiscal 2021 Results Fourth Quarter October 20, 2021

Fiscal 2021 ResultsFourth Quarter
October 20, 2021
This presentation contains forward-looking statements within the meaning of the Private Securities Litigation Reform Act of 1995. Investors are cautioned that forward-looking statements are inherently uncertain and involve potential risks and uncertainties. A number of factors could cause actual results to differ materially from these statements, including, but not limited to uncertainty surrounding the COVID-19 pandemic; general economic uncertainty in key markets and a worsening of domestic economic conditions or low levels of economic growth; availability of financing for RV and marine dealers; ability to innovate and commercialize new products; ability to manage our inventory to meet demand; competition and new product introductions by competitors; risk related to cyclicality and seasonality of our business; significant increase in repurchase obligations; business or production disruptions; inadequate inventory and distribution channel management; ability to retain relationships with our suppliers; increased material and component costs, including availability and price of fuel and raw materials; ability to integrate mergers and acquisitions; ability to attract and retain qualified personnel and changes in market compensation rates; exposure to warranty claims; ability to protect our information technology systems from data security, cyberattacks, and network disruption risks and the ability to successfully upgrade and evolve our information technology systems; ability to retain brand reputation and related exposure to product liability claims; governmental regulation, including for climate change; impairment of goodwill; and risks related to our Convertible and Senior Secured Notes including our ability to satisfy our obligations under these notes. Additional information concerning certain risks and uncertainties that could cause actual results to differ materially from that projected or suggested is contained in the Company's filings with the Securities and Exchange Commission ("SEC") over the last 12 months, copies of which are available from the SEC or from the Company upon request. We caution that the foregoing list of important factors is not complete. The company disclaims any obligation or undertaking to disseminate any updates or revisions to any forward-looking statements contained in this presentation or to reflect any changes in the company's expectations after the date of this presentation or any change in events, conditions or circumstances on which any statement is based, except as required by law.
INDUSTRY AND MARKET DATA In this presentation, we rely on and refer to information and statistics regarding market participants in the sectors in which we compete and other industry data. We obtained this information and statistics from third-party sources, including reports by market research firms. While such information is believed to be reliable, for the purposes used herein, we make no representation or warranty with respect to the accuracy of such information. Any and all trademarks and trade names referred to in this presentation are the property of their respective owners.
NON-GAAP FINANCIAL MEASURESThis presentation includes financial information prepared in accordance with accounting principles generally accepted in the U.S. (“GAAP”), as well as certain adjusted or non-GAAP financial measures such as EBITDA, adjusted EBITDA and adjusted diluted earnings per share (“EPS”). EBITDA is defined as net income before interest expense, provision for income taxes, and depreciation and amortization expense. Adjusted EBITDA is defined as net income before interest expense, provision for income taxes, depreciation and amortization expense, and other pre-tax adjustments made in order to present comparable results from period to period. Adjusted diluted earnings per share is defined as diluted earnings per share adjusted for after-tax items that impact the comparability of our results from period to period. Examples of items excluded from Adjusted EBITDA include acquisition-related costs, restructuring expense, debt issuance write-off, gain on the sale of property, plant and equipment and non-operating income. Examples of items excluded from Adjusted dilutive earnings per share include acquisition-related costs, non-cash interest expense, restructuring expense, gain on sale of property, plant and equipment, impact of convertible share dilution and tax impact of the adjustments. These non-GAAP financial measures, which are not calculated or presented in accordance with GAAP, have been provided as information supplemental and in addition to the financial measures presented in accordance with GAAP. Such non-GAAP financial measures should not be considered superior to, as a substitute for, or as an alternative to, and should be considered in conjunction with, the GAAP financial measures presented herein. The non-GAAP financial measures presented may differ from similar measures used by other companies. Please see slides 32-33 for reconciliations of these non-GAAP measures to the nearest GAAP measure.
We have included these non-GAAP performance measures as comparable measures to illustrate the effect of non-recurring transactions occurring during the year and improve comparability of our results from period to period. Management uses these non-GAAP financial measures (a) to evaluate our historical and prospective financial performance and trends as well as our performance relative to competitors and peers; (b) to measure operational profitability on a consistent basis; (c) in presentations to the members of our Board of Directors to enable our Board of Directors to have the same measurement basis of operating performance as is used by management in its assessments of performance and in forecasting and budgeting for our company; (d) to evaluate potential acquisitions; and (e) to ensure compliance with covenants and restricted activities under the terms of our credit facility and outstanding notes. We believe these non-GAAP financial measures are frequently used by securities analysts, investors and other interested parties to evaluate companies in our industry.
Forward Looking Statements
2© 2021 Winnebago Industries
We promise…
quality delivered by empowered, passionate employees. We’re part of a team caring for customers through a lifetime of experiences with us. And we purposefully innovate to delight customers with new ways to travel, live, work and play.
For the team at Winnebago Industries, the outdoors is a calling.
One that removes the line between what we love and what we do. We are a family of brands with rich legacies that are as unique as our customers but unified in how we work.
3© 2021 Winnebago Industries

Products
Overview
Quick Facts
4© 2021 Winnebago Industries
We help our customers explore the outdoor lifestyle, enabling extraordinary mobile experiences as they travel, live, work and play.
$3.6B F21 Annual Revenue
6,800+ Highly Skilled Employees1
Class A – Gas & Diesel Class B
Class C – Gas & Diesel Travel Trailer
5th Wheel Specialty Vehicles
Boats
Locations
Executive Office
RV Production
Boat Production
Significant Transformation (2016-Current)
F16 Current• Revenue $1.0B $3.6B• RV Market Share 3.3% 12.5%2
• Market Cap3 $0.7B $2.4B
1 includes the employees of Barletta Boat Company; transaction closed in early Fiscal 20222 current market share is retail fiscal year-to-date as of August, 2021; per Statistical Surveys Inc.3 market cap: F16 as of 8/30/16 and current as of 10/18/21
Pontoons
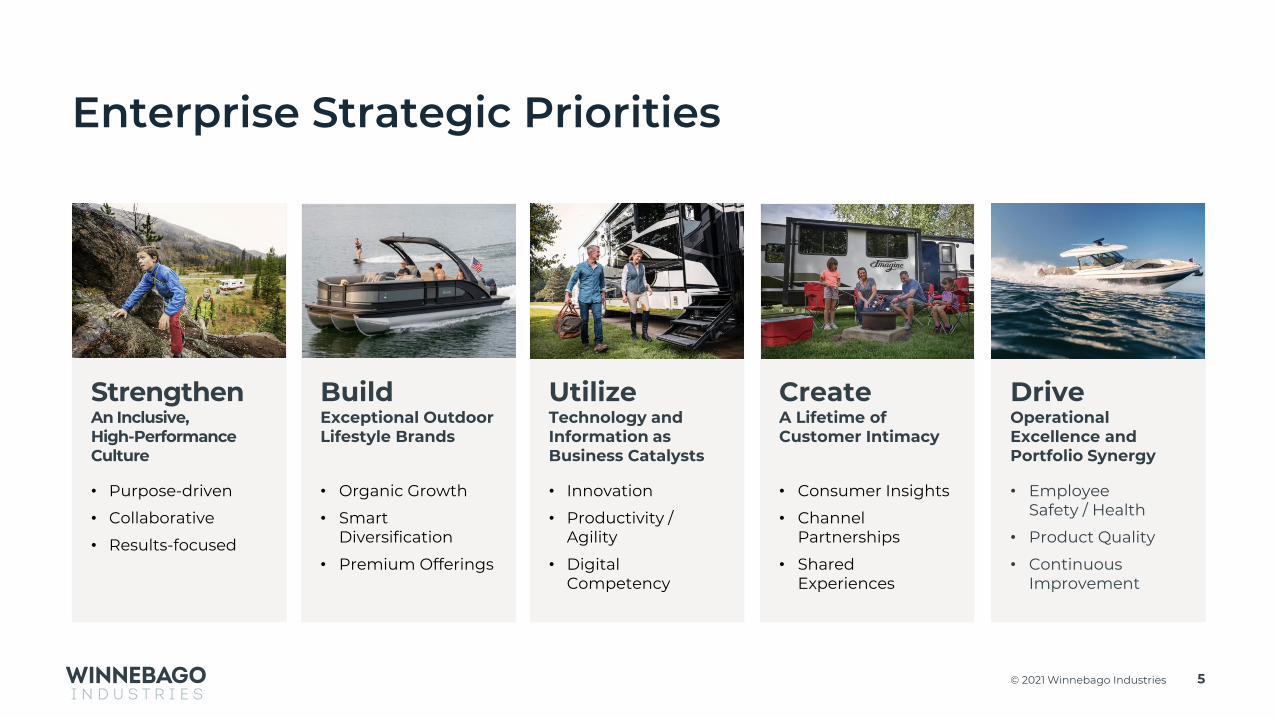
Strengthen An Inclusive, High-Performance Culture
• Purpose-driven
• Collaborative
• Results-focused
BuildExceptional Outdoor Lifestyle Brands
• Organic Growth
• Smart Diversification
• Premium Offerings
UtilizeTechnology and Information as Business Catalysts
• Innovation
• Productivity / Agility
• Digital Competency
CreateA Lifetime of Customer Intimacy
• Consumer Insights
• Channel Partnerships
• Shared Experiences
Drive Operational Excellence and Portfolio Synergy
• Employee Safety / Health
• Product Quality
• Continuous Improvement
Enterprise Strategic Priorities
5© 2021 Winnebago Industries
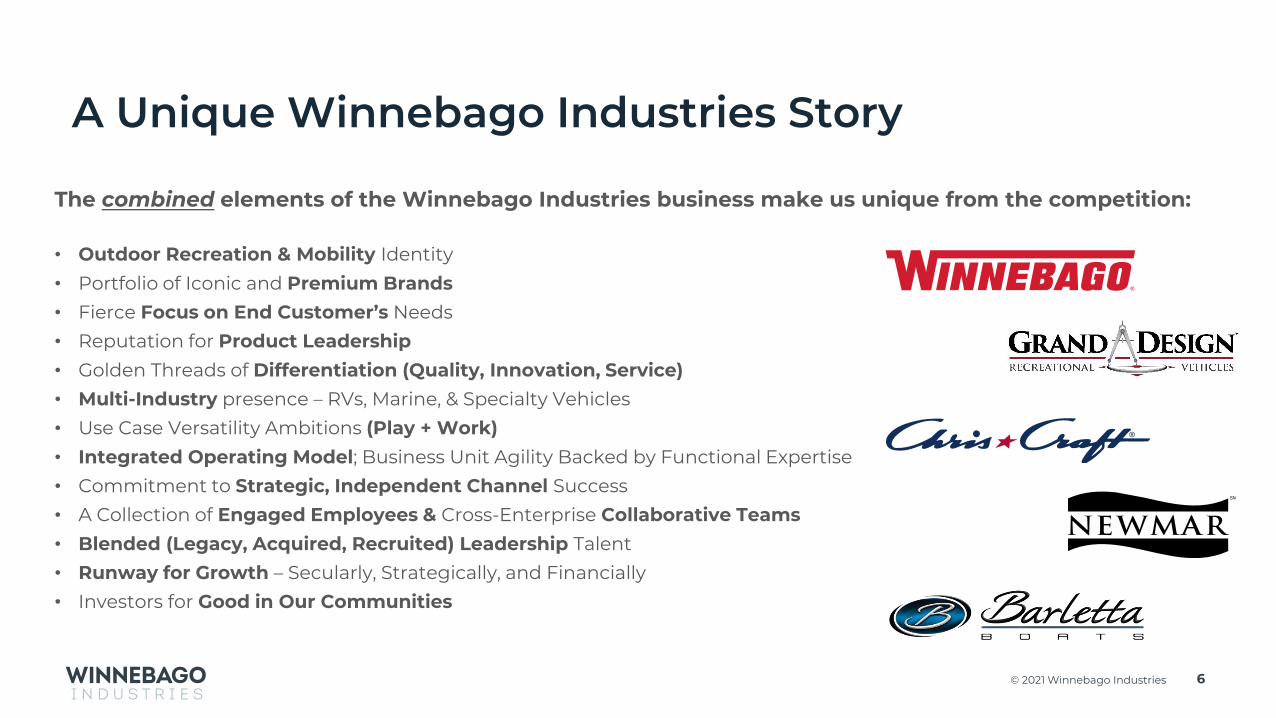
A Unique Winnebago Industries Story
6© 2021 Winnebago Industries
The combined elements of the Winnebago Industries business make us unique from the competition:
• Outdoor Recreation & Mobility Identity
• Portfolio of Iconic and Premium Brands
• Fierce Focus on End Customer’s Needs
• Reputation for Product Leadership
• Golden Threads of Differentiation (Quality, Innovation, Service)
• Multi-Industry presence – RVs, Marine, & Specialty Vehicles
• Use Case Versatility Ambitions (Play + Work)
• Integrated Operating Model; Business Unit Agility Backed by Functional Expertise
• Commitment to Strategic, Independent Channel Success
• A Collection of Engaged Employees & Cross-Enterprise Collaborative Teams
• Blended (Legacy, Acquired, Recruited) Leadership Talent
• Runway for Growth – Secularly, Strategically, and Financially
• Investors for Good in Our Communities

F21 Q4 and Annual Highlights
Fourth Quarter
• Record quarterly revenues of $1.0 billion
• RV market share gains continue; 12.5% FYTD
• Strong gross margin expansion to 18.1% (+150 bps vs F20 Q4 and +40 bps vs F21 Q3)
• Record Adjusted Diluted EPS of $2.57 (+77%, or +$1.12, vs F20 Q4)
• Announced acquisition of Barletta Boat Company; closed in early Fiscal 2022
Annual
• Record revenues of $3.6 billion
• Record gross margin of 17.9%
• Record Adjusted EPS of $8.55
7© 2021 Winnebago Industries
F19 Q4*
8© 2021 Winnebago Industries
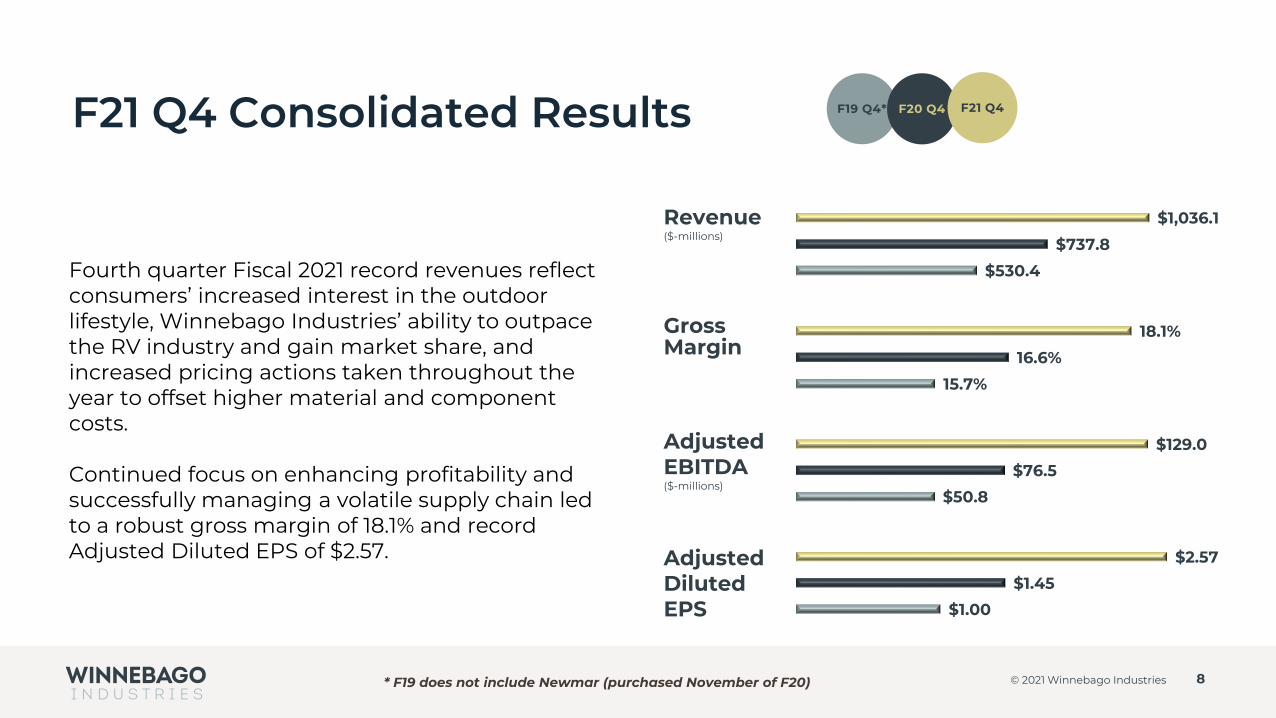
$530.4
$737.8
$1,036.1
$50.8
$76.5
$129.0
$1.00
$1.45
$2.57
15.7%
16.6%
18.1%Gross Margin
Adjusted EBITDA ($-millions)
Adjusted Diluted EPS
Revenue($-millions)
Fourth quarter Fiscal 2021 record revenues reflect consumers’ increased interest in the outdoor lifestyle, Winnebago Industries’ ability to outpace the RV industry and gain market share, and increased pricing actions taken throughout the year to offset higher material and component costs.
Continued focus on enhancing profitability and successfully managing a volatile supply chain led to a robust gross margin of 18.1% and record Adjusted Diluted EPS of $2.57.
F20 Q4 F21 Q4F21 Q4 Consolidated Results
* F19 does not include Newmar (purchased November of F20)
9© 2021 Winnebago Industries
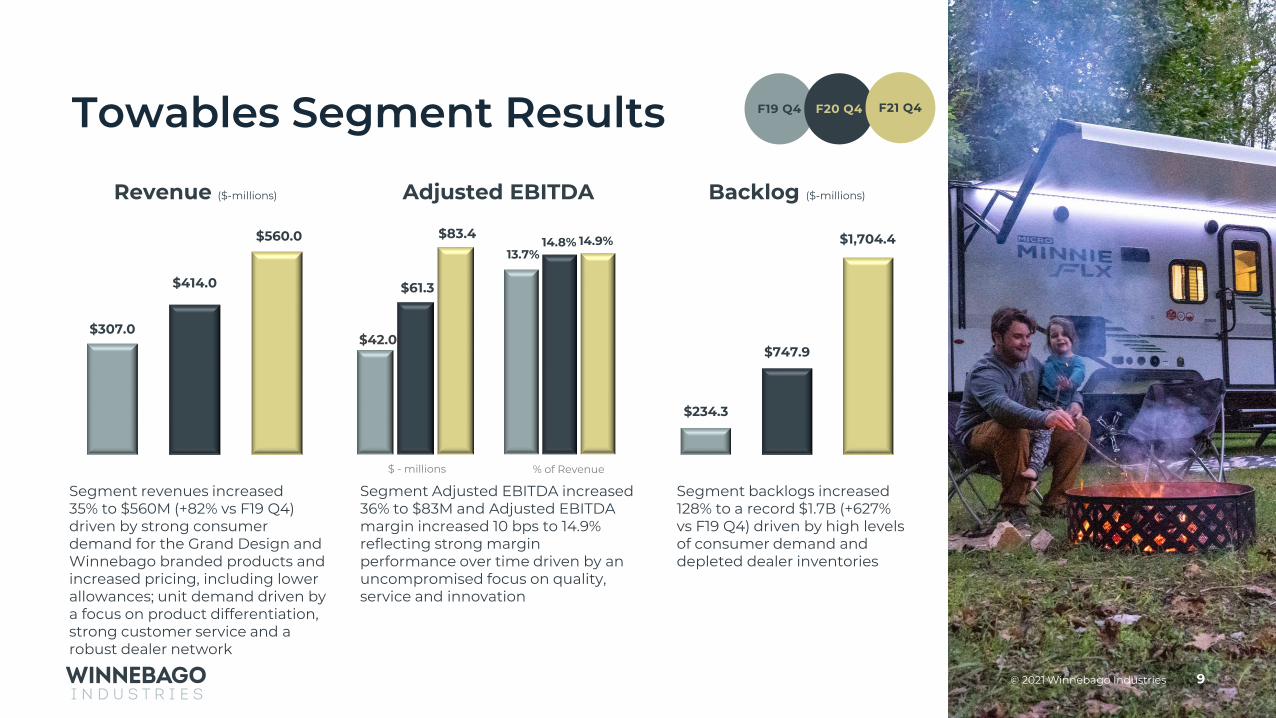
Segment revenues increased 35% to $560M (+82% vs F19 Q4) driven by strong consumer demand for the Grand Design and Winnebago branded products and increased pricing, including lower allowances; unit demand driven by a focus on product differentiation, strong customer service and a robust dealer network
Segment backlogs increased 128% to a record $1.7B (+627% vs F19 Q4) driven by high levels of consumer demand and depleted dealer inventories
Adjusted EBITDA Backlog ($-millions)Revenue ($-millions)
$42.0
$61.3
$83.4
$ - millions
$307.0
$414.0
$560.0
$234.3
$747.9
$1,704.413.7%
14.8% 14.9%
% of Revenue
Segment Adjusted EBITDA increased 36% to $83M and Adjusted EBITDA margin increased 10 bps to 14.9% reflecting strong margin performance over time driven by an uncompromised focus on quality, service and innovation
F19 Q4 F20 Q4 F21 Q4Towables Segment Results

$10.7
$19.5
$50.4
$ - millions
10© 2021 Winnebago Industries
$200.7
$301.8
$448.9
$165.4
$1,051.4
$2,303.5
Segment revenues increased 49% to $449M (+124% vs F19 Q4) driven by strong consumer demand for Winnebago and Newmar branded products and increased pricing, including lower discounts and allowances
Segment Adjusted EBITDA increased $31M to $50M and Adjusted EBITDA % improved 480 bps to 11.2% (+580 bps vs F19 Q4) primarily due to strong consumer demand of our premium products, pricing, including lower discounts and allowances, and productivity gains over recent years
Segment backlogs increased 119% to a record $2.3B (+1293% vs F19 Q4) driven by high levels of consumer demand and depleted dealer inventories
5.4%6.4%
11.2%
% of Revenue
Adjusted EBITDA Backlog ($-millions)Revenue ($-millions)
* F19 does not include Newmar (purchased November of F20)
F19 Q4* F20 Q4 F21 Q4Motorhome Segment Results

Strong Financial Results Over Time
11© 2021 Winnebago Industries
$223$300 $307 $313
$650
2017 2018 2019 2020 2021
$1,547$2,017 $1,986
$2,356
$3,630
2017 2018 2019 2020 2021
WGO IND Net Revenue WGO IND Gross Profit$ - Millions
$139$182 $180 $168
$436
2017 2018 2019 2020 2021
WGO IND Adjusted EBITDA*$ - Millions% of revenue
$ - millions% of revenue
WGO IND Free Cash Flow**
$83$55
$93
$238 $192
2017 2018 2019 2020 2021
$ - MillionsFCF = Op CF less Cap Ex
14.4%14.9% 15.5% 13.3%
17.9%
9.0%9.0% 9.0% 7.1%
12.0%
2.3X2017
3.1X2017
2.3X2017
2.9X2017
* non-GAAP measure; see reconciliation on slide 32** non-GAAP measure; see reconciliation on slide 35
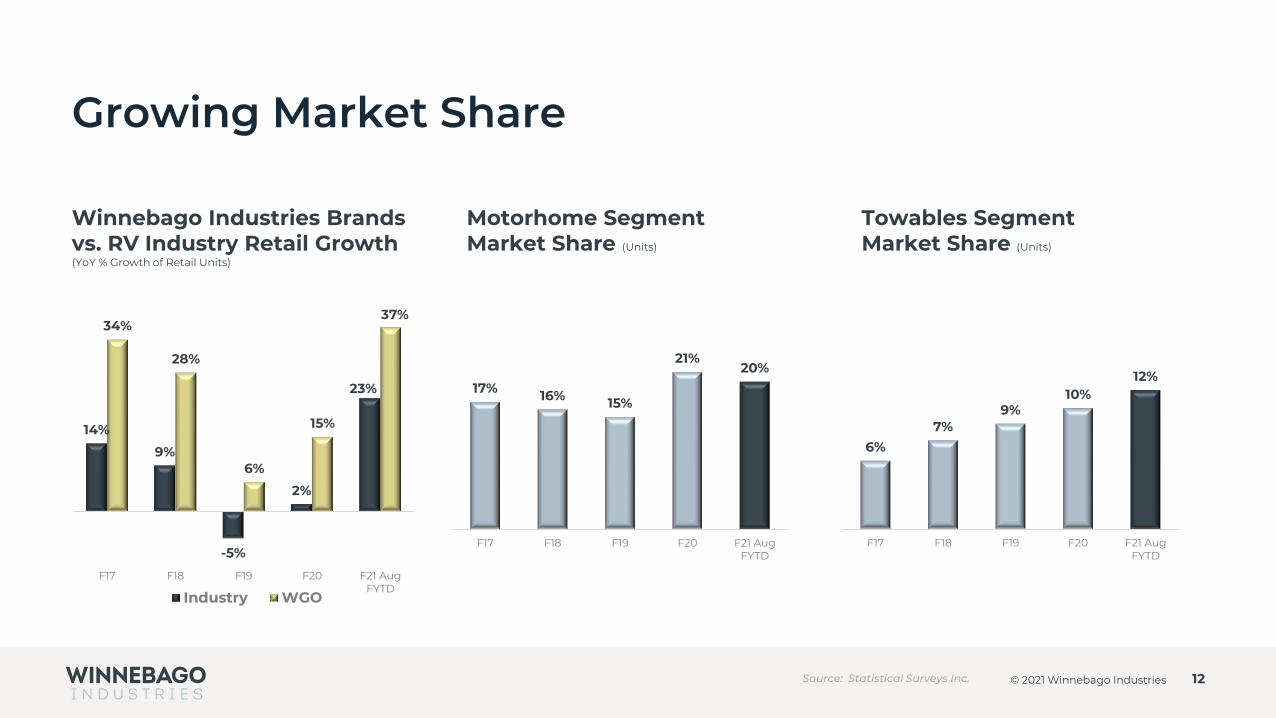
6%
7%9%
10%12%
F17 F18 F19 F20 F21 AugFYTD
14%
9%
-5%
2%
23%
34%
28%
6%
15%
37%
F17 F18 F19 F20 F21 AugFYTD
Industry WGO
Growing Market Share
Towables Segment Market Share (Units)
Winnebago Industries Brands vs. RV Industry Retail Growth (YoY % Growth of Retail Units)
Motorhome Segment Market Share (Units)
12© 2021 Winnebago Industries
17% 16% 15%
21%20%
F17 F18 F19 F20 F21 AugFYTD
Source: Statistical Surveys Inc.
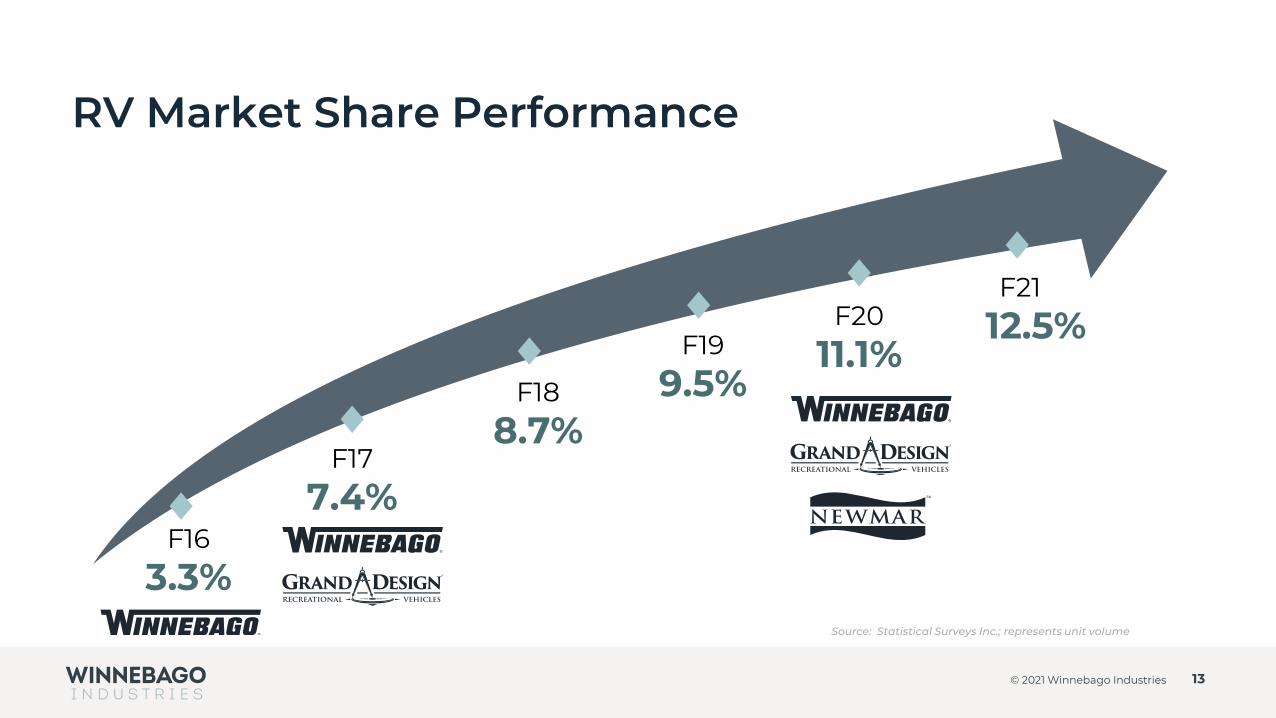
RV Market Share Performance
13© 2021 Winnebago Industries
F16
3.3%
F17
7.4%
F18
8.7%
F19
9.5%
F20
11.1%
Source: Statistical Surveys Inc.; represents unit volume
F21
12.5%
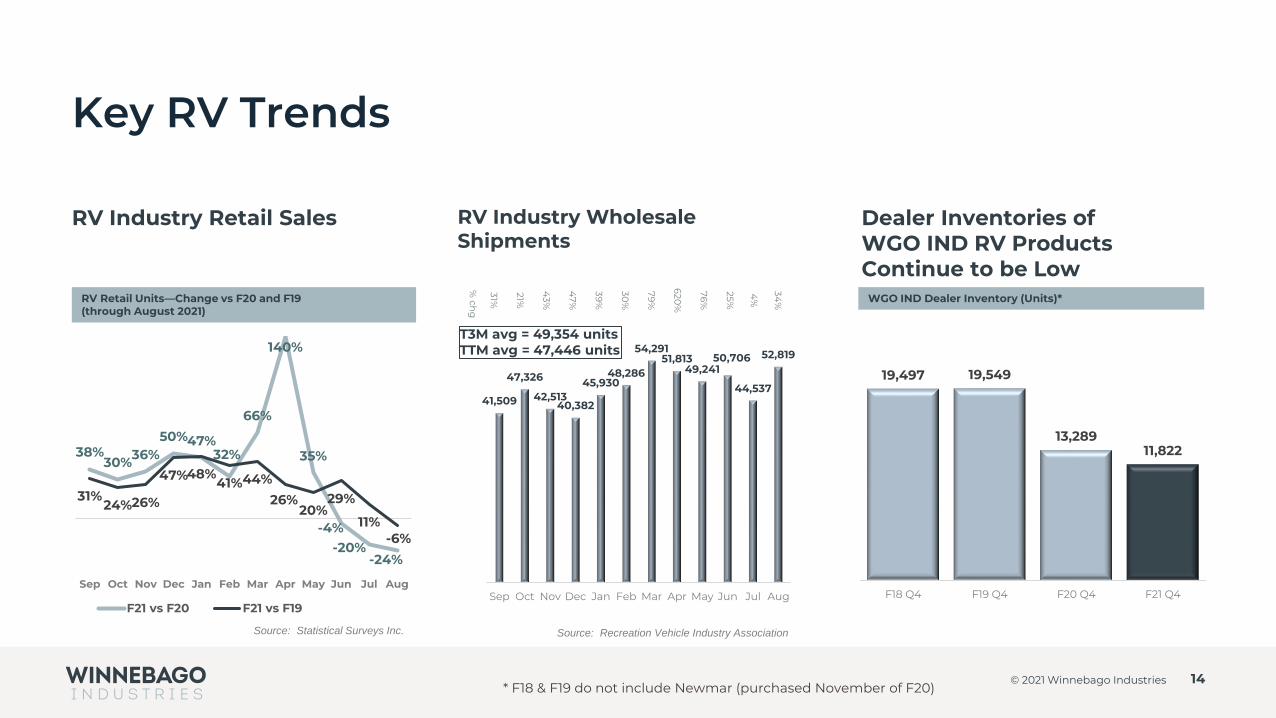
Key RV Trends
Dealer Inventories of WGO IND RV Products Continue to be Low
RV Industry Retail Sales RV Industry Wholesale Shipments
14© 2021 Winnebago Industries
RV Retail Units—Change vs F20 and F19 (through August 2021)
41,509
47,326
42,51340,382
45,93048,286
54,29151,813
49,24150,706
44,537
52,819
Sep Oct Nov Dec Jan Feb Mar Apr May Jun Jul Aug
31%
21%
43%
47%
39%
30%
79%
620%
76%
25%
4%
34%
% ch
g
19,497 19,549
13,28911,822
F18 Q4 F19 Q4 F20 Q4 F21 Q4
WGO IND Dealer Inventory (Units)*
Source: Recreation Vehicle Industry AssociationSource: Statistical Surveys Inc.
T3M avg = 49,354 unitsTTM avg = 47,446 units
* F18 & F19 do not include Newmar (purchased November of F20)
38%30%36%
50%47%32%
66%
140%
35%
-4%-20%
-24%
31%24%26%
47%48%41%44%
26%20%
29%
11%-6%
Sep Oct Nov Dec Jan Feb Mar Apr May Jun Jul Aug
F21 vs F20 F21 vs F19
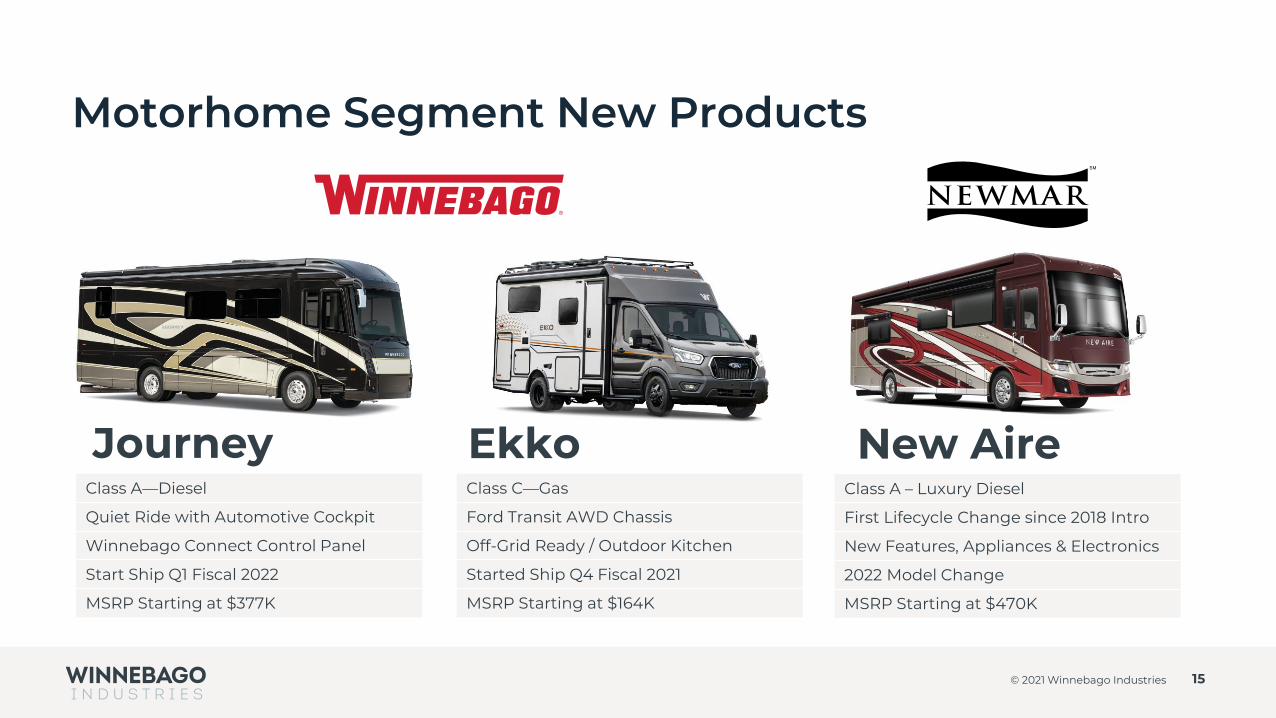
Motorhome Segment New Products
15© 2021 Winnebago Industries
Class A—Diesel
Quiet Ride with Automotive Cockpit
Winnebago Connect Control Panel
Start Ship Q1 Fiscal 2022
MSRP Starting at $377K
Class C—Gas
Ford Transit AWD Chassis
Off-Grid Ready / Outdoor Kitchen
Started Ship Q4 Fiscal 2021
MSRP Starting at $164K
Journey EkkoClass A – Luxury Diesel
First Lifecycle Change since 2018 Intro
New Features, Appliances & Electronics
2022 Model Change
MSRP Starting at $470K
New Aire
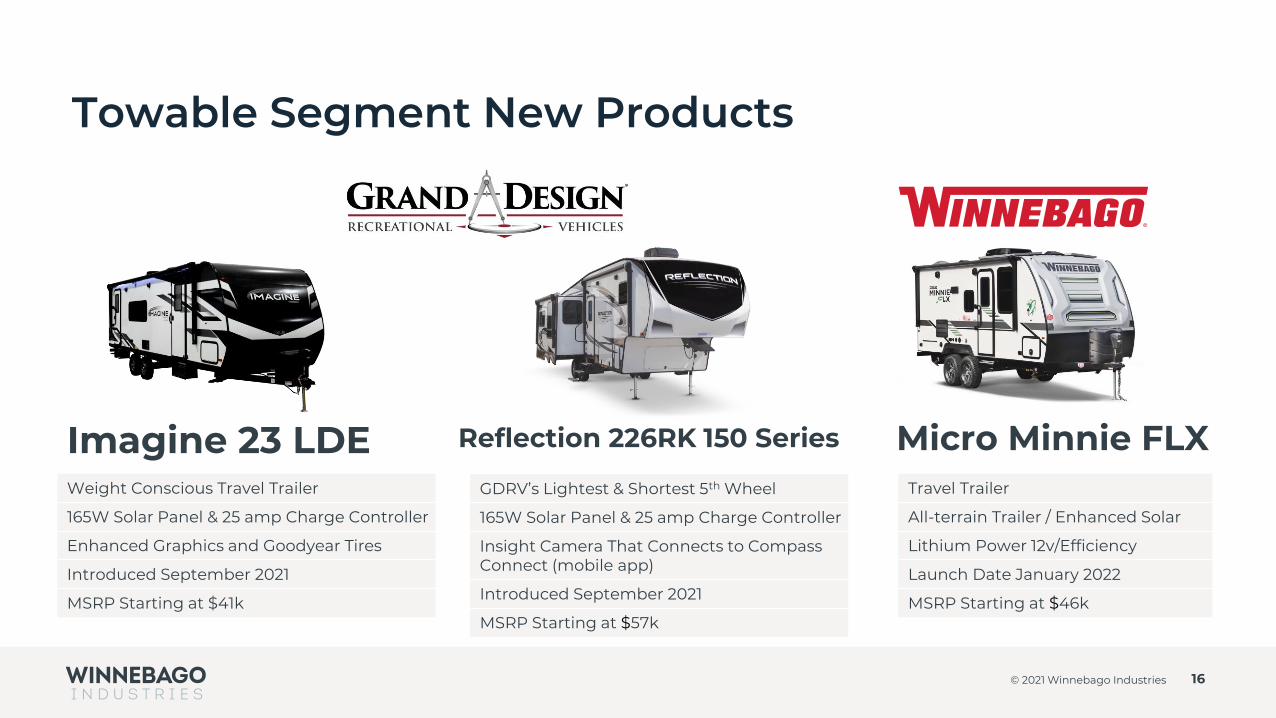
Weight Conscious Travel Trailer
165W Solar Panel & 25 amp Charge Controller
Enhanced Graphics and Goodyear Tires
Introduced September 2021
MSRP Starting at $41k
Towable Segment New Products
16© 2021 Winnebago Industries
Travel Trailer
All-terrain Trailer / Enhanced Solar
Lithium Power 12v/Efficiency
Launch Date January 2022
MSRP Starting at $46k
Micro Minnie FLXImagine 23 LDEGDRV’s Lightest & Shortest 5th Wheel
165W Solar Panel & 25 amp Charge Controller
Insight Camera That Connects to Compass Connect (mobile app)
Introduced September 2021
MSRP Starting at $57k
Reflection 226RK 150 Series
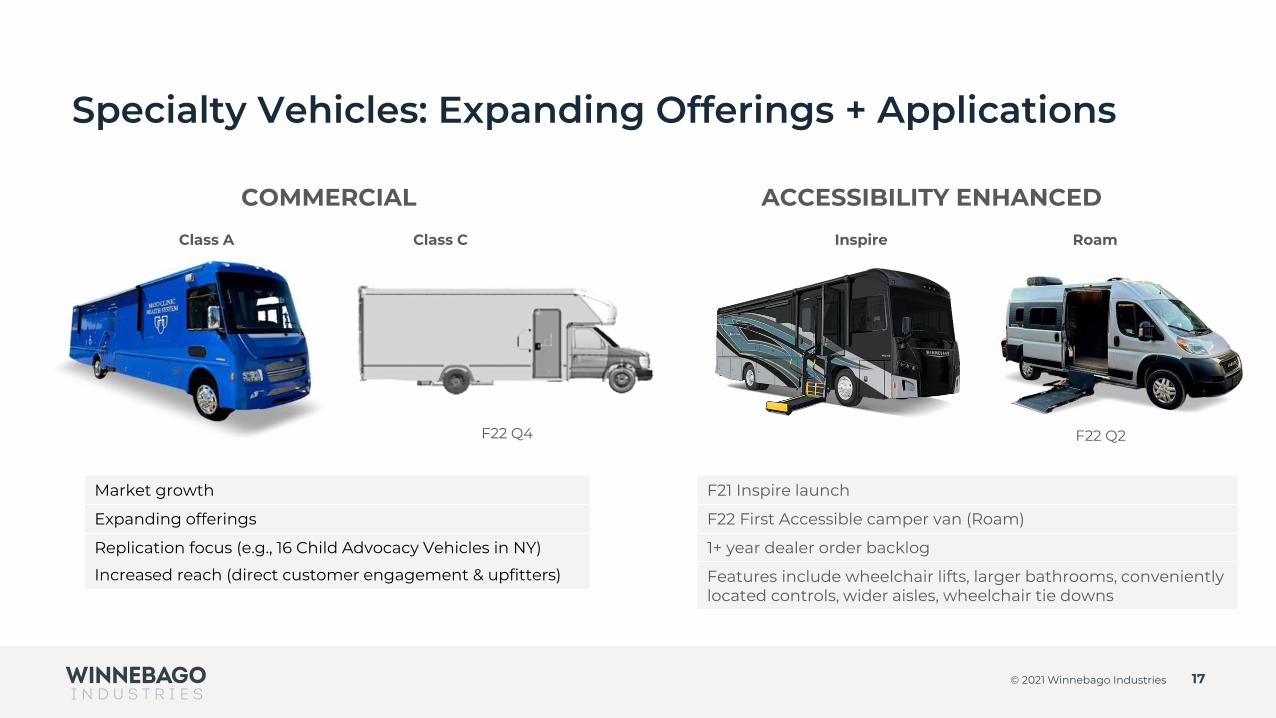
Specialty Vehicles: Expanding Offerings + Applications
17© 2021 Winnebago Industries
COMMERCIAL ACCESSIBILITY ENHANCED
F22 Q4
Inspire Roam
F22 Q2
Class A Class C
Market growth
Expanding offerings
Replication focus (e.g., 16 Child Advocacy Vehicles in NY)
Increased reach (direct customer engagement & upfitters)
F21 Inspire launch
F22 First Accessible camper van (Roam)
1+ year dealer order backlog
Features include wheelchair lifts, larger bathrooms, conveniently located controls, wider aisles, wheelchair tie downs
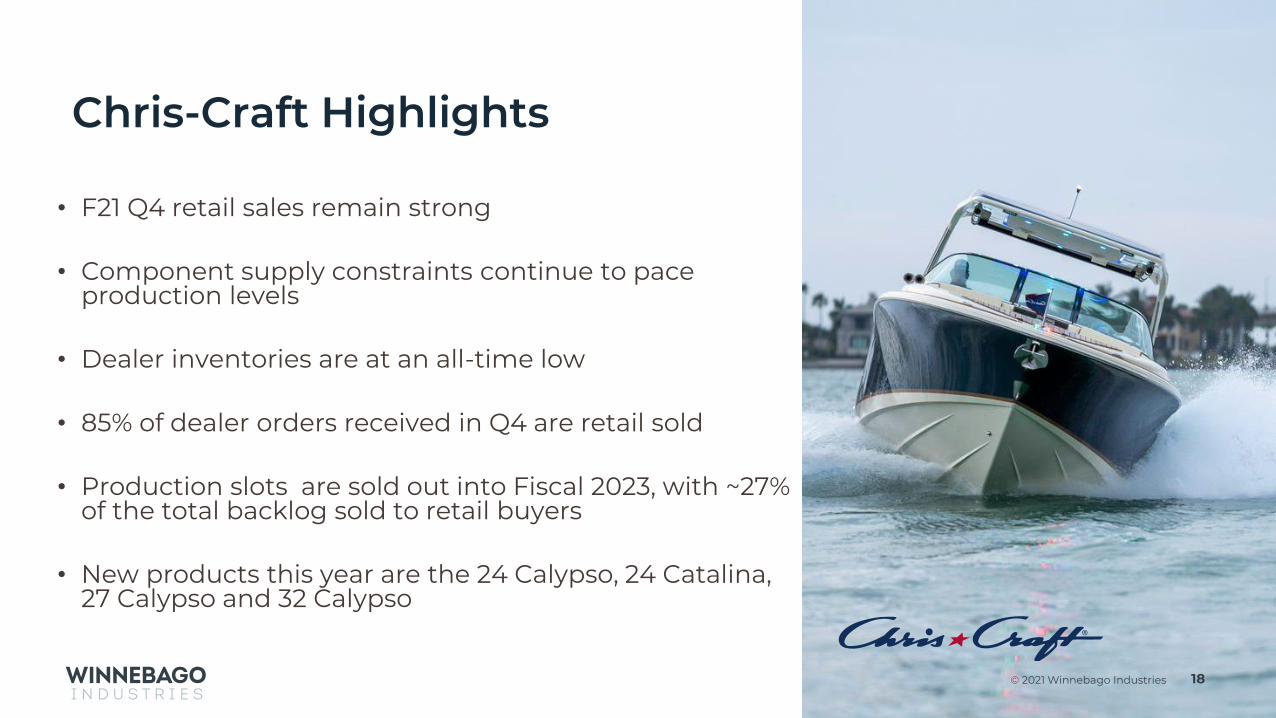
Chris-Craft Highlights
18© 2021 Winnebago Industries
• F21 Q4 retail sales remain strong
• Component supply constraints continue to pace production levels
• Dealer inventories are at an all-time low
• 85% of dealer orders received in Q4 are retail sold
• Production slots are sold out into Fiscal 2023, with ~27% of the total backlog sold to retail buyers
• New products this year are the 24 Calypso, 24 Catalina, 27 Calypso and 32 Calypso

Marine Segment New Products
19© 2021 Winnebago Industries
Center Console
Reversible Helm Seat
Pilothouse Hardtop
Introduced October 2021
MSRP Starting at $225k
Catalina 24’Multi-function Convertible Club Chair
Sport Arch
New Argento Furniture Color
Standard Doggie Dockview Gate Panels
Well-equipped MSRP $85K - $110k
Corsa 25QSSBow Rider Series
Dive Door
Dynamic Seating
Introduced November 2020
MSRP Starting at $178k
Calypso 24’

Strong & Growing Interest In The Outdoors
20© 2021 Winnebago Industries
71.5 77.0 86.1
2014 2017 2020
Active Camping Households1
3.1% CAGR 2014-2020
60% of the U.S. population pursued an outdoor activity in 20202
68% of consumers under the age of 55 participated in an outdoor activity such as camping, hiking, boating or visiting a state or national park2
31% participated for the first time2
9%36%
64% 72% 82%
121%
2014-15 2014-16 2014-17 2014-18 2014-19 2014-20
Growth in Camping 3+ Times Per Year1
10.1 million new households camped in 2020 and an additional 4.3 million new households are estimated to camp for the first time in 20211
Source: 1 KOA 2021 North American Camping Report2 Padilla Spotlight Methodology: online survey conducted among U.S. consumers at least 18 years or older between November 13 and
November 17, 2020. Responses were weighted to U.S. Census for age, gender and ethnicity. There were 1,984 completed surveys.3 Outdoor Foundation; 2021 Outdoor Participation Trends Report
160.7 million Americans, ages 6 and over, participated in at least 1 outdoor activity; +7.1 million versus 20193
52.9% outdoor participation rate; highest participation rate ever and up from 2019 rate of 50.7%3
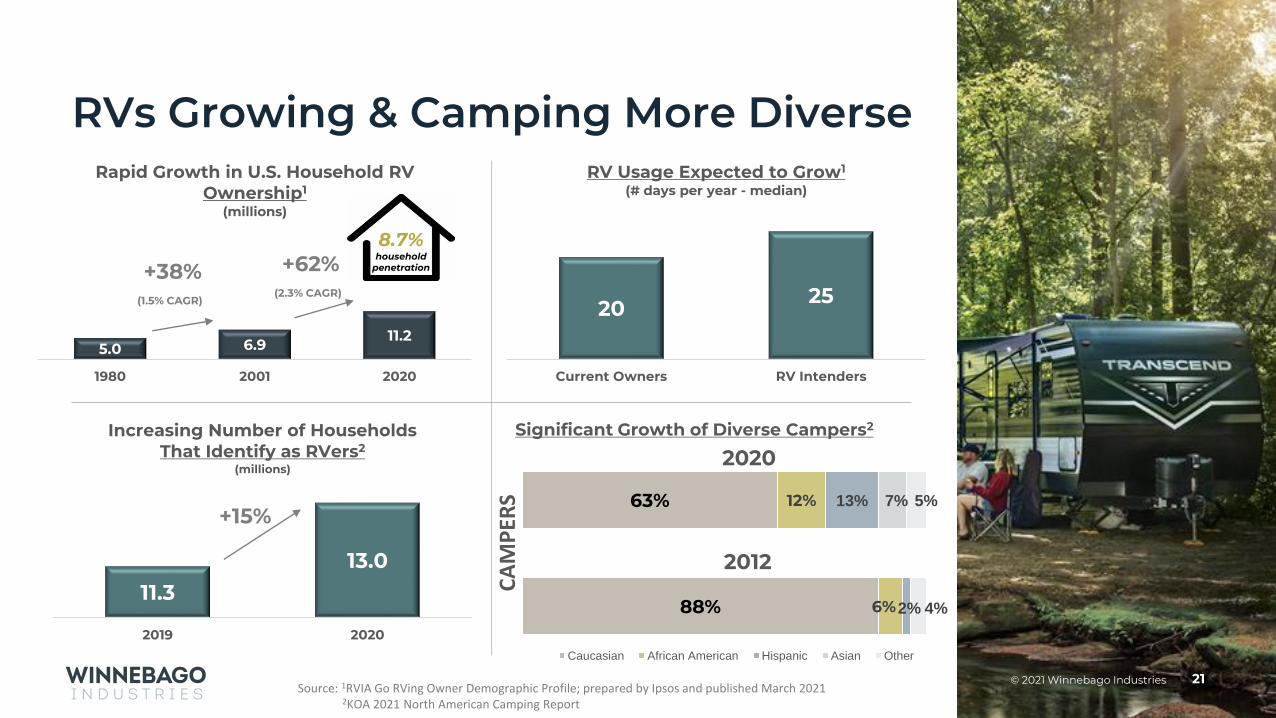
RVs Growing & Camping More Diverse
21© 2021 Winnebago Industries
5.0 6.911.2
1980 2001 2020
Rapid Growth in U.S. Household RV Ownership1
(millions)
+38%(1.5% CAGR)
+62%(2.3% CAGR)
20 25
Current Owners RV Intenders
RV Usage Expected to Grow1
(# days per year - median)
Source: 1RVIA Go RVing Owner Demographic Profile; prepared by Ipsos and published March 20212KOA 2021 North American Camping Report
8.7%household
penetration
Significant Growth of Diverse Campers2
CA
MP
ERS
2020
2012
88%
63%
6%
12%
2%
13% 7%
4%
5%
Caucasian African American Hispanic Asian Other
11.313.0
2019 2020
Increasing Number of Households That Identify as RVers2
(millions)
+15%
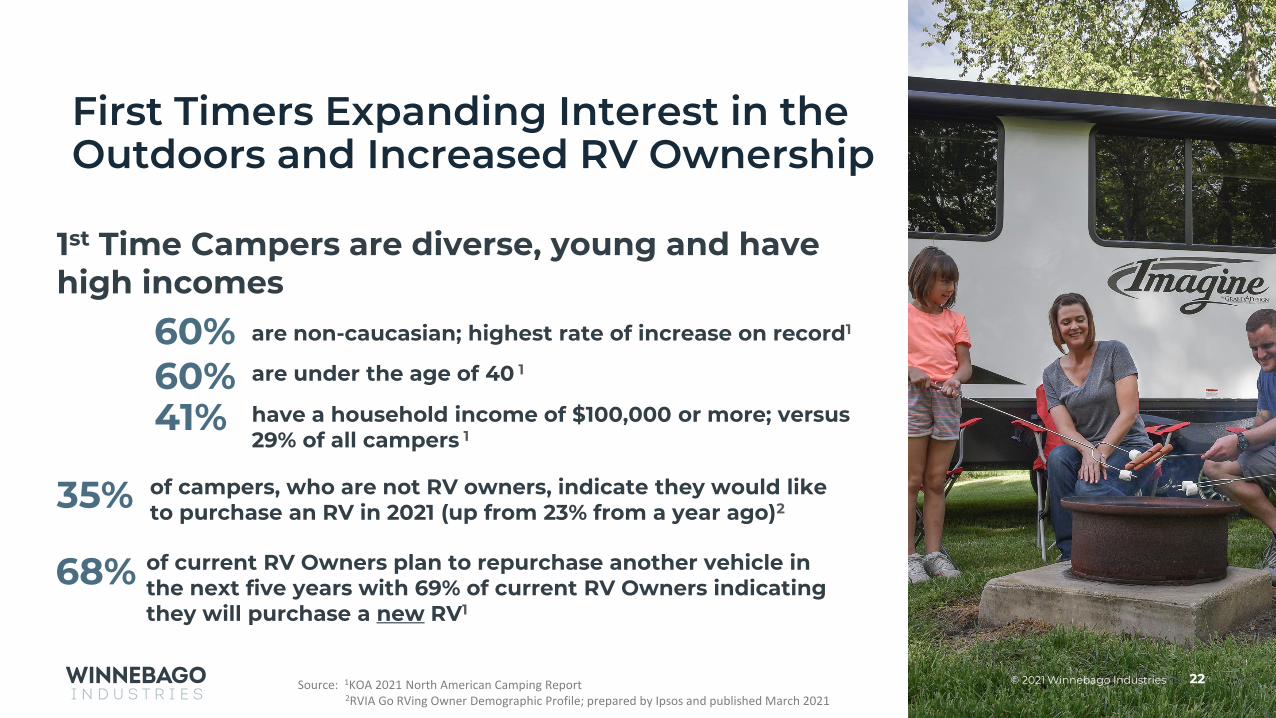
First Timers Expanding Interest in the Outdoors and Increased RV Ownership
22© 2021 Winnebago Industries
60% are non-caucasian; highest rate of increase on record1
of campers, who are not RV owners, indicate they would like to purchase an RV in 2021 (up from 23% from a year ago)235%
of current RV Owners plan to repurchase another vehicle in the next five years with 69% of current RV Owners indicating they will purchase a new RV1
68%
Source: 1KOA 2021 North American Camping Report2RVIA Go RVing Owner Demographic Profile; prepared by Ipsos and published March 2021
41% have a household income of $100,000 or more; versus 29% of all campers 1
1st Time Campers are diverse, young and have high incomes
60% are under the age of 40 1

Capital Allocation Priorities• Reinvest in our core businesses; talent, capacity
expansion, lean process improvements
• Continue to acquire businesses that are a strategic and cultural fit, and are financially accretive; Grand Design, Chris-Craft, Newmar, Barletta
• Maintain adequate liquidity; approximately $627M of liquidity as of F21 Q4, including untapped ABL of $192.5M; adjusted liquidity of $397M when considering $230M cash outlay related to the Barletta acquisition in early F22 Q1
• Optimize capital structure; F21 Q4 leverage ratio of 0.4x
• Return cash to shareholders through consistent dividends and share repurchase
✓Quarterly dividend announced in August, 2021 increased 50% to $0.18 per share
✓New $200M share repurchase authorization approved by BOD on October 13, 2021
23© 2021 Winnebago Industries
97 83134
270 237
F17 F18 F19 F20 F21
Net Cash from Operations($ - millions)
1429
4132
45
F17 F18 F19 F20 F21
Capital Expenditures($ - millions)
13 18 20 15
62
F17 F18 F19 F20 F21
Cash Returned to Shareholders1
($ - millions)
1 – defined as dividends plus share repurchases, excluding shares repurchased for employee compensation purposes
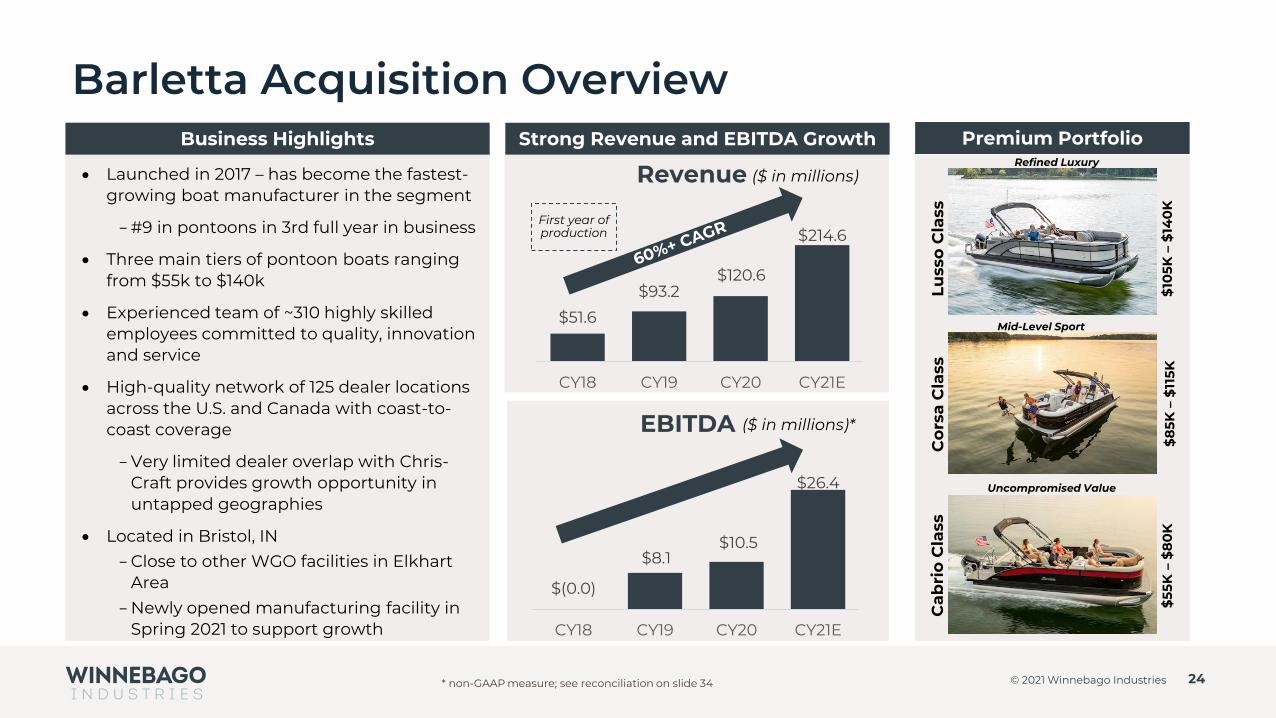
Barletta Acquisition Overview
24© 2021 Winnebago Industries
Revenue
First year of production
($ in millions)• Launched in 2017 – has become the fastest-growing boat manufacturer in the segment
-#9 in pontoons in 3rd full year in business
• Three main tiers of pontoon boats ranging from $55k to $140k
• Experienced team of ~310 highly skilled employees committed to quality, innovation and service
• High-quality network of 125 dealer locations across the U.S. and Canada with coast-to-coast coverage
-Very limited dealer overlap with Chris-Craft provides growth opportunity in untapped geographies
• Located in Bristol, IN-Close to other WGO facilities in Elkhart
Area
-Newly opened manufacturing facility in Spring 2021 to support growth
$51.6
$93.2$120.6
$214.6
CY18 CY19 CY20 CY21E
Strong Revenue and EBITDA Growth
EBITDA
$(0.0)
$8.1$10.5
$26.4
CY18 CY19 CY20 CY21E
($ in millions)*
Business Highlights
Ca
bri
o C
lass
Co
rsa
Cla
ssLu
sso
Cla
ss
$8
5K –
$11
5K$
105K
–$
140
K$
55K
–$
80
K
Premium PortfolioRefined Luxury
Mid-Level Sport
Uncompromised Value
* non-GAAP measure; see reconciliation on slide 34
1.6
2.0
2.5
0.4
0.0
0.5
1.0
1.5
2.0
2.5
3.0
F18Q1
F18Q2
F18Q3
F18Q4
F19Q1
F19Q2
F19Q3
F19Q4
F20Q1
F20Q2
F20Q3
F20Q4
F21Q1
F21Q2
F21Q3
F21Q4
Leverage Ratio*
Target Range (0.9x – 1.5x)
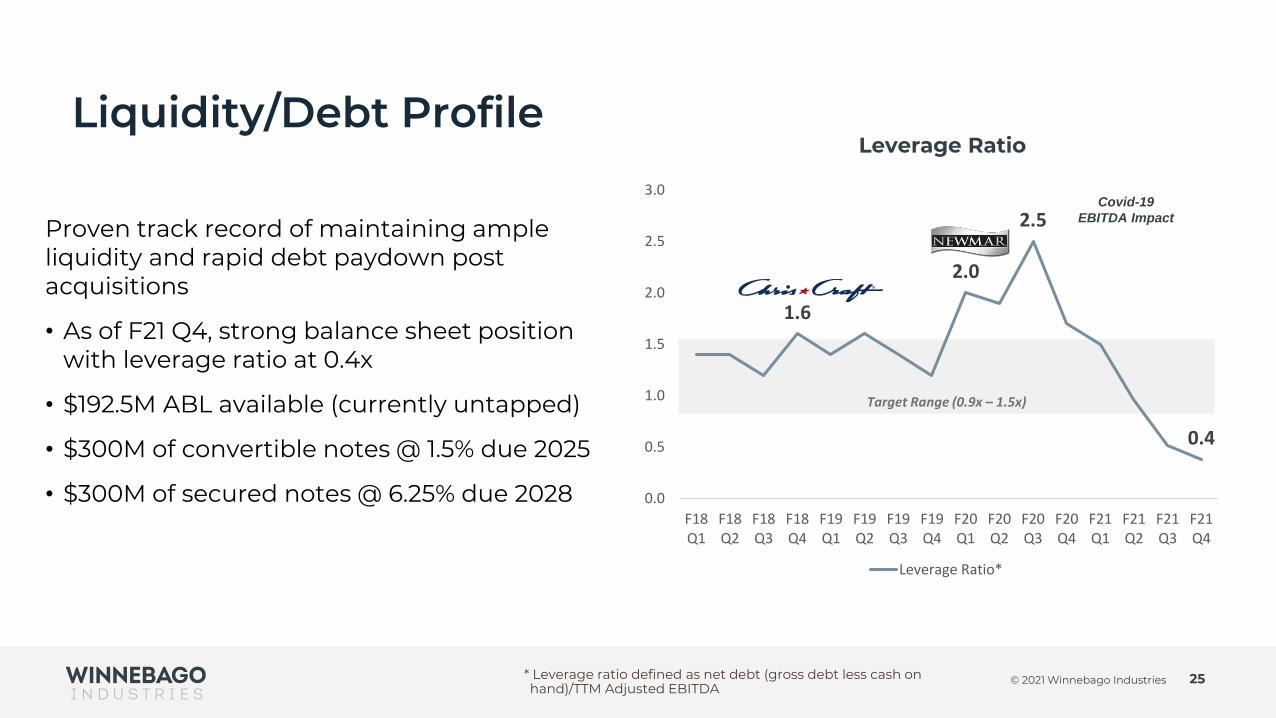
Liquidity/Debt Profile
Proven track record of maintaining ample liquidity and rapid debt paydown post acquisitions
• As of F21 Q4, strong balance sheet position with leverage ratio at 0.4x
• $192.5M ABL available (currently untapped)
• $300M of convertible notes @ 1.5% due 2025
• $300M of secured notes @ 6.25% due 2028
Leverage Ratio
25© 2021 Winnebago Industries
Covid-19
EBITDA Impact
* Leverage ratio defined as net debt (gross debt less cash on hand)/TTM Adjusted EBITDA

Adjusted EPS Definition Change in Fiscal 2022
26© 2021 Winnebago Industries
Background• Adjusted EPS was adopted by WGO in Fiscal 2020 with the acquisition of Newmar (issuance of the convertible note)• WGO has adjusted for acquisition-related/transaction costs, non-cash interest, restructuring costs, gain on sale of
assets and convertible share dilution• We believe utilizing this non-GAAP measure better represents the underlying operating performance of the business
Starting with Fiscal 2022• We will adjust for acquisition-related intangible amortization (100% of “amortization of intangible assets” line item in
the Statements of Income)
Impact to Fiscal 2022 and Fiscal 2021Q1 Q2 Q3 Q4 ANNUAL
Fiscal 2022Prior acquisition intangible amortization - $-millions 3.5 3.4 3.4 3.4 13.7Prior acquisition intangible amortization – $ EPS 0.10 0.10 0.10 0.10 0.40Barletta intangible amortization - $-millions 4.6 4.6 4.6 1.8 15.7Barletta intangible amortization – $ EPS 0.13 0.13 0.13 0.05 0.45Tax impact of adjustments – $ EPS* (0.06) (0.06) (0.06) (0.04) (0.21)NET ADJUSTED EPS IMPACT 0.18 0.18 0.18 0.12 0.65
Fiscal 2021Prior acquisition intangible amortization - $-millions 3.6 3.6 3.6 3.6 14.4Prior acquisition intangible amortization – $ EPS 0.11 0.11 0.10 0.10 0.42Tax impact of adjustments – $ EPS* (0.02) (0.02) (0.02) (0.02) (0.09)NET ADJUSTED EPS IMPACT 0.08 0.08 0.08 0.08 0.33
* Fiscal 2022 tax impact of adjustments will utilize an assumed 24.2% tax rate; Fiscal 2021 tax impact of adjustments utilize a 21.0% tax rate
NOTE: EPS data may not foot across or down due to rounding
Barletta intangible
amortization detail:
(subject to change)
Dealer Network
• $20.3M
• 12 yr. life
Backlog
• $14.0M
• 10 month life

Operational ExcellenceSafety
• Despite COVID-19 challenges:
• All operations fully functional and engaged
• Recordable incidence rate has remained stable
• Days away, restricted or transfer rate has also remained stable
• Reduced Workers’ Compensation reserves by more than 50% since 2016
Productivity/Synergies
• Newmar fully integrated and tracking to annual synergies of $5M+
• Junction City closure providing $4M+ annual productivity savings
• Winnebago RVs transitioned fully to a build-to-dealer order model during F20 providing profitability and working capital benefits in F21
• Investing in creating organic capacity in addition to capacity-enabling capital investments
27© 2021 Winnebago Industries

Corporate Responsibility
28© 2021 Winnebago Industries
As our company evolves, we focus on environmental sustainability goals
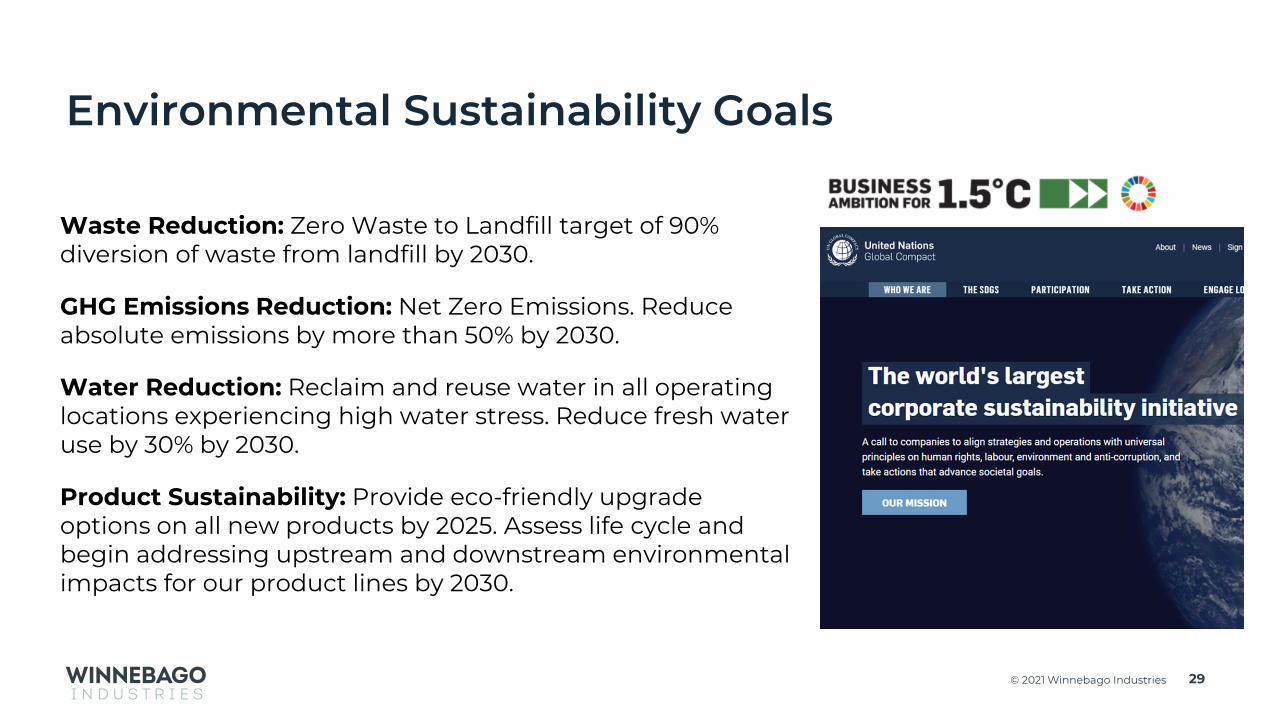
• Joined the UN Global Compact in 2021 and committed to the Business Ambition for 1.5oC
• Exploring new technologies and products to minimize environmental impact, including all-electric specialty vehicles
• Engaging with Business Units to evaluate and implement sustainability plans
People and partnerships drive our inclusive, high-performing culture
• Safety: COVID-19 response very effective, maintaining safety gains
• People: Hired first head of Diversity, Equity and Inclusion to advance strategy and goals
• Community: support National Park Foundation service corps to advance outdoor equity; launched year-round GO Together Fund to address employee hardship
Responsible governance practices guide Winnebago Industries
• Code of Conduct: 100% office–based employees trained and certified; manufacturing in progress
• ESG: enhanced corporate board engagement
• Corporate Responsibility: annual report, aligned with ESG reporting frameworks, launching December www.winnebagoind.com/responsibility
• 10 of 11 corporate directors are independent
29© 2021 Winnebago Industries
Environmental Sustainability Goals
Waste Reduction: Zero Waste to Landfill target of 90% diversion of waste from landfill by 2030.
GHG Emissions Reduction: Net Zero Emissions. Reduce absolute emissions by more than 50% by 2030.
Water Reduction: Reclaim and reuse water in all operating locations experiencing high water stress. Reduce fresh water use by 30% by 2030.
Product Sustainability: Provide eco-friendly upgrade options on all new products by 2025. Assess life cycle and begin addressing upstream and downstream environmental impacts for our product lines by 2030.
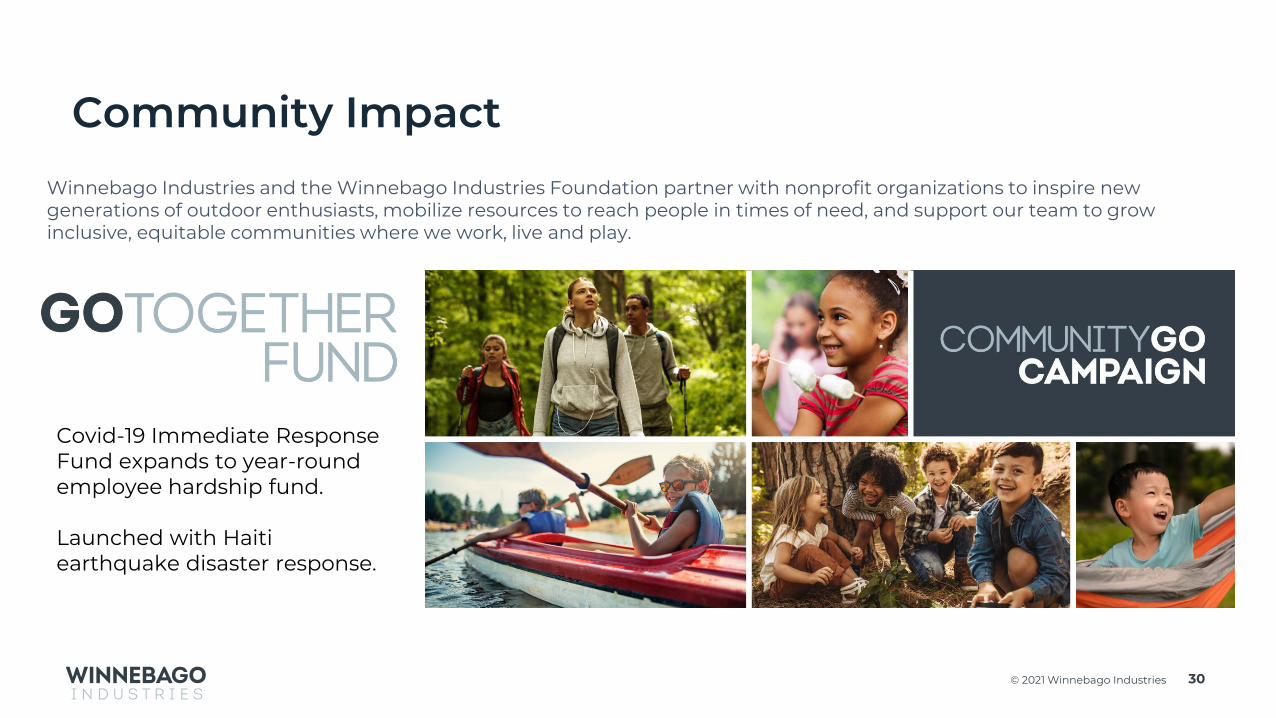
Community Impact
30© 2021 Winnebago Industries
Winnebago Industries and the Winnebago Industries Foundation partner with nonprofit organizations to inspire new generations of outdoor enthusiasts, mobilize resources to reach people in times of need, and support our team to grow inclusive, equitable communities where we work, live and play.
Covid-19 Immediate Response Fund expands to year-round employee hardship fund.
Launched with Haiti earthquake disaster response.
31© 2021 Winnebago Industries
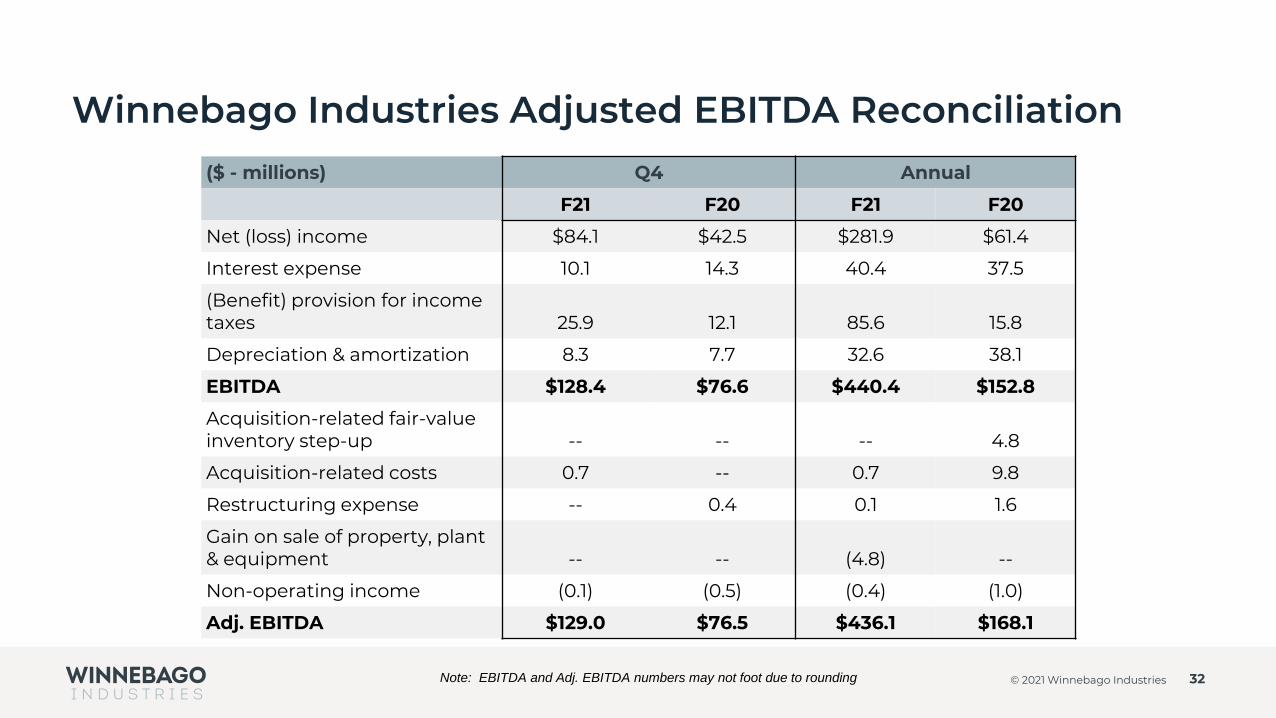
Winnebago Industries Adjusted EBITDA Reconciliation
32© 2021 Winnebago Industries
($ - millions) Q4 Annual
F21 F20 F21 F20
Net (loss) income $84.1 $42.5 $281.9 $61.4
Interest expense 10.1 14.3 40.4 37.5
(Benefit) provision for income taxes 25.9 12.1 85.6 15.8
Depreciation & amortization 8.3 7.7 32.6 38.1
EBITDA $128.4 $76.6 $440.4 $152.8
Acquisition-related fair-value inventory step-up -- -- -- 4.8
Acquisition-related costs 0.7 -- 0.7 9.8
Restructuring expense -- 0.4 0.1 1.6
Gain on sale of property, plant & equipment -- -- (4.8) --
Non-operating income (0.1) (0.5) (0.4) (1.0)
Adj. EBITDA $129.0 $76.5 $436.1 $168.1
Note: EBITDA and Adj. EBITDA numbers may not foot due to rounding
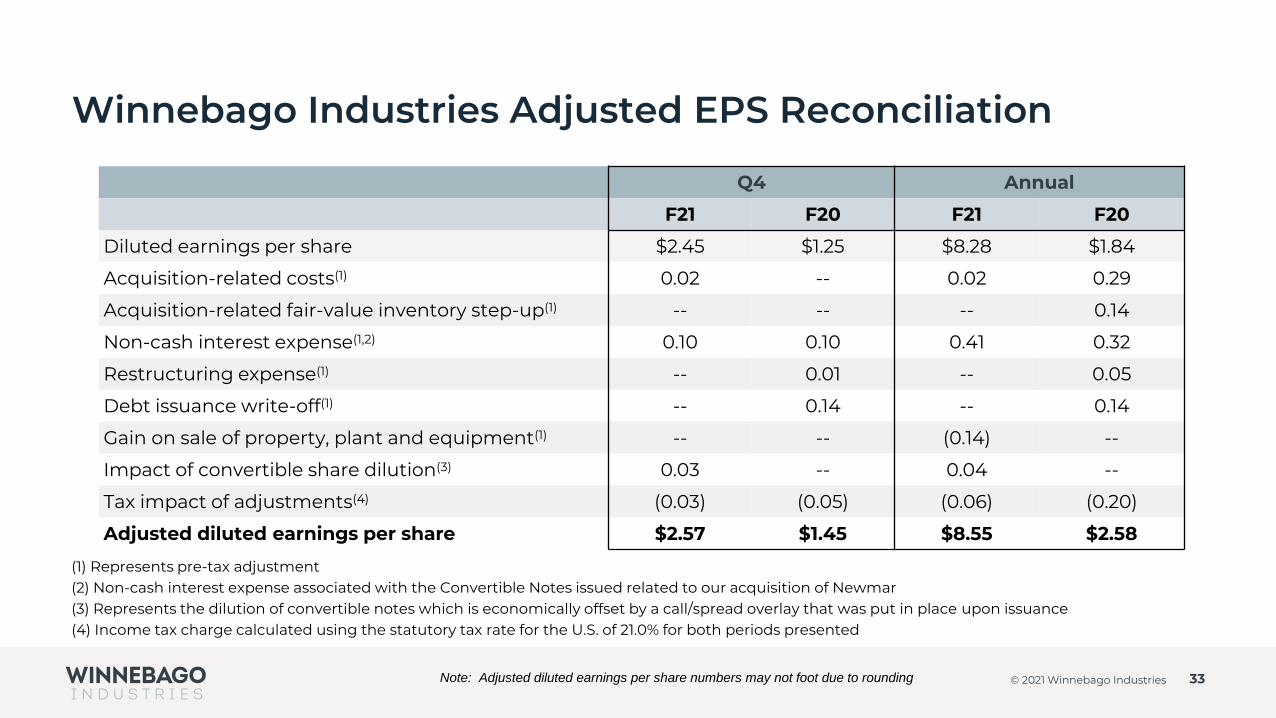
Winnebago Industries Adjusted EPS Reconciliation
33© 2021 Winnebago Industries
Q4 Annual
F21 F20 F21 F20
Diluted earnings per share $2.45 $1.25 $8.28 $1.84
Acquisition-related costs(1) 0.02 -- 0.02 0.29
Acquisition-related fair-value inventory step-up(1) -- -- -- 0.14
Non-cash interest expense(1,2) 0.10 0.10 0.41 0.32
Restructuring expense(1) -- 0.01 -- 0.05
Debt issuance write-off(1) -- 0.14 -- 0.14
Gain on sale of property, plant and equipment(1) -- -- (0.14) --
Impact of convertible share dilution(3) 0.03 -- 0.04 --
Tax impact of adjustments(4) (0.03) (0.05) (0.06) (0.20)
Adjusted diluted earnings per share $2.57 $1.45 $8.55 $2.58
(1) Represents pre-tax adjustment(2) Non-cash interest expense associated with the Convertible Notes issued related to our acquisition of Newmar(3) Represents the dilution of convertible notes which is economically offset by a call/spread overlay that was put in place upon issuance(4) Income tax charge calculated using the statutory tax rate for the U.S. of 21.0% for both periods presented
Note: Adjusted diluted earnings per share numbers may not foot due to rounding
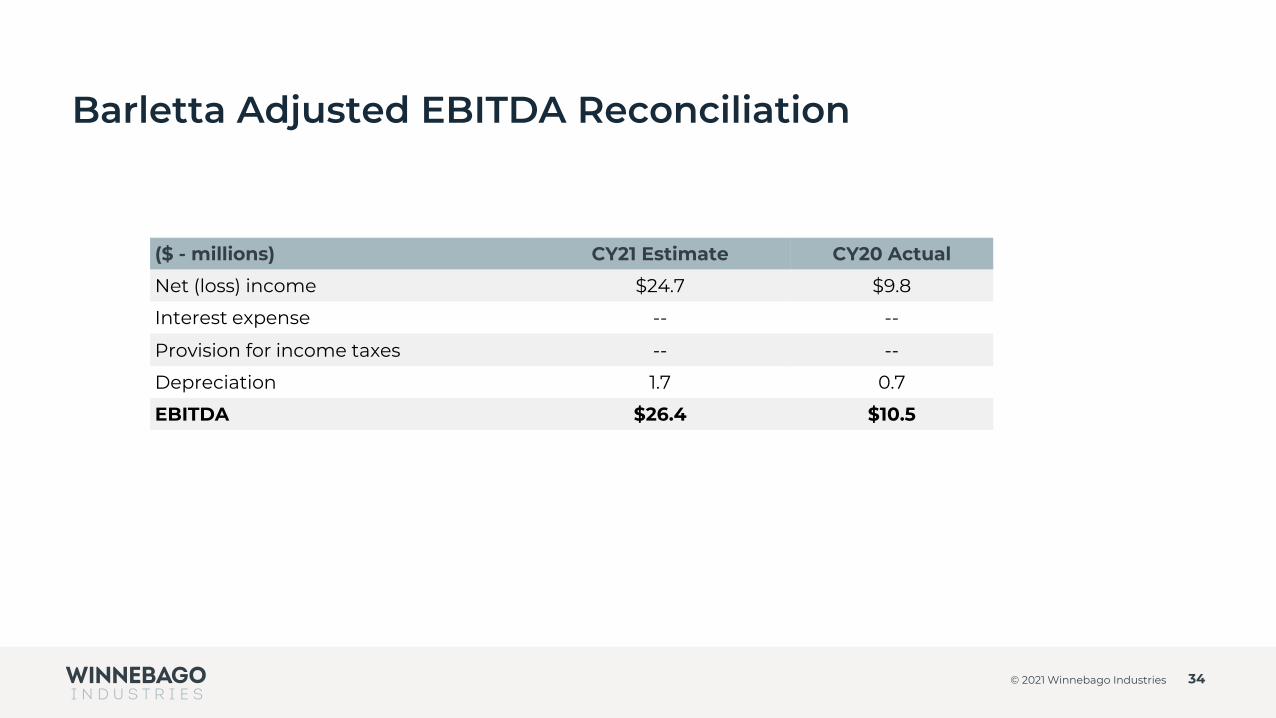
Barletta Adjusted EBITDA Reconciliation
34© 2021 Winnebago Industries
($ - millions) CY21 Estimate CY20 Actual
Net (loss) income $24.7 $9.8
Interest expense -- --
Provision for income taxes -- --
Depreciation 1.7 0.7
EBITDA $26.4 $10.5

Winnebago Industries Free Cash Flow Reconciliation
35© 2021 Winnebago Industries
($ - millions) F21 F20
Net cash provided by operating activities $237.3 $270.4
Purchases of property, plant, and equipment (44.9) (32.4)
Free Cash Flow $192.4 $238.0


