DIRECTORATE GENERAL ECONOMICS FISCAL POLICIES DIVISION FISCAL CONSOLIDATION IN EU COUNTRIES IN THE NINETIES: NEW FACTS AND POLICY IMPLICATIONS 1 July 2002 1 Prepared by Maria Gabriella Briotti, European Central Bank. Anna Foden prepared tables and charts and also contributed to the organisation of the database. I would like to thank Professor Albert Ando, Professor Jürgen von Hagen, Ludger Schuknecht and Guido Wolswijk for useful comments and suggestions, and Anna Foden for her editing work. The views expressed are mine and do not necessarily reflect those of the ECB.
Transcript
DIRECTORATE GENERAL ECONOMICS FISCAL POLICIES DIVISION
FISCAL CONSOLIDATION IN EU COUNTRIES IN THE NINETIES: NEW FACTS AND POLICY IMPLICATIONS1
July 2002
1 Prepared by Maria Gabriella Briotti, European Central Bank. Anna Foden prepared tables and charts and also contributed to the organisation of the database. I would like to thank Professor Albert Ando, Professor Jürgen von Hagen, Ludger Schuknecht and Guido Wolswijk for useful comments and suggestions, and Anna Foden for her editing work. The views expressed are mine and do not necessarily reflect those of the ECB.
2
1 Introduction
In the 1990's, most EU countries hurried to meet the Maastricht fiscal parameters'
requirement under comparable economic conditions and adopted sizeable fiscal
consolidation. This provides a unique standpoint and a consistent framework to analyse and
compare the budgetary adjustments adopted by the various countries and detect their impact
on public finances sustainability and economic activity. This paper takes a close look at a
host of stylised facts to describe the main features of the budget consolidation implemented
by the various Member States in stage two and three of monetary union. The paper
highlights, in a rather descriptive fashion, whether considerations relative to convergence of
budget structure and competitiveness have influenced policy choices since the signing of the
Maastricht Treaty. As a closely related issue, the paper points out the conditions under which
fiscal contractions might have minimised their negative effects on growth and have been
effective in producing lasting budget consolidation. In so doing, the purpose of the paper is to
set a framework for further discussion and empirical work on the subject.
Following the introduction, the second section presents stylised facts of the fiscal
consolidation process in EU countries over the 1990s. The observation of the budgetary
adjustments in EU countries, shows that revenue based adjustments have generally
preceded expenditure based adjustments. The paper claims that in the choice of policy
adopted, convergence of budget structure and awareness of their impact on a country's
competitiveness played a role. Hence, initial budget conditions have influenced the choice of
policies.
The third section focuses on the macroeconomics of fiscal consolidation. The paper claims
that the new institutional framework of budget discipline enshrined by the Maastricht Treaty
may have increased the credibility of governments regarding their commitment to comply
with the fiscal parameters requirement. Hence, intertemporal effects of fiscal policy have
become more relevant, thus strengthening potential positive wealth effects of fiscal
consolidation. The sizeable budget adjustments implemented by the various countries in the
run up to EMU, even in periods of slow growth, might have to some extent been unexpected.
Therefore, fiscal consolidation could have caused people to switch their expectations about
future policies. Hence, because of a Maastricht effect on confidence, contractionary effects of
fiscal consolidation might have been somewhat lessened in the 1990's. In this respect, the
paper produces some evidence that countries that relied more on tax consolidation than
others might have recorded the lowest growth rates.
3
2 Fiscal consolidation in the EU countries in the 1990s
2.1 Declining deficits and debt ratios in the second half of the nineties, in the EU and euro area-12
At the beginning of the nineties, most EU countries showed sizeable imbalances in their
public finances. In 1991, the general government deficit ratio was equal to 4.2% of GDP on
average in the EU-15, and it was somewhat higher on average in the euro area-12 (see
Table 1). Almost all countries recorded a deficit: nine of them had deficit ratios between 1%
and 3% of GDP, three of them had deficit ratios between 4% and 7% of GDP and two of
them had deficit ratios higher than 11% of GDP. Net of the expenditure for interests on public
debt, the primary budget balance in 1991 was in surplus, both in the average of the EU-15
and of the euro area-12. In the same year, the general government debt ratio was equal to
55% of GDP in the average of the EU countries and somewhat higher in the average of the
euro area-12. Eight countries had a debt ratio below 60% of GDP and four countries above
90% of GDP. Taking as reference the Maastricht fiscal parameters, six countries recorded
both budget balance and debt imbalances and six countries showed clear budget imbalances
(Chart 1).
Looking at the period between 1991 and 2001, one can easily detect that budgetary
development in the EU-15 and euro area aggregates have generally followed a common
pattern (see Table 2). An initial generalised worsening of budget balance and debt ratios took
place until the mid-nineties, also reflecting the budgetary impact of the economic recession of
1993-1994. A subsequent period of strong budgetary improvement took place in 1996 and
1997, as a result of countries' consolidation efforts in the run up to EMU. In 1997, the
reference year to assess the countries' convergence to the criteria of the Maastricht Treaty,
the average general government budget deficit ratio declined to 2.5% on average in the EU-
15 countries and to 2.6% in the euro area-12 average. This accounts for a remarkable
budgetary improvement of 2.7 percentage points of GDP for the EU-15 and 2.4 percentage
points of GDP in the euro area-12, during the years 1996 and 1997. Declining interest
expenditure also contributed to the budgetary improvement. Therefore, the primary budget
balance ratio improved less than the total budget balance ratio during the same period, by
2.3 percentage points in the EU-15 average and 2.0 percentage points in the euro area-12
average, respectively. During the more recent years from 1998 to 2001, budget balances
generally improved and debt ratios were on a steady declining path. As of the end of 2001,
the general government budget deficit had declined further to 0.5% of GDP on average in the
EU-15 and to 1.1% of GDP on average in the euro area-12.
4
Since 1997, the general government debt ratio has been on a steady declining path. In 2001
the debt ratio had declined from its peak in the mid-nineties by some 10 percentage points to
62.5% of GDP on average in the EU-15 and by some 7 percentage points to 68.8% of GDP
on average in the euro area-12. However, it is still much higher than at the beginning of the
decade in both the EU-15 and euro area-12 aggregate.
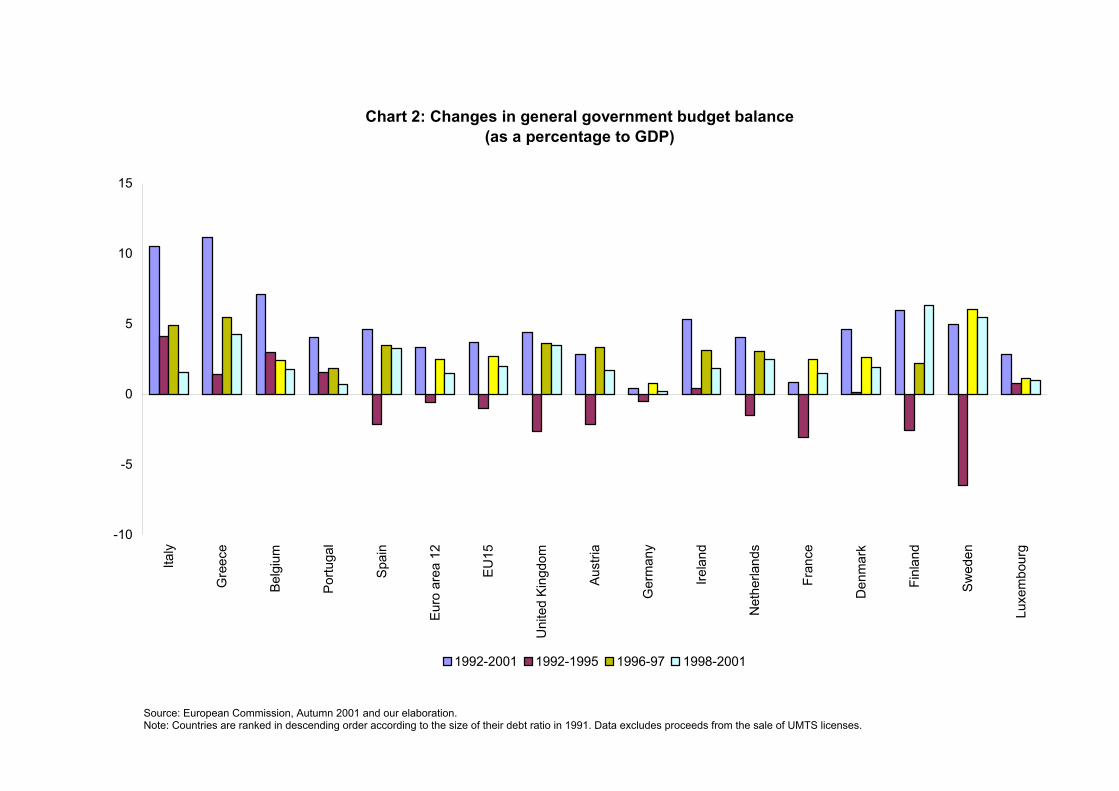
As expected, deficit reductions were larger in countries which showed the largest initial
budget imbalances. Therefore, over the period considered, countries' fiscal positions have
converged towards lower deficits and debt. Ranking countries in descending order, according
to the size of their budget deficit ratio in 1991, shows that the largest reduction of budget
deficit ratios over 1992 until 2001 generally occurred in those countries which had recorded
the highest initial deficit ratios (Chart 2). However, budget deficits are not the only concern in
assessing fiscal imbalances and implementing budgetary adjustments, which also depend on
the size of the accumulated size of the public debt ratio. Ranking countries in descending
order, according to the size of their debt ratio in 1991, shows that higher debt ratios at the
beginning of the period are generally combined with the largest debt reductions over 1992
until 2001, with the notable exceptions of Greece and Italy (Chart 3).
2.2 Fiscal stance becomes restrictive in the run-up to EMU
Looking back over the years 1991 to 2001, one can distinguish three different stages of fiscal
consolidation in the EU countries (see Table 3 and Chart 4). During the period from 1992 to
1995, the fiscal stance, as measured by the cyclically adjusted primary balance, was
moderately restrictive. The cyclically adjusted primary surplus improved by 0.8 percentage
points in the EU-15 to 0.5% of GDP in 1995, and by 1.7 percentage points in the euro area-
12 to 0.8% of GDP in 1995. In the run-up to EMU, and in particular over the years 1996 and
1997, the fiscal stance became more restrictive and the cyclically adjusted primary surplus
improved by 2.4 percentage points of GDP in the EU-15 and by 2.2 percentage points of
GDP in the euro area-12. Taking as reference the year 1997, when the convergence to the
Maastricht Treaty was assessed, the fiscal stance in the EU countries became broadly
neutral or somewhat expansionary afterwards. During the years 1998 until 2001, the
cyclically adjusted primary surplus remained broadly constant on average in the EU-15 and
even diminished somewhat on average in the euro area-12.
In general, countries with higher budget imbalances have performed greater consolidation
efforts over the nineties. This is broadly illustrated by chart 4, where countries are ordered in
descending order, according to the size of their budget deficit in 1991. Chart 4 indicates that
countries' consolidation efforts, as measured by the overall change in the cyclically adjusted
5
primary balance, are generally declining going from left to right, with the most notable
exception of Portugal.
Most countries strengthened their consolidation efforts in 1996 and 1997 in the run-up to the
EMU. Taking the annual average change of the cyclically adjusted primary balance, for each
individual country and in each period considered, roughly illustrates how countries have
distributed their consolidation efforts over time (see Table 3). In 1996 and 1997, the annual
average consolidation effort was some 1.2 and 1.1 percentage points of GDP in the EU-15
and euro area-12, respectively. This indicates bigger annual consolidation efforts than at any
other period of time considered. By contrast, in the previous years from 1991 to 1995, the
annual average consolidation effort accounted for only 0.2 and 0.4 percentage points of
GDP, in the EU-15 and euro area-12, respectively. Furthermore, the annual average change
of the cyclically adjusted primary balance over the years 1998 until 2001 shows a
consolidation fatigue in EU countries and the euro area as a whole.
2.3 Revenue and expenditure ratios converging towards EU-15 and euro area-12 average
From 1991 until 1997, most EU countries recorded sizeable increases of revenue-to-GDP
ratios, with expenditure ratios also showing some increases. Expenditure cuts were instead
generally implemented only since 1996. Overall, tax increases have been lower (and tax cuts
higher) in countries where the revenue ratios were above the EU-15 and euro area-12
respective average. To some extent, expenditure cuts have been largest in countries with
higher than average expenditure ratios. At the end of the period considered, the standard
deviation across countries' structural revenue ratios and primary expenditure ratios declined
significantly both in the EU-15 and in the euro area-12 aggregates.
From 1991 to 2001 the total revenue to-GDP ratio increased by 1 percentage point to 46.4%
of GDP in the EU-15 and by 1.6 percentage points to 46.8% of GDP in the euro area-12 (see
Table 4). However, the increase in the revenue ratio over the whole period hides the
developments in some specific years and in individual countries. From 1991 until 1997, the
total revenue ratio increased by 1.6 percentage points to 46.9% of GDP in the EU-15 and by
2.4 percentage points to 47.6% of GDP in the euro area. Having reached a maximum value
of the ratio in 1997, it started declining thereafter. From 1998 until 2001, the total revenue
ratio declined by 0.5 percentage point of GDP in the EU-15 and by 0.8 percentage points in
the euro area-12. However, some countries continued to increase their revenue even in later
years. Furthermore, countries with higher than average revenue ratios have been less
inclined to further increase their taxes. Therefore, over the period considered, the biggest
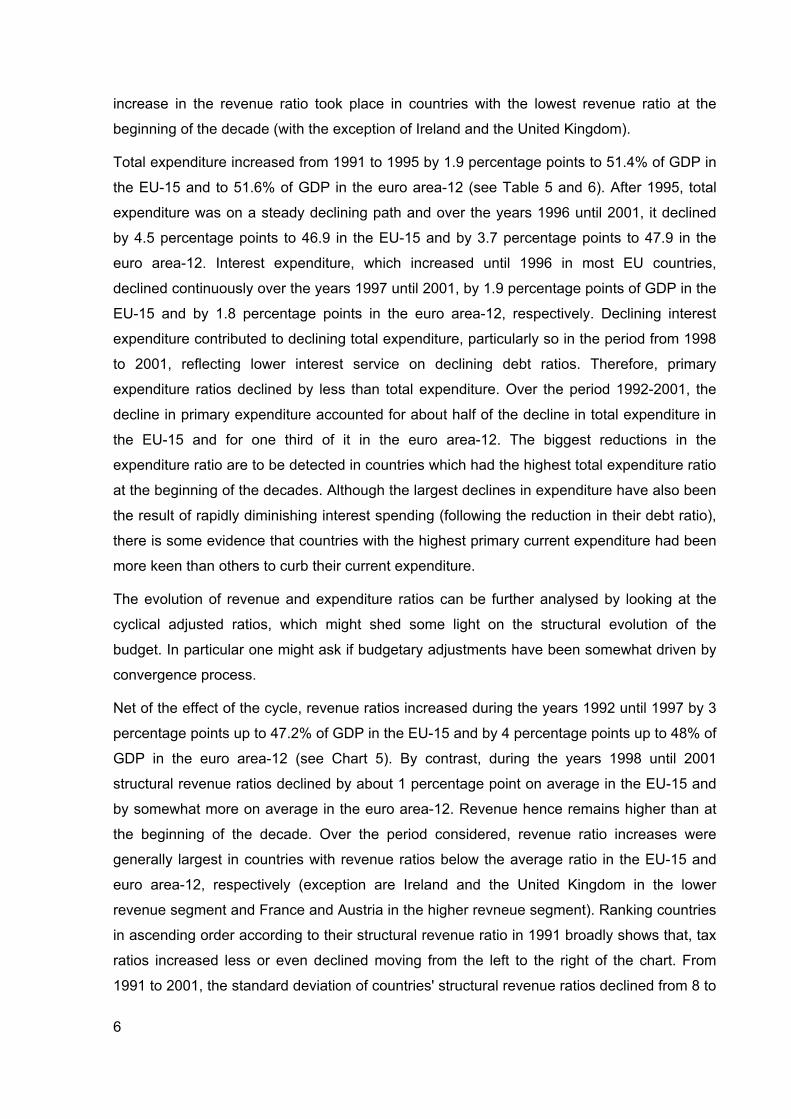
6
increase in the revenue ratio took place in countries with the lowest revenue ratio at the
beginning of the decade (with the exception of Ireland and the United Kingdom).
Total expenditure increased from 1991 to 1995 by 1.9 percentage points to 51.4% of GDP in
the EU-15 and to 51.6% of GDP in the euro area-12 (see Table 5 and 6). After 1995, total
expenditure was on a steady declining path and over the years 1996 until 2001, it declined
by 4.5 percentage points to 46.9 in the EU-15 and by 3.7 percentage points to 47.9 in the
euro area-12. Interest expenditure, which increased until 1996 in most EU countries,
declined continuously over the years 1997 until 2001, by 1.9 percentage points of GDP in the
EU-15 and by 1.8 percentage points in the euro area-12, respectively. Declining interest
expenditure contributed to declining total expenditure, particularly so in the period from 1998
to 2001, reflecting lower interest service on declining debt ratios. Therefore, primary
expenditure ratios declined by less than total expenditure. Over the period 1992-2001, the
decline in primary expenditure accounted for about half of the decline in total expenditure in
the EU-15 and for one third of it in the euro area-12. The biggest reductions in the
expenditure ratio are to be detected in countries which had the highest total expenditure ratio
at the beginning of the decades. Although the largest declines in expenditure have also been
the result of rapidly diminishing interest spending (following the reduction in their debt ratio),
there is some evidence that countries with the highest primary current expenditure had been
more keen than others to curb their current expenditure.
The evolution of revenue and expenditure ratios can be further analysed by looking at the
cyclical adjusted ratios, which might shed some light on the structural evolution of the
budget. In particular one might ask if budgetary adjustments have been somewhat driven by
convergence process.
Net of the effect of the cycle, revenue ratios increased during the years 1992 until 1997 by 3
percentage points up to 47.2% of GDP in the EU-15 and by 4 percentage points up to 48% of
GDP in the euro area-12 (see Chart 5). By contrast, during the years 1998 until 2001
structural revenue ratios declined by about 1 percentage point on average in the EU-15 and
by somewhat more on average in the euro area-12. Revenue hence remains higher than at
the beginning of the decade. Over the period considered, revenue ratio increases were
generally largest in countries with revenue ratios below the average ratio in the EU-15 and
euro area-12, respectively (exception are Ireland and the United Kingdom in the lower
revenue segment and France and Austria in the higher revneue segment). Ranking countries
in ascending order according to their structural revenue ratio in 1991 broadly shows that, tax
ratios increased less or even declined moving from the left to the right of the chart. From
1991 to 2001, the standard deviation of countries' structural revenue ratios declined from 8 to
7
6.7 in the EU-15 and from 7 to 5.7 in the euro area-12, illustrating some convergence of
revenue collection.
Cyclically adjusted primary total expenditure declined slightly over the total 1991-2001
period. It increased from 1991 until 1995 by more than one percentage point up to about
45.9% of GDP, both in the EU-15 and in the euro area-12 (see Chart 6). Structural reduction
of expenditure only took place from 1996, and continued steadily until 2001, with a total
reduction of 2.7 percentage points down to 43.3% of GDP in the EU-15 and a smaller
reduction of some 1.8 percentage points, down to 44% of GDP in the euro area-12.
Fiscal consolidation efforts on the expenditure side have been stronger in countries that had
very high expenditure ratios in 1991. This is broadly shown in the chart, where countries are
ranked from left to right in descending order, according to the size of their structural primary
expenditure ratio in 1991. Almost all countries with higher than average expenditure ratios
have reduced their expenditure ratios. By contrast, almost all increases in expenditure ratios
took place in countries with lower-than-average expenditure ratios (except for France). From
1991 to 2001, the standard deviation of countries' structural primary expenditure ratios
declined from 6.8 to 5.9 in the EU-15 and from 6.4 to 5.3 in the euro area-12. A qualitative
conclusion that one can draw is that in the choice of policy adopted awareness of the
convergence process and of competitive aspects have plaid a role.
2.4 Capital expenditure shows a mixed pattern
Capital expenditure shows a mixed pattern among EU countries. Most countries have
generally reduced capital expenditure ratios over 1992 until 2001. There is also some
evidence that countries with historically low capital expenditure have increased their capital
expenditure in the effort to improve their infrastructure. This is suggested by the pattern of
capital expenditure ratio changes over 1991 until 2001, where countries are ranked in
descending order according to their capital expenditure ratios in 1991 (see Chart 7). The
chart shows that increases in capital expenditure ratio have mostly taken place in countries
with below average capital expenditure.
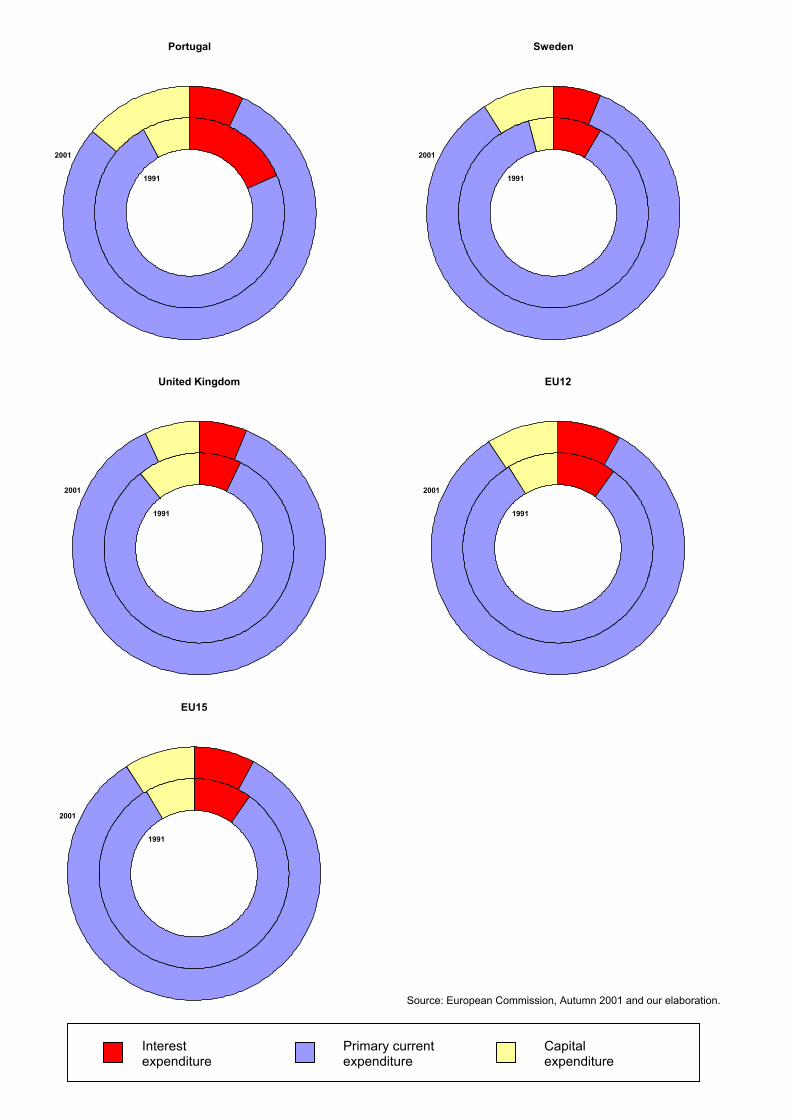
The composition of expenditure in individual countries shows some clear changes over the
decade considered (Chart 8). The chart shows the expenditure composition for its main items
(primary current, capital and interest expenditure) in 1991 and 2001. As expected, capital
expenditure increased in countries that recorded relatively lower capital expenditure ratios to
total expenditure during the period considered. This has been particularly the case in
Greece, Ireland, Portugal and Sweden. Furthermore, countries with higher debt ratios have
benefited more from the decline in interest spending. This has been particularly the case for
8
Belgium, Greece, Ireland, Italy and Portugal. In a number of countries the decline in interest
spending has somewhat compensated a larger share in current expenditure. This has been
so in Belgium, Denmark and Italy. In other countries, such as Greece, Ireland and Portugal,
lower interest expenditure has created more room for capital expenditure. However, given
that changes of opposite signs have taken place in different countries, taken together for the
EU-15 and the euro area-12 the composition of the budget by main items remained broadly
constant.
2.5 Revenue based adjustment preceded expenditure based adjustment
Budgetary adjustments implemented by EU countries from 1991 until 2001 can be described
according to three distinct periods (see Charts 9a, 9b and 9c, where the portions of the
quadrant with a positive sign indicate a budget improvement and vice versa). From 1991 until
1995, the cyclically adjusted primary budget balance, as ratio to GDP, improved only slightly
on average in both the EU-15 and the euro area. The moderate budgetary consolidation was
largely based on revenue adjustments, partly offset by increases in expenditure. This is
shown in chart 9a, where positive changes in the cyclically adjusted revenue to-GDP ratio
have been partly offset by changes in the cyclically adjusted primary expenditure to-GDP
ratio. As a result, the variation of the cyclically adjusted primary budget balance ratio in the
EU-15 and the euro area-12, respectively, lies in the portion of the quadrant denoted by a
positive sign, pointing to the budget improvement recorded in the period considered.
Furthermore, the observed values fall in the first quadrant, illustrating that budget adjustment
was revenue based.
The average picture hides individual countries' developments to some extent. Almost all
countries increased their tax revenues. However, four countries (Spain, Italy, Luxembourg
and Finland) matched policies of higher revenue with expenditure restraint, thus reinforcing
their budgetary adjustment. By contrast, in four countries (Belgium, Germany, Greece and
Portugal) revenue increases were partially offset by expenditure increases, while in three
countries (Denmark, France and Austria) expenditure overrun more than offset tax based
adjustment. As a result, only eight of the 15 EU countries succeeded in implementing fiscal
consolidation in the period considered. In the case of Ireland and the Netherlands, moreover,
tax rebates came together with expenditure restraints, thus allowing a broadly neutral stance
over the period considered.
In the years 1996 to 1997, the cyclically adjusted primary budget ratio improved significantly
on average in the EU-15 and euro area-12 (see Chart 9b). Both expenditure restraints and
revenue increases contributed to budget consolidation, with a larger contribution from the
9
expenditure side relative to the revenue side in the EU-15 as a whole, and a more balanced
contribution from both sides in the euro area-12. In the chart, the observed values in fact fall
in the second quadrant, indicating both revenue and expenditure based adjustments. With
the only exception of Portugal, all countries implemented policies to curb expenditures, which
allowed a reduction of the expenditure to-GDP ratio or its stabilisation. However, revenue
increases also contributed to budget adjustments in a number of countries (Belgium,
Germany, Spain, France, Italy and Sweden), thus strengthening the effects of expenditure
restraints. With the only exceptions of Portugal and Finland, all countries implemented
restrictive policies in the period considered.
In the period 1998 until 2001, the structural primary budget balance ratio remained broadly
constant on average in the EU-15, reflecting a broadly balanced reduction of the average
expenditure and revenue ratios, and declined somewhat in the euro area (see Chart 9c).
Looking at individual countries, most of them adopted policies aimed at simultaneously
lowering structural revenue and expenditure. As a result, most countries have maintained a
broadly neutral fiscal stance showing greater concern for issues such as quality of public
finances, budget composition and the size of government, than for further needed
consolidation. This is illustrated by Chart 8c, where most countries lie along the bisect
(neutral stance) and in the third quadrant (negative changes of both revenue and expenditure
ratios). Notable exceptions were Ireland, Italy and Portugal, which recorded some
deterioration in their structural budgets. By contrast, Greece, Finland and the United
Kingdom pursued some further consolidation.
A number of countries recorded a setback in fiscal consolidation in the aftermath of their
budget consolidation. In terms of budget balance deterioration, the setback was stronger in
Belgium, Germany, Italy, the Netherlands and Sweden. With the only exception of Sweden,
those countries have relied more on tax based adjustments than on expenditure based
adjustments.
A tentative conclusion one can draw from the observation of budgetary adjustments in EU
countries, is that revenue based adjustments have generally preceded expenditure based
adjustments. One possible explanation is that the commitment to budget discipline enshrined
in the Maastricht Treaty and the inevitable approach of the Convergence doomsday might
have produced a "Maastricht effect" which urged countries to pursue rapid and significant
budget consolidation. Hence, governments chose to implement tax increases before
expenditure cuts because of their immediate impact on the budget deficit, while effects from
expenditure cuts generally lag behind. This has been particularly the case of countries with
large imbalances.
10
2.6 Composition of adjustment also reflects initial budget conditions
One might like to ask whether there were significative differences in the composition of the
budget adjustments adopted by the various countries within the periods considered. Different
policies could have reflected different sources of budget vulnerability for the various
countries. For instance, when benefits from social security systems mature, curtailing current
expenditure is not in the immediate control of government. Or else, in some countries,
measures to curtail capital spending have more difficulty gaining acceptance politically.
Furthermore, initial budget conditions, such as serious budget imbalances or budget
composition not in line with the EU average might have prompted structural adjustments in
countries' budgets. Analysis by simple graphical means suggests that the overall process of
budget adjustments over the entire period 1992-2001 have followed broadly similar patterns.
Chart 9d shows that at the end of the period considered, all countries observations lie in the
portions of the quadrant denoted by a positive sign. The dispersion of countries'
observations, with reference to the entire period considered, appears to be smaller than in
each of the sub-periods considered.
In order to see if initial budget conditions have influenced policies adopted by the various
countries, chart 10 illustrates the prevailing revenue and expenditure ratios in the various
countries in 1991. Observations located in the first and second quadrant indicate countries
which had revenue ratios above the EU-15 and euro area-12 average, such as Sweden,
Finland, Denmark, the Netherlands, Austria, France and Luxembourg. Looking at the overall
adjustment for the entire period, one can see that countries with higher revenue ratios have
been keener to reduce their revenue ratios or have recordedsmallr tax increases. By
contrast, countries like Portugal and Greece, starting from relatively low revenue ratios, have
recorded the highest revenue increase. In conclusion, there is some qualitative evidence that
initial budget conditions, including both the magnitude of fiscal imbalances and budget
composition, might have affected the choice of budget policy. This would further confirm a
"Maastricht effect" in terms of convergence of budget structure. However, over the long run,
differences in the composition of budgetary adjustments appear to reflect a different timing of
implementation of a given fiscal policy rather than uncorrelated fiscal policies.
3 The macroeconomics of fiscal consolidation in the run up to EMU
3.1 An overview of the main issues
One relevant aspect of the assessment of fiscal consolidation processes is the analyses of
11
the interaction between growth and fiscal policy. The economic literature has deeply
analysed the issue against the background of episodes of fiscal consolidation undertaken in
the past and current decades. The literature emphasises that, in the short run, a restrictive
fiscal policy would generally imply contractionary effects on the aggregate demand.
However, expansionary effects are also possible if fiscal policies prompt a change in the
expectations of economic agents about their future wealth (demand side effects) and/or
contribute to improve the competitiveness of the economy (supply side effects).
A number of crucial assumptions must be satisfied for a restrictive policy to produce
expansionary effects. According to the expectation view, fiscal adjustments must come as a
surprise and modify people's expectations about the need for more disruptive future fiscal
restriction and, hence, future wealth. Tax systems also play a role, with higher distortionary
effects attached to larger and more disruptive consolidations. Government must be
committed to fiscal discipline in a credible way, thus strengthening intertemporal effects of
restrictive fiscal policy on expected wealth and demand. In order to determine possible
expansionary effects, the crucial aspects of a budget adjustment are its size, composition,
graduality of implementation and initial conditions of public finances.
The paper claims that the new institutional framework of budget discipline enshrined by the
Maastricht Treaty has raised new elements of interest in the analysis. In particular, some
conditions might have been satisfied according to which contractionary fiscal policies might
have minimised their contractionary effect on growth.
In order to find support for these claims, the next section analyses the economic and budget
conditions under which countries have undertaken their budgetary consolidation in the run up
to EMU. Fiscal consolidation undertaken by almost all EU countries over the same years,
and therefore under similar economic conditions, provides a consistent framework to analyse
the budgetary adjustments adopted by the various countries. Based on qualitative analyses,
the section highlights that specific features of the consolidation process could have made its
effects on growth less detrimental. It illustrates conditions according to which consolidation in
the run up to EMU might have been less detrimental for growth and points at some evidence
that consolidation fatigue in the aftermath of monetary union was stronger for tax based than
Von Hagen J., A. Hughes Hallet and R. Strauch, (2001), Budgetary consolidation in EMU,
Economic Papers, No. 148, March.
IMF, (1996), Can fiscal contraction be expansionary in the short run? World Economic
Outlook.
IMF, (2001), Impact of fiscal consolidation on macroeconomic performances, World
Economic Outlook.
Krugman P. R. and M. Obsfeld, (1987), International Macroeconomics: Theory and Policy.
Mc Dermott, J. and R. Wescott, (1996), An empirical analysis of fiscal adjustments, IMF Staff
Papers, Vol. 43, No. 4, December.
Modigliani, F. and R. Brumberg, (1954), Utility analysis and the consumption function: an
interpretation of cross-section data, in K. K. Kurihara (ed.), Post Keynesian economics,
Rutgers University Press.
Obstfeld M., and K. Rogoff, (1996) Foundations of international economics, Cambridge MA,
MIT Press.
OECD, (1993), Economic outlook, Automatic stabilisers: their extent and role, June.
Perotti, R., (1996), Fiscal consolidation in Europe: composition matters, The American
Economic Review: Papers and Proceedings, Vol. 86, No. 2, May.
Perotti, R., (1999), Fiscal policy in good times and bad, Quarterly Journal of Economics,
November.
Perotti, R., (2000), What do we know about the effects of fiscal policy? XII Riunione
scientifica, Pavia, Collegio Ghisleri, Università di Pavia, ottobre 2000.
Perotti R., (2002), Estimating the effects of fiscal policy in OECD countries, Mimeo, ISOM
Conference, Frankfurt am Main, Germany.
Romer, D., (2001), Advanced macroeconomics, McGraw-Hill, second edition.
Sutherland, A., (1997), Fiscal crises and aggregate demand: can high public debt reverse the
effects of fiscal policy, Journal of Public Economics, LXV.
Zaghini A., (1999), The economic policy of fiscal consolidations: The European experience,
Temi di discussione, Banca d'Italia, No. 355, June.
FISCAL CONSOLIDATION IN EU COUNTRIES IN THE NINETIES: NEW FACTS AND POLICY IMPLICATIONS1
Tables and Charts
July 2002
1 Prepared by Maria Gabriella Briotti, European Central Bank. Anna Foden prepared tables and charts and also contributed to the organisation of the data base. I would like to thank Jürgen von Hagen, Ludger Schuknecht and Guido Wolswijk for useful comments and suggestions, and Anna Foden for her editing work. The views expressed are mine and do not necessarily reflect those of the ECB.
Table 1General government budgetary position in EU countries and the euro area(as a percentage of GDP)
Note: Countries are ranked in descending order, according to the change of the cyclically adjusted primary balanceSource: European Commission, Autumn 2001 and our elaboration
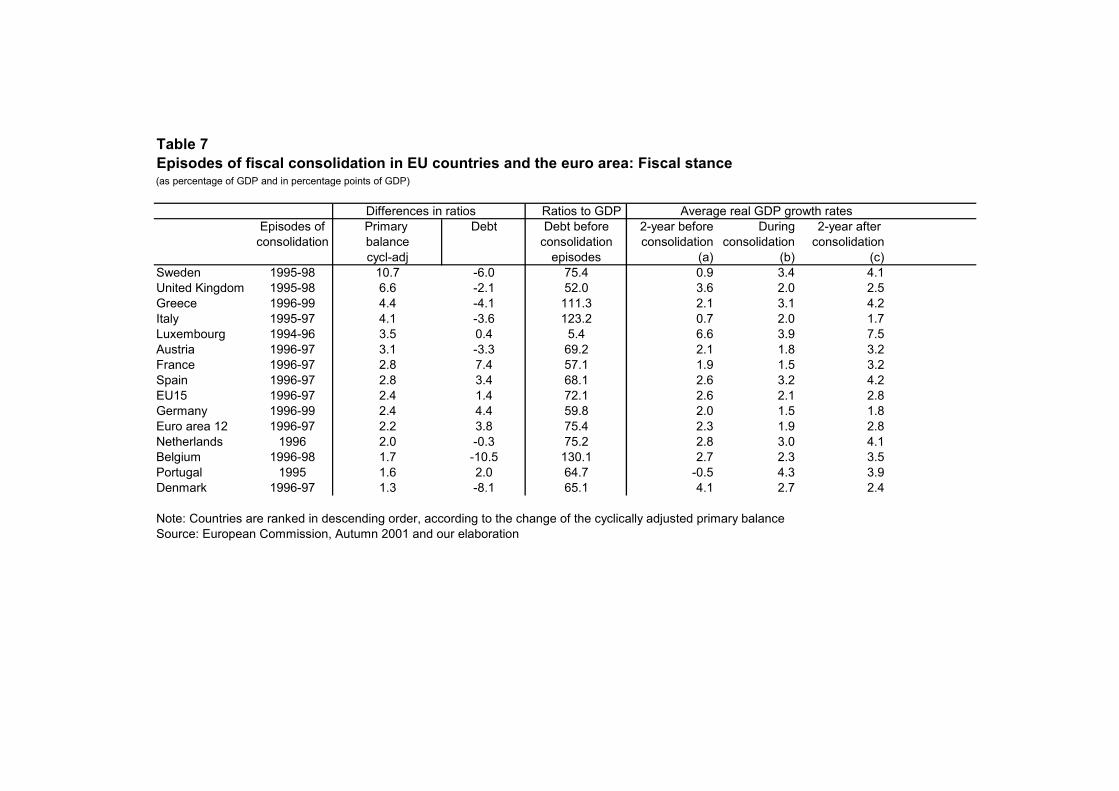
Table 8Episodes of fiscal consolidation in EU countries and the euro area: Underlying factors(as percentage of GDP and in percentage points of GDP)
(a) Cyclically adjusted primary expenditure Differences in ratios Ratios to GDP
Episode of Primary Primary Primary expend. Debtconsolidation expenditure balance before before
Note: Countries are ranked in descending order, according to the change of the cyclically adjusted total revenueSource: European Commission, Autumn 2001 and our elaboration
Deviation of average growth rate in the 2-year period after consolidation compared with
the consolidation period
Deviation of average growth rate in the 2-year period after consolidation compared with
the consolidation period
Source: European Commission, Autumn 2001 and our elaboration.
Chart 1: Debt ratio and budget balance, in 1991(as a percentage of GDP)
Source: European Commission, Autumn 2001 and our elaboration. Note: Countries are ranked in descending order according to the size of their debt ratio in 1991. Data excludes proceeds from the sale of UMTS licenses.
Chart 2: Changes in general government budget balance(as a percentage to GDP)
-10
-5
0
5
10
15Ita
ly
Gre
ece
Belg
ium
Portu
gal
Spai
n
Euro
are
a 12
EU15
Uni
ted
King
dom
Aust
ria
Ger
man
y
Irela
nd
Net
herla
nds
Fran
ce
Den
mar
k
Finl
and
Swed
en
Luxe
mbo
urg
1992-2001 1992-1995 1996-97 1998-2001
Source: European Commission, Autumn 2001 and our elaboration. Note: Countries are ranked in descending order according to the size of their budget deficit in 1991. Data excludes proceeds from the sale of UMTS licenses.
Chart 3: Changes in general government debt ratio (as a percentage to GDP)
-60
-50
-40
-30
-20
-10
0
10
20
30
40Be
lgiu
m
Italy
Irela
nd
Gre
ece
Net
herla
nds
Portu
gal
Den
mar
k
Euro
are
a 12
Aust
ria
EU15
Swed
en
Spai
n
Ger
man
y
Fran
ce
Uni
ted
King
dom
Finl
and
Luxe
mbo
urg
1992-2001 1992-1995 1996-97 1998-2001
Source: European Commission, Autumn 2001 and our elaboration. Note: Countries are ranked in ascending order, according to the size of their cyclically adjusted revenue ratio in 1991. Data excludes proceeds from the sale of UMTS licenses.
Chart 4: Changes in general government cyclically adjusted primary budget balance(as a percentage to GDP)
-5
0
5
10Ita
ly
Gre
ece
Belg
ium
Portu
gal
Spai
n
Euro
are
a 12
EU15
Uni
ted
King
dom
Aust
ria
Ger
man
y
Irela
nd
Net
herla
nds
Fran
ce
Den
mar
k
Finl
and
Swed
en
Luxe
mbo
urg
1992-2001 1992-1995 1996-97 1998-2001
Source: European Commission, Autumn 2001 and our elaboration. Note: Countries are ranked in descending order according to the size of their structural primary expenditure ratio in 1991. Data excludes proceeds from the sale of UMTS licenses.
Chart 5: Changes in general government cyclically adjusted total revenue(as a percentage to GDP)
-10
-5
0
5
10
15G
reec
e
Portu
gal
Spai
n
Irela
nd
Uni
ted
King
dom
Ger
man
y
Italy
Euro
are
a 12
EU15
Belg
ium
Luxe
mbo
urg
Fran
ce
Aust
ria
Net
herla
nds
Den
mar
k
Finl
and
Swed
en
1992-2001 1992-1995 1996-97 1998-2001
Source: European Commission, Autumn 2001 and our elaboration. Note: Countries are ranked in descending order according to their expenditure ratio in 1991. Data excludes proceeds from the sale of UMTS licenses.
Chart 6: Changes in general government cyclically adjusted primary total expenditure(as a percentage to GDP)
-10
-8
-6
-4
-2
0
2
4
6
8
10
Swed
en
Finl
and
Den
mar
k
Aust
ria
Net
herla
nds
Fran
ce
Luxe
mbo
urg
Euro
are
a 12
EU15
Ger
man
y
Italy
Belg
ium
Uni
ted
King
dom
Spai
n
Irela
nd
Gre
ece
Portu
gal
1992-2001 1992-1995 1996-97 1998-2001
Source: European Commission, Autumn 2001 and our elaboration. Note: Countries are ranked in descending order according to their capital expenditure ratio in 1991. Data excludes proceeds from the sale of UMTS licenses.
Chart 7: Changes in general government capital expenditure(as a percentage to GDP)
-6
-3
0
3
6Fi
nlan
d
Aust
ria
Luxe
mbo
urg
Spai
n
Fran
ce
Ger
man
y
Gre
ece
Italy
Uni
ted
King
dom
Euro
are
a 12
EU15
Irela
nd
Net
herla
nds
Portu
gal
Swed
en
Den
mar
k
Belg
ium
1992-2001 1992-1995 1996-97 1998-2001
Denmark
1991
2001
Belgium
1991
2001
Germany
1991
2001
Greece
1991
2001
France
1991
2001
Spain
1991
2001
Chart 8: Composition of budget expenditure (as percentage of the total expenditure)
Interest expenditure
Primary current expenditure
Capital expenditure
Ireland
1991
2001
Italy
1991
2001
Luxembourg
1991
2001
Netherlands
1991
2001
Austria
1991
2001
Finland
1991
2001
Interest expenditure
Primary current expenditure
Capital expenditure
Portugal
1991
2001
United Kingdom
1991
2001
EU12
1991
2001
EU15
1991
2001
Interest expenditure
Primary current expenditure
Capital expenditure
Sweden
1991
2001
Source: European Commission, Autumn 2001 and our elaboration.
Source: European Commission, Autumn 2001 and our elaboration. Note: (+) Values on the positive side of the quadrant indicate a tightening of the fiscal stance and vice versa.
Chart 9a: Budget adjustments 1992-1995 (cyclically adjusted ratios to GDP)
Source: European Commission, Autumn 2001 and our elaboration. Note: (+) Values on the positive side of the quadrant indicate a tightening of the fiscal stance and vice versa.
Chart 9c: Budget adjustments 1998-2001(cyclically adjusted ratios to GDP)
Source: European Commission, Autumn 2001 and our elaboration. Note: Changes of cyclically adjusted variables refer to relevant episodes of fiscal consolidation in the run-up to EMU. Growth deviation is the deviation of the average growth rate in the 2-year period after consolidation compared with the consolidation period.
Chart 12a: Changes in cyclically adjusted primary expenditure and growth deviation(as percentage points of GDP)
-1.0
0.0
1.0
2.0
3.0
4.0
-10.0 -8.0 -6.0 -4.0 -2.0 0.0 2.0 4.0
Primary expenditure
Gro
wth
dev
iatio
n
LU
UKSE
FR
ATBE GRNL
ESEU12
EU15
PT
DE
ITDK
Chart 12b: Changes in cyclically adjusted revenue and growth deviation(as percentage changes)