City of AuroraItem #: SS: 1st: 2nd: 3a 2/24/14 Council Agenda CommentaryItem Title: City County Feasibility Study Item Initiator:Lawson, Michael - Fin/Budget Prog Administrator - Finance Staff Source:Wolfe, Michelle - Deputy City Manager - General Management City Manager/Deputy City Manager Signature: Skip Noe Outside Speaker: Julie Herlands, TischlerBise, 301-320-6900Council Goal: 2012: 6.0--Provide a well-managed and financially strong City ACTIONS(S) PROPOSED(Check all appropriate actions) Approve Item as proposed at Study SessionApprove Item wi th Waiver of Recons iderationApprove Item and Move Forward to Regular MeetingApprove Item as proposed at Regular MeetingInformation OnlyPREVIOUS ACTIONS OR REVIEWS: Policy Committee Name: Public and Intergovernmental Relations Policy Committee Meeting Date: Minutes AttachedMinutes Not AvailableActions Taken: Recommends Do Not RecommendForwarded without RecommendationRecommendation Report AttachedHISTORY(Dates reviewed by City coun cil, Policy Comm ittees, Boards and Comm issions, or Staff. Summarize pertinent com ment s. ATTACH MINUTES OF COUNCIL MEETINGS, POLICY COMMITTEES AND BOA RDS AND COMMISSIONS.) Staff has provided regular monthly updates on this report to the Public and Intergovernmental Relations Policy Committee since the October 21, 2013 special study session. ITEM SUMMARY(Brief description of item, disc ussion, key po ints, recomm endations, etc.) This report is the culmination of an initial phase of study on the potential formation of a City-County of Aurora. The Ci ty retained the servi ces of TischlerBi se and its sub-consultants to study the feasibil ity of such a formation with an emphasis on the fiscal impacts. The study is primarily a fiscal impact analysis that estimates costs to provide county services and related facilities as well as estimates the revenue implications of the formation. The fiscal feasibility study identifies a baseline starting point for operating and capital costs using Arapahoe and Adams Counties as the foundation. The study does not at this time identi fy efficiencies in service provision, efficiencies in facility use, or policy decisions that may result in cost savings. It does reflect maximum potential costs for county services and facilities to serve a City-County of Aurora. Furthermore, the study provides projections for 20 years of future growth, which can be viewed as a relatively short amount of time given that forming a City-County of Aurora has lasting implications for many future generations beyond an initial 20-year period. Finally, the study assumes an equalized county
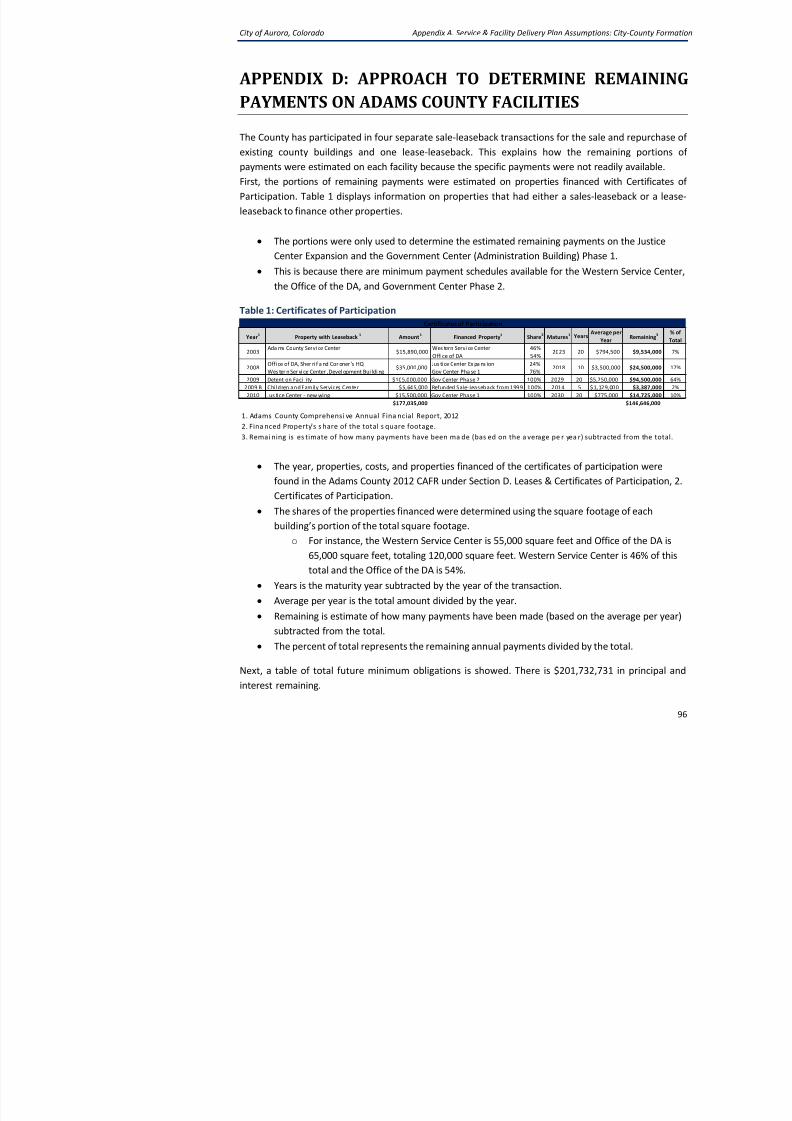
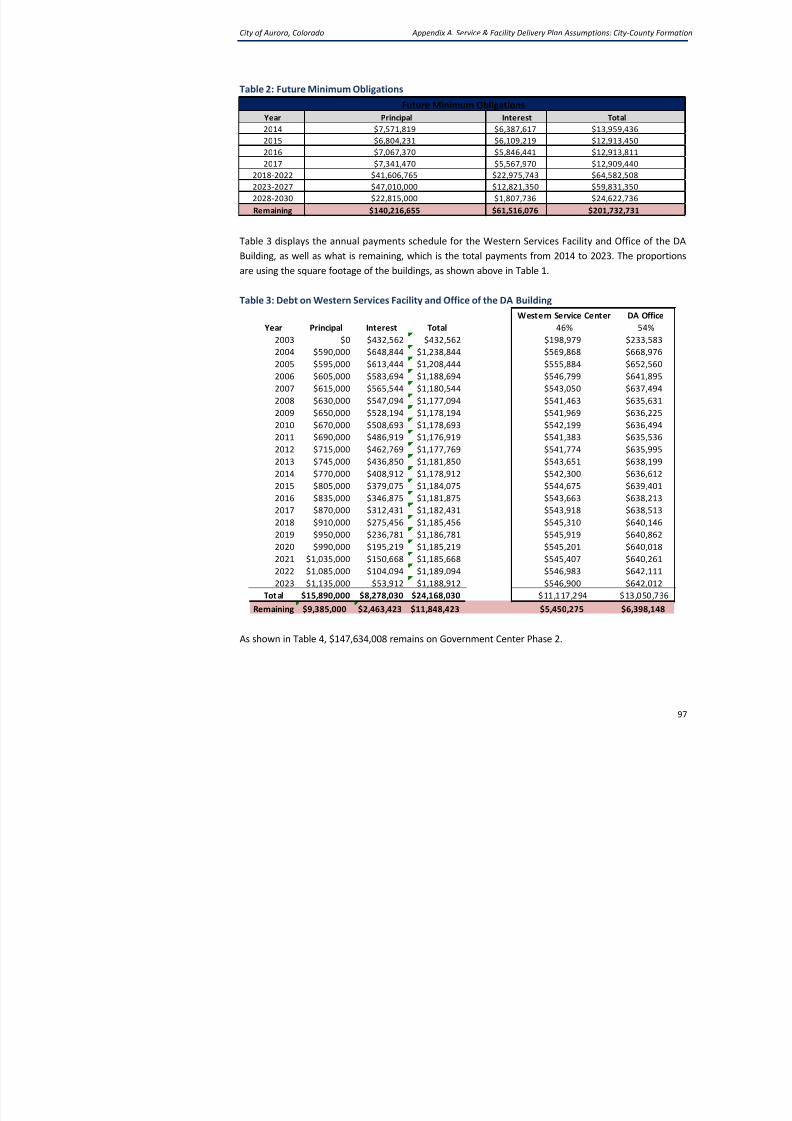
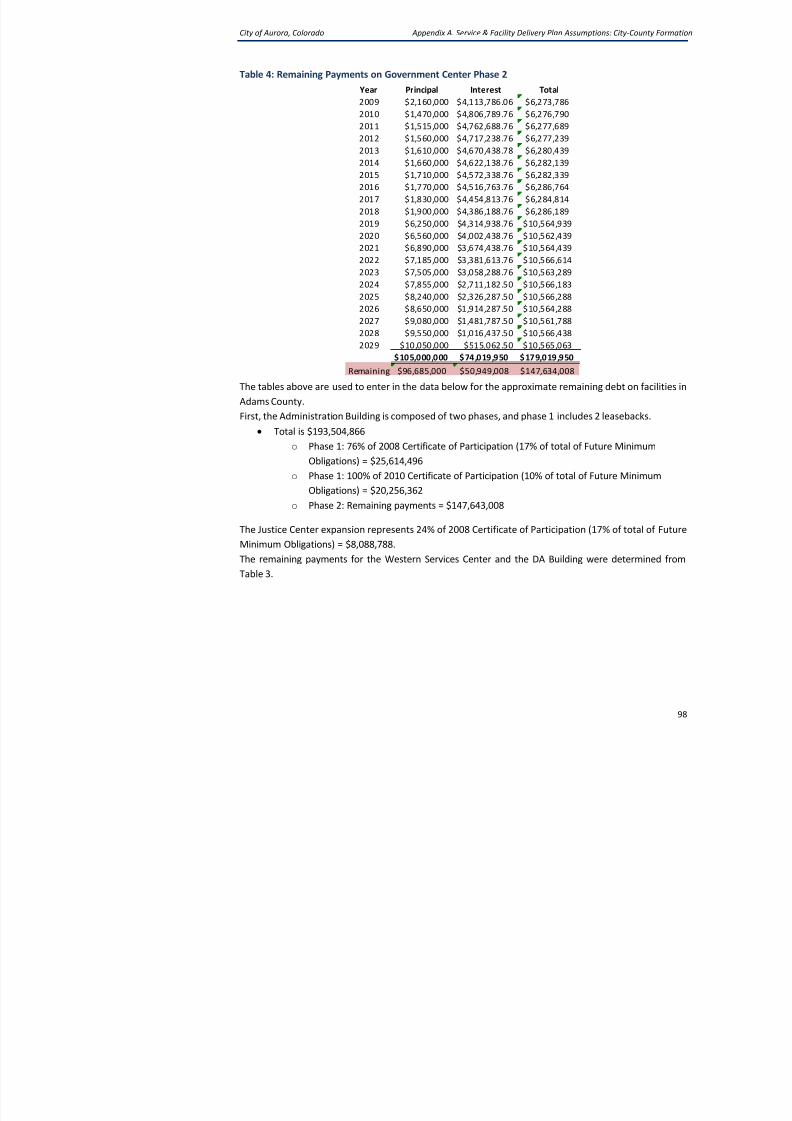
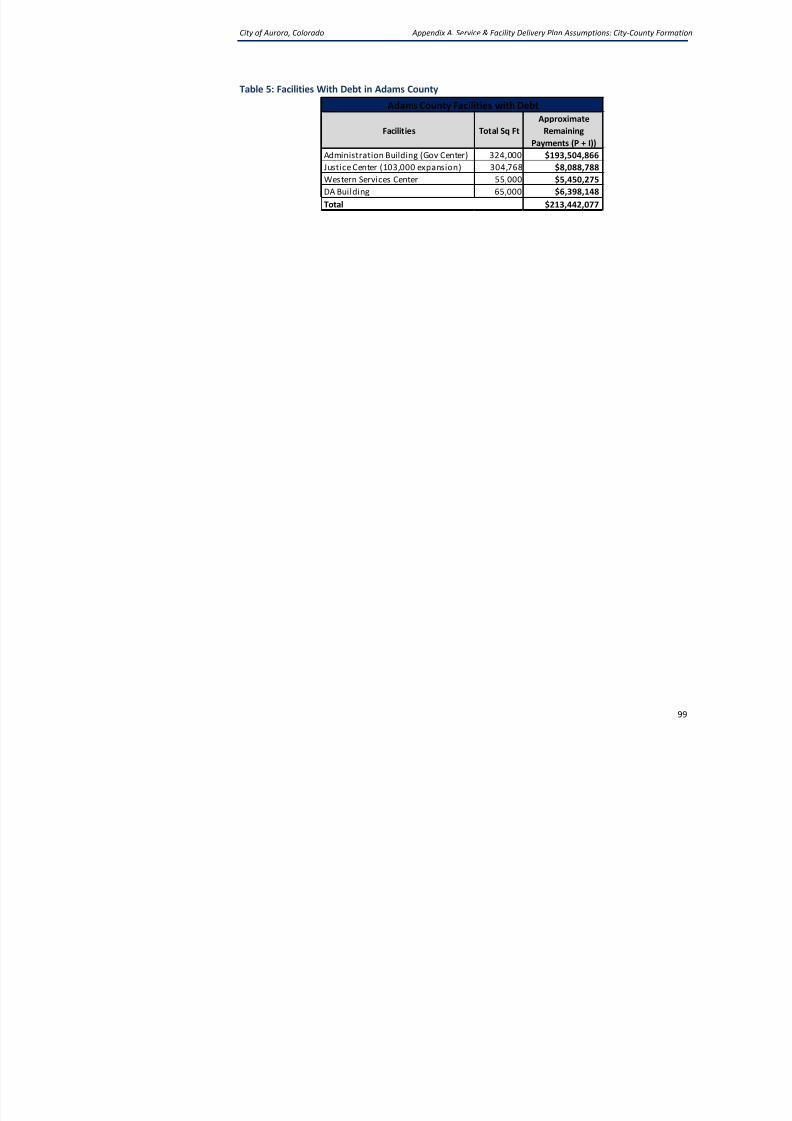
Transcript
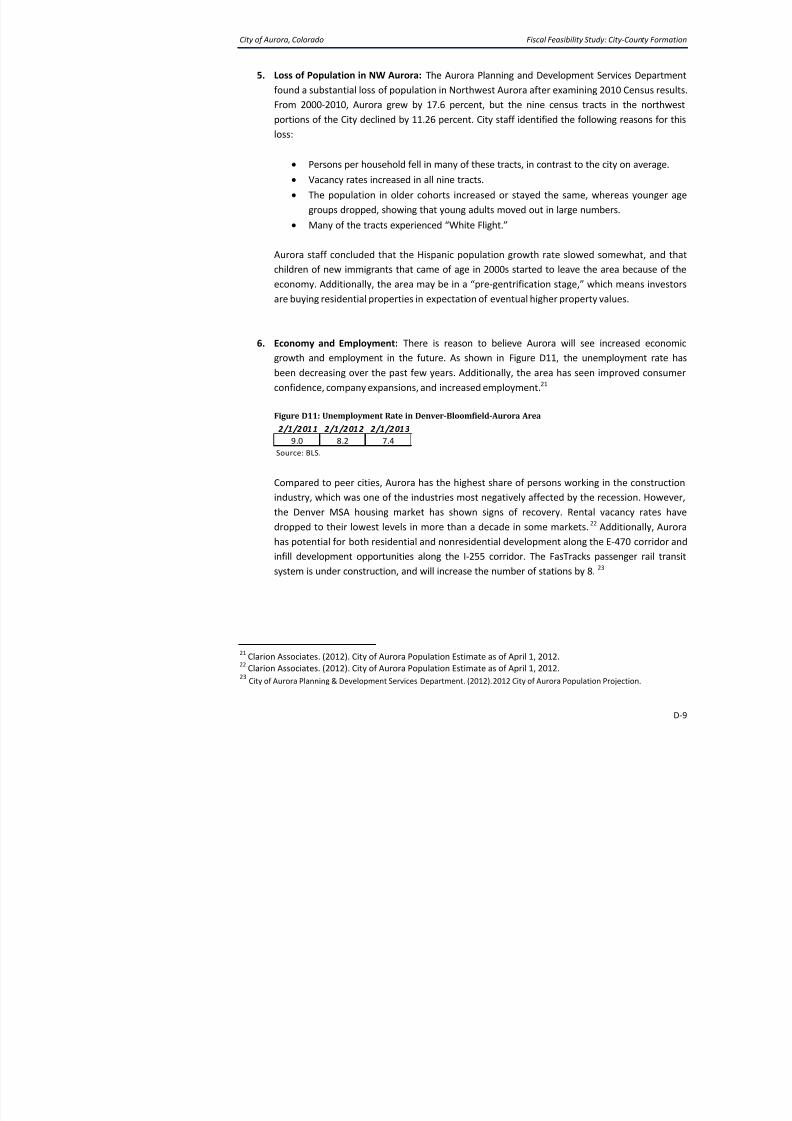
8/12/2019 Fiscal Feasibility Study: Formation of City-County of Aurora
Council Goal: 2012: 6.0--Provide a well-managed and financially strong City
ACTIONS(S) PROPOSED (Check al l appropr iate act ions)
Approve Item as proposed at Study Session Approve Item with Waiver of Rec
Approve Item and Move Forward to Regular Meeting
Approve Item as proposed at Regular Meeting Information Only
PREVIOUS ACTIONS OR REVIEWS:
PolicyCommittee
Name: Public and Intergovernmental Relations Policy Committee
Meeting Date: Minutes Attached Minutes Not Available
Actions Taken: Recommends Do Not Recommend Forwarded without Reco
Recommendation Repo
HISTORY (Dates reviewed by City coun ci l , Pol icy Comm ittees, Boards and Comm issions, or Staff . Sum
comment s. ATTACH MINUTES OF COUNCIL MEETINGS, POLICY COMMITTEES AND BOARDS AND COMM
Staff has provided regular monthly updates on this report to the Public and Intergovernmen
Policy Committee since the October 21, 2013 special study session.
ITEM SUMMARY (Br ief descr ipt ion of i tem, disc ussion, key po ints, recomm endat ions, etc.)
This report is the culmination of an initial phase of study on the potential formation of a City Aurora. The City retained the services of TischlerBise and its sub-consultants to study the fsuch a formation with an emphasis on the fiscal impacts. The study is primarily a fiscal impathat estimates costs to provide county services and related facilities as well as estimates th
8/12/2019 Fiscal Feasibility Study: Formation of City-County of Aurora
City of Aurora, Colorado Fiscal Feasibility Study: City-
This report is provided to the City of Aurora, Colorado, as part of the TischlerBise Twork scope for a Feasibility Study for Formation of City and County of Aurora.
Public Release
TischlerBise
4701 Sangamore Road
Suite S240
Bethesda, Maryland 20816
800.424.4318
www.tischlerbise.com
8/12/2019 Fiscal Feasibility Study: Formation of City-County of Aurora
City of Aurora, Colorado Fiscal Feasibility Study: City-
Contents
EXECUTIVE SUMMARY ...................................................................................................Approaches and Major Assumptions ..........................................................................
Appendix A. Service and Facility Delivery Plan Assumptions ............................................
Appendix B. Revenue Projection Approach ......................................................................General Fund Revenue ................................................................................................
Special Revenue Funds ...............................................................................................
Appendix C. Feasibility Study Parameters ........................................................................
Statement of General Assumptions ............................................................................
Key Parameters from Direction Provided by City Council ..........................................
Appendix D: Demographic and Land Use Projection Memo .............................................
City of Aurora, Colorado Fiscal Feasibility Study: City-
Figure 31. Cumulative (20-Year Total) Capital Expenditures ...................................................
Figure 32. County Outstanding Debt Service: Aurora Share of Average Annual Payments ....
Figure 33. Base Year Operating Revenues ...............................................................................Figure 34. Base Year Capital Revenues ....................................................................................
Figure 36. Cumulative (20-Year Total) Capital Revenues .........................................................
Figure 37. Aurora Assessed Values (Tax Year 2012): Citywide and by County (Aurora Portio
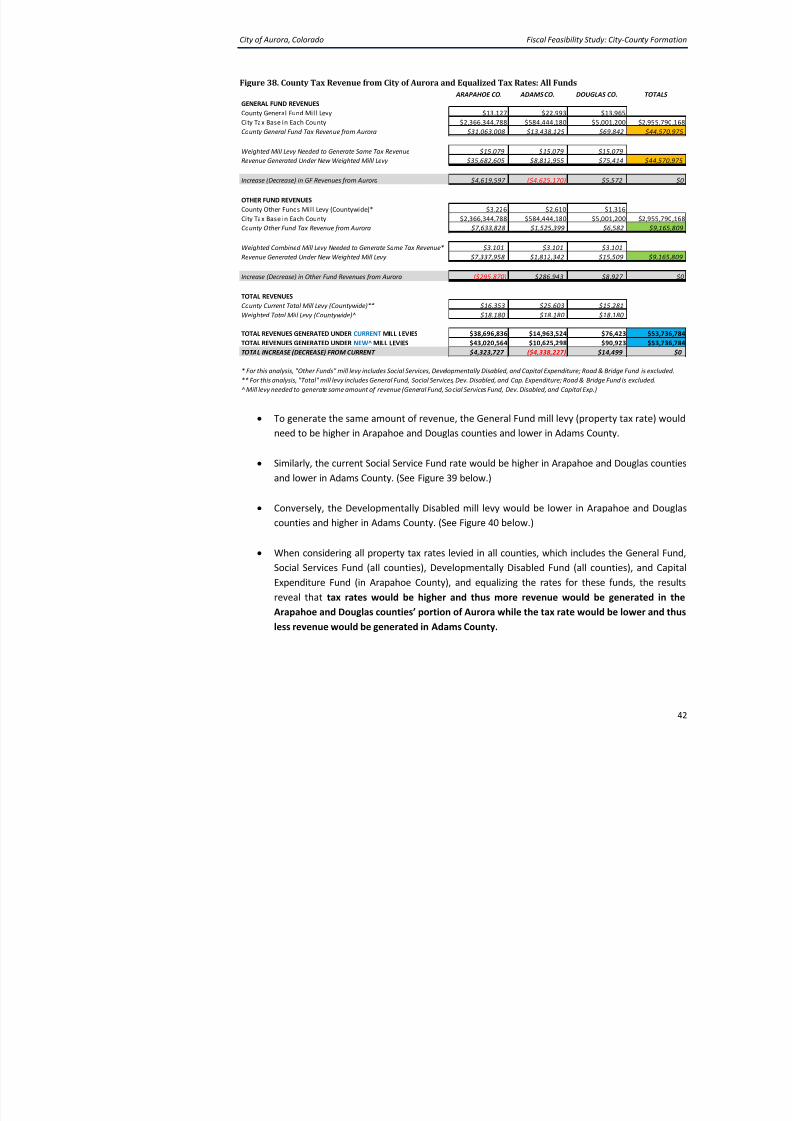
Figure 38. County Tax Revenue from City of Aurora and Equalized Tax Rates: All Funds .......
Figure 39. County Tax Revenue from City of Aurora and Equalized Tax Rates: Social Service
Figure 40. County Tax Revenue from City of Aurora and Equalized Tax Rates: DevelopmeFund ..........................................................................................................................................
Figure 41. Scenario A: Aurora Average Assessed Values per Person and Job (Tax Year 2012
by County (Aurora Portion) ......................................................................................................
Figure 42. Scenario B: Aurora Average Market and Assessed Values by Type of Property.....
Figure 43. Base Year General Fund Revenues .........................................................................
Figure 44. Base Year Social Services Fund Revenues ...............................................................
Figure 45. Base Year Community Resources (in Special Funds) Revenues ..............................Figure 46. Summary of Fiscal Feasibility Results ......................................................................
Figure 47. Summary of Fiscal Feasibility Results: Alternative Revenue Scenario ....................
Figure 48. Summary of Capital Facilities: Current and Growth-Related Needs .......................
8/12/2019 Fiscal Feasibility Study: Formation of City-County of Aurora
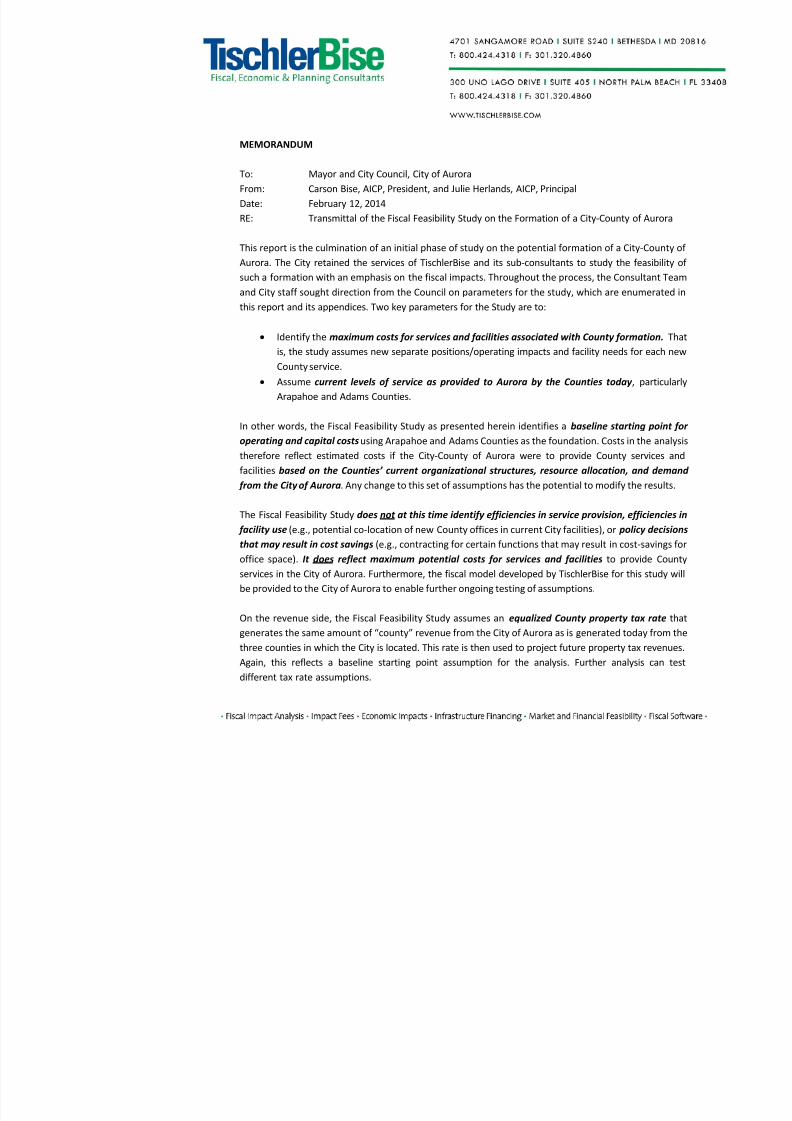
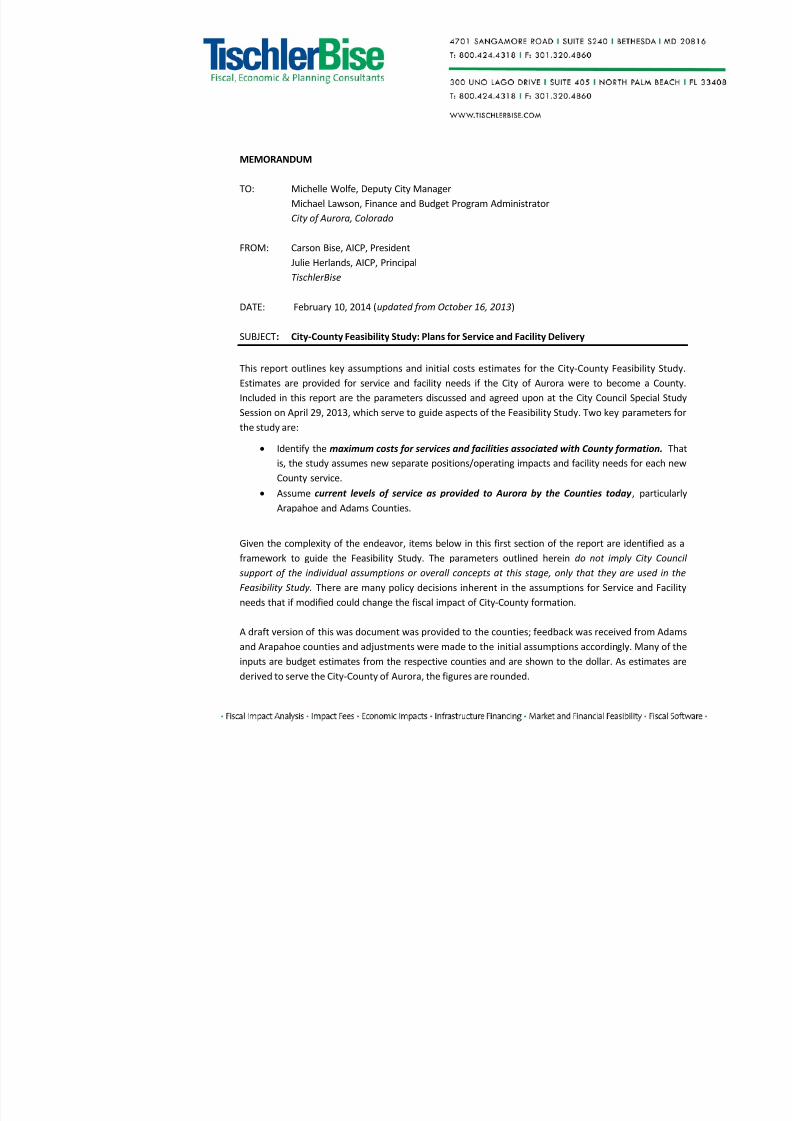
From: Carson Bise, AICP, President, and Julie Herlands, AICP, Principal
Date: February 12, 2014RE: Transmittal of the Fiscal Feasibility Study on the Formation of a City-Count
This report is the culmination of an initial phase of study on the potential formation of a
Aurora. The City retained the services of TischlerBise and its sub-consultants to study th
such a formation with an emphasis on the fiscal impacts. Throughout the process, the Co
and City staff sought direction from the Council on parameters for the study, which are e
this report and its appendices. Two key parameters for the Study are to:
• Identify the maximum costs for services and facilities associated with County fo
is, the study assumes new separate positions/operating impacts and facility need
County service.
• Assume current levels of service as provided to Aurora by the Counties toda
Arapahoe and Adams Counties.
In other words, the Fiscal Feasibility Study as presented herein identifies a baseline sta
operating and capital costs using Arapahoe and Adams Counties as the foundation. Costs
therefore reflect estimated costs if the City-County of Aurora were to provide County
facilities based on the Counties’ current organizational structures, resource allocation
from the City of Aurora. Any change to this set of assumptions has the potential to modify
The Fiscal Feasibility Study does not at this time identify efficiencies in service provision, facility use (e.g., potential co-location of new County offices in current City facilities), or p
that may result in cost savings (e.g., contracting for certain functions that may result in c
office space). It does reflect maximum potential costs for services and facilities to p
services in the City of Aurora. Furthermore, the fiscal model developed by TischlerBise for
b id d h i f bl f h i i f i
8/12/2019 Fiscal Feasibility Study: Formation of City-County of Aurora
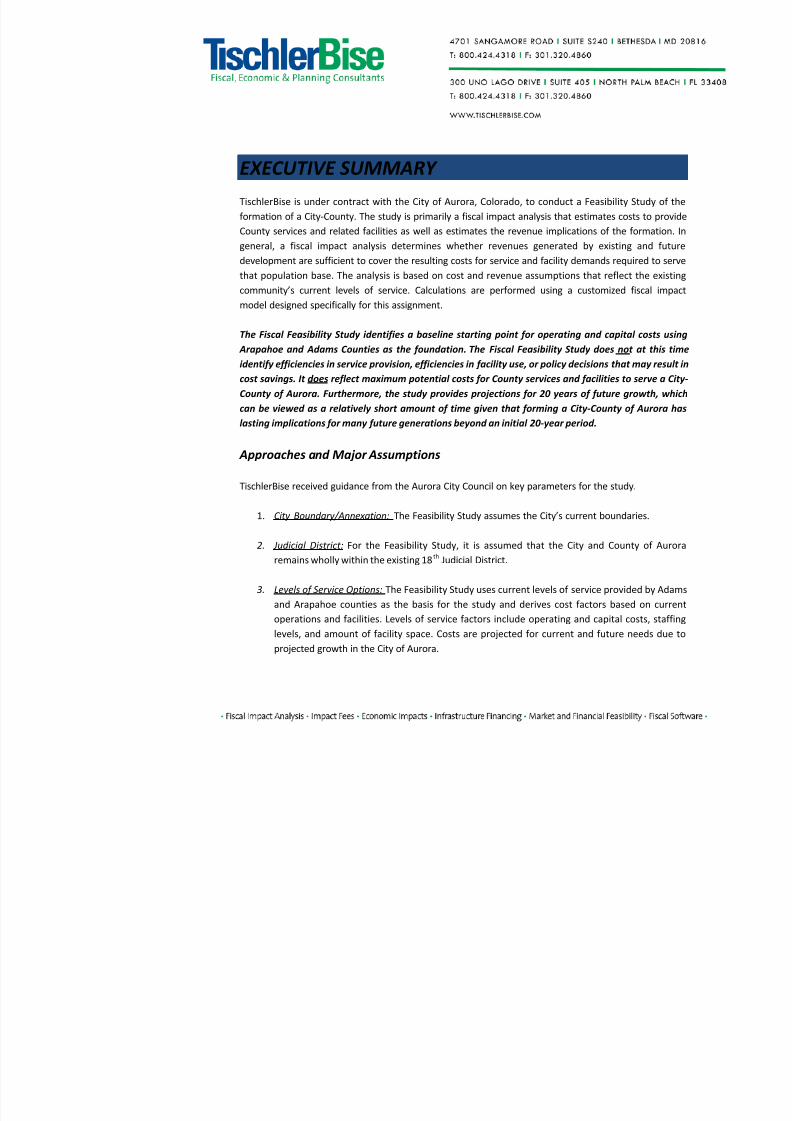
TischlerBise is under contract with the City of Aurora, Colorado, to conduct a Feasibilit
formation of a City-County. The study is primarily a fiscal impact analysis that estimates c
County services and related facilities as well as estimates the revenue implications of the
general, a fiscal impact analysis determines whether revenues generated by existin
development are sufficient to cover the resulting costs for service and facility demands req
that population base. The analysis is based on cost and revenue assumptions that refle
community’s current levels of service. Calculations are performed using a customized
model designed specifically for this assignment.
The Fiscal Feasibility Study identifies a baseline starting point for operating and capit
Arapahoe and Adams Counties as the foundation. The Fiscal Feasibility Study does no
identify efficiencies in service provision, efficiencies in facility use, or policy decisions tha
cost savings. It does reflect maximum potential costs for County services and facilities t
County of Aurora. Furthermore, the study provides projections for 20 years of future
can be viewed as a relatively short amount of time given that forming a City-County lasting implications for many future generations beyond an initial 20-year period.
Approaches and Major Assumptions
TischlerBise received guidance from the Aurora City Council on key parameters for the stu
1. City Boundary/Annexation: The Feasibility Study assumes the City’s current bound
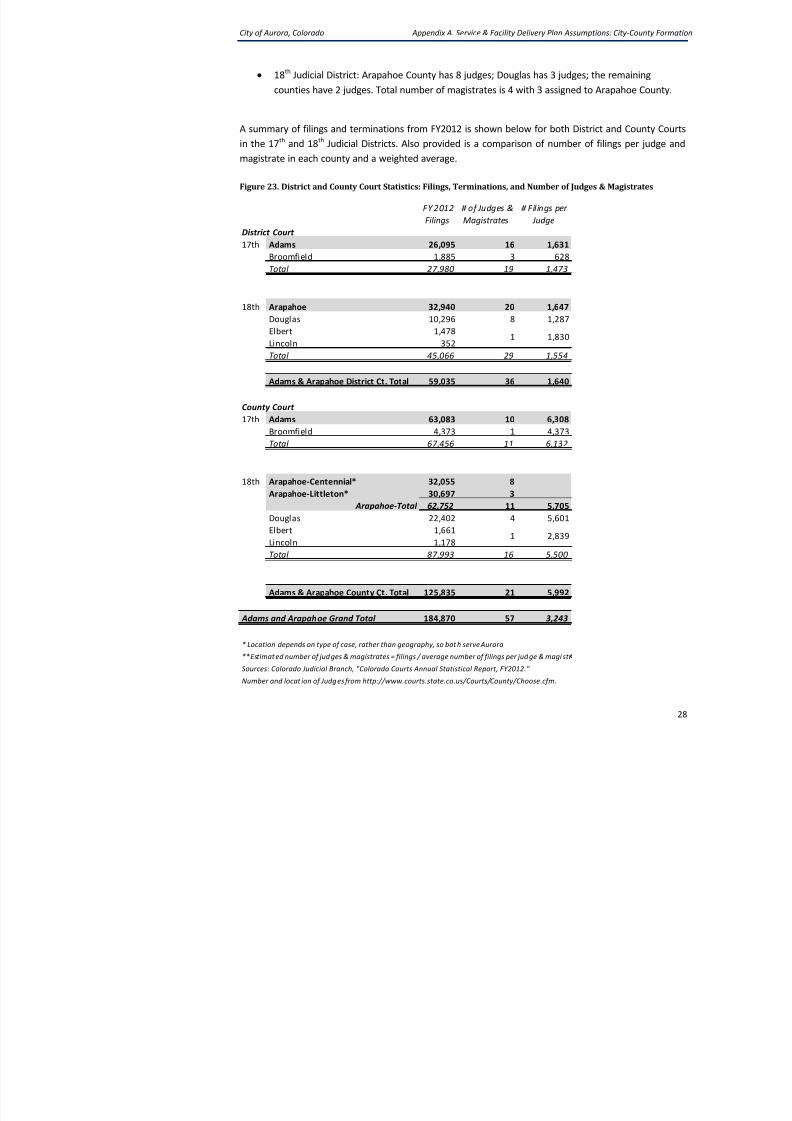
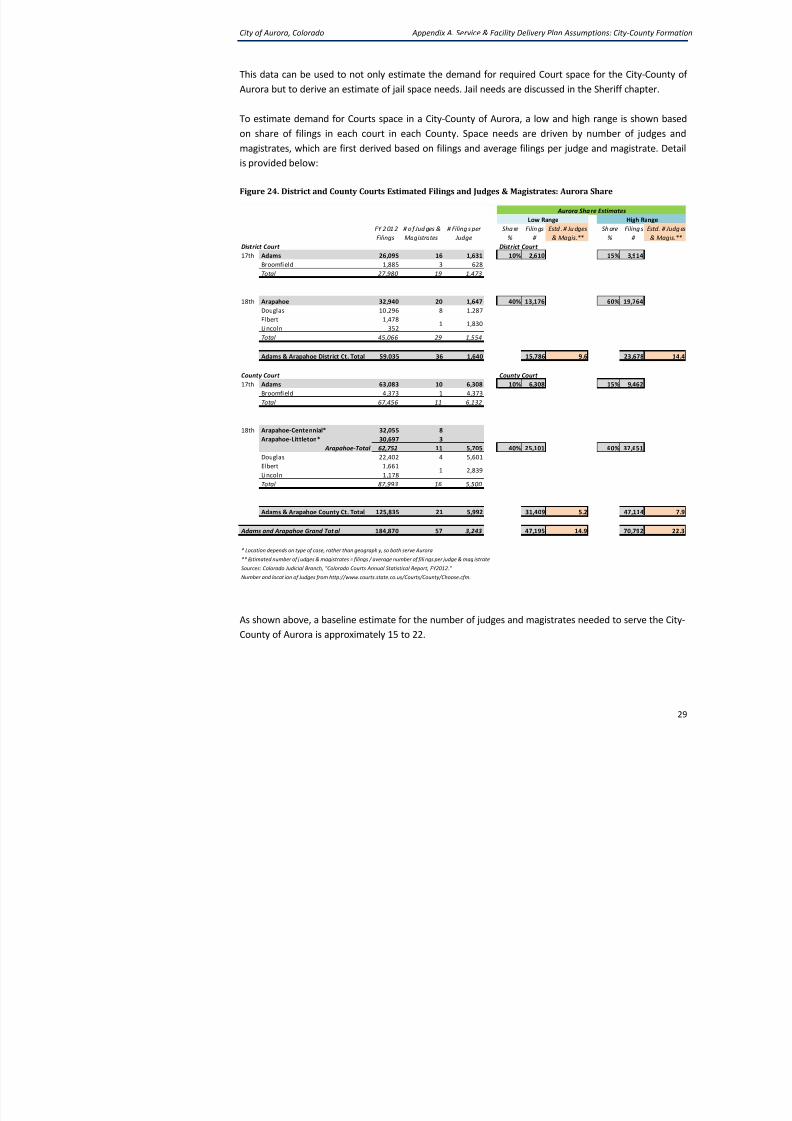
2. Judicial District: For the Feasibility Study, it is assumed that the City and Cou
remains wholly within the existing 18th Judicial District.
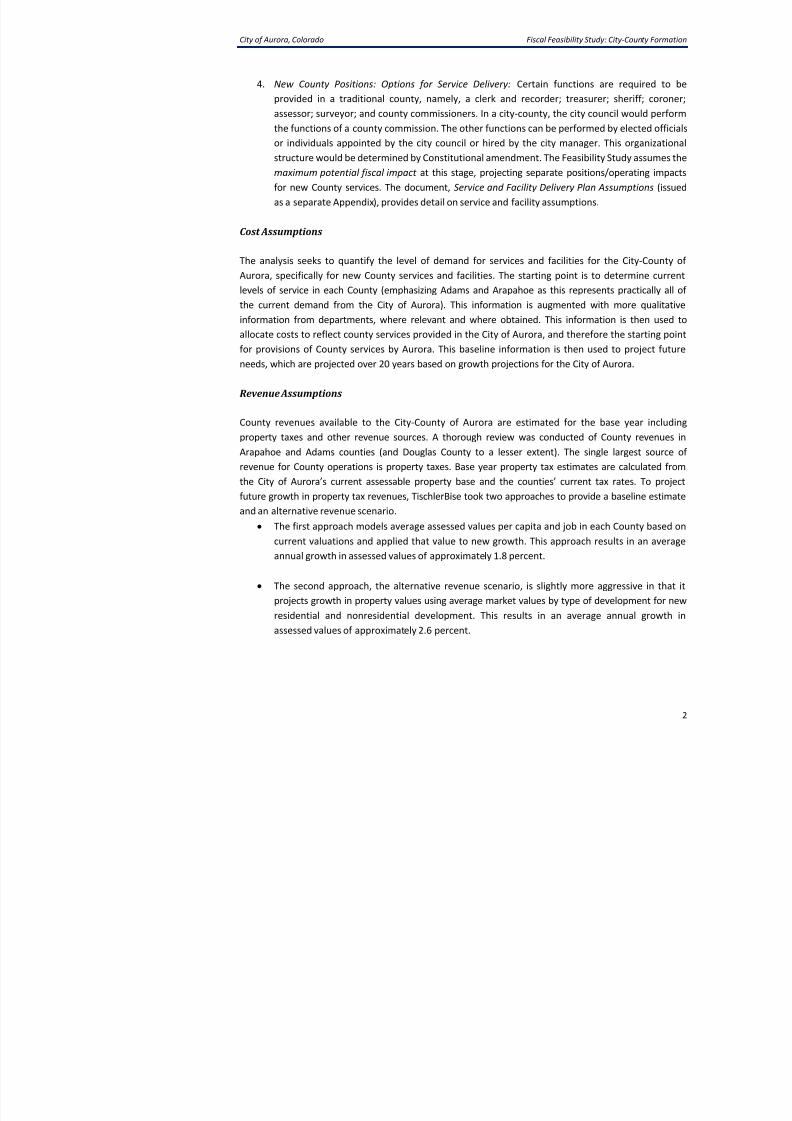
8/12/2019 Fiscal Feasibility Study: Formation of City-County of Aurora
City of Aurora, Colorado Fiscal Feasibility Study: City-
Inflation Assumption
The analysis does not assume any inflation throughout the projection period. Cost
projections are in constant 2013 dollars. This assumption is consistent with current bu
avoids the difficulty of forecasting as well as interpreting results expressed in inflated dolla
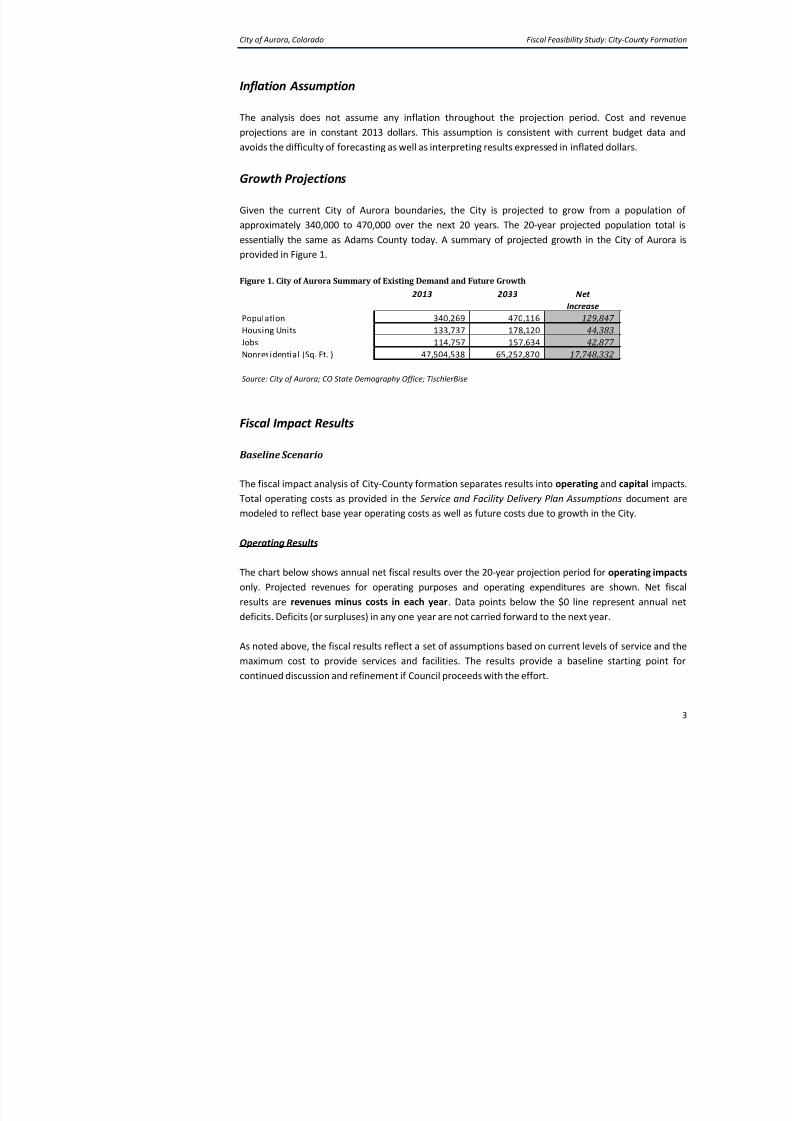
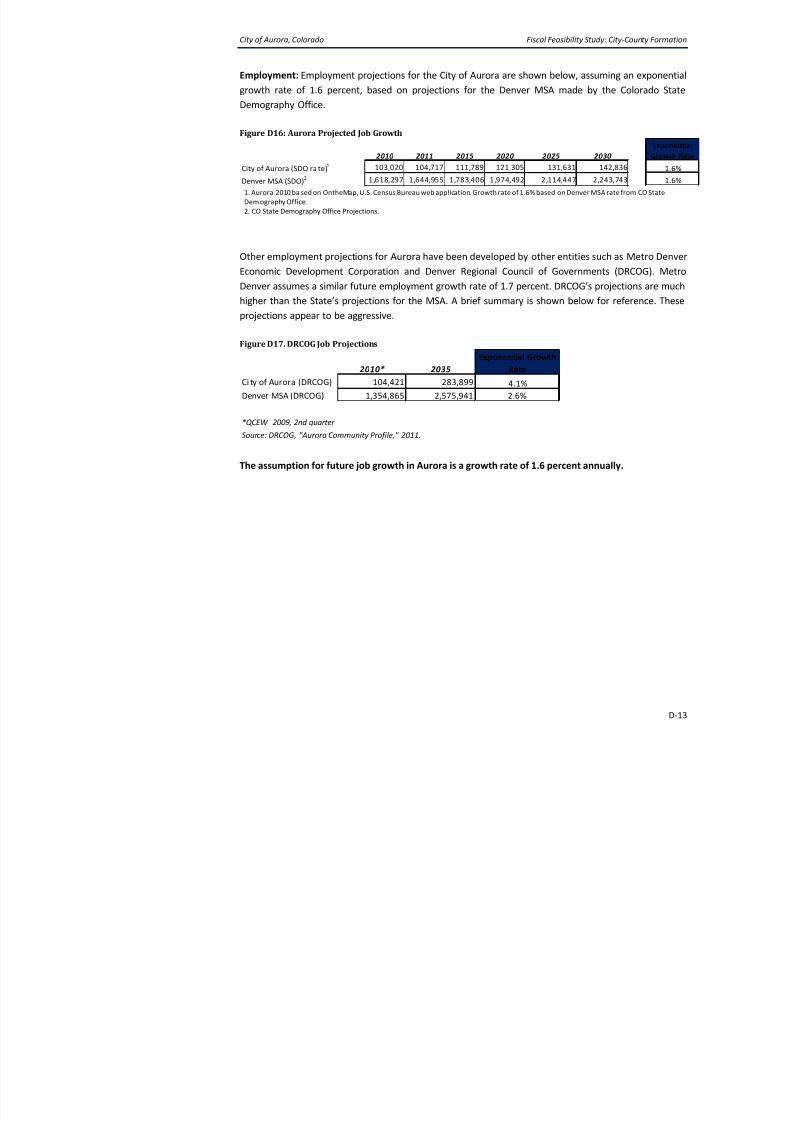
Growth Projections
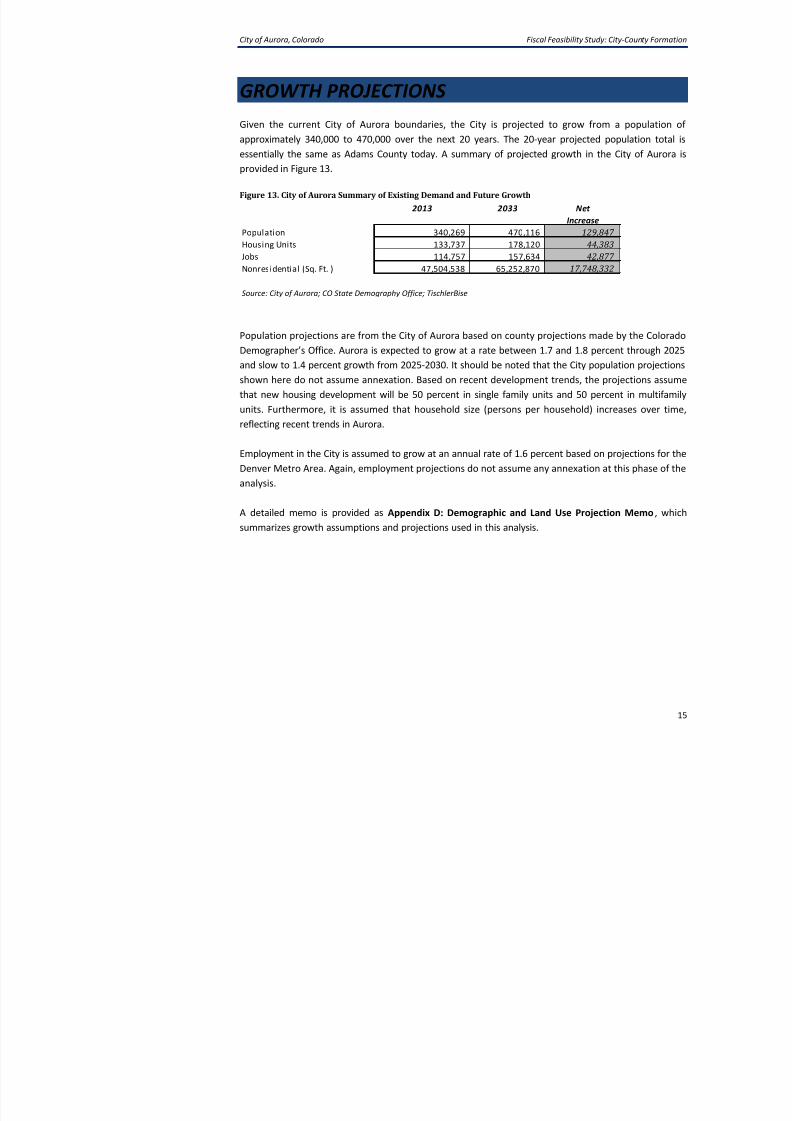
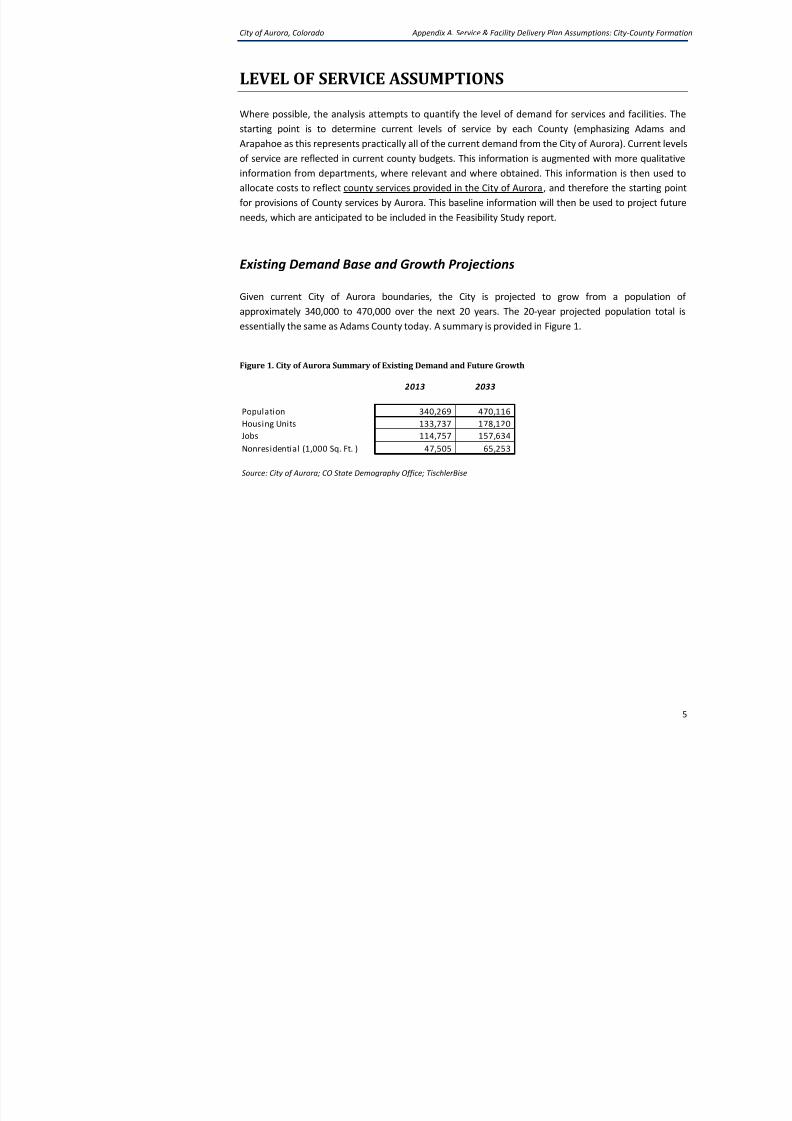
Given the current City of Aurora boundaries, the City is projected to grow from a approximately 340,000 to 470,000 over the next 20 years. The 20-year projected pop
essentially the same as Adams County today. A summary of projected growth in the Ci
provided in Figure 1.
Figure 1. City of Aurora Summary of Existing Demand and Future Growth
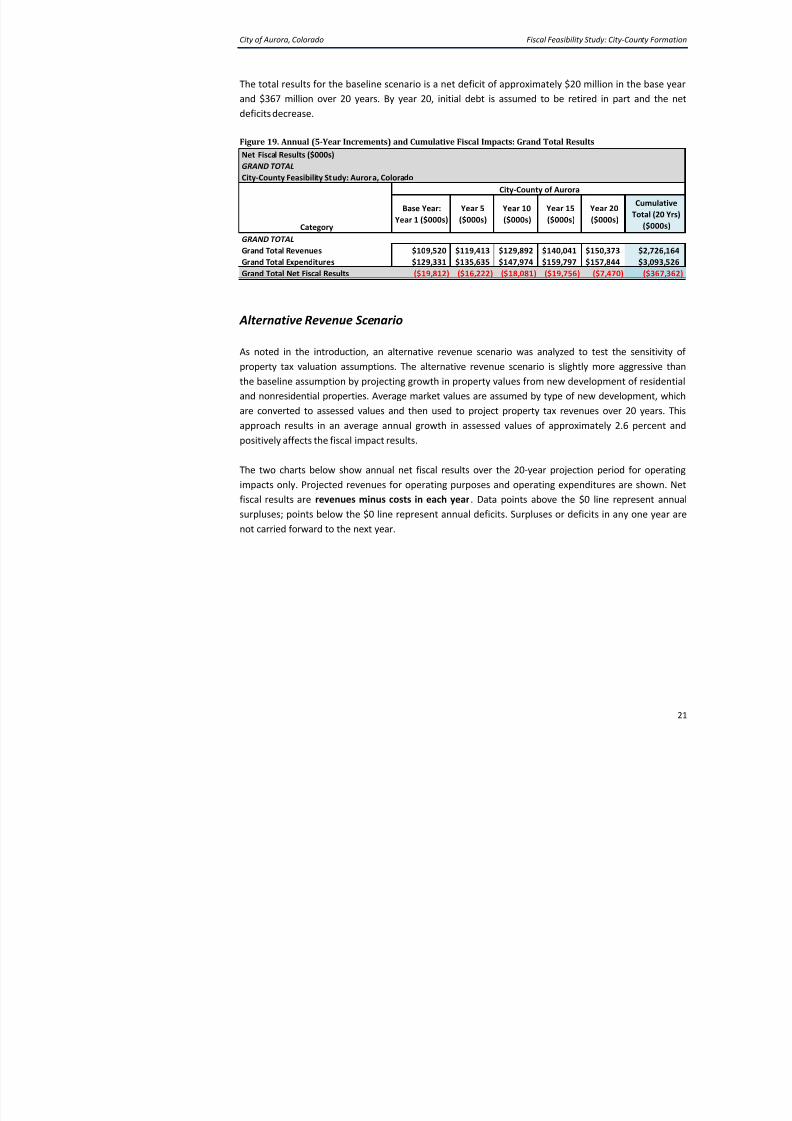
Fiscal Impact Results
Baseline Scenario
The fiscal impact analysis of City-County formation separates results into operating and c
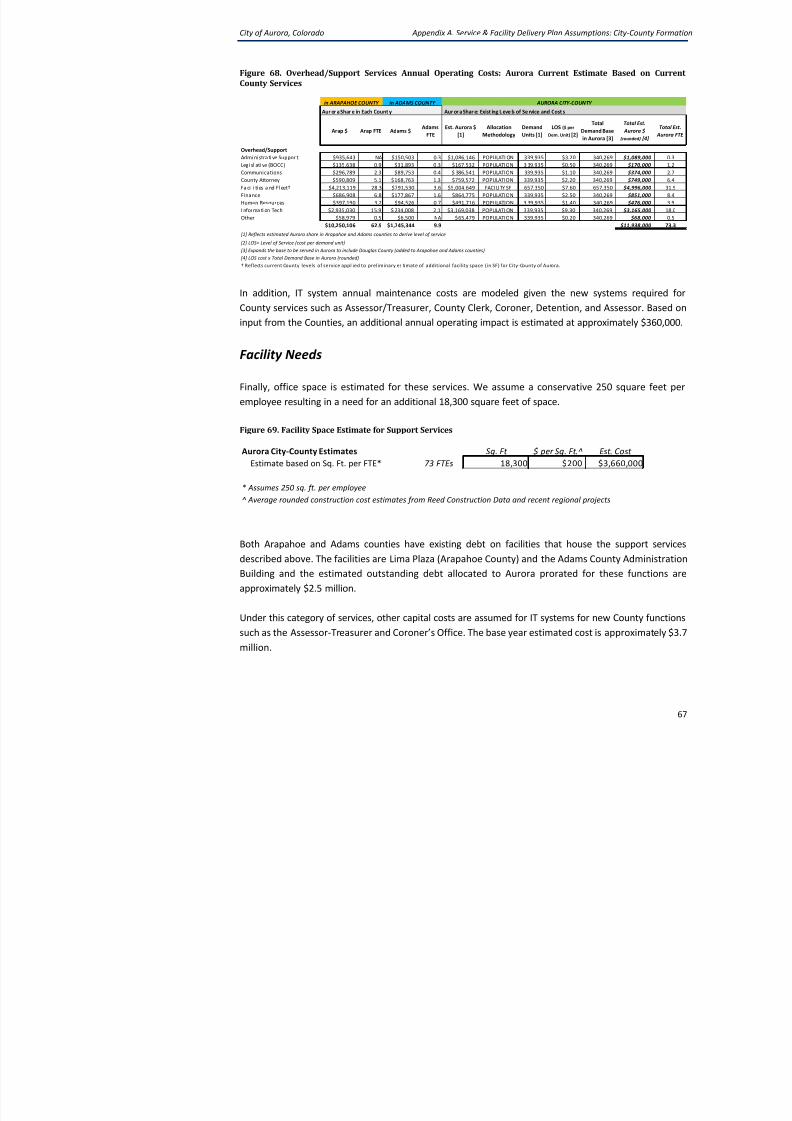
Total operating costs as provided in the Service and Facility Delivery Plan Assumptions
modeled to reflect base year operating costs as well as future costs due to growth in the C
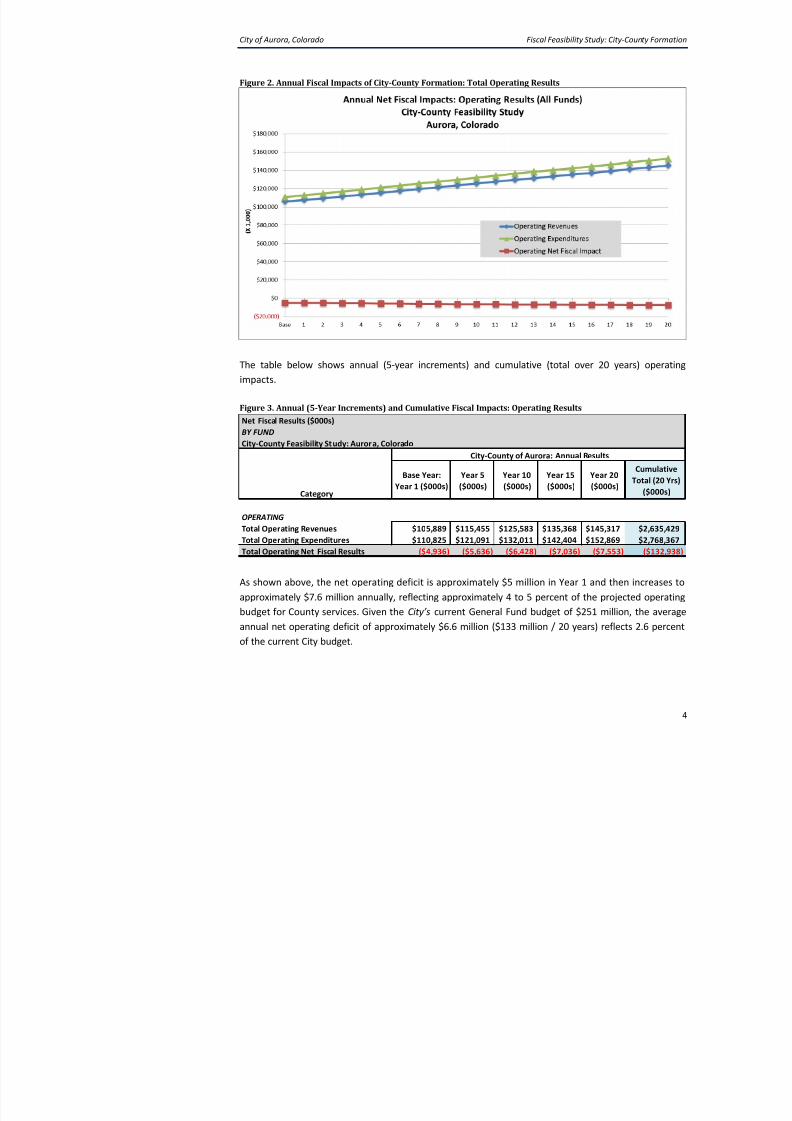
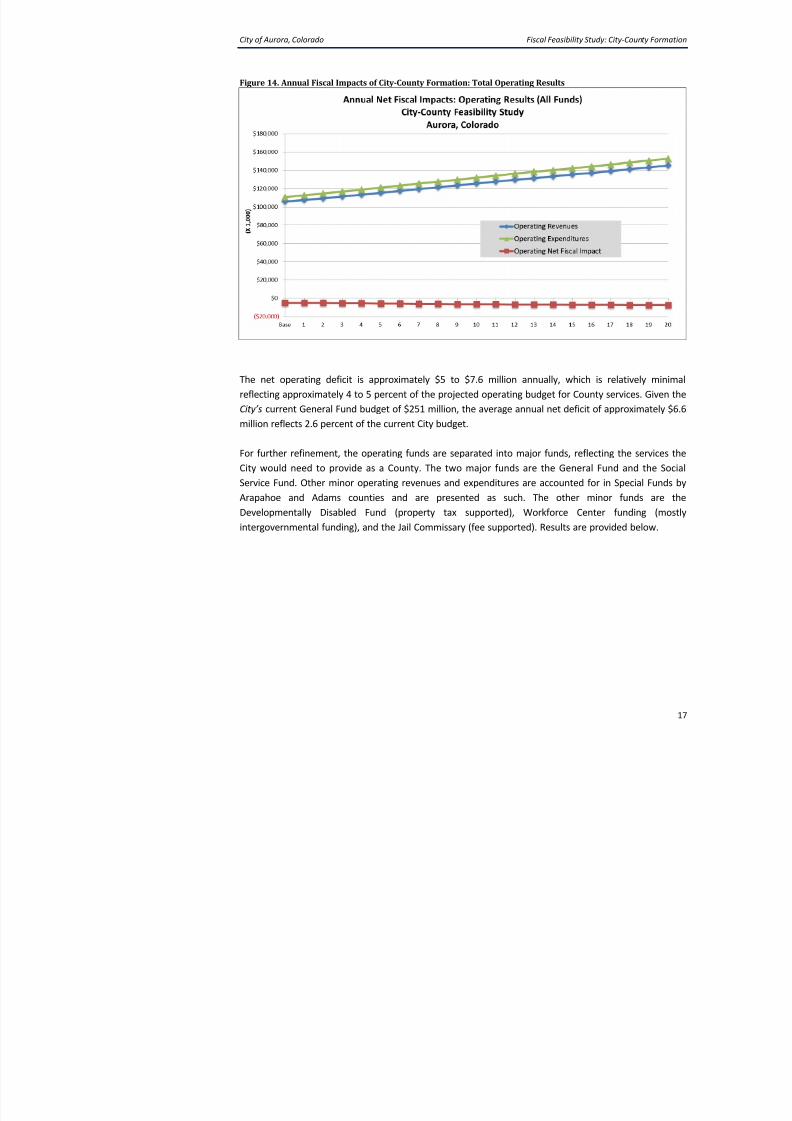
Operating Results
The chart below shows annual net fiscal results over the 20-year projection period for ope
l P j t d f ti d ti dit h
2013 2033 Net
Increase
Population 340,269 470,116 129,847
Housing Units 133,737 178,120 44,383
Jobs 114,757 157,634 42,877
Nonresidential (Sq. Ft. ) 47,504,538 65,252,870 17,748,332
Source: City of Aurora; CO State Demography Office; TischlerBise
8/12/2019 Fiscal Feasibility Study: Formation of City-County of Aurora
City of Aurora, Colorado Fiscal Feasibility Study: City-
For further detail, operating funds are separated into major funds, reflecting the services
need to provide as a County. The two major funds are the General Fund and the Socia
Other minor operating revenues and expenditures are accounted for in Special Funds by
Adams counties and are presented as such (Developmentally Disabled Fund (property t
Workforce Center funding (mostly intergovernmental funding), and the Jail Commissary (f
Results are provided below.
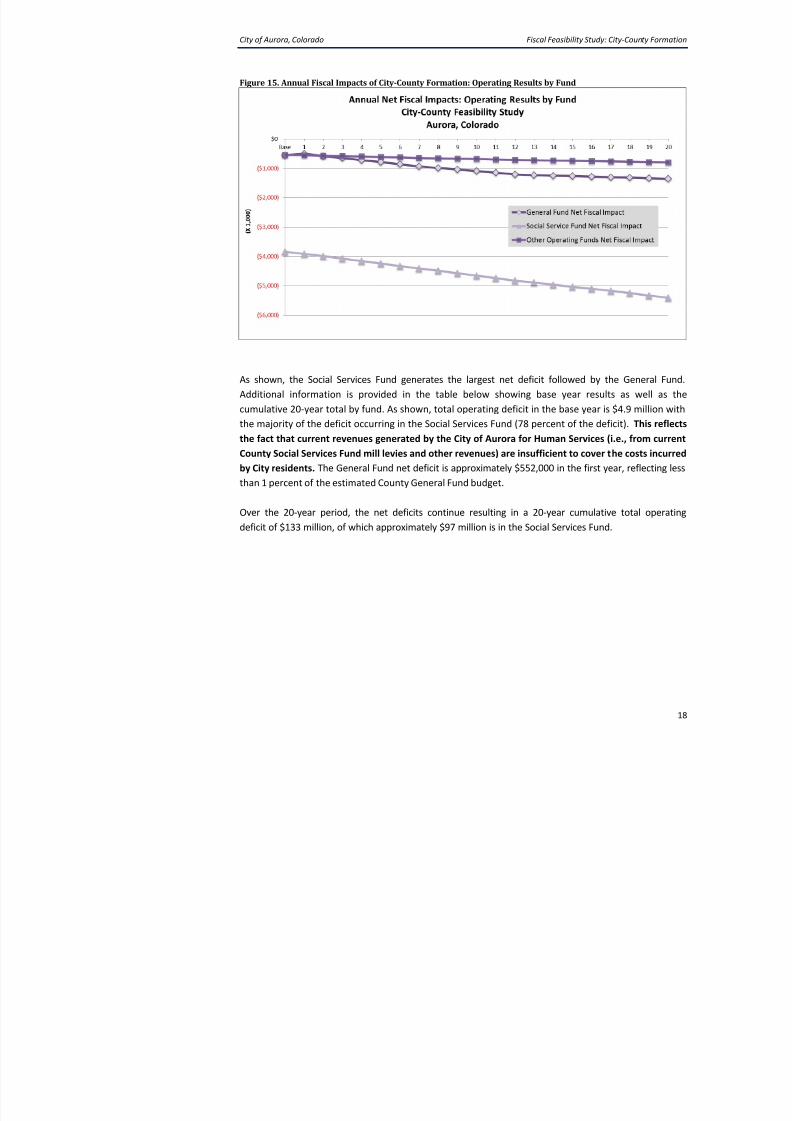
Figure 4. Annual Fiscal Impacts of City-County Formation: Operating Results by Fund
As shown, the Social Services Fund generates the largest net deficit. The total operating
base year is $4.9 million with the majority of the deficit occurring in the Social Services Fu
of the deficit). This reflects the fact that current revenues generated by the City of Auro
Services are insufficient to cover the costs incurred by City residents. The General Funapproximately $552,000 in the first year, reflecting less than 1 percent of the estimated bu
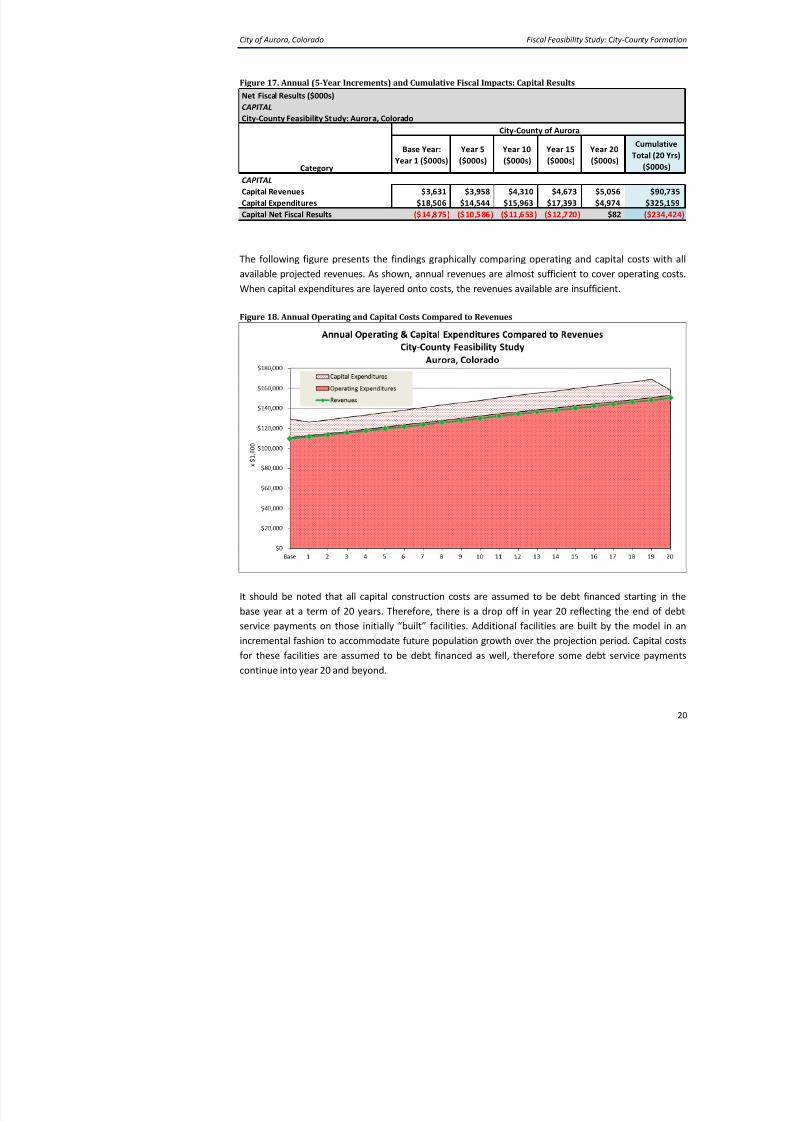
Capital Results
The fiscal impact analysis also covers capital expenditures shown separately below The
8/12/2019 Fiscal Feasibility Study: Formation of City-County of Aurora
City of Aurora, Colorado Fiscal Feasibility Study: City-
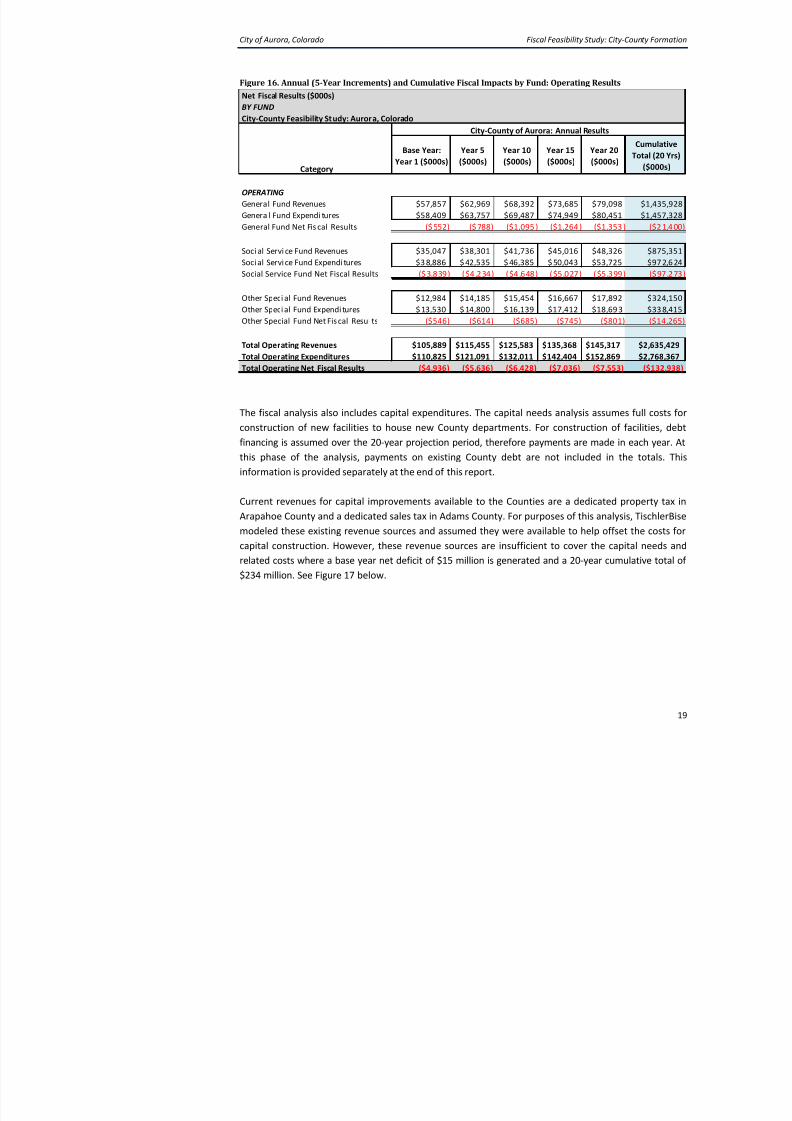
Figure 16. Annual (5-Year Increments) and Cumulative Fiscal Impacts by Fund: Operating Results
The fiscal analysis also includes capital expenditures. The capital needs analysis assumeconstruction of new facilities to house new County departments. For construction of
financing is assumed over the 20-year projection period, therefore payments are made in
this phase of the analysis, payments on existing County debt are not included in t
information is provided separately at the end of this report.
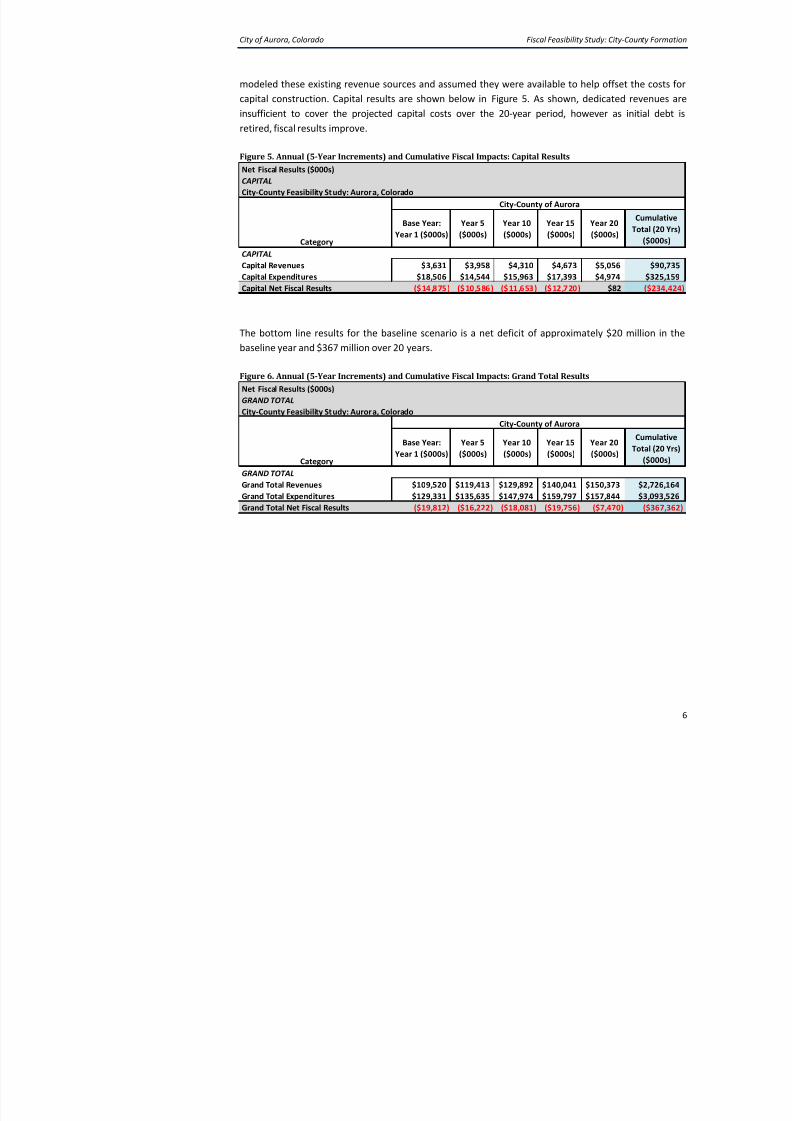
Current revenues for capital improvements available to the Counties are a dedicated p
Arapahoe County and a dedicated sales tax in Adams County. For purposes of this analysmodeled these existing revenue sources and assumed they were available to help offse
capital construction. However, these revenue sources are insufficient to cover the cap
related costs where a base year net deficit of $15 million is generated and a 20-year cum
$234 million. See Figure 17 below.
Net Fiscal Results ($000s)
BY FUNDCity-County Feasibility Study: Aurora, Colorado
City-County of Aurora: Annual Results
Category
OPERATING
General Fund Revenues $57,857 $62,969 $68,392 $73,685 $79,098
Genera l Fund Expendi tures $58,409 $63,757 $69,487 $74,949 $80,451
General Fund Net Fis cal Results ($ 552) ($ 788) ($1,095 ) ($1,264 ) ($1,353
Soci al Servi ce Fund Revenues $35,047 $38,301 $41,736 $45,016 $48,326
Soci al Servi ce Fund Expendi tures $3 8,886 $ 42,535 $ 46,385 $ 50,043 $53,725
Social Service Fund Net Fiscal Results ($3,839) ($4,234) ($4,648) ($5,027) ($5,399
Other Speci al Fund Revenues $12,984 $14,185 $15,454 $16,667 $17,892
Other Speci al Fund Expendi tures $ 13,530 $ 14,800 $ 16,139 $17,412 $18,69 3
Other Special Fund Net Fiscal Resul ts ($546) ($614) ($685) ($745) ($801)
Total Operating Revenues $105,889 $115,455 $125,583 $135,368 $145,317
Total Operating Expenditures $110,825 $121,091 $132,011 $142,404 $152,869
Total Operating Net Fiscal Results ($4,936) ($5,636) ($6,428) ($7,036) ($7,553)
Year 15
($000s)
Year 20
($000s)
Year 10
($000s)
Base Year:
Year 1 ($000s)
Year 5
($000s)
City of Aurora Colorado Fiscal Feasibility Study: City-
8/12/2019 Fiscal Feasibility Study: Formation of City-County of Aurora
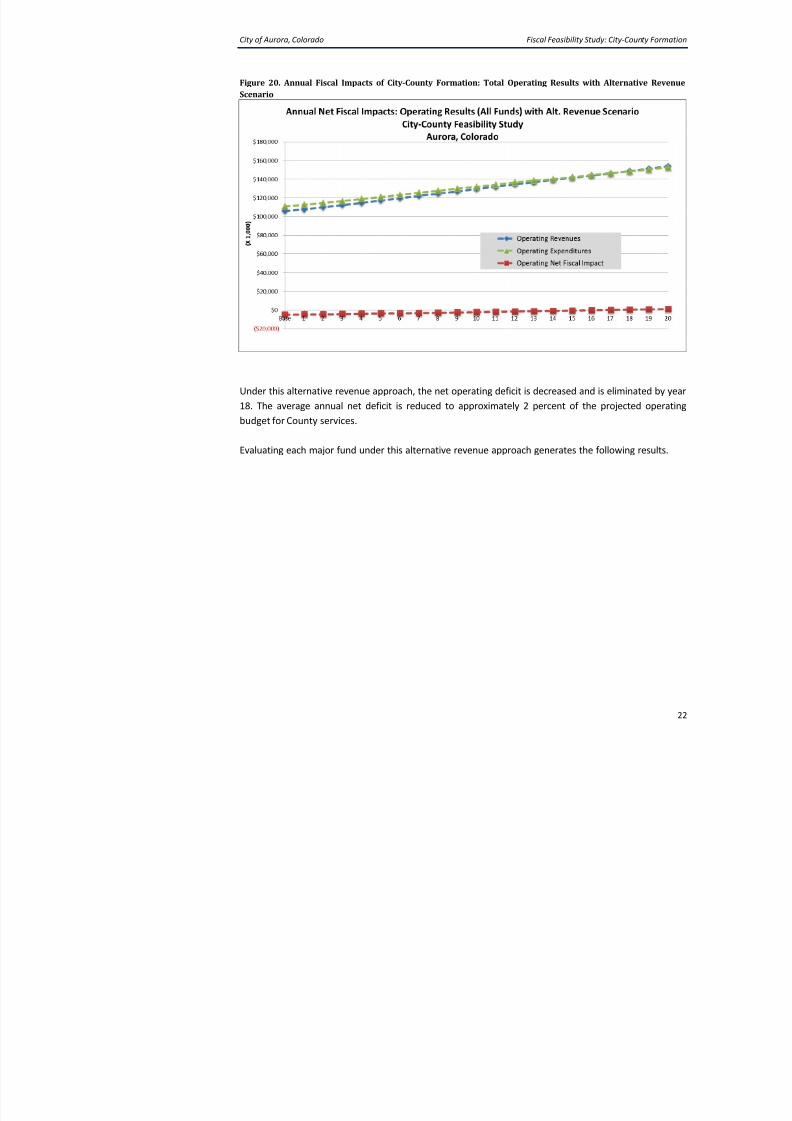
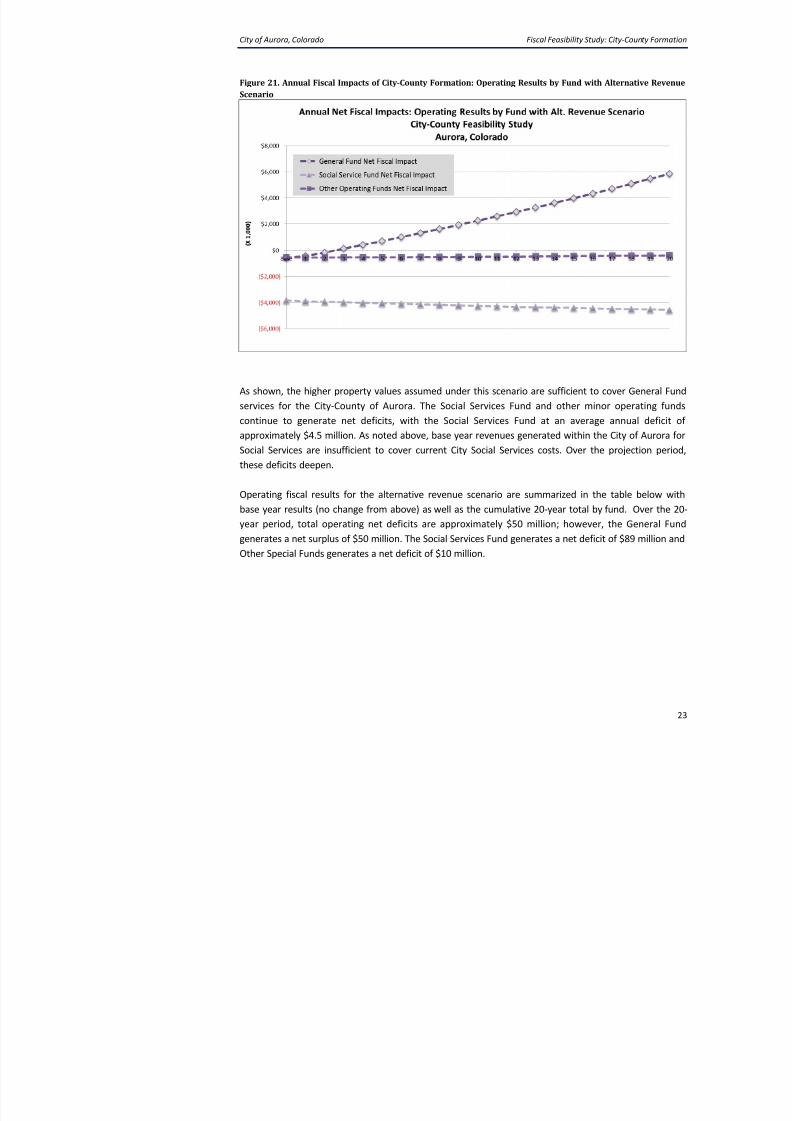
Figure 21. Annual Fiscal Impacts of City-County Formation: Operating Results by Fund with Alter
Scenario
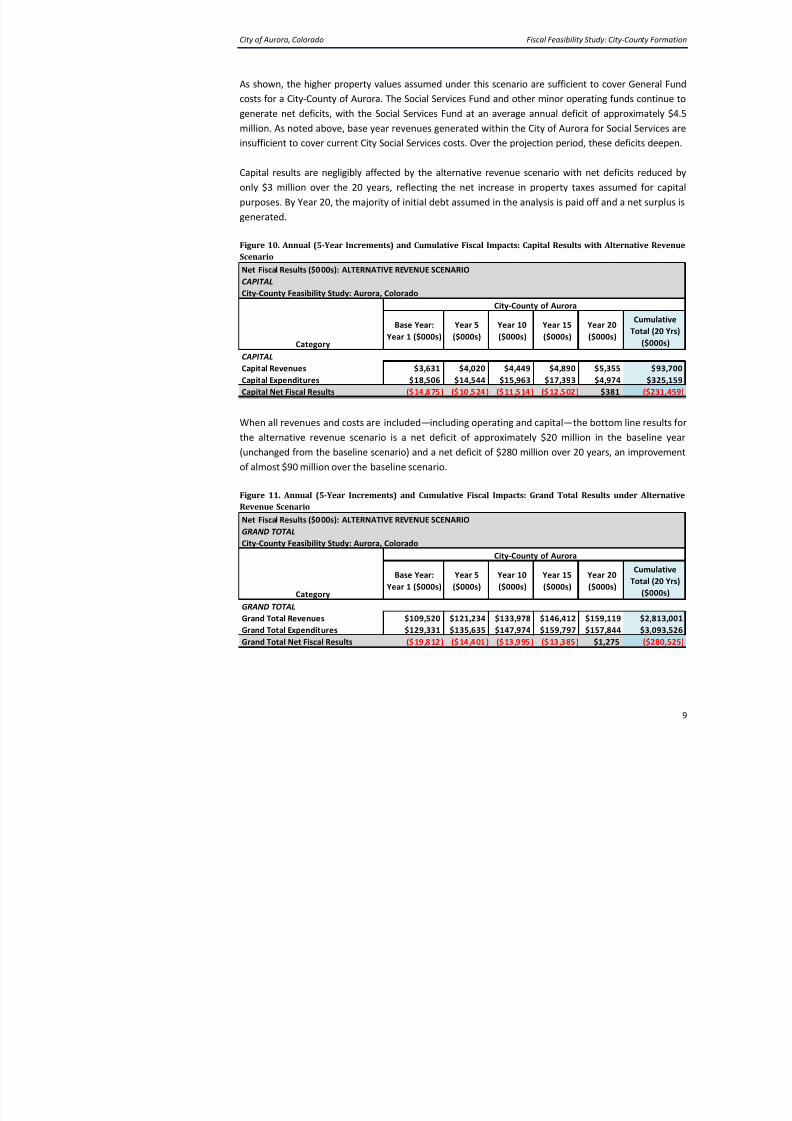
As shown, the higher property values assumed under this scenario are sufficient to cover
services for the City-County of Aurora. The Social Services Fund and other minor op
continue to generate net deficits, with the Social Services Fund at an average annapproximately $4.5 million. As noted above, base year revenues generated within the City
Social Services are insufficient to cover current City Social Services costs. Over the pro
these deficits deepen.
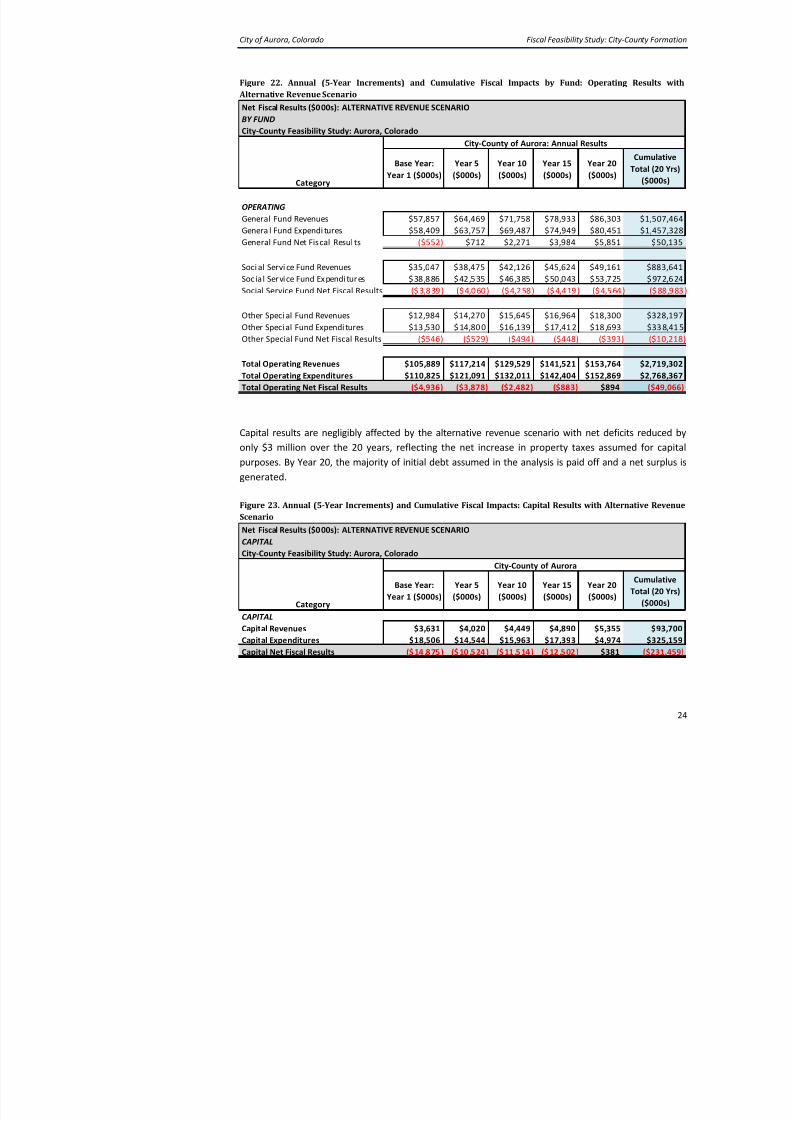
Operating fiscal results for the alternative revenue scenario are summarized in the tab
base year results (no change from above) as well as the cumulative 20-year total by fund
year period, total operating net deficits are approximately $50 million; however, the
generates a net surplus of $50 million. The Social Services Fund generates a net deficit of $
Other Special Funds generates a net deficit of $10 million.
City of Aurora, Colorado Fiscal Feasibility Study: City-
8/12/2019 Fiscal Feasibility Study: Formation of City-County of Aurora
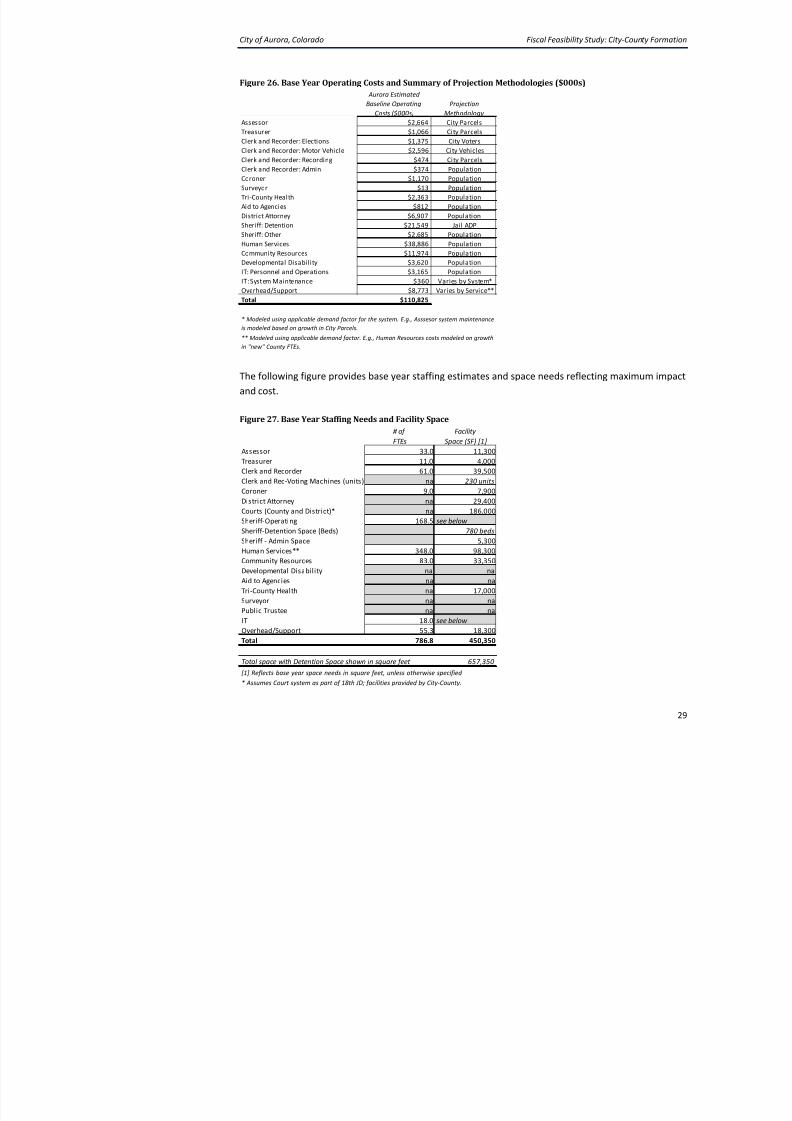
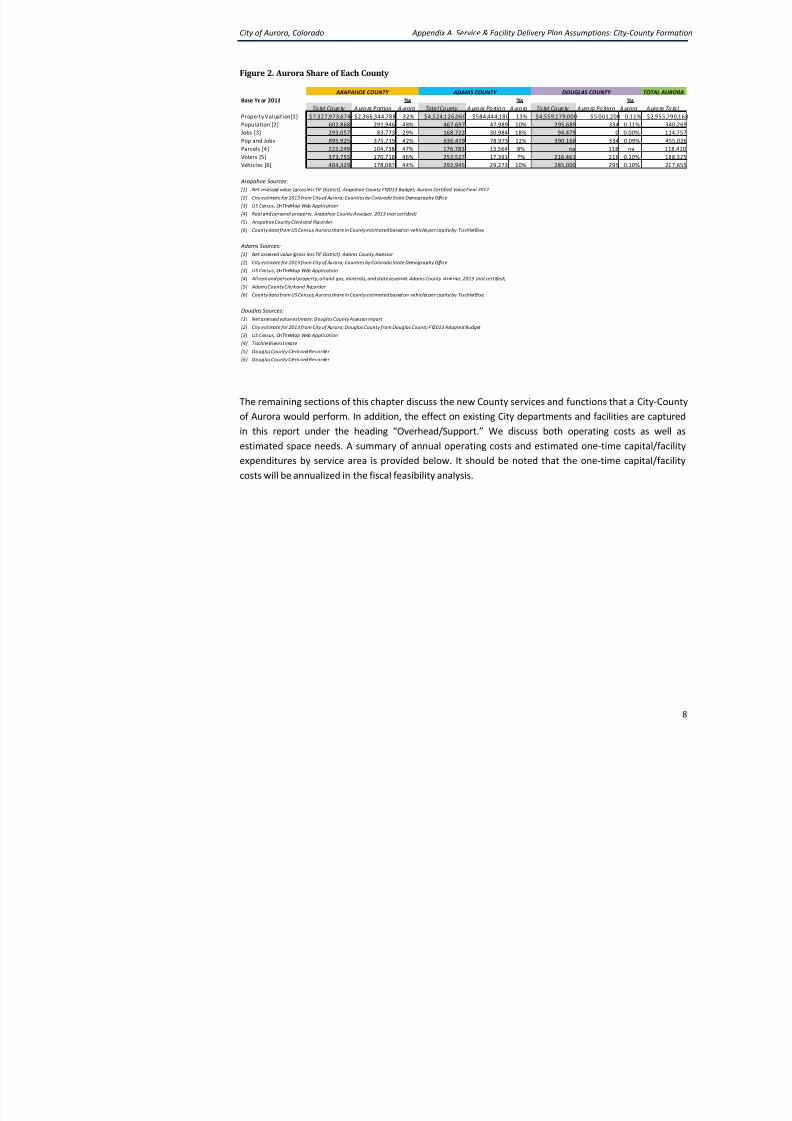
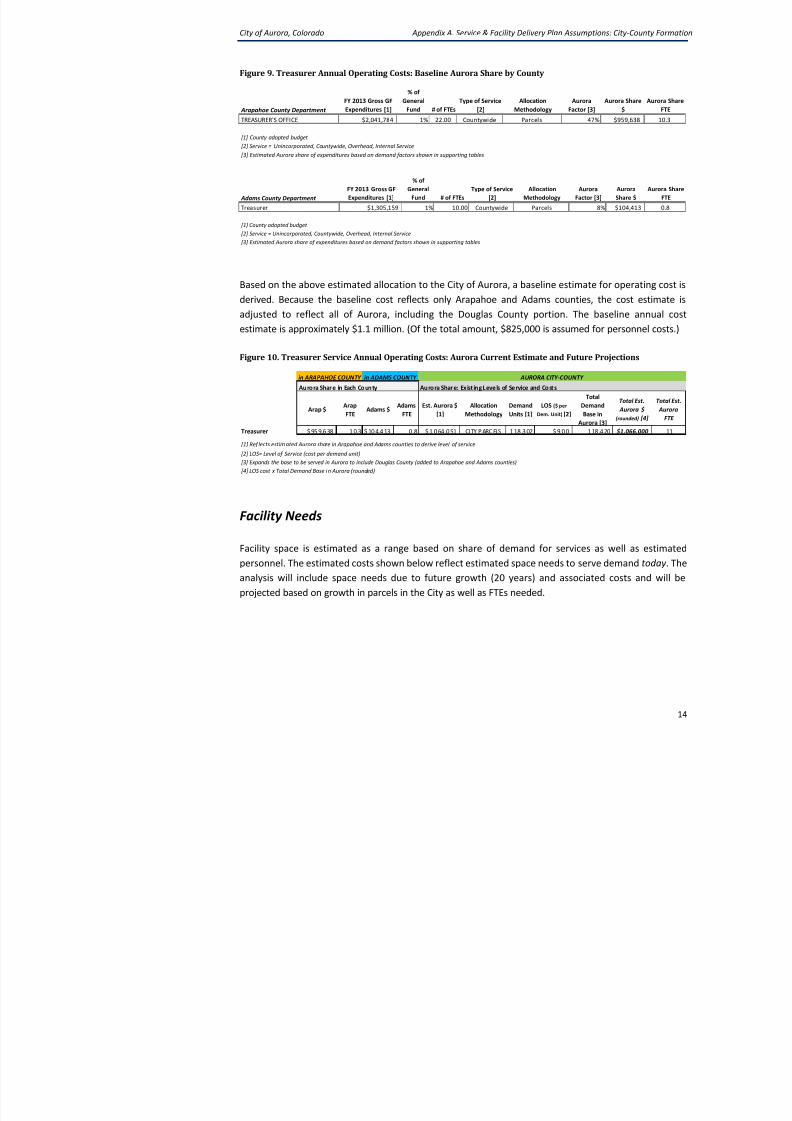
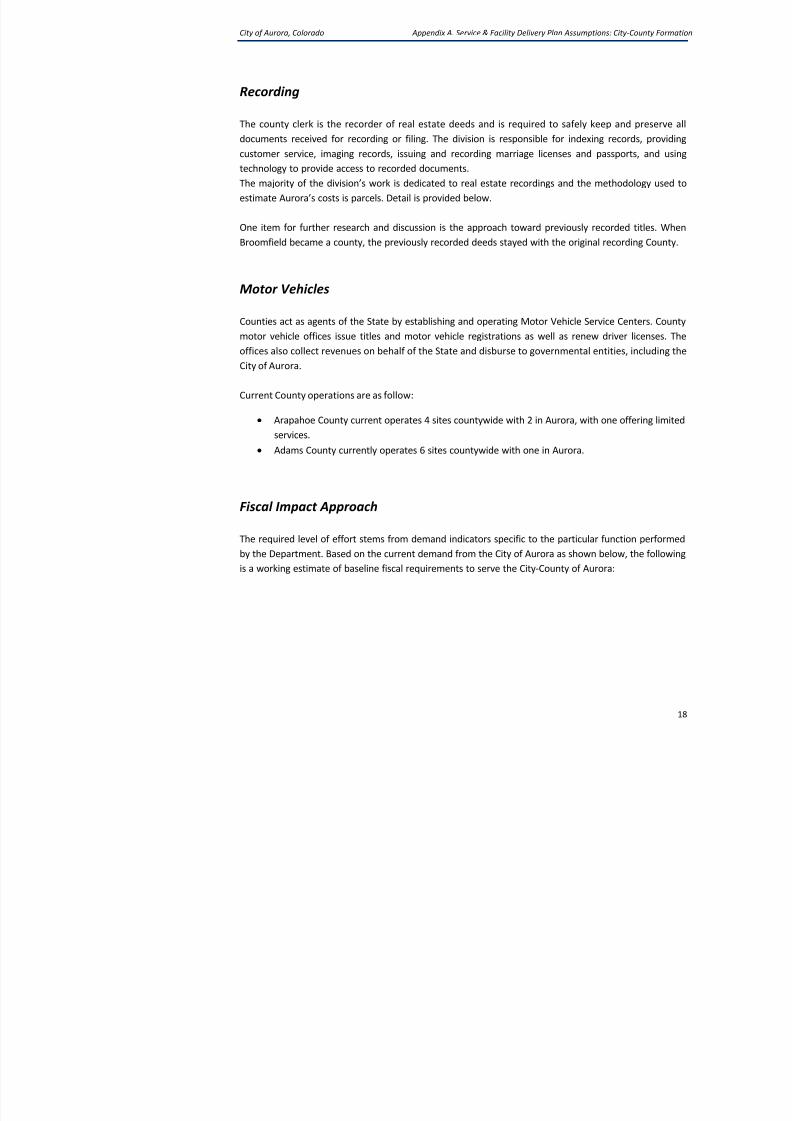
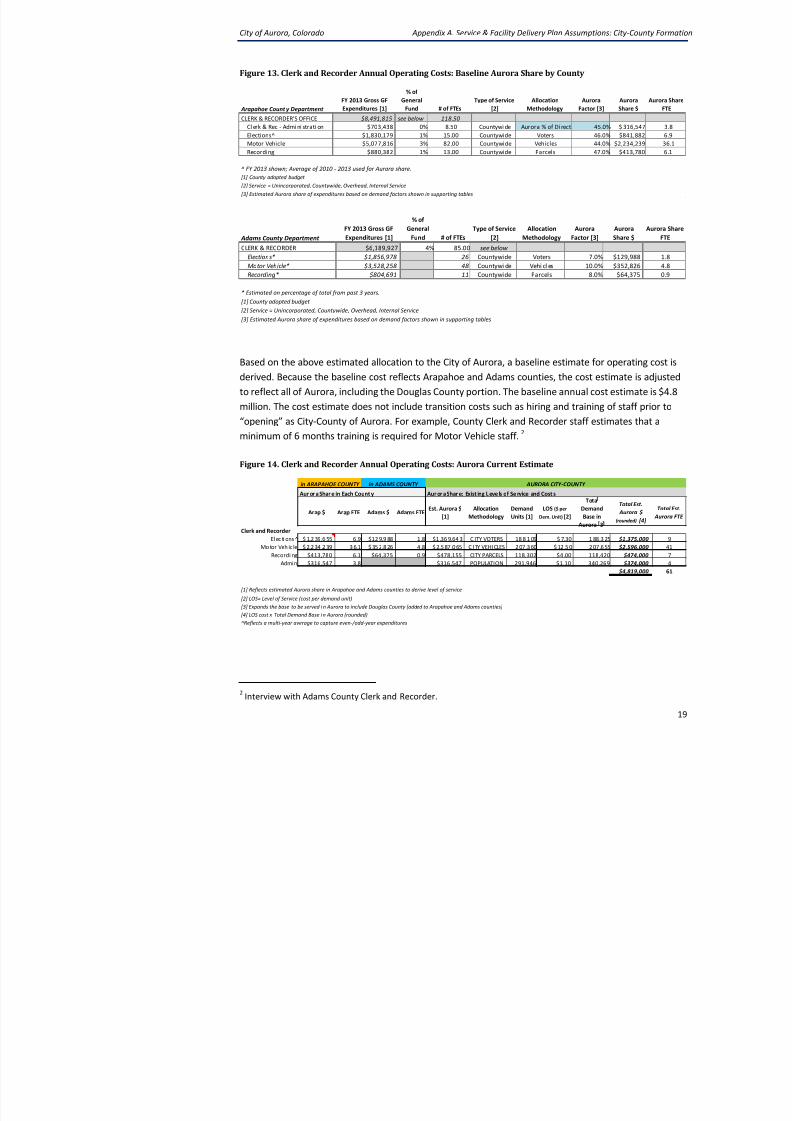
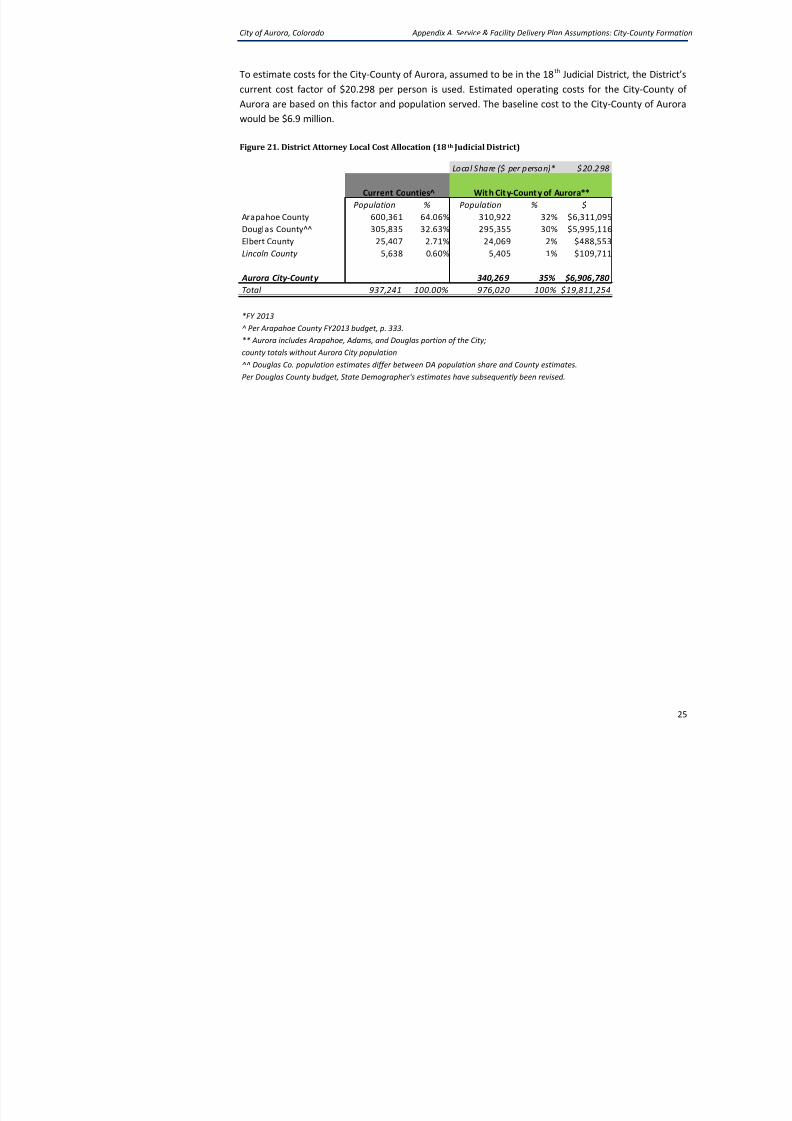
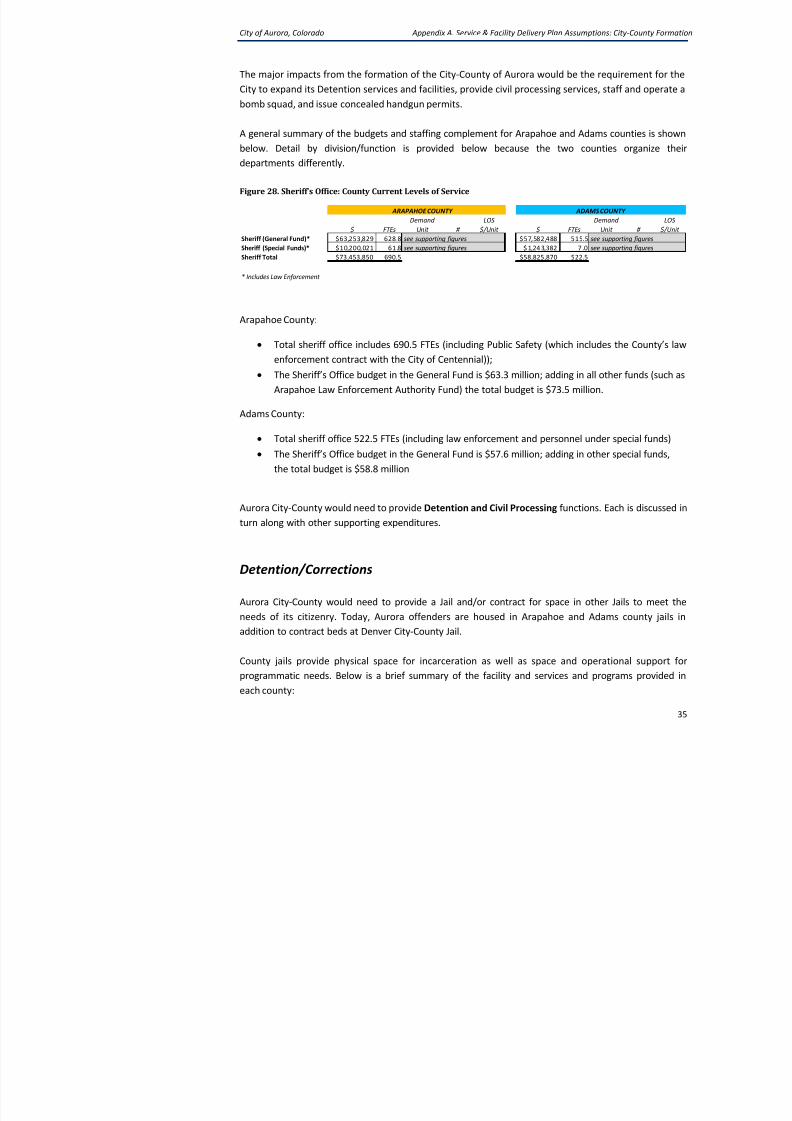
A summary of baseline operating costs to serve City-County of Aurora and projection fact
below. These costs for services are then used as the baseline to project costs to serve futhe City-County of Aurora. See Figure 26.
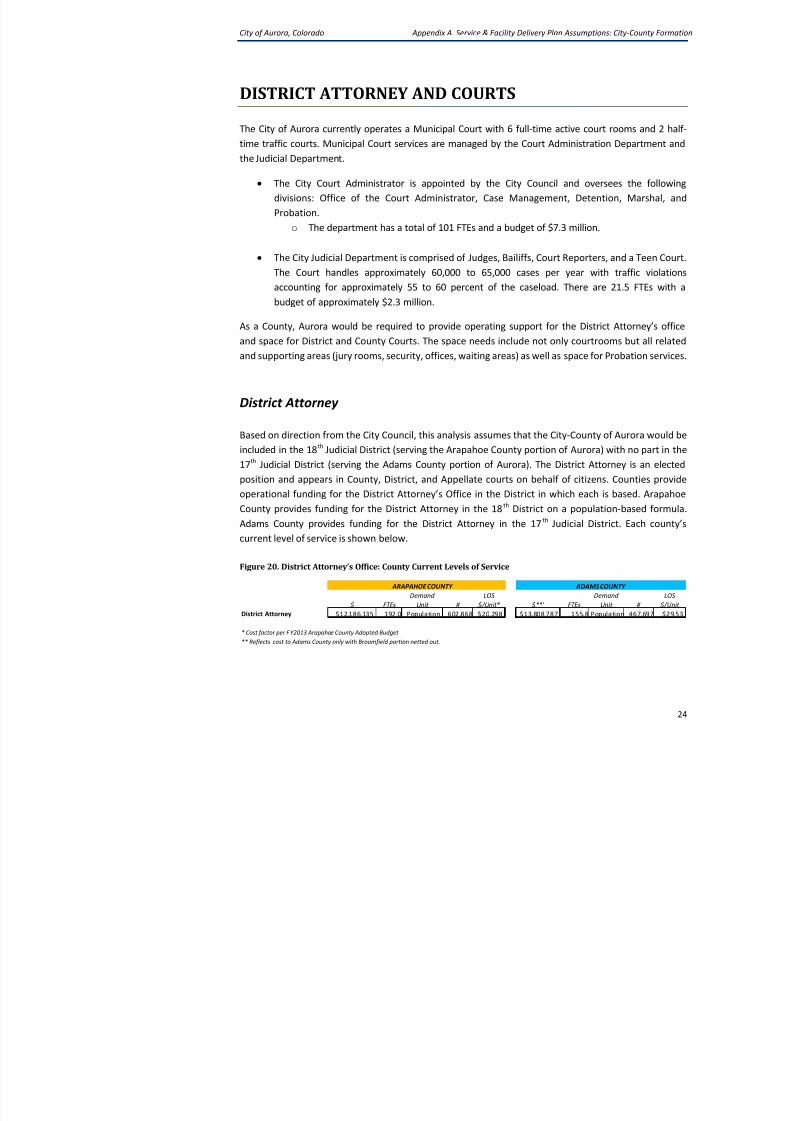
ARAPAHOE COUNTY ADAMS COUNTY DOUGLAS COUNTY
Base Year 2013 %s %s
To tal Co un ty A uro ra P ortion A urora Tota l Co unty A uro ra Po rtio n A uro ra To tal Co un ty A uro ra Po rtio n AProperty Valuation[1] $7,327,973,674 $2,366,344,788 32% $4,524,126,060 $584,444,180 13% $4,559,179,000 $5,001,200
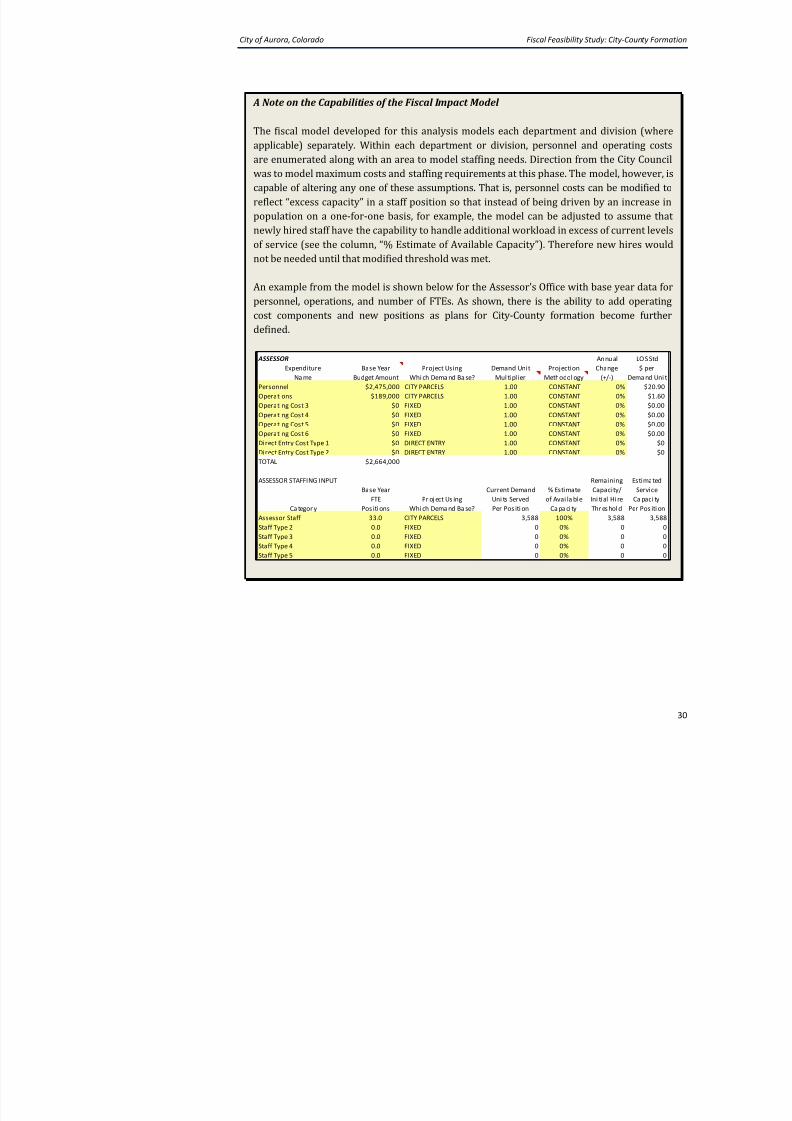
A Note on the Capabilities of the Fiscal Impact Model
The fiscal model developed for this analysis models each department and divis
applicable) separately. Within each department or division, personnel and oper
are enumerated along with an area to model staffing needs. Direction from the C
was to model maximum costs and staffing requirements at this phase. The model, h
capable of altering any one of these assumptions. That is, personnel costs can be m
reflect “excess capacity” in a staff position so that instead of being driven by an i
population on a one-for-one basis, for example, the model can be adjusted to anewly hired staff have the capability to handle additional workload in excess of cur
of service (see the column, “% Estimate of Available Capacity”). Therefore new h
not be needed until that modified threshold was met.
An example from the model is shown below for the Assessor’s Office with base ye
personnel, operations, and number of FTEs. As shown, there is the ability to add
cost components and new positions as plans for City-County formation becomdefined.
ASSESSOR Annual
Expenditure Base Year Project Using Demand Unit Projection Change
Na me Budget Amount Whi ch Dema nd Ba se? Mul ti pl ier Methodol ogy (+/-)
Personnel $2,475,000 CITY PARCELS 1.00 CONSTANT 0%
Operations $189,000 CITY PARCELS 1.00 CONSTANT 0%
Operating Cost 3 $0 FIXED 1.00 CONSTANT 0%
Operating Cost 4 $0 FIXED 1.00 CONSTANT 0%
Operating Cost 5 $0 FIXED 1.00 CONSTANT 0%
Operating Cost 6 $0 FIXED 1.00 CONSTANT 0%
Direct Entry Cost Type 1 $0 DIRECT ENTRY 1.00 CONSTANT 0%
Direct Entry Cost Type 2 $0 DIRECT ENTRY 1.00 CONSTANT 0%
TOTAL $2,664,000
ASSESSOR STAFFING INPUT Remaining
Base Year Current Demand % Estimate Capacity/
FTE Pr oj ect Us ing Uni ts Served of Avai la bl e Ini ti al Hi re
Ca tegor y Pos iti ons Whi ch Dema nd Ba se? Per Pos iti on Ca pa ci ty Thr es hol d
Assessor Staff 33.0 CITY PARCELS 3,588 100% 3,588
Staff Type 2 0.0 FIXED 0 0% 0
Staff Type 3 0.0 FIXED 0 0% 0
Staff Type 4 0.0 FIXED 0 0% 0
Staff Type 5 0.0 FIXED 0 0% 0
City of Aurora, Colorado Fiscal Feasibility Study: City-
8/12/2019 Fiscal Feasibility Study: Formation of City-County of Aurora
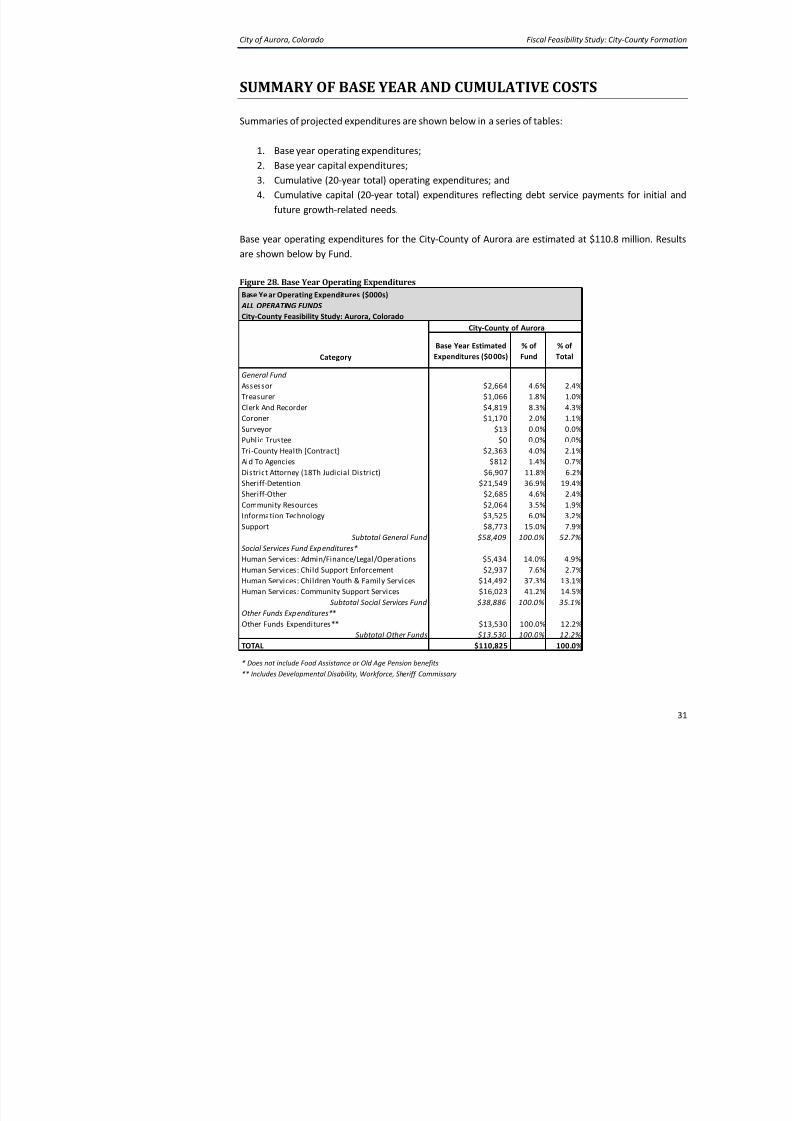
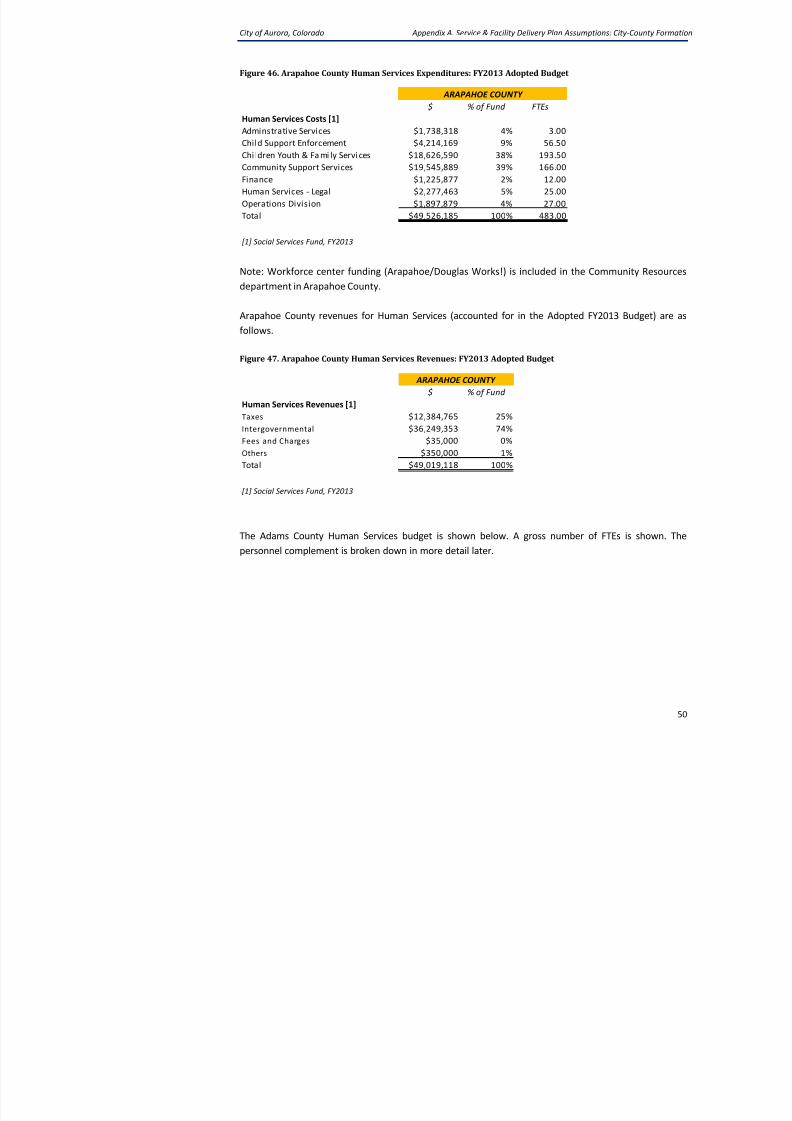
General Fund expenditures comprise approximately 53 percent of total operating expend
majority of total expenditures for Human Services (at 35 percent) followed by Dete
(almost 20 percent). The majority of “Other Funds Expenditures” is for Workforce Serviassumed to have offsetting revenues.
As noted elsewhere in this study, operating costs reflect estimated costs attributable for n
serve the City-County of Aurora. To derive estimates for Information Technology and Supp
weighted average of Aurora’s direct costs to current County direct costs is derived and a
individual support cost component. That is, a simplified cost allocation approach was u
because similar services are provided in the City of Aurora today, this is an area refinement to determine the incremental increase in IT and other overhead services, p
resulting costs needed to support additional County direct services.
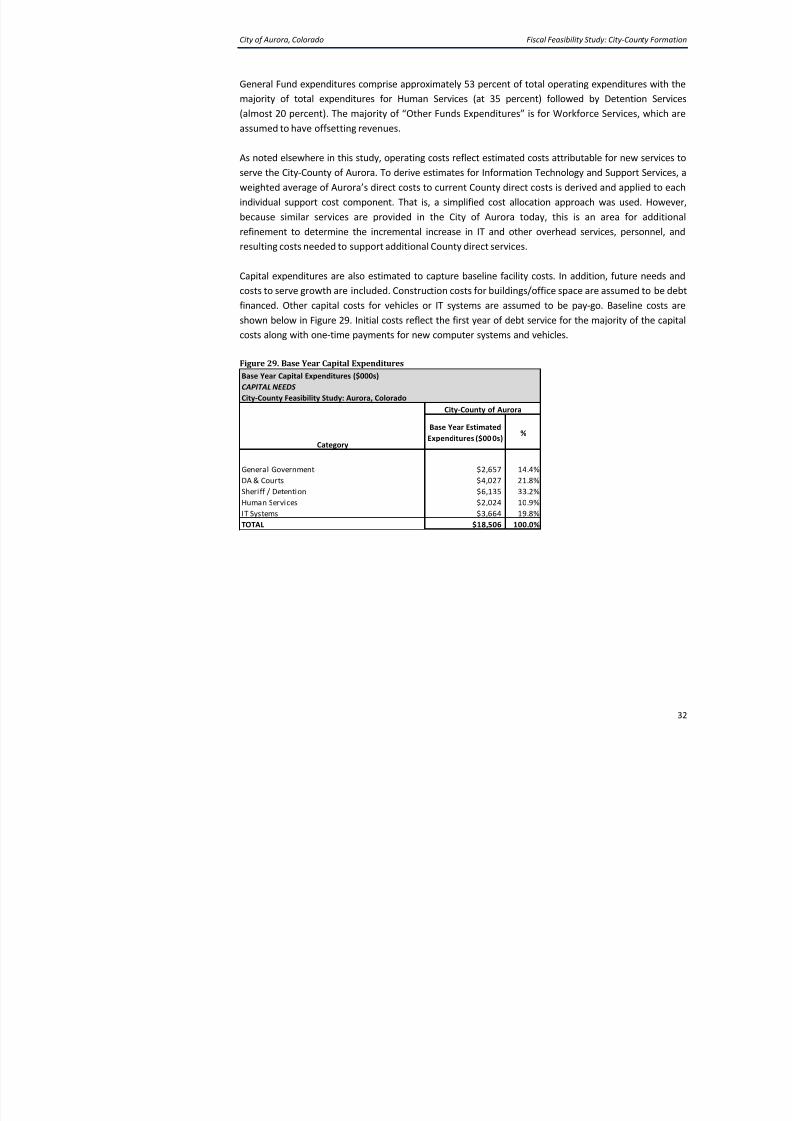
Capital expenditures are also estimated to capture baseline facility costs. In addition, fut
costs to serve growth are included. Construction costs for buildings/office space are assum
financed. Other capital costs for vehicles or IT systems are assumed to be pay-go. Base
shown below in Figure 29. Initial costs reflect the first year of debt service for the majoritcosts along with one-time payments for new computer systems and vehicles.
Figure 29. Base Year Capital Expenditures
Base Year Capital Expenditures ($000s)
CAPITAL NEEDS
City-County Feasibility Study: Aurora, Colorado
City-County of Aurora
Category
General Government $2,657 14.4%
DA & Courts $4,027 21.8%
Sheriff / Detention $6,135 33.2%
Human Services $2,024 10.9%
IT Systems $3,664 19.8%
TOTAL $18,506 100.0%
%Base Year Estimated
Expenditures ($00 0s)
City of Aurora, Colorado Fiscal Feasibility Study: City-
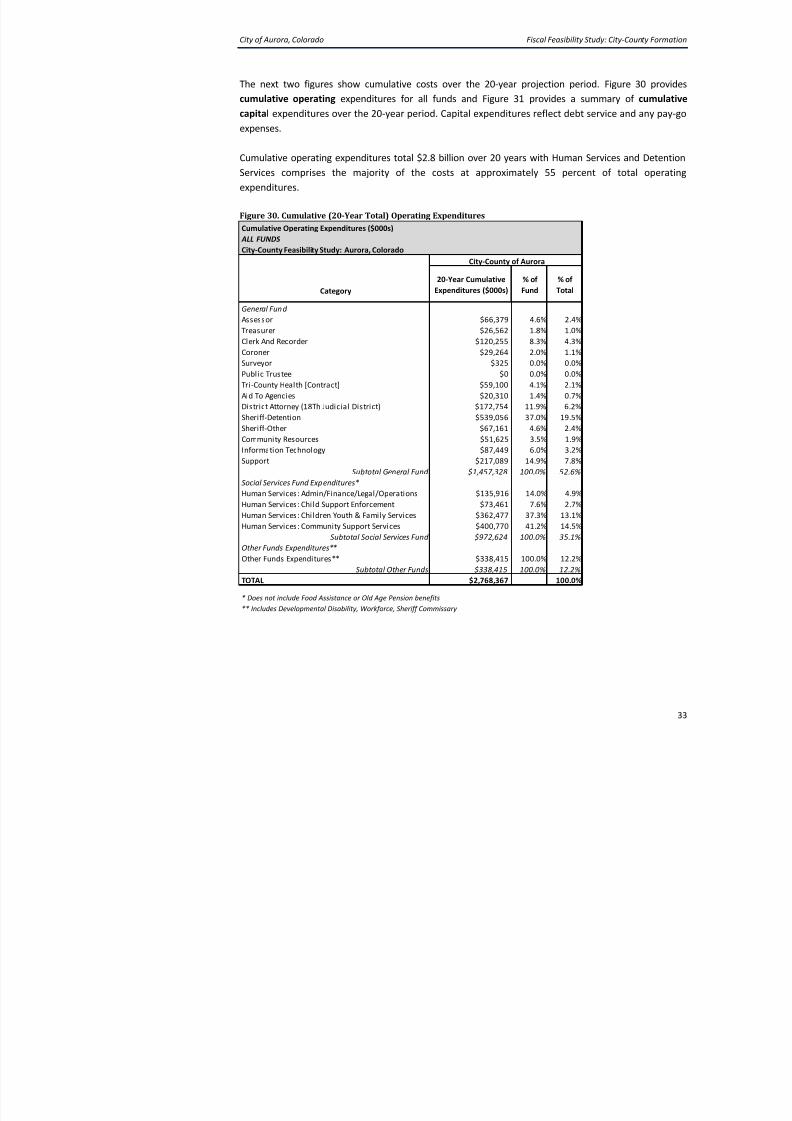
8/12/2019 Fiscal Feasibility Study: Formation of City-County of Aurora
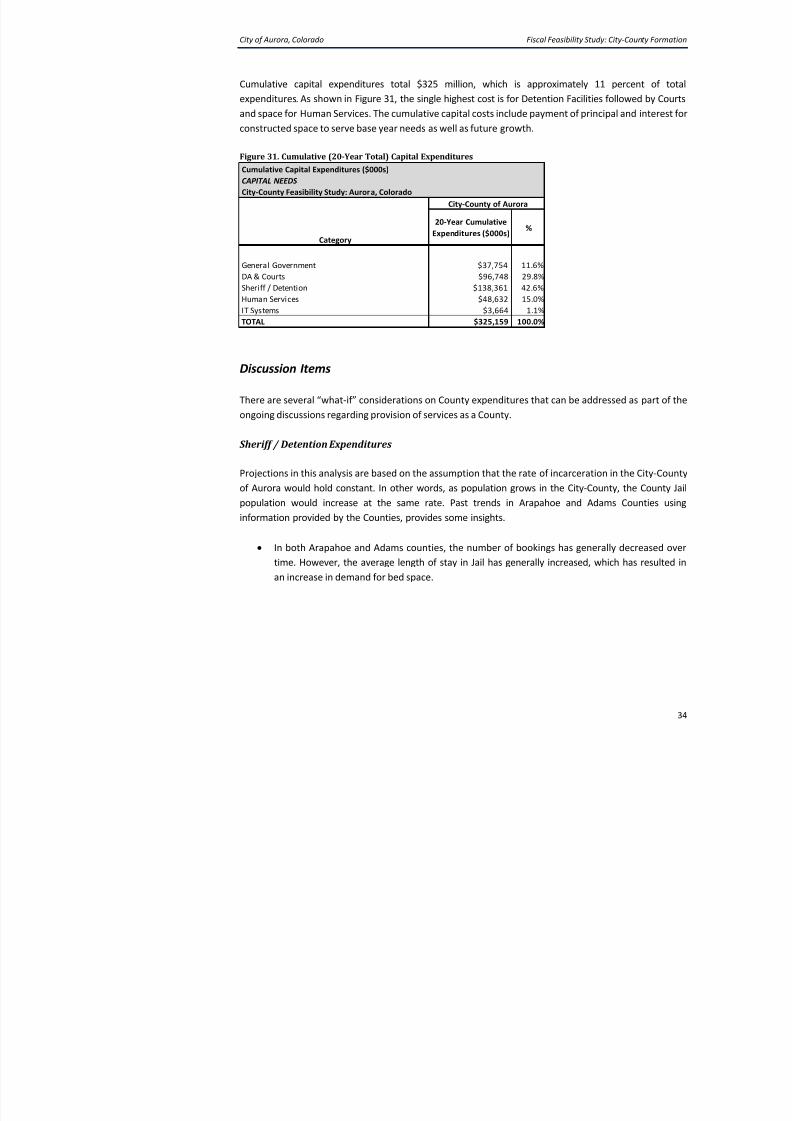
Cumulative capital expenditures total $325 million, which is approximately 11 pe
expenditures. As shown in Figure 31, the single highest cost is for Detention Facilities follo
and space for Human Services. The cumulative capital costs include payment of principal aconstructed space to serve base year needs as well as future growth.
Figure 31. Cumulative (20-Year Total) Capital Expenditures
Discussion Items
There are several “what-if” considerations on County expenditures that can be addressed
ongoing discussions regarding provision of services as a County.
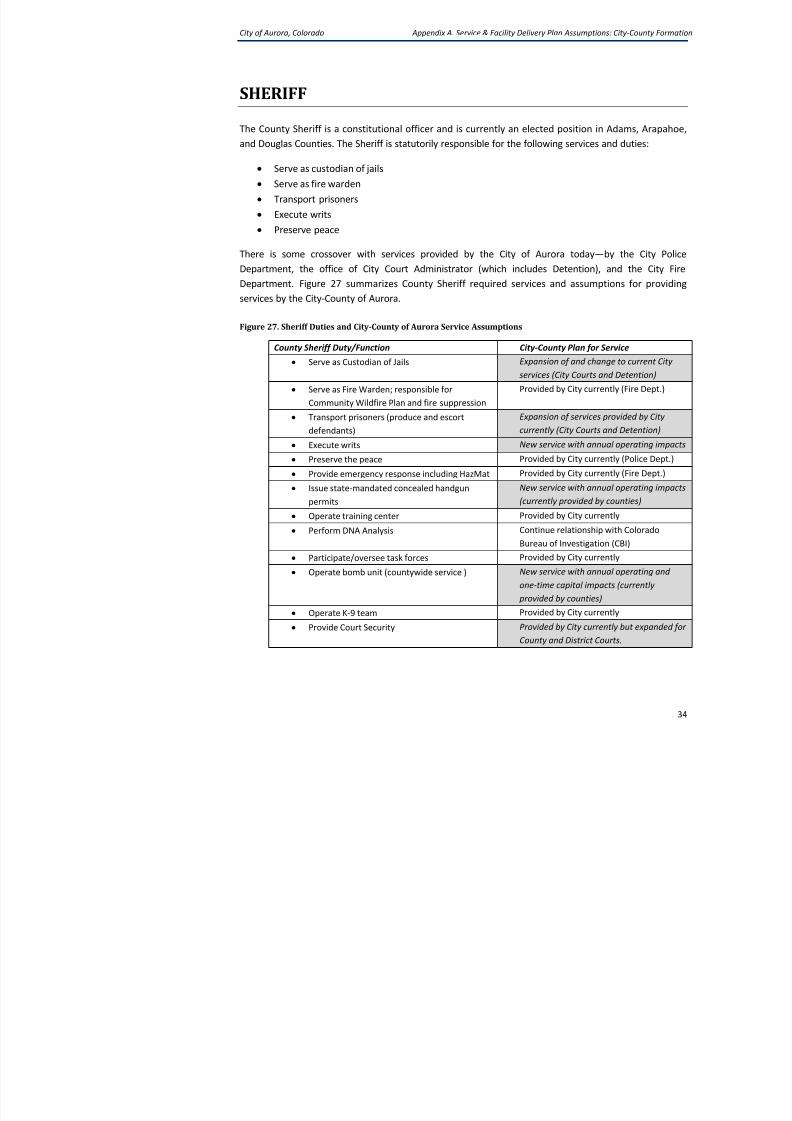
Sheriff / Detention Expenditures
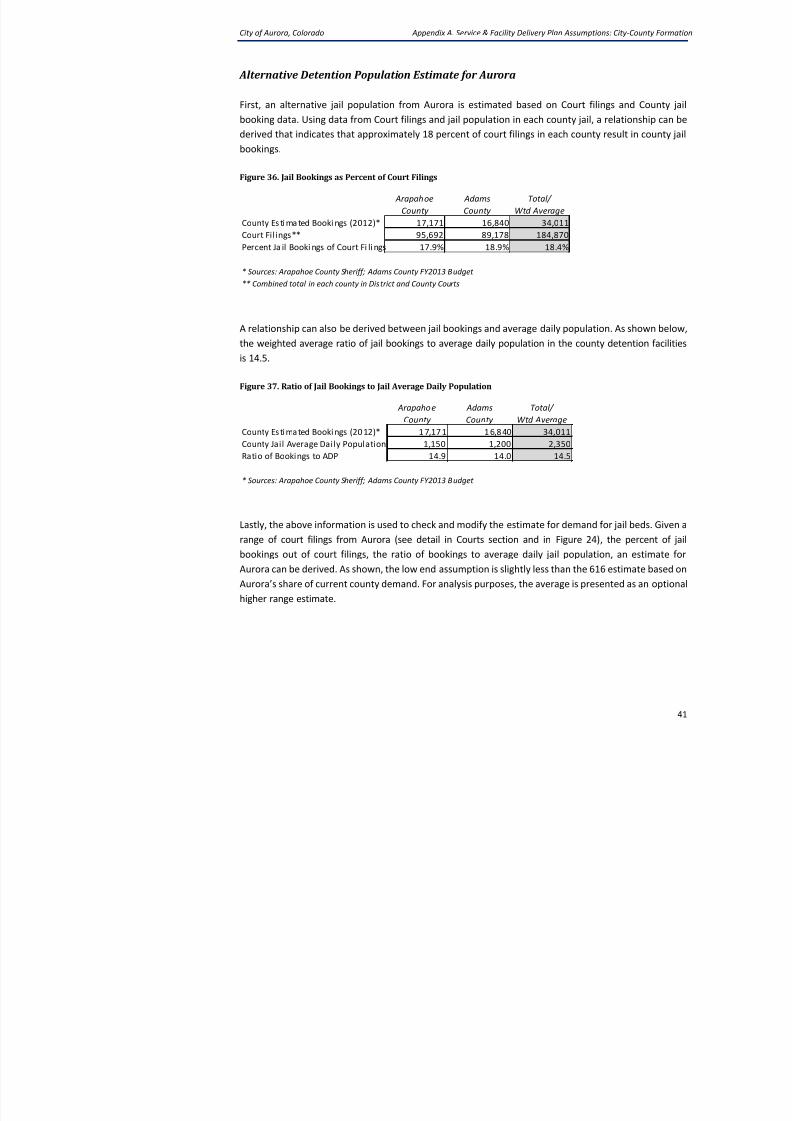
Projections in this analysis are based on the assumption that the rate of incarceration in t
of Aurora would hold constant. In other words, as population grows in the City-County,
population would increase at the same rate. Past trends in Arapahoe and Adams C
information provided by the Counties, provides some insights.
• In both Arapahoe and Adams counties, the number of bookings has generally d
time. However, the average length of stay in Jail has generally increased, which
an increase in demand for bed space.
Cumulative Capital Expenditures ($000s)
CAPITAL NEEDS
City-County Feasibility Study: Aurora, Colorado
City-County of Aurora
Category
General Government $37,754 11.6%
DA & Courts $96,748 29.8%
Sheriff / Detention $138,361 42.6%
Human Services $48,632 15.0%
IT Systems $3,664 1.1%
TOTAL $325,159 100.0%
%20-Year Cumulative
Expenditures ($000s)
City of Aurora, Colorado Fiscal Feasibility Study: City-
8/12/2019 Fiscal Feasibility Study: Formation of City-County of Aurora
o Arapahoe County: 21.0 inmates per 10,000 residents
conducted for Adams County, the foll
incarceration rates were reported:
o Adams County: 29.2 inmates per 10,000 residents
o For comparison purposes: Jefferson County: 21.3 inmates per 10,000 res
County: 36.1 inmates per 10,000 residents
• Looking at the current conditions, given the reported Average Daily Population
and Adams Counties and current general County population, the latest rates are:
o Arapahoe County: 19.1 inmates per 10,000 residents (decreased from 201o Adams County: 25.7 inmates per 10,000 residents (decreased from 2011)
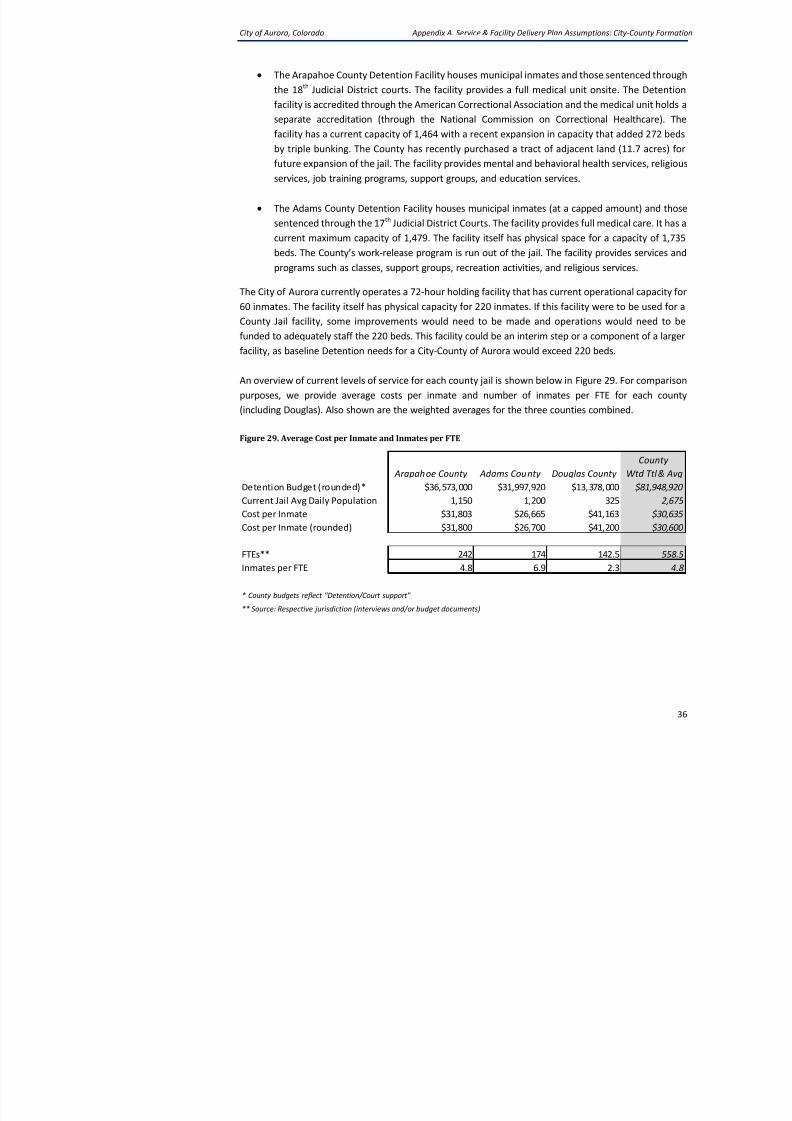
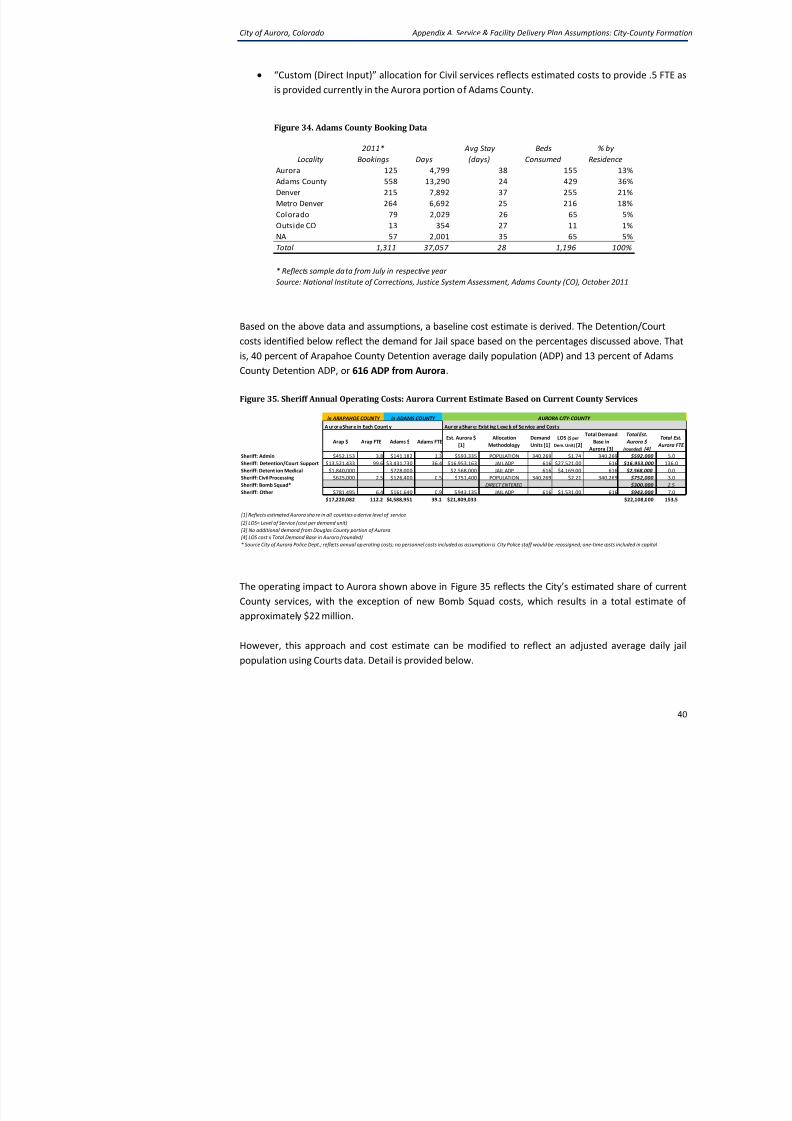
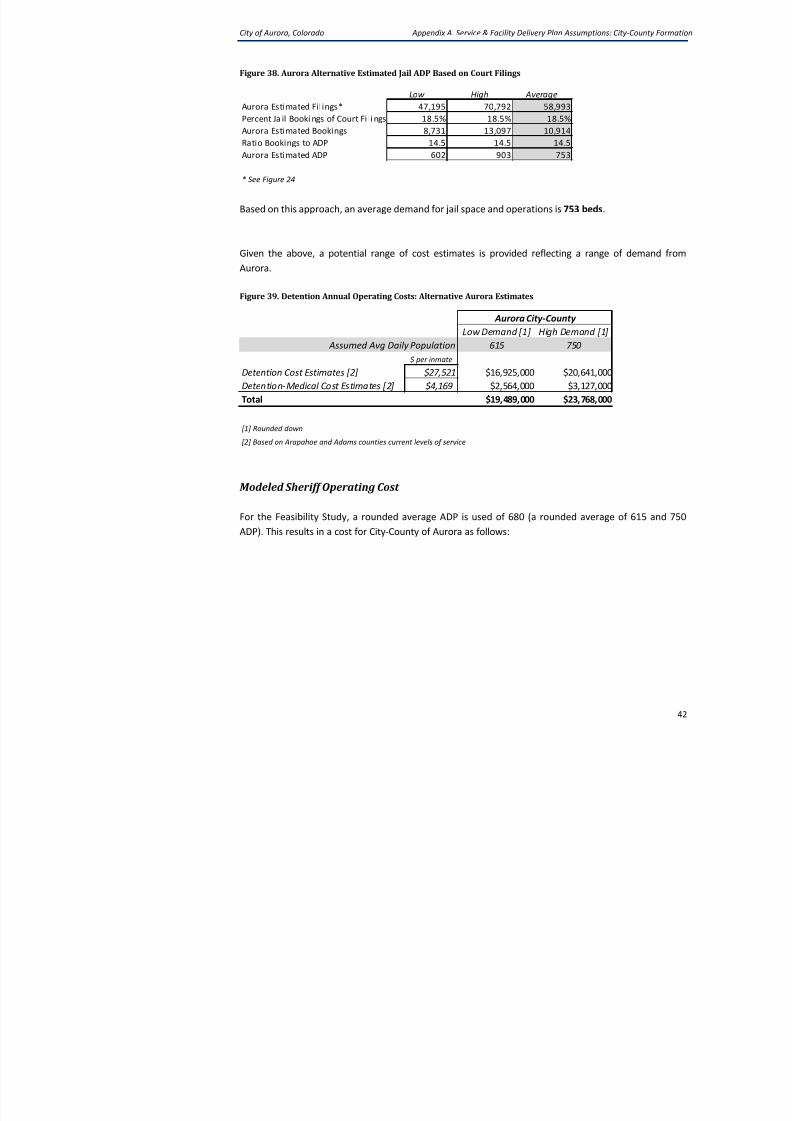
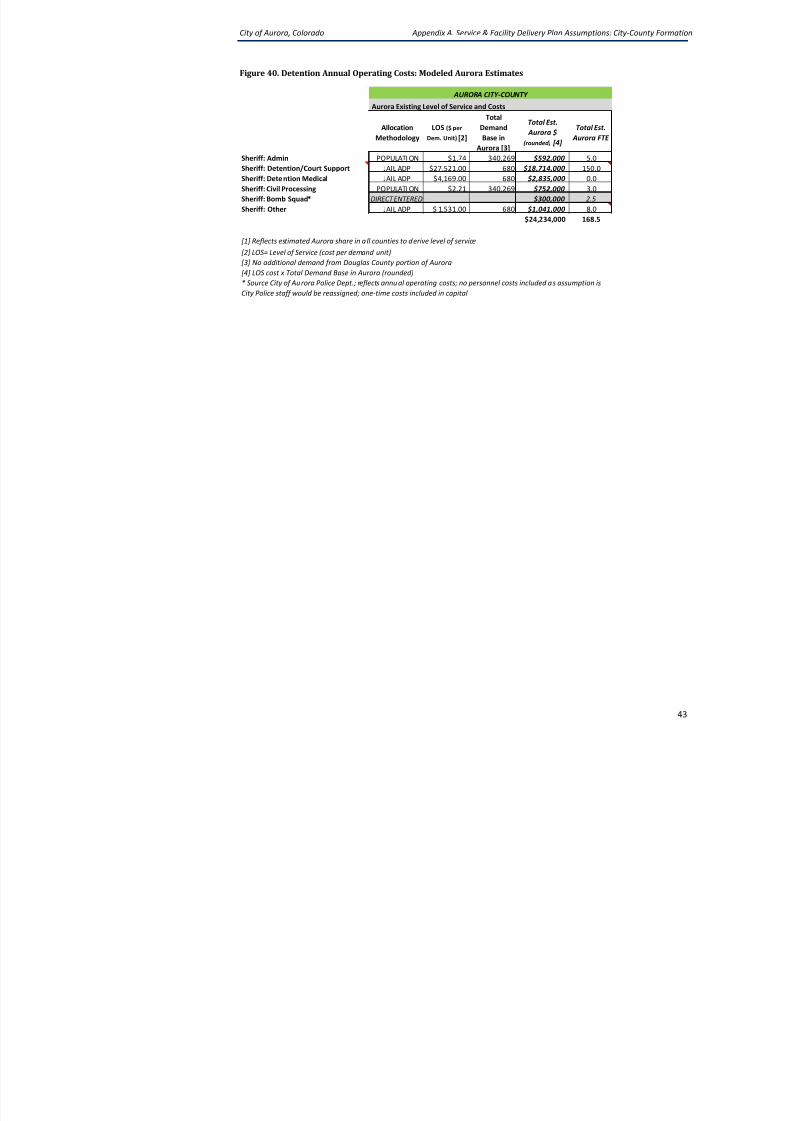
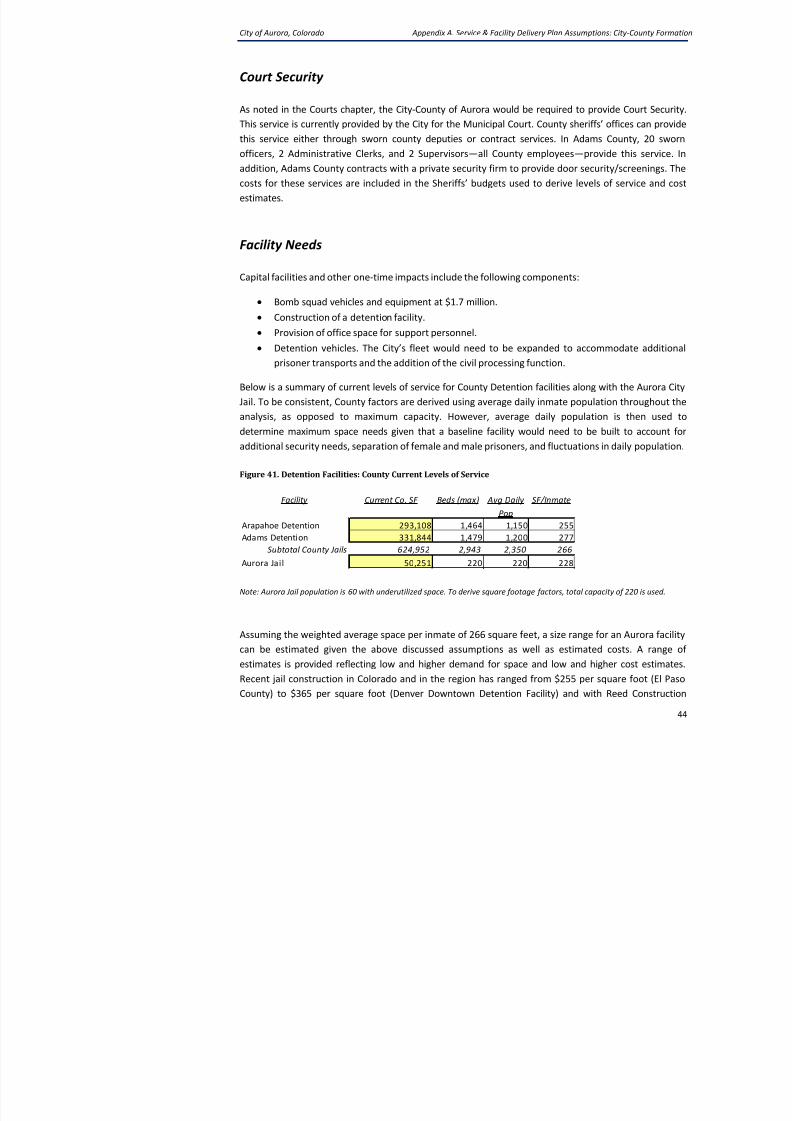
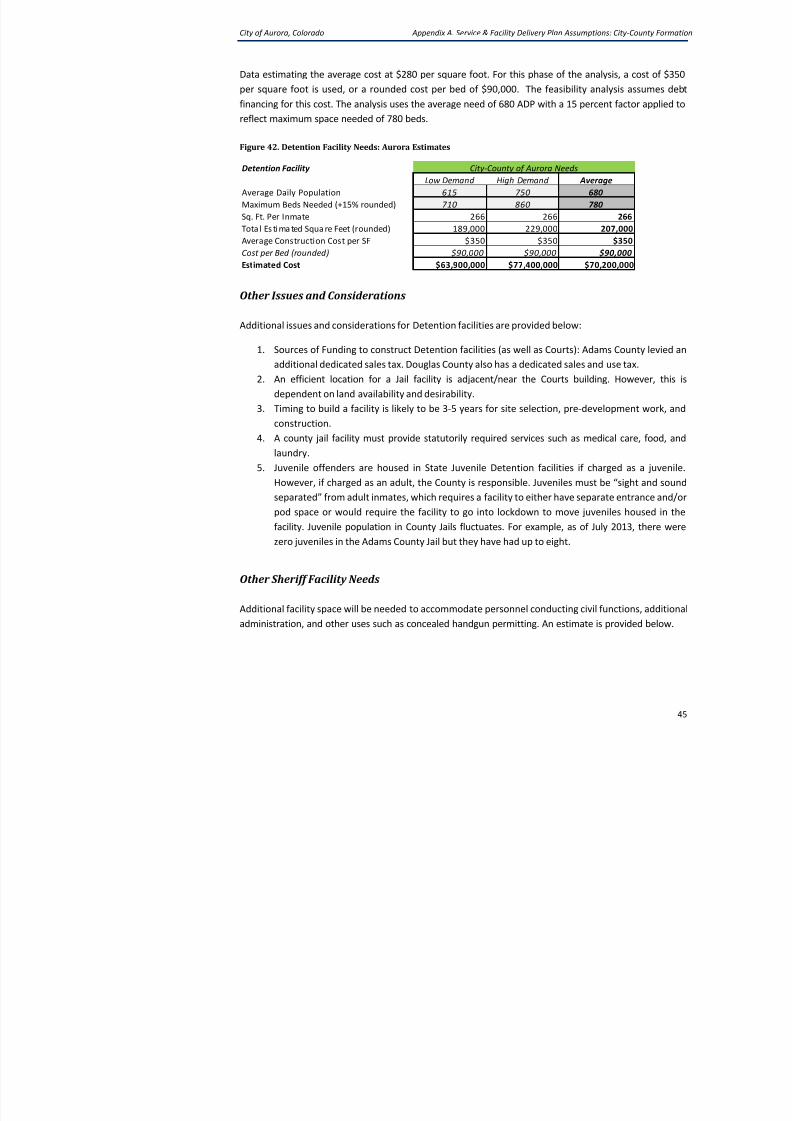
Using the approach outlined in the Service Plan, an average daily inmate population of 6
would result in an incarceration rate of 20 inmates per 10,000 residents. The Feasibility an
this rate holds constant over time, resulting in a projected average daily population of 940
the 20-year projection period. (It should be noted that the Detention Facility included
assumes construction of a facility to house a maximum population of 780 in the basprojected maximum need for 1,078 beds by the end of the 20-year projection period.)
The incarceration rate assumption presents an opportunity throughout the City-Cou
process to discuss detention/correction philosophy, service provision, current practices,
from elsewhere, and other related topics. For example, should the community’s expectat
incarceration rate will hold steady over time? Or are there opportunities to initiate goals t
rate through alternative sentencing or other means?
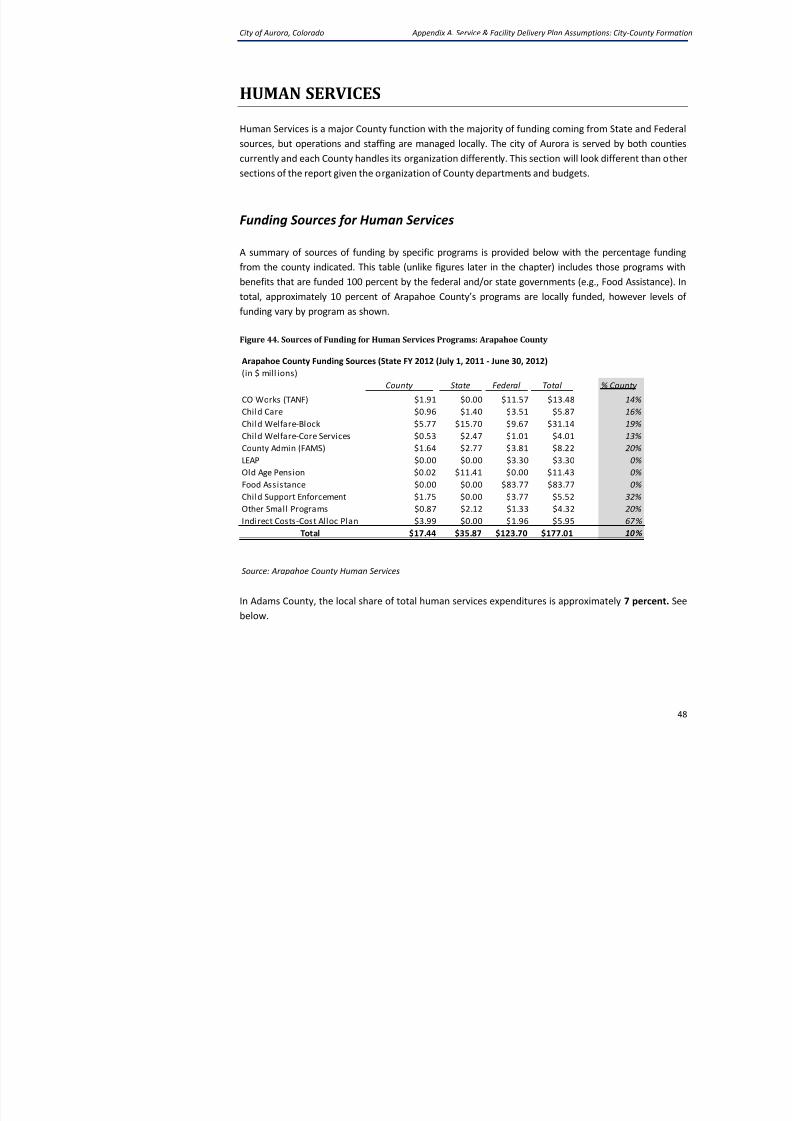
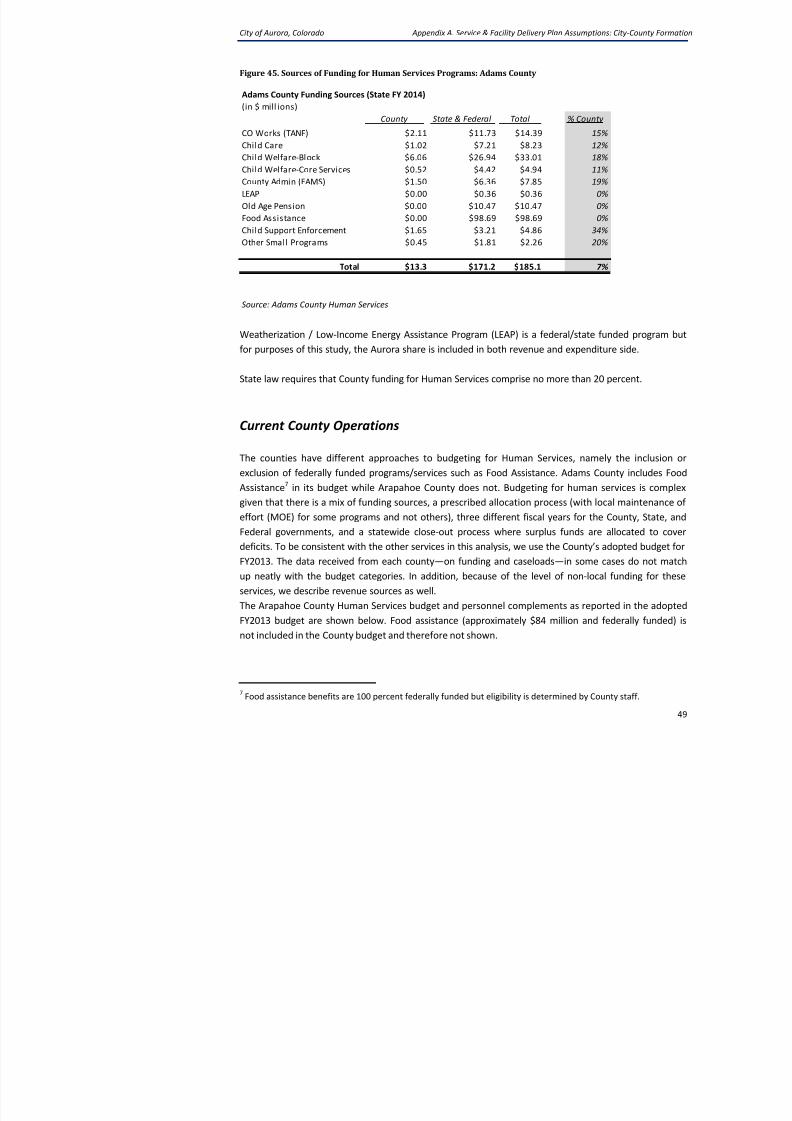
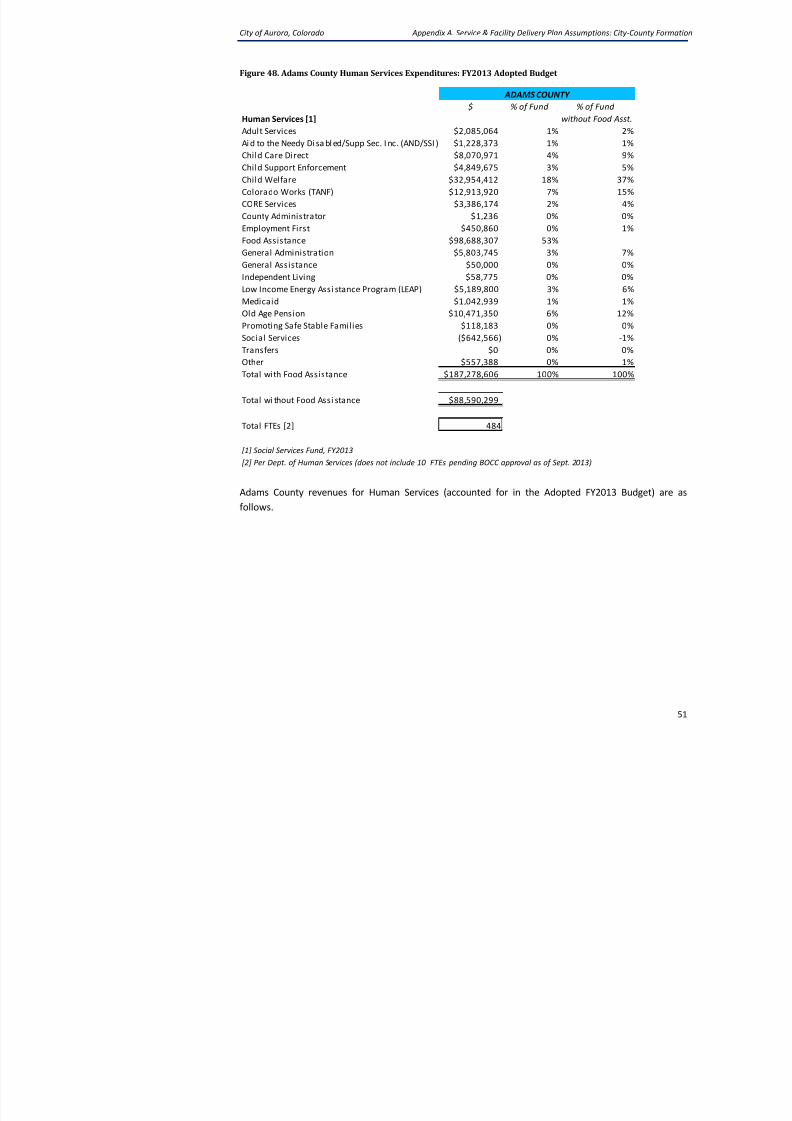
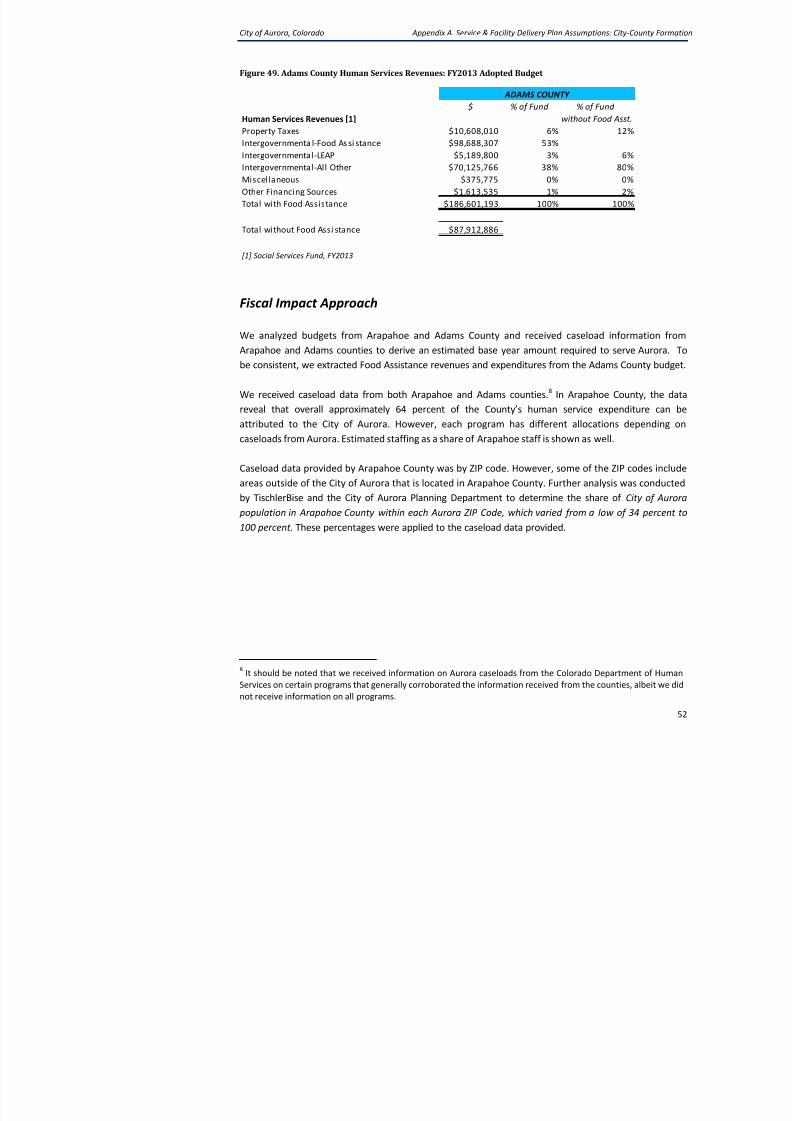
Human Services
Human Services expenditures are captured in the Social Services Fund. The majority of ex
covered by funding from the State and Federal government. Benefits that are fully sup
State or Federal government (i.e., Food Assistance and Old Age Pension) are not in
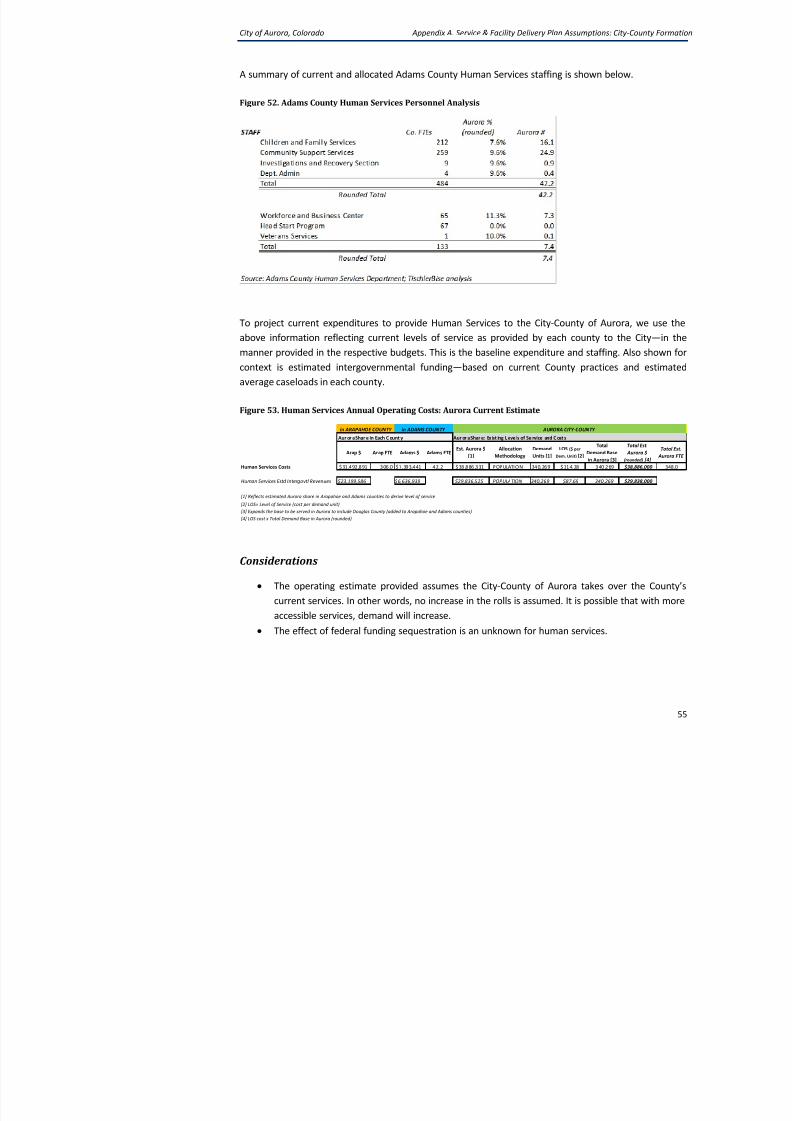
analysis. Estimated initial operating costs are approximately $39 million, which assumes t
population transfers from current Arapahoe and Adams Counties. There are two possible
assumption:
City of Aurora, Colorado Fiscal Feasibility Study: City-
8/12/2019 Fiscal Feasibility Study: Formation of City-County of Aurora
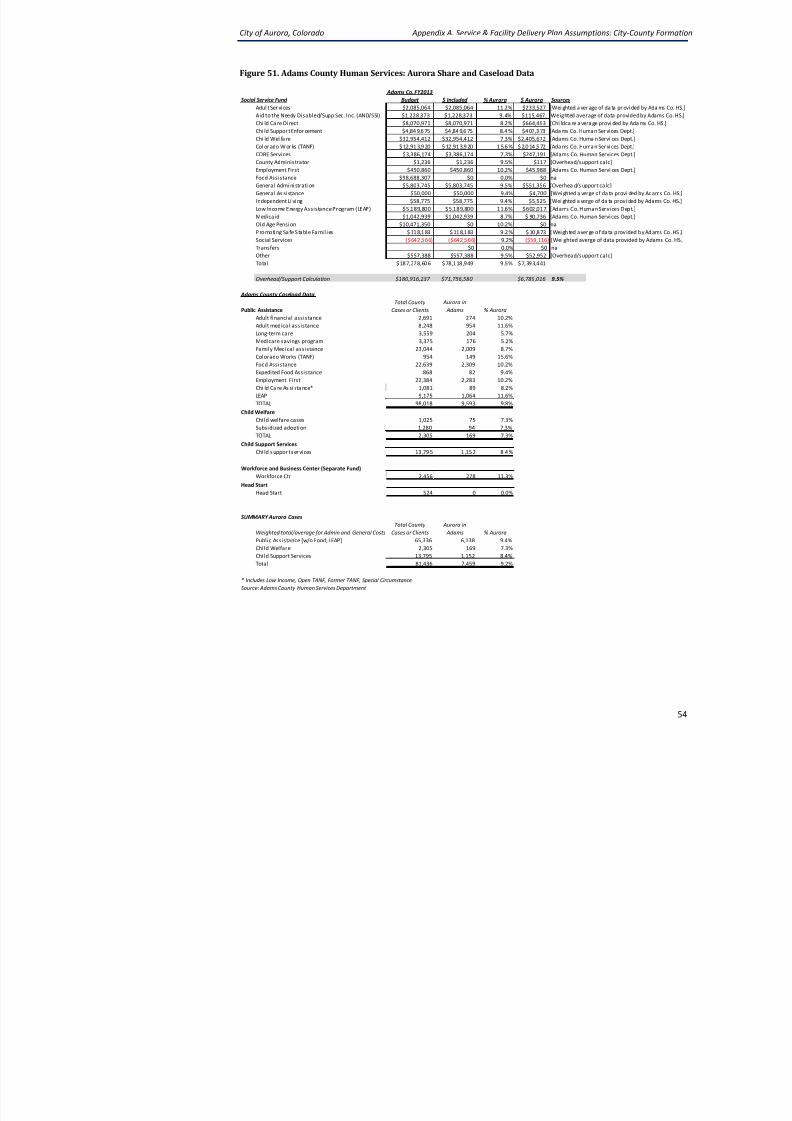
• Second, it is possible that base year operating costs may be overestimated for o
of Human Services, namely Child Support Enforcement (base year estimate of ap
million). It is likely that active cases at the time of County transition would be roriginating County. That is, those cases in Arapahoe and Adams Counties today
with those counties and the City-County of Aurora would be responsible for ne
time of County formation. If this is the case, then base year costs for this divi
lower, however an infrastructure would need to be put in place to cover new case
would be transferred. As City-County formation continues to be pursued, these as
operational decisions will need to be negotiated with the Counties and State. F
this analysis at this phase, the estimate derived is useful as a baseline level ostandard to be used for annualized County operations and to project future expen
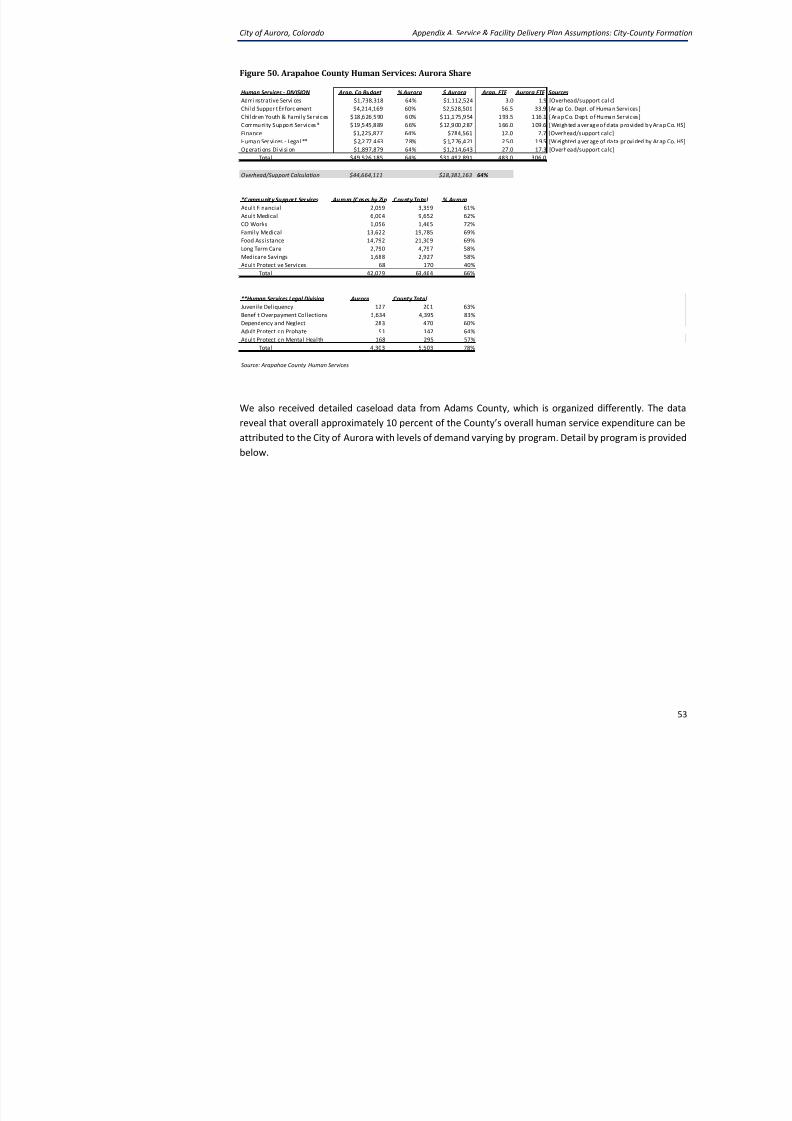
Another area for discussion and refinement if City-County formation is pursued is on fu
service and needs due to changing demographics and income levels. For instance, caseloa
at a higher rate than the general population in Arapahoe County. While growth in case
always equate to a growth in local budget requirements, the expectation for future levels
be established at the front-end of the process and therefore considering several alternscenarios during the next phases will assist in long-term planning.
Community Resources
The Feasibility Study assumes the City-County of Aurora is a separate Workforce region. H
not guaranteed unless population is above 500,000. That said, the assumption in the aintergovernmental revenues offset expenditures, so there is a neutral fiscal impact.
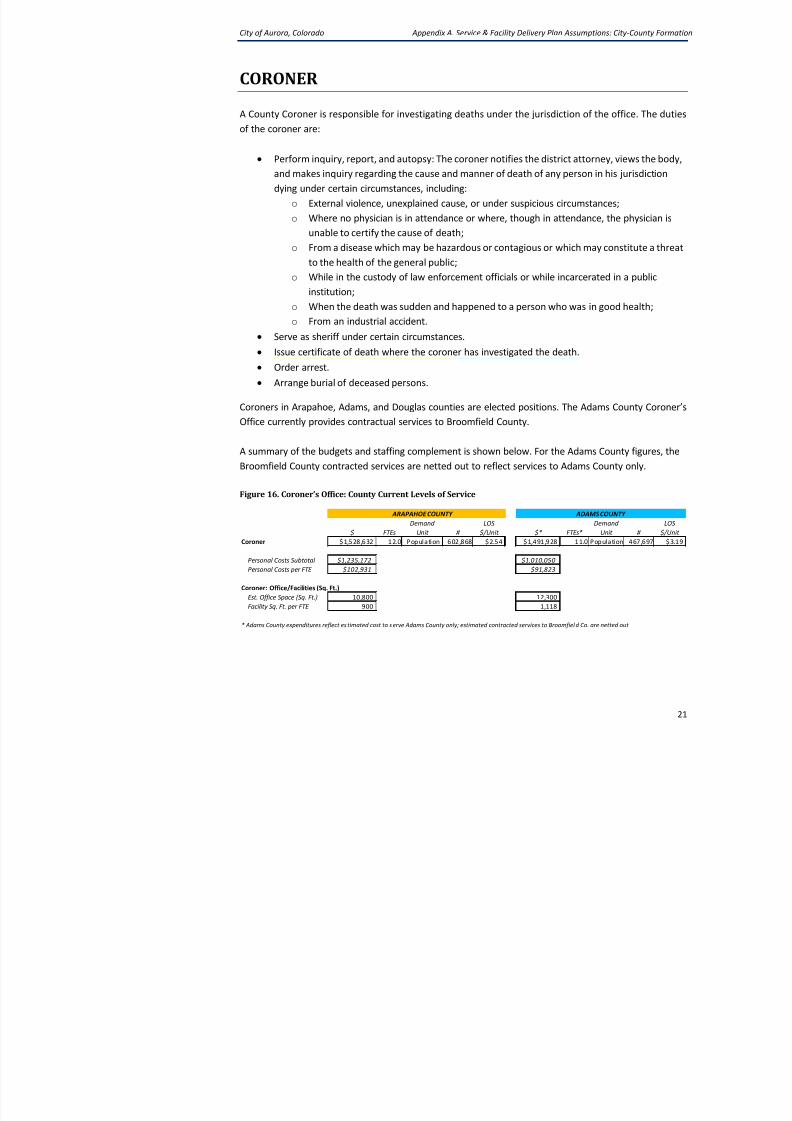
Existing County Debt
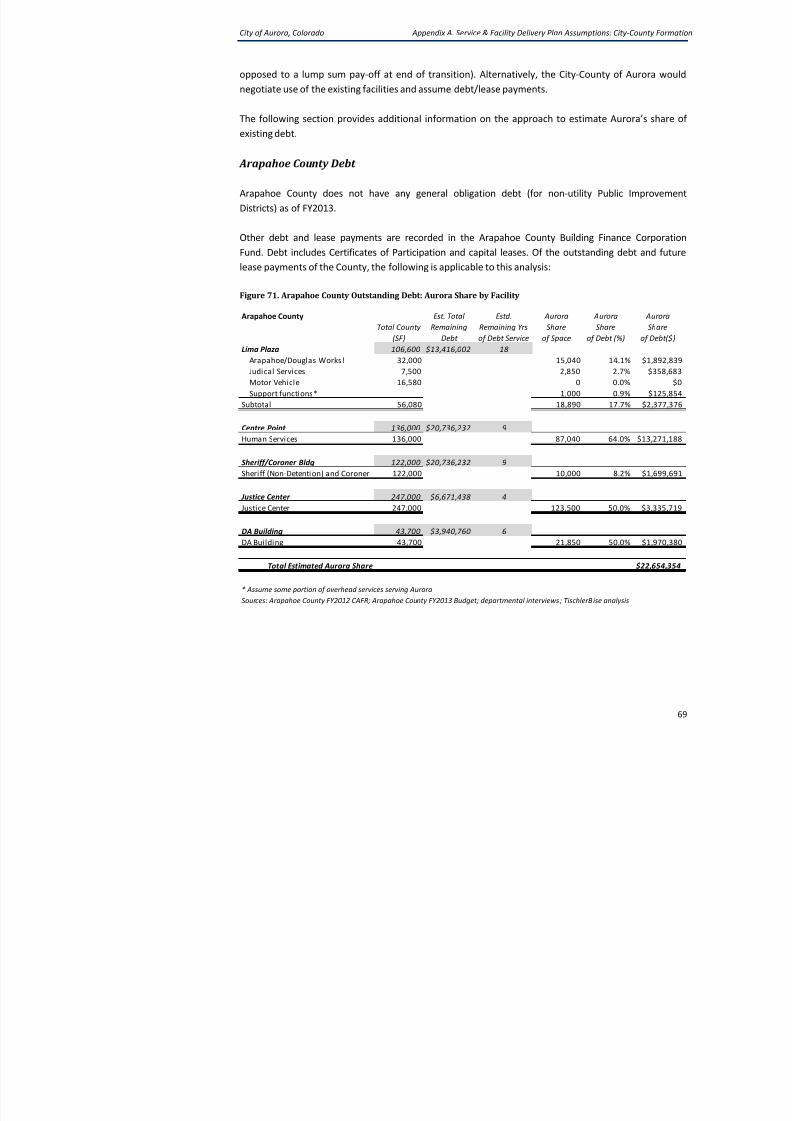
As discussed in the Service Plan, Arapahoe and Adams Counties have existing debt/lease
facilities that currently serve Aurora. The City-County would be obligated per State law proportionate share of existing County general obligation debt . However, none of the thre
any outstanding general obligation debt. Although there is no applicable general obligat
possibility is that the City-County of Aurora would pay its fair share of annual debt se
payments) (incurred by a certain date) for the proportion of the facility serving the City
City of Aurora, Colorado Fiscal Feasibility Study: City-
8/12/2019 Fiscal Feasibility Study: Formation of City-County of Aurora
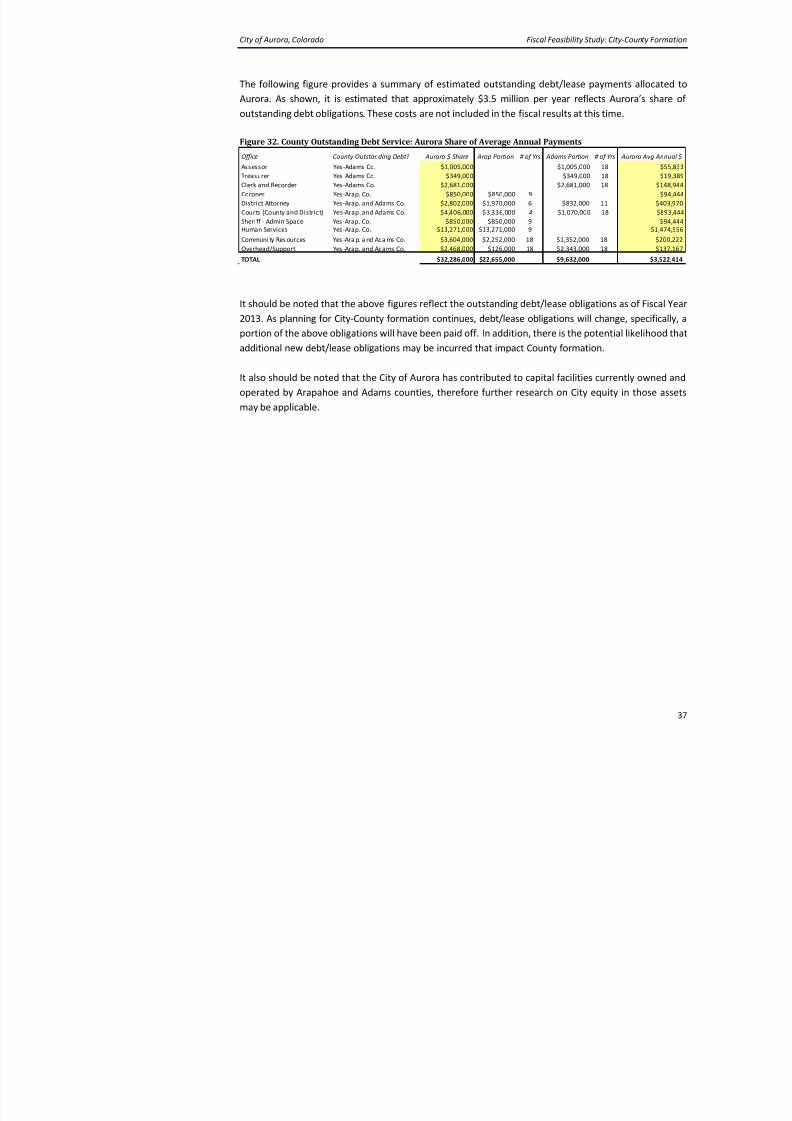
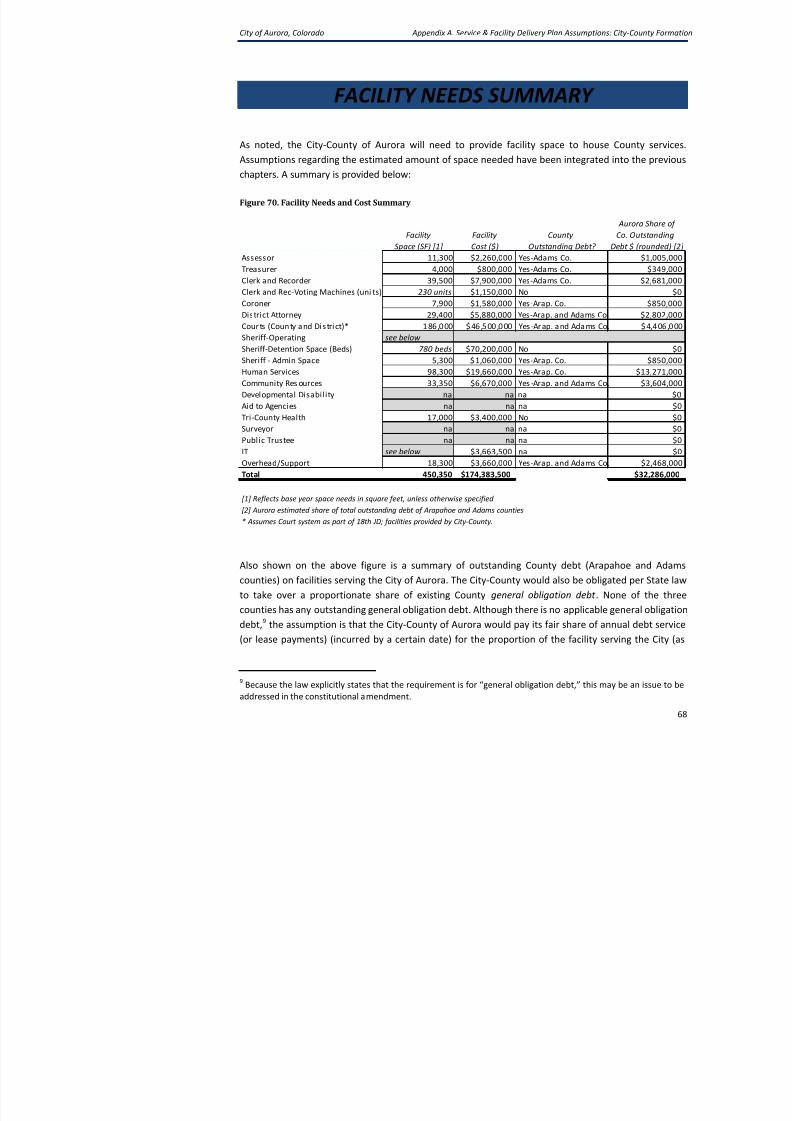
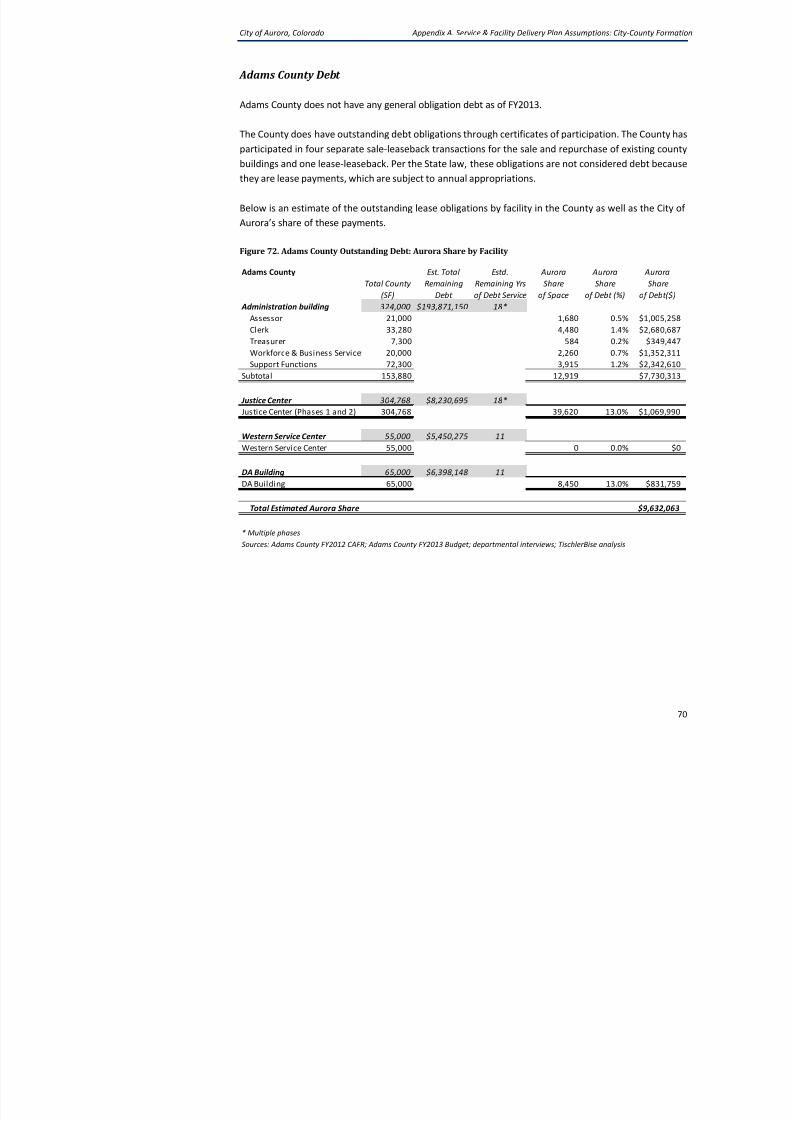
The following figure provides a summary of estimated outstanding debt/lease paymen
Aurora. As shown, it is estimated that approximately $3.5 million per year reflects Aur
outstanding debt obligations. These costs are not included in the fiscal results at this time.
Figure 32. County Outstanding Debt Service: Aurora Share of Average Annual Payments
It should be noted that the above figures reflect the outstanding debt/lease obligations a
2013. As planning for City-County formation continues, debt/lease obligations will changeportion of the above obligations will have been paid off. In addition, there is the potential
additional new debt/lease obligations may be incurred that impact County formation.
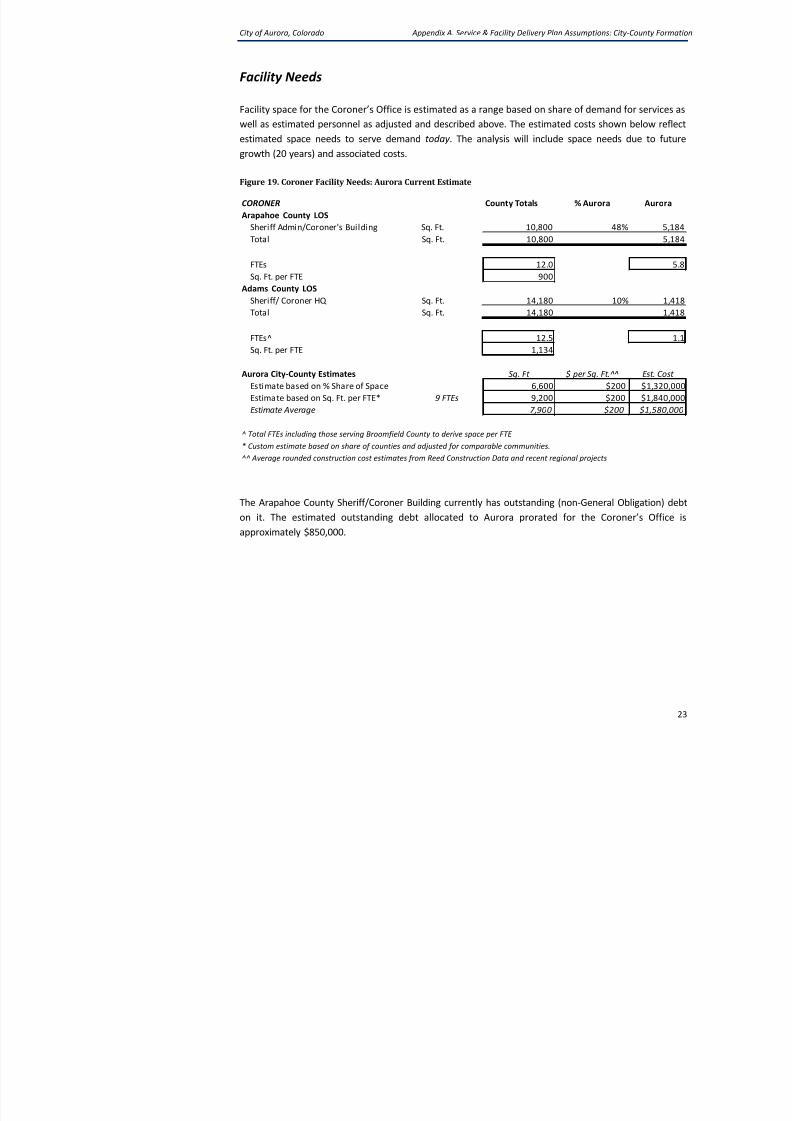
It also should be noted that the City of Aurora has contributed to capital facilities curren
operated by Arapahoe and Adams counties, therefore further research on City equity i
may be applicable.
Office County Outstanding Debt? Aurora $ Share Arap Portion # of Yrs Adams Portion # of Yrs A
Assessor Yes-Adams Co. $1,005,000 $1,005,000 18
Treasurer Yes-Adams Co. $349,000 $349,000 18
Clerk and Recorder Yes-Adams Co. $2,681,000 $2,681,000 18
Coroner Yes-Arap. Co. $850,000 $850,000 9
District Attorney Yes-Arap. and Adams Co. $2,802,000 $1,970,000 6 $832,000 11
Courts (County and District) Yes-Arap. and Adams Co. $4,406,000 $3,336,000 4 $1,070,000 18
Sheriff - Admin Space Yes-Arap. Co. $850,000 $850,000 9 Human Services Yes-Arap. Co. $13,271,000 $13,271,000 9
Communi ty Res ources Yes -Ara p. a nd Ada ms Co. $3,604,000 $2,252,000 18 $1,352,000 18
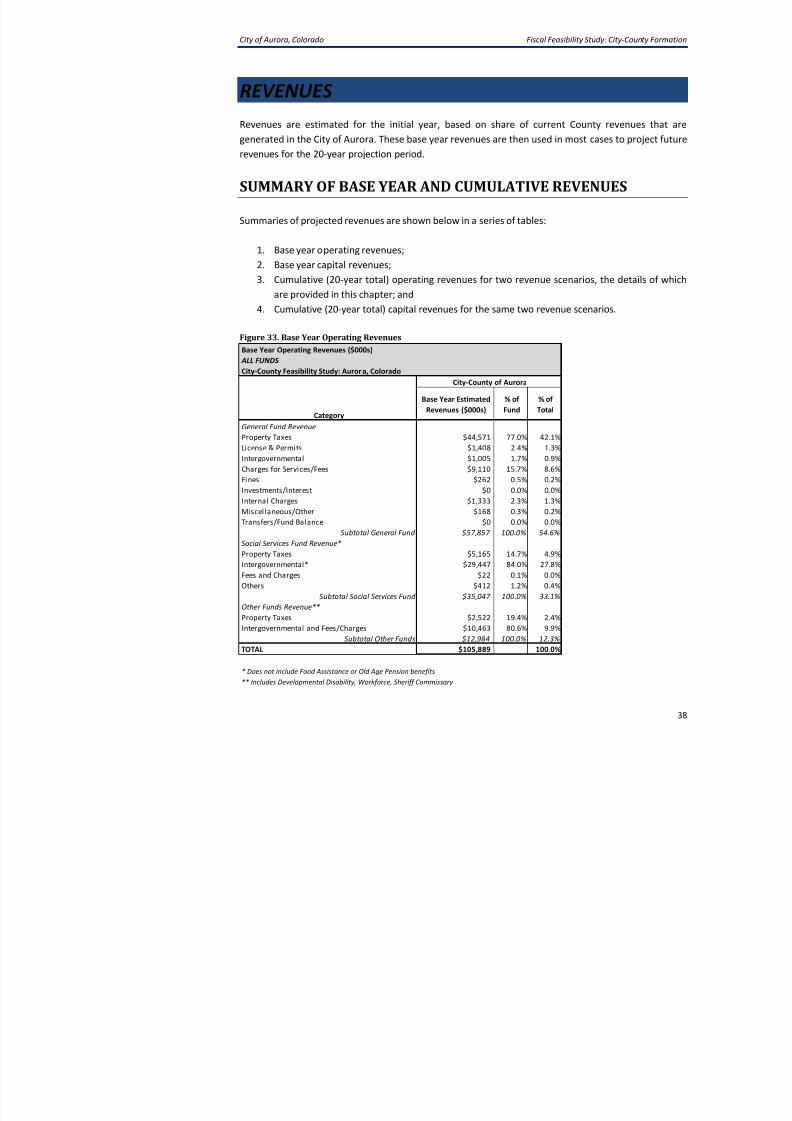
As shown, property taxes comprise 77 percent of the General Fund revenue sources
combined, property taxes are approximately 50 percent of the total. The next largest sou
in the General Fund is Charges for Services. In the Social Services Fund, intergovernmemake up 84 percent of the fund (which excludes pass-through funds for Food Assista
funded) and Old Age Pension (state funded)).
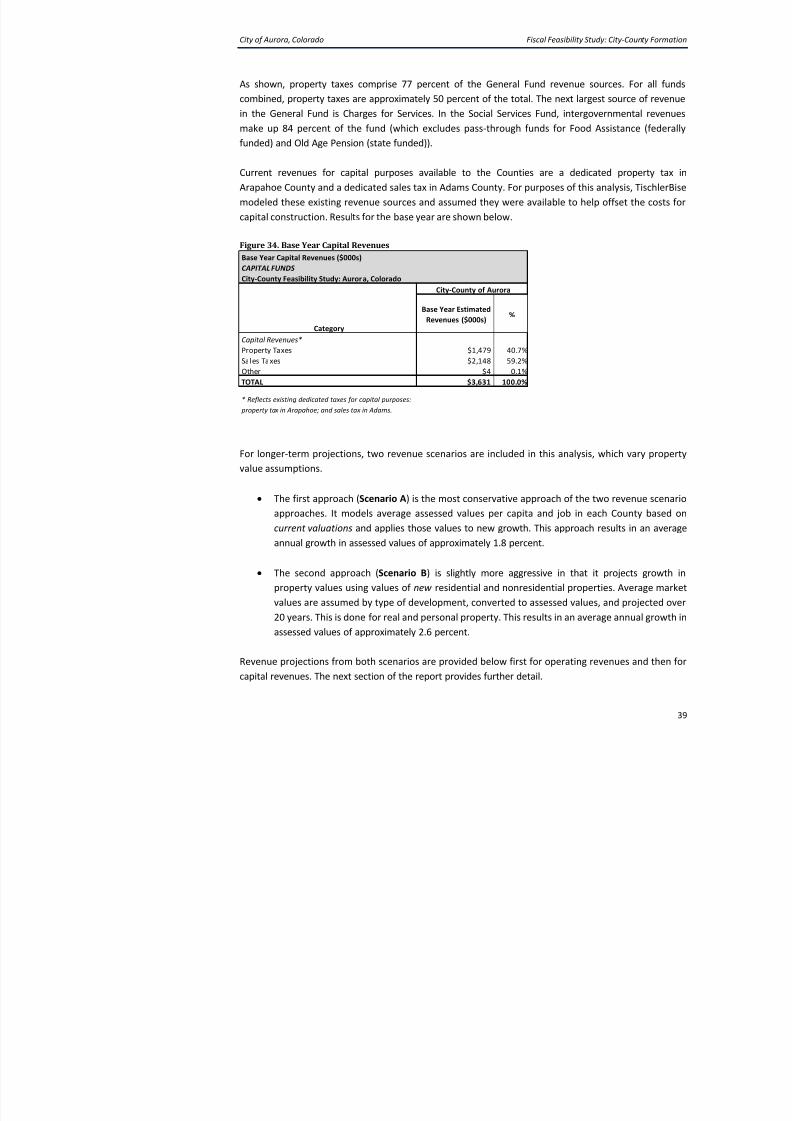
Current revenues for capital purposes available to the Counties are a dedicated p
Arapahoe County and a dedicated sales tax in Adams County. For purposes of this analys
modeled these existing revenue sources and assumed they were available to help offse
capital construction. Results for the base year are shown below.
Figure 34. Base Year Capital Revenues
For longer-term projections, two revenue scenarios are included in this analysis, which
value assumptions.
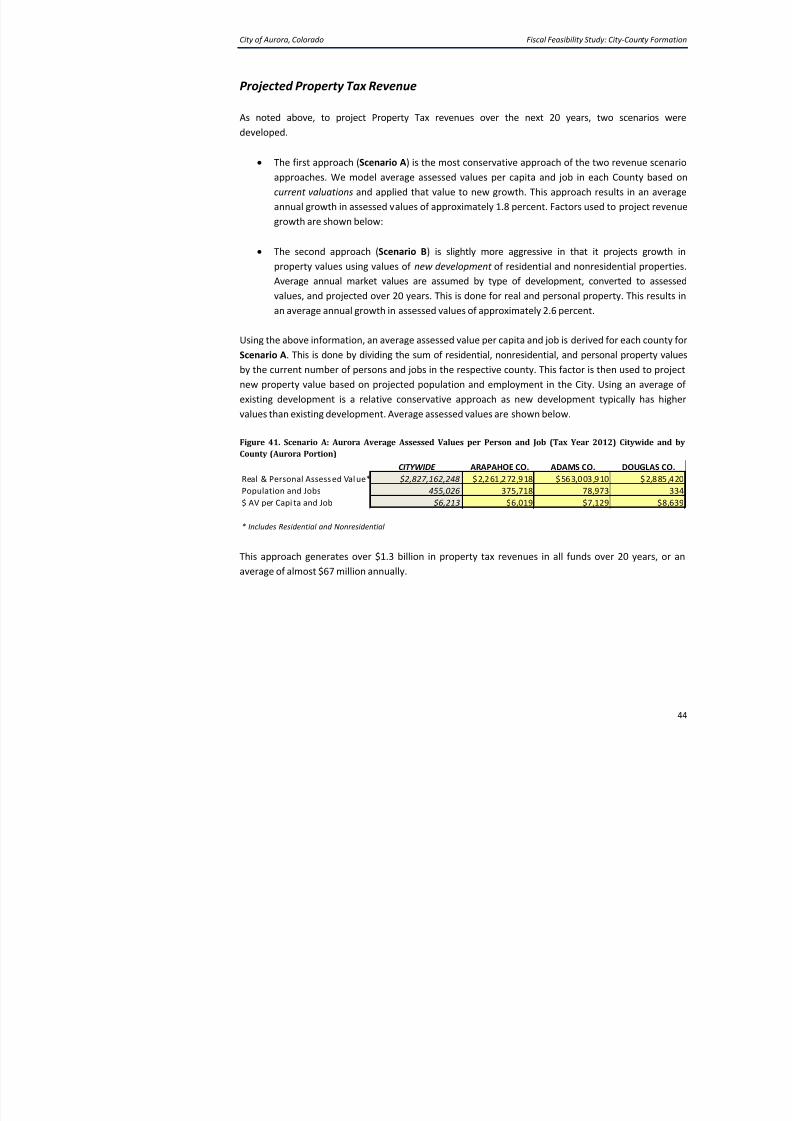
• The first approach (Scenario A) is the most conservative approach of the two rev
approaches. It models average assessed values per capita and job in each Co
current valuations and applies those values to new growth. This approach results
annual growth in assessed values of approximately 1.8 percent.
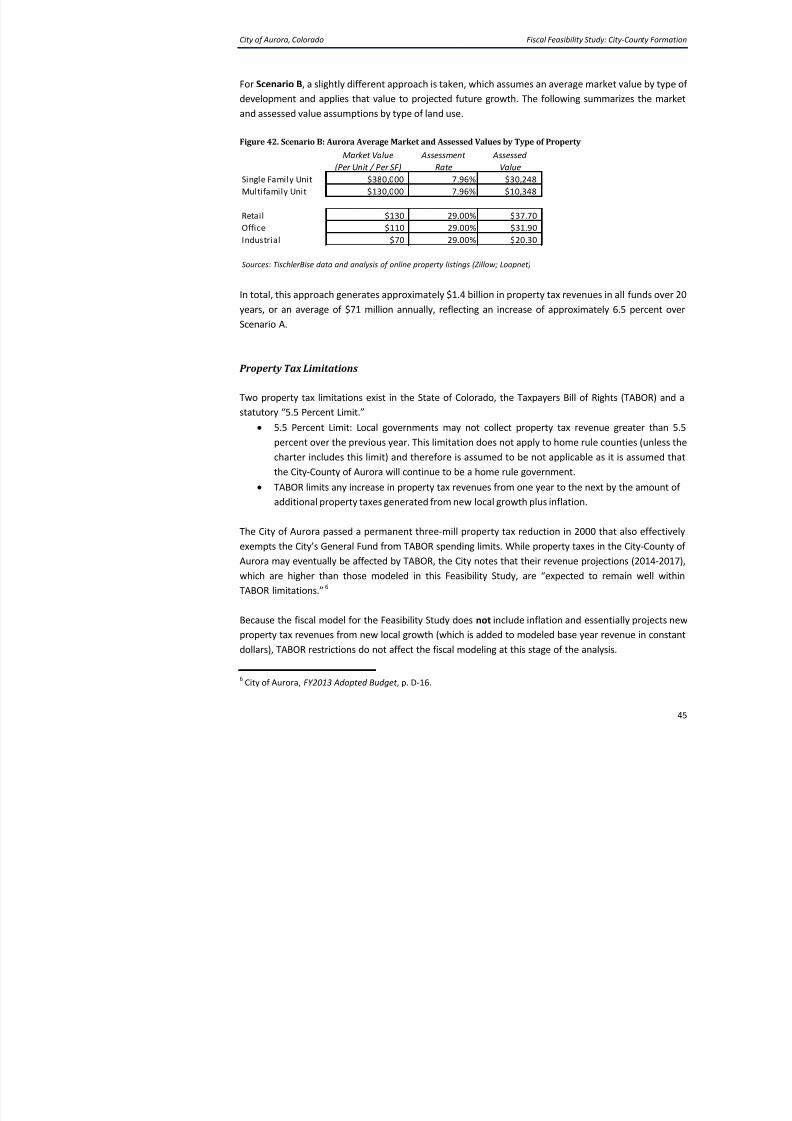
• The second approach (Scenario B) is slightly more aggressive in that it proje
t l i l f id ti l d id ti l ti A
Base Year Capital Revenues ($000s)
CAPITAL FUNDS
City-County Feasibility Study: Aurora, Colorado
City-County of Aurora
Category
Capital Revenues*
Property Taxes $1,479 40.7%
Sales Taxes $2,148 59.2%
Other $4 0.1%
TOTAL $3,631 100.0%
* Reflects existing dedicated taxes for capital purposes:
property tax in Arapahoe; and sales tax in Adams.
Base Year Estimated
Revenues ($000s)%
City of Aurora, Colorado Fiscal Feasibility Study: City-
8/12/2019 Fiscal Feasibility Study: Formation of City-County of Aurora
The majority of County revenues are generated from property taxes. Within the Gene
estimated that approximately 77 percent of the funding would be from property
considering all funds together, including the Social Service Fund, the share from pro
approximately 50 percent.
Base year property values by County for the City of Aurora are shown below:
Figure 37. Aurora Assessed Values (Tax Year 2012): Citywide and by County (Aurora Portion)
Base Year Property Tax Revenue
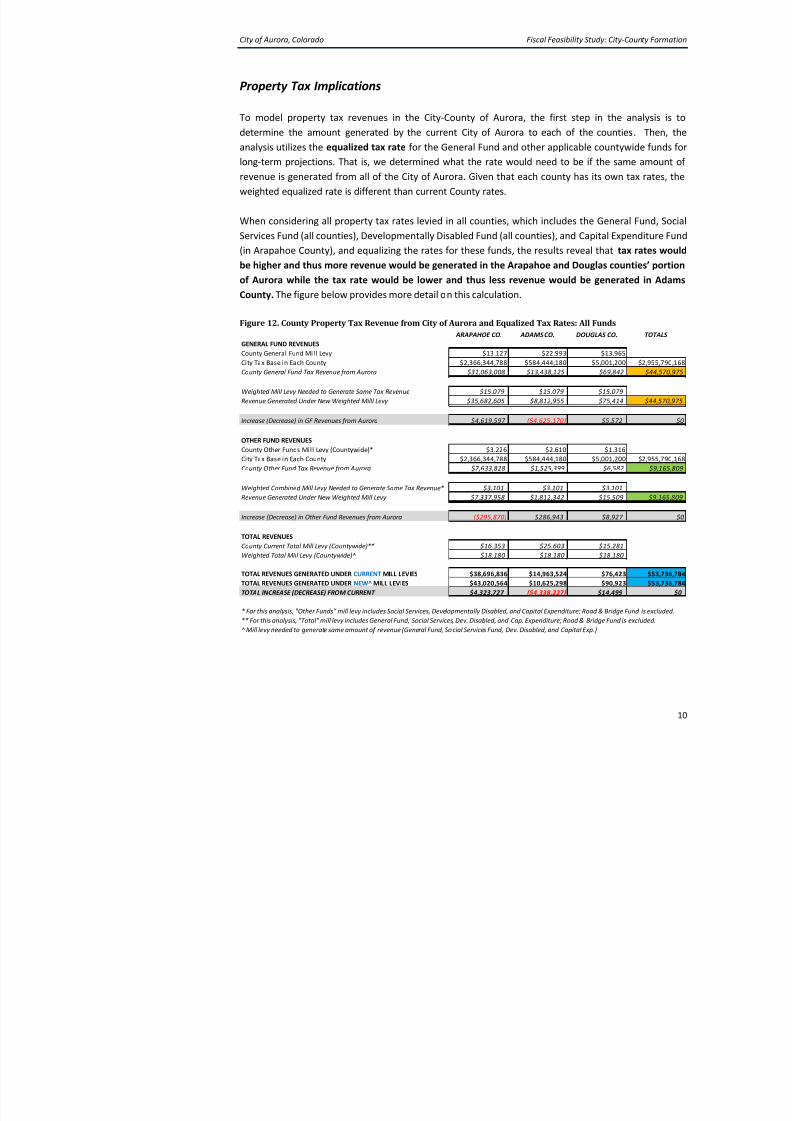
To model property tax revenues in the City-County of Aurora, the first step is to determi
of property tax revenue generated by the current City of Aurora to each of the counties. T
base-year revenue generated from the City of Aurora and is used in the model as base ye
revenues reflecting “new” County revenue.
Then, for future years in the projection, the model uses the equalized mill levy (propert
the General Fund and other applicable countywide funds. That is, we determined whawould need to be if the same amount of revenue is generated from all of the City of Auro
each county has its own mill levies, the weighted equalized mill levy is different than c
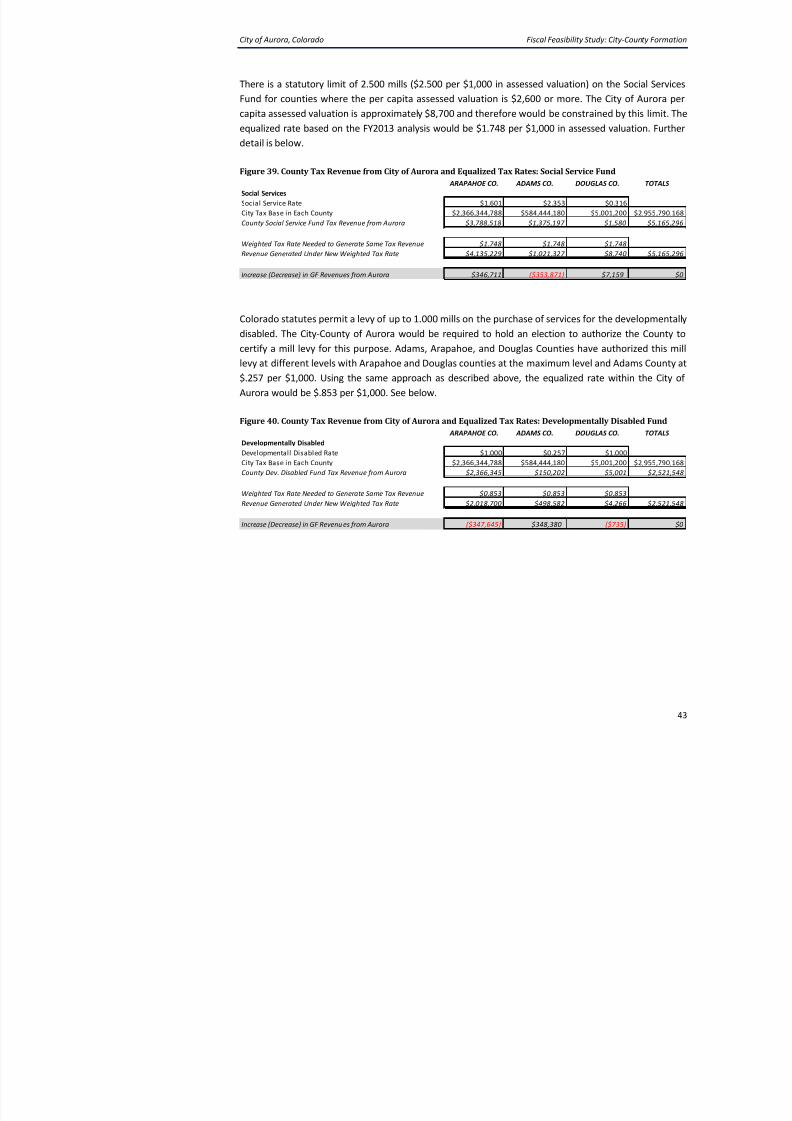
There is a statutory limit of 2.500 mills ($2.500 per $1,000 in assessed valuation) on the
Fund for counties where the per capita assessed valuation is $2,600 or more. The City
capita assessed valuation is approximately $8,700 and therefore would be constrained byequalized rate based on the FY2013 analysis would be $1.748 per $1,000 in assessed valu
detail is below.
Figure 39. County Tax Revenue from City of Aurora and Equalized Tax Rates: Social Service Fund
Colorado statutes permit a levy of up to 1.000 mills on the purchase of services for the dedisabled. The City-County of Aurora would be required to hold an election to authorize
certify a mill levy for this purpose. Adams, Arapahoe, and Douglas Counties have autho
levy at different levels with Arapahoe and Douglas counties at the maximum level and Ad
$.257 per $1,000. Using the same approach as described above, the equalized rate wit
Aurora would be $.853 per $1,000. See below.
Figure 40. County Tax Revenue from City of Aurora and Equalized Tax Rates: Developmentally Dis
ARAPAHOE CO. ADAMS CO. DOUGLAS CO.
Social Services
Social Service Rate $1.601 $2.353 $0.31
City Tax Base in Each County $2,366,344,788 $584,444,180 $5,001,20
County Social Service Fund Tax Revenue from Aurora $3,788,518 $1,375,197 $1,580
Weighted Tax Rate Needed to Generate Same Tax Revenue $1.748 $1.748 $1.748
Revenue Generated Under New Weighted Tax Rate $4,135,229 $1,021,327 $8,740
Increase (Decrease) in GF Revenues from Aurora $346,711 ($353,871) $7,159
ARAPAHOE CO. ADAMS CO. DOUGLAS CO.
Developmentally Disabled
Developmentall Disabled Rate $1.000 $0.257 $1.00
City Tax Base in Each County $2,366,344,788 $584,444,180 $5,001,20
County Dev. Disabled Fund Tax Revenue from Aurora $2,366,345 $150,202 $5,001
Weighted Tax Rate Needed to Generate Same Tax Revenue $0.853 $0.853 $0.853
Revenue Generated Under New Weighted Tax Rate $2,018,700 $498,582 $4,266
Increase (Decrease) in GF Revenu es from Aurora ($347,645) $348,380 ($735
City of Aurora, Colorado Fiscal Feasibility Study: City-
8/12/2019 Fiscal Feasibility Study: Formation of City-County of Aurora
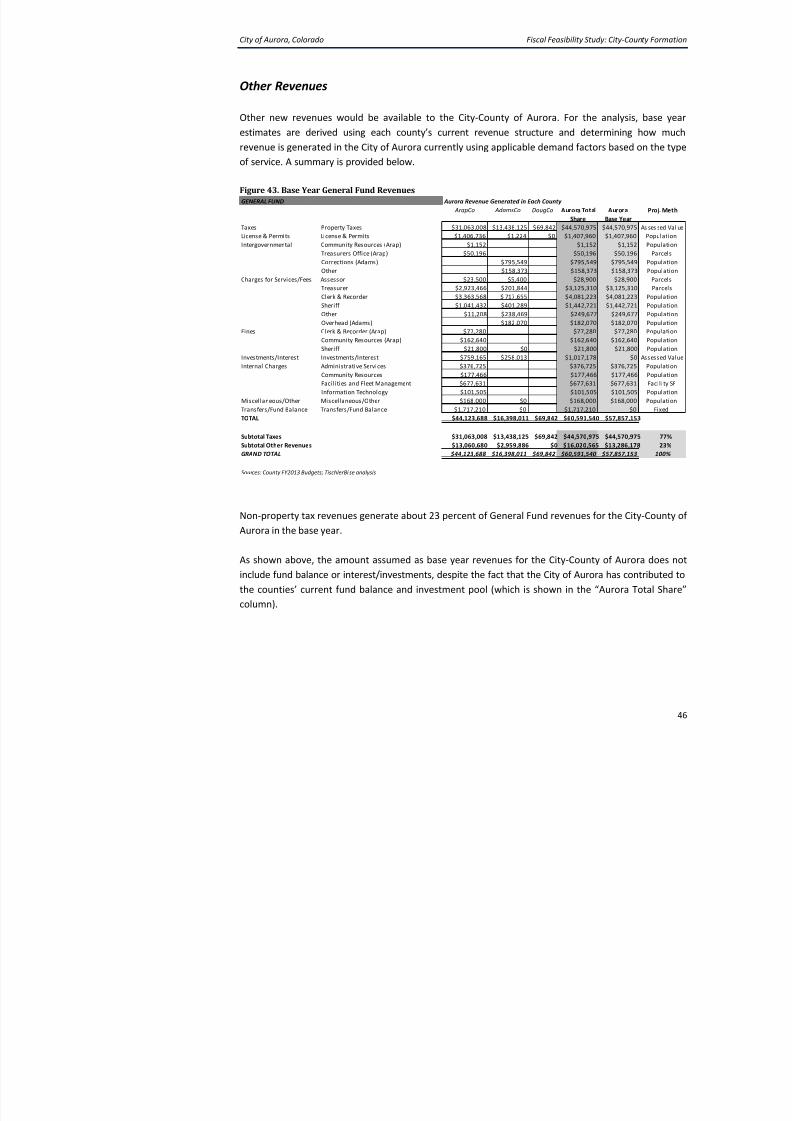
Other new revenues would be available to the City-County of Aurora. For the analyestimates are derived using each county’s current revenue structure and determini
revenue is generated in the City of Aurora currently using applicable demand factors bas
of service. A summary is provided below.
Figure 43. Base Year General Fund Revenues
Non-property tax revenues generate about 23 percent of General Fund revenues for the
Aurora in the base year.
As shown above, the amount assumed as base year revenues for the City-County of Au
include fund balance or interest/investments, despite the fact that the City of Aurora has
GENERAL FUND Aurora Revenue Generated in Each County
ArapCo AdamsCo DougCo Aurora Total Auror
Share Base YTaxes Property Taxes $31,063,008 $13,438,125 $69,842 $44,570,975 $44,570
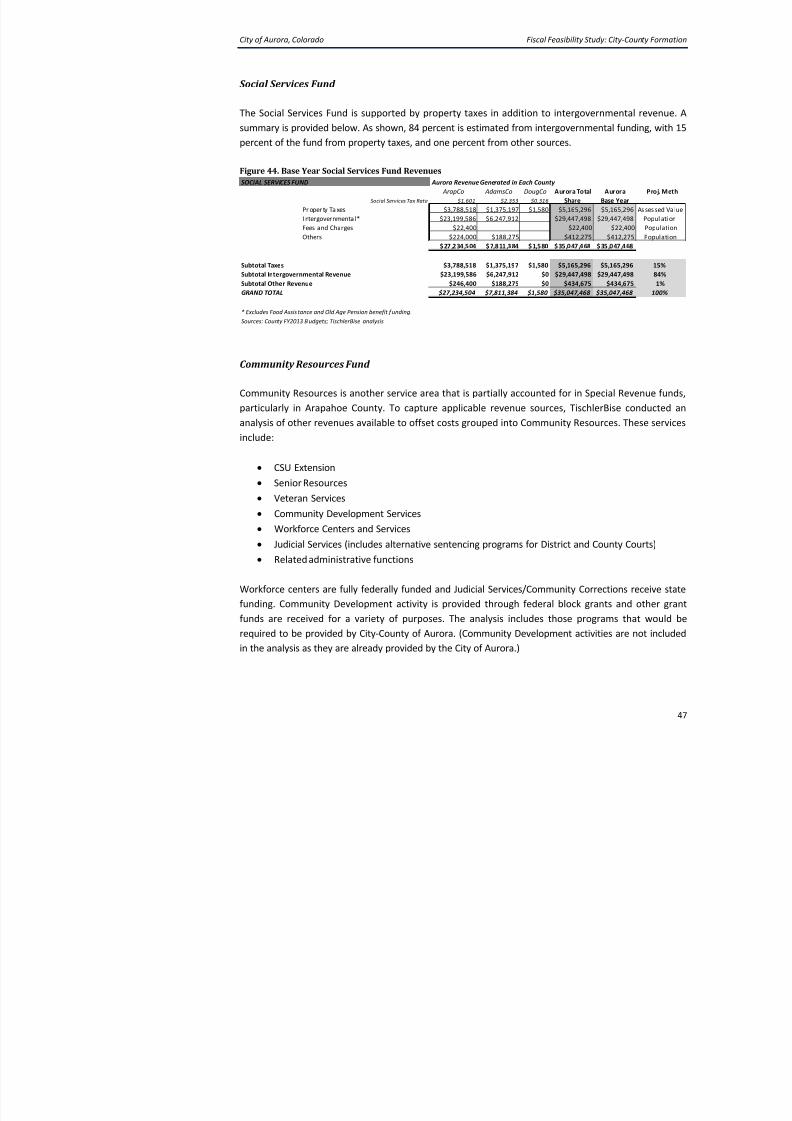
The Social Services Fund is supported by property taxes in addition to intergovernmensummary is provided below. As shown, 84 percent is estimated from intergovernmental fu
percent of the fund from property taxes, and one percent from other sources.
Figure 44. Base Year Social Services Fund Revenues
Community Resources Fund
Community Resources is another service area that is partially accounted for in Special R
particularly in Arapahoe County. To capture applicable revenue sources, TischlerBise
analysis of other revenues available to offset costs grouped into Community Resources. include:
• CSU Extension
• Senior Resources
• Veteran Services
• Community Development Services
• Workforce Centers and Services• Judicial Services (includes alternative sentencing programs for District and County
• Related administrative functions
/
SOCIAL SERVICES FUND Aurora Revenue Generated in Each County
ArapCo AdamsCo DougCo Aurora Total Aurora
Social Services Tax Rate $1.601 $2.353 $0.316 Share Base Ye
Pr oper ty Ta xes $3,788,518 $1,375,197 $1,580 $5,165,296 $5,165
I ntergovernmenta l* $23,199,586 $6,247,912 $29,447,498 $29,447Fees and Charges $22,400 $22,400 $22
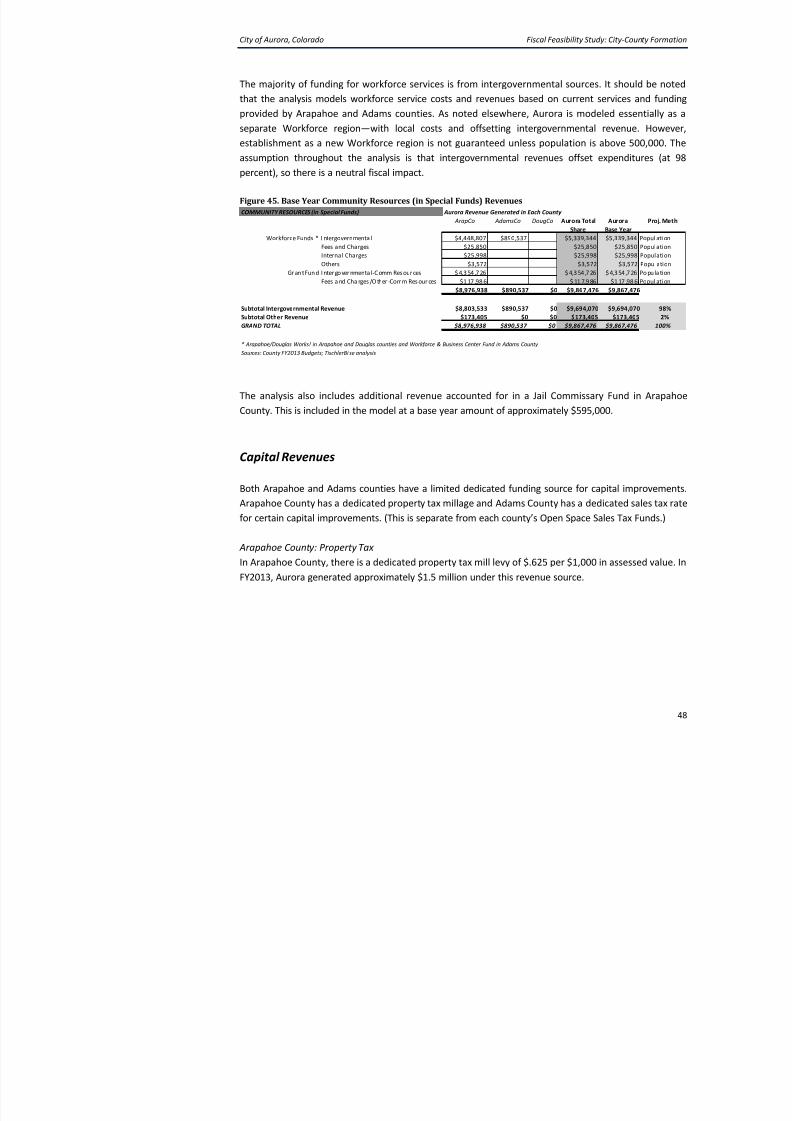
The majority of funding for workforce services is from intergovernmental sources. It sh
that the analysis models workforce service costs and revenues based on current service
provided by Arapahoe and Adams counties. As noted elsewhere, Aurora is modeled eseparate Workforce region—with local costs and offsetting intergovernmental reven
establishment as a new Workforce region is not guaranteed unless population is above
assumption throughout the analysis is that intergovernmental revenues offset expen
percent), so there is a neutral fiscal impact.
Figure 45. Base Year Community Resources (in Special Funds) Revenues
The analysis also includes additional revenue accounted for in a Jail Commissary Fun
County. This is included in the model at a base year amount of approximately $595,000.
Capital Revenues
Both Arapahoe and Adams counties have a limited dedicated funding source for capital
Arapahoe County has a dedicated property tax millage and Adams County has a dedicate
for certain capital improvements. (This is separate from each county’s Open Space Sales T
Arapahoe County: Property Tax
In Arapahoe County, there is a dedicated property tax mill levy of $.625 per $1,000 in ass
FY2013, Aurora generated approximately $1.5 million under this revenue source.
COMMUNITY RESOURCES (in Special Funds) Aurora Revenue Generated in Each County
ArapCo AdamsCo DougCo Aurora Total AurorShare Base Y
Workforce Funds * I ntergovernmenta l $4,448,807 $890,537 $5,339,344 $5,339
Fees and Charges $25,850 $25,850 $25
Internal Charges $25,998 $25,998 $25
Others $3,572 $3,572 $3
Gr an t Fun d I nter go ver nmenta l-Comm Res our ces $ 4,3 54 ,7 26 $ 4,3 54 ,7 26 $ 4,3 54
Fees a nd Cha rges /O ther -Comm Res our ces $1 17 ,98 6 $ 11 7,9 86 $1 17
The City and County of Broomfield has a Street Fund mill levy as part of its City budge
have a separate Road and Bridge Fund as part of its County budget. The City of Au
currently have a mill levy in a separate Street Fund or Road and Bridge Fund. To make ulost from conversion to a City-County, a new dedicated tax would need to be implemented
Open Space Funding: Dedicated Sales Taxes
Both Arapahoe and Adams counties have a dedicated sales tax for Open Space purposes
and usage limitations vary by county, but the City receives funding from each county from
• Arapahoe County: The voter-approved Open Space sales tax rate is .25%. Jurisdict
County receive 50 percent of the funds collected in the County based on share
with a portion of the remaining funds available for grants in special districts an
municipalities. The City of Aurora has received approximately 56 percent of
distributed to municipalities over a nine-year period from 2004 to 2012 ($42 m
total $75 million).8
• Adams County: The voter-approved Open Space sales tax rate is .25%. It is auth
2026. Jurisdictions receive 30 percent of the funds generated and is distributed
location where the tax was generated. The remaining funds are distribut
competitive grant program (68% of the funds) and 2 percent is for administration c
Based on estimated share of sales tax generated in Aurora in each County, it is estimate
contributes approximately $9 to $10 million annually to both Open Space Sales Tax Fundthe same time, the City of Aurora receives approximately $6 million in revenues annu
counties combined, although this figure may vary depending on the awarding of grants f
This revenue source is anticipated to grow in the short-term at an annual rate of 2.5 perc
can generally be used for park land acquisitions and improvements, construction, main
some limitations), and patrol costs for parks and open space.
Because these taxes are County taxes that were approved by voters in each respective clegal analysis would need to be conducted to determine the process to continue this ta
County of Aurora.
City of Aurora, Colorado Fiscal Feasibility Study: City-
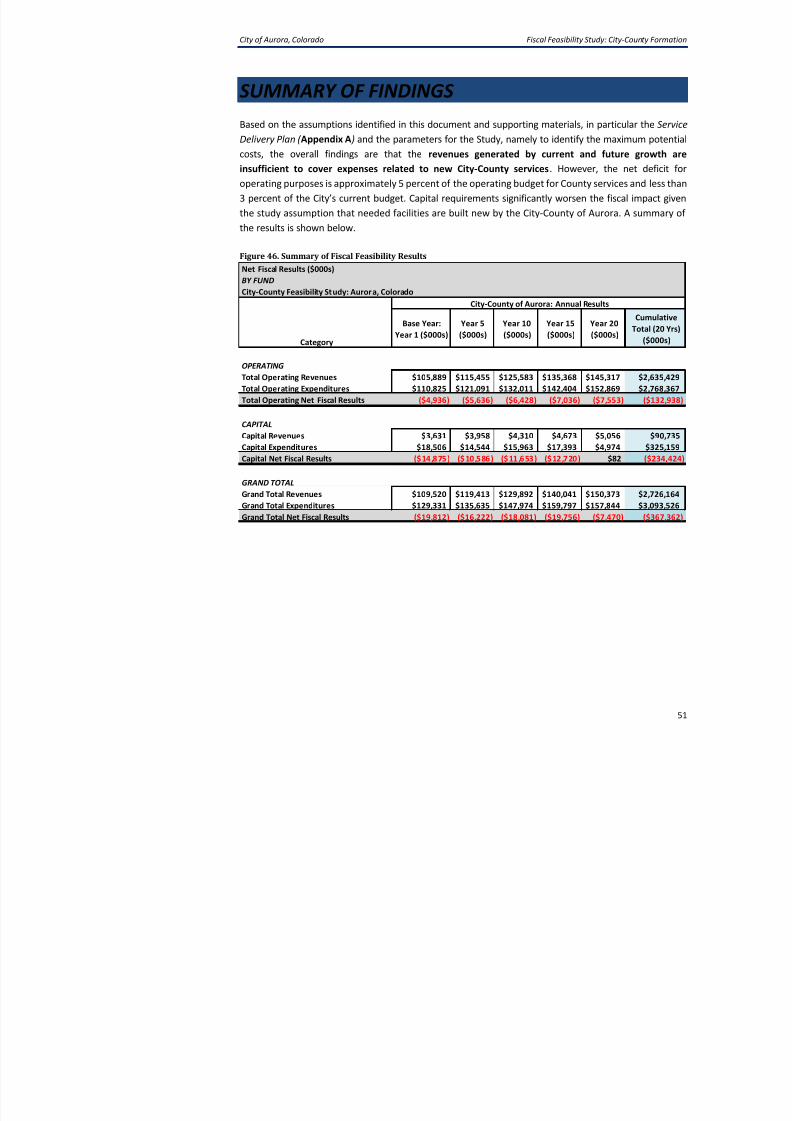
SUMMARY OF FINDINGS
8/12/2019 Fiscal Feasibility Study: Formation of City-County of Aurora
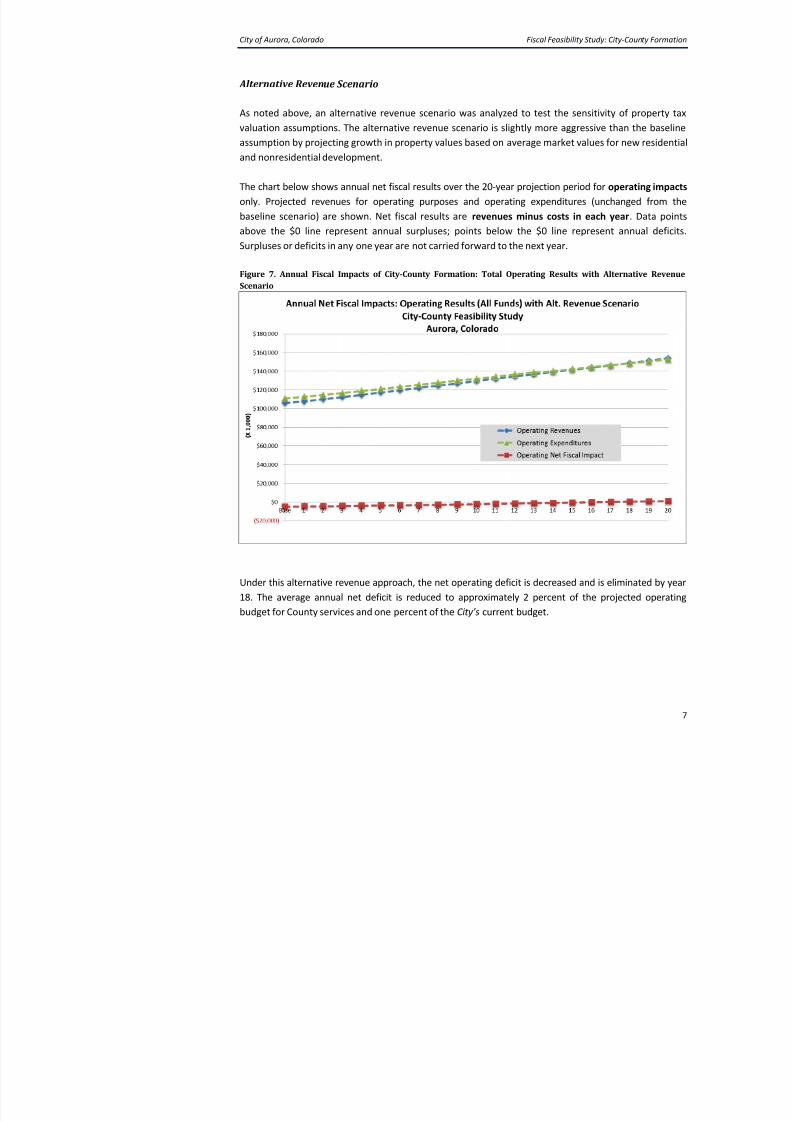
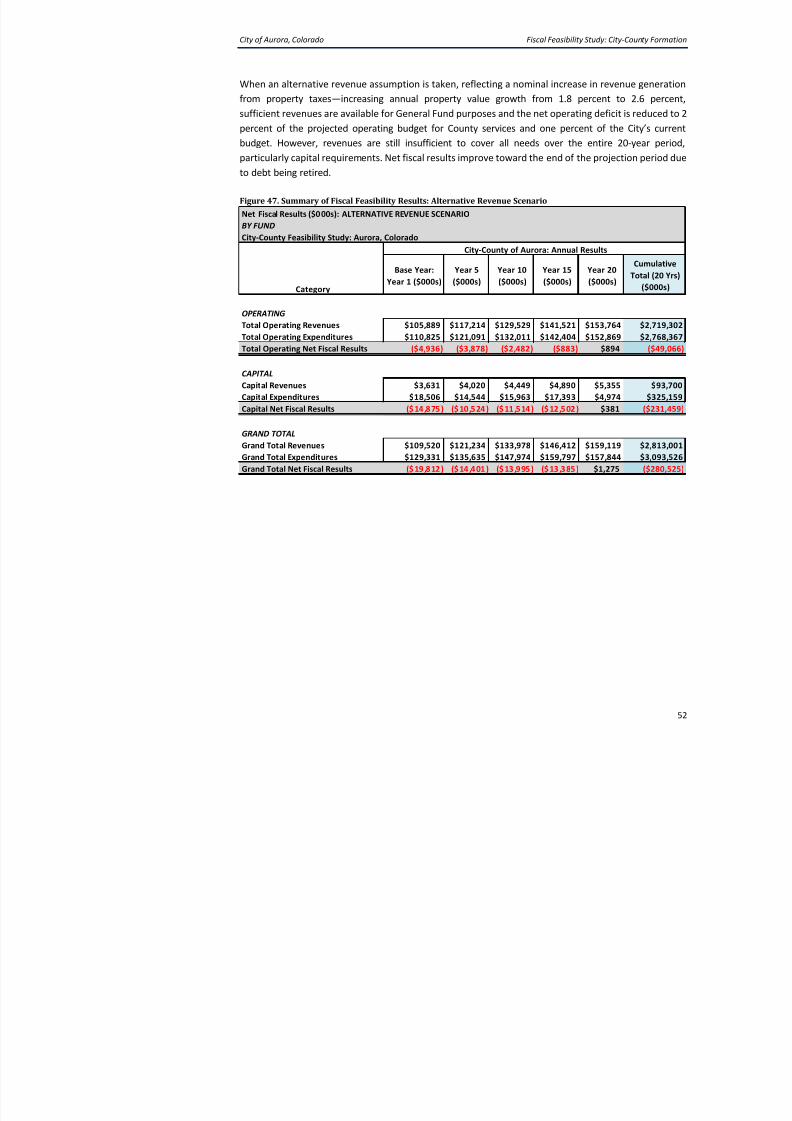
from property taxes—increasing annual property value growth from 1.8 percent to
sufficient revenues are available for General Fund purposes and the net operating deficit percent of the projected operating budget for County services and one percent of the
budget. However, revenues are still insufficient to cover all needs over the entire 2
particularly capital requirements. Net fiscal results improve toward the end of the project
to debt being retired.
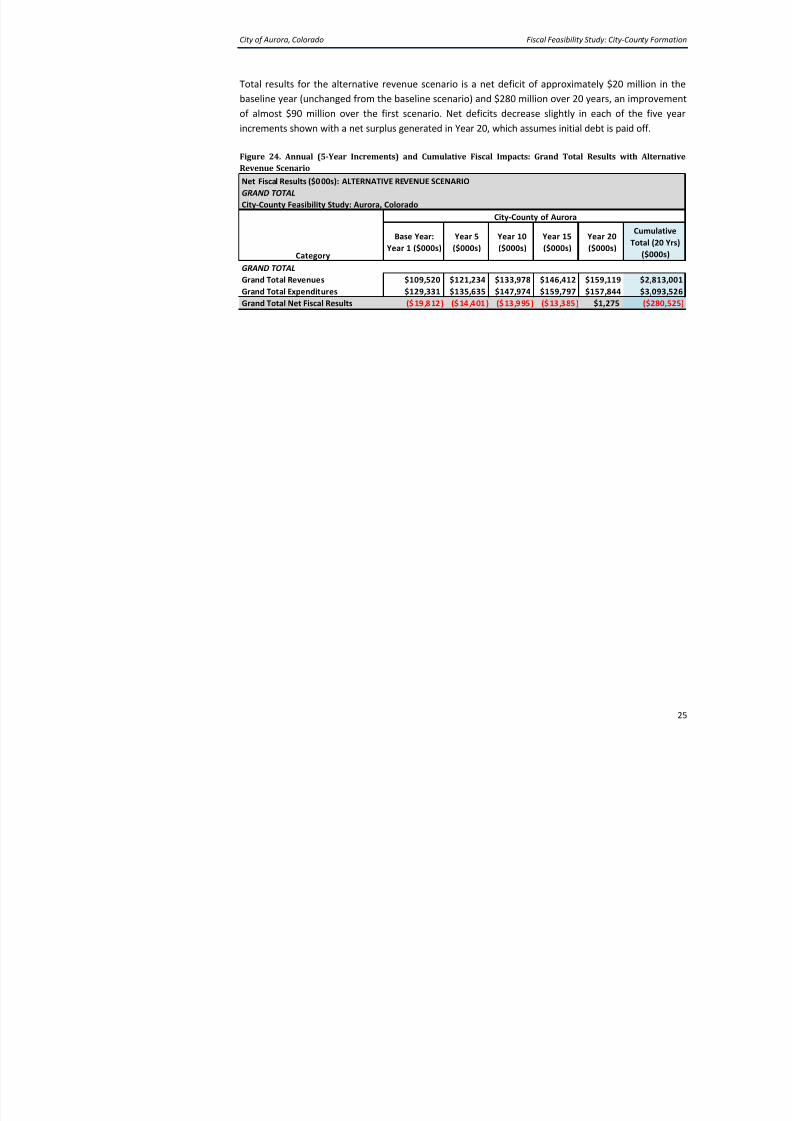
Figure 47. Summary of Fiscal Feasibility Results: Alternative Revenue Scenario
Net Fiscal Results ($000s): ALTERNATIVE REVENUE SCENARIO
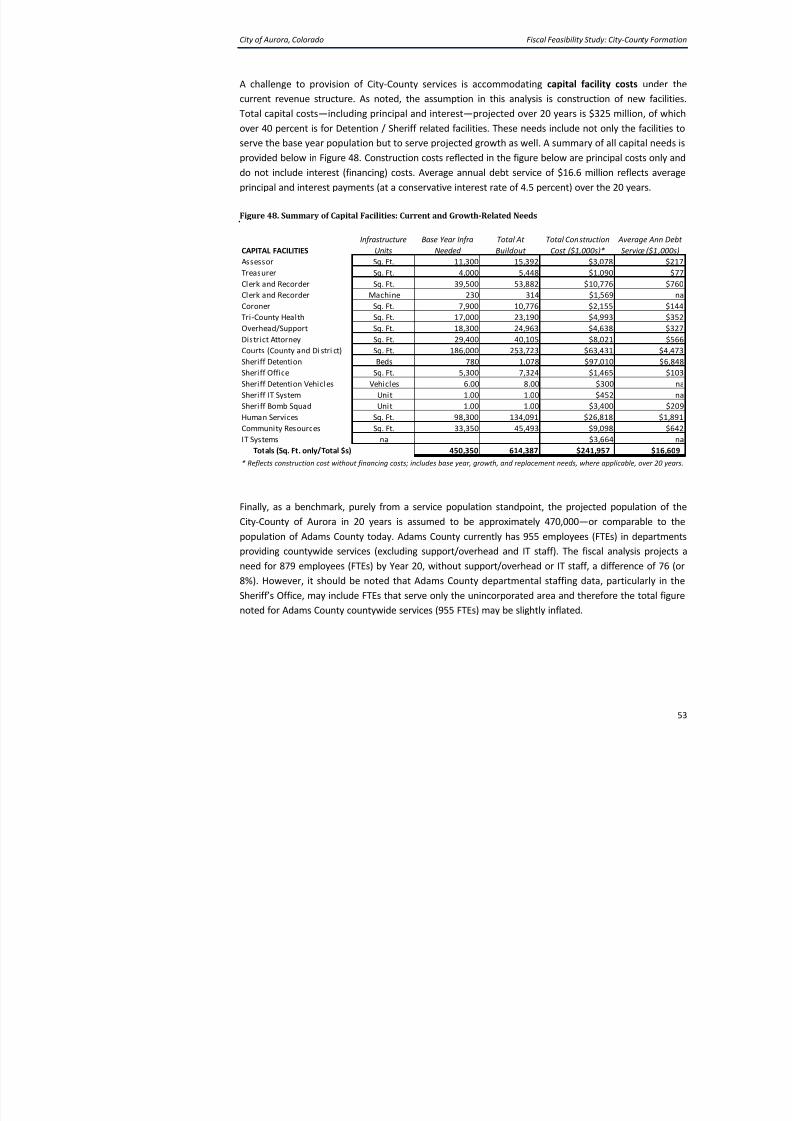
current revenue structure. As noted, the assumption in this analysis is construction of
Total capital costs—including principal and interest—projected over 20 years is $325 mover 40 percent is for Detention / Sheriff related facilities. These needs include not only t
serve the base year population but to serve projected growth as well. A summary of all c
provided below in Figure 48. Construction costs reflected in the figure below are principal
do not include interest (financing) costs. Average annual debt service of $16.6 million re
principal and interest payments (at a conservative interest rate of 4.5 percent) over the 20
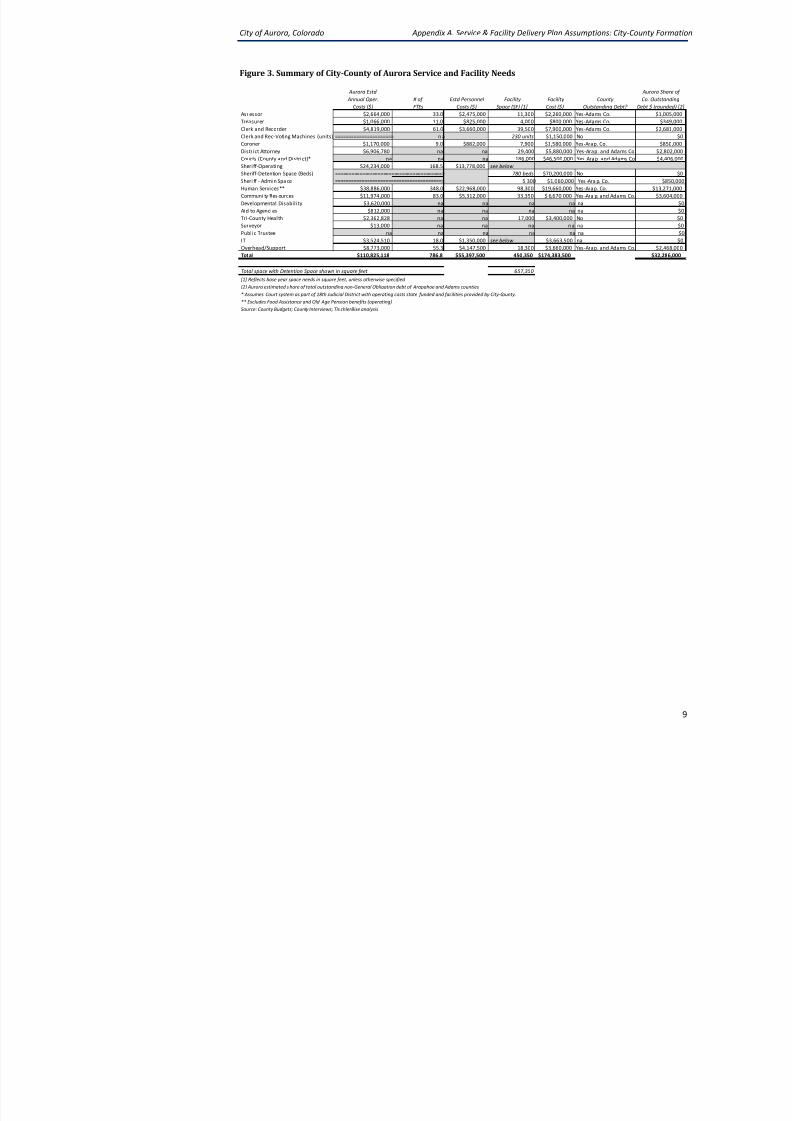
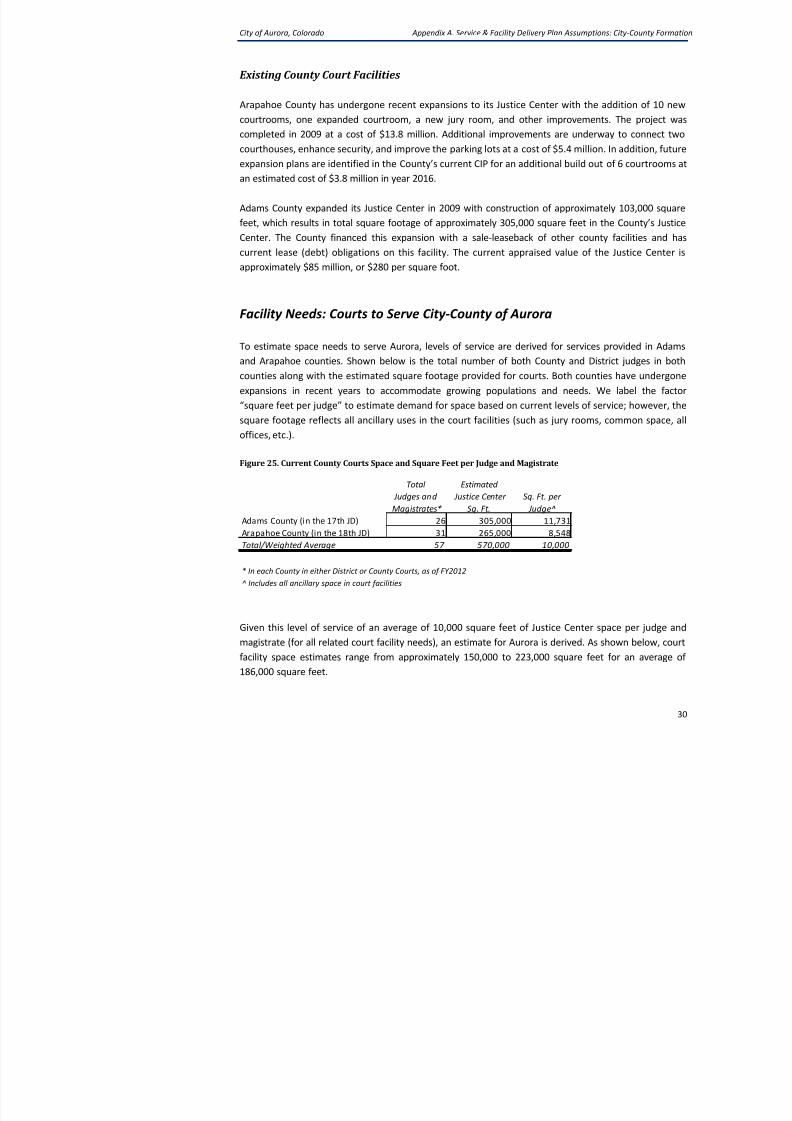
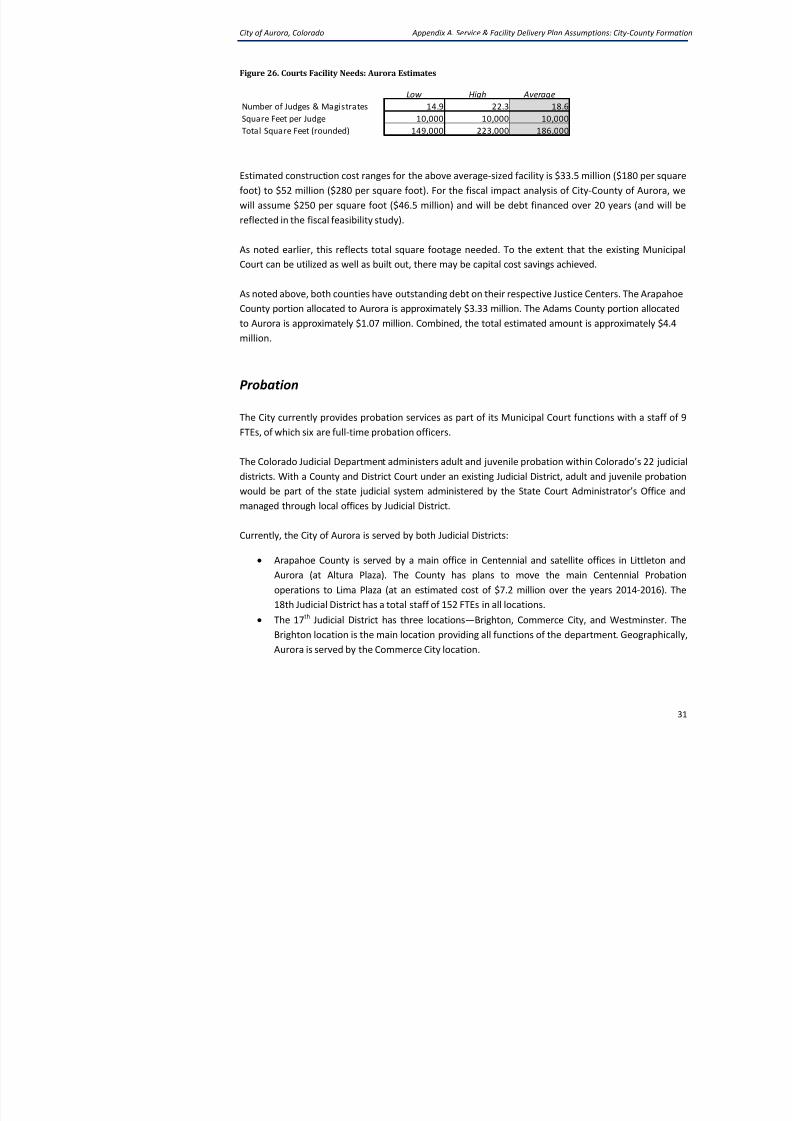
Figure 48. Summary of Capital Facilities: Current and Growth-Related Needs
Finally, as a benchmark, purely from a service population standpoint, the projected pop
City-County of Aurora in 20 years is assumed to be approximately 470,000—or comp
population of Adams County today. Adams County currently has 955 employees (FTEs) i
providing countywide services (excluding support/overhead and IT staff). The fiscal ana
need for 879 employees (FTEs) by Year 20, without support/overhead or IT staff, a differ
8%). However, it should be noted that Adams County departmental staffing data, part
CAPITAL FACILITIES
Infrastructure
Units
Base Year Infra
Needed
Total At
Buildout
Total Construction
Cost ($1,000s)*
A
S
Assessor Sq. Ft. 11,300 15,392 $3,078
Treasurer Sq. Ft. 4,000 5,448 $1,090
Clerk and Recorder Sq. Ft. 39,500 53,882 $10,776
Clerk and Recorder Machine 230 314 $1,569
Coroner Sq. Ft. 7,900 10,776 $2,155
Tri-County Health Sq. Ft. 17,000 23,190 $4,993
Overhead/Support Sq. Ft. 18,300 24,963 $4,638
District Attorney Sq. Ft. 29,400 40,105 $8,021
Courts (County and Di stri ct) Sq. Ft. 186,000 253,723 $63,431
Several considerations of what may be considered “off-model” issues have emerged du
effort. This section summarizes those issues and is in no particular order.
Judicial District and Court Organization
Based on City Council direction at this phase of the analysis, court services and faci
modeled based on the City-County of Aurora remaining with the 18
th
Judicial Distelsewhere). However, if the City is interested in pursuing the formation of a new Judicial
would allow for a combined Municipal-County Court), a separate analysis is suggested. Th
explore, but may not be limited to: the process for formation; cost effectiveness of a s
trade-offs regarding funding sources and revenue streams (state versus local); struct
relationships, and operating cost impacts for the District Attorney’s Office, Public Def
Probation services, and Clerk’s Office; and technology implications.
The following additional items related to Judicial Services are noted:
• To create a new Judicial District, the support of two thirds of both houses of
Legislature is required. This decision might be separate and could follow after a po
from the election creating Aurora as a City and County.
• On the other hand, it may be possible to include the creation of a separate JudiciaConstitutional Amendment. More research is necessary to ascertain if the creati
District could be accomplished in the Constitutional Amendment. However, crea
District and the City and County might be considered two subjects and would
denied on the basis of the single subject requirement for ballot initiatives in Color
• Other considerations of joining an existing District or pursuing creation of a new D
population served; location within Aurora of highest crime rates by type; ideDistrict; prevention programs and innovative community programs; utilization
courts such as drug courts and family court; and domestic violence issues. Other
may include how probation is managed within each District; community
i li d l d f it i i i d tili ti
City of Aurora, Colorado Fiscal Feasibility Study: City-
provide input on selection criteria as well as allow for Aurora residents to
8/12/2019 Fiscal Feasibility Study: Formation of City-County of Aurora
nominating commission and supply community feedback in the process, but
selection is by the Governor.
• Broomfield City-County is part of the 17th Judicial District and its District and Cou
funded and controlled by the State. The City-County has a separate Municipal Co
appointed by the Council. Unlike other counties in the state, the Clerk’s O
Municipal, County, and District Court Clerks’ functions with the state reimbu
County for a portion of the staffing.
• Denver is a single Judicial District and operates the court system in total. Denver
court operation costs and does not receive reimbursement from the Co
Department. With this relationship, there have been recent issues with data
efficient sharing of information with the State.
• In counties that are part of the State Court system, the state reimburses 80 perce
state-mandated salaries for district attorneys with the localities in the Judicial Dithe remaining 20 percent. However, in many instances, salaries are negotiated h
state minimum, and the locality is therefore obligated to cover 100 percent of the
• Both Counties have Alternative Sentencing/Diversion programs in place. The
Aurora would need to do the same and could have the opportunity to shape prog
ground up.
Efficiencies in Service Provision and Facilities
During the Feasibility Study process, there has been some discussion on identifying
service between City and County operations and facilities. While direction from the City
identify maximum costs for new County services and costs, some discussion on efficiencies
There are two main aspects when talking about efficiencies: decreasing costs and
revenues. Within this general framework, the following is offered for further discussions in
City of Aurora, Colorado Fiscal Feasibility Study: City-
with a volatile and transient population, requiring a higher staffing ratio th
8/12/2019 Fiscal Feasibility Study: Formation of City-County of Aurora
As noted earlier, with conversion to a City-County, the City will lose revenues they recfrom the Open Space Sales Tax Fund ($6 million) and the County Road and Bridge Shar
($2.4 million). To make up the lost revenues, the City-County would need to impleme
taxes.
Changes Due to Affordable Care Act
Effect on costs for public employees
For Fiscal Year 2014, the City of Aurora is beginning to implement the Affordable Care
budgeted impacts for City services and employees is conversion of approximately 5
benefitted FTEs across several funds with an overall operating impact of approximately $5
an operating budget (non-enterprise funds) of approximately $320 million, this is a neglig
percent.
Effect on costs to serve Jail population
Under the ACA, Detention staff will be obligated to determine inmate eligibility for Me
available through exchanges. While inmates may be able to be enrolled, their servic
covered while incarcerated due to federal restrictions. A number of issues have been id
National Association of Counties (NACO) related to this provision of service:10
• Establishing county jails as point of contact with newly eligible individuals.
• Expanding current staff capacity at jails to conduct screening and enrollment.
• Overcoming barriers related to jail environment and jail population characteris
turnover/short stays of jail population; changes in release dates (for Medicaid st
proper documentation; reluctance to enroll).
• Providing adequate information technology to perform these functions.
• Tracking and reporting changes to eligibility status: I.e., if found guilty, enrollee is
coverage through Medicaid or a health exchange and jail staff would be r
reporting this.
City of Aurora, Colorado Fiscal Feasibility Study: City-
8/12/2019 Fiscal Feasibility Study: Formation of City-County of Aurora
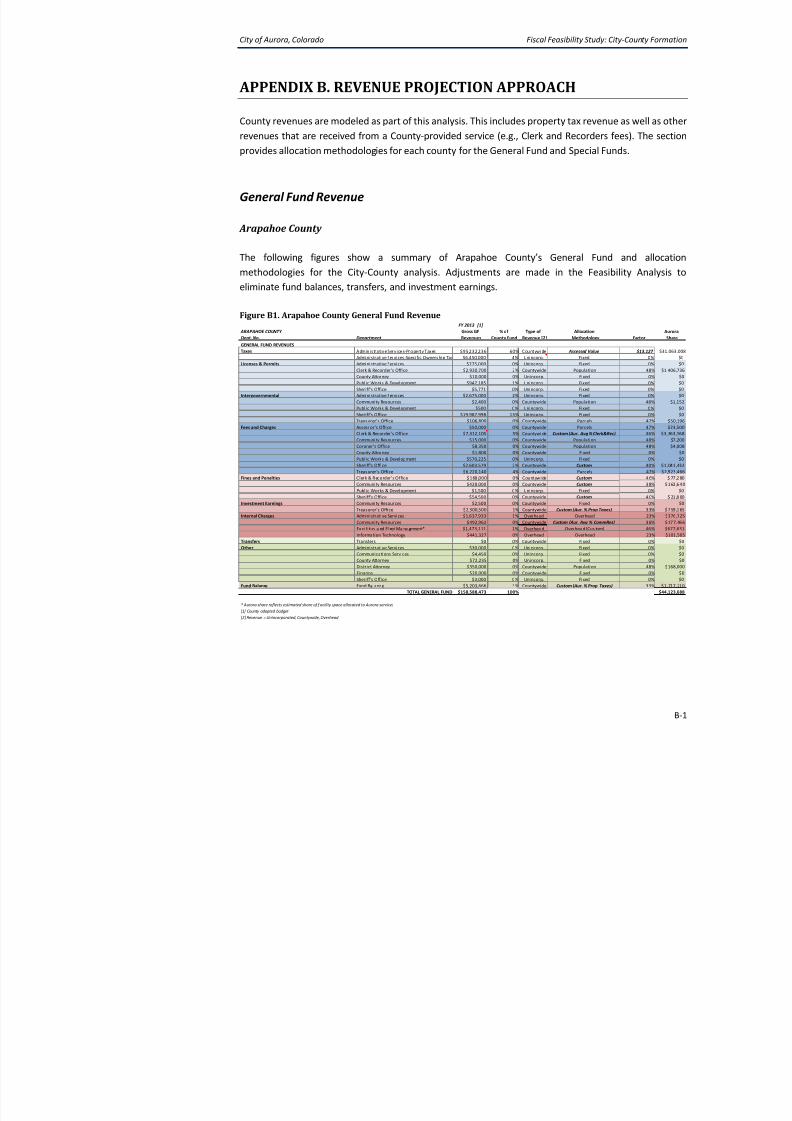
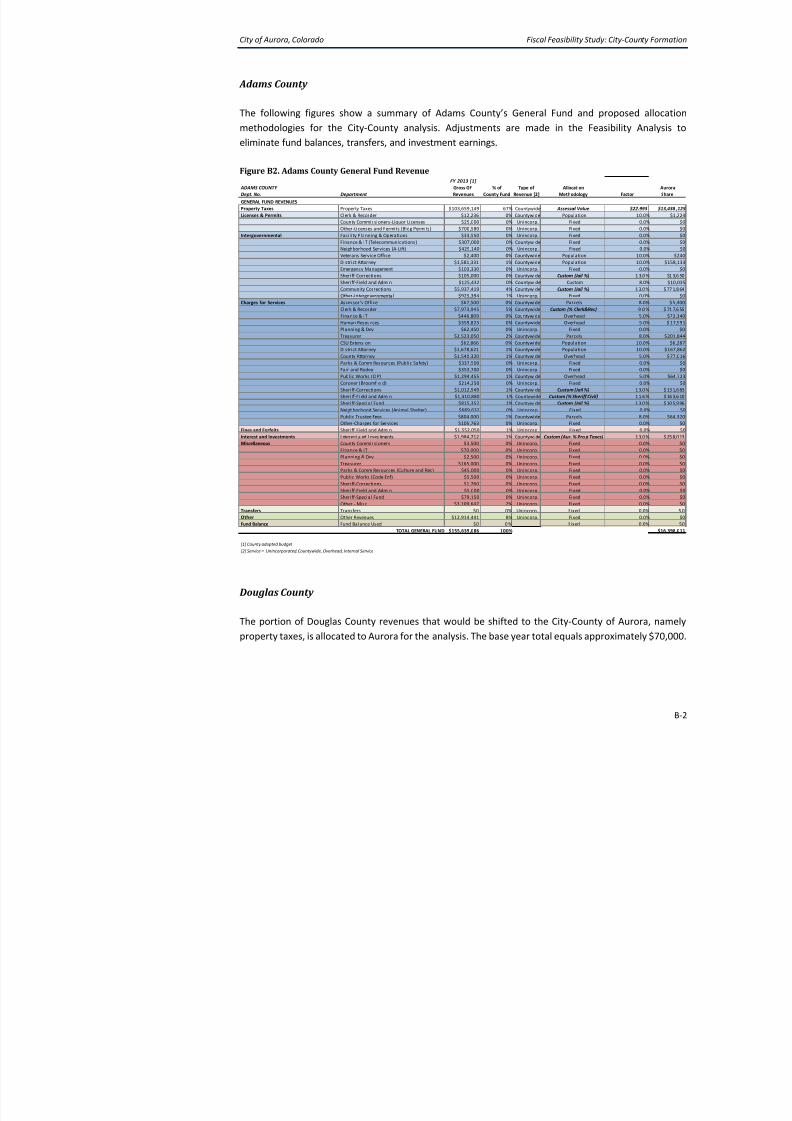
County revenues are modeled as part of this analysis. This includes property tax revenue arevenues that are received from a County-provided service (e.g., Clerk and Recorders fee
provides allocation methodologies for each county for the General Fund and Special Fund
General Fund Revenue
Arapahoe County
The following figures show a summary of Arapahoe County’s General Fund a
methodologies for the City-County analysis. Adjustments are made in the Feasibili
eliminate fund balances, transfers, and investment earnings.
Figure B1. Arapahoe County General Fund Revenue
FY 2013 [1] ARAPAHOE COUNTY Gross GF % of Type of Allocation
Dept. No. Department Revenues County Fund Revenue [2] Methodology
GENERAL FUND REVENUES
Taxes Administrative Services-Property Taxes $95,232,236 60% Countywide Assessed Value
Publ ic Trustee Fees $804,000 1% Countywide Parcels
Other-Charges for Services $105,763 0% Unincorp. Fixed
Fines and Forfeits Sheriff-Field and Admin $1,552,050 1% Unincorp. Fixed Interest and Investments I nterest a nd I nves tments $1,984,712 1% Countywi de Custom (Aur. % Pro p Taxes)
Miscellaneous County Commissioners $3,500 0% Unincorp. Fixed
Finance & IT $70,000 0% Unincorp. Fixed
Planning & Dev $2,500 0% Unincorp. Fixed
Treasurer $165,000 0% Unincorp. Fixed
Parks & Comm Resources (Culture and Rec) $45,000 0% Unincorp. Fixed
Publ ic Works (Code Enf) $5,500 0% Unincorp. Fixed
Sheriff-Corrections $1,760 0% Unincorp. Fixed
Sheriff-Field and Admin $5,000 0% Unincorp. Fixed
Sheriff-Special Fund $79,150 0% Unincorp. Fixed
Other - Misc $3,109,647 2% Unincorp. Fixed
Transfers Transfers $0 0% Unincorp. Fixed
Other Other Revenues $12,914,441 8% Unincorp. Fixed
Fund Balance Fund Balance Used $0 0 % Fixed
TOTAL GENERAL FUND $155,639,086 100%
[1] County adopted budget
[2] Service = Unincorporated, Countywide, Overhead, Internal Service
City of Aurora, Colorado Fiscal Feasibility Study: City-
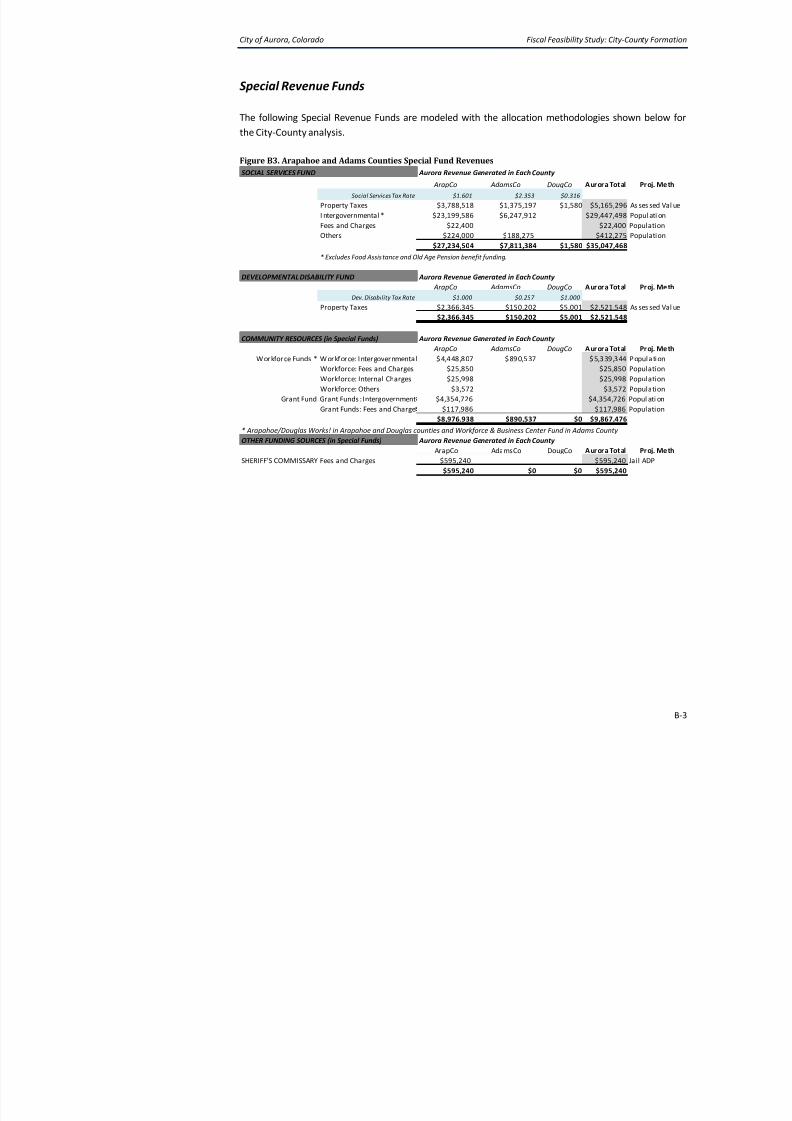
Special Revenue Funds
8/12/2019 Fiscal Feasibility Study: Formation of City-County of Aurora
COMMUNITY RESOURCES (in Special Funds) Aurora Revenue Generated in Each County
ArapCo AdamsCo DougCo Aurora Tota
Workforce Funds * Workforce: Intergovernmenta l $4,448,807 $890,537 $5,339,344
Workforce: Fees and Charges $25,850 $25,850
Workforce: Internal Charges $25,998 $25,998
Workforce: Others $3,572 $3,572
Grant Fund Grant Funds : Intergovernment $4,354,726 $4,354,726
Grant Funds: Fees and Charge $117,986 $117,986
$8,976,938 $890,537 $0 $9,867,476
* Arapahoe/Douglas Works! in Arapahoe and Douglas counties and Workforce & Business Center Fund in Adams County OTHER FUNDING SOURCES (in Special Funds) Aurora Revenue Generated in Each County
ArapCo AdamsCo DougCo Aurora Tota
SHERIFF'S COMMISSARY Fees and Charges $595,240 $595,240
$595,240 $0 $0 $595,240
City of Aurora, Colorado Fiscal Feasibility Study: City-
8/12/2019 Fiscal Feasibility Study: Formation of City-County of Aurora
The following items are general assumptions for the City-County of Aurora Feasibility Studand for which direction was provided by Aurora City Council. This includes only applicable
the discussion.
Statement of General Assumptions
Nature of the Feasibility Study
Put simply, the Feasibility Study as being conducted now provides estimated costs to p
services and related facilities as well as the estimated revenue implications of the f
Consultant Team will not make a judgment as to whether the conversion is feasible or no
many criteria on which feasibility can be measured, reflecting both quantitative a
measures. The expectation is that Council will review the results of the Feasibility Stud
council manager form of government. Service delivery costs are based on this assumption
Further, as a city-county, the City Council can perform the duties of a county commission
to delegate certain duties to boards and commissions appointed by the city council.
information on this topic, we provide language below from the Constitutional Amendme
City and County of Broomfield.
“ . . . On and after November 15, 2001, the terms of office of the mayor and city council of t
of Broomfield shall terminate with regard to the city of Broomfield and said mayor and city
shall become the mayor and city council of the city and county of Broomfield. The city counc
city and county of Broomfield, in addition to performing the duties prescribed in the city and
charter and ordinances, shall perform the duties of a board of county commissioners
delegate certain duties to various boards and commissions appointed by the city council of
and county of Broomfield.” 11
The fiscal analysis will model the costs and revenues available if the City were to formAurora. It is anticipated that up to twenty years’ worth of growth will be projected with
reflecting the development in the ground today. It is modeled to reflect the ongoing and
(such as capital facilities and assumption of outstanding debt service costs) to serve curr
growth. This analysis, at this phase of the study, does not model outreach costs that will b
to the election or certain transition or start-up costs in the initial years prior to “opening t
county such as training, costs associated with recruitment and hirin
communications/marketing efforts to the community on the change is service provider. Tbe above and beyond the costs modeled herein. Costs for marketing, campaigning, and tra
will depend heavily on the strategy and plan developed by the Aurora City Council in a foll
County formation is pursued. This process is likely to have many options and alternatives.
The analysis also assumes current City operations and facility needs continue to b
adequately serve current City demand as well as future City growth. In other words, new c
and revenue streams are considered independent of City operations and revenue souexception of current revenue sources (from counties to the City) that would be af
formation of the City-County of Aurora).
City of Aurora, Colorado Fiscal Feasibility Study: City-
Key Parameters from Direction Provided by City Council
1 City Boundary/Annexation: The Feasibility Study assumes current City boundaries
8/12/2019 Fiscal Feasibility Study: Formation of City-County of Aurora
1. City Boundary/Annexation: The Feasibility Study assumes current City boundaries
2. Judicial District: For the Feasibility Study, it is assumed that the City and Cou
remains in the 18th Judicial District (Arapahoe, Douglas, Elbert, and Lincoln) and n
any portion of the jurisdiction remaining with the 17th Judicial District (Adams and
3. Levels of Service Options
As directed by City Council, the Feasibility Study, and the assumptions herein, usesof service provided by Adams and Arapahoe counties as the basis for the stud
factors based on current operations and facilities. Levels of service factors include
capital costs, staffing levels, and amount of facility space per “demand unit”
(expressed as full-time equivalents (FTE)). Demand units include population, d
employment by type, or vehicle trips and depend on the type of service or
evaluated.
4. New County Positions: Options for Service Delivery
Certain functions are required to be provided in a traditional county, namely
recorder; treasurer; sheriff; coroner; assessor; surveyor; and county commissione
In a city and county, the city council would perform the functions of a county c
described above). The other functions can be performed by elected officials
appointed by the city council or hired by the city manager. This organizational stbe determined by Constitutional amendment. Salaries of appointed positi
determined as would any other salaries of the city and county.
Based on direction from City Council, the Feasibility Study will assume the maxi
fiscal impact at this stage. That is, the study and quantitative analysis will assume
positions/operating impacts as the approach. Appendix B is a summary of positio
be provided by counties. Appendix C to this document includes a write-up of hoand County and Broomfield City and County address these positions, and the p
efficiencies.
Existing City departments and positions would be affected by County formation, s
City of Aurora, Colorado Fiscal Feasibility Study: City-
8/12/2019 Fiscal Feasibility Study: Formation of City-County of Aurora
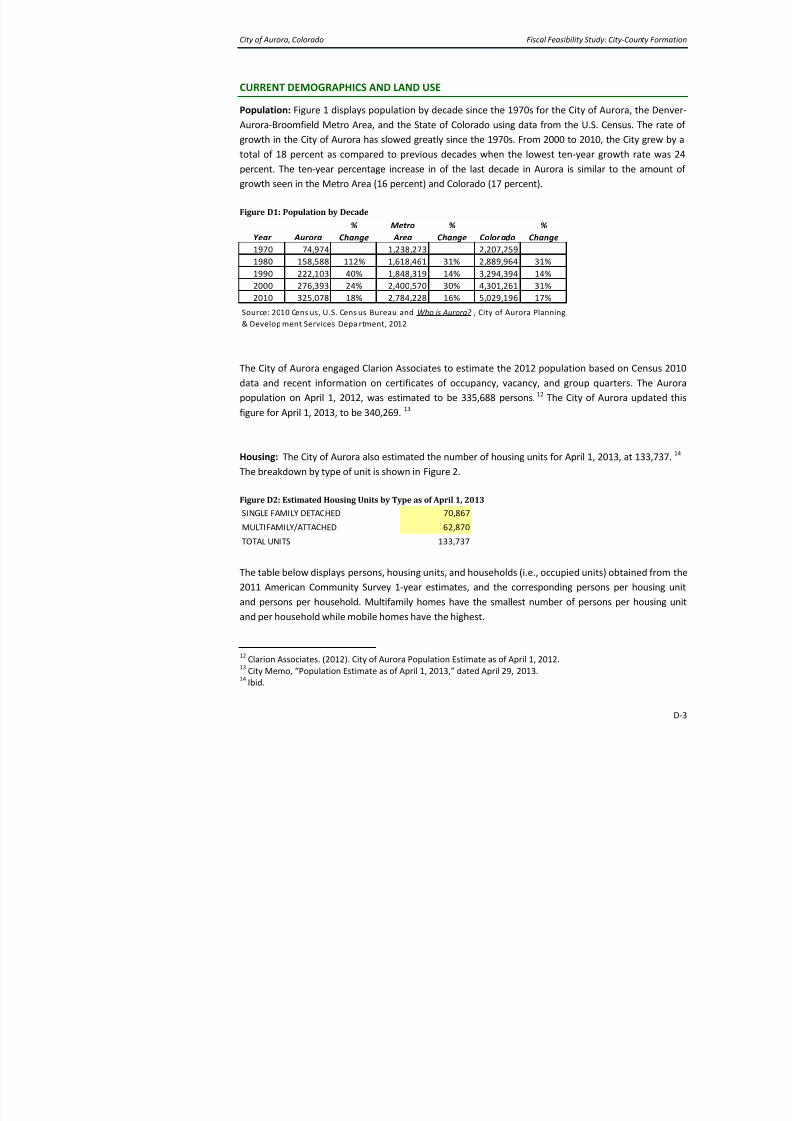
Aurora-Broomfield Metro Area, and the State of Colorado using data from the U.S. Censugrowth in the City of Aurora has slowed greatly since the 1970s. From 2000 to 2010, the
total of 18 percent as compared to previous decades when the lowest ten-year growt
percent. The ten-year percentage increase in of the last decade in Aurora is similar to t
growth seen in the Metro Area (16 percent) and Colorado (17 percent).
Figure D1: Population by Decade
The City of Aurora engaged Clarion Associates to estimate the 2012 population based o
data and recent information on certificates of occupancy, vacancy, and group quarte
population on April 1, 2012, was estimated to be 335,688 persons.12 The City of Auror
figure for April 1, 2013, to be 340,269. 13
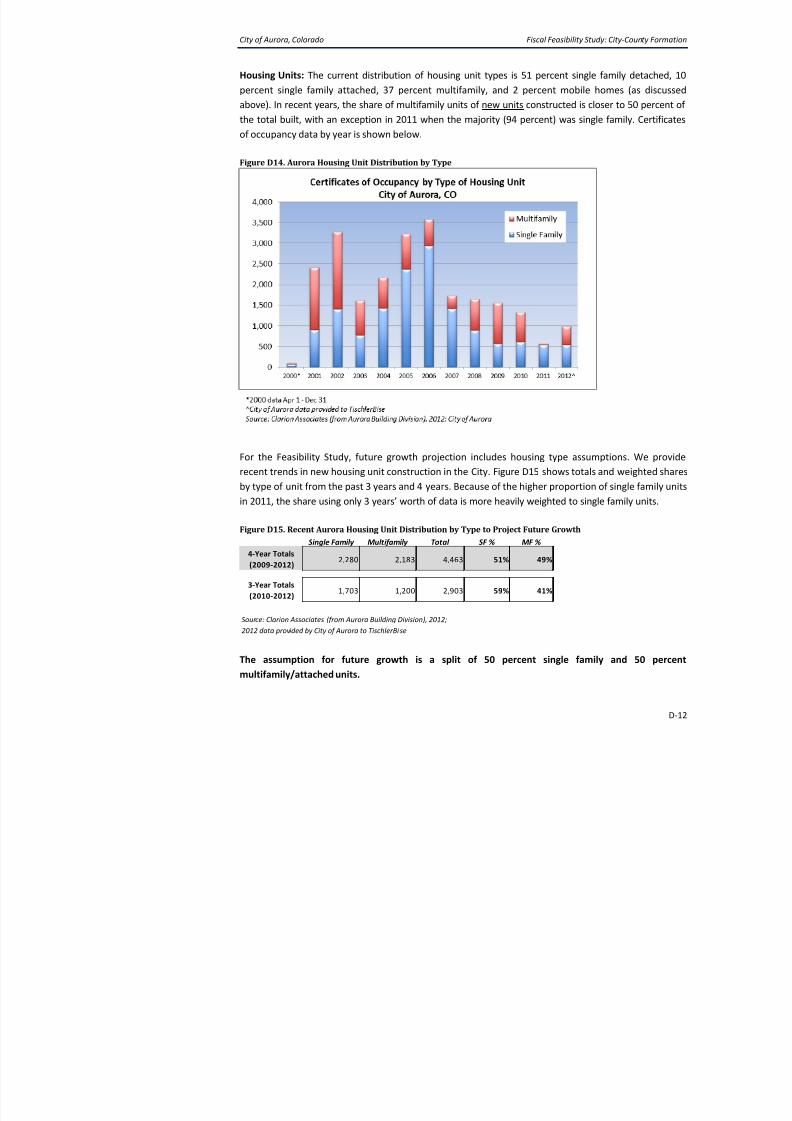
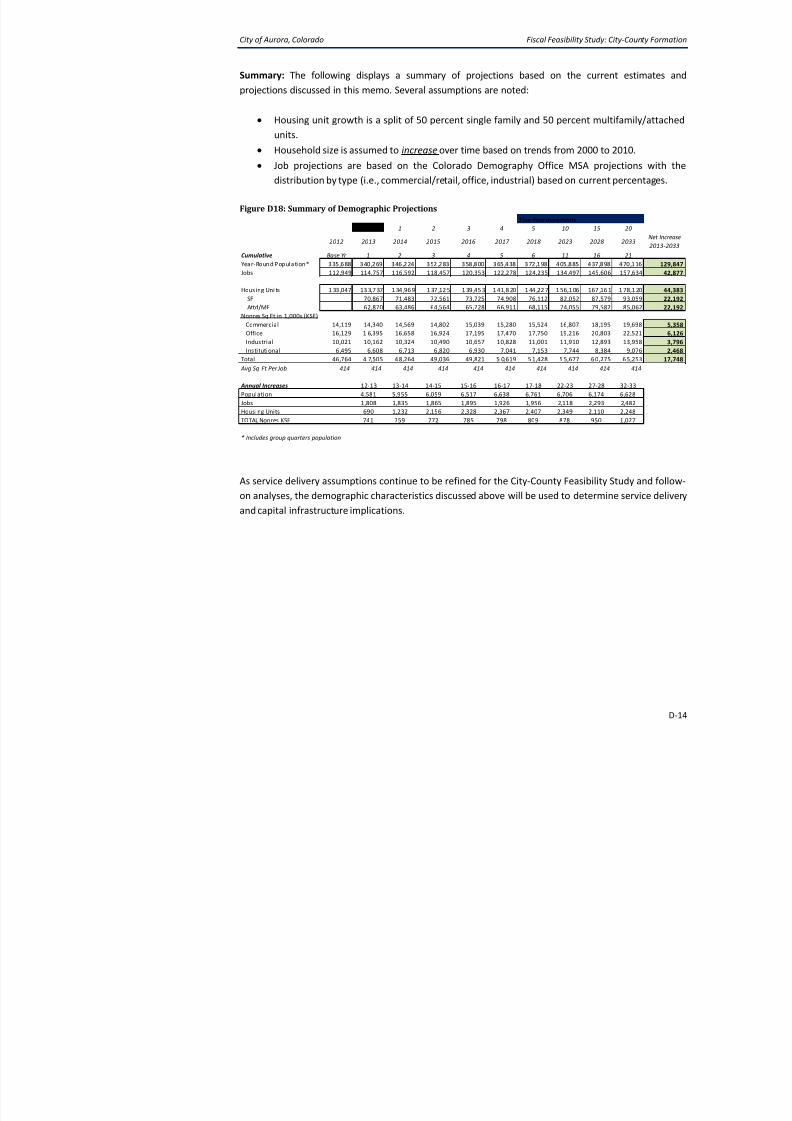
Housing: The City of Aurora also estimated the number of housing units for April 1, 2013,
The breakdown by type of unit is shown in Figure 2.
Figure D2: Estimated Housing Units by Type as of April 1, 2013
The table below displays persons, housing units, and households (i.e., occupied units) obt
2011 A i C it S 1 ti t d th di
Year Aurora%
ChangeMetro Area
%Change Colorado
%Change
1970 74,974 1,238,273 2,207,259
1980 158,588 112% 1,618,461 31% 2,889,964 31%
1990 222,103 40% 1,848,319 14% 3,294,394 14%
2000 276,393 24% 2,400,570 30% 4,301,261 31%
2010 325,078 18% 2,784,228 16% 5,029,196 17%
Source: 2010 Cens us, U.S. Cens us Bureau and Who is Aurora? , City of Aurora Planning
& Develop ment Services Depa rtment, 2012
SINGLE FAMILY DETACHED 70,867
MULTIFAMILY/ATTACHED 62,870
TOTAL UNITS 133,737
City of Aurora, Colorado Fiscal Feasibility Study: City-
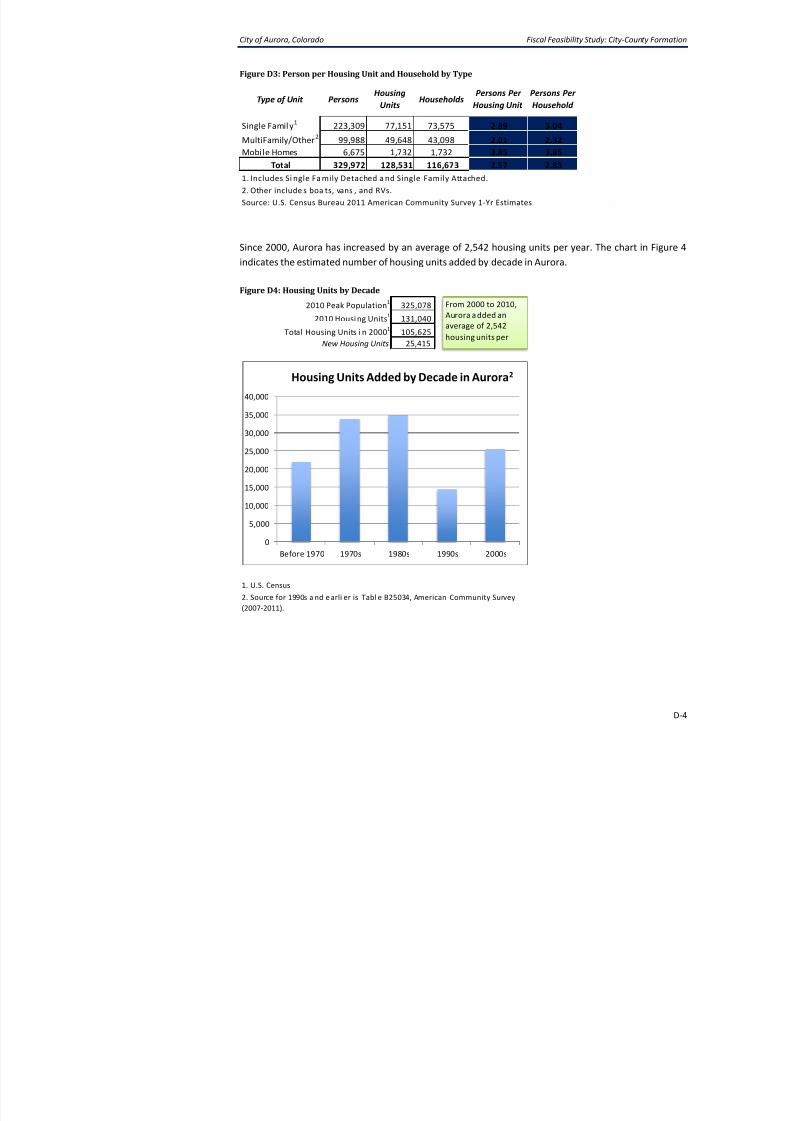
Figure D3: Person per Housing Unit and Household by Type
Type of Unit PersonsHousing
UnitsHouseholds
Persons Per
Housing Unit
Persons Per
Household
8/12/2019 Fiscal Feasibility Study: Formation of City-County of Aurora
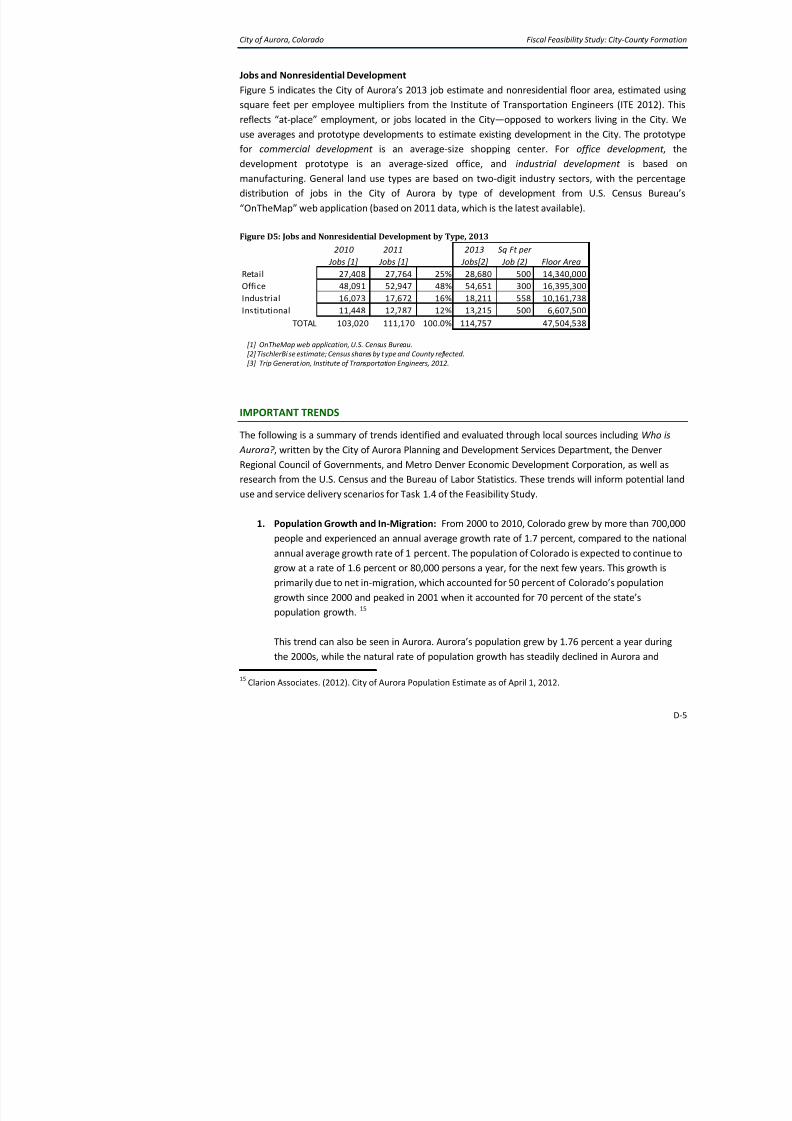
reflects “at-place” employment, or jobs located in the City—opposed to workers living iuse averages and prototype developments to estimate existing development in the City.
for commercial development is an average-size shopping center. For office deve
development prototype is an average-sized office, and industrial development
manufacturing. General land use types are based on two-digit industry sectors, with t
distribution of jobs in the City of Aurora by type of development from U.S. Ce
“OnTheMap” web application (based on 2011 data, which is the latest available).
Figure D5: Jobs and Nonresidential Development by Type, 2013
IMPORTANT TRENDS
The following is a summary of trends identified and evaluated through local sources includ
Aurora? , written by the City of Aurora Planning and Development Services Department, th
Regional Council of Governments, and Metro Denver Economic Development Corporation
research from the U.S. Census and the Bureau of Labor Statistics. These trends will inform
use and service delivery scenarios for Task 1.4 of the Feasibility Study.
1. Population Growth and In-Migration: From 2000 to 2010, Colorado grew by mor
people and experienced an annual average growth rate of 1.7 percent, compared
annual average growth rate of 1 percent. The population of Colorado is expected t
grow at a rate of 1.6 percent or 80,000 persons a year, for the next few years. This
primarily due to net in-migration, which accounted for 50 percent of Colorado’s p
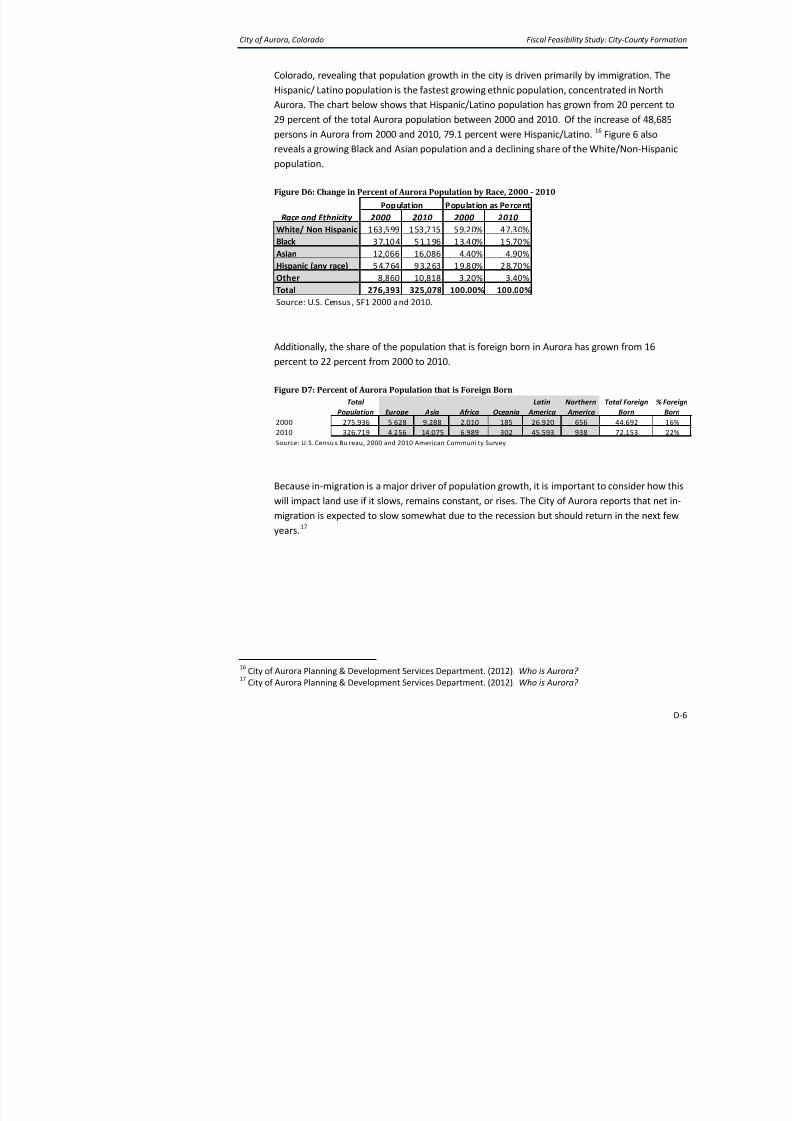
The age group identified as Generation Y, which is roughly the 14 to 34 set
certain development trends, including urban and mixed use environments. Curr
fueling a large demand for apartments and transit- and multi-modal-accessible Additionally, the baby boomer generation, which is characterized by those aged
demand similar types of development. As this population ages, low densi
development may isolate them from services and other opportunities, and it is
many will prefer to live in walkable urbanized areas served by transit. Addit
nesters may choose to downsize to smaller homes or apartments. Because
described above, land use scenarios involving dense development and apartm
neighborhoods, and increased transit should be considered.
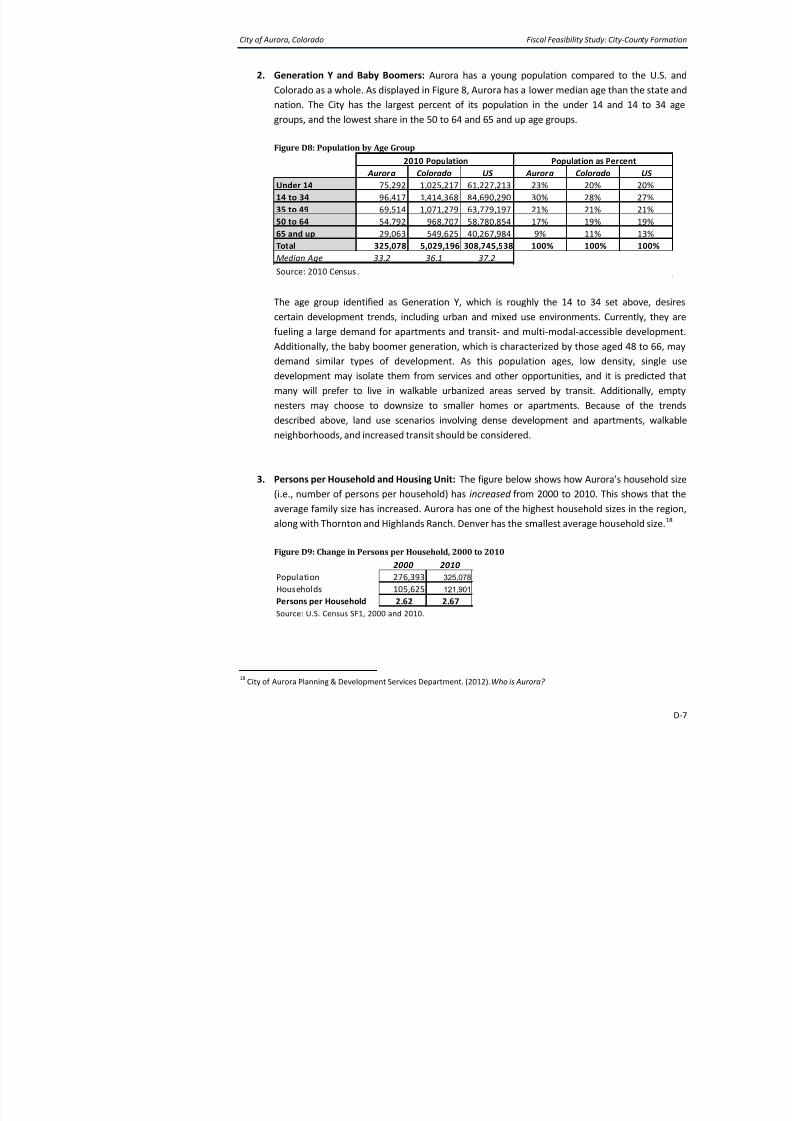
3. Persons per Household and Housing Unit: The figure below shows how Aurora’s
(i.e., number of persons per household) has increased from 2000 to 2010. This s
average family size has increased. Aurora has one of the highest household sizes
along with Thornton and Highlands Ranch. Denver has the smallest average house
Figure D9: Change in Persons per Household, 2000 to 2010
Aurora Colorado US Aurora Colorado
Under 14 75,292 1,025,217 61,227,213 23% 20%
14 to 34 96,417 1,414,368 84,690,290 30% 28%
35 to 49 69,514 1,071,279 63,779,197 21% 21%
50 to 64 54,792 968,707 58,780,854 17% 19%
65 and up 29,063 549,625 40,267,984 9% 11%
Total 325,078 5,029,196 308,745,538 100% 100%
Median Age 33.2 36.1 37.2
Source: 2010 Census .
2010 Population Population as Perc
2000 2010
Population 276,393 325,078
City of Aurora, Colorado Fiscal Feasibility Study: City-
Additionally, the share of one-person households has been increasing in Aurora
over the past decades. This can be attributed to the aging population and the
population who are putting off having children.19
8/12/2019 Fiscal Feasibility Study: Formation of City-County of Aurora
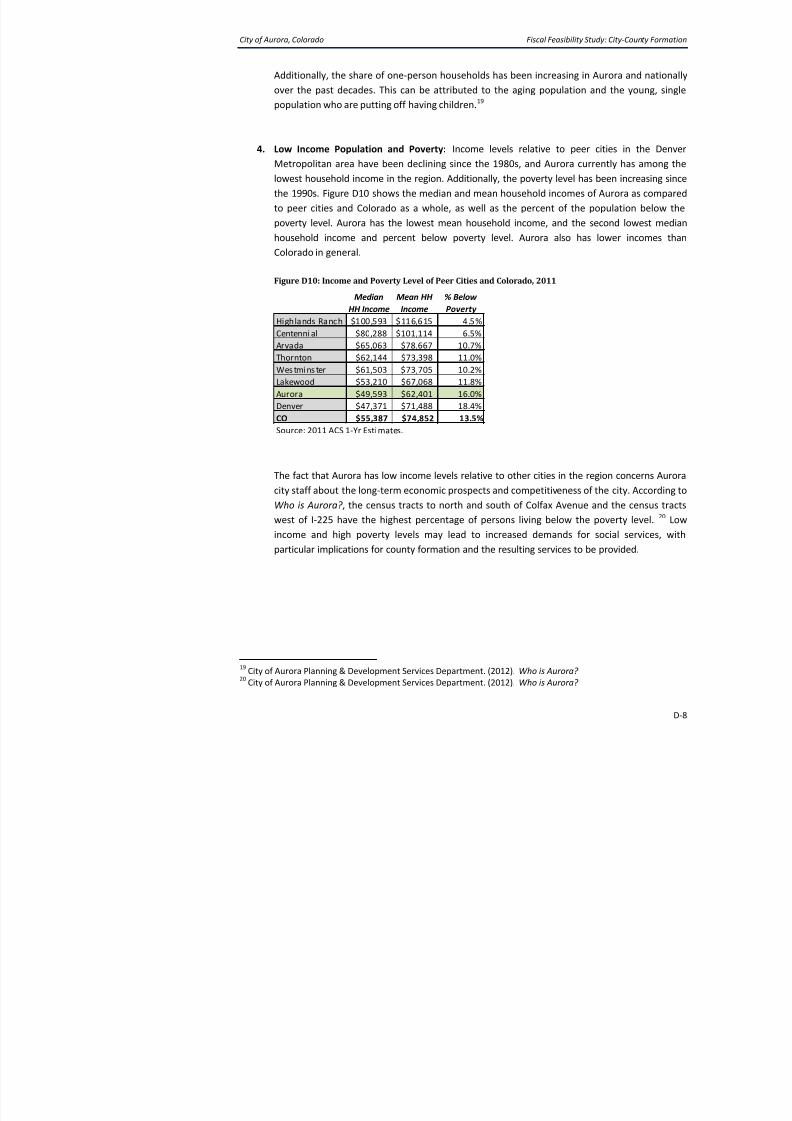
4. Low Income Population and Poverty: Income levels relative to peer cities
Metropolitan area have been declining since the 1980s, and Aurora currently h
lowest household income in the region. Additionally, the poverty level has been i
the 1990s. Figure D10 shows the median and mean household incomes of Auror
to peer cities and Colorado as a whole, as well as the percent of the populat
poverty level. Aurora has the lowest mean household income, and the second
household income and percent below poverty level. Aurora also has lower
Colorado in general.
Figure D10: Income and Poverty Level of Peer Cities and Colorado, 2011
The fact that Aurora has low income levels relative to other cities in the region co
city staff about the long-term economic prospects and competitiveness of the cit
Who is Aurora? , the census tracts to north and south of Colfax Avenue and the
west of I-225 have the highest percentage of persons living below the povert
income and high poverty levels may lead to increased demands for social particular implications for county formation and the resulting services to be provid
Median
HH Income
Mean HH
Income
% Below
Poverty
Highlands Ranch $100,593 $116,615 4.5%
Centenni al $80,288 $101,114 6.5%Arvada $65,063 $78,667 10.7%
Thornton $62,144 $73,398 11.0%
Wes tmi ns ter $61,503 $73,705 10.2%
Lakewood $53,210 $67,068 11.8%
Aurora $49,593 $62,401 16.0%
Denver $47,371 $71,488 18.4%
CO $55,387 $74,852 13.5%
Source: 2011 ACS 1-Yr Estimates.
City of Aurora, Colorado Fiscal Feasibility Study: City-
5. Loss of Population in NW Aurora: The Aurora Planning and Development Service
found a substantial loss of population in Northwest Aurora after examining 2010
From 2000-2010, Aurora grew by 17.6 percent, but the nine census tracts in
portions of the City declined by 11.26 percent. City staff identified the following r
l
8/12/2019 Fiscal Feasibility Study: Formation of City-County of Aurora
The U.S. Census “OnTheMap” web application reveals that of the 103,020 job
2010, 25 percent were occupied by Aurora residents and 75 percent were occupie
of other cities (in-commuters). This is a change since 2002 when 31 percent of Auheld by Aurora citizens and 69 percent were held by residents of other cities.
Aurora currently has two rail transit stations, and the I-225 rail line is cu
construction. This 10.5 mile line will travel through Aurora and connect the exis
Station with the future Peoria/Smith station and include 8 stations, providing op
transit-oriented development, infill development, and more options for co
accessing services and recreation in the region.24
The City of Aurora stations completion by 2016.
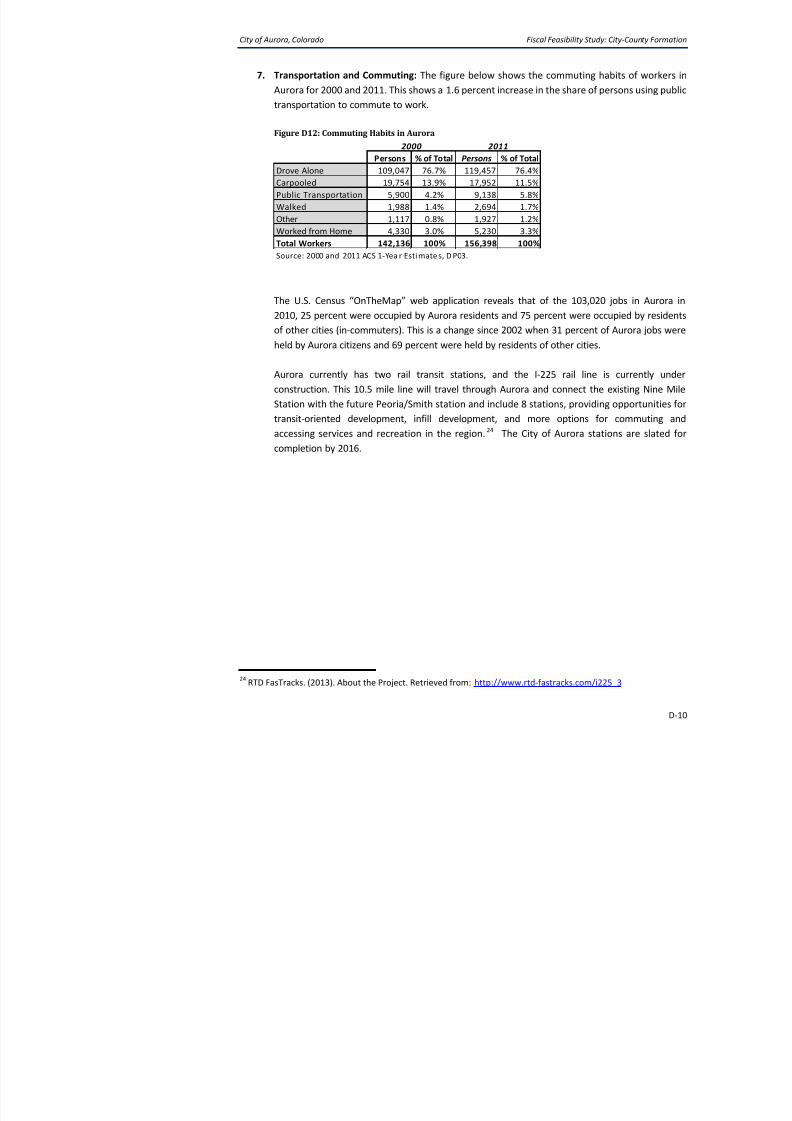
Persons % of Total Persons % of Total
Drove Alone 109,047 76.7% 119,457 76.4%
Carpooled 19,754 13.9% 17,952 11.5%
Public Transportation 5,900 4.2% 9,138 5.8%
Walked 1,988 1.4% 2,694 1.7%
Other 1,117 0.8% 1,927 1.2%
Worked from Home 4,330 3.0% 5,230 3.3%
Total Workers 142,136 100% 156,398 100%
Source: 2000 and 2011 ACS 1-Yea r Esti mate s, D P03.
2000 2011
City of Aurora, Colorado Fiscal Feasibility Study: City-
POTENTIAL SERVICE DELIVERY/GROWTH SCENARIO
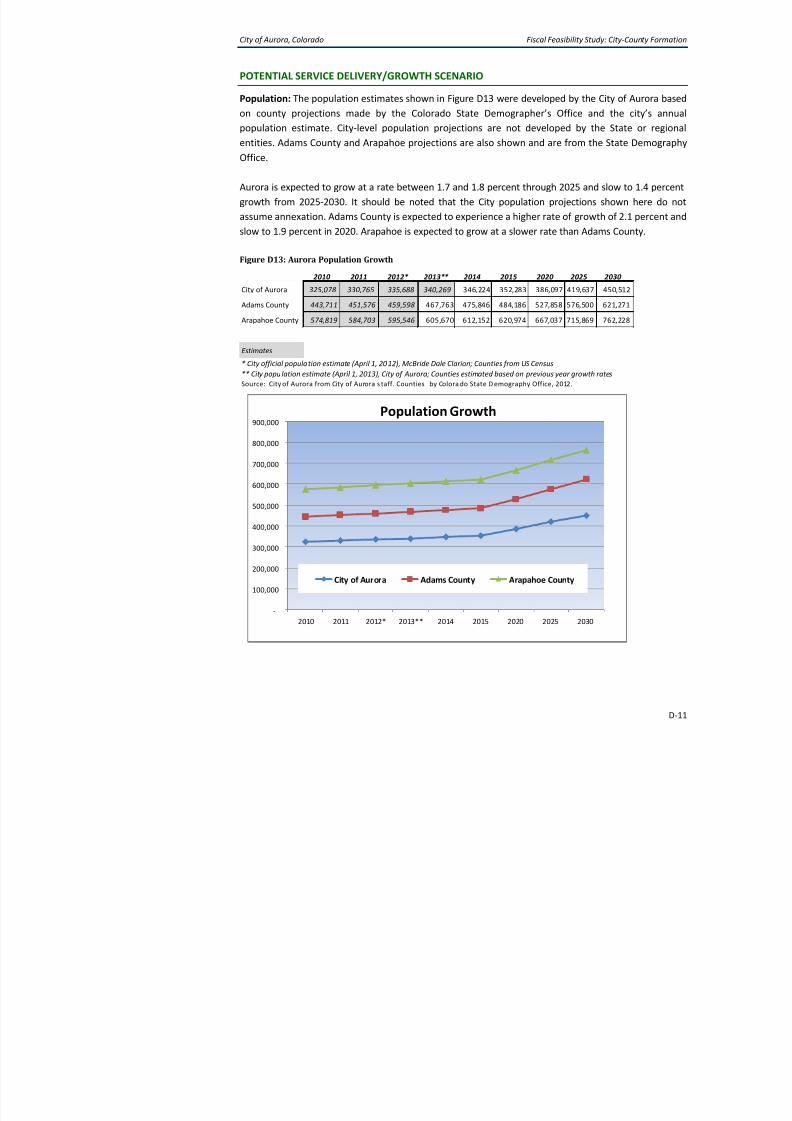
Population: The population estimates shown in Figure D13 were developed by the City o
on county projections made by the Colorado State Demographer’s Office and the
population estimate. City-level population projections are not developed by the Sta
8/12/2019 Fiscal Feasibility Study: Formation of City-County of Aurora
County or City Office/Department Name of Contact Title
Arapahoe County Board of County Commissioners Nancy Doty County Commissioner, Ch
Arapahoe County Board of County Commissioners Nancy N. Sharpe County Commissioner, Di
Arapahoe County Board of County Commissioners Rod Bockenfeld County Commissioner, Dis
Arapahoe County Board of County Commissioners Nancy Jackson County Commissioner, Di
Arapahoe County Board of County Commissioners Bill L. Holen County Commissioner, Pr
Arapahoe County Assessor's Office Corbin Sakdol AssessorArapahoe County Assessor's Office Monica Babbitt Deputy Assessor Administ
Arapahoe County Clerk and Recorder's Office Matt Crane Clerk and Recorder
Arapahoe County Clerk and Recorder's Office Mary C. Whitley Deputy Clerk and Recorde
Arapahoe County Sheriff's Office J. Grayson Robinson Sheriff
Arapahoe County Treasurer's Office Sue Sandstrom Treasurer
Arapahoe County Board of County Commissioners Administration Dept. Lori Bosanko BOCC Administration Man
Arapahoe County Community Resources Department Don Klemme Director
Arapahoe County Finance Department Janet Kennedy Director
Arapahoe County Finance Department Todd Weaver Budget Manager
Arapahoe County Finance Department Steven R. Oliver Accounting Manager
Arapahoe County Human Services Department Cheryl Ternes DirectorArapahoe County Human Services Department Kevin McNeal Finance Division Manager
Arapahoe County Human Services Department Jessica Gapuzan Performance Managemen
Arapahoe County Open Spaces & Intergovernmental Relations Shannon Carter Director
Adams County Office of the County Manager Todd Leopold County Manager
Adams County Assessor's Office Gil Reyes Assessor
Adams County Clerk and Recorder's Office Karen Long Clerk and Recorder
Adams County Clerk and Recorder's Office Norma Burkhart Elections Administrator
Adams County Clerk and Recorder's Office Linda Bishop Motor Vehicle Manager
Adams County Clerk and Recorder's Office Sadie Lyons Recording Manager
Adams County Sheriff's Office Douglas N. Darr Sheriff
Adams County Treasurer's Office Brigitte Grimm Treasurer
Adams County Finance Department Rich Lemke Director
Adams County Finance Department Ben Dahlman Assistant Director
Adams County Human Services Department Chris Kline Director
Adams County Human Services Department Brian P. KennaDeputy Director, Operatio
and Support Services
Adams County Neighborhood Services Department Raymond H. Gonzales Director
Douglas County County Administration Barbara J. Drake Deputy County Manager
Douglas County County Administration Maureen Waller^ Project Manager
Douglas County Assessor's Office Teri Cox Assessor
Douglas County Clerk and Recorder's Office Sheri Davis Elections ManagerDouglas County Clerk and Recorder's Office Marsha Faulk Motor Vehicle Manager
Douglas County Sheriff's Office Capt. Robert McMahan Support Services Division
Douglas County Treasurer's Office Diane Holbert Treasurer
City of Aurora City Council Steve Hogan Mayor
City of Aurora City Council Sally Mounier Council Member Ward I
City of Aurora, Colorado Service and Facility Delivery Plan Assumptions: City-
City of Aurora City Manager's Office George "Skip" Noe City Manager
Ci ty of Aurora Ci ty Manage r's Of fi ce Mi che ll e Wol fe * De puty City Manage r, Adm
City of Aurora City Manager's Office Roberto Venegas* Assistant City Manager
Ci ty of Aurora Ci ty Manage r's Of fi ce Mi chae l Lawson* Fi nance and Budge t ProgrCity of Aurora Court Administration Zelda M. DeBoyes* Court Administrator
8/12/2019 Fiscal Feasibility Study: Formation of City-County of Aurora
City of Aurora, Colorado Appendix A. Service & Facility Delivery Plan Assumptions: City
Contents
Statement of General Assumptions ...............................................................................
Key Parameters from Direction Provided by City Council .................................................
Level of Service Assumptions .........................................................................................Existing Demand Base and Growth Projections ..................................................................
8/12/2019 Fiscal Feasibility Study: Formation of City-County of Aurora
information on this topic, we provide language below from the Constitutional Amendme
City and County of Broomfield.
“ . . . On and after November 15, 2001, the terms of office of the mayor and city council of t
of Broomfield shall terminate with regard to the city of Broomfield and said mayor and city
shall become the mayor and city council of the city and county of Broomfield. The city counc
city and county of Broomfield, in addition to performing the duties prescribed in the city and
charter and ordinances, shall perform the duties of a board of county commissioners
delegate certain duties to various boards and commissions appointed by the city council of
and county of Broomfield.” 1
The fiscal analysis will model the costs and revenues available if the City were to form
Aurora. It is anticipated that up to twenty years’ worth of growth will be projected withreflecting the development in the ground today. It is modeled to reflect the ongoing and
(such as capital facilities and assumption of outstanding debt service costs) to serve curr
growth. This analysis, at this phase of the study, does not model outreach costs that will b
to the election or certain transition or start-up costs in the initial years prior to “opening t
county such as training, costs associated with recruitment and hirin
communications/marketing efforts to the community on the change is service provider. T
be above and beyond the costs modeled herein. Costs for marketing, campaigning, and trawill depend heavily on the strategy and plan developed by the Aurora City Council in a foll
County formation is pursued. This process is likely to have many options and alternatives.
The analysis also assumes current City operations and facility needs continue to b
adequately serve current City demand as well as future City growth. In other words, new c
and revenue streams are considered independent of City operations and revenue sou
exception of current revenue sources (from counties to the City) that would be afformation of the City-County of Aurora).
City of Aurora, Colorado Appendix A. Service & Facility Delivery Plan Assumptions: City
KEY PARAMETERS FROM DIRECTION PROVIDED
COUNCIL
1. City Boundary/Annexation: The Feasibility Study assumes current City boundaries
8/12/2019 Fiscal Feasibility Study: Formation of City-County of Aurora
2. Judicial District: For the Feasibility Study, it is assumed that the City and Cou
remains in the 18th Judicial District (Arapahoe, Douglas, Elbert, and Lincoln) and n
any portion of the jurisdiction remaining with the 17th Judicial District (Adams and
3. Levels of Service Options
As directed by City Council, the Feasibility Study, and the assumptions herein, uses
of service provided by Adams and Arapahoe counties as the basis for the stud
factors based on current operations and facilities. Levels of service factors include
capital costs, staffing levels, and amount of facility space per “demand unit”
(expressed as full-time equivalents (FTE)). Demand units include population, d
employment by type, or vehicle trips and depend on the type of service or
evaluated.
4. New County Positions: Options for Service Delivery
Certain functions are required to be provided in a traditional county, namely
recorder; treasurer; sheriff; coroner; assessor; surveyor; and county commissione
In a city and county, the city council would perform the functions of a county cdescribed above). The other functions can be performed by elected officials
appointed by the city council or hired by the city manager. This organizational st
be determined by Constitutional amendment. Salaries of appointed positi
determined as would any other salaries of the city and county.
Based on direction from City Council, the Feasibility Study will assume the maxi
fiscal impact at this stage. That is, the study and quantitative analysis will assumepositions/operating impacts as the approach. Appendix B is a summary of positio
be provided by counties. Appendix C to this document includes a write-up of ho
and County and Broomfield City and County address these positions and the p
City of Aurora, Colorado Appendix A. Service & Facility Delivery Plan Assumptions: City
LEVEL OF SERVICE ASSUMPTIONS
Where possible, the analysis attempts to quantify the level of demand for services and
starting point is to determine current levels of service by each County (emphasizinArapahoe as this represents practically all of the current demand from the City of Aurora)
f i fl d i b d Thi i f i i d i h
8/12/2019 Fiscal Feasibility Study: Formation of City-County of Aurora
Service and facility delivery assumptions for the City-County Feasibility Study are ou
document. This document is not meant to be a staffing plan or a detailed space needs stuintent is to identify the initial estimated costs—which in some cases includes a range of co
maximum potential costs, as directed by the Aurora City Council. The following app
wherever possible:
• Countywide functions are identified and extracted from County departmental bud
• The service analysis includes General Fund services as well as services accounted
Funds where those services are provided Countywide (e.g., Social Service
components of General Fund services.
• Discussions with County service providers occurred over the course of this s
consulted with State offices and other counties where appropriate to cross-check
• To derive cost factors, Arapahoe and Adams counties are used. The factors are
determine baseline costs to serve a City-County of Aurora, which accounts for the
all counties (that is, expanding the base to include the portion of the City in Dougla
• Overhead/support costs are included both within new County service expenditureadministrative costs are included in Sheriff cost estimates and are derived based
administration/overhead expenses of the direct Sheriff expenditures provided
separate service and cost estimate is provided for County-ser
administration/overhead (ultimately reflecting additional effort by existing City
(e.g., City Attorney’s office).
• Costs and staffing estimates are not adjusted at this phase of the analysis. Fo
derive estimated staffing needs for Aurora City-County based on FTE counts applicable share, but do not adjust downward for potential staffing efficienci
business practices, pay scales or vice versa. We assume that salary levels are com
the City of Aurora and Arapahoe and Adams counties for this phase of the feasi
City of Aurora, Colorado Appendix A. Service & Facility Delivery Plan Assumptions: City
The following required County services are discussed in this document:
1. Assessor
2. Treasurer
3. Clerk and Recorder
4. Coroner
8/12/2019 Fiscal Feasibility Study: Formation of City-County of Aurora
Clerk and Recorder $4,819,000 61.0 $3,660,000 39,500 $7,900,000 Yes-Adams Co. Clerk and Rec-Voting Machines (units) ====================== n a 230 units $1,150,000 No
Sheriff-Operating $24,234,000 168.5 $13,778,000 see below
Sheriff-Detention Space (Beds) ========================================> 780 beds $70,200,000 No
Sheri ff - Admi n Spa ce ========================================> 5,300 $1,060,000 Yes -Ara p. Co.
Human Services** $38,886,000 348.0 $22,968,000 98,300 $19,660,000 Yes-Arap. Co.
Communi ty Res ources $11,974,000 83.0 $5,312,000 33,350 $ 6,670,000 Yes -Ara p. and Adam
Developmental Disabil ity $3,620,000 na na na na na
Aid to Agencies $812,000 na na na na na
Tri-County Health $2,362,828 na na 17,000 $3,400,000 No
Surveyor $13,000 na na na na na
Public Trustee na na na na na na IT $3,524,510 18.0 $1,350,000 see below $3,663,500 na
Overhead/Support $8,773,000 55.3 $4,147,500 18,300 $3,660,000 Yes-Arap. and Adam
Total $110,825,118 786.8 $55,397,500 450,350 $174,383,500
Total space with Detention Space shown in square feet 657,350
[1] Reflects base year space needs in square feet, unless otherwise specified
[2] Aurora estimated s hare of total outstanding non-General Obligation debt of Arapahoe and Adams counties
* Assumes Court system as part of 18th Judicial District with operating costs state funded and facilities provided by City-County.
** Excludes Food Assistance and Old Age Pension benefits (operating)
Source: County Budgets; County Interviews; Tis chlerBise analysis
City of Aurora, Colorado Appendix A. Service & Facility Delivery Plan Assumptions: City
ASSESSOR
Aurora City-County will need to provide property assessment services. Obligations and reqset forth in State statute. Deadlines and specific requirements are state mandated. A
required services is provided in Appendix B.
8/12/2019 Fiscal Feasibility Study: Formation of City-County of Aurora
The County Assessor is currently elected in Arapahoe, Adams, and Douglas counties. Cur
budgets and space for the Assessor’s Office in Arapahoe and Adams Counties is shown bel
Figure 4. Assessor’s Office: County Current Levels of Service
Other cost and service considerations include:
• County assessment will need a software system that integrates with the Trea
Arapahoe County is currently transitioning their system at a cost of $3.5 million.
• The system will need to allow for online access to assessment records (i.e., a pr
function)
• County appraisers are trained specifically for mass appraisal (as opposed t
appraisers who work in the private real estate market.) They require certifications
• Technical support is handled through shared IT pool in Arapahoe County with in
are familiar with department-specific software.
• In Adams County, technical support is handled through departmental staff. The As
also has dedicated GIS staff (4 FTE plus interns) that are departmental staff.• Administrative personnel are necessary to provide customer service to citizens of
• Current staff specifically assigned to Aurora include:
o Arapahoe County: 8 residential appraisers (including supervisor); 1 to 2 la
ARAPAHOE COUNTY ADAMS COUNT
$ FTEs
Demand
Unit #
LOS
$/Unit $ FTEs
Demand
Unit
Assessor: Operations $4,987,243 63.0 P arcel s 223,249 $22.34 $3,963,964 44.0 P arcel s
[2] Service = U nincorporated, Countywide, Overhead, Internal Service[3] Es timated Aurora share of expenditures based on demand factors shown in supporting tables
projected based on growth in parcels in the City as well as FTEs needed.
Figure 7. Assessor Facility Needs: Aurora Current Estimate
The Adams County Administration Building currently has outstanding (non-General Oblig
it. The estimated outstanding debt allocated to Aurora prorated for the Assess
approximately $1 million.
In addition to the office space needs, an Assessor’s office will need appropriate technology
ASSESSOR County Totals % Aurora Auror
Arapahoe County LOSAdministration Building^ Sq. Ft. 13,600 30% 4
Altura Plaza Sq. Ft. 4,700 100% 4
Total Sq. Ft. 18,300 8
FTEs 63
Sq. Ft. per FTE 290
Adams County LOS
Administration Bui lding 21,000 8% 1
FTEs 44
Sq. Ft. per FTE 477
Aurora City-County Estimates Sq. Ft $ per Sq. Ft.^^ Est. Co
Estimate based on % Share of Space 10,500 $200 $2,100
Estimate based on Sq. Ft. per FTE* 33 FTEs 12,100 $200 $2,420
Estimate Average 11,300 $200 $2,260
^ Reflects Aurora share of non-appraiser space in Admin Bldg. Aurora appraisers housed in Altura Plaza
* Weighted average of two counties
^^ Average rounded construction cost estimates from Reed Construction Data and recent regional projects
City of Aurora, Colorado Appendix A. Service & Facility Delivery Plan Assumptions: City
TREASURER
The Treasurer is a constitutional officer responsible for billing and collecting propedistributing revenues to taxing authorities. Taxing authorities include all entities with ta
such as school districts, water districts, metro districts, etc. Arapahoe and Adams Co
8/12/2019 Fiscal Feasibility Study: Formation of City-County of Aurora
approximately 350 different taxing authorities currently. Each taxing district has to certify
the Board of County Commissioners and report it to the County Treasurer. The County
oversees the County investment practices. The current Treasurers in Arapahoe, Adams
counties are elected. The current Aurora Finance office is assumed to provide the invest
for the City-County of Aurora. The remaining functions will be new services to be providCounty of Aurora.
Current budgets and personnel complements for Arapahoe and Adams counties are as fol
Figure 8. Treasurer’s Office: County Current Levels of Service
Of the 22 full time equivalents in the Arapahoe County Treasurer’s office, approximatelyaccounting, 5 FTEs handle property taxes, 2 FTEs handle tax liens and bankruptcies, 1 FT
posting notices, and the remainder in administration/management. The County Treasurer
approximately half the current County staffing would be needed to serve Aurora with a
to 7 handling accounting and property taxes, 2 for tax liens (as more than 50 percent of th
liens and bankruptcies are in Aurora), and .5 FTEs for field work. This estimate of approxi
[2] Service = Unincorporated, Countywide, Overhead, Internal Service[3] Estimated Aurora share of expenditures based on demand factors shown in supporting tables
in ARAPAHOE COUNTY in ADAMS COUNTY AURORA CITY-COUNTY
Aurora Share in Each County Aurora Share: Exist ing Levels of Service and Costs
Costs vary by election year. Even years are generally more expensive than odd years. T
Adams County in 2012 (Presidential election) cost approximately $1 million more to the C
amount, approximately $150,000 was reimbursed by the State. The rest was paid by th
participating jurisdictions (including City of Aurora, which paid approximately $45,500 bCounty for its share of election costs).
The City-County of Aurora would be responsible for holding elections for all jurisdict
boundaries for all types of elections including TABOR elections. The entities include sc
metro districts, utility districts, etc. The City-County of Aurora would develop a reimburse
for these entities for the costs of the elections. For example, Adams County allocat
election costs on percent of active registered voters. TABOR costs are allocated based formula for printing costs (percentage of TABOR pages of texts per jurisdiction) and postag
on percentage of households in each jurisdiction).
Election requirements frequently change by state legislative changes. For the upcoming e
counties are required to mail all ballots and establish early voter locations, which will sta
hours. Costs are anticipated to be incurred for training, staffing, and potentially rental of
to increased mandates, the charge-back rate to municipalities is expected to increase thiArapahoe County the cost per voter is expected to increase from approximately $1.45 to
County estimates a cost per voter of $2 in 2013 as well.)
City of Aurora, Colorado Appendix A. Service & Facility Delivery Plan Assumptions: City
Recording
The county clerk is the recorder of real estate deeds and is required to safely keep an
documents received for recording or filing. The division is responsible for indexing reco
customer service, imaging records, issuing and recording marriage licenses and passpo
technology to provide access to recorded documents.
8/12/2019 Fiscal Feasibility Study: Formation of City-County of Aurora
The majority of the division’s work is dedicated to real estate recordings and the metho
estimate Aurora’s costs is parcels. Detail is provided below.
One item for further research and discussion is the approach toward previously recorde
Broomfield became a county, the previously recorded deeds stayed with the original recor
Motor Vehicles
Counties act as agents of the State by establishing and operating Motor Vehicle Service C
motor vehicle offices issue titles and motor vehicle registrations as well as renew driveoffices also collect revenues on behalf of the State and disburse to governmental entities
City of Aurora.
Current County operations are as follow:
• Arapahoe County current operates 4 sites countywide with 2 in Aurora, with one o
services.
• Adams County currently operates 6 sites countywide with one in Aurora.
Fiscal Impact Approach
The required level of effort stems from demand indicators specific to the particular funct
by the Department. Based on the current demand from the City of Aurora as shown below
is a working estimate of baseline fiscal requirements to serve the City-County of Aurora:
City of Aurora, Colorado Appendix A. Service & Facility Delivery Plan Assumptions: City
Figure 13. Clerk and Recorder Annual Operating Costs: Baseline Aurora Share by County
Arapahoe Count y Department
FY 2013 Gross GF
Expenditures [1]
% of
General
Fund # of FTEs
Type of Service
[2]
Allocation
Methodology
Aurora
Factor [3]
A
Sh
CLERK & RECORDER'S OFFICE $8,491,815 see below 118.50
Cl erk & Rec - Admi ni strati on $703,438 0% 8.50 Countywi de Aurora % of Di rect 45.0% $ 3
• The City Court Administrator is appointed by the City Council and oversees
divisions: Office of the Court Administrator, Case Management, Detention,
Probation.
o The department has a total of 101 FTEs and a budget of $7.3 million.
• The City Judicial Department is comprised of Judges, Bailiffs, Court Reporters, and
The Court handles approximately 60,000 to 65,000 cases per year with tr
accounting for approximately 55 to 60 percent of the caseload. There are 21.
budget of approximately $2.3 million.
As a County, Aurora would be required to provide operating support for the District At
and space for District and County Courts. The space needs include not only courtrooms and supporting areas (jury rooms, security, offices, waiting areas) as well as space for Prob
District Attorney
Based on direction from the City Council, this analysis assumes that the City-County of Au
included in the 18th Judicial District (serving the Arapahoe County portion of Aurora) with
17th Judicial District (serving the Adams County portion of Aurora). The District Attorney
position and appears in County, District, and Appellate courts on behalf of citizens. Co
operational funding for the District Attorney’s Office in the District in which each is ba
County provides funding for the District Attorney in the 18th District on a population-b
Adams County provides funding for the District Attorney in the 17 th Judicial District.
current level of service is shown below.
Figure 20. District Attorney’s Office: County Current Levels of Service
ARAPAHOE COUNTY ADAMS COUNTY
City of Aurora, Colorado Appendix A. Service & Facility Delivery Plan Assumptions: City
To estimate costs for the City-County of Aurora, assumed to be in the 18th Judicial Distric
current cost factor of $20.298 per person is used. Estimated operating costs for the
Aurora are based on this factor and population served. The baseline cost to the City-Co
would be $6.9 million.
Figure 21. District Attorney Local Cost Allocation (18th Judicial District)
Local Share ($ per person)* $20.298
8/12/2019 Fiscal Feasibility Study: Formation of City-County of Aurora
Figure 23. District and County Court Statistics: Filings, Terminations, and Number of Judges & Mag
FY 2012 # of Judges & # Filings per
Filings Magistrates Judge
District Court
17th Adams 26,095 16 1,631
Broomfield 1,885 3 628
Total 27,980 19 1,473
18th Arapahoe 32,940 20 1,647
Douglas 10,296 8 1,287
Elbert 1,478
Lincoln 352Total 45,066 29 1,554
Adams & Arapahoe District Ct. Total 59,035 36 1,640
County Court
17th Adams 63,083 10 6,308
Broomfield 4,373 1 4,373
Total 67,456 11 6,132
18th Arapahoe-Centennial* 32,055 8
Arapahoe-Littleton* 30,697 3
Arapahoe-Total 62,752 11 5,705
Douglas 22,402 4 5,601
Elbert 1,661
Lincoln 1,178Total 87,993 16 5,500
1 2,839
1 1,830
City of Aurora, Colorado Appendix A. Service & Facility Delivery Plan Assumptions: City
This data can be used to not only estimate the demand for required Court space for the
Aurora but to derive an estimate of jail space needs. Jail needs are discussed in the Sheriff
To estimate demand for Courts space in a City-County of Aurora, a low and high range i
on share of filings in each court in each County. Space needs are driven by number magistrates, which are first derived based on filings and average filings per judge and ma
is provided below:
Figure 24 District and County Courts Estimated Filings and Judges & Magistrates: Aurora Share
8/12/2019 Fiscal Feasibility Study: Formation of City-County of Aurora
Number and locat ion of Judges from http://www.courts.state.co.us/Courts/County/Choose.cfm.
1 2,839
1 1,830
City of Aurora, Colorado Appendix A. Service & Facility Delivery Plan Assumptions: City
Existing County Court Facilities
Arapahoe County has undergone recent expansions to its Justice Center with the addit
courtrooms, one expanded courtroom, a new jury room, and other improvements. Th
completed in 2009 at a cost of $13.8 million. Additional improvements are underway tocourthouses, enhance security, and improve the parking lots at a cost of $5.4 million. In a
expansion plans are identified in the County’s current CIP for an additional build out of 6
an estimated cost of $3.8 million in year 2016.
8/12/2019 Fiscal Feasibility Study: Formation of City-County of Aurora
Adams County expanded its Justice Center in 2009 with construction of approximately 1
feet, which results in total square footage of approximately 305,000 square feet in the C
Center. The County financed this expansion with a sale-leaseback of other county faccurrent lease (debt) obligations on this facility. The current appraised value of the Jus
approximately $85 million, or $280 per square foot.
Facility Needs: Courts to Serve City-County of Aurora
To estimate space needs to serve Aurora, levels of service are derived for services prov
and Arapahoe counties. Shown below is the total number of both County and District j
counties along with the estimated square footage provided for courts. Both counties ha
expansions in recent years to accommodate growing populations and needs. We la
“square feet per judge” to estimate demand for space based on current levels of service
square footage reflects all ancillary uses in the court facilities (such as jury rooms, com
offices, etc.).
Figure 25. Current County Courts Space and Square Feet per Judge and Magistrate
Total Estimated
Judges and Justice Center Sq. Ft. per
Magistrates* Sq. Ft. Judge^
Adams County (in the 17th JD) 26 305,000 11,731
Arapahoe County (in the 18th JD) 31 265,000 8,548
Total/Weighted Average 57 570,000 10,000
* In each County in either District or County Courts, as of FY2012
^ Includes all ancillary space in court facilities
City of Aurora, Colorado Appendix A. Service & Facility Delivery Plan Assumptions: City
by the City for the Municipal Court. County sheriffs’ offices can provide this service either
county deputies or contract services. The costs for these services are captured in the Sh
and section below.
Court System: Issues to Consider
The following items are noted:
• Assuming that the City-County of Aurora stays within the 18th Judicial District, th
have control over the number of County Judges, the number of District Judges, o
Probation Services as they will all fall under the State. The Governor would appo
and County judges. However, as a County, Aurora may have more of an oppor
with the Governor’s Office to provide input on selection criteria as well as all
residents to serve on the nominating commission and supply community fe
process, but the ultimate selection is by the Governor.
• Broomfield City-County is part of the 17th Judicial District and its District and Cou
funded and controlled by the State. The City-County has a separate Municipal Co
appointed by the Council. Unlike other counties in the state, the Clerk’s O
Municipal, County, and District Court Clerks’ functions with the state reimbu
County for a portion of the staffing.
• The Arapahoe County Justice Coordinating Committee works on addressing iss
justice system. Currently, the committee does not have municipal representation
of Aurora.3
• In counties that are part of the State Court system, the state reimburses 80 perce
state-mandated salaries for district attorneys with the localities in the Judicial Di
the remaining 20 percent However in many instances salaries are negotiated h
City of Aurora, Colorado Appendix A. Service & Facility Delivery Plan Assumptions: City
• Based on City Council direction at this phase of the analysis, court services and fa
modeled based on the City-County of Aurora remaining with the 18th Judicial Dis
elsewhere). However, if the City is interested in pursuing the formation of a new J
(which would allow for a combined Municipal-County Court), a separate st
necessary. The study should explore, but may not be limited to, the following itemformation; cost effectiveness of a shared system; trade-offs regarding fundin
revenue streams (state versus local); structure, reporting relationships, and
impacts for the District Attorney’s Office, Public Defenders Office, Probation
Clerk’s Office; and technology implications.
8/12/2019 Fiscal Feasibility Study: Formation of City-County of Aurora
There is some crossover with services provided by the City of Aurora today—by t
Department, the office of City Court Administrator (which includes Detention), and
Department. Figure 27 summarizes County Sheriff required services and assumptions
services by the City-County of Aurora.
Figure 27. Sheriff Duties and City-County of Aurora Service Assumptions
County Sheriff Duty/Function City-County Plan for Servic
• Serve as Custodian of Jails Expansion of and change to
services (City Courts and De
• Serve as Fire Warden; responsible for
Community Wildfire Plan and fire suppression
Provided by City currently (
• Transport prisoners (produce and escort
defendants)
Expansion of services provi
currently (City Courts and D
• Execute writs New service with annual op• Preserve the peace Provided by City currently
• Provide emergency response including HazMat Provided by City currently
• Issue state-mandated concealed handgun
permits
New service with annual op
(currently provided by coun
• Operate training center Provided by City currently
• Perform DNA Analysis Continue relationship with
Bureau of Investigation (CB
• Participate/oversee task forces Provided by City currently
• Operate bomb unit (countywide service ) New service with annual op
one time capital impacts (c
City of Aurora, Colorado Appendix A. Service & Facility Delivery Plan Assumptions: City
The major impacts from the formation of the City-County of Aurora would be the requir
City to expand its Detention services and facilities, provide civil processing services, staff
bomb squad, and issue concealed handgun permits.
A general summary of the budgets and staffing complement for Arapahoe and Adams coubelow. Detail by division/function is provided below because the two counties
departments differently.
Figure 28. Sheriff’s Office: County Current Levels of Service
8/12/2019 Fiscal Feasibility Study: Formation of City-County of Aurora
• Total sheriff office includes 690.5 FTEs (including Public Safety (which includes thenforcement contract with the City of Centennial));
• The Sheriff’s Office budget in the General Fund is $63.3 million; adding in all other
Arapahoe Law Enforcement Authority Fund) the total budget is $73.5 million.
Adams County:
• Total sheriff office 522.5 FTEs (including law enforcement and personnel under sp
• The Sheriff’s Office budget in the General Fund is $57.6 million; adding in other sp
the total budget is $58.8 million
Aurora City-County would need to provide Detention and Civil Processing functions. Each
turn along with other supporting expenditures.
Detention/Corrections
ARAPAHOE COUNTY ADAMS COUNTY
$ FTEs
Demand
Unit #
LOS
$/Unit $ FTEs
Demand
Unit
Sheriff (General Fund)* $63,253,829 628.8 see supporting figures $57,582,488 515.5 see supportSheriff (Special Funds)* $10,200,021 61.8 see supporting figures $ 1,24 3,382 7 .0 see support
Sheriff Total $73,453,850 690.5 $58,825,870 522.5
* Includes Law Enforcement
City of Aurora, Colorado Appendix A. Service & Facility Delivery Plan Assumptions: City
• The Arapahoe County Detention Facility houses municipal inmates and those sent
the 18th Judicial District courts. The facility provides a full medical unit onsite.
facility is accredited through the American Correctional Association and the medi
separate accreditation (through the National Commission on Correctional He
facility has a current capacity of 1,464 with a recent expansion in capacity that adby triple bunking. The County has recently purchased a tract of adjacent land (1
future expansion of the jail. The facility provides mental and behavioral health ser
services, job training programs, support groups, and education services.
8/12/2019 Fiscal Feasibility Study: Formation of City-County of Aurora
• The Adams County Detention Facility houses municipal inmates (at a capped amo
sentenced through the 17th Judicial District Courts. The facility provides full medic
current maximum capacity of 1,479. The facility itself has physical space for a cabeds. The County’s work-release program is run out of the jail. The facility provid
programs such as classes, support groups, recreation activities, and religious servi
The City of Aurora currently operates a 72-hour holding facility that has current operation
60 inmates. The facility itself has physical capacity for 220 inmates. If this facility were to
County Jail facility, some improvements would need to be made and operations wou
funded to adequately staff the 220 beds. This facility could be an interim step or a compon
facility, as baseline Detention needs for a City-County of Aurora would exceed 220 beds.
An overview of current levels of service for each county jail is shown below in Figure 29. F
purposes, we provide average costs per inmate and number of inmates per FTE fo
(including Douglas). Also shown are the weighted averages for the three counties combine
Figure 29. Average Cost per Inmate and Inmates per FTE
Current levels of service are determined based on several data sources, including inform
from the Sheriff’s Offices, budgets, and demographic factors. The following is a working e
share of expenses provided by each County Sheriff’s Office to serve the City of Aurora
starting point to derive current baseline fiscal requirements for Sheriff services. Additio
provided in this section reflecting those services provided by the City currently, nam
services, and an alternative approach to estimate operating costs for the City-County of Au
The first series of figures are Arapahoe County Sheriff services and costs.
Figure 30. Sheriff Annual Operating Costs: Baseline Aurora Share - Arapahoe County General Fund
Figure 31. Sheriff Annual Operating Costs: Baseline Aurora Share - Arapahoe County Special Fund
Arapahoe Count y Department
FY 2013 Gross GF
Expenditures [1]
% of
General
Fund # o f FTEs
Type of Service
[2] Allocation Methodology
Aurora
Factor [3]
Aur
SHERIFF'S OFFICE $63,253,829 see below
Sheriff-Administration $1,808,613 1% 15.00 Overhead Aurora % of Sheriff Direct 25%
Sheriff-Detention Services^^ $38,073,198 see below 397.50
Sheri ff-Detenti on/Cour t Support $3 1,97 3,19 8 2 0% 242.00 Countywide Custom (Jail %) 40% $12 Sheri ff-Detenti on Medi cal $4,600,000 3% Countywi de Cus tom (Ja il %) 40% $1
Based on the above data and assumptions, a baseline cost estimate is derived. The Detent
costs identified below reflect the demand for Jail space based on the percentages discusseis, 40 percent of Arapahoe County Detention average daily population (ADP) and 13 percen
County Detention ADP, or 616 ADP from Aurora.
Figure 35. Sheriff Annual Operating Costs: Aurora Current Estimate Based on Current County Serv
The operating impact to Aurora shown above in Figure 35 reflects the City’s estimated sh
,
Colorado 79 2,029 26 65 5
Outside CO 13 354 27 11
NA 57 2,001 35 65 5
Total 1,311 37,057 28 1,196 100
* Reflects sample data from July in respective year
Source: National Institute of Corrections, Justice System Assessment, Adams County (CO), October 201
in ARAPAHOE COUNTY in ADAMS COUNTY AURORA CITY-COUNTY
A ur or a Shar e in Each Count y Aur or a Shar e: Exist ing L eve ls of Se rvice and Cost s
[1] Reflects estimated Aurora sha re in all counties o derive level of service
[2] LOS= Level of Service (cost per demand unit)
[3] No additional demand from Douglas County portion of Aurora
[4] LOS cost x Total Demand Base in Aurora (rounded)
* Source City of Aurora Police Dept.; reflects annual op erating costs; no personnel costs included as assumption is City Police staff would be reassigned; one-time costs incl
City of Aurora, Colorado Appendix A. Service & Facility Delivery Plan Assumptions: City
Alternative Detention Population Estimate for Aurora
First, an alternative jail population from Aurora is estimated based on Court filings a
booking data. Using data from Court filings and jail population in each county jail, a relat
derived that indicates that approximately 18 percent of court filings in each county resubookings.
Figure 36. Jail Bookings as Percent of Court Filings
Arapahoe Adams Total/
C t C t Wtd A
8/12/2019 Fiscal Feasibility Study: Formation of City-County of Aurora
Sheriff: Other JAIL ADP $ 1,531.00 680 $1,041,000 8.0
$24,234,000 168.5
[1] Reflects estimated Aurora share in all counties to derive level of service[2] LOS= Level of Service (cost per demand unit)
[3] No additional demand from Douglas County portion of Aurora
[4] LOS cost x Total Demand Base in Aurora (rounded)
* Source City of Aurora Police Dept.; reflects annual operating costs; no personnel costs included as assumption is
City Police staff would be reassigned; one-time costs included in capital
City of Aurora, Colorado Appendix A. Service & Facility Delivery Plan Assumptions: City
Court Security
As noted in the Courts chapter, the City-County of Aurora would be required to provide
This service is currently provided by the City for the Municipal Court. County sheriffs’ offic
this service either through sworn county deputies or contract services. In Adams Couofficers, 2 Administrative Clerks, and 2 Supervisors—all County employees—provide t
addition, Adams County contracts with a private security firm to provide door security/s
costs for these services are included in the Sheriffs’ budgets used to derive levels of se
estimates.
8/12/2019 Fiscal Feasibility Study: Formation of City-County of Aurora
Human Ser vi ces - Lega l ** $ 2,2 77 ,4 63 7 8% $ 1,7 76 ,4 21 2 5.0 1 9.5 [W ei ghted aver age of data pOperati ons Di vi si on $1,897,879 64% $1,214,643 27.0 17.3 [Overhead/support calc]
further discussed under Sheriff chapter; costs shown here)
• Related administrative functions
Adams County has similar services housed in different departments in the County. Thes
included in this section. For purposes of this analysis, these services are grouped
“Community Resources.”
Workforce centers are fully federally funded and Judicial Services/Community Correctionfunding. Community Development activity is provided through federal block grants an
funds are received for a variety of purposes. The analysis includes those programs t
required to be provided by City-County of Aurora. Community Development activities ar
as they are already provided by the City of Aurora.
Figure 55. Community Resources Department: County Current Levels of Service
ARAPAHOE COUNTY ADAMS COU
$ FTEs Demand Unit #
LOS
$/Unit $ FTEs
Deman
Unit
Community Resources General Fund [1]
Comm Res -Admi ni str ati ve Ser vi ces $889,682 10.0 see supporting figures na na see supp
Comm Res-CSU Extension $452,400 5.0 $731,578 6.0
Comm Res-Senior Resources $309,816 4.3 na na
Comm Res-Veteran Services $160,100 2.0 $66,164 1.0
Comm Res-Judicial Services $1,475,914 21.0 $5,929,803 3.0
Comm Res-Community Dev Services $30,000 0.0 na na
Total $3,317,912 42.3 $6,727,545 10.0
Community Resources Special Funds [2]
ARAPAHOE/ DOUGLAS WORKS! FUND [3] $9,668,762 83.0 $7,880,862 64.2
GRANT FUND [4] $10,172,754 46.3 na na
Total $19,841,516 129.3 $7,880,862 64.2
Personal Costs Total (All Funds) $11,338,171 $4,564,378
City of Aurora, Colorado Appendix A. Service & Facility Delivery Plan Assumptions: City
Current baseline costs to serve Aurora, based on information provided by the County are s
Figure 56. Arapahoe County Community Resources Annual Operating Costs: Baseline Aurora Share
Arapahoe County Department
FY 2013 Gross GF
Expenditures [1]
% of
General
Fu nd # o f FTEs
Type of Service
[2] Allocation Methodology
Aurora
Factor [3]
Aur
COMMUNITY RESOURCES Comm Res -Ad mi ni str ati ve Ser vi ces $ 88 9,6 82 1 % 1 0.0 0 Coun tywi de O ver hea d (Aur or a % of CR Di rec t) 3 6%
Comm Res-CSU Extension $452,400 0% 5.00 Countywide Custom (Caseload) 26%
Comm Res-Senior Resources $309,816 0% 4.25 Countywide Custom (Caseload) 44%
Comm Res-Veteran Services $160,100 0% 2.00 Countywide Population 48%
Comm Res-Judicial Services $1,475,914 1% 21.00 Countywide Custom (Caseload) 38%
Comm Res-Community Dev Services $30,000 0% 0.00 Countywide Fixed 0%
Arapahoe County Community Resource functions are housed apart from Human Servidepartments. Below is a summary of estimated Aurora’s share of this space for services p
Community Resources.
City of Aurora, Colorado Appendix A. Service & Facility Delivery Plan Assumptions: City
Figure 60. Community Resources Facility Needs: Aurora Current Estimate
COMMUNITY RESOURCES County Totals % Aurora
Arapahoe County LOS
Admin-Arapahoe Plaza Sq. Ft. 3,000 36%
Arapahoe/Douglas Works!
Lima Plaza Sq. Ft. 32,000 47%Altura Plaza Sq. Ft. 4,600 47%
CentrePoint Plaza Sq. Ft. 1,100 47%
Arapahoe Plaza Sq. Ft. 200 0%
Phil l ip S. Miller Library (Castle Rock) Sq. Ft. 600 0%
CSU Extension-Datura Sq. Ft. 7850 0%
Judical Services
Altura Plaza Sq. Ft. 2,330 38%
Arapahoe Plaza Sq Ft 130 38%
8/12/2019 Fiscal Feasibility Study: Formation of City-County of Aurora
The City-County of Aurora will need to have a Surveyor. Adams County currently budgetsat $17,810. An estimated amount for the City-County of Aurora is based on this amount a
be $13,000.
Public Trustee
The County Public Trustee processes documents pertaining to foreclosures and release
trust (when mortgages are paid off). In foreclosure proceedings, the Public Trustee is expe
that the foreclosures are processed according to the law. The position is appointed by th
Colorado. The Public Trustee’s office is fully funded by fees for service and is not in
analysis.
Overhead/Supporting Costs
To reflect overhead and other non-line service costs that are not captured in the direc
above, we provide an estimate of allocated costs to the City of Aurora. To allocate Auro
derive a weighted average of Aurora’s direct costs to current County direct costs in each C
that percentage for each overhead/supporting cost component. Detail is provided below.
for potential additional research and analysis if the City moves forward with County formamore in-depth analysis of each county’s cost allocation plan as well as an examinati
provided by the City today and the incremental increase in services personnel and co
City of Aurora, Colorado Appendix A. Service & Facility Delivery Plan Assumptions: City
Figure 66. Arapahoe County Overhead/Support Cost Analysis: Aurora Share
Arapahoe County Department
FY 2013 Gross GF
Expenditures [1]
% of
General
Fund # of FTEs
Type of Service
[2]
Allocation
Methodology
Aurora
Factor [3]
Aurora
$
ADMINISTRATIVE SERVICES† $18,190,261 11% na Overhead Overhead 23% $93
† Gen. Fund amount shown, which includes transfers and pass-through funds. Aurora share is first reduced to reflect Admin. costs of $4,068,013 (then multip
†† Aurora share reflects estimated share of facility space allocated to Aurora services
[1] County adopted budget
[2] Service = Unincorporated, Countywide, Overhead, Internal Service
[3] Estim ated Aurora share of expenditures based on dem and factors shown in supporting tables
8/12/2019 Fiscal Feasibility Study: Formation of City-County of Aurora
† Gen. Fund amount shown, which i ncludes debt service and charges for services . Aurora share is first reduced to reflect operating costs of $1.7m (then multipl ied by
†† Aurora share reflects estimated share of facility space allocated to Aurora services
[1] County adopted budget
[2] Service = Unincorporated, Countywide, Overhead, Internal Service
[3] Estimated Aurora share of expenditures based on demand factors shown in supporting tables
City of Aurora, Colorado Appendix A. Service & Facility Delivery Plan Assumptions: City
Figure 68. Overhead/Support Services Annual Operating Costs: Aurora Current Estimate Ba
County Services
in ARAPAHOE COUNTY in ADAMS COUNTY AURORA CITY-COUNTY
Aur or a Shar e in Each Count y Aur or a Shar e: Exist ing L eve ls of Se rvice and Cost s
Arap $ Arap FTE Adams $Adams
FTE
Est. Aurora $
[1]
Allocation
Methodology
Demand
Units [1]
LOS ($ per
Dem. Unit) [2]
Total
Demand Base
in Aurora [3] (r
Overhead/Support
Admi ni stra ti ve Suppor t $935,643 NA $150,503 0.3 $1,086,146 POPULATI ON 339,935 $3.20 340,269
Legi sl ati ve (BOCC) $135,638 0.9 $31,893 0.3 $167,532 POPULATION 3 39,935 $0.50 340,269
In addition, IT system annual maintenance costs are modeled given the new system
County services such as Assessor/Treasurer, County Clerk, Coroner, Detention, and Asse
input from the Counties, an additional annual operating impact is estimated at approximat
Facility Needs
Finally, office space is estimated for these services. We assume a conservative 250 sq
employee resulting in a need for an additional 18,300 square feet of space.
Figure 69. Facility Space Estimate for Support Services
Both Arapahoe and Adams counties have existing debt on facilities that house the su
described above. The facilities are Lima Plaza (Arapahoe County) and the Adams County Building and the estimated outstanding debt allocated to Aurora prorated for these
i l $2 5 illi
[3] Expands the base to be served in Aurora to include Douglas County (added to Arapahoe and Adams counties)
[4] LOS cost x Total Demand Base in Aurora (rounded)
† Reflects current County levels of service appl ied to preliminary es timate of additional facility space (in SF) for City-County of Aurora.
Aurora City-County Estimates Sq. Ft $ per Sq. Ft.^ Est. CoEstimate based on Sq. Ft. per FTE* 73 FTEs 18,300 $200 $3,660
* Assumes 250 sq. ft. per employee
^ Average rounded construction cost estimates from Reed Construction Data and recent regional projects
8/12/2019 Fiscal Feasibility Study: Formation of City-County of Aurora
Figure 72. Adams County Outstanding Debt: Aurora Share by Facility
Adams County Est. Total Estd. Aurora Aurora
Total County Remaining Remaining Yrs Share Share
(SF) Debt of Debt Service of Space of Debt (%)
Administration building 324,000 $193,871,150 18*
Assessor 21,000 1,680 0.5
Clerk 33,280 4,480 1.4
Treasurer 7,300 584 0.2
Workforce & Business Service 20,000 2,260 0.7Support Functions 72,300 3,915 1.2
Subtotal 153,880 12,919
Justice Center 304,768 $8,230,695 18*
Justice Center (Phases 1 and 2) 304,768 39,620 13.0
Western Service Center 55,000 $5,450,275 11
Western Service Center 55,000 0 0.0
DA Building 65,000 $6,398,148 11
DA Building 65,000 8,450 13.0
Total Estimated Aurora Share
* Multiple phases
Sources: Adams County FY2012 CAFR; Adams County FY2013 Budget; departmental interviews; TischlerBise analysi
City of Aurora, Colorado Appendix A. Service & Facility Delivery Plan Assumptions: City
Existing County Facilities
Current facilities serving Aurora are potential candidates for continuation by the City-Cou
In particular are:
• Altura Plaza: Currently houses Assessor’s Office staff, Arapahoe/Douglas WorkResources, Tri-County Health, satellite Probation Office, and a Motor Vehicle offi
service. The current appraised value of the building and land is $5.5 million, wh
approximately $95 per square foot. Arapahoe County has plans in its current F
upgrades to the building, namely remodeling (2-year planned cost of $3.3 milli
replacement in 2015 ($500,000).
• Centrepoint Plaza: Currently houses Arapahoe County’s Human Services depar
City of Aurora comprises approximately 65 percent of the department’s activities
8/12/2019 Fiscal Feasibility Study: Formation of City-County of Aurora
City of Aurora comprises approximately 65 percent of the department s activities location, the building would be a candidate for City-County of Aurora use.
8/12/2019 Fiscal Feasibility Study: Formation of City-County of Aurora
TRI-COUNTY HEALTH $4,166,801 3% na Countywide Population (Formula) 48% $
TRANSFER TO OTHER FUNDS $0 0% na Fixed Fixed 0%
TOTAL GENERAL FUND* $158,757,203 100% 1369.50 $4
^ FY 2013 shown; Average of 2010 - 2013 used for Aurora share.
* Will not equal FY2013 County adopted budget due to m odifications in Comm Resources from departmental information provided
^^ Includes Detention, Court Support, and Civil Functions
† Gen. F und amount shown, which includes transfers and pass-through funds. Aurora share is first reduced to reflect Admin. cost of $4m ( then multiplied by Aurora factor)
†† Aurora share reflects estimated share of f acility space allocated to Aurora services
[1] County adopted budget
[2] Service = Unincorporated, Countywide, Overhead, Internal Service
[3] Es timated Aurora share of expenditures based on demand factors shown in supporting tables
City of Aurora, Colorado Appendix A. Service & Facility Delivery Plan Assumptions: City
Figure 75. Arapahoe County Special Funds Base Year Budget Detail and Allocation Methodologies
Arapahoe County Fund and Depart ment
FY 2013 Gross
Special Fund
Expenditures [1]
% of Total
Special
F unds # of F TEs
Type of Service
[2] Allocation Methodology
Aurora
Factor [3]
Aur
ARAPAHOE CO FAIR FUND-Community Resources $25,600 0% Unincorp. Fixed 0.0%
Open Spaces & Intergovernmental Relations $277,425 0% Unincorp. Fixed 0.0%
Public Works & Development $0 0% Unincorp. Fixed 0.0%
A county attorney may be elected or appointed, as must be provided by law. 10
The Colorado Constitution requires the above positions to be elected to four year terms
amendment to the Constitution creating the City-County of Aurora would allow for tordinances of the City-County of Aurora to govern the selection and compensation of req
By way of example, below is the relevant section of the City-County of Broomfield’s
amendment regarding required officers:
Section 11. Officers - city and county of Broomfield
The officers of the city and county of Broomfield shall be as provided for by
ordinances. The jurisdiction, term of office, and duties of such officers shall
November 15, 2001. The qualifications and duties of all such officers shall be as p
the city and county charter and ordinances, but the ordinances shall designate th
shall perform the acts and duties required of county officers pursuant to this cons
general laws of the state of Colorado, as far as applicable. All compensation for e
shall be determined by ordinance and not by state statute. If any elected officer
county of Broomfield shall receive any compensation, such officer shall receive
stated salary, the amount of which shall be fixed by ordinance within limits fixed
county charter or by resolution approving the city and county budget and paid in
payments. No elected officer shall receive any increase or decrease in compensa
City of Aurora, Colorado Appendix A. Service & Facility Delivery Plan Assumptions: City
The text herein reflects the requirements as currently set forth in the Colorado Constit
that the required County officers are to be elected. Again, as part of the County formati
amendment to the Constitution can alter this requirement.
Assessor
Election
A county assessor shall be elected at a general election for a four year term. He or she sha
the people of Colorado with two or more sufficient sureties in a sum of $6,000 or
performance of the assessor’s duties according to law and to the satisfaction of the board
bond required, a county may purchase crime insurance coverage in an amount not less th
behalf of the assessor to protect the county from any malfeasance on the part of the asoffice.11
8/12/2019 Fiscal Feasibility Study: Formation of City-County of Aurora
Conduct Elections. The County Clerk and Recorder is a county’s chief election official r
conducting elections to include national, state, city, county, special districts, and s
Responsibilities are enumerated throughout C.R.S. Title 1, Elections.
Record Deeds and Maintain Documents. The county clerk is the recorder of deeds and sh
and preserve all documents received for recording or filing in his or her office. The clerk
must record or cause to be recorded all documents authorized by law to be recorded. U
any document to which a documentary fee applies, the clerk and recorder shall fo
complete, and accurate copy of such document to the office of the county assessor.19
Other items that the county clerk and recorder shall maintain include:
• Grantor index and grantee index.20
• Reception book. When any document has been accepted by the clerk and recorde
and the proper fee has been paid, such document shall be deemed to be re
purposes. After a document has been received, the clerk and recorder shall endo
document information.
21
• File of all subdivision plats and common interest community plats or maps
recording in accordance with law.
22
• Trade name registration records provided by the department of revenue. 23
Administer Oaths and Take Affidavits and Depositions. The county clerks and recorders
to administer all oaths of office, and other oaths, and to take affidavits and dep
City of Aurora, Colorado Appendix A. Service & Facility Delivery Plan Assumptions: City
administering oaths and taking affidavits or depositions, county clerk and recorders shall
prescribed by section 30-1-103 (2) (a).25
Collect Fee for Technology Fund. Through June 30, 2017, the county clerk and recorder
surcharge of $1 for each document received for recording or filing, in addition to any ot
cents of each dollar shall be transmitted to the secretary of state, who will place the monand recorder technology fund. The remaining fifty cents can be retained by the clerk and
separate account, or be transmitted to the technology fund. If retained, the money shou
an electronic filing system or a core filing system. 26 The clerk and recorder techn
administered by the secretary of state.27
Record and Process Designated Beneficiary Agreements. A signed and acknowledg
beneficiary agreement shall be recorded with the county clerk and recorder in the countof the parties resides. The county clerk and recorder shall assess a recording fee for
of the parties resides. The county clerk and recorder shall assess a recording fee for
designated beneficiary agreement in that county, a fee for issuing two certified copies of t
beneficiary agreement that indicate the date and time of recording with the county, and a
acknowledgments. All fees collected by the county clerk and recorder shall be deposited
clerk's fee fund maintained as required in section 30-1-119, C.R.S.
The clerk and recorder of the county shall have the following duties:• To indicate on the designated beneficiary agreement or a revocation of a designa
agreement the date and time that it is recorded with the clerk and recorder;
• To issue two certified copies of the recorded designated beneficiary agreement th
date and time of the recording;
• To issue replacement certified copies of a designated beneficiary agreement or a
designated beneficiary agreement upon payment of a replacement fee.
• Designated beneficiary agreements and revocations of designated beneficiary agbe considered open records for purposes of part 2 of article 72 of title 24, C.R.S.
Coroner
Election
A coroner shall be elected in each county for the term of four years. Before entering the o
shall give bond to the people of Colorado for $25 000 or more with sufficient sureties to b
City of Aurora, Colorado Appendix A. Service & Facility Delivery Plan Assumptions: City
Requirements to Assume Position
A person is eligible to hold the office of coroner if she or she is a citizen of the United Sta
of Colorado, and of the county in which the person will hold the office of coroner. He or
earned a high school diploma, its equivalent, or a college degree, and have given a set of
background check must be done, and if a person who has been convicted or pleadedfederal charge under federal or state law is unqualified for the office unless pardoned.29
A person who is elected or appointed to the office of coroner for the first time shall:
• Attend a training course for new coroners of at least forty hours using the curricu
by the C.C.S.T. board.
• Obtain certification in basic medical-legal death investigation from the Colo
association or another training provider approved by the C.C.S.T. board.
• Complete a minimum of sixteen hours of in service training provided by the Colo
8/12/2019 Fiscal Feasibility Study: Formation of City-County of Aurora
• Complete a minimum of sixteen hours of in-service training provided by the Colo
association or by another training provider approved by the C.C.S.T. board durin
the coroner's term.
The C.C.S.T. board shall have discretion to waive or alter any of the above requirements.30
authorized to appoint a deputy, which must be in writing and filed in the office of the
coroner may delegate any of the coroner’s powers to one or more deputies. Each debefore entering the duties of office, shall file with the county clerk and recorder of the co
and oath of office required by law to be filed by the coroner. In lieu of the bond required
purchase crime insurance coverage on behalf of the deputy coroner to protect the people
from any malfeasance on the part of the deputy coroner while in office.31
Duties
Serve as Sheriff Under Certain Circumstances. When there is no sheriff in any county, itthe coroner to exercise all the powers and duties of the sheriff of his county until a sherif
or elected and qualified; and when the sheriff for any cause is committed to the jail of h
coroner shall be keeper of such jail during the time the sheriff remains a prisoner. 32
Perform Inquiry, Report, and Autopsy. The coroner shall immediately notify the dis
proceed to view the body, and make all proper inquiry respecting the cause and manner o
person in his jurisdiction who has died under the following circumstances:• From external violence, unexplained cause, or under suspicious circumstances;
City of Aurora, Colorado Appendix A. Service & Facility Delivery Plan Assumptions: City
• From criminal abortion, including any situation where such abortion may ha
induced;
• From a disease which may be hazardous or contagious or which may constitute a
health of the general public;
• While in the custody of law enforcement officials or while incarcerated in a public
• When the death was sudden and happened to a person who was in good health; o• From an industrial accident.
After consultation with the district attorney, the coroner may request that jurisdiction of
be transferred to the coroner of the county in which the event which resulted in the death
occurred, with the jurisdiction effective upon the acceptance by the receiving coroner.
When a person dies as a result of circumstances specified or is found dead and the cauunknown, the person who discovers the death shall report it immediately to law enforcem
8/12/2019 Fiscal Feasibility Study: Formation of City-County of Aurora
the coroner, and the coroner shall take legal custody of the body. The body of any such p
be removed from the place of death except upon the authority of the coroner in consult
district attorney or local law enforcement agency, nor shall any article on or immediate
such body be disturbed until authorized by the coroner in consultation with the district at
law enforcement agency. The coroner shall perform a forensic autopsy or have a fo
performed as required by section 30-10-606.5 or upon the request of the dist
When the coroner has knowledge that any person has died under any of the circumsta
above, he may summon forthwith six citizens of the county to appear at a place nam
inquest to hear testimony and to make such inquiries as he deems appropriate.
Issue Certificate of Death. In all cases where the coroner has held an investigation o
certificate of death shall be issued by the coroner or the coroner's deputy. Any certifissued by a coroner or a coroner's deputy shall be filed with the registrar and shall state
concerning the nature of the disease or the manner of death, and, if from external causes,
shall state whether in their opinion death was accidental, suicidal, or felonious. In
certificate shall include the information described in section 25-2-103 (3) (b), C.R.S.,
subject of the investigation or inquest is under one year of age. A copy of the certifica
affidavit of presumed death, including any related documents and statements of fact, sh
in the applicable county in a secure location in an appropriate county facility accessibcounty coroner or the coroner's designee and in a manner that is consistent with the c
l d f d l l
City of Aurora, Colorado Appendix A. Service & Facility Delivery Plan Assumptions: City
• Any information, record, or report related to treatment, consultation, counseli
services from any licensed psychologist, professional counselor, marriage and fa
social worker, or addiction counselor, certified addiction counselor,
psychotherapist if the report, record, or information is relevant to the inquest or i
Order Arrest. The coroner may order his arrest by an officer or any person and shal
warrant requiring the officer or other person to take him before the county court if the p
is present. If the person charged is not present and the coroner believes he can be take
may issue a warrant to the sheriff of the county, requiring him to arrest the person and ta
the county court.34
Arrange Burial of Deceased Persons. The coroner shall arrange for the body of a deceased
he is called to view to be delivered to his friends if there are any. If not he shall cause him
buried, the expenses to be paid from any property found with the body, or, if there is n35
8/12/2019 Fiscal Feasibility Study: Formation of City-County of Aurora
County treasurers must be elected in each county for a four year term. Before beginn
duties, the treasurer must execute to the people of the state of Colorado a surety bond t
by the board of county commissioners (board) and to be filed in the office of the cou
recorder.57
Duties
Receive and Pay Moneys. It is the duty of the county treasurer to receive all money be
county from all sources. All money received by him or she shall be paid out only on the
board of county commissioners, according to law.58
Deposit Funds. The treasurer must deposit all funds and moneys that come into his or h
virtue of the office into one or more state or national banks, or previously approved sa
associations. The board may authorize the county treasurer to invest all or any part of
moneys in securities meeting the investment requirements established in part 6 of article
C.R.S. All securities so purchased shall be duly registered in the name of the cou
and shall be deposited and safely kept in the custody of some state bank or
bank.59
Keep Accounts. The treasurer shall keep a true account of the receipt and expenditurethat come into his or her hands in books to be kept for this purpose. The records should
City of Aurora, Colorado Appendix A. Service & Facility Delivery Plan Assumptions: City
and shall report to the board of county commissioners regarding the disposition of the rec
or finding no later than ninety days after the issuance of the final audit report.60
Apportion and Separate Funds. The treasurer must apportion and keep all taxes collected
funds for which they were levied. The amount of interest gained through the in
county funds, regardless of the origin of such funds, may be credited to the gethe county by the county treasurer, unless such investment is made from s
allocated for a definite purpose and so maintained.61
Give Notice for Payment of Warrants. When there is in the treasury, to the credit of any
more, against which fund there are any outstanding and unpaid lawful warrants or orde
treasurer shall immediately give public notice of the fact by a written notice posted for thi
outer door of the office of the treasurer. The treasurer, at the same time, shall call in f
outstanding and unpaid lawful warrants and orders drawn on said fund which the m
treasury will pay and which are entitled to payment from said funds. 62
8/12/2019 Fiscal Feasibility Study: Formation of City-County of Aurora
treasury will pay and which are entitled to payment from said funds.
Collect Taxes. The county treasurer serves as the collector of taxes.63 Upon payment,
should issue a receipt to the person paying it. In the case of taxes, the receipt must state
of property taxed, the rate of taxation, and the total amount of such taxes to agree with h
Assess Property. Assess, at a fair value, the property of any person liable to pay taxes wh
assessor has failed to assess, to place the same on the tax roll, and to collect taxes.65
City of Aurora, Colorado Appendix A. Service & Facility Delivery Plan Assumptions: City
APPENDIX C: COUNTY OFFICIALS IN CONSOL
CITY-COUNTIES
This section provides further information on how the current consolidated city-counties
Denver and Broomfield—handle required County functions. This section includes all s
courts.
Summary: For both Denver and Broomfield, all the positions are appointed or hired, exce
Clerk and Recorder. In Denver, all the positions are filled by a traditional officer as s
Colorado State Code, with the exception of the Sheriff. The Manager of Safety overseeDepartment as well as the Police and Fire Departments, and the Undersheriff/ Director
supervises the Sheriff’s Department
8/12/2019 Fiscal Feasibility Study: Formation of City-County of Aurora
o Performs the duties required by law of a county coroner.
Sheriff
• Leadership
o The “manager of safety” exercises the powers and performs the duties of
Appointed by the Mayor of Denver
o Sheriff’s Department is supervised by the Director of Corrections and Und Appointed by the Mayor of Denver
• Duties – Manager of Safety
o Serves as officer in full charge of the Department of Safety. The Depart
has full control of the departments of fire and police and additionally pe
required by the State to be exercised and performed by the sheriff. 79
o Establishes, maintains, and can manage a community corrections
activities for the incarceration, oversight, and rehabilitation of offenders.
8
o Appoint special police officers and patrol officers, with or without pay fronecessary, all of whom shall be subject to the orders of the Chief of Polic
authorized and empowered to do and perform such of the duties of the m
police force.81
o Delegates duties to the Sheriff Department.
82
• Duties - Director of Corrections/ Undersheriff
o Not listed in Charter or Revised Municipal Code. Website reports that:
71 Denver, Colorado Code of Ordinances. Title I § 8.1.2.72
Denver, Colorado Code of Ordinances. Title I § 8.1.2.
City of Aurora, Colorado Appendix A. Service & Facility Delivery Plan Assumptions: City
The Denver Sheriff Department is responsible for the care,
transport of prisoners for the City and County of Denver.
Director of Corrections/ Undersheriff oversees:
• County Jail Division: long term care and custody of prisone
• Downtown Division: prisoner intake center where
processed into the system and housed until such a time
able to make bond, or have been given an advisementThe Civil Division, Court Services Unit and the Correctiona
Facility (located at Denver Health) also reside under t
Division.
• Technology, Support and Special Projects Division: T
responsible for the Department's overall administratio
projects, the Training Academy and the Vehicle Impound
• History
o The Denver Sheriff’s Department was established in 1969, which consolidsheriff’s functions under one management structure.
City of Aurora, Colorado Appendix A. Service & Facility Delivery Plan Assumptions: City
Table 2: Future Minimum Obligations
Table 3 displays the annual payments schedule for the Western Services Facility and Of
Building, as well as what is remaining, which is the total payments from 2014 to 2023. Tare using the square footage of the buildings, as shown above in Table 1.