Fiscal Governance and Public Services: Evidence from Tanzania and Zambia Barak D. Hoffman Clark C. Gibson Department of Political Science University of California, San Diego September 2005 Abstract Does a government’s source of revenue explain its policies? The predominate view in development studies contends that policy variation results directly from institutional variation. Building on a literature which we label fiscal theories of governance, we argue that a government’s sources of revenue strongly affect its public expenditures, independent of institutions. Using data from local government budgets in Tanzania and Zambia, we find that local governments in both countries produce more public services as their budget’s share of local taxes increases. Alternatively, revenue that local governments receive from sources outside their boundaries -- transfers from the central government and foreign assistance -- increases the share of local budgets consumed by employee benefits and administrative costs. Because there is no variation in the powers of local governments in Tanzania and Zambia, the effects of revenue sources on public expenditure that we find are independent of political institutions. The results suggest that fiscal accountability is an important factor to consider when designing policies to enhance local government capacity. Barak Hoffman Clark Gibson UCSD UCSD 9500 Gilman 9500 Gilman La Jolla CA 92093-0521 La Jolla CA 92093-0521 858.248.9087 858. 822.5140 [email protected][email protected]
Transcript
Fiscal Governance and Public Services: Evidence from Tanzania and Zambia
Barak D. Hoffman
Clark C. Gibson
Department of Political Science
University of California, San Diego
September 2005
Abstract
Does a government’s source of revenue explain its policies? The predominate view in development studies contends that policy variation results directly from institutional variation. Building on a literature which we label fiscal theories of governance, we argue that a government’s sources of revenue strongly affect its public expenditures, independent of institutions. Using data from local government budgets in Tanzania and Zambia, we find that local governments in both countries produce more public services as their budget’s share of local taxes increases. Alternatively, revenue that local governments receive from sources outside their boundaries -- transfers from the central government and foreign assistance -- increases the share of local budgets consumed by employee benefits and administrative costs. Because there is no variation in the powers of local governments in Tanzania and Zambia, the effects of revenue sources on public expenditure that we find are independent of political institutions. The results suggest that fiscal accountability is an important factor to consider when designing policies to enhance local government capacity.
Barak Hoffman Clark Gibson UCSD UCSD 9500 Gilman 9500 Gilman La Jolla CA 92093-0521 La Jolla CA 92093-0521 858.248.9087 858. 822.5140 [email protected][email protected]
I. Introduction Arumeru District and Monduli District in Tanzania share a number of similarities. The adjacent districts have identical political institutions, are overwhelmingly agricultural, and are relatively free from ethno-religious conflict. In fact, on nearly every dimension that economists, political scientists, and development practitioners have claimed as important for development - endowments, political institutions, geography, climate, economic structure, and ethno-religious relations - Arumeru and Monduli are practically identical. How then are we to explain the enormous variation in levels of development that exist between the two districts? The literacy rate in Arumeru is 72% whereas the literacy rate in Monduli is 39%; the net primary enrollment rate is 79% in Arumeru and 45% in Monduli; 70% of households have a radio in Aruemru but only 35% have a radio in Monduli. The gulf between Arumeru and Monduli’s development levels is not unique. Within Tanzania, district literacy rates range from 27% to 92% and net primary school enrollment rates range from 37% to 93%. In neighboring Zambia these puzzling variations also exist: life expectancy ranges from 34 years to 59 years and infant mortality range from 7% to 20%. How do we explain such different levels of development within these countries? In this study we explore one of the causes of these disparities. Building on a literature which we label fiscal theories of governance, we argue that a local government’s revenue source is central to explaining its policy choices. We find that local governments in Tanzania and Zambia produce more public services as a share of total local government expenditure as local revenue increases. Alternatively, as central government transfers and foreign aid increase, public services as a share of the local government budget falls. Not only does this effect remain after controlling for socioeconomic factors but, more importantly, the influence of sources of revenue on local government expenditure that we find is independent of political institutions because no variation in political institutions at the local level in either country. This study furthers our understanding of the politics of development in several important ways. First, unlike the larger set of studies that link political institutions to policy and development outcomes, we examine the effects of revenue on public expenditure under identical political institutions. The main thrust of the political institutional approach is to tie policy outcomes to political institutions; our approach demonstrates that there is another source of political accountability independent of formal political institutions: the fiscal link between the government and the governed. Understanding these fiscal links, we argue, is central to understanding development in general and the political effect of foreign aid in particular. Second, our research design allows us to test directly the influence of revenue streams on government choices. We use district level government budget data from Tanzania and Zambia, two countries where there is no variation in political institutions at the local level. Our research design is a methodological advance over most quantitative studies of
how revenue sources affect policy choices that use cross national data and rely on control variables to account for the differences in political institutions across countries. Further, because local level political institutions do not vary within either country but local level political institutions vary widely between the two countries - local governments in Tanzania are dominated by the center while Zambia’s district governments enjoy greater powers – we are also able to explore the strength of revenue effects on policy outcomes under two different sets of institutions. We believe this is the first study to implement such a research design. Third, we use the entire local government budget in our research. Existing studies that attempt to explain sub-national variation in public policy outcomes tend to examine single sectors. Such research could produce misleading results because demand for different types of public services varies widely and this variation manifests itself in wide differences in expenditures across different types public services. Using the entire local budget provides a comprehensive analysis of how sources of revenue affect policy choices The results of this study bear directly on current development policy. Through programs of institutional reform, donors are placing considerable effort into increasing the accountability of local governments in these two countries. Our results predict that the success or failure of these policies depends partly on the structure of local government revenue. Specifically, institutional reform that results in substituting local taxes for donor and/or government transfers, as recently occurred in Tanzania, could undermine efforts to increase local government accountability. We present our study in six parts. We review the theoretical foundations of our approach in section II. In section III, we provide background information on the countries we use to test our hypotheses, Tanzania and Zambia. Section IV presents the data and methods that we use in testing our fiscal theory of governance. We discuss the results in section V. Section VI concludes. II. Theoretical Foundations Political Institutions The provision of public services is a central topic in political science. The vast majority of this work explores how political institutions affect government policies. Much of this research is cross-national and centers around how differences in types of democratic institutions such as political systems (e.g. presidential versus parliamentary), electoral rules (e.g., first past the post versus run-offs), electoral systems (single-member districts versus multimember districts), the degree of separation of powers (veto points), and the relationship between local governments and central governments affect public policy outcomes (see Bardhan 2001, Bardhan, and Mookherjee 2005b, Carey and Shugart 1995, Cox 1997, Linz 1990 and 1994, Lijphart 1999, McIntyre 2003, Persson and Tabellini 2003; Perrson et al., 2003, Perrson et al., 2005, Shugart and Carey 1992, Shugart and Mainwaring 1997, Tsebelis 2002).
2
At the sub-national level, scholars have developed a large body of research that examines the consequences of decentralization for political accountability.1 Studies of decentralization generally explore how changes in the political power of local governments shape public policy outcomes (Rondinelli, et al. 1989, Inman and Rubinfeld 1996, Ferejohn and Weingast 1997). Studies that focus on the effect of decentralization on the provision of public services generally seek to adjudicate between two hypotheses. Proponents of decentralization argue it should increase accountability because local governments are more accountable that distant central governments. Opponents of decentralization argue that decentralization may reduce local provision of public services because local elites can divert public funds more easily through a decentralized system of than a centralized one.2 Evidence exists to support both hypotheses; many of the studies find evidence to support both hypotheses within the same country and even within the same village (e.g., Bardhan and Mookherjee 2004; Galasso and Ravillon 2005). Reinikka and Svensson (2004), for example, examine the effect of a school capitation program in Uganda and found that central government grants to schools benefited students mainly in well-off districts while local elites were able to divert the capitation grants in relatively poorer districts. Galiani et al. (2005) present similar results in their study of Argentine school decentralization. According to their study, decentralization facilitated the ability of elites to divert funds in poor towns in poorly-run provinces while decentralization led to more active oversight of schools in non-poor towns in well-run provinces. Most surprisingly, Bardhan and Mookherjee (2004) and Galasso and Ravillon (2005) found evidence of elites diverting funds and increased accountability within villages.3 These studies are an important addition to our understanding of the links between public policy, institutions, and accountability. Generally the studies find that local factors, such as level of development, inequality, and the ability of citizens to participate in local politics, are important intervening factors that determine how decentralization affects the distribution of public services. Such findings point to the limitations of institutions as explanatory variables for public policy outcomes. Fiscal Theories of Governance Political institutions are not the only mechanisms that political scientists have employed to explain public policy outcomes. A smaller but important set of studies explores how the fiscal relationship between the government and the governed can help explain public
1 See Ahmed et al. (2005) and Bardhan and Mookherjee (2005b) for a review of these studies. 2 See Bardhan (2001), Bardhan and Mookherjee (2005a), and Bardhan and Mookherjee (2005b) for a comprehensive summary of this debate. 3 While Galasso and Ravillon (2005) find that the larger the proportion of poor people in the village the greater the share given to the poor, they also find that as village inequality rises, the proportion going to the poor falls. Along the same lines, Bardhan and Mookherjee (2004) found that while village governments in West Bengal, India were far better at targeting the poor than were higher levels of government but also found some evidence of elite capture.
3
policy outcomes; we call these fiscal theories of governance. Fiscal theories of governance argue two central points. First, the shape of political institutions reflects a government’s need for revenue (e.g., Bates and Lien 1985; Levi 1988; Moore 1995). This line of thinking is found most prominently in the work of scholars seeking to explain the evolution of state structure. In general, this approach holds that a government has incentives to defer to its citizens’ policy preferences when it is dependent on its citizens for revenue. Alternatively, when a government is not dependent on its citizens to raise revenue, the government has fewer incentives to defer to its citizens’ policy preferences (Moore 1998). Second, taxpayers benefit from government policies roughly in proportion with the share of government revenue they finance (e.g. Bates and Lien 1985; Boix 2002; Lindert 2004). Fiscal theories of governance have considerable power in explaining political outcomes. Levi (1988), for example, uses evidence from ancient Rome, England and France in the Middle Ages, 18th Century Britain, and modern Australia to demonstrate that since tax payments are to a certain extent voluntary, governments need to create compliance (or cede policy making power) in order to generate revenue. Other scholars have used fiscal theories of governance to develop compelling arguments to account for the rise of democratic political institutions in Europe (e.g., Bates 2001, Downing 1992, North and Weingast 1989, Root 1992, Tilly 1992). According to Tilly (1992), for example, as wars in Europe became more expensive, raising revenue and troops through coercion became an increasingly inefficient strategy. As coercion became a less effective strategy for raising resources needed to fight wars, monarchs sought to generate revenue through policy concessions and policies that facilitated economic development. Bates and Lien (1985) use a formal model to predict a similar outcome and make the important point that the more mobile capital is the more policy making power a government must cede in order to generate revenue. These works help us to understand that origins of public revenue can have a dramatic impact on the structure and policies of government, as well as the developmental outcomes associated with those policies. Studies from politics in rentier economies extend this logic to assert that external funds (i.e., funds not raised from the domestic population) should impede the development of democracy since valuable external resources, such as oil, reduce the dependence of the government on the governed (e.g., Karl 1997; Ross 2001; Tornell and Lane 1998). According to Ross (2001), there are three causal mechanisms that lead from oil and mineral dependence to reduced political accountability. The first is the rentier effect. The rentier effect inhibits democratic accountability because governments that derive their revenue from easily exploitable natural resources do not need to tax their populations and therefore face no fiscal pressure from their citizens to produce public services. The second mechanism is the repression effect where external sources of revenue give the state greater coercive power. The third effect is the modernization effect. Because a rentier economy tends to inhibit industrial development (see Sachs and Warner 1998), resource-based economies are not subject to economic forces that often catalyze citizen demand for democratic governance, such as education, industrialization, and urbanization.
4
A number of scholars have extended the logic of rentier economics to suggest that foreign aid may generate the same political incentives as rentier commodities, especially if conditions on aid are weakly enforced (Brautigam 2000, Coolidge and Rose-Ackerman 1997, Knack 2000, Moore 1995, and Svennson 2000). Moore (1995) argues that foreign aid, like easily exploitable natural resources, reduces the need for the government to collect taxes and as a result, reduces fiscal accountability. Similarly, Brautigam (2000) argues that long-term dependence on foreign aid undermines the quality of governance, reduces pressure for reform and accountability, and diminishes effort to collect taxes. Triesman (2000) extends this logic to transfers from the central government to local governments. Our Approach We borrow from fiscal theories of governance to explain patterns of local government expenditure in Tanzania and Zambia. Unlike studies that examine the effect of political institutions on public policy outcomes, political institutions in our sample do not vary at the local level. Moreover, we also diverge from decentralization studies that seek to determine the effect of a change of institutions (e.g., from more centralized to less centralized) on the supply of public services. Finally, we also depart from studies using fiscal theories of the governance to investigate how sources of public revenue influence political institutions. Rather, we examine how sources of revenue affect public policy - in this case public expenditure - when there is no variation in political institutions. Following theories of fiscal governance, we hypothesize that the more local revenue a local government collects, the larger the share of public services in the local government budget. Alternatively, we hypothesize that the more transfers and foreign aid a local government receives, the smaller the share of public services in the local government budget. As long as there are local elections, we expect this relationship to hold independent of political institutions. Using district level data from Tanzania and Zambia offers a major advantage over cross-national studies that have attempted to understand the effects of revenue streams on public policy outcomes.4 Unlike cross-national studies, we do not need to rely on control variables to account for differences in political institutions across countries because the political institutions for our unit of analysis - district governments - do not vary within each country.5 Because political institutions are orthogonal to our variables of interest (sources of revenue for local governments), we can be certain that our results do not reflect any correlation between revenue sources and political institutions. Finally, one benefit of our study compared to the studies we have cited that examine the effect of decentralization on public service delivery is that we examine the entire local budget, not just a specific program or policy area. This is an advance because studies that examine the effect of decentralization on one program or area face the difficulty that demand for different public services varies widely. For example, Azfar, et al. (2001) 4 We study each country separately. 5 See Snyder (2001)
5
found that in Uganda, sub-national preferences were far stronger for primary education than for immunization. Local leaders, in turn, were far more sensitive to the quality of primary education than to the quality of immunization. As a result, separate studies of each program would lead to drastically different results. By using the entire local budget, we can make the far more simple and plausible assumption that the majority of the public would prefer that the local government allocate funds to public services rather than to salaries and administrative costs. III. Tanzania and Zambia Tanzania and Zambia share many important similarities that make them excellent cases for this study (see table 1). First, both countries are in the same agro-climactic region. Second, both countries exhibit quite similar economies and levels of development. Out of 174 countries, Tanzania is ranked 162 and Zambia is rankled 164 on the UNDP’s Human Development Index. Given their poverty it is not surprising that both countries are very large aid recipients. Third, the two countries have a broadly similar political history. Both countries are former British colonies and attained independence at about the same time. Moreover both countries were one-party quasi-Socialist regimes in the 1970s and 1980s, democratized in the early 1990s, and are relatively free of ethic and/or religious conflict.6 Currently, Tanzania and Zambia have very similar ratings in terms of the two most popular measures of democracy, Freedom House and Polity. The critical political difference between the two today is that the ruling party in Tanzania during the single-party regime has won the first two multi-party elections (1995 and 2000) while Zambia’s single party was replaced through multiparty elections in 1991. Fourth, Tanzania and Zambia have similar electoral systems at the national level and local level. Both countries have direct elections for president, elect members of parliament in single member districts using a first-past-the-post system, elect councilors at the local level, and allow for reelection for president, parliament, and local councilors.
6 The Minorities at Risk (MAR) database does not view any sub-national group within mainland Tanzania or Zambia as an immediate risk for rebellion. However, it is important to note that MAR data suggest Zanzibar in Tanzania and the Lozi in Zambia could be future threats.
6
Table 1: Economic, Political and Social Comparison between Tanzania and Zambia
Tanzania Zambia National Population 36 million 10 million Urban Population as a Share of Total Population 34% 40% Life Expectancy 43 37 Fertility Rate 5 5 Infant Mortality Rate 10% 10% Child Mortality Rate 17% 18% Adult HIV Infection Rate 9% 16% Adult Literacy Rate 78% 80% Net Primary Enrollment 68% 69% Primary Completion Rate 58% 58% Per Capita GDP (Nominal) 300 380 Per Capita GDP (PPP) 580 840 Agriculture as a Percent of GDP 44% 22% UNDP Human Development Rank (out of 174) 162 164 Polity Score 2 1 Freedom House Rating Partly Free Partly Free Democratic Transition 1995 1991 Corruption (Transparency International)* 2.8 2.6 ICRG Composite Investment Risk** 58 48 Index of Economic Freedom (Heritage Foundation) Mostly Not Free Mostly Not Free Aid/GDP 13% 18% Aid/Per Capita 47 54 Local Average Population Per District 280,000 140,000 District Employee Benefits Per Capita $11.43 $7.35 District Other Charges Per Capita $6.28 $4.64 District Government Consumption Per Capita*** $17.71 $11.99 District Government Consumption a Share of GDP 5.9% 3.2% Probability Recurrent Costs are Equal (p-value) <.01
* Scale 1-10 (worst to best) ** Scale 0-100 (highest risk to lowest risk) *** Government Consumption equals Employee Benefits plus Administrative Costs The key institutional difference for the purposes of our study between the two countries is that while local governments in Tanzania are almost wholly reliant on the central government for funding, local governments in Zambia are much more fiscally autonomous. About 90% of district government revenue in Tanzania comes from central government transfers whereas only about 15% of local government revenue in Zambia comes from central government transfers. Not surprisingly, local governments have more political independence from the central government in Zambia than in Tanzania. This difference is important for our analysis because our results demonstrate that fiscal incentives of local governments operate independent of their link to the central government and independent of the share of local the local budget financed by local revenue.
7
To be clear, we are not comparing Tanzania to Zambia. We are looking for similar patterns in local government behavior across local governments in two countries with different political institutions. We study two countries because we want to be certain that our results are not idiosyncratic to one country or one set of institutions. Moreover, if local governments react the same way irrespective of the power of local government, then we will have evidence or a more general phenomenon. IV. Data and Methods Unit of Analysis and Data Sources Our unit of analysis is the district. Districts in Tanzania and Zambia are roughly the equivalent of counties (or cities that are their own county) in the United States. There are 116 districts in mainland Tanzania and 72 districts in Zambia. On average, the population of districts in both Tanzania and Zambia is about 200,000. In Tanzania the source of the data are the Medium Term Expenditure Frameworks (MTEFs) for each district in the country. MTEFs typically include detailed budget information that identify the source of revenue (local, central government transfer, and external assistance) and expenditures by individual components. MTEFs are completed annually and use a three-year rolling budget form of planning.7 In Zambia our data sources are local government budgets. Currently, local governments in Zambia produce detailed budgets on district revenue and expenditure. Budgets in Tanzania and Zambia report three general categories of local government expenditure. The first is personal emoluments which are salaries and other direct employee benefits. The second is administrative costs, such as supplies, maintenance, and vehicles. The sum of personal emoluments and administrative costs are total recurrent costs or government consumption. The third category of expenditure is public services. Public services are all expenditures that are aimed at district improvement. While public services includes public-type goods, such as education and health, public services also include narrowly-targeted benefits, such as bus shelters and grants to certain community groups, as well as services that benefit the public but have a low social return, such as maintenance of parks. It is important for us to note that we face no problem separating expenditures financed by local revenue from expenditures financed by central government transfers and donor funds. Local governments, in general, have discretion only over funds they collect from their own constituents because almost all transfers from donors and the central government are earmarked for specific expenditures and the local government budgets identify those earmarked expenditures.
7 The MTEFs also review past budget performance by examining actual expenditure compared to estimated expenditure and whether the district fulfilled its project objectives as stated in under the estimated expenditures. MTEFs vary in quality. The two areas with the least detail tend to be (1) detailed local government expenditures from own-source revenue; and (2) donor/NGO expenditures.
8
To test our hypotheses, we use budget estimates, as passed by district councils, rather than actual budget expenditures. Using budget estimates instead of actual expenditures is advantageous for two reasons. First, actual expenditures often are quite different from budget estimates. While some of this is due to behavior by the district council, variation in transfers from donors and the central government often is a consequence of factors beyond the control of district governments, such as budget cuts for donor agencies by their home governments. Second, elected members of the district council vote on revenue and expenditure estimates and must justify these estimates to their constituents, donors, and the central government. As a result, budget estimates are a clear public declaration of the priorities of elected district councils. Dependent Variables Our key dependent variables measure local government expenditures funded from locally-generated revenue; we exclude external sources of revenue (aid and transfers) from our dependent variables. Recall that we have no trouble identifying expenditure from different sources of revenue (local taxes, central government transfers, and foreign aid) because local government budgets identify expenditure from sources of revenue. Our ideal dependent variable is public services provided from locally-generated revenue. In Zambia, constructing this variable is straightforward as local budgets contain complete information on uses of local government sources of revenue. In Tanzania, measuring how governments spend own-source revenue is more difficult. Specifically, while most districts report the amount of own-source revenue used for government consumption, most districts do not report how much of their own-source revenue they use for public services. While it is tempting to infer that the share not used for recurrent costs must be used for public services, such a conclusion is not entirely accurate because the central government encourages districts to maintain budget surpluses and districts can run small budget deficits if they can borrow money. For these reasons, we use the share of own-source revenue used for government consumption to test our hypotheses. We also use administrative costs as additional dependent variable because one can argue that employee compensation is partly an investment in development (e.g., a school is useless without a teacher and a health clinic is useless without a doctor or a nurse). Fortunately, using government consumption as our dependent variable is not problematic. Our main hypotheses are that we expect (1) a positive relationship between local revenue and local services and (2) a negative relationship between external sources of revenue and local services. We easily can restate these hypotheses as we expect (1) a negative relationship between local revenue and local government consumption and (2) a positive relationship between external sources of revenue and local government consumption. For both countries we need to exercise considerable caution with how we express our dependent variable. The most obvious way of testing our hypotheses would be to use aggregate or per capita budget expenditures as our dependent variable. However because we have no reason to believe that expenditures on any budget line-item will decrease as taxes and/or transfers rise, using aggregate or per capita expenditure would be
9
inappropriate. Instead we express our dependent variable as a share of total own-source expenditure. As a consequence, for Tanzania, our dependent variables are the share of locally-generated revenue used for (1) total government consumption; and (2) other charges (i.e., government consumption minus employee benefits). For Zambia our dependent variable is public services as a share of locally-generated revenue. For this reason, we expected the sign of our key explanatory variables will be different in each country as the figure below shows. It is important to reiterate that we are testing the same hypotheses in each country; the reason we predict different signs is because data constraints force us to use different dependent variables in each country.
Figure 3: Hypotheses Dependent Variable
Locally-Funded Government Consumption/
Total Locally-Funded Expenditure (Tanzania)
Locally-Funded Public Services/
Total Locally-Funded Expenditure
(Zambia)
Local Revenue - + Explanatory Variable External Revenue (Central
Government and Donors) + -
Explanatory Variables The key explanatory variables for our study are the three sources of revenue for local governments: locally-generated revenue, transfers from the central government, and foreign aid. In both countries, locally-generated revenue is the easiest to identify. Central government transfers are somewhat more problematic to identify because donors partially finance funds that central governments in both countries use for transfers. Our criterion for categorizing central government transfers is if parliament, not donors, decides on the allocation of funds across districts. We categorize these items as central government transfers, even if they are financed partially by donors, because from the point of view of the local government, the transfers and any conditions associated with those transfers originate from the central government. Identifying foreign aid is more difficult. In Tanzania, local governments record two types of donor flows. The first are direct transfers for local projects. The second includes direct transfers plus programs that are financed by donors but are distributed through independent government agencies that parliament does not control. This would include programs like the Tanzania Social Action Fund and the Local Government Capital Developments Program. Because classifying the latter category as donor could be a debatable point, we us both measures (in separate models). In Zambia, local governments do not comprehensively record donor transfers. Thus our measure of foreign assistance to local governments in Zambia is disbursements from the Zambia Social Investment Fund (ZAMSIF). Although ZAMSIF is only a subset of donor flows into districts, using ZAMSIF data has two advantages: first, the data are comprehensive and second, to receive ZAMSIF funds, local governments must develop projects with
10
community involvement and the projects must be directed in part at strengthening the capacity of the local government (ZAMSIF 2004). Because two of the primary objectives of ZAMSIF are to increase the capacity of local governments and to increase community participation in development projects, ZAMSIF is explicitly designed to increase local government accountability. As a result, using ZAMSIF data is a particularly rigorous test of our hypothesis: if ZAMSIF projects which are specifically designed to increase local government accountability result in larger government consumption, foreign aid with fewer conditions on accountability is likely lead to a similar outcome. Because our dependent variables are expressed as a share of expenditure, it would seem logical to express each source of revenue as a share of total revenue. However, because the three shares must sum to one by definition, we would be unable to test the three hypotheses simultaneously if we expressed our three explanatory variables as a share of total local revenue. Although testing different sources of revenue separately would solve the immediate statistical problems, we would be unable to say for certain which of the three sources of revenue had the greatest impact on local government expenditure.8 Because we are interested in testing all three sources of revenue simultaneously and because it is our objective to understand which source of revenue has the greatest impact on local government expenditure, we use the three sources of revenue measured in per capita terms.9 We also use an array of control and structural variables in our model, such as level of development (i.e., poverty rates, mortality rates, life expectancy), size of district (total population and total area), and electoral data from the most recent elections in Zambia (2001).10 Structural economic variables are especially important because a plausible alternative hypothesis could be that more economically developed districts have more accountable governments, as Modernization Theory might predict. We can only test this argument by including economic variables in our model. For Tanzania the control/structural variables come from the 2000 census and for Zambia the source of these variables is the 2000 census and the 2000 living conditions survey. The two tables below summarize the variables we are using in our models. Table two identifies our dependent and explanatory variables. Table three provides budget definitions for the budget variables we use.
8 For the sake of simplicity, consider the case where we have two sources of expenditure, internal and external), Because the share of internal funds equals 1 minus the share of external funds, in separate regressions, the coefficients and standard errors on these variables would be exactly the same; the only difference would be the sign. As a result, there would be no way to determine the relative importance of each factor. 9 The correlations among sources of revenue (local, national, and foreign) are sufficiently low that we can include all three in our models. In Tanzania, the highest correlation is between own sources of revenue and transfers (0.4). In Zambia, the highest correlation is between local taxes and aid transfers (-0.2). 10 We do not use electoral data from Tanzania because of the ruling party’s overwhelming majority: in mainland Tanzania over 90% of the seats in Parliament are held by the ruling party.
11
Table 2: Dependent Variables and Central Explanatory Variables
Tanzania Zambia Dependent Variable 1. Government Consumption
(i.e., employee benefits plus administrative costs)
Public Services
2. Administrative Costs (i.e., government consumption minus employee benefits)
Explanatory Variable: Own Source Revenue
Local Revenue Local Revenue
Explanatory Variable: Aid 1. Direct donor aid Zambia Social Investment Fund 2. Aid disbursed by independent
government agencies + direct donor aid
Explanatory Variable: Transfers Total government transfers Total government transfers
Table 3: Budget Definitions
Total Expenditure = Own Source Expenditure + Central Government Expenditure + Aid Expenditure Own Source Expenditure = Government Consumption (Recurrent Expenditure) + Public Services + Net Surplus Government Consumption (Recurrent Expenditure) = Salaries and Employee Benefits + Administrative Costs Total Revenue = Local Revenue + Government Transfers + Aid
Method We use OLS with robust standard errors to test our hypotheses since we have only one year of data and thus can only conduct a cross-sectional analysis. We also do not use instrumental variables since we have no evidence to suggest that our dependent variables are endogenous. One, our control variables are from the 2000 census while the budget data is from FY 2005. Two, while it is possible that the central government and donors could base their transfers on local government budgets, in practice the opposite occurs: local governments pass their budgets after receiving information on how much they will receive from donors and the central government. V. Results Tanzania Because about 90% of local government budgets in Tanzania come from the central government and donors before we test our hypotheses, we first attempt to predict
12
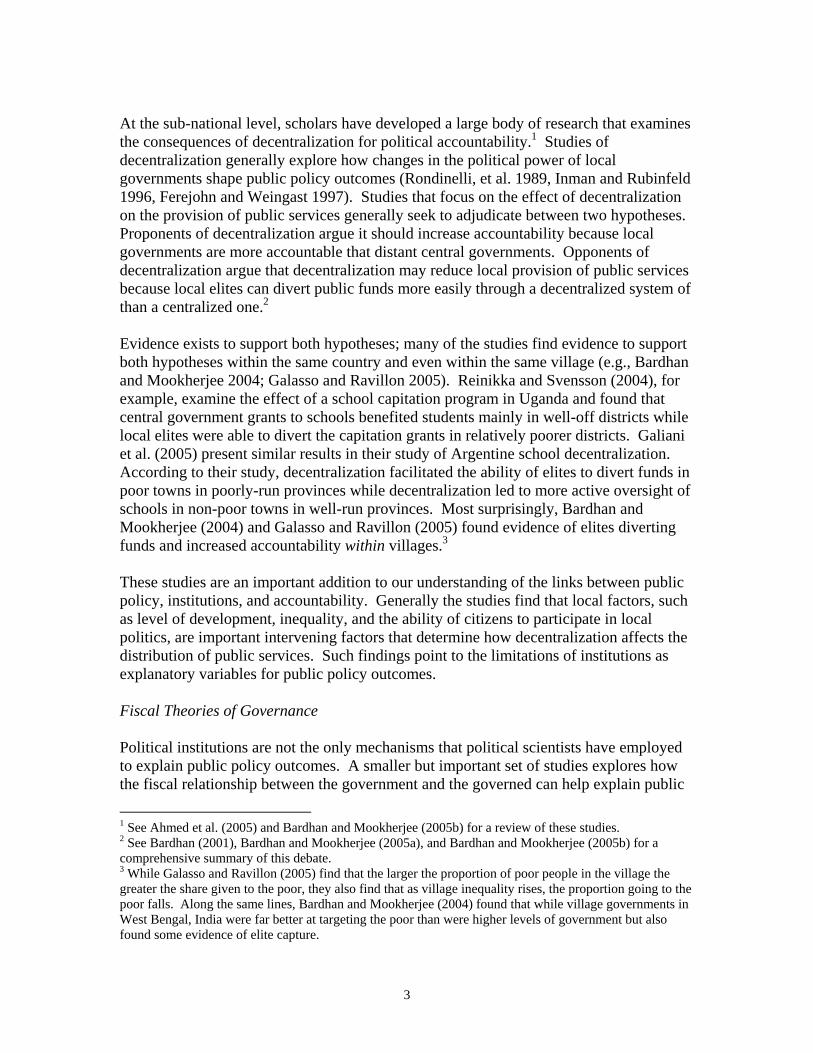
transfers from the central government and donors to districts. The ability to predict transfers is important because local governments that rely heavily on transfers, like district governments in Tanzania, are only able to generate realistic multi-year budget plans if they can reasonably predict future sources of revenue. To predict transfers, we use a number of obvious “measures of need.” We use obvious “measures of need” to determine if donors and the central government distribute funds to district governments using fairly formulaic methods or of if they use more idiosyncratic methods. Consequently, our explanatory variables are the size of the population, various measures of household development (e.g., literacy rates, infant mortality rates, percent of population involved in agriculture), and various measures of district development (e.g., percent of households with electricity and kilometers of road). The results we show below show a sub-set of these regressions using log population, literacy rates, and log of kilometers of road per district.11 These “measures of need” do a surprisingly good job of explaining government transfers to districts as tables 4A and 4B show. Population, literacy rates, and kilometers of road are able to explain between 76% and 98% of transfers. For all transfers - employee benefits, administrative costs, and development - population is by far the strongest predictor of transfers. Level of development (as measured by literacy rates and kilometers of road) has a small and positive effect on transfers for employee benefits and development transfers while level of development has a small but negative effect on transfers for administrative costs. Whereas the central government uses a transparent process for transfers to local governments, donors appear to follow no such logic. While we are able to explain about 85% of the variance in all government transfers using population, level of development, and kilometers of road, these same variables explain only 13% of the variance in donor transfers. One interpretation is that the much smaller number of districts that report donor transfers suggests our results using all districts may be biased if we compare them to districts that report donor funding. When we restrict the sample to those districts that report donor flows (table 4B) the results for government transfers stay the same suggesting that we do not have selection bias. What is more likely is that districts are not reporting donor flows in full and/or that local governments do not have control over donor flows because donors bypass district governments. Either way, the data suggest that a district’s inability to predict donor flows is a much larger impediment to multi-year budgeting than its inability to predict government flows.12
11 The results of the regressions change minimally with regard to which measure of household and district development we employ. 12 This is consistent with what we heard from district government officials; in most cases where we heard complaints about the inability to forecast flows the government officials complained about donor opacity not government.
13
Table 4a: Determinants of Transfers to All District Governments in Tanzania
Robust t statistics in parentheses * significant at 10%; ** significant at 5%; *** significant at 1%
While the results above suggest that there is no bias to limiting our analysis to only those districts that report donor flows, is important to examine more thoroughly if there are any clear differences between districts that report donor funds and those that do not. The table below shows that across a broad range of indicators - enrollment rates, literacy rates, recurrent transfers, population, area, percent of households with electricity, agriculture as a share of the labor force, and total kilometers of roads - there are no statistically significant differences between districts that report donor funds and those that do not. For these reasons, there does not appear to be any bias between districts that report donor funds and those that do not.
14
Table 5: Differences Between Districts that Report and Don't Report Donor Funds
Donor Funds
Reported Donor Funds Not Reported Number of Districts 59 54 Population 297,000 275,000 Recurrent Transfers Per Capita $14 $12 Area (Square Kilometers) 7,646 7,471 Literacy Rate 62% 60% Houses with Electricity 7% 8% Agriculture/Total Labor 70% 70% Net Enrollment Rate 67% 68% Kilometer of Roads 619 608
Tables six and seven show the results using data from Tanzania for both measures of our dependent variable (administrative costs as a share of total expenditure and total government consumption as a share of total expenditure). Several points bear highlighting. First, and most important, as local taxes increase, the share of the local budget for government consumption falls. Second, higher central government transfers increases the share of the local budget for government consumption. Third, donor flows have no systematic effect on government expenditure. Although on the surface this is evidence against our hypothesis, evidence from Zambia (that we show in the next sub-section) as well as the evidence presented in table 4B suggests that either (1) we are not capturing aid flows very well; or (2) aid flows are not sufficiently predictable for government to react to them. Fourth, table seven shows that development indicators (literacy rates and kilometers of road per district) have no effect on local government expenditure even when we remove local taxes (table seven, columns two and four). This is important because we can reject the hypothesis that the effect of locally-generated revenue on local government expenditure is a proxy for the effect of level of development on local government expenditure.
Table 6: Tanzania Results
Administrative Costs/ Total Expenditure
Government Consumption/ Total Expenditure
Local Taxes Per Capita -0.600 -0.230 -0.747 -0.258 (3.20)*** (2.38)** (3.30)*** (1.98)* Total Government Transfers Per Capita 0.135 0.080 0.162 0.096 (3.73)*** (3.16)*** (3.72)*** (3.14)*** Direct Donor Transfer Per Capita -0.004 0.008 (0.15) (0.25) Total Donor Flows Per Capita -0.026 -0.026 (1.33) (1.12) Log Population 1.037 0.972 1.258 1.234 (2.92)*** (3.57)*** (2.97)*** (3.75)*** Constant -13.201 -11.504 -15.993 -14.679 (2.77)*** (3.08)*** (2.80)*** (3.26)*** Observations 50 76 50 76 R-squared 0.23 0.18 0.24 0.18
Robust t statistics in parentheses * significant at 10%; ** significant at 5%; *** significant at 1%
15
Table 7: Robustness Check for Tanzania
Administrative Costs/
Total Expenditure Government Consumption/
Total Expenditure Local Taxes Per Capita -0.697 -0.863 (2.84)*** (2.88)*** Total Government Transfers Per Capita 0.125 0.100 0.148 0.116 (3.52)*** (2.85)*** (3.41)*** (2.69)** Donor Transfer Per Capita 0.009 -0.019 0.023 -0.011 (0.29) (0.71) (0.63) (0.36) Log Population 0.994 0.931 1.195 1.118 (3.06)*** (2.69)** (3.10)*** (2.70)*** Log Road (KM) 0.118 0.632 0.193 0.829 (0.29) (1.34) (0.38) (1.44) Adult Literacy Rate 0.012 0.007 0.016 0.009 (0.76) (0.43) (0.80) (0.46) Constant -13.915 -16.352 -17.064 -20.080 (2.35)** (2.42)** (2.39)** (2.47)** Observations 49 49 49 49 R-squared 0.24 0.14 0.25 0.14
Robust t statistics in parentheses * significant at 10%; ** significant at 5%; *** significant at 1%
Zambia
The results from tests using Zambian data follow the striking pattern of those we found in Tanzania. As locally-generated revenues increase, local government expenditure on public services as a share of the local budget also increases while the opposite occurs with government transfers. The last column in table six shows that local revenue is not a proxy for wealth: literacy rates (our proxy for development) have no effect on government expenditure even when we remove local taxes. One key difference between the results from the two countries is that unlike donor transfers in Tanzania, ZAMSIF transfers decrease services as a share of the government budgets, consistent with our hypothesis. One hypothesis that may explain these divergent results is that local governments in Zambia are able to anticipate ZAMSIF transfers with a much higher degree of certainty compared to the average donor program because ZAMSIF announces how much funds are available for each district and districts subsequently propose projects to draw on those funds. Since ZAMSIF is designed to increase local government capacity and because ZAMSIF projects must involve community participation, our finding that ZAMSIF funds actually decrease local government expenditure on services (as a share of the local government budget) is powerful support for our hypothesis.
16
Table 8: Zambia Results and Robustness Check Services as a Share of Total Local Government Expenditure Local Taxes Per Capita 0.004 0.005 0.008 0.008 (2.20)** (2.65)** (2.84)*** (4.30)*** Transfers Per Capita -0.021 -0.023 -0.021 -0.021 (2.39)** (2.30)** (2.13)** (2.04)** ZAMSIF Transfers Per Capita -0.024 -0.020 -0.020 -0.019 (1.90)* (2.44)** (2.73)*** (2.53)** Adult Literacy -0.003 -0.004 -0.004 0.000 (1.31) (1.52) (1.91)* (0.42) Log Population -0.059 -0.058 -0.048 (1.65) (1.60) (1.29) Log Area (Square KM) 0.037 (1.50) Log Population Density -0.042 -0.006 (2.37)** (0.77) Poverty 0.003 (0.83) Constant 1.022 1.425 0.981 0.873 0.474 (1.79)* (4.00)*** (2.08)** (5.96)*** (4.02)*** Observations 46 46 46 46 50 R-squared 0.19 0.20 0.22 0.22 0.04
Robust t statistics in parentheses * significant at 10%; ** significant at 5%; *** significant at 1% Table nine reports on whether political parties or different types of local taxes help explain the public services share of local government expenditure. Columns one and two show the logic of fiscal governance holds even in the face of partisanship. Unlike in Tanzania, which is dominated by one party, Zambia has a competitive multiparty electoral system. The two main political parties are the Movement for a Multiparty Democracy (MMD), the ruling party, and the United Party for National Development (UPND), the leading opposition party (there are a number of other smaller parties as well). The first two columns of table nine test whether the parties affect local government expenditure by adding each party’s seat share on local councils.13 There is some evidence that districts with a higher share of MMD seats devote more of their budget to government consumption while districts with a higher share of UPND seats are more concerned with public services. More interesting, including seat shares of political parties reduces the significance of central government transfers, not local revenue, suggesting that partisanship may affect central government transfers.14 The last column in table nine examines whether governments are sensitive to different sources of revenue streams. Local governments in Zambia report three main types of local revenue: taxes (e.g., income taxes and levies), charges (e.g., fees and rent), and other income. Interestingly, given that other income is the most diverse source of local revenue it nevertheless has the strongest effect on expenditures. 13 Because of the fairly strong negative correlation between the share of local government votes from each party, we could not put both parties in the same equation. 14 Simple correlations provide tentative support for this hypothesis. While there is no correlation between local taxes and political parties, there is a positive correlation between MMD seat shares and national transfers while there is a small negative correlation between UPND seat shares and transfers.
17
Table 9: Additional Zambia Tests Services as a Share of Local Government Expenditure Total Revenue Per Capita 0.009 0.008 (4.33)*** (4.08)*** MMD Seat Share -0.005 (1.85)* UPND Seat Share 0.002 (2.16)** Taxes Per Capita 0.007 (3.18)*** Charges Per Capita 0.04 (1.25) Other Revenue Per Capita 0.018 (2.95)*** Transfers Per Capita -0.010 -0.018 -0.021 (0.86) (1.79)* (2.06)** ZAMSIF Transfers Per Capita -0.020 -0.020 -0.017 (2.60)** (2.58)** (1.90)* Adult Literacy -0.004 -0.005 -0.004 (1.80)* (2.12)** (1.87)* Log Population Density -0.066 -0.037 -0.041 (2.90)*** (2.00)* (2.28)** Constant 1.052 0.845 0.861 (6.54)*** (5.50)*** (5.53)*** Observations 46 46 48 R-squared 0.22 0.29 0.24
Robust t statistics in parentheses * significant at 10%; ** significant at 5%; *** significant at 1%
The magnitude of the effects we find are economically significant as well as statistically significant. For example, in Tanzania, model three in table four predicts that increase in per capita taxes from the 25th percentile to the 75th percentile should decrease government consumption as a share of the local budget from the 50th percentile to the 15th percentile. Similarly, for Zambia, model five in table six predicts that an increase in per capita taxes from the 25th percentile to the 75th percentile should increase public services as a share of the local budget from the 50th percentile to the 75th percentile. The Graph 1 below shows the effect of changes in per capita taxes on the service share of the budget in Zambia. The graph shows that an increase in per capita taxes from the 25th to the 75th percentile (roughly a three-fold increase in local taxes) increases the share of the budget going to services from 47% to 57% (roughly a 20% increase).
18
Graph 1: Effect of Local Taxes on Services as a Share of Local Expenditure in Zambia
45%
50%
55%
60%
25% 30% 35% 40% 45% 50% 55% 60% 65% 70% 75%
Per Capita Taxes (Percentile)
Shar
e of
Bud
get f
or S
ervi
ces
VI. Conclusion
In this paper we have employed insights from fiscal theories of governance to examine how sources of revenue affect local government expenditures. First, independent of the level of external assistance, local governments in Tanzania and Zambia devote a larger share of locally-generated revenue to public services as the amount of taxes constituents pay increases. Second, external funds encourage district governments to use locally-generated revenue for government consumption. Third, the results on the impact of donor funds on local government budgets are mixed. While local governments in Zambia treat ZAMSIF transfers and central government transfers the same, donor flows to local governments in Tanzania appear to have no impact on local government expenditure. However, we also have some evidence that the inability of local governments in Tanzania to predict donor funds may explain why, in aggregate, donor funds appear to have no systematic impact on the expenditure decisions of local governments in Tanzania.
Our results speak directly to current development policy in Tanzania and Zambia. Recently, in Tanzania, for example, donors and the central government replaced the largest source of local government revenue with a central government transfer. At the same time, donors currently are spending hundreds of millions of dollars every year to increase the accountability of district governments in Tanzania. Over the past year, the World Bank alone has agreed to spend approximately $75 million for local government reform in Tanzania. The majority of the funds, however, are devoted to increasing accountability from the supply side through institutional reform. Our results suggest that increasing the accountability of local governments can come from the demand side as well by strengthening the fiscal link between a district government and its citizens.
19
References Ahmad, Junaid, Shantayana Devarajan, Stuti Khemani, and Shekhar Shah (2005), “Decentralization and Service Delivery”, World Bank Policy Research Working Paper 3603, Washington, DC: World Bank. Akin, John, Paul Hutchinson and Koleman Strumpf (2001), “Decentralization and Government Provision of Public Goods: The Public Health Sector in Uganda”, Chapel Hill, NC: Working Paper 01-35, Measure Evaluation, Carolina Population Center University of North Carolina at Chapel Hill. Azfar, Omar, Satu Kähkönen, and Patrick Meagher (2001), Conditions for Effective Decentralized Governance: A Synthesis of Research Findings, College Park, MD: Working Paper, IRIS Center, University of Maryland. Bardhan, Pradhan (2002), “Decentralization of Governance and Development”, Journal of Economic Perspectives, 16(4), 185-206. Bardhan, Pradhan and Dilip Mookherjee (2004), “Pro-Poor Targeting and Accountability of Local Governments in West Bengal”, Working Paper, Institute for Economic Development, Boston University. Bardhan, Pradhan and Dilip Mookherjee (2005a), “Decentralizing Delivery of Anti-Poverty Programs in Developing Countries”, Journal of Public Economics, forthcoming. Bardhan, Pradhan and Dilip Mookherjee (2005b), Decentralization and Local Governments in Developing Countries: A Comparative Perspective, Cambridge, MA: MIT Press, forthcoming. Bates, Robert (2001), “Prosperity and Violence”, New York: Norton. Bates, Robert and Dau-Hsiang Lien (1985), “A Note on Taxation and Representative Government”, Politics and Society 14(l). Bish, R. and V. Ostrom (1973), “Understanding urban government: Metropolitan Reform Reconsidered”, Washington, DC: American Enterprise Institute for Public Policy Research, Domestic Affairs Study 20. Boix, Carles (2003), “Democracy and Redistribution”, New York: Cambridge University Press. Brautigam, Deborah (2000), “Aid, Dependence, and Governance”, Stockholm: Almqvist and Wiksell.
20
Bueno de Mesquita, Bruce, Randolph Siverson, Alastair Smith, and James D. Morrow. (2003), “The Logic of Political Survival”, Cambridge MA: MIT Press. Carey, John and Matthew Shugart (1995), “Incentives to Cultivate a Personal Vote: A Rank Ordering of Electoral Formulas”, Electoral Studies 14 (1). Coolidge, Jacqueline and Susan Rose-Ackerman (1997), “High-Level Rent-Seeking and Corruption in African Regimes”, World Bank Working Paper 1780, Washington, DC: World Bank. Cox, Gary (1997), “Making Votes Count”, New York: Cambridge University Press. Cox, Gary and Mathew McCubbins (2001), ‘The Institutional Determinants of Economic Policy Outcomes’ in Haggard and McCubbins (eds.), “Presidents, Parliaments, and Policy”, New York: Cambridge University Press. Downing, Brian (1992), “The Military Revolution and Political Change”, Princeton, NJ: Princeton University Press. Ferejohn, J, and B. Weingast (1997), “The New Federalism: Can the States Be Trusted?”, Stanford (CA): Hoover Institution Press. Galasso, Emanuela and Martin Ravillon (2005), “Decentralized Targeting of an Antipoverty Program”, Journal of Public Economics, 89, 705-727. Galiani, Sebastian, Paul Gertler and Erenesto Schargrodsky (2005), `School Decentralization: Helping the Good Get Better, but Leaving the Poor Behind’, Working Paper, Buenos Aires: Universidad de San Andres. Inman, R., and Rubinfeld, D. (1996), “Designing Tax Policy in Federalist Economies: an overview”, Journal of Public Economics 60, 307–334. Karl, Terry Lynn (1997), “The Paradox of Plenty”, Berkeley, CA: University of California Press. Knack, Stephen (2000), “Aid Dependence and the Quality of Governance”, World Bank Working Paper 2396, Washington, DC: World Bank. Levi, Margaret (1988), “Of Rule and Revenue”, Berkeley: University of California Press. Lijphart, Arendt (1999), “Patterns of Democracy”, New Haven, CT: Yale University Press. Lindert, Peter (2004), “Growing Public: Social Spending and Economic Growth Since the Eighteenth Century”, New York: Cambridge University Press.
21
Linz, Juan (1990), “Perils of Presidentialism”, Journal of Democracy, 1, p. 50-69. Linz, Juan (1994), ‘Presidential or Parliamentary Democracy: Does It Make a Difference’, in Linz and Valenzuela (eds.), “The Failure of Presidential Democracy”, Baltimore, MD: Johns Hopkins University Press. Mainwaring, Scott and Matthew Shugart, eds. (1997), “Presidentialism and Democracy in Latin America”, New York, Cambridge University Press. McIntyre, Andrew (2003), “The Power of Institutions” Cornell, NY: Cornell University Press. Moore, Mick (1995) “Promoting Good Government by Supporting Institutional Development?”, Institute for Development Studies, University of Sussex, Brighton UK: IDS Bulletin 26 (2) Moore, Mick (1998), “Death Without Taxes”, in Robinson and White (eds.), “The Democratic Developmental State”, Oxford: Oxford University Press, p. 84-124. Ndulu, Benno and Stephen O’Connell (1999), “Governance and Growth in Sub-Saharan Africa”, Journal of Economic Perspective 13(1). North, Douglass and Barry Weingast (1989), “Constitutions and Commitment”, Journal of Economic History, 49(4), p. 803-832. Persson, Torsten, Gerard Roland, and Guido Tabellini (2003), “How Do Electoral Rules Shape Party Structures, Government Coalitions, and Economic Policies?”, NBER Working Paper 10176, Cambridge, MA: NBER Persson, Torsten, Gerard Roland, and Guido Tabellini (2005), “Electoral Rules and Government Spending in Parliamentary Democracies”, mimeo. Persson, Torsten, and Gerard Roland (2003), “Constitutional Rules and Fiscal Policy Outcomes”, American Economic Review, 94 (1). Przeworski, Adam, Michael E. Alvarez, José Antonio Cheibub, and Fernando Limongi 2001) “Democracy and Development: Political Institutions and Well-Being in the World, 1950-1990”, New York: Cambridge University Press. Reinikka, Ritva and Jakob Svensson (2004), “Local Capture: Evidence from a Central Government Transfer Program in Uganda”, Quarterly Journal of Economics, 119 (2). Republic of Zambia (1996), “Local Government Act 1996”, Lusaka, Zambia: Government of the Republic of Zambia.
22
Rondinelli, D., J. McCullough and R. Johnson (1989), “Analyzing Decentralization Policies in Developing Countries: A Political-Economy Framework,” Development and Change 20, p.57-87. Root, Hilton (1992), “The Fountain of Privilege”, Berkeley, CA: University of California Press. Ross, Michael (2001), “Does Oil Hinder Democracy?”, World Politics, 53 (3), p. 325-361. Sachs, Jeffrey and Andrew M. Warner (1997), “Natural Resource Abundance and Economic Growth”, Center for International Development, Harvard University. Shugart, Matthew and John Carey (1992), “Presidents and Assemblies”, New York: Cambridge University Press. Svensson, Jakob (2000), “Foreign Aid and Rent-Seeking”, Journal of International Economics, 51 (2), p. 437-461. Tiebout, Charles (1956), “A Pure Theory of Local Public Expenditures," Journal of Political Economy, 64: 416-24. Tornell, Aaron and Philip Lane (1998), “Are Windfalls a Curse?”, Journal of International Economics 44 (1). Treisman, Daniel (2000), “The Causes of Corruption”, Journal of Public Economics, 76 (3), p. 399-457. Tsebelis, George (2002), “Veto Players”, Princeton, NJ: Princeton University Press. United Republic of Tanzania (2000), “Local Government Laws Principal Legislation (Revised Edition) 2000”, Dar es Salaam, Tanzania: Government of the United Republic of Tanzania. Wiseman, J.A., (1995), “Democracy and Political Change”, London: Routledge, 1995. ZAMSIF (2004), “Zambia Social Action Fund: ZAMSIF in Brief”, Lusaka, Zambia: ZAMSIF.