Fiscal Brief New York City Independent Budget Office December 2017 Disruption Ahead? NYC’s Current Fiscal Outlook Looks Stable, But Federal Tax Overhaul & Budget Cuts Lurk Fiscal Outlook IBO New York City Independent Budget Office Ronnie Lowenstein, Director 110 William St., 14th floor New York, NY 10038 Tel. (212) 442-0632 Fax (212) 442-0350 [email protected]www.ibo.nyc.ny.us Over a year ago IBO described Mayor de Blasio’s November 2016 Financial Plan as a “placeholder” plan awaiting clarification as to federal fiscal policy. Because of the uncertainty wrought by last fall’s national elections and the ambiguity of policy pronouncements made by the then-incoming presidential administration, there was a hesitation on the part of the de Blasio Administration to make any extensive budgetary changes. Twelve months have passed since the release of that financial plan and it is still uncertain how Trump Administration policies will affect the city’s fiscal condition. The outline of Mayor de Blasio’s November 2017 Financial Plan much resembles the structure of previous plans over the last year. While specific risks from large scale changes in U.S. tax policy are clearer today than they were a year ago much still remains uncertain and this year’s November financial plan remains what could yet again be described as a placeholder pending final enactment of a tax bill and agreement on the federal budget. The economic and revenue forecasts in the November 2017 plan are little changed from the budget that was adopted last June: continued slow growth in the local economy and tax revenues. The updated financial plan has lowered the current year business income tax forecast in response to a modest decline in collections so far this year, but otherwise left the de Blasio Administration’s tax revenue forecast unchanged. With major changes to the federal tax code imminent, many of these forecasts will certainly need to be re-evaluated in the near future. Total Revenue and Expenditure Projections Dollars in millions 2018 2019 2020 2021 Average Change Total Revenue $87,256 $89,100 $92,426 $95,451 3.0% Total Taxes 57,574 60,088 62,888 65,565 4.4% Total Expenditures $86,229 $91,723 $93,803 $95,623 3.5% IBO Surplus/(Gap) Projections $1,027 ($2,623) ($1,377) ($172) Adjusted for Prepayments and Debt Defeasances: Total Expenditures $90,409 $91,723 $93,803 $95,623 1.9% City-Funded Expenditures $65,628 $67,829 $69,599 $71,056 2.7% NOTES: IBO projects a surplus of $1.03 billion for 2018. If the 2018 surplus is used to prepay some 2019 expenses, the budget shortfall in 2019 is $1.6 billion. Figures may not add due to rounding. New York City Independent Budget Office
Transcript
Fiscal Brief New York City Independent Budget Office
December 2017
Disruption Ahead?
NYC’s Current Fiscal Outlook Looks Stable, But Federal Tax Overhaul & Budget Cuts Lurk
Fiscal Outlook
IBO New York CityIndependent Budget OfficeRonnie Lowenstein, Director
110 William St., 14th floorNew York, NY 10038Tel. (212) 442-0632
Over a year ago IBO described Mayor de Blasio’s November 2016 Financial Plan as a “placeholder” plan awaiting clarification as to federal fiscal policy. Because of the uncertainty wrought by last fall’s national elections and the ambiguity of policy pronouncements made by the then-incoming presidential administration, there was a hesitation on the part of the de Blasio Administration to make any extensive budgetary changes. Twelve months have passed since the release of that financial plan and it is still uncertain how Trump Administration policies will affect the city’s fiscal condition.
The outline of Mayor de Blasio’s November 2017 Financial Plan much resembles the structure of previous plans over the last year. While specific risks from large scale changes in U.S. tax policy are clearer today than they were a year ago much still remains uncertain and this year’s November financial plan remains what could yet again be described as a placeholder pending final enactment of a tax bill and agreement on the federal budget.
The economic and revenue forecasts in the November 2017 plan are little changed from the budget that was adopted last June: continued slow growth in the local economy and tax revenues. The updated financial plan has lowered the current year business income tax forecast in response to a modest decline in collections so far this year, but otherwise left the de Blasio Administration’s tax revenue forecast unchanged. With major changes to the federal tax code imminent, many of these forecasts will certainly need to be re-evaluated in the near future.
Total Revenue and Expenditure ProjectionsDollars in millions
2018 2019 2020 2021 Average Change
Total Revenue $87,256 $89,100 $92,426 $95,451 3.0%
NOTES: IBO projects a surplus of $1.03 billion for 2018. If the 2018 surplus is used to prepay some 2019 expenses, the budget shortfall in 2019 is $1.6 billion. Figures may not add due to rounding.
For the first time during his tenure, Mayor de Blasio’s November 2017 Financial Plan does not count on a surplus in the current fiscal year that can be used to reduce the next year’s budget gap. As a result the Mayor’s stated gap—$3.2 billion—for the upcoming fiscal year is larger in absolute terms and as a percentage of planned city spending than in any of his prior November plans. In prior years the de Blasio Administration had initiated citywide savings programs that created enough additional resources to create surpluses in the November plan. The savings program issued as part of the November plan is relatively modest compared with prior years. The current savings program provides $234 million of additional resources in the current year and $238 million in the next fiscal year. Nearly 70 percent of this saving is the result of reductions in planned debt service expenses and fringe benefit adjustments resulting from a smaller-than-estimated city workforce.
Based on IBO’s analysis of tax revenues and spending as presented under the Mayor’s plan, along with our own updated economic forecast, we estimate the city will have $1.2 billion in additional city-generated revenue offset by some additional spending, enough to end the current fiscal year with a surplus of $1.0 billion. Assuming the 2018 surplus is used to prepay some of next year’s expenditures, and after accounting for $555 million of additional resources IBO estimates the city will accrue in 2019, we estimate next year’s budget gap will be just under $1.6 billion, slightly under 2.4 percent of city-funded expenditures.
IBO’s 2018 surplus estimate does not include the $1.45 billion currently allocated for two reserves within the fiscal year 2018 budget—these reserves are currently counted as expenditures but do not support any specific spending needs. If these funds are not used to cover unexpected spending needs or revenue shortfalls in the current year, they will become part of the 2018 surplus, which would close nearly the entire remainder of the budget gap IBO forecasts for 2019.
We project relatively manageable shortfalls of $1.4 billion and $176 million for the last two years of the 2018-2021 financial plan period, shortfalls that could be substantially reduced or eliminated through the use of the reserves of $1.25 billion a year built into the financial plan for 2020 and 2021 (assuming the reserves are not needed to fill revenue shortfalls or fund unexpected spending needs).
Economic Outlook
IBO’s outlook for the U.S. economy for the next two years is little changed from our forecast in May, though it is far less
certain. We expect consumer spending to continue fueling economic growth and forecast an acceleration of real growth next year, from 2.2 percent in 2017 to 2.7 percent in 2018. (In our discussion of the economic outlook, years refer to calendar years and monthly and quarterly data are seasonally adjusted.) But with growth constrained by an increasingly tight labor market and inflationary pressures building, IBO forecasts slower growth in 2019 through 2021. Adding to the uncertainty typical of any economic forecast is the likelihood of major shifts in federal tax policy, details of which are still unknown as of this writing. IBO’s current economic forecast does not incorporate the effect of any of these potential changes.
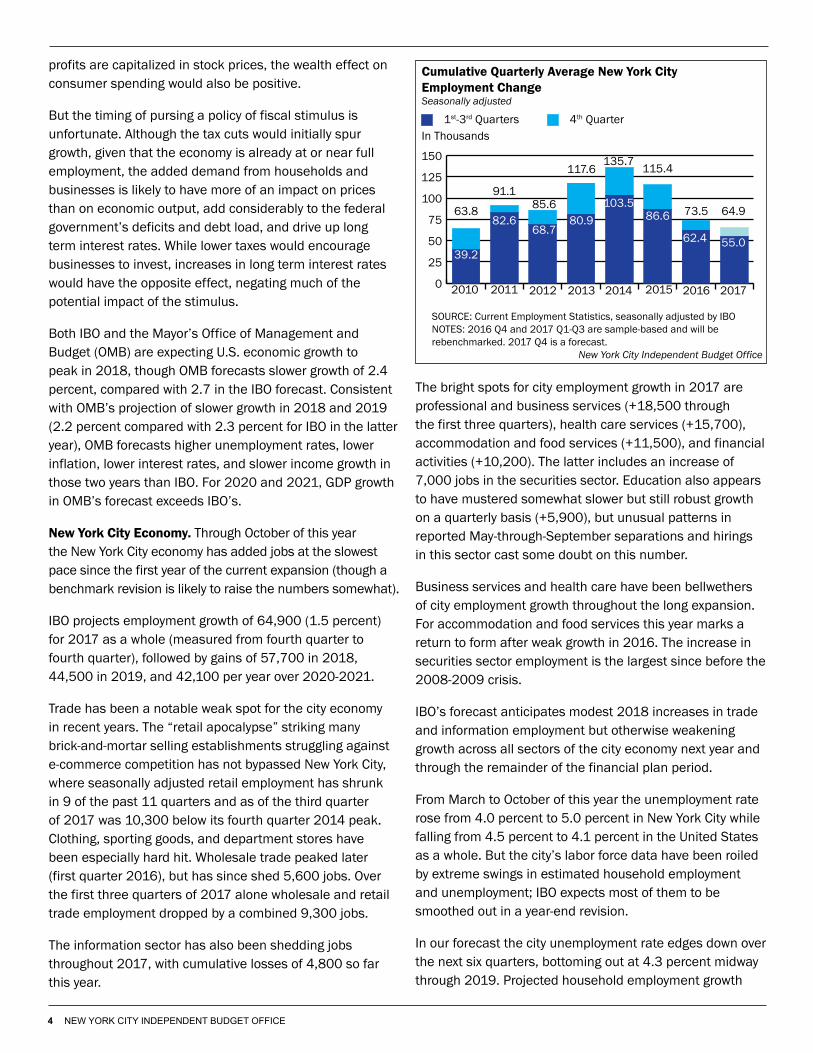
Through October of this year, the city economy added jobs at the slowest pace since the current expansion began and IBO expects growth to further weaken over the plan period. Measured on a fourth quarter-to-fourth quarter basis (Q4 over Q4), IBO forecasts the addition of 64,900 jobs in 2017, 57,700 jobs in 2018, and less than 45,000 jobs per year in 2019 through 2021. Though the official unemployment rate in the city rose from 4.0 percent in March to 5.0 percent in October of this year, we expect it to gradually decline over the next six quarters to reach 4.3 percent.
U.S. Economy. IBO’s economic outlook for the next two years is essentially unchanged from the forecast we published in May. With consumer spending as the primary fuel for growth, the current expansion is expected to continue, while labor markets tighten further and the Federal Reserve implements a gradual and orderly rise in interest rates to ward off excessive inflation. IBO forecasts 2.7 percent growth in real (inflation-adjusted) gross domestic product (GDP) next year and 2.3 percent growth in 2019, followed by slower growth in 2020 and 2021. The forecast is premised on the success of Federal Reserve actions to limit inflationary pressures without rattling financial markets; missteps in monetary policy are a significant risk to the forecast. Moreover, the probability of extensive changes to federal corporate and individual taxes—the details of which are unknown as of this writing—makes the risks to the forecast particularly high. Some possible consequences of major changes to federal taxes, which have not been incorporated into IBO’s baseline forecast, are discussed below.
The current economic expansion is now in its ninth year and there are no signs that it is nearing an end. After slowing in 2016, U.S. growth has picked up this year. Real GDP growth accelerated from 1.2 percent in 2017: Q1 to 3.1
percent in Q2 and 3.3 percent in Q3 (preliminary estimate). While average monthly employment growth this year has been slightly lower than in 2016, the number of jobs has increased in all regions of the country and in almost all industries. The unemployment rate fell to 4.1 percent in October and was unchanged in November, its lowest level since 2000. Labor shortages in specific industries and regions are mounting, such as in Texas and Florida where post-hurricane rebuilding efforts have boosted demand for construction workers and building supplies. The extra construction activity resulting from the rebuilding efforts has also contributed to economic growth.
Many conditions are favorable for continued economic growth. The most important factors are those fueling consumer spending: the strong labor market and a wealth effect from rising housing and financial asset prices. Though average real wage growth was relatively weak through much of the expansion, it has recently begun to accelerate and employment growth itself has enabled many households to spend more. Households are in a strong financial position to continue spending. Their debt service burden—the share of disposable (after-tax) income required to stay current on debt obligations—has remained at historic lows. Moreover, rising home prices and record highs in equity markets have swelled the wealth of many households, which in turn has boosted their willingness to spend. Wealth effects are expected to remain strong in the coming year, particularly from housing. Other conditions favorable to continued economic growth include moderate energy costs and a strong global economy in which no major country is in recession.
With little slack in labor markets and other resource constraints, relatively rapid GDP growth rates over the last two quarters are not likely to be sustained. Based on our expectation that growth will slow in the fourth quarter of 2017, IBO forecasts 2.2 percent real GDP for the year as a whole, compared with 1.5 percent growth in 2016. Led by stronger consumer spending and bolstered by global demand for exports, growth is projected to accelerate to 2.7 percent in 2018. The strong labor market is expected to draw more participants into the labor force, which will support GDP growth. However, the already-low unemployment rate will barely decline, to 3.9 percent on average in 2018—a very low rate that many economists consider to be full employment, the threshold under which labor markets are tight enough to spur inflation. With inflationary pressures in the economy already building, the Federal Reserve has signaled its intention to increase the federal funds rate (the rate at which banks lend funds
overnight to other banks) three times in 2018, as it did this year. The increases are expected to be small, and IBO forecasts a 1.9 percent rate for the year as a whole. We expect the Federal Reserve’s actions to result in consumer price inflation of 2.1 percent in 2018, close to the 2.0 rate it considers optimal.
Given the constraints of labor and other resources in an economy operating at full-employment, IBO forecasts that real GDP growth will peak in the middle of 2018 and then decline to average 2.3 percent in 2019. With the unemployment rate forecast to remain at 3.9 percent and the Federal Reserve projected to continue raising interest rates, we expect that inflation will accelerate to 2.8 percent. Over the last two years of the forecast period, IBO forecasts slower economic growth of 1.6 percent in 2020 and 1.9 percent in 2021, along with increases in the unemployment rate and declines in the rate of inflation.
The challenge of the Federal Reserve in the coming years will be to raise interest rates and unwind quantitative easing (the central bank’s unconventional policy of purchasing securities during the Great Recession) just enough to slow economic growth and tame inflation, but not enough to substantially reduce business investment and consumer spending. Failure of monetary policy to achieve its goals without unintended consequences is the primary risk to IBO’s economic outlook. Years of historically low interest rates have fueled large increases in the price of equities. With stocks at record highs and—by many measures—overvalued, the Federal Reserve’s challenge is to avoid disruptions that could rapidly deflate asset prices and lead to a bear market or (in the worst case) recession.
IBO’s forecast is more uncertain than usual, because the outlook for the U.S. economy depends in part on what specific changes to the tax code are made now that some tax legislation seems increasingly likely. Since the Republican Party sweep of Congress and the White House in 2016, IBO’s forecasts have been premised on eventual passage of a deficit-financed federal tax cut. But the $1.5 trillion, 10-year increase in the federal deficit contained in current proposals is three times larger than we incorporated into our baseline forecast. The tax cuts would provide significant stimulus to the nation’s economy, increasing after-tax income for businesses—which would receive the bulk of the savings—and many (but not all) households. The likely short-term increase in households’ after-tax income could extend the consumer spending spree that has fueled the current expansion and increase business profits. To the extent that increased business
profits are capitalized in stock prices, the wealth effect on consumer spending would also be positive.
But the timing of pursing a policy of fiscal stimulus is unfortunate. Although the tax cuts would initially spur growth, given that the economy is already at or near full employment, the added demand from households and businesses is likely to have more of an impact on prices than on economic output, add considerably to the federal government’s deficits and debt load, and drive up long term interest rates. While lower taxes would encourage businesses to invest, increases in long term interest rates would have the opposite effect, negating much of the potential impact of the stimulus.
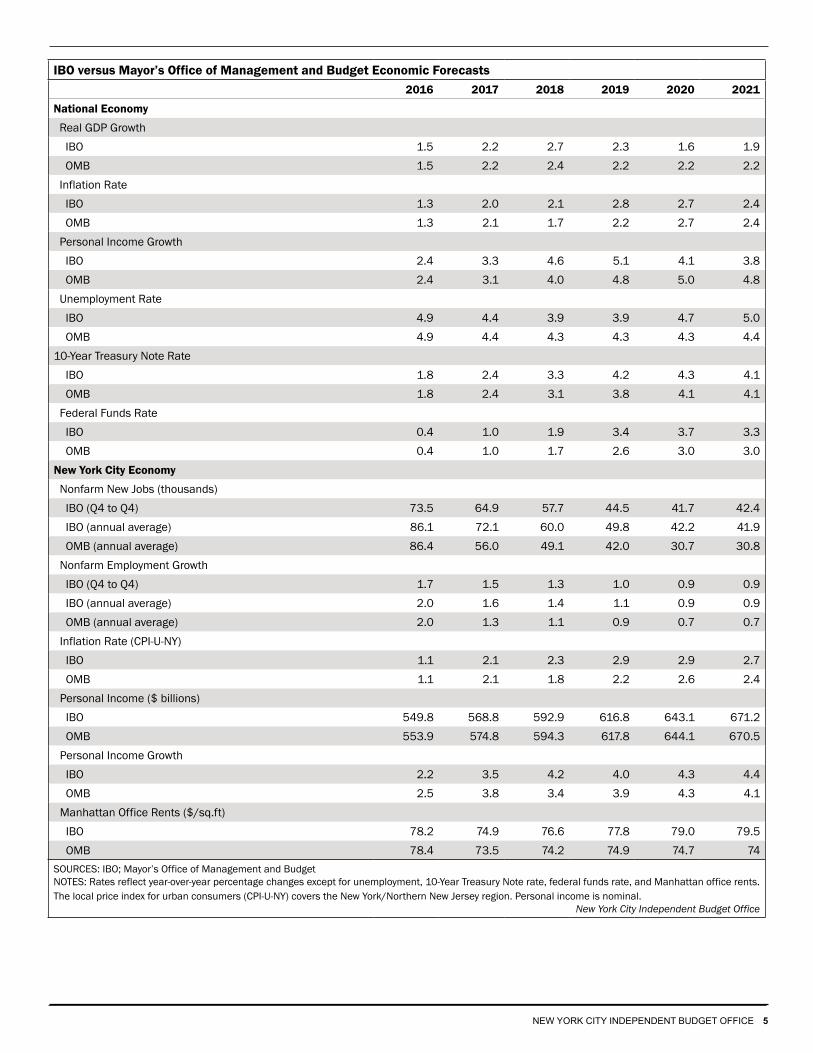
Both IBO and the Mayor’s Office of Management and Budget (OMB) are expecting U.S. economic growth to peak in 2018, though OMB forecasts slower growth of 2.4 percent, compared with 2.7 in the IBO forecast. Consistent with OMB’s projection of slower growth in 2018 and 2019 (2.2 percent compared with 2.3 percent for IBO in the latter year), OMB forecasts higher unemployment rates, lower inflation, lower interest rates, and slower income growth in those two years than IBO. For 2020 and 2021, GDP growth in OMB’s forecast exceeds IBO’s.
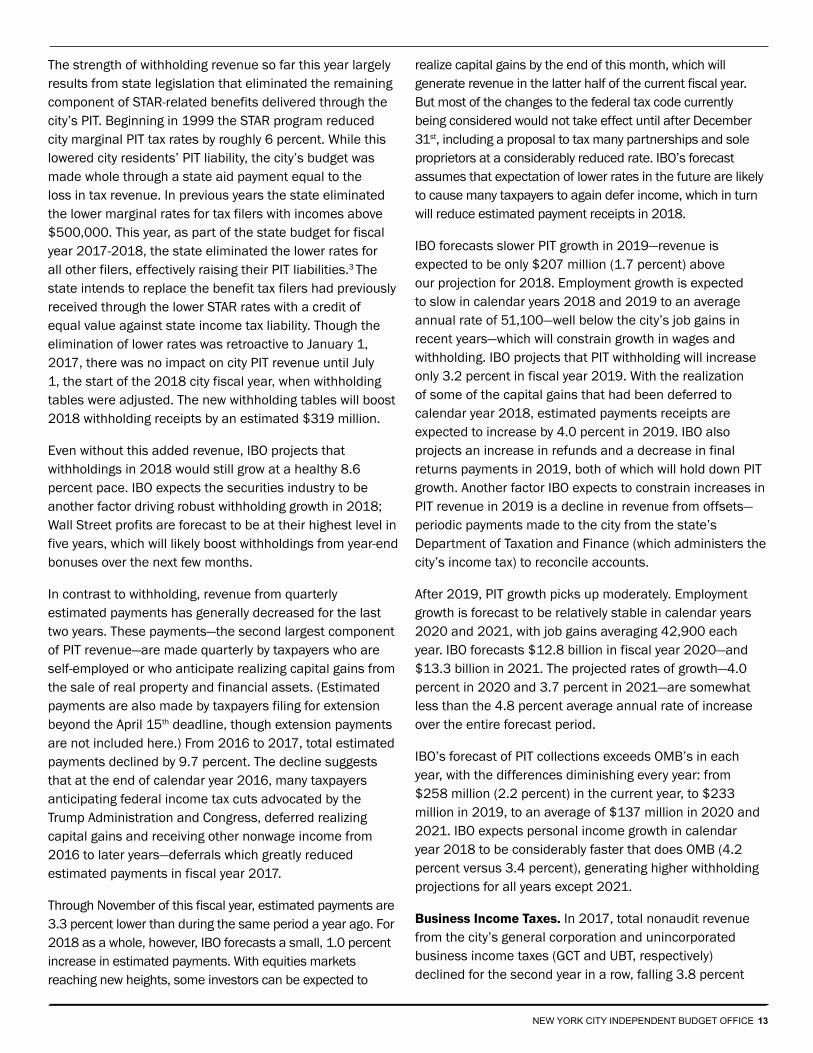
New York City Economy. Through October of this year the New York City economy has added jobs at the slowest pace since the first year of the current expansion (though a benchmark revision is likely to raise the numbers somewhat).
IBO projects employment growth of 64,900 (1.5 percent) for 2017 as a whole (measured from fourth quarter to fourth quarter), followed by gains of 57,700 in 2018, 44,500 in 2019, and 42,100 per year over 2020-2021.
Trade has been a notable weak spot for the city economy in recent years. The “retail apocalypse” striking many brick-and-mortar selling establishments struggling against e-commerce competition has not bypassed New York City, where seasonally adjusted retail employment has shrunk in 9 of the past 11 quarters and as of the third quarter of 2017 was 10,300 below its fourth quarter 2014 peak. Clothing, sporting goods, and department stores have been especially hard hit. Wholesale trade peaked later (first quarter 2016), but has since shed 5,600 jobs. Over the first three quarters of 2017 alone wholesale and retail trade employment dropped by a combined 9,300 jobs.
The information sector has also been shedding jobs throughout 2017, with cumulative losses of 4,800 so far this year.
The bright spots for city employment growth in 2017 are professional and business services (+18,500 through the first three quarters), health care services (+15,700), accommodation and food services (+11,500), and financial activities (+10,200). The latter includes an increase of 7,000 jobs in the securities sector. Education also appears to have mustered somewhat slower but still robust growth on a quarterly basis (+5,900), but unusual patterns in reported May-through-September separations and hirings in this sector cast some doubt on this number.
Business services and health care have been bellwethers of city employment growth throughout the long expansion. For accommodation and food services this year marks a return to form after weak growth in 2016. The increase in securities sector employment is the largest since before the 2008-2009 crisis.
IBO’s forecast anticipates modest 2018 increases in trade and information employment but otherwise weakening growth across all sectors of the city economy next year and through the remainder of the financial plan period.
From March to October of this year the unemployment rate rose from 4.0 percent to 5.0 percent in New York City while falling from 4.5 percent to 4.1 percent in the United States as a whole. But the city’s labor force data have been roiled by extreme swings in estimated household employment and unemployment; IBO expects most of them to be smoothed out in a year-end revision.
In our forecast the city unemployment rate edges down over the next six quarters, bottoming out at 4.3 percent midway through 2019. Projected household employment growth
Cumulative Quarterly Average New York City Employment ChangeSeasonally adjusted
1st-3rd Quarters 4th Quarter
0
25
50
75
100
125
150
In Thousands
2010 2011 2012 2013 2014 2015 2016 2017
39.2
82.668.7
80.9103.5
86.6
62.4 55.0
63.8
91.185.6
117.6135.7 115.4
73.5 64.9
SOURCE: Current Employment Statistics, seasonally adjusted by IBONOTES: 2016 Q4 and 2017 Q1-Q3 are sample-based and will be rebenchmarked. 2017 Q4 is a forecast.
SOURCES: IBO; Mayor’s Office of Management and BudgetNOTES: Rates reflect year-over-year percentage changes except for unemployment, 10-Year Treasury Note rate, federal funds rate, and Manhattan office rents. The local price index for urban consumers (CPI-U-NY) covers the New York/Northern New Jersey region. Personal income is nominal.
is modest over this period, but labor force growth is even slower. The slowing economy pushes the unemployment rate back to 4.6 percent in 2020 and 2021.
IBO expects 2017 to close with another overall decline in inflation-adjusted average wages in New York City. This will make the third year in a row and fifth in the last six of declining real wages. In 2017 dollars, this year’s average wage ($87,815) is 10 percent below the prerecession 2007 peak ($97,506). Over most of this past decade the securities sector has been the main source of drag on overall wage growth, and estimated average Wall Street wages in 2017 ($377,282) remain more than 20 percent below their 2007 peak ($472,567). But annual average wage growth has been very weak throughout much of the city economy. At least in part this is a composition effect, a result of the fact that workforce growth has been much slower in the 35-54 age bracket—the peak earnings years—than it has been among both younger (22-34) and older (55 and up) workers. The ongoing decline in average hours worked over the past decade has likely also cut into annual wage growth.
IBO’s forecast includes a turn to positive growth in average real wages in 2018 with small inflation-adjusted gains continuing over the forecast period. The anticipated growth is attributed to wage pressures stemming from the combination of the prolonged expansion with slower labor force growth.
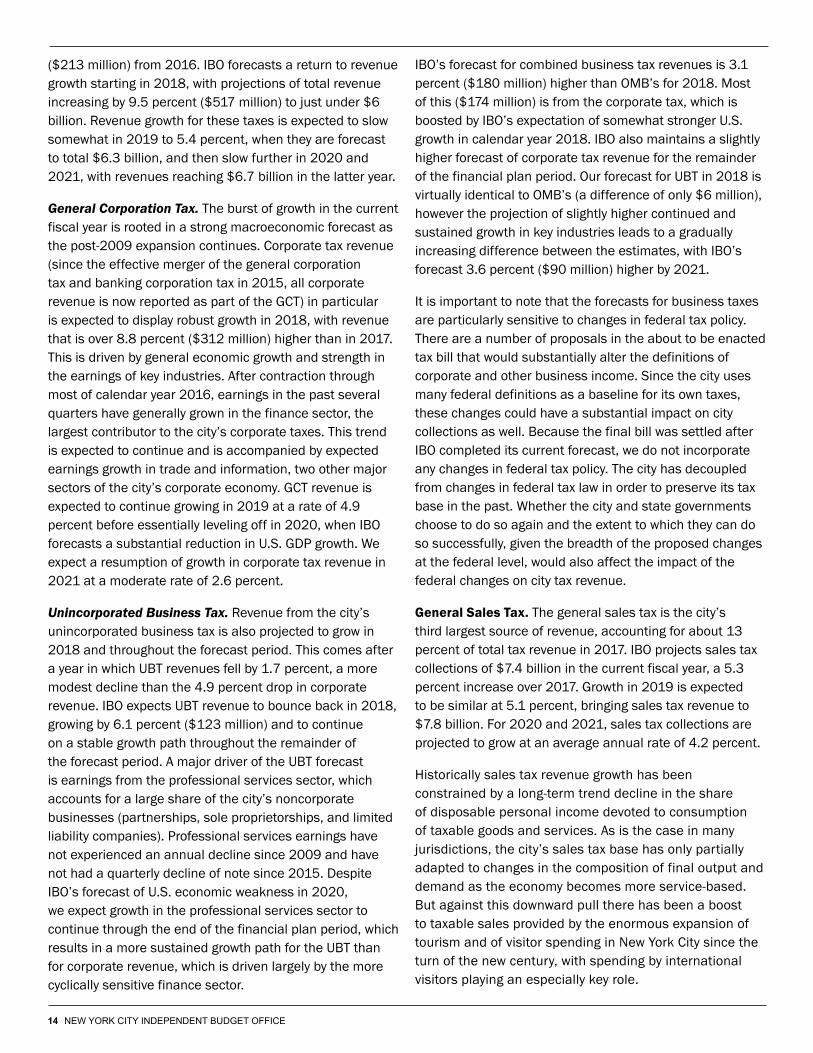
New York Stock Exchange member-firm broker-dealer profits surged to $17.8 billion over the first three quarters of 2017, exceeding the total for all of 2016. Our projected $21.9 billion total for the full year would make 2017 the best year for Wall Street profits since 2012. Net interest expenses are expected to top $25.1 billion this year, nearly double the level of 2016—which itself more than doubled the level of 2015. But the growth in net operating revenues has more than kept pace. Both revenues and expenses are still far below the norms that prevailed before the crisis of 2008 (see figure), but the trend has been away from the extremely low levels of recent years.
IBO currently projects net interest expenses and net operating revenues to grow more slowly over the next five years, yielding Wall Street profit estimates in the $16 billion to $18 billion range over this period. But all these forecasts may have to be revised upward if the current momentum in broker-dealer activity is sustained.
IBO estimates that taxable real estate sales in New York City will total roughly $92 billion in 2017, a significant drop from both the record $126 billion in sales in 2015, and the $111 billion total of 2016. We expect commercial sales to be around $37 billion, less than half the record-breaking 2015 total of $78 billion. Residential sales are projected at roughly $55 billion, a new record. This will be the first year since 2010 that the value of residential sales has exceeded the value of commercial sales.
$-80$-70$-60$-50$-40$-30$-20$-10
$0$10$20$30$40$50$60$70
19911992
19931994
19951996
19971998
19992000
20012002
20032004
20052006
20072008
20092010
20112012
20132014
20152016
2017
Quarterly Net Operating Revenues, Net Interest Expenses, and Profits of New York Stock Exchange Member Firms
Net Operating Revenues
2016 dollars in billions
Net Interest Expenses Profits
SOURCE: Intercontinental ExchangeNew York City Independent Budget Office
The strength in residential sale value this year has been largely driven by growth in unit prices and sales volume outside Manhattan. Comparing the first 11 months of 2017 with the same period last year, the average price per residential unit sold rose 3.9 percent citywide, but fell 0.7 percent in Manhattan. Average prices rose by double digit amounts in the other four boroughs, led by Brooklyn, with an increase of 11.9 percent. The number of residential sales rose 4.7 percent citywide in January-November 2017 compared with the same period in 2016, but in Manhattan the increase was just 2.6 percent, the lowest of the five boroughs. This indicates weakness at the very high end of the market, which is concentrated in Manhattan.
IBO expects real estate sales to increase slightly in 2018, as a mild recovery in the commercial sector compensates for a drop in residential sales. Sales will continue to increase through 2021, but will still fall short of the record levels of 2015. The struggles of “brick and mortar” retail, combined with slowing employment growth in office-using industries, as well as the availability of new office space at the World Trade Center site and Hudson Yards, will reduce the attractiveness of buying and selling office and retail buildings on the basis of expected future income growth. On the residential side, moderate growth is projected. However, changes in income tax policy such as the elimination of deductions for state and local taxes, and/or restrictions on the deductibility of mortgage interest, could put downward pressure on residential prices.
Taxes and Other Revenues
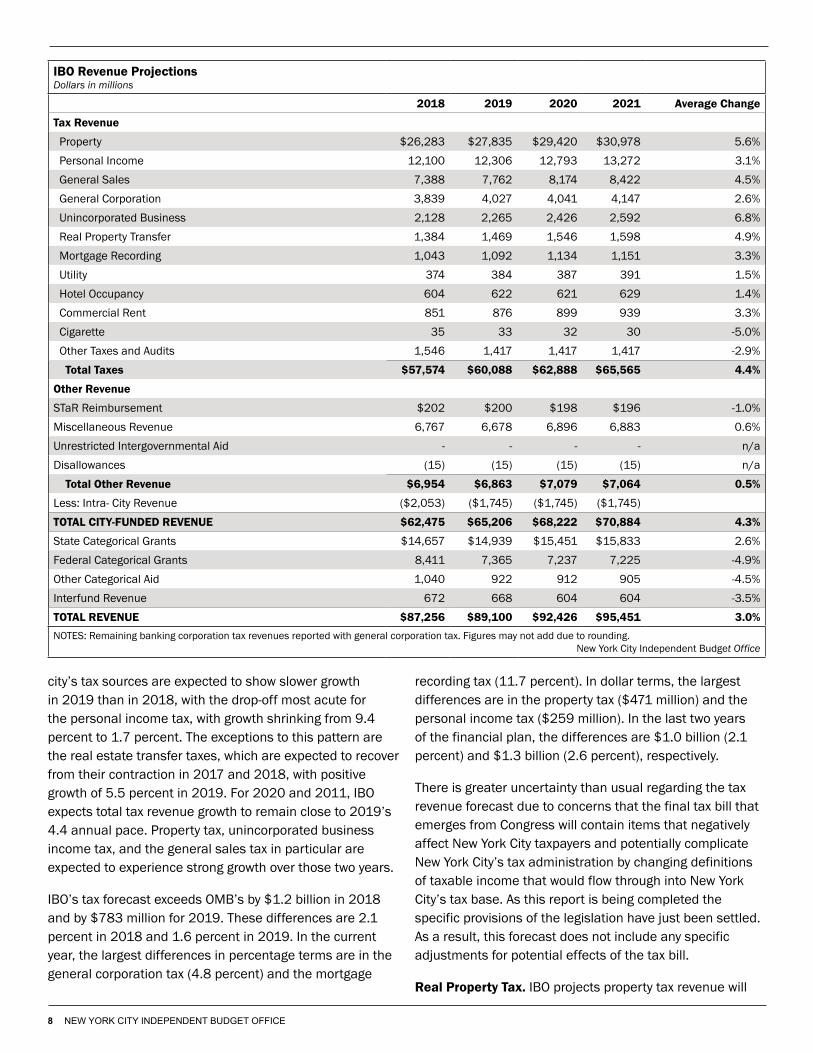
IBO’s forecast of revenue from taxes and other sources including fines, fees, and state and federal aid totals $87.3 billion for the current fiscal year, an increase of $3.8 billion (4.5 percent) over 2017 (all years in this section and the following sections refer to fiscal years unless otherwise noted). Much of this increase is due to an anticipated $3.3 billion, or 6.0 percent, increase in tax revenue this year over last, led by the city’s personal and business income taxes as well as the real property tax. State and federal grants are also expected to add $1.4 billion this year; much of the increase in federal grants continues to be related to post-Sandy rebuilding and resiliency programs supported by federal agencies. Meanwhile, the city’s nontax revenues, which come from fees, fines, and a variety of other sources, are expected to fall by $977 million (12.3 percent) from 2017 to 2018. Total revenue growth in 2019 is expected to slow by more than half to 2.1 percent, with taxes and state and local grants all expected to experience slower growth in 2019 than in 2018. Of the $89.1 billion in total revenue IBO forecasts
for 2019, $65.2 billion will come from city sources and the balance from state, federal, and other categorical grants.
While total revenue growth is expected to be modest from this year to next, IBO expects the tax revenue portion of that total be somewhat stronger, rising by $2.5 billion, or 4.4 percent, to reach $60.1 billion in 2019. The city’s own nontax revenues (primarily fees, fines, and asset sales) are projected to show little change from 2018 to 2019, totaling $6.9 billion, down less than $100 million from 2018. Noncity revenues in 2019 are expected to be 3.7 percent lower than in 2018 thanks largely to an anticipated drop in federal grants under OMB’s assumption that much of the remaining Sandy aid is actually spent in 2018.
IBO projects that total revenues will grow at a moderate, 3.5 percent average annual rate after 2019, with the total reaching $95.5 billion by 2021. Over the last two years of the financial plan, city taxes are expected to outpace growth from other city revenue sources, as well as state and federal grants. Taxes are forecast to increase at an average annual rate of 4.4 percent, while growth in noncity revenue sources is projected to average 1.5 percent a year in 2020 and 2021.
The first part of this section presents IBO’s tax revenue forecast, followed by a detailed discussion of each of the city’s major tax sources. It concludes with a brief overview of the outlook for nontax revenues.
Tax Revenues. IBO’s forecast for tax revenue in the current fiscal year is $57.6 billion, a gain of 6.0 percent from fiscal year 2017. This marks a rebound in growth following the two prior years when tax revenue growth was 3.6 percent and 2.6 percent, respectively. Tax revenue growth is forecast to moderate to 4.4 percent in 2019, with taxes growing to $60.1 billion. We project that tax revenues will rise at an average rate of 4.4 percent annually over the final two years of the financial plan period and total $65.6 billion in 2021.
The strong revenue growth this year is seen in most of the city’s major tax sources. The exceptions are declines in the city’s two real estate transfer taxes, which are dependent on interest rates and the state of the local property markets. After peaking in 2016, both transfer taxes fell in 2017 and are forecast to show negative growth again this year, although the declines are less severe than in 2017. Mortgage recording tax revenue (MRT) is expected to fall by 6.7 percent this year and real property transfer tax (RPTT) revenue by 2.2 percent
For 2019, IBO expects tax revenue growth to slow to 4.4 percent, with revenue totaling $60.1 billion. Most of the
city’s tax sources are expected to show slower growth in 2019 than in 2018, with the drop-off most acute for the personal income tax, with growth shrinking from 9.4 percent to 1.7 percent. The exceptions to this pattern are the real estate transfer taxes, which are expected to recover from their contraction in 2017 and 2018, with positive growth of 5.5 percent in 2019. For 2020 and 2011, IBO expects total tax revenue growth to remain close to 2019’s 4.4 annual pace. Property tax, unincorporated business income tax, and the general sales tax in particular are expected to experience strong growth over those two years.
IBO’s tax forecast exceeds OMB’s by $1.2 billion in 2018 and by $783 million for 2019. These differences are 2.1 percent in 2018 and 1.6 percent in 2019. In the current year, the largest differences in percentage terms are in the general corporation tax (4.8 percent) and the mortgage
recording tax (11.7 percent). In dollar terms, the largest differences are in the property tax ($471 million) and the personal income tax ($259 million). In the last two years of the financial plan, the differences are $1.0 billion (2.1 percent) and $1.3 billion (2.6 percent), respectively.
There is greater uncertainty than usual regarding the tax revenue forecast due to concerns that the final tax bill that emerges from Congress will contain items that negatively affect New York City taxpayers and potentially complicate New York City’s tax administration by changing definitions of taxable income that would flow through into New York City’s tax base. As this report is being completed the specific provisions of the legislation have just been settled. As a result, this forecast does not include any specific adjustments for potential effects of the tax bill.
Real Property Tax. IBO projects property tax revenue will
grow from $26.3 billion in 2018 to $27.8 billion in 2019, a 5.9 percent increase. For the four years of the financial plan period, we expect revenue to grow at an average annual pace of 5.6 percent. By comparison, OMB expects increases in property tax revenue to average 5.1 percent a year through 2021.
Background. The amount of tax owed on real property in New York City depends on the type of property, its value for tax purposes, and the applicable tax rate. Under New York State’s property tax law, there are four classes of property in the city: Class 1 consists of one-, two-, and three-family homes; Class 2 comprises apartment buildings, including cooperatives and condominiums; Class 3 is exclusively real property owned by utility companies; and Class 4 consists of all other commercial and industrial property. Each class’s share of the levy is determined under state law that allows only small shifts in the share of the overall property tax borne by each class. The city then divides the apportioned citywide levy by the taxable assessed value of property for each class, resulting in a class-specific tax rate that determines how much a taxpayer in a particular class owes per $100 of their property’s taxable value.
The assessed value of a property for tax purposes (taxable assessed value) is established by the Department of Finance. The department estimates each property’s fair market value and then applies an assessment percentage, which reduces the amount of the property’s value subject to the property tax. For Class 1 property, no more than 6.0 percent of fair market value is taxable, while 45.0 percent of fair market value is taxable in Classes 2, 3, and 4; the assessment rates for each class are set by the Finance Commissioner. A property’s resulting assessed value is then further reduced by any property tax exemptions in order to reach taxable assessed value.
Because of differences in assessment percentages, exemptions, and assessment practices across property types, the share of the levy borne by each class is not
proportional to its share of market value. One critical difference in assessment practices affects taxable assessed values for coops and condos in Class 2. Under the state law, the city is required to value coops and condos as if they were income producing properties rather than based on sales values as Class 1 properties are. IBO estimates that valuing coops and condos based on income results in market values for tax purposes that are discounted by roughly 20 percent compared with sales-based estimates.
Class 1 properties account for a much smaller share of the levy (14.8 percent) than their share of market value, as reported by the Department of Finance (47.2 percent) or as a share of IBO’s estimate incorporating sales-based values of coops and condos (32.5 percent). Based on the market values reported by the Department of Finance, Class 2 accounts for 24.7 percent of market value, a share that almost doubles if IBO’s sales-based market value estimates are used for coops and condos. The other classes bear a disproportionately large share of the property tax burden because their shares of the levy exceed their shares of market value, regardless of how it is measured.
These disparities between the share of total market value and the share of the tax levy are likely to be at the center of the debate over reforming the city’s property tax, which Mayor de Blasio has promised to take up during his next term.
Assessment Roll for 2019. The tentative assessment roll for fiscal year 2019 is scheduled for release in January 2018. After a period for appeals and review, a final roll will be released in May. IBO projects that aggregate market value on the final roll will be 6.5 percent greater than on 2018’s roll, while assessed value for tax purposes is forecast to grow by 5.9 percent.
Class 1. The aggregate market value of Class 1 properties on the 2019 roll is expected to be 7.9 percent higher than this year’s. This increase reflects strong growth in median
Disparities Between Market Values and Levy ShareDollars in billions
Tax Class
Department of Finance Fiscal Year 2018 Final Roll IBO Estimated Market Value
City Council Tax Fixing Resolution
Total Market Value
Share of the Total Market Value
Estimated Market Value
Share of the Total Market Value Share of the Levy Levy
sales prices; for single-family homes in the boroughs outside Manhattan, the median price through September was $520,000, a $38,000 increase over last year.
IBO projects assessed value for tax purposes in 2019 will increase by 3.8 percent over 2018. For Class 1 properties, the assessed value moves toward a target assessment of 6.0 percent of market value, although assessment increases are capped at 6.0 percent a year or 20.0 percent over five years. As long as a parcel’s assessed value under the cap is less than the target assessment of 6.0 percent of market value, the ratio of assessed value to market value will trend upwards towards 6.0 percent. If the assessed value under the cap reaches 6.0 percent of market value, the latter becomes the new assessed value, which is why the ratio of assessed value to market value can never exceed 6.0 percent. When the housing market is strong, the median ratio of assessed value to market value tends to fall as increases in market value outpace increases in the capped assessments. For single-family homes outside Manhattan, the median ratio of assessed to market value declined from 5.4 percent in 2004 to a low of 3.7 percent in 2008. More recently, the median ratio for single-family homes outside Manhattan has been slowly rising, growing from 4.0 percent in 2009 to 4.9 percent in 2018—still well below the 6.0 percent target.
Class 2 and Class 4. IBO projects that on the final roll for 2019, the official aggregate market value for Class 2 will total $299.6 billion, a 6.4 percent increase over 2018. Aggregate market value for Class 4 property is expected to reach $308.6 billion, a 4.3 percent increase over 2018.
Aggregate assessed value for tax purposes for Class 2 is expected to be $85.9 billion, a 5.9 percent increase from the 2018 roll, and $116.2 billion for Class 4, a 6.3 percent change from the previous year. The increase projected for Class 2 is below the average growth in taxable assessed value over the past five years (7.7 percent). The slower growth in part echoes a drop in new multifamily building permits after a rush to start projects before the benefits available under the 421-a program were curtailed. The forecast for Class 4 is also slightly below its five-year average of 6.6 percent. IBO expects that widespread problems in New York City’s retail sector will continue to put downward pressure on retail rents, slowing the increase in aggregate market value and taxable assessed values in Class 4.
The continued growth in Class 2 and Class 4 assessments for tax purposes is partly attributable to the city’s method
for translating changes in market value into assessed value. In most cases changes in parcels’ market values are phased in over five years. The assessed value changes from the preceding four years that have yet to be recognized on the tax roll are called the pipeline. IBO’s assessed value projections thus are in part a reflection of the strong real estate market in recent years, which has allowed the pipeline to increase fourfold from $6.3 billion in 2011 to $26.0 billion in 2018.
Outlook for Market & Assessed Values in 2020 & 2021. IBO forecasts an increase in aggregate market value of 5.5 percent in 2020 and 5.1 percent in 2021. Market value growth in Class 1 is expected to slow from 7.9 percent in 2019 to 4.6 percent in 2021, while increases in market value in Classes 2 and 4 are expected to remain stable at 6.6 percent and 4.8 percent, respectively, over the last two years of the financial plan.
Aggregate assessed value for tax purposes is projected to grow by 5.8 percent in 2020 and 5.4 percent in 2021. IBO anticipates 5.9 percent annual average growth for Class 4 in both 2020 and 2021. Class 1 and 2 taxable assessed values are expected to grow an average of 3.8 percent and 5.8 percent, respectively in 2020 and 2021. Based on these estimates, the pipeline of changes in assessed value remaining to be recognized on the tax roll will fall from $26.2 billion in 2019 to $23.4 billion in 2020 and $21.9 billion in 2021.
Outlook for Property Tax Revenue. IBO anticipates property tax revenue will total $26.3 billion at the close of 2018 and $27.8 billion in 2019—an increase of 5.9 percent. Growth is expected to average 5.5 percent annually over the following two years, with revenue reaching $31.0 billion in 2021. In contrast, OMB forecasts 2018 revenues of $25.8 billion and average annual growth of 5.1 percent through 2021, when they project property tax revenue will total $29.9 billion.
Much of the difference between IBO’s forecast and OMB’s stems from elements of the property tax system other than the market outlook. The amount of property tax revenue the city collects in any fiscal year is determined not just by the assessment roll and tax rates, but also by the delinquency rate, abatements granted, refunds for disputed assessments, collections from prior years, and other property tax debits and credits collectively known as the property tax reserve. Most of the variance between IBO’s and OMB’s property tax revenue projections is attributable to differences in forecasting items included in the reserve. Some reserve components, such as delinquencies, are
counted as debits, thus reducing current year tax revenue. Other components, such as payments made in a given fiscal year for prior-year liability, are counted as credits, thus increasing current year tax revenue. Because the dollar value of the debits generally exceeds the dollar value of the credits, the net value of the reserve is nearly always negative, which is why anticipated revenue is always less than the forecast for the property tax levy.
At this point in the fiscal year, with the assessment roll and levy finalized last spring, the only differences between the IBO and OMB 2018 property tax revenue forecasts will stem from the reserve.1 Virtually the entire difference between OMB’s and IBO’s revenue forecast is due to four components in the reserve: prior-year collections, refunds, delinquencies, and canceled taxes. Later in the forecast period, differences in the levy forecasts play a greater role so that by 2021, differences between IBO’s and OMB’s reserve forecast for these four components account for less than half of the difference.
Exemption Changes in 2018 and Beyond. Parameters for two exemptions—one for veterans and the other for senior citizens and disabled homeowners—were changed for 2018 and beyond. Taxpayers receiving the veteran’s exemption are now also exempt from the portion of the total property tax rate earmarked for school purposes. The property tax rate is actually made up of two parts: one for general government purposes and one for school purposes. In the past, veteran property owners were only exempt from the general purpose portion of the property tax, but not the share of the tax used to fund schools. The new legislation will exempt veterans from both. Also, the maximum income limit to qualify for the senior citizen and disability exemptions was increased from $37,999 to $58,399. Senior and disabled homeowners making $50,000 or less can now have the taxable assessed value of their homes cut by 50 percent, with smaller percentage reductions for those with incomes between $50,000 and $58,399. OMB estimates that these changes will together decrease revenue by $87 million in 2018 and about $94 million, on average, from 2019 through 2021.2
Tax legislation about to be enacted as this report is being written will include provisions that would negatively affect the value of real property and property tax revenue in New York City. IBO’s current forecast, completed before the tax bill was finalized, does not include adjustments for potential impacts.
Real Estate Transfer Taxes. The city receives revenue from two taxes related to real estate purchases or financing.
The real property transfer tax is levied on the value of real estate sold, while the mortgage recording tax is levied on the value of mortgages, including certain refinancing activity. Together these taxes are referred to as the transfer taxes. IBO expects revenues from the transfer taxes to decline for the second year in a row, to $2.4 billion in 2018, 19.3 percent less than the $3.0 billion received in 2016. Following this year’s dip, collections from the two taxes are projected to grow at a moderate rate, and reach $2.7 billion in 2021. Even without adjusting for inflation, collections will remain well below their 2007 peak ($3.3 billion in 2007 dollars) for the foreseeable future.
Real Property Transfer Tax. Revenue from the real property transfer tax reached $1.4 billion in billion in 2017, a 20.3 percent drop from the record $1.8 billion level of 2016. RPTT collections vary with both the level and composition of real estate sales. Commercial properties are taxed at a higher rate than residential properties, and for both commercial and residential sales, the tax rate is higher when the price exceeds $500,000.
Real estate sales and RPTT revenue peaked in 2007, declined over the next three years, and then began a recovery. In 2015, RPTT revenues from commercial sales reached an all-time high, not adjusting for inflation. In 2016 commercial sales dropped, while residential sales, and total RPTT revenue, were even greater than the year before. The commercial real estate sector continued to lose ground compared with the residential sector in 2017. For the first five months of fiscal year 2018 (through November) RPTT revenue from commercial sales was down 15.1 percent with respect to the same period last year, while tax revenue from residential sales was up 3.8 percent.
IBO projects that RPTT revenue will drop 2.2 percent in 2018 compared with 2017, due to the decline in commercial sales. Growth will resume in 2019 and continue through 2021, with residential real estate projected to account for just under half of tax revenue. By 2021, RPTT collections are forecast to be $1.6 billion, well below the record levels of 2015 and 2016.
Mortgage Recording Tax. Mortgage recording tax revenue fell more sharply than RPTT collections in the wake of the financial crisis, and has recovered more slowly. MRT revenue was roughly $1.2 billion in 2017, 9.4 percent less than in 2016, and far below the 2007 peak of $1.6 billion (2007 dollars).
The MRT does not track the value of real estate sales as closely as does the RPTT because not all sales involve a
mortgage, and for sales with a mortgage, the fraction of the purchase price that is financed varies by transaction. In addition, mortgage refinancings, which may be subject in part or in whole to the MRT, are not connected to a property sale.
Historically, high MRT collections have generally corresponded to periods of low interest rates and significant refinancing activity. Mortgage rates fell in the aftermath of the financial crisis of 2007, but the depressed economy and credit restrictions kept lending activity at a low level. As the economy recovered, continued low interest rates stimulated borrowing. While IBO projects increases in mortgage rates over the next few years, rates will continue to be low by historic standards. Higher interest rates will exert a dampening effect on real estate prices, but overall sales and the value of sales-related mortgage originations are still expected to rise. The value of mortgage refinancing, on the other hand, will drop as rates increase. After declining 6.7 percent to $1.0 billion in 2018, MRT revenue is projected to rise to $1.2 billion in 2021.
IBO’s projections of transfer tax revenue follow a similar pattern to those of OMB, but are consistently higher. IBO’s forecast of RPTT revenue is 1.5 percent higher in 2018 and 4.9 percent higher in 2019. IBO’s MRT forecast is 11.7 percent higher than OMB’s in 2018 and 13.9 percent higher in 2019. For the entire 2018-2021 period, our forecast of RPTT revenue is 4.9 percent higher than OMB’s, while our forecast of MRT revenue is 12.9 percent higher.
Expected changes in federal tax policy will have a significant impact on the real estate market, and by implication, on RPTT and MRT revenues. These changes will reduce the overall tax benefits from purchasing residential property, by restricting the scope of the mortgage interest deduction and increasing the standard deduction. Policies that diminish the tax benefits of buying residential property would be expected to reduce the average price per unit of housing sold, resulting in lower RPTT and MRT revenues from each sale. Because the tax bill was still being negotiated as we completed our forecast, we assume that current law remains unchanged.
Commercial Rent Tax. IBO expects commercial rent tax (CRT) revenue to total $851 million in 2018, up 4.2 percent from 2017. CRT revenue is projected to grow at an annual average rate of 3.3 percent in 2019 through 2021 and reach $939 million in 2021, a 15.0 percent increase over 2017.
The CRT is a tax imposed on tenants who rent space for business, professional, or commercial purposes in certain areas of Manhattan below 96th Street. Not-for-profit entities,
subtenants, tenants located in the World Trade Center area, and tenants located in the Commercial Revitalization Program abatement zone are all exempt from the tax. Over time both the tax rate and the geographic area subject to the tax have been reduced. Currently, tenants whose annual gross rents are less than $250,000 are exempt from the tax, and a sliding tax credit is applied to tenants with annual or annualized rents between $250,000 and $300,000.
A bill passed by the City Council in November 2017 creates a credit that eliminates the tax for tenants paying from $250,000 to $499,999 in annualized rent, provided the total income of the tenant is $5 million or less. Tenants paying rents of $250,000 to $499,999 but with income of $5 million to $10 million are eligible for a partial tax credit, as are tenants paying from $500,000 to $550,000 whose income does not exceed $10 million. The new regulations will take effect July 1, 2018, and the City Council Finance Division anticipates that they will result in a reduction of $37 million in CRT revenue in 2019. Neither IBO nor OMB has included the impact of the bill in their CRT revenue projections.
Annual CRT collections depend on the tax rate, rent levels, and the amount of rental space subject to the tax. Unlike the transfer taxes, CRT revenue is not subject to significant year-to-year fluctuations, and has increased every year since 1999. IBO’s CRT forecasts for this year and the next are almost identical to those of OMB—just $3 million higher in 2018 and $8 million lower in 2019. OMB projects slightly higher growth than IBO in subsequent years, and by 2021, IBO’s forecast is $16 million (1.7 percent) below OMB’s.
Personal Income Tax. IBO forecasts $12.1 billion in personal income tax (PIT) revenue—net of refunds—in 2018, a little more than $1 billion (9.4 percent) increase over 2017 collections. The jump in revenue this year is largely the result of changes enacted last spring in the state’s School Tax Relief (STAR) program. PIT growth is projected to slow to 1.7 percent in 2019 to $12.3 billion—slower growth than in all but one other year since the current economic expansion began in 2010. IBO expects growth to average 3.8 percent a year in 2020 and 2021.
So far this year, 2018 personal income tax collections have followed a pattern similar to 2017, with solid increases in withholding receipts—the largest component of PIT revenue—and decreases in quarterly estimated payments. Withholding receipts so far this year (through November) are 14.5 percent greater than during the comparable period in 2017, and IBO forecasts 12.5 percent withholding growth for the year as a whole.
The strength of withholding revenue so far this year largely results from state legislation that eliminated the remaining component of STAR-related benefits delivered through the city’s PIT. Beginning in 1999 the STAR program reduced city marginal PIT tax rates by roughly 6 percent. While this lowered city residents’ PIT liability, the city’s budget was made whole through a state aid payment equal to the loss in tax revenue. In previous years the state eliminated the lower marginal rates for tax filers with incomes above $500,000. This year, as part of the state budget for fiscal year 2017-2018, the state eliminated the lower rates for all other filers, effectively raising their PIT liabilities.3 The state intends to replace the benefit tax filers had previously received through the lower STAR rates with a credit of equal value against state income tax liability. Though the elimination of lower rates was retroactive to January 1, 2017, there was no impact on city PIT revenue until July 1, the start of the 2018 city fiscal year, when withholding tables were adjusted. The new withholding tables will boost 2018 withholding receipts by an estimated $319 million.
Even without this added revenue, IBO projects that withholdings in 2018 would still grow at a healthy 8.6 percent pace. IBO expects the securities industry to be another factor driving robust withholding growth in 2018; Wall Street profits are forecast to be at their highest level in five years, which will likely boost withholdings from year-end bonuses over the next few months.
In contrast to withholding, revenue from quarterly estimated payments has generally decreased for the last two years. These payments—the second largest component of PIT revenue—are made quarterly by taxpayers who are self-employed or who anticipate realizing capital gains from the sale of real property and financial assets. (Estimated payments are also made by taxpayers filing for extension beyond the April 15th deadline, though extension payments are not included here.) From 2016 to 2017, total estimated payments declined by 9.7 percent. The decline suggests that at the end of calendar year 2016, many taxpayers anticipating federal income tax cuts advocated by the Trump Administration and Congress, deferred realizing capital gains and receiving other nonwage income from 2016 to later years—deferrals which greatly reduced estimated payments in fiscal year 2017.
Through November of this fiscal year, estimated payments are 3.3 percent lower than during the same period a year ago. For 2018 as a whole, however, IBO forecasts a small, 1.0 percent increase in estimated payments. With equities markets reaching new heights, some investors can be expected to
realize capital gains by the end of this month, which will generate revenue in the latter half of the current fiscal year. But most of the changes to the federal tax code currently being considered would not take effect until after December 31st, including a proposal to tax many partnerships and sole proprietors at a considerably reduced rate. IBO’s forecast assumes that expectation of lower rates in the future are likely to cause many taxpayers to again defer income, which in turn will reduce estimated payment receipts in 2018.
IBO forecasts slower PIT growth in 2019—revenue is expected to be only $207 million (1.7 percent) above our projection for 2018. Employment growth is expected to slow in calendar years 2018 and 2019 to an average annual rate of 51,100—well below the city’s job gains in recent years—which will constrain growth in wages and withholding. IBO projects that PIT withholding will increase only 3.2 percent in fiscal year 2019. With the realization of some of the capital gains that had been deferred to calendar year 2018, estimated payments receipts are expected to increase by 4.0 percent in 2019. IBO also projects an increase in refunds and a decrease in final returns payments in 2019, both of which will hold down PIT growth. Another factor IBO expects to constrain increases in PIT revenue in 2019 is a decline in revenue from offsets—periodic payments made to the city from the state’s Department of Taxation and Finance (which administers the city’s income tax) to reconcile accounts.
After 2019, PIT growth picks up moderately. Employment growth is forecast to be relatively stable in calendar years 2020 and 2021, with job gains averaging 42,900 each year. IBO forecasts $12.8 billion in fiscal year 2020—and $13.3 billion in 2021. The projected rates of growth—4.0 percent in 2020 and 3.7 percent in 2021—are somewhat less than the 4.8 percent average annual rate of increase over the entire forecast period.
IBO’s forecast of PIT collections exceeds OMB’s in each year, with the differences diminishing every year: from $258 million (2.2 percent) in the current year, to $233 million in 2019, to an average of $137 million in 2020 and 2021. IBO expects personal income growth in calendar year 2018 to be considerably faster that does OMB (4.2 percent versus 3.4 percent), generating higher withholding projections for all years except 2021.
Business Income Taxes. In 2017, total nonaudit revenue from the city’s general corporation and unincorporated business income taxes (GCT and UBT, respectively) declined for the second year in a row, falling 3.8 percent
($213 million) from 2016. IBO forecasts a return to revenue growth starting in 2018, with projections of total revenue increasing by 9.5 percent ($517 million) to just under $6 billion. Revenue growth for these taxes is expected to slow somewhat in 2019 to 5.4 percent, when they are forecast to total $6.3 billion, and then slow further in 2020 and 2021, with revenues reaching $6.7 billion in the latter year.
General Corporation Tax. The burst of growth in the current fiscal year is rooted in a strong macroeconomic forecast as the post-2009 expansion continues. Corporate tax revenue (since the effective merger of the general corporation tax and banking corporation tax in 2015, all corporate revenue is now reported as part of the GCT) in particular is expected to display robust growth in 2018, with revenue that is over 8.8 percent ($312 million) higher than in 2017. This is driven by general economic growth and strength in the earnings of key industries. After contraction through most of calendar year 2016, earnings in the past several quarters have generally grown in the finance sector, the largest contributor to the city’s corporate taxes. This trend is expected to continue and is accompanied by expected earnings growth in trade and information, two other major sectors of the city’s corporate economy. GCT revenue is expected to continue growing in 2019 at a rate of 4.9 percent before essentially leveling off in 2020, when IBO forecasts a substantial reduction in U.S. GDP growth. We expect a resumption of growth in corporate tax revenue in 2021 at a moderate rate of 2.6 percent.
Unincorporated Business Tax. Revenue from the city’s unincorporated business tax is also projected to grow in 2018 and throughout the forecast period. This comes after a year in which UBT revenues fell by 1.7 percent, a more modest decline than the 4.9 percent drop in corporate revenue. IBO expects UBT revenue to bounce back in 2018, growing by 6.1 percent ($123 million) and to continue on a stable growth path throughout the remainder of the forecast period. A major driver of the UBT forecast is earnings from the professional services sector, which accounts for a large share of the city’s noncorporate businesses (partnerships, sole proprietorships, and limited liability companies). Professional services earnings have not experienced an annual decline since 2009 and have not had a quarterly decline of note since 2015. Despite IBO’s forecast of U.S. economic weakness in 2020, we expect growth in the professional services sector to continue through the end of the financial plan period, which results in a more sustained growth path for the UBT than for corporate revenue, which is driven largely by the more cyclically sensitive finance sector.
IBO’s forecast for combined business tax revenues is 3.1 percent ($180 million) higher than OMB’s for 2018. Most of this ($174 million) is from the corporate tax, which is boosted by IBO’s expectation of somewhat stronger U.S. growth in calendar year 2018. IBO also maintains a slightly higher forecast of corporate tax revenue for the remainder of the financial plan period. Our forecast for UBT in 2018 is virtually identical to OMB’s (a difference of only $6 million), however the projection of slightly higher continued and sustained growth in key industries leads to a gradually increasing difference between the estimates, with IBO’s forecast 3.6 percent ($90 million) higher by 2021.
It is important to note that the forecasts for business taxes are particularly sensitive to changes in federal tax policy. There are a number of proposals in the about to be enacted tax bill that would substantially alter the definitions of corporate and other business income. Since the city uses many federal definitions as a baseline for its own taxes, these changes could have a substantial impact on city collections as well. Because the final bill was settled after IBO completed its current forecast, we do not incorporate any changes in federal tax policy. The city has decoupled from changes in federal tax law in order to preserve its tax base in the past. Whether the city and state governments choose to do so again and the extent to which they can do so successfully, given the breadth of the proposed changes at the federal level, would also affect the impact of the federal changes on city tax revenue.
General Sales Tax. The general sales tax is the city’s third largest source of revenue, accounting for about 13 percent of total tax revenue in 2017. IBO projects sales tax collections of $7.4 billion in the current fiscal year, a 5.3 percent increase over 2017. Growth in 2019 is expected to be similar at 5.1 percent, bringing sales tax revenue to $7.8 billion. For 2020 and 2021, sales tax collections are projected to grow at an average annual rate of 4.2 percent.
Historically sales tax revenue growth has been constrained by a long-term trend decline in the share of disposable personal income devoted to consumption of taxable goods and services. As is the case in many jurisdictions, the city’s sales tax base has only partially adapted to changes in the composition of final output and demand as the economy becomes more service-based. But against this downward pull there has been a boost to taxable sales provided by the enormous expansion of tourism and of visitor spending in New York City since the turn of the new century, with spending by international visitors playing an especially key role.
There is some risk to the sales tax forecast on both of these fronts. On the one hand, the “retail apocalypse” overtaking brick-and-mortar sales establishments (and reflected in the collapse of New York City retail employment growth) may accelerate the decline in the ratio of taxable sales to disposable (after-tax) income. On the other hand, there is concern that anxieties surrounding changes in U.S. immigration and visa policies may substantially curtail international tourism; for calendar year 2017, NYC and Co. has recently projected the first decline in the number of foreign tourists since 2009. Insofar as these fears are borne out, this too could weigh down growth in taxable sales.
IBO’s sales tax forecast is about $129 million higher than OMB’s projection for the current year. For 2019 the IBO forecast is $119 million less than OMB’s, though this difference is for the most part due to differing treatment of the final $150 million of the Sales Tax Asset Receivable Corporation intercept scheduled for July 2018 through March 2019. IBO recognizes these repayments to the state out of sales tax receipts but OMB does not. Had OMB deducted these scheduled repayments from its forecast, IBO’s 2019 forecast would exceed OMB’s by $31 million.
Hotel Occupancy Tax. IBO forecasts $604 million in hotel tax collections for 2018, a 4.2 percent increase over collections in 2017. For 2019, $622 million in hotel tax revenue—a 2.9 percent increase—is expected. In the following years average annual growth is only 0.6 percent.
Hotel stays in the city are taxed by both the sales tax and the hotel tax. As noted above in the sales tax section, the growth of tourism in New York City has been a boon to the city’s economy and tax revenues for more than a decade. Since 2009 hotel tax revenue has increased at an annual average rate of 6.8 percent—remarkable growth considering the large increase in the city’s hotel room inventory, increased competition from Airbnb rentals (whose hosts do not always meet their tax obligations), sluggish domestic economic growth, and recessions in some of the countries that account for large shares of the city’s tourists during this period. Revenue growth has slowed in the last three years to an average annual rate of 2.6 percent, as some of these headwinds may be taking their toll. With no major foreign economy in recession and the domestic economy near or at full-employment and expected to continue expanding for the next two years, IBO expects hotel tax revenue growth to continue, but at even slower paces than in recent years.
IBO’s 2018 hotel tax forecast is $24 million greater than
OMB’s, which projects only a negligible increase in revenue this year. The difference grows to $30 million in 2019 but then narrows as OMB projects more substantial growth in 2020 and 2021.
Other Revenues. The city’s nontax revenues—a variety of fees, fines, charges, asset sales, interest income, and other miscellaneous revenue—are expected to total $7.0 billion this year, a drop of $977 million from 2017. Much of the decline is due to a reduction of $588 million in OMB’s reserve for the disallowance of grants. The funds freed up from the reserve were recorded as part of other city revenues in 2017; no similarly sized adjustment is anticipated in 2018 through 2021. The $168 million reduction in the state’s STAR aid for this year, which exactly offsets the increase in city revenue that results from the latest change in the way the state’s STAR personal income tax benefit is delivered to taxpayers, accounts for much of the remainder of the change in other revenues this year. The Mayor’s November financial plan anticipates little additional change in the total from these revenue sources for 2019 and beyond.
State, federal, and other categorical aid and interfund revenue are the remaining sources among nontax revenues. They are expected to total $24.1 billion this year, which includes $895 million in anticipated Hurricane Sandy assistance from the federal government. The bulk of that money has been allocated through the federal government’s Community Development Block Grant process to help in the recovery and is scheduled to be spent this year. With most Sandy aid received by 2018, these revenue sources are projected to decline in the aggregate by $886 million in 2019. After 2019, state, federal, other categorical, and interfund revenues are forecast to resume growing, but at a very slow pace; annual growth is expected to average 1.4 percent in 2020 and 2021. By the last year of the financial plan, these grants are expected to total $24.6 billion.
Spending
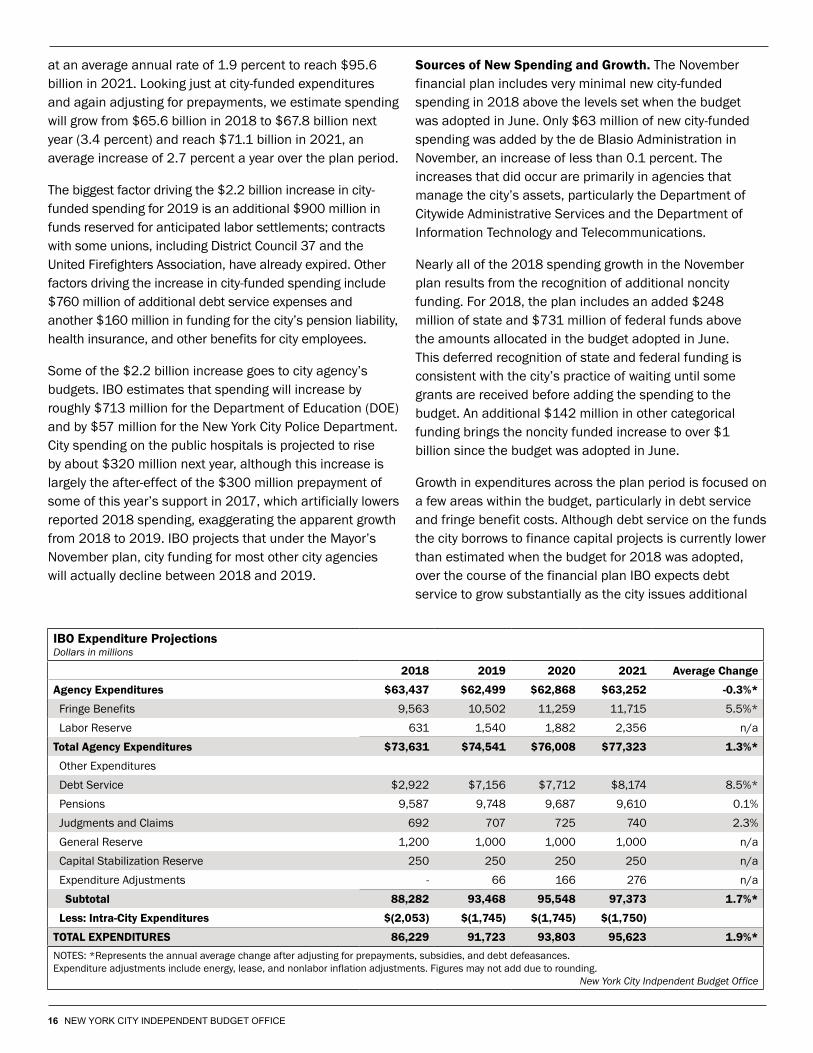
IBO estimates that under the policies and programs articulated in the Mayor’s latest financial plan, total city spending, including state and federal grant-funded programs, will grow from $86.2 billion this fiscal year to $91.7 billion next year. Adjusting this year’s expenditures for the prepayment of expenses with prior year resources, IBO estimates 1.1 percent growth in spending in 2019. Similarly, after adjusting for prepayments, we project that total spending over the financial plan period will increase
at an average annual rate of 1.9 percent to reach $95.6 billion in 2021. Looking just at city-funded expenditures and again adjusting for prepayments, we estimate spending will grow from $65.6 billion in 2018 to $67.8 billion next year (3.4 percent) and reach $71.1 billion in 2021, an average increase of 2.7 percent a year over the plan period.
The biggest factor driving the $2.2 billion increase in city-funded spending for 2019 is an additional $900 million in funds reserved for anticipated labor settlements; contracts with some unions, including District Council 37 and the United Firefighters Association, have already expired. Other factors driving the increase in city-funded spending include $760 million of additional debt service expenses and another $160 million in funding for the city’s pension liability, health insurance, and other benefits for city employees.
Some of the $2.2 billion increase goes to city agency’s budgets. IBO estimates that spending will increase by roughly $713 million for the Department of Education (DOE) and by $57 million for the New York City Police Department. City spending on the public hospitals is projected to rise by about $320 million next year, although this increase is largely the after-effect of the $300 million prepayment of some of this year’s support in 2017, which artificially lowers reported 2018 spending, exaggerating the apparent growth from 2018 to 2019. IBO projects that under the Mayor’s November plan, city funding for most other city agencies will actually decline between 2018 and 2019.
Sources of New Spending and Growth. The November financial plan includes very minimal new city-funded spending in 2018 above the levels set when the budget was adopted in June. Only $63 million of new city-funded spending was added by the de Blasio Administration in November, an increase of less than 0.1 percent. The increases that did occur are primarily in agencies that manage the city’s assets, particularly the Department of Citywide Administrative Services and the Department of Information Technology and Telecommunications.
Nearly all of the 2018 spending growth in the November plan results from the recognition of additional noncity funding. For 2018, the plan includes an added $248 million of state and $731 million of federal funds above the amounts allocated in the budget adopted in June. This deferred recognition of state and federal funding is consistent with the city’s practice of waiting until some grants are received before adding the spending to the budget. An additional $142 million in other categorical funding brings the noncity funded increase to over $1 billion since the budget was adopted in June.
Growth in expenditures across the plan period is focused on a few areas within the budget, particularly in debt service and fringe benefit costs. Although debt service on the funds the city borrows to finance capital projects is currently lower than estimated when the budget for 2018 was adopted, over the course of the financial plan IBO expects debt service to grow substantially as the city issues additional
TOTAL EXPENDITURES 86,229 91,723 93,803 95,623 1.9%*NOTES: *Represents the annual average change after adjusting for prepayments, subsidies, and debt defeasances.Expenditure adjustments include energy, lease, and nonlabor inflation adjustments. Figures may not add due to rounding.
Debt Service $99 - - - Fringe Benefits:Health Insurance - Education - 57 116 216 Health Insurance - City University - 2 5 9 Health Insurance - All Other Agencies - 97 193 347
TOTAL IBO PRICING DIFFERENCES $1,027 $555 $899 $1,440
IBO Prepayment Adjustment 2018/2019 (1,027) 1,027 - - IBO SURPLUS/(GAP) PROJECTIONS - (1,596) (1,374) (176)NOTES: Negative pricing differences (in parentheses) widen the gaps, while positive pricing differences narrow the gaps. Remaining banking corporation tax revenues reported with general corporation tax. Figures may not add due to rounding.
debt to finance its capital programs. In both absolute dollars and percent growth, debt service is the primary cost driver of increased expenditures over the plan period. After adjustment for prepayments, interest and principal payments are projected to grow at an average annual rate of 8.5 percent, from $6.4 billion this year to $8.2 billion in 2021, an increase of $1.8 billion.
The cost of providing fringe benefits for city employees and retirees, including health care costs, grows by nearly as much as debt service over the plan period. From 2018 through 2021 these costs are estimated to swell from just under $10.0 billion in the current year to over $11.7 billion by 2021, an annual growth rate of 5.5 percent.
Growth of pension costs, which are often cited as a primary driver of expenditure growth, is essentially flat throughout the 2018-2021 plan period. Because of the recent bull market on Wall Street, the city’s municipal pension investment portfolio has continued to outperform its assumed 7.0 percent rate of return. While weaker pension investment returns from prior years had forced the city to contribute an additional $120 million for 2018 in last November’s financial plan, more recent returns have enabled the city to reduce its contribution in fiscal year 2019 by an equivalent amount. The 2017 November plan reduces the city’s 2021 pension contribution by nearly $400 million. These changes lower the annual growth rate of the city’s planned pension contributions to less than 0.1 percent over the plan period as compared with 2.5 percent at this time last year.
Spending Re-estimates: Higher & Lower. IBO’s estimates of certain elements of city-funded expenditures differ from the numbers presented by the Mayor in the November plan, with some elements higher and others lower. Overall, we estimate city-funded spending will be about $166 million greater this year than projected by the Mayor and $247 million higher in 2019.
Based on IBO’s re-estimates, the Mayor’s plan over-states city-funded expenses in four major areas: debt service, health insurance, public assistance, and sanitation. While the de Blasio Administration reduced its forecast for 2018 debt service costs by $38 million in the November plan, we estimate debt service costs in the current year are still overstated by $99 million in the Mayor’s revised projections. Although OMB’s 2018 variable rate bond interest assumptions are currently 3.44 percent for tax-exempt bonds and 6.0 percent for taxable bonds, these rates remain well above current levels. IBO’s projections
of savings are based upon conservative estimates of current year variable interest rates using historical data and forecasts from financial institutions
IBO estimates that another of the major drivers of city spending—the cost of providing health insurance for city employees and retirees—is also overstated in the financial plan. While also foreseeing increases in these costs, IBO estimates the growth in spending on health insurance by the city will not be as steep as the de Blasio Administration estimates. Based on an analysis of historical growth rates and using the federal government’s estimates of growth in health care costs, we project that city spending on health insurance will be lower than presented in the November plan by $156 million in 2019, $313 million in 2020, and $572 million in 2021.
We also expect that city-funded spending on cash assistance for the poor will be lower than projected by the de Blasio Administration. The Mayor’s estimates rely on caseload data from April 2016, when caseloads were on the rise, for its November 2017 projections. Caseloads have actually leveled off and declined somewhat from the levels seen in 2016. IBO’s estimate is based upon the more recent data. As a result we estimate that cash assistance expenses in 2018 will be $18 million lower than projected in the November plan. For 2019 through 2021 we assume a flattening of the growth in caseloads and estimate a $12 million annual reduction in city-funded spending on cash assistance for the poor.
IBO estimates that the Department of Sanitation’s (DSNY) financial plan overstates city-funded expenditures by $55 million in the current year, $42 million in 2019, $45 million in 2020, and $36 million in 2021. A portion of this savings comes from IBO’s forecast of lower expenditures for the closure of the Fresh Kills landfill. Over the last few years DSNY has consistently over-budgeted for costs associated with the closure of the Fresh Kills landfill. The current plan includes approximately $71 million annually in 2018 through 2020 and $62 million in 2021 for these costs. IBO expects that DSNY spending from 2018 through 2021 will more closely mirror the actual expenditures for the last six years. The remainder of the savings is expected to accrue from reductions in planned expenditures in personal services for the department’s Bureau of Cleaning and Collection. Based on actual spending in recent fiscal years, IBO estimates that DSNY has over-budgeted for these expenses.
While IBO identifies some items in the financial plan where the de Blasio Administration has over-estimated spending,
these are more than offset by underestimates of city-funded expenditures in other parts of the plan. We estimate additional expenditures in three primary areas: the provision of shelter for homeless individuals and families, charter school funding, and uniformed overtime.
The cost of homeless services presents the most notable difference; IBO estimates an additional need of $142 million in the current year rising to $207 million by 2021. The primary factor behind our re-estimate of these costs is our projection of increases in the number of single adults and adult families in the shelter system. While the de Blasio Administration has anticipated some increase in the shelter census for these two groups, its growth estimates are not in line with recent historical data. IBO estimates that shelter usage by single adults will cost the city an additional $98 million in 2018, growing to $158 million by 2021. For adult family shelters, IBO estimates the city will spend $8 million more in 2018, $6 million more in 2019, and $5 million more in each of the remaining years of the financial plan. Although IBO’s estimates of the cost of providing shelter for families with children are in line with those of the de Blasio Administration, we expect less funding to be available from the federal government for these shelter costs. In order to make up for the shortfall in federal funding IBO estimates the city will need to provide an additional $36 million in the current year and $43 million in each of the next three years for the cost of shelter for families with children.
IBO has also re-estimated the Department of Education’s expenditure of city funds for the current year by an additional $35 million, an amount that grows to nearly $113 million by 2021. These additional costs are the result of the de Blasio Administration’s decision to postpone adding funds for the planned expansion of grades by existing charter schools until later in the budget process. IBO estimates that the de Blasio Administration continues to under-estimate enrollment in city charter schools—much as the Bloomberg Administration did—by about 2,400 students in the current year growing to nearly 7,500 students by 2021.
In recent years IBO has questioned DOE’s ability to achieve its planned goals for reimbursement of Medicaid-eligible expenses. By the close of the last fiscal year DOE had submitted claims for approximately $40 million in Medicaid reimbursements and assumed receipt of the funds, marking the first time in years that the department met its budget target. DOE’s estimate for Medicaid reimbursement in 2018 is twice as much as last year’s. While IBO has not incorporated a re-estimate of this element of the DOE
budget in its projected spending totals, the department’s track record for processing Medicaid reimbursement claims has been poor, and there is reason for caution in assuming that the DOE will meet the more ambitious targets in the financial plan.
As in past years, we expect overtime costs for the police, fire, and correction departments will be higher than estimated in the Mayor’s plan. Based upon past patterns, we anticipate that overtime costs for the three agencies will together be $125 million more than budgeted for each year of the financial plan period.
Pressure Points. While the Mayor’s financial plan includes only a relatively small $63.4 million (less than 0.1 percent) increase in city-funded expenditures—considerably less than the savings for 2018 identified in the plan—it may be increasingly difficult to maintain that prudence next fiscal year and the years beyond. And given the tax and budget changes that may be enacted in Washington and the budget shortfalls projected in Albany, it may become increasingly difficult for the city to maintain its current spending patterns.
Perhaps the most immediate threat to balancing the city’s budget is the impending cost of settling contracts with the city’s municipal labor unions. Currently, over 100,000 full-time city employees, approximately 33 percent of the city’s full-time workforce, are working under the terms of expired contracts, including the city’s largest union, District Council 37. By the end of calendar year 2018 contracts covering nearly 90 percent of the city’s full-time workforce will have expired, including the contract for the United Federation of Teachers.
The de Blasio Administration has set aside $631 million in the current fiscal year increasing to $2.4 billion by 2021 to cover the costs of potential labor settlements. IBO estimates that for each 1 percent increase in annual wages the city would spend an additional $121 million in the current fiscal year and slightly over $1.1 billion in 2021. The de Blasio Administration has taken the position that it is willing to be flexible on the extent of future wage increases only if the unions are willing to pay for them with givebacks that would reduce city expenditures. After giving back over $1.4 billion in concessions over the last four years for health care savings through increases in co-pays, higher premiums, and eligibility audits, in order to secure wage increases during the previous round of contract negotiations, the city’s labor unions may be galvanized in their efforts to seek greater wage increases with fewer
givebacks in the coming negotiations.4 The Patrolman’s Benevolent Association, representing some 23,000 full-time police officers, has already rejected the city’s contract offers and requested that all negotiations be handled through binding arbitration.
Other budget concerns revolve around the potential for substantial losses in revenue due to Washington and Albany. A prime example is the sweeping changes in federal tax policy, which are about to be ebnacted as this is written. The tax bill could have far reaching consequences for the city’s economic and revenue outlook. Neither IBO nor the Mayor’s Office of Management and Budget have accounted for any of the potential repercussions from these changes in their current economic and tax forecasts. The Mayor’s office has released an estimate that 800,000 out of the 3.2 million city income tax returns would see an increase in federal income tax under earlier versions of the bill. The loss of at least some state and local tax deductions will raise federal taxes for many New York City residents who are currently able to deduct all of those state and local taxes—which in New York are quite high—when calculating their federal tax. Losing some the deduction will increase the ‘cost’ of city income and property taxes, making it harder to attract and retain city residents and workers or to pursue policies that would raise city (or state) taxes. Curtailing the deduction for property taxes will also put downward pressure on home prices by raising the cost of ownership, as will the likely reduction in the amount of mortgage interest that can be deducted.
The legislation also includes significant changes on the corporate side. Many city businesses will likely benefit from the lower corporate rate. The additional profits and incentives for capital investment in current versions of the legislation may spur firms to invest and expand, creating new jobs and output in the city. But the bill also contains provisions that would flow through into city definitions of business income that reduce the basis for the city’s own business income tax. Avoiding such a scenario would require legislation in Albany to “decouple” definitions in the city’s tax system from those in the federal tax code.
While potential changes to federal tax policy will likely have a long-term effect on the city’s fiscal well-being, the effects of a Trump Administration budget could have much more immediate effects on the city’s financial plan. The President’s budget proposal, submitted to Congress in March but not yet adopted, would reduce federal funding of critical services at many city agencies. The Trump budget would reduce hundreds of millions of dollars of funding to
the two agencies, Housing Preservation and Development and the New York City Housing Authority, that are critical in providing safe and affordable housing for many low- and middle-income New Yorkers. In addition, the elimination of funding for the Community Development Block Grant program would cut funding to over 20 city agencies that provide a wide variety of services in low-income neighborhoods throughout the city. The city’s Health + Hospitals, the only critical care option for many low-income New Yorkers, stands to lose hundreds of millions of dollars of operating funds under President Trump’s budget proposals. Already struggling to stay economically viable, a loss of such magnitude could permanently cripple the city’s public hospitals.
Additional pressure on city spending could come from Albany. Through the first six months of the state’s current fiscal year, tax collections were down by $387 million from the projected totals and $768 million below last year. According to Governor Cuomo, there is a $4.1 billion shortfall in the budget for the fiscal year beginning April 1st and a recent report by State Comptroller DiNapoli estimated that the gap could eventually be more than double that level. The city’s financial plan relies on nearly $15 billion in funding from the state for the upcoming fiscal year, some of which could be in jeopardy depending on how the state brings its own budget into balance.
In Reserve. The de Blasio Administration continues to set aside record amounts of funds in reserve to help the city weather any sharp drops in revenue or the need for unexpected spending. The current financial plan for 2018 includes $1.45 billion in reserve funds: dollars budgeted as expenses but not attached to any specific need. If the funds go unused, as they have in the Mayor’s prior budget plans, they then become part of the surplus and would be used to offset the shortfall projected for 2019. The financial plan also contains a reserve of $1.25 billion in each year from 2019 through 2021.
In addition to these budgeted reserves, the de Blasio Administration has put aside more than $4 billion in the Retiree Health Benefits Trust, including $100 million added in 2017. No new funding is budgeted for the trust this year. While funds in the trust can only be used to pay all or part of the cost of retiree benefits in a given year, that is a sizable sum—$2.4 billion in 2018 and $2.5 billion in 2019. Retiree health costs paid with funds from the trust free up an equal amount of city funds in the budget for other needs.
The current financial plan is the last financial plan
presented during the first term of the de Blasio Administration. The ensuing plan to be released in January marks the start of the Mayor’s second term as well as the inauguration of a new City Council and a new Speaker. Both the Mayor and the new Speaker will likely want to start their terms setting ambitious goals for the city. Already the Mayor has begun to put forward his plan to expand the city’s commitment to the development of affordable housing units. But the tax bill in Washington could make the plan more expensive as low-income tax credits lose some of their benefit.
The Mayor’s goals may also be tempered by the fiscal realities in both Washington and Albany. The state and federal governments are more likely to be reducing their commitments to municipal governments than to be a source of funds for expanding city initiatives. Moreover, with state and local tax deductibility curtailed it will be that much harder to raise local taxes to fund new initiatives. This may force the city to look for spending reductions elsewhere in its own budget in order to finance new priorities.
Endnotes1For fiscal years 2018 through 2021 the OMB reserve forecasts include the costs of the changes to the veterans, senior citizens, and disabled exemptions. Beginning in fiscal year 2019, it is expected that the costs of these changes would be shifted from the reserve to the levy. For this forecast, IBO has followed OMB’s presentation as it has no effect on the total property tax revenue forecast. 2For additional information about these changes and other exemptions, see the Benefits for Property Owners section of the Department of Finance website.3Last year the per-filer city PIT credit provided by STAR was eliminated and converted into an equal credit for city residents against the state income tax. Note that the additional PIT revenue the city will receive this year will not increase total city revenue, because state reimbursement for what would have been lost city PIT collections is also ending.4Total savings as reported by the city’s Office of Labor Relations is $3.4 billion over four years. The additional $2 billion of savings is $1.6 billion on HIP rate savings and $350 million of Senior Care Plan savings resulting from the city’s overestimate of annual health care rate increases.
Receive notification of IBO’s free reports by e-mail