April 2015 SDN/15/06 I M F S T A F F D I S C U S S I O N N O T E Fiscal Policy in Latin America: Lessons and Legacies of the Global Financial Crisis Oya Celasun, Francesco Grigoli, Keiko Honjo, Javier Kapsoli, Alexander Klemm, Bogdan Lissovolik, Jan Luksic, Marialuz Moreno-Badia, Joana Pereira, Marcos Poplawski-Ribeiro, Baoping Shang, and Yulia Ustyugova
Transcript
April 2015 SD
N/15/06
I M F S T A F F D I S C U S S I O N N O T E
Fiscal Policy in Latin America: Lessons and Legacies of the Global
Financial Crisis
Oya Celasun, Francesco Grigoli, Keiko Honjo, Javier Kapsoli, Alexander Klemm, Bogdan Lissovolik, Jan
Fiscal Policy in Latin America: Lessons and Legacies of the Global Financial Crisis Prepared by Oya Celasun, Francesco Grigoli, Keiko Honjo, Javier Kapsoli, Alexander Klemm, Bogdan
Lissovolik, Jan Luksic, Marialuz Moreno-Badia, Joana Pereira, Marcos Poplawski-Ribeiro, Baoping Shang, and Yulia Ustyugova1
Authorized for distribution by Nigel Chalk and Gilbert Terrier
DISCLAIMER: Staff Discussion Notes (SDNs) showcase policy-related analysis and research being developed by IMF staff members and are published to elicit comments and to encourage debate. The views expressed in Staff Discussion Notes are those of the author(s) and do not necessarily represent the views of the IMF, its Executive Board, or IMF management.
1 The paper was prepared by a staff team led by Oya Celasun and Marialuz Moreno-Badia under the guidance of Nigel Chalk and Gilbert Terrier. It has benefited from suggestions by Alejandro Werner and Vitor Gaspar. The authors thank participants at a seminar on April 23rd, 2015 at the Wilson Center and the discussants James Mahon and Carlos Vegh for very useful comments. Extensive data inputs and comments by the IMF country teams for Brazil, Chile, Colombia, Mexico, Peru, and Uruguay are also gratefully acknowledged. Jan Luksic was a summer intern at the IMF’s Western Hemisphere Department when the paper was prepared.
REFERENCES _____________________________________________________________________________________ 34 BOXES 1. Evidence of Reduced Fiscal Policy Procyclicality in Latin America _____________________________ 14
2. Brazil: Fiscal Framework in the Aftermath of the Crisis ________________________________________ 28 FIGURES 1. LA6: Change in the Fiscal Balances in 2003–07 __________________________________________________ 9
2. LA6: Balance Sheets in the Run Up to the Crisis _______________________________________________ 10
3. LA6: Fiscal Impulse and Announced Discretionary Stimulus in 2009 __________________________ 10
4. LA6: Impact of Fiscal Stimulus on Output, 2009 _______________________________________________ 11
5. Real GDP Developments _______________________________________________________________________ 11
6. LA6: Cyclicality Coefficients from a Panel Regression __________________________________________ 12
7. LA6: A Year-by-Year Look at Cyclicality of Fiscal Policy ________________________________________ 13
8. LA6: Change in the Fiscal Balances from 2007 to 2014 ________________________________________ 13
9. LA6: Public Debt and Output Variability _______________________________________________________ 15
10. LA6: Primary Government Expenditure _______________________________________________________ 16
11. LA6: Current Expenditure vs. Capital Expenditure, Changes in 2007-09 vs. 2007-13 _________ 17
FISCAL POLICY IN LATIN AMERICA
4 INTERNATIONAL MONETARY FUND
12. LA6: Selected Drivers of the Change in the Public Expenditure-to-GDP Ratio in 2007-12 ___ 17
13. LA6: Social and Capital Spending, 2012 ______________________________________________________ 18
4. LA6: Numerical Fiscal Frameworks and Other Fiscal Institutions, 2013 ________________________ 25
5. LA6: Relaxation of Fiscal Frameworks __________________________________________________________ 27
FISCAL POLICY IN LATIN AMERICA
INTERNATIONAL MONETARY FUND 5
EXECUTIVE SUMMARY Latin America’s bold fiscal response to the global financial crisis was hailed as a sign that the region had finally overcome the procyclical fiscal policies of the past. Today, more than six years later, most countries in the region have not fully rebuilt their fiscal space despite of the recent era of buoyant commodity revenues and strong growth. This Staff Discussion Note aims to draw lessons from the region’s fiscal policy experience during the crisis and its aftermath. It focuses on the six larger, financially-integrated emerging market economies of Latin America (LA6)—Brazil, Chile, Colombia, Mexico, Peru, and Uruguay—which account for more than 70 percent of the region’s GDP. The 2009 fiscal stimulus was useful in containing output losses in LA6 countries. However, the easing was, for most countries, not followed by a commensurate fiscal normalization. This pattern underlines the risks associated with undertaking large discretionary policy changes without a medium-term anchor or an exit plan. The end-result has been a permanent increase in current spending and has proved hard to reverse as growth recovered. A more insidious legacy of the crisis has been in the form of heightened fiscal risks and some erosion of fiscal institutional frameworks. Rebuilding fiscal buffers should be one of the main priorities going forward. The desired size, pace, and timing of the fiscal adjustment will vary across countries depending on debt dynamics, fiscal risks, the macroeconomic outlook, and market conditions. In some cases, the existing space still allows for the use of fiscal policy to counter negative shocks in the near term. In others, a quicker shift to consolidation will be needed even in cases where economic growth remains disappointing and below potential. Fortunately, some of this adjustment is already underway but more needs to be done. Particular attention should be paid to raising the efficiency of public spending in the LA6 countries which will allow governments to improve the quality of public goods and services while containing spending growth.
On the institutional front, reforms need to go beyond a simple restoration of the pre-crisis fiscal frameworks. The goal should be to build in features that avoid procyclicality, ensure a more symmetric response to both downturns and expansions, and to incorporate well-defined escape clauses. Stronger adherence to such rules is needed that meets not only the letter but also the spirit of the underlying fiscal policy frameworks. Finally, the multi-year consequences of budget decisions taken today should be given more prominence in the public policy debate.
INTERNATIONAL MONETARY FUND 6
INTRODUCTION Background. Latin America’s bold fiscal policy reaction to the 2008–09 global financial crisis was hailed as a sign that the region had finally overcome its procyclical fiscal past. Many countries in the region entered the crisis with historically large fiscal buffers, enabling them to counter the adverse impact of the global financial crisis with a quick shift to a growth-supportive fiscal expansion.
The legacies of the crisis. More than six years later, most of the region has not rebuilt its fiscal space. Cyclically adjusted fiscal balances are well below pre-crisis levels, even with the benefits of buoyant commodity revenues and strong growth in the years following the crisis. This is now becoming a pressing concern, as the commodity cycle turns and global growth weakens. In some cases, policymakers are now becoming constrained in their ability to mount a countervailing fiscal response in the face of an adverse growth shock. Some are even being pushed toward a procyclical fiscal tightening. A more insidious legacy of the crisis has taken the form of heightened fiscal risks and an erosion of institutional fiscal frameworks.
A time to take stock. With the dust of the crisis now settling, this paper aims to take stock of the region’s fiscal policy experience during the crisis and its aftermath. The goal is to derive lessons—good and bad—and highlight what this means for policy priorities ahead. The analysis focuses on the six larger, financially-integrated emerging market economies of Latin America (LA6)—Brazil, Chile, Colombia, Mexico, Peru, and Uruguay—which account for more than 70 percent of the region’s GDP. All of these countries are now confronting an end to the commodity cycle and the imminent reversal of exceptionally accommodative monetary conditions in the U.S. Room for fiscal maneuver, and the valuable insurance that it provides, has rarely been at such a premium.
Questions this paper tackles. The paper provides an overview of how fiscal policy in the LA6 countries evolved in the years before, during, and after the crisis, including in terms of cyclicality. It then turns to a set of central policy questions facing the region:
Impact. How was the fiscal stimulus undertaken and what was the impact on output?
Legacies. Did fiscal policy in the LA6 turn procyclical? How large was the increase in spending and what were the drivers? How much have fiscal buffers been eroded and what was the impact on the resilience of public finances in the face of potential shocks? How did the crisis-response affect fiscal policy frameworks and what shortcomings were revealed in the fiscal institutions?
Looking forward. How much do buffers need to be rebuilt? How much can reasonably be achieved simply by increasing spending efficiency? What institutional reforms are now needed to provide enduring anchors for fiscal policy?
INTERNATIONAL MONETARY FUND 7
The main findings of the analysis are as follows:
In most countries, fiscal policy was unambiguously expansionary in 2009. Calculations based on ranges of multipliers suggest that output in 2009 would have been ¾ to 2 percent lower in the absence of such fiscal easing. This highlights the importance of the proactive response of policymakers in the region and the efforts that were made in the decade prior to the crisis to build fiscal space.
Much of the fiscal easing during the crisis came from an upward shift in current expenditures. On average about two-thirds of the 4 percentage points of GDP increase in spending were in current outlays, making it harder to reverse as growth recovered.
The easing in response to the crisis of 2008–09 was generally not followed by a fiscal withdrawal of equal magnitude, except in Chile. There is some evidence, though, that intended policies were more countercyclical than outcomes in some cases as post-crisis growth surprised to the upside.
If the region had maintained a countercyclical stance and tightened fiscal policy during 2010–14, public debt dynamics would have been more favorable on the eve of the emerging market growth slowdown. In addition, in most cases, output variability would have been lower.
To varying degrees, there was an erosion of fiscal policy institutions following the crisis, although repair is currently underway in most countries.
Fiscal space, which is set to come under pressure over the medium term from demographics and increasing demands for public services, has been diminished by the incomplete reversal of the crisis response. Debt levels, though, mostly appear manageable.
Where to next?
Fiscal buffers need to be strengthened across the LA6, although the desired size, pace, and timing of the adjustment vary across countries.
Chile and Peru broadly appeared to have followed a path of policy smoothing and, thus, have retained significant space to react in case of future shocks (although part of this space is being eroded by the decline in commodity prices).
In Colombia, fiscal policy was mostly acyclical after the crisis. The public sector has fiscal space, but caution should be exercised in deploying it given the potential for sustained low commodity revenue.
FISCAL POLICY IN LATIN AMERICA
8 INTERNATIONAL MONETARY FUND
Brazil and Uruguay have eroded their fiscal position to a point where, in the coming years, they may have to tighten policies while economic growth is below potential. Mexico has reversed a part of its crisis-related fiscal easing, but its deficit needs to be lowered further to stabilize the public debt.
Reforms need to go beyond a simple restoration of the pre-crisis fiscal frameworks. The new institutional set-up should build in features to distinguish temporary from permanent revenues, avoid procyclicality, ensure a more symmetric response to downturns and expansions, and incorporate well-defined escape clauses. In addition, the multi-year consequences of budget decisions should be given more prominence within the institutional structure and in the public policy debate. Expansions of lasting expenditure commitments (e.g. through higher wages or new social programs) that are not funded by revenue increases should be taken on cautiously, if at all.
Stronger adherence to the policy rules is needed to build credibility. This involves avoiding creative accounting changes or the use of one-off revenues to meet the letter (but not the spirit) of the fiscal policy framework. Loopholes that allow for off-budget, quasifiscal activities are damaging to credibility and should be closed.
Raising the efficiency of public spending would support the continued provision of public good and services while stemming spending growth. This will require a range of micro-level reforms that vary greatly across countries.
THE FISCAL POLICY REACTION TO THE CRISIS The global financial crisis marked the first major external shock that LA6 countries were able to counter with a concerted fiscal policy response. Buffers accumulated during the previous decade—in the context of strong growth and commodity prices—allowed for a significant fiscal policy easing.
1. In the years between the early 2000s and the collapse of Lehman Brothers, Latin America enjoyed its strongest economic performance and fiscal health at least since the 1970s. This positive shift was supported by a host of domestic structural and institutional reforms undertaken in the late 1990s and early 2000s, as well as a favorable external environment. Much of the fiscal improvement, however, was due to strong growth and commodity prices rather than tighter fiscal policy (Figure 1).2 3
2 Resource revenues constitute an important source of revenues in Brazil, Chile, Colombia, Mexico and Peru. In 2013, their contribution to total revenues ranged from 6 percent in Brazil to 20 percent in Mexico. 3 Izquierdo and Talvi (2008) estimated the cyclically adjusted fiscal balance for the part of the commodity boom through 2007 and pointed to a fiscal policy loosening.
INTERNATIONAL MONETARY FUND 9
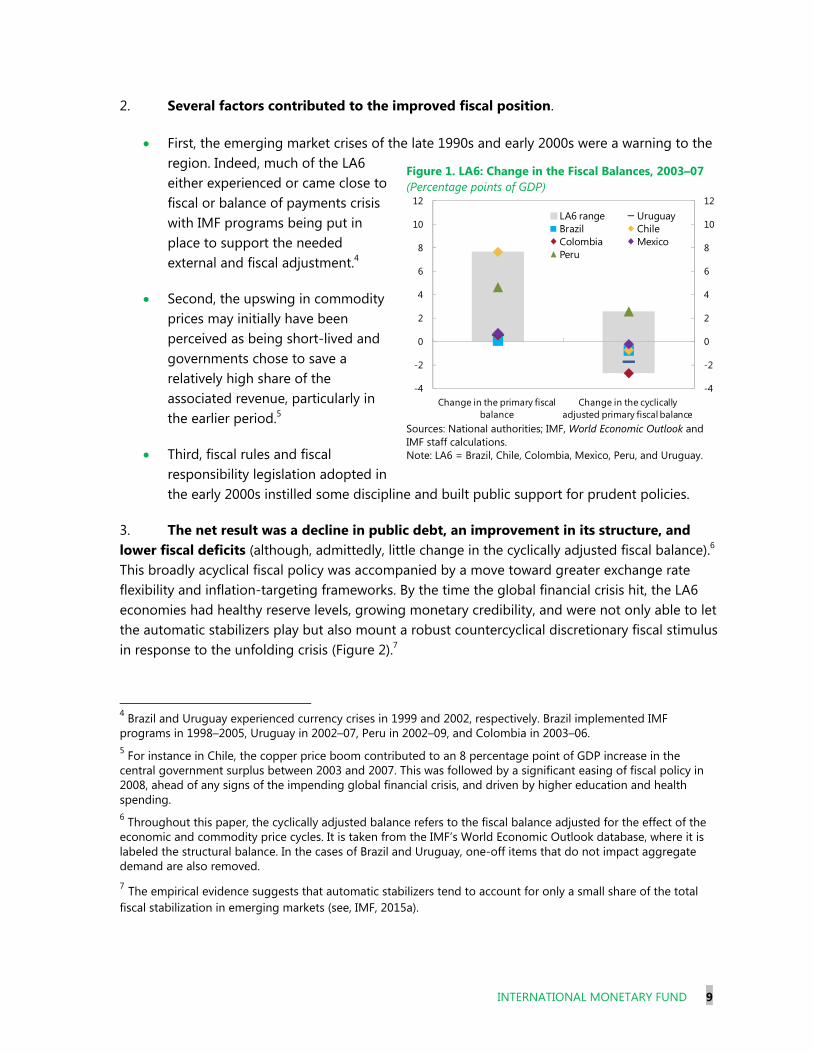
2. Several factors contributed to the improved fiscal position.
First, the emerging market crises of the late 1990s and early 2000s were a warning to the region. Indeed, much of the LA6 either experienced or came close to fiscal or balance of payments crisis with IMF programs being put in place to support the needed external and fiscal adjustment.4
Second, the upswing in commodity prices may initially have been perceived as being short-lived and governments chose to save a relatively high share of the associated revenue, particularly in the earlier period.5
Third, fiscal rules and fiscal responsibility legislation adopted in the early 2000s instilled some discipline and built public support for prudent policies.
3. The net result was a decline in public debt, an improvement in its structure, and lower fiscal deficits (although, admittedly, little change in the cyclically adjusted fiscal balance).6 This broadly acyclical fiscal policy was accompanied by a move toward greater exchange rate flexibility and inflation-targeting frameworks. By the time the global financial crisis hit, the LA6 economies had healthy reserve levels, growing monetary credibility, and were not only able to let the automatic stabilizers play but also mount a robust countercyclical discretionary fiscal stimulus in response to the unfolding crisis (Figure 2).7
4 Brazil and Uruguay experienced currency crises in 1999 and 2002, respectively. Brazil implemented IMF programs in 1998–2005, Uruguay in 2002–07, Peru in 2002–09, and Colombia in 2003–06. 5 For instance in Chile, the copper price boom contributed to an 8 percentage point of GDP increase in the central government surplus between 2003 and 2007. This was followed by a significant easing of fiscal policy in 2008, ahead of any signs of the impending global financial crisis, and driven by higher education and health spending. 6 Throughout this paper, the cyclically adjusted balance refers to the fiscal balance adjusted for the effect of the economic and commodity price cycles. It is taken from the IMF’s World Economic Outlook database, where it is labeled the structural balance. In the cases of Brazil and Uruguay, one-off items that do not impact aggregate demand are also removed. 7 The empirical evidence suggests that automatic stabilizers tend to account for only a small share of the total fiscal stabilization in emerging markets (see, IMF, 2015a).
Figure 1. LA6: Change in the Fiscal Balances, 2003–07 (Percentage points of GDP)
Sources: National authorities; IMF, World Economic Outlook and IMF staff calculations. Note: LA6 = Brazil, Chile, Colombia, Mexico, Peru, and Uruguay.
-4
-2
0
2
4
6
8
10
12
-4
-2
0
2
4
6
8
10
12
Change in the primary fiscal balance
Change in the cyclically adjusted primary fiscal balance
LA6 range UruguayBrazil ChileColombia MexicoPeru
FISCAL POLICY IN LATIN AMERICA
10 INTERNATIONAL MONETARY FUND
4. This rapid shift to fiscal expansion marked a break from the region’s history where it repeatedly had to tighten fiscal policy in response to adverse external shocks. In most countries, fiscal policy was unambiguously expansionary in 2009 (Figure 3).8 Brazil, Chile, Mexico, and Peru announced discretionary stimulus packages, ranging from about 1½ to 3¼ percent of GDP (see the Technical Appendix, section I, for the composition of the packages). In line with the experience in other countries (IMF 2013a), these packages were largely designed to be temporary in nature and included public investment programs (Chile, Mexico, and Peru), targeted transfers to protect the vulnerable (Brazil, Chile and Mexico), tax relief (Brazil and Chile), and lending to the state-owned development bank (Brazil) to provide funding for the private sector. In virtually all cases there was a sizable increase in public sector spending.
5. This fiscal policy easing helped dampen output losses in the LA6. Simulations based on the IMF’s Flexible System of Global Models (FSGM) suggest that, in the absence of fiscal stimulus, output levels in 2009 would have been 1½ to 2 percent below the actual outturns (for
8 IMF surveillance at the time noted that a countercyclical fiscal policy can be desirable to mitigate the threat of a prolonged slowdown as long as fiscal room is available, and current and prospective financing conditions do not pose risks (IMF, 2009a).
Figure 2. LA6: Balance Sheets in the Run–Up to the Crisis
Source: IMF, World Economic Outlook. Note: LA6 = Brazil, Chile, Colombia, Mexico, Peru, and Uruguay.
Figure 3. LA6: Fiscal Impulse and Announced Discretionary Stimulus in 20091/ (Percentage points of GDP)
Sources: National authorities; Organisation of Economic Co-operation and Development; IMF, World Economic Outlook; and IMF staff calculations. 1/ Fiscal impulse is calculated as a change in the cyclically adjusted primary deficit.
0
30
60
90
120
2002 2007
Public Sector Debt (Percent of GDP)
LA6 Range
LA6 Average
0
30
60
90
120
2002 2007
Share of Public Debt in Foreign Currency (Percent)
0
15
30
45
2002 2007
Short-Term External Debt (Percent of GDP)
5
15
25
35
2002 2007
Gross International Reserves (Percent of GDP)
-1
0
1
2
3
4
Brazil Chile Colombia Mexico Peru Uruguay
Fiscal impulseAnnounced discretionary stimulus
INTERNATIONAL MONETARY FUND 11
more details, see the Technical Appendix, section II). Monetary policy accommodation helped amplify the impact of the fiscal loosening (Figure 4).9 The average fiscal multipliers implicit in the model are about 1 for public capital and consumption spending, and 0.5 for transfers and revenue measures. The multiplier for policy lending is assumed to be 0.5, based on IMF staff research. Calculations using econometric estimates of fiscal multipliers for emerging market economies yield somewhat lower estimates.10 The ranges of estimates highlight the insurance provided by having built up fiscal space in the preceding decade. Subsequently, output levels recovered relatively quickly in the LA6. By 2011, output had almost returned to pre-crisis trends, in sharp contrast to many of the other emerging market economies (Figure 5).
Figure 5. Real GDP Developments1/
(Index)
Source: IMF, World Economic Outlook. 1/ The lines show outturns and projections for real GDP from the April World Economic Outlook forecasts in 2008−14. The data for real GDP is normalized to 100 in year 2007. 9 All of the countries shown in the chart started easing their monetary policy interest rates in late 2008 as the crisis unfolded and kept them at low levels through the first half of 2010. The Uruguayan Central Bank raised its policy rate in early 2009 but also entered an easing cycle in the second half of the year. 10 An alternative exercise with multipliers in the range of 0.3−0.4, in line with Ilzetzki (2011), results in an estimated fiscal impact of ¾ to 1½ percent of output. Various empirical studies, however, suggest that fiscal multipliers vary with the state of the business cycle and are generally larger in downturns, when monetary policy is accommodative and fiscal space is high (see also Auerbach and Gorodnichenko (2012), and Baum, Poplawski-Ribeiro, and Weber (2012)).
90
100
110
120
130
140
150
160
170
2007
2008
2009
2010
2011
2012
2013
2014
2015
LA6
2008
2009
2011
2014
90
100
110
120
130
140
150
160
170
2007
2008
2009
2010
2011
2012
2013
2014
2015
Emerging and Developing Economies
90
100
110
120
130
140
150
160
170
2007
2008
2009
2010
2011
2012
2013
2014
2015
Advanced Economies
Figure 4. LA6: Impact of Fiscal Stimulus on Output, 2009 (Percent of actual GDP)
Source: IMF staff estimations. Note: The fiscal stimulus impact under average multipliers (yellow diamonds) assumes fiscal multipliers of 0.3 for spending, 0.4 for revenues, and 0.5 for policy lending. Uruguay is not included in the simulations as it did not ease fiscal policy in 2009.
0
1
2
3
4
Brazil Chile Colombia Mexico Peru
Imported fiscal stimulus (FSGM)
Amplification due to monetary policy accomodation (FSGM)
Domestic fiscal stimulus (FSGM)
Domestic fiscal stimulus (average multipliers)
FISCAL POLICY IN LATIN AMERICA
12 INTERNATIONAL MONETARY FUND
LEGACIES The window to withdraw fiscal stimulus was missed in most cases. This was partly due to the uncertainty prevailing at the time but also because of political difficulty in unwinding spending increases. The end result has been a decline of fiscal buffers to a point where some countries now have to undertake procyclical tightening in the coming years. A more insidious legacy of the crisis was the erosion of fiscal institutions.
A. An End to Fiscal Procyclicality?
6. Regression analysis suggests lessened procyclicality in the LA6 from 2008 onwards, both on average as well as on a country-by-country basis (Figure 6 and Box 1).11 In principle, the last five years, when the LA6 economies recovered quickly—as commodity prices rebounded and global interest rates were exceptionally low—provide a litmus test. Countries were not under market pressure to adjust (as in past times) and so the revealed path of policy provides a demonstration of the underlying commitment to fiscal discipline. The post crisis sample period (2010–14) is too short for reliable econometric estimates but, to provide an indication of the underlying tendencies, we plot the year-to-year changes in fiscal policy against the output gap for each country to examine the cyclicality of fiscal policy in the aftermath of the crisis (Figure 7). The results are instructive. Chile and, to a limited extent, Mexico consistently tightened their fiscal position in 2010–12 as output climbed back up toward and above potential (policy moved from south-west to north-east in Figure 7). Colombia’s fiscal policy was mostly acyclical (moving horizontally in Figure 7). On the other hand, Brazil’s fiscal policy was countercyclical during downturns (but not upturns) and Uruguay was clearly procyclical. This suggests that, for most of the region, the countercyclical stance identified in the regression analysis was driven by the stimulus in 2009 rather than the policy behavior in later years. There is one caveat, however. There is some evidence that the intention was to be more countercyclical and part of the delay of fiscal withdrawal was due to the expectations of a tepid recovery and perceived downside risks to growth at the time (see Box 1).
11 See also Frankel, Vegh, and Vuletin (2013), and Vegh and Vuletin (2014). While results at the regional level are relatively strong, regression results for individual countries in Latin America typically do not yield statistically significant confirmation of pro or countercyclical policy (Box 1).
Figure 6. LA6: Cyclicality Coefficients from a Panel Regression1/
Sources: IMF, World Economic Outlook; and IMF staff calculations. 1/ A negative coefficient implies procyclicality. Box 1 provides details on the regression.
-0.3
-0.2
0.2
-0.4
-0.2
0
0.2
0.4
1990-99 2000-07 2008-14
INTERNATIONAL MONETARY FUND 13
Figure 7. LA6: A Year-by-Year Look at Cyclicality of Fiscal Policy
7. In sum, policymakers for much of the LA6 missed the window to withdraw fiscal stimulus after the crisis. As a result, the region has experienced an enduring fiscal expansion for more than half a decade. By 2014, cyclically adjusted fiscal balances were, on average, 2¾ percentage points weaker than in 2007 (Figure 8). This experience is not unique to the LA6. Indeed, other small open commodity-exporting economies have reversed an even smaller share of their 2009 stimulus. However, the difference is that post-crisis growth in those countries has been considerably weaker than in the LA6.
Figure 8. LA6: Change in the Fiscal Balances from 2007-14 (Percentage points of GDP)
Source: IMF, World Economic Outlook. -16
-14
-12
-10
-8
-6
-4
-2
0
2
Brazil Chile Colombia Mexico Peru Uruguay
Change in the primary fiscal balance
Change in the cyclically adjusted primary fiscal balance
Change from 2007 to 2009
Change from 2007 to 2014
FISCAL POLICY IN LATIN AMERICA
14 INTERNATIONAL MONETARY FUND
Box 1. Evidence of Reduced Fiscal Policy Procyclicality in Latin America
To estimate the cyclicality of fiscal policy in Latin America since the mid-2000s, a standard regression specification is used, linking the fiscal stance—i.e., the change in the fiscal balance (∆ / )1—to the output gap
(∗
∗ ) for country i at year t (1990–2014). The regression
controls for commodity prices (P), the initial fiscal balance, and, in the panel regressions, country effects (f):
∆∗
∗
The coefficient is then an indicator of the cyclicality of fiscal policy, with a positive sign indicating countercyclical and a negative sign procyclical policy. To control for the endogeneity of the output gap an alternative specification using instrumental variables is also estimated.
The results suggest that policy behavior in LA6 has either been mostly acyclical or has switched between a pro and countercyclical stance. Controlling for differences across time shows that policy was, on average, procyclical in the LA6 before the crisis, although the degree of procyclicality diminished marginally after 2000. From 2008 onwards, there was a clearer reduction in procyclicality.
As it is typical in the literature, country-by-county regressions mostly yield statistically insignificant estimates of the coefficient on the output gap. However, estimated coefficients for the pre and post-2008 periods do indicate a movement toward more countercyclical policy in Colombia and Mexico, since the global financial crisis. These findings are in line with Frankel, Vegh, and Vuletin (2013), and Klemm (2014). Nevertheless, these results should be interpreted with caution as they may be driven by the outlier of fiscal stimulus and growth decline in 2009 rather than a lasting policy change.2 ____________________________________________
1 The approach developed in Klemm (2014) is followed to measure the fiscal stance, taking into account both discretionary fiscal policy and certain automatic stabilizers. Concretely, this measure is calculated by excluding from the fiscal balance any revenue from higher potential output but including additional revenue that stems from higher tax ratios. On the expenditure side, any deviation of the share of spending in potential GDP is counted, but not changes in the spending ratio that are simply due to deviations of GDP from potential. 2 If “vintage” output gap estimates are used—those ones that prevailed at the time the fiscal policy decisions were being made—three countries move toward more countercyclical policy: Brazil, Chile, and Mexico.
Table 2. Coefficients on the Output Gap from Country-by-Country Regressions
Table 1. LA6: Country Fixed Effect Regressions
Dependent Variable: ∆ Adjusted Primary Balance
(1) (2)
Adjusted balancet-1 -0.17*** -0.22***
(0.02) (0.02)Commodity price index 0.55*** 0.48***
Sources: IMF, World Economic Outlook ; and IMF staff calculations. Note: Robust standard errors in parentheses. Country fixed effects included. * p<0.1, ** p<0.05, *** p<0.01.
OLS IV-1 IV-2
pre-2008 ∆ since 2008
Brazil 0.38 -1.46 -0.32 0.60 -0.31(0.23) (2.31) (1.38) (0.50) (0.49)
Sources: IMF, World Economic Outlook ; and IMF staff calculations. Note: Robust standard errors in parentheses. OLS = ordinary least squares; IV-1 uses the lagged estimated output gap as an instrument; IV-2 the U.S. one-year Treasury bill and the export-weighted growth rate of trading partners. The coefficient on the estimated output gap is shown. All regressions also include a constant, the lagged adjusted primary balance, and the commodity price index.
∆ Adjusted Primary Balance
INTERNATIONAL MONETARY FUND 15
8. How much could a countercyclical fiscal stance have helped to recover fiscal space and stabilize output in the aftermath of the crisis?12 To shed some light on this issue, the IMF’s FSGM was used to examine the potential implications if a more countercyclical stance—in most cases associated with larger fiscal withdrawal—had been adopted in the recovery from the crisis (see Technical Appendix, section II for details). The answer depends on individual country circumstances (Figure 9).
In Brazil and Uruguay, more countercyclical fiscal policy during the post-crisis rebound would not only have been able to reduce the variability of output, but it would also have saved 4 and 9 percentage points of GDP in public debt respectively. In addition, it would have ensured that these countries entered the subsequent growth slowdown with more favorable debt dynamics.
In Chile, which in 2010–12 withdrew significantly more than what was injected in 2009, a more paced withdrawal would have lowered volatility but at the expense of modestly higher public debt.
In Peru, there would have been some reduction in output volatility but with relatively little effect on the public debt ratio.
For Mexico and Colombia, the trade-offs are more ambiguous and the effects are relatively small.
9. The countercyclical response in 2009 helped contain output losses and was valuable. However, greater efforts to reduce the deficits in the subsequent years would have helped to rebuild fiscal space while, in some cases, actually reducing the variability of output.
12 Since the exercise is meant to investigate the implications of a symmetric response to downturns and upturns, the reaction of the cyclically adjusted fiscal balance to the output gap is assumed to be unchanged from 2009 onwards. Specifically, for the countries with countercyclical fiscal policy response in 2009—Brazil, Chile, Colombia, Mexico, Peru—the reaction of the cyclically adjusted balance to the output gap in 2010–14 is assumed to be equal to the reaction in 2009. For Uruguay which did not ease fiscal policy in 2009 acyclical fiscal policy is assumed from 2009 onwards.
Figure 9. LA6: Public Debt and Output Variability
Source: IMF staff calculations. Note: Arrows show how the public debt level in 2013 and the variability of output in 2009–13 would have been affected by countercyclical policy behavior. The starting point shows the actual debt in 2013 and actual output variability in 2009–13 (measured as the square root of the sum of squared deviations from trend, divided by the mean). See Technical Appendix, section III for details.
0
10
20
30
40
50
60
70
0.00 0.01 0.02 0.03 0.04
Gro
ss P
ublic
deb
t, Pe
rcen
t of
GD
P
Output – Coefficient of Variation
Brazil
Chile
Colombia
Mexico
Peru
Uruguay
FISCAL POLICY IN LATIN AMERICA
16 INTERNATIONAL MONETARY FUND
B. A Step-Up in Public Sector Spending
10. The expansion in 2008–09 came with a sizable increase in spending in all LA6 countries. Subsequently, the fiscal adjustment that has occurred came entirely from higher revenues—partly reflecting tax policy reforms but also buoyancy and better tax administration (see Technical Appendix, section III). Spending has either broadly stayed at the elevated 2009 levels (Chile, Colombia and Mexico) or risen further (Brazil, Peru and Uruguay). As a result, the spending-to-GDP ratios in 2014 were, on average, 4 percent of GDP higher than in 2007 (Figure 10). In many cases these increases are permanent in nature and have not been matched by a similar permanent change in revenue policies.
11. In all countries except Peru, and to lesser extent, Colombia, the increase in public sector spending has come from higher current outlays (Figure 11). On average, only one-third of the increase in spending came from capital spending. Current spending contributes to increased fiscal rigidity since it tends to contain items that are more inertial (such as public wages or pensions) or politically harder to reverse (like social protection or health care). The dominant drivers of the spending increase varied greatly across the region and involved higher social protection in Brazil and Peru, health and education spending in Chile, pensions in Mexico, and health care and education in Uruguay (Figure 12). Although some of these increases may have
Figure 10. LA6: Primary Government Expenditure(Percent of GDP)
INTERNATIONAL MONETARY FUND 17
responded to broad entitlement reforms (notably in Chile and Uruguay), in most cases there were no major new entitlement programs.13 Nor is it clear that the increase in expenditure reflected the continuation of the stimulus measures, as many of these were intended to be temporary in nature (see IMF 2009b).
12. There is clear scope for improvements in spending effectiveness. Except for Brazil, primary spending is below the average for emerging market economies but outcomes are generally worse than that implied by the lower spending. This view is corroborated by examining the technical efficiency of spending in the region, using frontier analysis or cost-benefit indicators, which finds:14
13 Chile and Uruguay implemented important health reforms that expanded the coverage under public plans. Also, noncontributory pension schemes were introduced or expanded in Chile, Uruguay, Mexico, and Peru. In Brazil and Colombia, on the other hand, pension spending increased amid higher minimum wage levels to which pension benefits are indexed. Higher social spending also reflected the introduction of free universal coverage for pre-school services in Chile; and the expansion of unemployment insurance coverage in Uruguay. 14 For details on the frontier analysis (FA) methodology, see Grigoli and Kapsoli (2013), and Albino-War and others (2014). The FA approach is only used to measure the efficiency of spending in health, education, and public investment. A cost-benefit analysis is used instead to measure the efficiency of social protection. The cost benefit calculations are based on micro-simulations using household survey data. This approach is widely used in the analysis of the impact of taxation and transfers on poverty and income inequality, see Paulus and others, 2009; OECD, 2011; Caminada, Goudswaard, and Wang, 2012; Lustig and others, 2013.
Figure 11. LA6: Current Expenditure vs. Capital Expenditure, Changes in 2007–09 vs. 2007–131/
(Percentage points of GDP)
Figure 12. LA6: Selected Drivers of the Change in the Public Expenditure-to-GDP Ratio in 2007–12 (Percentage points of GDP)
Sources: National authorities; and IMF staff calculations. 1/ The starting points show the changes in spending between 2007 and 2009. Arrows show changes in expenditure between 2009 and 2013. Dots below the 45 degree line indicate changes in current expenditure exceeded those on capital spending.
Sources: National authorities; World Bank, World Development Indicators; BADEINSO. Note: Given data constraints, only the most important categories of spending by functional classification are included in the chart. 1/ Changes between 2007 and 2011. 2/ Changes between 2007 and 2011 for education and between 2007 and 2010 for social protection and pensions.
0
1
2
3
4
5
0 1 2 3 4 5
Ch
ange
in c
apit
al e
xpe
nd
itu
re
Change in current expenditure
Brazil
Chile
Colombia
Mexico
Peru
Uruguay
-1
0
1
2
3
4
5
Brazil Chile Colombia Mexico 1/ Peru 2/ Uruguay
Education HealthPensions Social protection (exc. pensions)Change in primary expenditure
FISCAL POLICY IN LATIN AMERICA
18 INTERNATIONAL MONETARY FUND
Health. In the LA6 countries, the loss in health-adjusted life expectancy (HALE) due to spending inefficiency is below the EM average (Figure 14, panels a and b).15 Nonetheless, countries are below the efficiency frontier, indicating that the same HALE scores could be attained by spending less.
Social protection. Social assistance spending in LA6 appears generally well-targeted, with benefit-cost ratios above the EM average except in Colombia (Figure 14, panel c). 16 On the other hand, social insurance programs—accounting for the lion’s share of social protection and mainly consisting of contributory pensions—are ineffective in reducing poverty and, in some cases, might potentially exacerbate income inequality (see Figure 14, panel d; Goñi, López, and Servén, 2011; and Lustig and others, 2012).
Education. Outcomes as measured by secondary-education PISA scores are relatively good in the LA6 given public education spending levels.17 Uruguay and Chile appear to be particularly efficient (Figure 14, panel e). Peru and Mexico are slightly below the frontier, whereas Colombia and Brazil have larger efficiency gaps.
Public investment. The public capital stock in LA6 is about 40 percent lower than the EM average. At the same time, the level and efficiency of public investment varies widely across the
15 HALE estimates the number of healthy years an individual is expected to live at birth by subtracting a proportion of the years of ill health (weighted according to severity) from overall life expectancy. Health outcomes are determined by many factors beyond spending on health care. The estimation thus controls for factors such as per capita income, educational attainment, and access to sanitation facilities and clean water. Countries also differ in terms of natural endowments, which are controlled for by including data on temperature, precipitation, percent of population affected by natural disasters, and geographical differences across countries. Life expectancy in the early 1800s is included to control for genetic and cultural differences. In addition, tobacco use and alcohol consumption, HIV/AIDs prevalence, and TB incidence are also controlled for, assuming that these conditions are beyond the control of the health care systems. 16 A benefit is classified as social assistance when eligibility does not depend on whether a contribution was made. A benefit is classified as social insurance when eligibility is conditional on making contributions (e.g. contributory pensions). 17 The output indicators for education and public infrastructure also depend on private spending, which could bias the efficiency estimates upwards.
Figure 13. LA6: Social and Capital Spending, 2012 (Percent of GDP)
Sources: national authorities; World Bank, World Development Indicators; BADEINSO; IMF, World Economic Outlook. Note: EM = emerging market. 1/ 2011 data for education, health, and social protection. 2/ 2011 data for education; 2010 data for social protection.
0
3
6
9
12
15
18
Education Health Social protection
Capital spending
BrazilChileColombiaMexico 1/Peru 2/UruguayEM average
INTERNATIONAL MONETARY FUND 19
Figure 14. LA6: Spending Efficiency1/
PER
COLMEX
CHL
BRA
URY
0.0
0.5
1.0
1.5
2.0
2.5
0 10,000 20,000 30,000 40,000 50,000
Exte
nded
out
put i
ndic
ator
inde
x
Public capital stock per capita (PPP adjusted)
BRA
CHL
COL MEX
PER
URY
300
400
500
600
0 5,000 10,000 15,000 20,000
PISA
scor
e (a
vera
ge)
Public spending per student (PPP adjusted)
Sources: World Bank; Organisation for Economic Co–operation and Development; and IMF staff calculations. Note: HALE= health–adjusted life expectancy; PISA = Programme for International Student Assessment; PPP = purhcasing power parity. Data labels in the figure use International Organization for Standardization country codes. 1/ Frontier analysis is used in panels a, e, and f. The horizontal axis in each of these charts show the input indicator, while the vertical axis shows the output indicator used to estimate the efficiency frontier.2/ Loss in HALE due to inefficiencies. 3/ The benefit-cost ratio is the difference between the poverty gap before and after transfers divided by total transfers. 4/ Percent reduction in Gini coefficient per 1 percent of GDP in social insurance spending.5/ The composite index used as output combines traditional infrastructure indicators (roads and access to safe water) with indicators covering the role of public investment in the provision of public services (teachers and hospital beds per capita).
BRA
CHLCOL
MEXPERURY
35
40
45
50
55
60
65
70
75
80
0 1,000 2,000 3,000 4,000 5,000 6,000 7,000
HA
LE in
yea
rs, 2
012
Average per capita health spending (PPP), 1995–12
0.0
0.5
1.0
1.5
2.0
2.5
3.0
Brazil Mexico Uruguay Peru Colombia Chile
Emerging market average
0
0.1
0.2
0.3
0.4
0.5
0.6
0.7
Peru Uruguay Mexico Brazil Chile Colombia
Emerging market average
-0.6
-0.3
0.0
0.3
0.6
0.9
1.2
1.5
Chile Uruguay Brazil Mexico Colombia Peru
Emerging market average
e. Education: Efficiency Frontier
a. Health: Efficiency Frontier b. Health: Loss in HALE2/
(Years)
f. Public Investment: Efficiency Frontier5/
c. Social Assistance: Benefit-Cost Ratio3/
(Percent)d. Social Insurance: Reduction in Gini4/
(Percent)
INTERNATIONAL MONETARY FUND 20
countries.18 The estimates suggest that Brazil, Chile, and Uruguay, which have low levels of public investment, are relatively efficient in its provision (Figure 14, panel f). However, Colombia, Mexico, and Peru could obtain sizeable gains by improving the quality of their public investments.
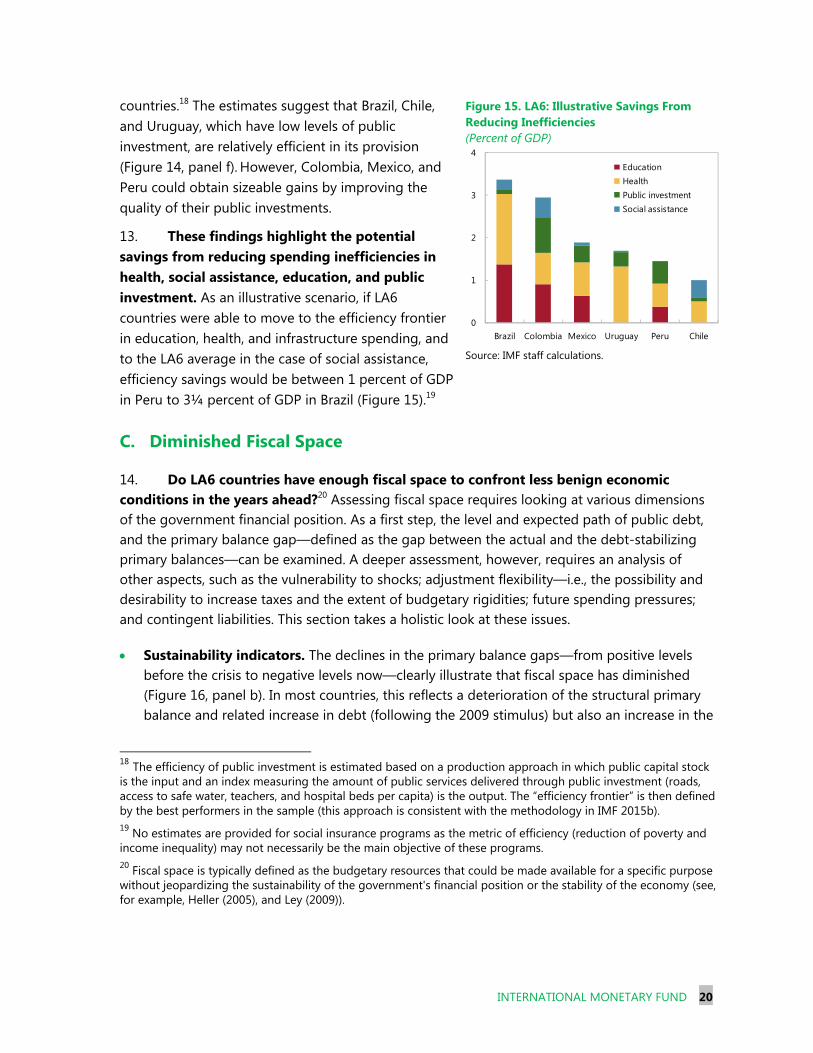
13. These findings highlight the potential savings from reducing spending inefficiencies in health, social assistance, education, and public investment. As an illustrative scenario, if LA6 countries were able to move to the efficiency frontier in education, health, and infrastructure spending, and to the LA6 average in the case of social assistance, efficiency savings would be between 1 percent of GDP in Peru to 3¼ percent of GDP in Brazil (Figure 15).19
C. Diminished Fiscal Space
14. Do LA6 countries have enough fiscal space to confront less benign economic conditions in the years ahead?20 Assessing fiscal space requires looking at various dimensions of the government financial position. As a first step, the level and expected path of public debt, and the primary balance gap—defined as the gap between the actual and the debt-stabilizing primary balances—can be examined. A deeper assessment, however, requires an analysis of other aspects, such as the vulnerability to shocks; adjustment flexibility—i.e., the possibility and desirability to increase taxes and the extent of budgetary rigidities; future spending pressures; and contingent liabilities. This section takes a holistic look at these issues.
Sustainability indicators. The declines in the primary balance gaps—from positive levels before the crisis to negative levels now—clearly illustrate that fiscal space has diminished (Figure 16, panel b). In most countries, this reflects a deterioration of the structural primary balance and related increase in debt (following the 2009 stimulus) but also an increase in the
18 The efficiency of public investment is estimated based on a production approach in which public capital stock is the input and an index measuring the amount of public services delivered through public investment (roads, access to safe water, teachers, and hospital beds per capita) is the output. The “efficiency frontier” is then defined by the best performers in the sample (this approach is consistent with the methodology in IMF 2015b). 19 No estimates are provided for social insurance programs as the metric of efficiency (reduction of poverty and income inequality) may not necessarily be the main objective of these programs. 20 Fiscal space is typically defined as the budgetary resources that could be made available for a specific purpose without jeopardizing the sustainability of the government's financial position or the stability of the economy (see, for example, Heller (2005), and Ley (2009)).
Figure 15. LA6: Illustrative Savings From Reducing Inefficiencies (Percent of GDP)
Source: IMF staff calculations.
0
1
2
3
4
Brazil Colombia Mexico Uruguay Peru Chile
EducationHealthPublic investmentSocial assistance
INTERNATIONAL MONETARY FUND 21
interest-growth differential. Absent improvements in primary balances, public debt ratios would display an upward trend in the years ahead. However, policy adjustments are evident in Brazil, Colombia, Mexico, and Peru which will diminish the risks to fiscal sustainability. Nevertheless, gross and net debt as a share of GDP are expected to remain above pre-crisis levels in all countries except Peru and Uruguay over the next five years—on average by 4 percentage points of GDP (Figure 16, panel a).
Figure 16. LA6: Fiscal Sustainability Indicators
Sources: IMF, World Economic Outlook; Fiscal Monitor; and IMF staff calculations. Note: EM = emerging market. 1/ Difference between the actual (or projected) primary balance and the debt-stabilizing primary balance (non-interest balance necessary to stabilize the public debt ratio at the level of the previous year). The interest rate-growth differential projected for 2015 was used to calculate the gaps shown by the green and red bars, using the 2008 and 2015 primary balances, respectively. The interest rate-growth differential in 2008 and the primary balance in 2008 were used for calculating the gaps shown by the diamonds. The effect of debt-creating flows outside the overall balance is not incorporated into the calculations.
Macroeconomic risks. The fiscal picture could deteriorate significantly in the face of plausible headwinds. Two alternative scenarios are analyzed to illustrate this sensitivity to macroeconomic shocks using the methodology developed by Adler and Sosa (2013).21
Under a protracted growth slowdown—assuming real GDP growth is ½ percentage point below current projections, in line with revisions to growth potential since the onset of the crisis—public debt ratios would be higher on average by 4 percentage points of GDP in 2020 compared to the baseline projections, with the impact being particularly large in Brazil, Colombia, and Uruguay (Figure 17, panel a).22
21 Adler and Sosa (2013) build on the IMF debt sustainability analysis (DSA) by integrating that approach with country-specific econometric estimates of the response of macro-fiscal variables to the external shocks (as well as their endogenous interdependency). Qualitative conclusions presented in this paper are consistent with the latest DSA for each country, in particular regarding the lower growth scenario (the other shocks are not considered in the DSA scenarios). 22 The impact of a growth slowdown on 2020 debt ratios depends on a number of factors: (i) the end 2014 debt ratio (largest for Brazil, Uruguay, and Mexico); (ii) the projected increase in debt ratios under the WEO baseline
(continued)
-20
-10
0
10
20
30
40
50
0 20 40 60 80
Net
deb
t
Gross debt
Brazil ChileColombia MexicoPeru UruguayEMs
a. Gross and Net Debt, 2007 vs. 2020(Percent of GDP)
-4
-2
0
2
4
6
8
Brazil Chile Colombia Mexico Peru Uruguay
2008 2015
b. Primary Balance Gap 1/
(Percent of GDP)
FISCAL POLICY IN LATIN AMERICA
22 INTERNATIONAL MONETARY FUND
Similar orders of magnitude are obtained assuming a commodity price shock whereby energy and metal prices stabilize at 25 percent below the baseline level by end-2017 (meaning that they would decrease further to the levels seen in 2004–05). The most affected countries in this case would be the natural resource producers—all except Uruguay—via lower government revenue and an endogenous growth slowdown.23
Policy risks. If the expenditure growth patterns of the recent past (2011–14) were to continue, debt ratios would be 9 percentage points of GDP higher than under the baseline, generally surpassing the impact of adverse macroeconomic shocks (Figure 16, panel b) and leading to unsustainable trends in Brazil and Uruguay. This underlines the importance of
(largest for Chile and Uruguay); (iii) the elasticity of primary deficits to GDP (which tends to be larger in countries with high expenditure ratios—Brazil, Uruguay, and Colombia—and/or low natural resource revenues as percent of GDP—Uruguay, Brazil); and (iv) the endogenous response of other macroeconomic variables—exchange rates and interest rates—to the growth variations and resulting debt increase (see Adler and Sosa, 2013). 23 The impact of lower commodity prices on debt ratios stems from the direct effect on government revenue (mainly in Colombia, Mexico, Chile and Peru) and the endogenous response of growth, interest, and exchange rates to the commodity price shock (the fall in oil prices benefits growth in Brazil, Chile, and Uruguay, but it is detrimental in all other countries; on the other hand, the fall in metal prices depresses growth in Brazil, Chile, and Peru (see Adler and Sosa, 2013).
Figure 17. LA6: Debt Dynamics under Alternative Scenarios
Sources: IMF, World Economic Outlook; and staff’s calculations. 1/ The WEO baseline bars show the change in the debt-to-GDP ratio between 2014 and 2020. The blue and green bars show the difference in the 2020 debt-to-GDP ratio in the scenario relative to the WEO baseline. The commodity price shock assumes that the price level of energy and metals is 25 percent below the WEO baseline level from 2017 onwards. The growth slowdown scenario assumes that real GDP growth is ½ percentage point below the baseline over 2015–20. 2/ The dots show the impact of lower growth through automatic debt dynamics (proportional to the debt-to-GDP ratio). 3/ The historical expenditure growth scenario assumes that average real expenditure growth over 2016–20 is the same as in 2011–14. The 2007 structural primary balance scenario assumes that the structural primary balance gradually converges to that observed in 2007 over 2016–17, and remains at that level thereafter.
-12
-8
-4
0
4
8
12
Brazil Chile Colombia Mexico Peru Uruguay
WEO baselineCommodity shockGrowth slowdownDirect contribution from fall in growth 2⁄
a. Macroeconomic Shocks: Change in Debt, 2014–201/
(Percent of GDP)
b. Policy Shocks: Change in Debt, 2014–203/
(Percent of GDP)
INTERNATIONAL MONETARY FUND 23
reverting at least to the structural primary balances prevailing in 2007 (which would lower the 2020 debt burden on average by 7 percent of GDP).24
Fiscal risks. Potential contingent liabilities are another important factor limiting the fiscal space in LA6 countries. These stem from various sources including guarantees to Private-Public Partnerships (Peru, Colombia, Chile), state-owned banks and public credit operations (Brazil, Chile, Mexico, and Uruguay); implicit guarantees to state-owned enterprises (Brazil, Chile, and Colombia), sub-national governments, and the financial sector; contingent liabilities related to lawsuits against the state (Brazil, Chile, Peru); and natural disasters (Chile, Mexico, Peru). Quantification of these risks is, however, inherently difficult not least because the extent of information and analysis in public documents varies widely across the LA6 countries.25
Spending pressures. Spending pressures are likely to grow as income levels rise, increasing the demand for public services (Wagner’s law). At the same time, the price of these public services will likely grow faster than the prices of private goods and services (the Baumol effect). Finally, demographic trends are going to put pressure on age-related spending across all LA6, particularly for health care (Table 3).
15. In view of these risks, the considerable margin of uncertainty on the outlook, and limited fiscal space, there is a clear case to rebuild fiscal buffers across all LA6. Although it is difficult to assess the appropriate level of buffers to shield against potential contingencies, the experience during the global financial crisis highlights the value of building ample margins. In general, the flexibility to adjust the fiscal position varies across countries, increasing with the share of discretionary spending (as opposed to mandatory spending or budget earmarks) and decreasing with the tax burden.26 Excessive earmarking introduces distortions in fiscal management and, in some cases, reduces the space for investment. Such rigidities also constrain the space for reallocation in response to changing needs or in the pursuit of efficiency gain and force any spending reduction to be borne by a narrower subset of budget items.
24 Notable exceptions are Colombia and Mexico, which are projected to maintain a stronger structural position in 2016–20 under the baseline than in 2007. 25 Some information is available in various documents such as, statements of fiscal risks, budget reports and medium-term fiscal frameworks, but is generally not comprehensive. See, for example, Cebotari and others (2009). 26 Macroeconomic flexibility (for example, on the exchange rate) can also help.
Table 3. LA6: Age-related Spending Increase, 2014–30 (Percent of GDP)
Sources: IMF, Fiscal Monitor; and IMF staff estimates. Note: * denotes estimates based on Cotlear (2011); **denotes estimates based on the World Bank (2013).
Brazil and Uruguay have the highest revenue ratios, and therefore the least headroom to raise taxes (Figure 18). Moreover, revenue earmarking is widespread in Brazil, and “rigid” spending (public wages, pensions, and social assistance spending) is high in Uruguay and has increased further in the past several years (Figures 19 and 20).
Colombia also shows relatively high spending rigidity, but has scope to raise taxes (and also faces a lower level of public debt).
Mexico, Chile, and Peru have far more flexibility given their relatively low tax ratios and lower earmarking and spending rigidities. However, all three face difficulties associated with the volatility of commodity revenue.27
D. An Erosion of Fiscal Institutions
16. In the decade prior to the global financial crisis, the LA6 countries undertook fiscal and budgetary reforms that created a framework to build-up fiscal buffers. They adopted fiscal rules (primarily targeting nominal deficit ceilings); caps on sub-national borrowing or expenditure growth (Table 4); medium-term budget frameworks; and fiscal responsibility laws (that combined fiscal and procedural rules to strengthen fiscal transparency, accountability, and budget management). Top-down budgeting—with fixed limits for line ministry spending plans—was prevalent across the region (Curristine and Bas, 2007) and, for most cases, stabilization funds were created. The LA6 countries compared favorably to their G20 peers in the quality of their budget institutions. (Figure 21).
27 Nevertheless, in some cases (e.g., Mexico) the reliance on commodity revenues has declined over time.
Figure 18. LA6: General Government Revenue (Percent of GDP)
Sources: IMF, World Economic Outlook; and IMF staff calculations. Note: Data labels in the figure use International Organization for Standardization country codes.
Figure 19. LA6: Share of Mandatory Spending (Percent of total spending)
Sources: Data for Brazil, Chile, Colombia, Mexico and Peru are from Organisation for Economic Co–operation and Development/Inter-American Development Bank (2014). Data for Uruguay were provided by the national authorities. Note: The blue bars indicate ranges. Mandatory spending—or budget earmarks—set aside a percentage of government funds for specific sectors. They are usually established by the constitution, or by primary or secondary legislation. Figure 20. LA6: Share of Rigid Spending (Percent of total spending)
Sources: IMF, World Economic Outlook, and IMF staff calculations. Note: EM = emerging market. Share of rigid spending is calculated as a share of government compensation of employees and social benefits (pensions and social assistance) in total spending.
BRA
CHL
COL
MEXPER
URYEMs
20
25
30
35
40
20 25 30 35 40
2014
2007
0
20
40
60
80
100
Braz
il
Colo
mbi
a
Chile
Mex
ico
Peru
Urug
uay
010203040506070
EM A
sia
EM E
urop
e
Braz
il
Chile
Colo
mbi
a
Mex
ico
Peru
Uru
guay
LA6 average
INTERNATIONAL MONETARY FUND 25
Table 4. LA6: Numerical Fiscal Frameworks and Other Fiscal Institutions
Sources: IMF, Fiscal Rules Dataset; IMF (2013b and 2014a); national authorities; OECD and IDB (2014); PEFA country reports. Note: NPFS = non-financial public sector; CG = central government; SSF = social security fund, PEs = public enterprises. 1/ Excludes Petrobras from 2009 and Electrobras from 2010. 2/ Brazil’s FRL requires the annual setting of targets for the main fiscal variables. Historically, the annual budget law sets a binding primary surplus target for the following year and indicative targets for subsequent years (see Box 2). 3/ Although there is no formal MTEF, certain elements within the budget process reflect MTEF practices. 4/ The rule was initially introduced without the law, but was institutionalized in 2006 (Ley No. 20.128). 5/ A fiscal council was introduced in 2013, but it lacks formal and operational independence. Additionally, prior to that, two independent panel of experts produced forecasts of trend GDP and copper prices. 6/ An escape clause was introduced (effective from 2012) allowing for the fiscal rule to be suspended temporarily in the case of extraordinary events threatening the macroeconomic stability, subject to the favorable opinion of CONFIS. 7/ Although the original framework did not have a cyclically adjusted target, it allowed for the accumulation of surpluses in the stabilization fund 8/ A law regulating a large scale mining project was approved by Congress in 2013. The law sets out a taxation regime in line with contemporary international standards and would create an intergenerational sovereign wealth fund that would receive 70 percent of mining related government revenues. 9/ Independent reviews and analyses of macroeconomic and/or fiscal assumptions.
Colombia 1997/2003 2011 Yes, from 2012NFPS, CG from
2012
Primary surplus/borrowing
limits; also CG structural balance
from 2012
No6 Yes Yes Yes
Mexico 2006 2014 No7 CG+SSFs+some PEs
"Traditional" balance; from 2014 also
spending growth capsYes No3 Yes Yes
Peru 1999 2013 From 2015NFPS, CG from
2015
Deficit <1% for NFPS, spending growth
CG<4%; CG structural balance from 2015
Yes No3 Yes No
Uruguay 2006 2011 NoConsolidated public sector
Net debt Yes No3 No8 No
FISCAL POLICY IN LATIN AMERICA
26 INTERNATIONAL MONETARY FUND
17. Despite this relatively strong starting point, the crisis revealed weaknesses in the fiscal frameworks and underscored the perils of making discretionary changes without a medium-term anchor or an exit plan:
As the extraordinary nature of the crisis unfolded, many countries had to resort to “bending the rules” through ad-hoc adjustments to accommodate the needed 2009 fiscal impulse (Table 5).28 The lack of flexibility of some of the frameworks and the urgency of supporting the economy may have initially justified these changes.
In the subsequent years, however, the relaxation of the fiscal frameworks became, de facto, permanent. There was insufficient effort to re-anchor medium-term fiscal objectives and, in some cases, there was a further weakening (see Box 2). More recently, though, several countries have refocused on the need to strengthen fiscal institutions.
Figure 22. LA6: Fiscal Loosening and the Numerical Rules, 2009
Sources: IMF country reports; and national authorities. Note: PB = primary balance. 1/ Since Brazil and Colombia did not have a fully fledged numerical fiscal rule in 2009, their performance is assessed against the respective fiscal targets on the primary balance. For Brazil, increase in policy lending is considered a relaxation, although it is not subject to the framework governing its primary balance target. 2/ For Peru, only the deficit rule is assessed. The use of an escape clause is not considered an ad hoc adjustment. 3/ For Mexico, accounting relaxations include non-recurrent revenues, which generally represent financing items. 28 Technical Appendix, section IV contains a country-by-country description of the evolution of fiscal frameworks.
0
1
2
3
4
5
Brazil 1/ Chile Colombia 1/ Mexico Peru Uruguay
Revision to deficit target Accounting adjustmentsChange to escape clause Policy lendingUse of escape clause
-10
-8
-6
-4
-2
0
2
Brazil 1/ Chile Colombia 1/ Mexico Peru 2/ Uruguay
Change in PB
Change in PB justified by fiscal rule & ad hoc adjustments
Change in PB justified by fiscal rule
a. Policy Relaxations Relative to Fiscal Rules, 2009(Percent of GDP)
b. Change in Primary Balance, 2009(Percent of GDP)
Figure 21. LA6: Quality of Budget Institutions, 20141/
(Index, max = 2)
Sources: National authorities; IMF (2014a); and IMF staff estimates. 1/ Twelve budget institutions are used to evaluate the strength of each G20 and LA6 country's institutional arrangements based on the methodology described in IMF (2014a). Category I includes: 1) fiscal reporting; 2) macrofiscal forecasting; 3) fiscal risk management; and 4) independent fiscal agency. Category II includes: 5) fiscal objectives and rules; 6) medium-term budget frameworks; 7) performance orientation; and 8) inter-governmental fiscal arrangements. Category III includes: 9) budget unity; 10) top-down budgeting; 11) parliamentary approval; and 12) budget execution. Maximum score within each category is 2.
0.0
0.5
1.0
1.5
2.0
Understanding the fiscal challenge
Developing a credible fiscal
strategy
Implementing the fiscal strategy
LA6 G20 G20-emerging
INTERNATIONAL MONETARY FUND 27
18. Specific shortcomings of the fiscal frameworks revealed during and subsequent to the global financial crisis include:
A reliance on nominal (as opposed to structural) targets which create a procyclical bias to policies (although, to some extent, expenditure rules—when binding—did seem to help stem spending pressures).29
29 A telling example is the case of Peru which in 2008 registered a fiscal over-performance (relative to the limit set by the fiscal rule) of close to 3½ percent of GDP thanks to sizable revenue windfalls and spending restraint partly imposed by the cap on government’s real spending growth. This over-performance allowed Peru to provide stimulus in 2009 without relaxing its fiscal policy rule.
Table 5. LA6: Relaxation of Fiscal Frameworks
Formally Missed
Target1/
Escape Clause Used to Meet
Target
Reduction of Targets
Adjustors Used
Changes in Coverage
One-offs and Accounting
Adjustments2/
Off-Budget Activity2/
Brazil (NFPS) No No 2009, 2013–144/ 2009–145/ 2009–10 Yes Yes
Chile (CG) 2008–10 No 2008–10 No No Yes Yes
Colombia (NFPS) 2009–10 No 2009–10 No No Yes Yes
Mexico ("Traditional" balance)
No3/ 2010–12 2010–12, 2014 No 2009 6/ Yes Yes
Peru (NFPS, CG for the spending rule)
2009 (only spending rule)
2009-102009–10 (both
rules); 2013 (spending rule)
No2011–12 (only spending rule)
Yes
Uruguay (CPS) 20082009–10, 2012–14
2009, 2011, 2014
2012 (second escape clause)
No Yes
Source: IMF staff estimates based on information obtained from Ministries of Finance.Note: CG = central government; CPS = consolidated pulic sector; FRL = fiscal responsibility law; NPFS = nonfinancial public sector.1/ Initial or revised target (including revisions under escape clauses).2/ Operations are reported subject to data constraints; more details are provided in Annex IV.3/ Missed by a de minimis margin in 2008–13.
5/ Adjustor cap removed in 2014, allowing for a NFPS primary deficit.6/ PEMEX investment excluded.
Type of Relaxation
Country (coverage of rule)
4/ Binding target for general government suspended (December 2013); central government no longer obliged to compensate for sub-national government losses. Cap on adjustor for priority investment and cost of tax cuts removed in December 2014.
FISCAL POLICY IN LATIN AMERICA
28 INTERNATIONAL MONETARY FUND
Box 2. Brazil: Fiscal Framework in the Aftermath of the Crisis
The backbone of Brazil’s fiscal framework is its Fiscal Responsibility Law (FRL). Since the adoption of the FRL in 2000 the government has committed to yearly non-financial public sector (NFPS) primary surplus targets with the Budget Guidance Law (LDO, in its Portuguese acronym) creating a binding primary surplus target for the first year and indicative targets for the following two years. Since 2006, and through 2015, some space is allowed under the LDO to protect priority investment spending through the so called “investment adjustor”.1
Nevertheless, since the onset of the global financial crisis, Brazil’s fiscal framework has been frequently modified. In 2009, an amendment to the LDO lowered the primary surplus target (and increased the adjustor) to support the economy. A significant part of stimulus was also provided off-budget through the public banks. This additional stimulus was never fully reversed and further changes were introduced in an effort to gain more flexibility while remaining within the framework:
The investment spending adjustor was widened. Starting from less than 0.2 percent of GDP in 2006, the adjustor increased over time to reach 1.3 percent of GDP by 2013 (partly thanks to the inclusion of temporary tax cuts) and in 2014, a late year revision to the LDO eliminated the ceiling on the adjustor altogether.
The coverage of the fiscal target was narrowed. The target traditionally covered the whole NFPS with the federal government responsible for ensuring overall compliance by compensating shortfalls by other agencies. However, in 2013 the federal government was no longer required to compensate for shortfalls elsewhere in the public sector, effectively reducing the target to one on the federal government primary balance. This clause was, however, eliminated in 2015 restoring the effective constraint on the NFPS.
Compliance with targets relied extensively on non-recurrent and off-budget transactions. These included tax amnesties, concession proceeds, and withdrawals from Brazil’s sovereign wealth fund. Payment for a growing share of spending has also been deferred to a later date (since targets are established on a cash basis).
Fiscal activities were pushed outside of the NFPS into public banks (around 10 percent of GDP was transferred from the federal government to public banks and then leveraged to support an expansion of public credit) and state-owned companies that are outside the NPFS coverage (for example, through price controls that created quasi-fiscal losses in Petrobras and Eletrobras). Nevertheless, the policy lending to public banks will be discontinued from 2015.
A retroactive renegotiation of the terms of subnational debt owed to the federal government (lowering the net payments from subnational governments by around ½ percent of GDP and undermining the FRL principle of no intergovernmental bailout).
Control of the executive over budget execution was diluted. Starting in 2015, parliamentary amendments to the budget will be made compulsory for up to 1.2 percent of net current revenue, (provided that half of expenses pertain to health services).
__________________________________________________ 1 The investment adjustor originally covered expenditures under the Pilot Investment Project (Portuguese acronym PPI) and since 2009 the Growth Acceleration Program (Portuguese acronym PAC).
Sources: Ministry of Planning; Ministry of Finance; Treasury; and staff calculations. Note: NFPS = Non-financial public sector; PB = primary balance. 1/ Final NFPS target without use of adjustor. In 2013-14, it includes officially projected surplus of subnational governments and state-owned enterprises (non-binding). Coverage changes in 2009 and 2010, respectively, by the exclusion of Petrobras and Eletrobras. 2/ Maximum allowed target adjustment under the final LDO (annual budget guidelines law). In 2014, it covers all realized costs with priority investment spending (PAC) and tax cuts.
Sources: Ministry of Planning; Ministry of Finance; Treasury; and staff calculations. Note: SWF = sovereign wealth fund. 1/ Nonrecurrent revenue includes proceeds from tax amnesties and concessions. 2/ Unpaid recognized spending obligations, end of fiscal year.
An ability to frequently change the targets established by the fiscal rules. These changes
occurred not only at the peak of the crisis but also in the recovery phase—invoking the escape clauses repeatedly (for example, Peru in 2010, Mexico in 2010–12, and Uruguay—for the net debt rule—in 2010, and 2012–14).
Narrow coverage of the fiscal rules. Coverage is limited to the central government in Chile. In Mexico, coverage excludes state and local governments. Moreover, Mexico’s rule covers a non-standard definition of the fiscal deficit, counting certain financing items as revenues and excluding some expenditures (for certain infrastructure projects and some financial sector-related transactions). Ad-hoc exclusions (limiting the coverage) were also introduced in Mexico (investment by the state petroleum company, PEMEX), Brazil (investment and tax cuts through the adjustor) and Peru (infrastructure maintenance, some social spending and equipment purchases for security forces).
No (or poorly defined) escape clauses. In Chile and Colombia there was no escape clause and so the targets were missed in order to accommodate the 2009 stimulus. At the other end, the escape clause was repeatedly used in Mexico and Uruguay (in the latter it was also loosened over time).
Nonrecurrent revenues were relied upon to meet the letter but not the spirit of the fiscal goals (Brazil and Mexico).
-2
0
2
4
6
2004 2006 2008 2010 2012 2014
NFPS PB target, full 1/
NFPS PB target minus adjustor 2/
-0.1
0.1
0.3
0.5
0.7
0.9
1.1
1.3
2004 2006 2008 2010 2012 2014
Nonrecurrent revenue plus use of (+) / deposit at (-) the SWF 1/
Floating debt 2/
FISCAL POLICY IN LATIN AMERICA
30 INTERNATIONAL MONETARY FUND
Weak budget execution controls meant that, for the region as a whole, expenditures were on average close to 1 percent of GDP above budgeted amounts (Figure 25, panel c). In addition, public accountability was limited with no independent monitoring of compliance with the fiscal rules.
In many cases, the multi-year budgetary framework proved not to be policy-relevant because they were not used to guide the budget process or to inform budgetary decisions.
Figure 25. LA6: Outturn vs. Budget Projections (Difference)
Sources: National budget documents; and IMF staff calculations. Note: Data labels in the figure use International Organization for Standardization country codes. BRA = Brazil; CHL = Chile; COL = Colombia; MEX = Mexico; PER = Peru; URY = Uruguay. 1/ For Brazil, data refer to primary net revenue and spending of the central government, and fiscal outturns include transfers to and from the sovereign wealth fund and flows related to the Petrobras operation in 2010, as reported by the Brazilian National Treasury and Central Bank. For Colombia, data refer to the total revenue and expenditure of the consolidated public sector. For Peru, data refer to the total revenue and expenditure of the general government. Data for Uruguay refer to total revenue and primary expenditure.
LESSONS The experience of Latin American countries during the global financial crisis reminds us that, to be effective, countercyclical fiscal policy cannot be a one-way ticket: it has to apply symmetrically during upturns and downturns. Institutions that provide a credible fiscal anchor are key. Prospective spending pressures (from rising income levels and demographics) and the need for adjustment underscore the importance of improving efficiency.
19. The experience since the global financial crisis highlights that, to be a viable option over the longer term, countercyclical fiscal policy has to be applied symmetrically during downturns and recoveries. Achieving such symmetry is a challenge, not only due to the pressing social and investment spending needs of developing economies but also to the sizable uncertainty in judging real-time output gap estimates (see, Grigoli and others, 2015). This highlights the importance of robust and transparent institutions to guide fiscal policy responses to economic fluctuations and commodity price shifts and to support macroeconomic stability and long-term growth (IMF, 2015c). The lessons and policy recommendations that become
-6
-4
-2
0
2
BRA CHL COL MEX PER URY
a. Real Growth (Percentage points)
Average 2008-09
Average 2010-13
-2
0
2
4
BRA CHL COL MEX PER URY
b. Revenue1/
(Percent of GDP)
-2
0
2
4
BRA CHL COL MEX PER URY
c. Expenditure1/
(Percent of GDP)
INTERNATIONAL MONETARY FUND 31
apparent from the past 5 years are centered on (i) restoring fiscal space, (ii) rebuilding fiscal institutions, and (iii) raising expenditure efficiency.
Restoring Counter-cyclicality and Fiscal Space
20. Rebuilding fiscal buffers will lessen vulnerabilities. The desired magnitude, timing, and pace of the adjustment vary across countries depending on prospective debt dynamics, fiscal risks, the macroeconomic outlook, and market conditions. In some cases, the existing space could still be used to counter negative shocks. In others, a quick shift to consolidation is needed to safeguard debt sustainability:
In Brazil and Uruguay, about 2½–3 percentage points of GDP in consolidation are needed to put the debt-to-GDP ratios on a firmly downward sloping path. The less favorable debt dynamics call for early fiscal consolidation to achieve a visible change in the direction of public debt right away. Over the longer term, spending rigidities and higher tax burdens call for deeper structural fiscal reforms. Substituting out of current spending would open up room to meet critical infrastructure investment needs.
Colombia and Mexico face more moderate public debt burdens, but are exposed to commodity price shocks. A gradual approach to restore a downward-sloping debt path is feasible but will require, over the next few years, consolidations of 2 percentage point of GDP in Colombia and 2–3 percentage point of GDP in Mexico.
Public debt levels in Chile and Peru remain well below that of other emerging markets giving these countries greater latitude for implementing countercyclical policy to mitigate downside shocks. Nonetheless, their vulnerability to commodity price shocks highlights the importance of accumulating even larger fiscal buffers, gradually improving the fiscal balances by 1–1½ percentage points of GDP over the medium term.
21. Part of the required adjustment is already underway. Brazil has announced a primary surplus target of 1.2 percent of GDP for 2015 and of at least 2 percent of GDP in 2016 and 2017. This strategy, together with the ending of policy lending from the Brazilian Treasury to public sector banks, should stabilize and then reduce gross public debt ratios. In Colombia and Mexico, the fiscal balance is currently projected to strengthen by more than 2 percentage points over the medium term. In Mexico, this is being supported by recently-announced expenditure reductions in 2015 and 2016. In Uruguay, on the other hand, the 2015 budget entails an adjustment amounting to only ¾ percent of GDP.
Redesigning Fiscal Institutions
22. Key areas include:
Adjusting for the cycle. Moving toward a fiscal rule that targets the structural balance (adjusting for the cycle and, in resource-rich countries, for deviations in commodity prices) would help limit procyclicality. Nevertheless, some pre-conditions have to be met
FISCAL POLICY IN LATIN AMERICA
32 INTERNATIONAL MONETARY FUND
for its successful implementation (see, Ter-Minassian, 2011) and, in some cases, the inherent difficulties in estimating the cyclical position may favor the use of an expenditure rule instead. Notwithstanding these difficulties, several LA6 countries already have rules that adjust for the cycle (Chile has long relied on a structural balance rule, while Colombia introduced a structural balance anchor through a constitutional amendment in 2011). In Peru, starting with the 2015 budget, there is an indicative structural balance anchor which feeds into a binding constraint on spending.
Adopting broadly defined expenditure rules may be a more viable option to limit procyclicality for some countries (Ayuso-i-Casals, 2012) as they are operationally easier to implement and monitor than a structural rule. Indeed, Mexico’s nominal deficit target has now been complemented by an expenditure rule, although this covers only about half of expenditures.
Ensuring broad and stable coverage of the rules (most notably by going beyond the central government) and eliminating loopholes. Mexico has recently made a step in this direction by giving more prominence to the broader measure of the fiscal balance (public sector borrowing requirement).
Establishing fiscal councils that are operationally independent could provide an objective public assessment of budgetary forecasts, and monitor compliance with fiscal rules. This would strengthen the credibility of the fiscal framework and catalyze a public debate on fiscal policy trade-offs (Debrun and Kinda, 2014). Chile and Colombia have already introduced such fiscal councils (although in Chile’s case the council lacks formal independence).30
Building in well-defined escape clauses to provide flexibility in the face of exceptional circumstances. To be effective, they should only include a limited range of factors that allow the clauses to be triggered, provide clarity on when they should be used and specify a path back to the rule (e.g. through commitments on the treatment of accumulated deviations).31 In 2011, Colombia introduced an explicit escape clause as well as provisions for exceptional (“countercyclical”) spending in certain circumstances accompanied by a requirement to set out an adjustment path back to the targets. Peru’s recent law provides a detailed definition of circumstances that trigger escape clauses as well as a corrective path.
Creating a rolling medium-term expenditure framework that accounts for the multiyear effects of new policies and establishes multiyear spending ceilings that are more than indicative forecasts.
30 Peru has passed a law that requires the establishment of an autonomous fiscal council (within the Ministry of Finance) tasked with analyzing the macro-fiscal projections and compliance with the fiscal laws and rules. 31 For a discussion, see Budina and others (2013).
INTERNATIONAL MONETARY FUND 33
Strengthen the mechanisms to save windfalls from commodity-related revenue. The oil and mining regime was reformed in both Colombia and Mexico to create or improve a savings fund.
Raising Expenditure Efficiency
23. Achieving rapid savings through outright reductions in expenditures may be politically difficult. Raising efficiency could slow the growth of spending significantly while, over time, get close to achieving similar outcomes. The analysis of technical efficiency presented in this paper highlights that the LA6 could potentially save 1–3½ percentage points of GDP by investing in improving the efficiency of public spending on education, health, social assistance, and infrastructure. This is, of course, a challenging undertaking that is far easier said than done.
24. The largest savings would come from tackling inefficiencies in health care spending. Reform priorities vary greatly by country, but common themes include: (i) correcting distortions and adopting payment methods that incentivize providers to contain costs and improve quality; (ii) streamlining the collection and administration of health care resources; (iii) emphasizing health promotion and preventive care; (iv) reducing fragmentation of the health care system, and (v) aligning hospital capacity with needs.32
25. There are other areas where efficiency improvements could also be sought. Some countries may have to reform their contributory pension schemes to contain pressures on the budget (IMF, 2014b). Improvements in the public investment management systems would help reap some efficiency gains on investment (Frank, 2013; and Rajaram and others, 2014). For the LA6 priorities the principal gains are likely to come from better coordination among different levels of governments and ensuring that quality rules for public infrastructure spending are enforceable (especially, for PPPs).33
32 For a discussion on measures to increase efficiency on health spending, see Bonilla-Chacín and Aguilera (2013); Bitran (2013); Torres and Acevedo (2013); Giedion and others (2014); IADB (2013); Pardo and Schott (2013); Schwellnus (2009); and Seinfeld and others (2013). 33 For a more detailed discussion on the institutional reforms that could help improving public investment efficiency, see IMF 2015b.
INTERNATIONAL MONETARY FUND 34
References
Adler, Gustavo, and Sebastian Sosa, 2013, “External Conditions and Debt Sustainability in Latin America,” IMF Working Paper No. 13/27 (Washington: International Monetary Fund).
___________, and Nicolas Magud, 2013, “Four Decades of Terms-of-Trade Booms: Saving-Investment Patterns and a New Metric of Income Windfall,” IMF Working Paper No. 13/103 (Washington: International Monetary Fund).
Albino-War, Maria, and others, 2014, “Making the Most of Public Investment in MENA and CCA Oil-Exporting Countries,” IMF Staff Discussion Note No. 14/10 (Washington: International Monetary Fund).
Auerbach, Alan J., and Yuriy Gorodnichenko, 2012, “Measuring the Output Responses to Fiscal Policy,” American Economic Journal: Economic Policy, Vol. 4, pp. 1–27.
Ayuso-i-Casals, Joaquim, 2012, “National Expenditure Rules: Why How and When,” Economic Papers 473 (December), (Brussels: European Commission).
Baum, Anja, Marcos Poplawski-Ribeiro, and Anke Weber, 2012, “"Fiscal Multipliers and the State of the Economy," IMF Working Papers 12/286, International Monetary Fund,” IMF Working Paper No. 12/286 (Washington: International Monetary Fund).
Bitran, Ricardo, 2013, “Explicit Health Guarantees for Chileans: The AUGE Benefits Package,” UNICO Studies Series 21 (Washington: World Bank).
Bonilla-Chacín, Maria E., and Nelly Aguilera, 2013, “The Mexican Social Protection System in Health,” UNICO Studies Series No. 1 (Washington: World Bank).
Budina, Nina, Tidiane Kinda, Andrea Schaechter, and Anke Weber, 2013, “Numerical Fiscal Rules: International Trends” in Public Financial Management and Its Emerging Architecture, ed. by Marco Cangiano, Teresa Curristine, and Michel Lazare (Washington: International Monetary Fund).
Caminada, Koen, Kees Goudswaard, and Chen Wang, 2012, “Disentangling Income Inequality and the Redistributive Effect of Taxes and Transfers in 20 LIS Countries Over Time,” LIS Working Paper Series No. 581 (Luxembourg: Luxembourg Income Study).
Cebotari, Aliona, Jeffrey Davis, Lusine Lusinyan, Amine Mati, Paolo Mauro, Murray Petrie, and Ricardo Velloso, 2009, “Fiscal Risks: Sources, Disclosure, and Management,” (Washington: International Monetary Fund).
Cotlear, Daniel, 2011, “Population Aging: Is Latin America Ready?” Directions in Development (Washington: World Bank).
INTERNATIONAL MONETARY FUND 35
Curristine, Teresa, and Maria Bas, 2007, “Budgeting in Latin America: Results of the 2006 OECD Budget Survey,” OECD Journal of Budgeting, Vol. 7–No. 1.
Debrun, Xavier, and Tidiane Kinda, 2014, “Strengthening Post-Crisis Fiscal Credibility: Fiscal Councils on the Rise—A New Dataset,” IMF Working Paper No. 14/58 (Washington: International Monetary Fund).
Frank, Jonas, 2013. “Public Investment Management in Latin America and the Caribbean: Institutions under Evolution,” Country Case Study, (Washington: World Bank).
Frankel, Jeffrey A., Carlos A. Vegh, and Guillermo Vuletin, 2013, “On Graduation from Fiscal Procyclicality, Journal of Development Economics, Vol. 100, pp. 21-47.
Grigoli, Francesco, and Javier Kapsoli, 2013, “Waste Not, Want Not: The Efficiency of Health Expenditure in Emerging and Developing Economies,” IMF Working Paper No. 13/187 (Washington: International Monetary Fund).
___________, Alexander Herman, Andrew Swiston, and Gabriel Di Bella, 2015, "Output Gap Uncertainty and Real-Time Monetary Policy," IMF Working Paper No. 15/14 (Washington: International Monetary Fund).
Giedion, Ursula, Ricardo Bitrán, and Ignez Tristao, eds., 2014, “Health Benefit Plans in Latin America: A Regional Comparison,” (Washington: Inter-American Development Bank).
Goñi, Edwin, Humberto J. López, and Luis Servén, 2011, “Fiscal Redistribution and Income Inequality in Latin America,” World Development Vol. 39(9), pp. 1558-1569.
Gragnolati, Michele, Magnus Lindelow, and Bernard Couttolenc, 2013, “Twenty Years of Health System Reform in Brazil: An Assessment of the Sistema Único de Saúde,” Directions in Development (Washington: World Bank).
Heller, Peter, 2005, “Understanding Fiscal Space,” Policy Discussion Paper No. 05/04 (Washington: International Monetary Fund).
Hemming, Richard, and Philip Joyce, 2013, “The Role of Fiscal Councils in Promoting Fiscal Responsibility,” in Public Financial Management and Its Emerging Architecture, ed. by Marco Cangiano, Teresa Curristine, and Michel Lazare (Washington: International Monetary Fund).
Inter-American Development Bank, 2013, “Colombia: Support for Reform of the General Social Security Health Care System”, Loan Proposal (Washington).
International Monetary Fund, 2009a, “Regional Economic Outlook—Western Hemisphere,” May 2009 (Washington: International Monetary Fund).
FISCAL POLICY IN LATIN AMERICA
36 INTERNATIONAL MONETARY FUND
___________, 2009b, “Fiscal Implications of the Global Financial Crisis,” IMF Occasional Paper No. 269 (Washington).
___________, 2013a, “Reassessing the Role and Modalities of Fiscal Policy in Advanced Economies,” IMF Policy Paper, (Washington).
___________, 2013b, “The Functions and Impact of Fiscal Councils,” IMF Policy Paper, (Washington).
___________, 2014a, “Budget Institutions in G-20 Countries: An Update,” IMF Policy Paper, (Washington).
___________, 2015a, “Fiscal Monitor—Now Is the Time: Fiscal Policies for Sustainable Growth,” (April), (Washington).
___________, 2015b, “Making Public Investment More Efficient,” IMF Policy Paper (forthcoming; Washington).
___________, 2015c, “Fiscal Policy and Long-term Growth,” IMF Policy Paper (forthcoming; Washington).
Ilzetzki, Ethan, 2011, “Fiscal Policy and Debt Dynamics in Developing Countries,” Policy Research Working Paper Series No. 5666 (Washington: World Bank).
Izquierdo Alejandro, and Ernesto Talvi, 2008, “All that Glitters May Not Be Gold: Assessing Latin America’s Recent Macroeconomic Performance,” (Washington: Inter-American Development Bank).
Klemm, Alexander, 2014, “Fiscal Policy in Latin America over the Cycle,” IMF Working Papers, No. 14/59 (Washington: International Monetary Fund).
Ley, Eduardo, 2009, "Fiscal Policy for Growth," World Bank Operational Studies No. 11120, (Washington: World Bank).
Lustig, Nora, George Gray-Molina, Sean Higgins, Miguel Jaramillo, Wilson Jiménez, Veronica Paz, Claudiney Pereira, Carola Pessino, John Scott, and Ernesto Yañez, 2012, “The Impact of Taxes and Social Spending on Inequality and Poverty in Argentina, Bolivia, Brazil, Mexico and Peru: A Synthesis of Results,” Working Paper No. 1216, Tulane Economics Working Paper Series (Tulane University).
___________, Carola Pessino and John Scott, 2013, "The Impact of Taxes and Social Spending on Inequality and Poverty in Latin America: Argentina, Bolivia, Brazil, Mexico, Peru and Uruguay," Public Finance Review, November, pp. 1–17.
INTERNATIONAL MONETARY FUND 37
Organization for Economic Cooperation and Development, 2011, Divided We Stand: Why Inequality Keeps Rising, (Paris).
___________, and Inter-American Development Bank, 2014, Government at a Glance: Latin America and the Caribbean 2014: Towards Innovative Public Financial Management, (Paris).
Paulus, Alari, Mitja Čok, Francesco Figari, Peter Hegedüs, Natasa Kump, Orsolya Lelkes, Horacio Levy, Christine Lietz, Silja Lüpsik, Daniela Mantovani, Leszek Morawski, Holly Sutherland, Peter Szivos, and Andres Võrk, 2009, “The Effects of Taxes and Benefits on Income Distribution in the Enlarged EU,” EUROMOD Working Paper EM8/09 (Essex: University of Essex).
Pardo, Cristian, and Whitney Schott, 2013, “Health Insurance Selection in Chile: A Cross-Sectional and Panel Analysis,” Health Policy and Planning, pp. 1-11.
Rajaram, Anand, Tuan Minh Le, Kai Kaiser, Jay-Hyung Kim, and Jonas Frank, 2014, “The Power of Public Investment Management: Transforming Resources into Assets for Growth,” (Washington: World Bank).
Schwellnus, Cyrille, 2009, “Achieving Higher Performance: Enhancing Spending Efficiency in Health and Education in Mexico,” Economics Department Working Paper No. 732 (Paris: Organization for Economic Co-operation and Development).
Seinfeld, Janice, Vilma Montañez, and Nicolas Besich, 2013, “The Health Insurance System in Peru: Towards a Universal Health Insurance,” Global Development Network.
Ter-Minassian, Teresa, 2011, “Should Latin American Countries Adopt Structural Balance-Based Fiscal Rules?” Revista de Economía y Estadística, Vol. XLIX, pp. 115–143.
Torres, Fernando M., and Oscar B. Acevedo, 2013, “Colombia Case Study: The Subsidized Regime of Colombia’s National Health Insurance System,” UNICO Studies Series No. 15, (Washington: World Bank).
Vegh, Carlos, and Guillermo Vuletin, 2014, “The Road to Redemption: Policy Response to Crises in Latin America,” IMF Economic Review, Vol. 62, No. 4 (Washington: International Monetary Fund).
World Bank Group, 2013, “Uruguay - Public Expenditure Review: Mitigating Fiscal Risks,” Latin America and Caribbean region, Poverty reduction and economic management, Public Expenditure Review Report No. 68770-UY, (Washington).