78


Fiscal Space for Health in Suriname
Final Report
A. Lorena Prieto, PhD Senior Economist
Washington DC. December, 2018

FISCAL SPACE FOR HEALTH − SURINAME FINAL REPORT
i
Contents
I. General background ........................................................................................................ 1
1.1 Objectives ................................................................................................................... 4
1.1.1 General objective ................................................................................................. 4
1.1.2 Specific objectives ................................................................................................ 4
1.2 Structure .................................................................... Error! Bookmark not defined.
II. General context ................................................................................................................ 4
2.1 Population and social context ..................................................................................... 4
2.2 Macroeconomic overview........................................................................................... 6
2.3 Health status context ................................................................................................. 16
2.4 Health sector overview ............................................................................................. 22
2.4.1 System Resources ............................................................................................... 24
2.4.2 Financing ........................................................................................................... 25
2.4.3 Health policies ................................................................................................... 29
III. Fiscal space conceptual framework, methods and data ...................................... 30
3.1 Basic condition: Economic growth and stability ...................................................... 33
3.2 New revenues ............................................................................................................ 34
3.2.1 Taxes .................................................................................................................. 35
3.2.2 Social security contributions for health ............................................................. 35
3.3 Efficiency gains ........................................................................................................ 36
3.4 Reprioritization of health expenditure ...................................................................... 37
3.5 Foreign aid ................................................................................................................ 37
3.6 Borrowing ................................................................................................................. 37
3.7 Printing money .......................................................................................................... 38
IV. Fiscal space estimates and analysis ....................................................................... 38
4.1 Economic growth ...................................................................................................... 38
4.2 New revenue ............................................................................................................. 44
4.2.1 Taxes .................................................................................................................. 48 A. Direct taxes ................................................................................................................... 50 B. Indirect taxes ................................................................................................................. 51 C. Indirect taxes: sin taxes ................................................................................................. 53 D. Tax expenditure ............................................................................................................ 56

FISCAL SPACE FOR HEALTH − SURINAME FINAL REPORT
ii
4.2.2 Social security contributions for health ............................................................. 57
4.3 Efficiency gains ........................................................................................................ 60
4.4 Reprioritization of health expenditure ...................................................................... 61
4.5 Donations .................................................................................................................. 62
4.6 Borrowing ................................................................................................................. 64
V. Conclusions and recommendations .............................................................................. 64

FISCAL SPACE FOR HEALTH − SURINAME FINAL REPORT
iii
List of Figures
Figure 1: Suriname‟s population pyramid, 2000 and 2015 .................................................... 5
Figure 2: Evolution of the human development index, Suriname and selected countries, 1990-2017 ....................................................................................... 6
Figure 3: Real GDP per capita (constant 2010 US$), Suriname and selected countries, 2000-2016 ....................................................................................................... 7
Figure 4: GDP annual growth, Suriname and selected countries, 2000-2016 ........................ 8
Figure 5: Real GDP annual growth projections (starting after 2016 and 2017), Suriname and selected countries, 2000-2022 .................................................. 9
Figure 6: Personal remittances received as percentage of GDP, 2000-2016 ........................ 10
Figure 7: General government revenue, expenditure, gross debt and net lending/borrowing as percentage of GDP, Suriname, 2000-2022 ................ 11
Figure 8: General government revenue and expenditure as percentage of GDP, Suriname and selected countries, 2000-2022 ................................................ 12
Figure 9: General government gross debt as percentage of GDP, Suriname and selected countries, 2000-2016 ....................................................................... 13
Figure 10: Tax revenue as percentage of GDP, Suriname and selected countries, 2000-2016 ..................................................................................................... 13
Figure 11: Tax revenue as percentage of GDP, Suriname and selected countries, 2000-2016 ..................................................................................................... 14
Figure 12: Participation rate as percentage of population ages 15+, 2000-2017 ................. 15
Figure 13: Life expectancy at birth (in years) by sex, Suriname, 1995-2015 ...................... 16
Figure 14: Neonatal, infant and children under 5 years of age per 1,000 live births and maternal mortality ratio per 100,000 live births, 1990-2016 ........................ 18
Figure 15: Maternal mortality ratio per 100,000 live births, Suriname and selected countries, 1990-2015 ..................................................................................... 19
Figure 16: Pregnant women receiving prenatal care as percentage of total pregnant women, Suriname and selected countries, 2000-2014 .................................. 20
Figure 17: Births attended by skilled health staff as percentage of total births, Suriname and selected countries, 2000-2014 ................................................ 21
Figure 18: Distribution of causes of death (percentage of total), Suriname and selected countries, 2000 and 2015 ................................................................ 22
Figure 19: Overview of payers, providers and beneficiaries of the health system, 2011 ..... 23
Figure 20: Suriname‟s health sector financing ..................................................................... 24
Figure 21: THE per capita (int$, PPP, constant 2011), Suriname and selected countries, 1995-2014 ..................................................................................... 26

FISCAL SPACE FOR HEALTH − SURINAME FINAL REPORT
iv
Figure 22: Distribution of health expenditure by sources, 2000-2015 ................................. 27
Figure 23: General government health expenditure versus out-of-pocket health expenditure, Suriname and selected countries, 2000, 2005, 2010 and 2015 ............................................................................................................... 28
Figure 24: GDP growth (1976-2016) and GDP per capita (int$, PPP, constant 2011) (1990-2016) ................................................................................................... 39
Figure 25: GGHE, GHE and SSHE (annual growth and as percentage of GDP), Suriname, 1996-2015 .................................................................................... 40
Figure 26: Annual growth of GDP versus annual growth of GGHE, GHE, SSHE, Suriname, 2001-2015 .................................................................................... 41
Figure 27: Public revenues as percentage of GDP, Suriname and selected countries, 2001-2016 ..................................................................................................... 45
Figure 28: Revenue by source as percentage of total revenue, Suriname, 2001-2012 ......... 46
Figure 29: Revenue by source as percentage of GDP, Suriname, 2001-2012 ...................... 46
Figure 30: Revenue by source as percentage of total revenue, Suriname, 2012-2016 ......... 47
Figure 31: Tax revenues as percentage of GDP, Latin American and Caribbean countries and some aggregates, 2012 ............................................................ 48
Figure 32: Tax revenue as percentage of GDP, Suriname and selected countries, 2001-2016 ..................................................................................................... 49
Figure 33: Tax revenue by direct/indirect tax as percentage of GDP, Suriname, 2001-2012 ............................................................................................................... 50
Figure 34: Direct tax revenue as percentage of GDP, 2001-2012 ........................................ 51
Figure 35: Indirect tax revenue as percentage of GDP, 2001-2012 ..................................... 52
Figure 36: Distribution of indirect tax revenue, 2001-2012 ................................................. 53
Figure 37: Revenue from sin taxes as percentage of total revenue, 2012-2016 ................... 54
Figure 38: Alcohol sales trends, 2005-2011 ......................................................................... 56
Figure 39: Sources of revenue as percentage of revenue, Suriname and selected countries, 2012 .............................................................................................. 58
Figure 40: Social security health expenditure as percentage of total health expenditure, Latin American and Caribbean countries, 2013 ....................... 58
Figure 41: Compulsory Financing Arrangements (CFA) as % of Current Health Expenditure (CHE), Suriname and selected countries, 2000-2016 .............. 59
Figure 42: Social Health Insurance (SHI) as % of Current Health Expenditure (CHE), Suriname and selected countries, 2000-2016 ................................................ 60
Figure 43: General government health expenditure as percentage of government expenditure, Suriname and selected countries, 1995-2014 ........................... 62

FISCAL SPACE FOR HEALTH − SURINAME FINAL REPORT
v
Figure 44: External resources for health as percentage of total health expenditure, Suriname and selected countries, 1995-2014 ................................................ 63
Figure 45: External health expenditure (EXT) as percentage of current health expenditure (CHE) and as percentage of GDP, Suriname, 2000-2016 ......... 64
List of Tables
Table 1: Employment and unemployment rate, Suriname, 2006 and 2016 ......................... 15
Table 2: Life expectancy at birth, Suriname and selected countries, 1995 and 2015 .......... 17
Table 3: Income elasticities of health expenditure, health expenditure as % of GDP, annual change in percentage points (pp), average annual and cumulative fiscal space ................................................................................. 43
Table 4: Suriname‟s excise tax structure, 2015 .................................................................... 56
Table 5: Sources of fiscal space for Suriname and recommendations ................................. 66

1
I. General background1 With the approval of the strategy for universal access to health and universal health
coverage (Res. CD53/5, Rev. 2) in the 53rd Directing Council of the Pan American Health
Organization (PAHO), the countries of the Americas Region committed to move forward
towards universal health, adopting the right to health, equity, and solidarity, as core values.
Through an integral approach, the strategy articulates the conditions that will allow
countries to focus and assess their policies and measure progress around four simultaneous,
interdependent strategic lines:
1. Expanding equitable access to comprehensive, quality, people- and community-
centered health services;
2. Strengthening stewardship and governance;
3. Increasing and improving financing with equity and efficiency, and advancing
toward the elimination of direct payments that constitute a barrier to access at
the point of service; and
4. Strengthening multisectoral coordination to address the social determinants of
health that ensure the sustainability of universal coverage.
PAHO‟s Department of Health Systems and Services (HSS) provides technical cooperation
within this framework for countries of the region. Always with the understanding that each
country has the capacity to establish its own action plan, taking into account its social,
economic, political, legal, historical, and cultural context, as well as current and future
health challenges.
Several countries are working on the implementation of a road map for universal health.
Within this effort, health financing is critical since a minimal level of resources should be
allocated to the health sector. This effort should be reflected in a fiscal prioritization of
health observed as an incremented weight of public health spending as a proportion of total
public spending. The goal of public expenditure on health equivalent to 6% of GDP is
mentioned in the third strategic line, as a useful benchmark in most cases. In this sense,
PAHO has started a line of work on the topic of fiscal space for health in an attempt to
1 This section is based on the Terms of Reference (TORs) of this consultancy.

2
analyze potential sources to increase public investment in health that could be considered as
policy options to sustain achievements in the direction of Universal health, including
priority programs.
According to the World Bank classification of countries, Suriname is an upper-middle
income country with a current per capita GDP of $int14,146 (current international dollars)2
that grew an average of 4.3 percent a year in the decade of 2004-2014. As many countries
of the Americas, with the end of the commodity boom the country started to experience
economic difficulties showing a GDP fall of 2.7% and 10.4% in 2015 and 2016,
respectively. These figures place Suriname as one of the worst performing countries in the
Region, even in a context of economic slowdown also shown by other countries. In terms
of health expenditure, the latest official data available show a total health expenditure of
5.7% of GDP and a public expenditure in health of 2.9% of GDP, both well below the
average of the Region (7.4% and 4.2% respectively).
A useful way to decompose the indicator of public expenditure in health as a percentage of
GDP is expressing it as the product of two factors:
1. Total Fiscal Capacity, expressed as total public expenditure as a percentage of GDP 2. Fiscal Priority to health, expressed as public expenditure in health as a percentage of
total public expenditure
Suriname shows a total fiscal capacity of 24.8% of GDP, with a fiscal priority for health of
11.8%. In the case of the second indicator, the country again is below the average of the
Region (13.6%) without even reaching an international benchmark of 15% set as a target
for African countries in the Abuja Declaration of 20013.
As mentioned in PAHO´s strategy for Universal Health it is imperative to “Increase and
optimize public financing for health in an appropriate, efficient, sustainable, and fiscally
responsible manner in order to expand access, reduce health inequities, increase financial
protection, and implement efficient interventions”. Also, a public expenditure on health
equivalent to 6% of GDP is a useful benchmark in most cases and is a necessary –though
2 Source: World Bank, World Development Indicators available on-line at: http://databank.worldbank.org/data/reports.aspx?source=2&country=SUR (accessed August 14, 2017). 3 For more information on the Abuja declaration refer to: http://www.who.int/healthsystems/publications/abuja_report_aug_2011.pdf?ua=1

3
not sufficient– condition to reduce inequities and increase financial protection within the
framework of universal access to health and universal health coverage. Current times in
Suriname are proving challenging for the government to advance in this direction,
highlighting the need to assess potential sources of funds for the health sector, taking into
consideration Suriname‟s context.
Suriname has gone through important policy reforms in the last years to advance in the
direction of Universal Health. In 2014 the Basic Health Care Insurance Act came into effect
with the aim of providing health insurance coverage for the population and intended to
improve access to services across all levels of care. In 2016, due to financial difficulties
shown by private insurance companies that managed part of the insurance scheme, the
management of this entire public scheme was transferred to the State Health Insurance
Foundation (SZF), currently covering around 75% of the population4.
The country‟s health sector is undergoing several financial challenges that were mentioned
by various health providers during several PAHO missions to the country: Hospitals, The
Regional Health Services (RGD), the Medical Mission and the public insurer, SZF. The
need for an increased allocation of resources to the health sector was also mentioned by
representatives of the Ministry of Health, but in the agreement that this must be
accompanied by a change in the model of care and in the organization of health services.
As a result, informing decision makers on potential options for increasing public funding
for health appears timely.
The present study aims at conducting an assessment of fiscal space for health in the
country, understanding fiscal space as “the availability of resources to finance an increase
in public spending without compromising the sustainability of the government's financial
position or the stability of the economy” (Heller, 2005a). The ultimate goal of the study is
to inform decision makers on the issue and to serve as an input in the dialogue between
different actors, specially between the Ministries of Health and Finance, on the need to
increase and improve financing with equity and efficiency.
4 Data provided by qualified informants during several PAHO missions.

4
1.1 Objectives
1.1.1 General objective The main objective is to identify the possible sources of additional financial resources for
the government to allocate to health.
1.1.2 Specific objectives The specific objectives are the following:
Describe the methods to estimate fiscal space;
Develop a method for the political viability analysis for each fiscal space source;
Identify information requirements;
Identify key players for the political viability analysis;
Estimate fiscal space for each source based on the available information;
Assess the political viability of each source; and
Discuss results and present recommendations.
II. General context
2.1 Population and social context
In 2015 Surinam had population of 553,204, where 49.8% are women (Figure 1). Its
population is also ethnically diverse, with the distribution of the main ethnic groups being:
Hindostani (27%); Maroon (22%); Creole (16%); Javanese (13%); and Mixed (13%). In
addition, indigenous Amerindian, most of whom live in the hinterland and hold much
historical, environmental and cultural significance for the country, comprise about 4% of
the population.

5
Figure 1: Suriname’s population pyramid, 2000 and 2015
Source: United Nations Population Division (2017).
Surinam has ten administrative districts, but its population is concentrated in the two urban
districts of Paramaribo and Wanica (66%). The remaining 34% is distributed among the
six coastal rural and the two hinterland districts. The hinterland districts of Brokopondo and
Sipaliwini, which comprise mainly Amerindian and Maroon villages, account for only 10%
of the country‟s population. The skewed population distribution is related to significant
disparities in living conditions among the urban, rural and hinterland areas.”
According to World Bank (2018) the poverty headcount ratio at $1.90 a day (2011 PPP)
was 23.4% of population in 1999 (latest year available), and 42.8% at $3.20 a day (2011
PPP). There is no official poverty data for Suriname. Suriname‟s Human Development
Index (HDI) has persistently improved since 2004 (Figure 2), with a drop in 2009 the year
of the international financial crisis. In 2017, Suriname‟s HDI was 0.720, slightly below
Jamaica (0.732) (Figure 2). In that year it was ranked 100th country out of 189 countries.
8 6 4 2 0 2 4 6 8
0 - 4 5 - 9
10 - 14 15 - 19 20 - 24 25 - 29 30 - 34 35 - 39 40 - 44 45 - 49 50 - 54 55 - 59 60 - 64 65 - 69 70 - 74 75 - 79
80 +
% of total poplationMales (2000) Females (2000)Males (2015) Females (2015)

6
Figure 2: Evolution of the human development index, Suriname and selected countries, 1990-2017
Source: UNDP (2018).
2.2 Macroeconomic overview
The world economy grew at a 3.0% rate in 2017, in comparison to the 2.4% rate in 2016
(United Nations, 2018). Latin America and the Caribbean (LAC) grew at a 1.0% rate in
2017 but is projected to grow at 2.0% and 2.5% in 2018 and 2019. But English-speaking
Caribbean economies do not fare as well. Countries like Suriname and Trinidad and
Tobago (commodity exporters) continue to contract, especially if China‟s economy slows
down.
United Nations (2018) projects that Caribbean countries will grow at a 1.8 and 2.0 rate in
2018 and 2019. But Suriname‟s projections are at 0.8% for 2018 and 2.2% in 2019.
According to Suriname Planning Bureau Foundation (2017) Suriname‟s economic growth
between 2012-2016 was mostly determined by prices of key commodities, especially gold
and oil. Suriname depends heavily on the mining sector (Caribbean Development Bank,
2014), where gold is the largest export product. Hence, when the world prices for gold and
0.8070.800
0.708
0.772
0.654
0.732
0.670.68
0.690.68
0.70 0.71
0.720
0.50
0.55
0.60
0.65
0.70
0.75
0.80
0.85
1990
1991
1992
1993
1994
1995
1996
1997
1998
1999
2000
2001
2002
2003
2004
2005
2006
2007
2008
2009
2010
2011
2012
2013
2014
2015
2016
2017
Hum
an D
evel
opm
ent I
ndex
(HDI
)
(54) Bahamas (58) Barbados (106) Belize (75) Grenada(125) Guyana (97) Jamaica (100) Suriname

7
oil fell in 2015 and 2016, this reduced government‟s income drastically, followed by
domestic consumption and public investments.
The public sector employs about 50% of the labor force, followed by agriculture with 11%
(Caribbean Development Bank, 2014).
Figure 3 shows real GDP per capita of Suriname, and six selected countries. The countries
for comparison were selected based on their region and the GDP per capita in 2016. Three
have higher GDP per capita, and three have lower. The Bahamas, although has the highest
GDP per capita it shows a permanent decreasing trend since 2002 with a significant drop
after the international financial crisis. The rest of the countries show an increasing trend,
including Suriname, except after 2014, its starts to fall.
Figure 3: Real GDP per capita (constant 2010 US$), Suriname and selected countries, 2000-2016
Source: World Bank (2018).
Figure 4 shows the annual growth rate. Suriname growth rate becomes negative (economic
contraction) in 2014 and continues to drop until 2016, unlike any other of the countries
considered.
0
5,000
10,000
15,000
20,000
25,000
30,000
2000 2001 2002 2003 2004 2005 2006 2007 2008 2009 2010 2011 2012 2013 2014 2015 2016
GDP
per c
apita
(con
stan
t 201
0 US$
)
Guyana Belize Jamaica Suriname
Grenada Barbados Bahamas, The

8
Figure 4: GDP annual growth, Suriname and selected countries, 2000-2016
Source: World Bank (2018).
According to IMF-WEO (2018) Suriname‟s lowest growth rate should be in 2016, and
become positive starting 2017 (Figure 5). According to the Suriname Planning Bureau
Foundation (2017) in 2017 Suriname grows by 0.9%, followed by 2.2% in 2018 and 1.2%
in 2019, 1.4% in 2020, and 2.2% in 2021.
-10
-5
0
5
10
15
2000 2001 2002 2003 2004 2005 2006 2007 2008 2009 2010 2011 2012 2013 2014 2015 2016
GDP
grow
th (a
nnua
l %)
Guyana Belize Jamaica Suriname
Grenada Barbados Bahamas, The

9
Figure 5: Real GDP annual growth projections (starting after 2016 and 2017), Suriname and selected countries, 2000-2022
Note: Projections start after 2016 for Belize, Jamaica, Suriname, and The Bahamas; and
they start after 2017 for Guyana, Grenada and Barbados. Source: IMF-WEO (2018).
The inflation rate reached 55.5% in 2016 then dropped to 22.3 in 2017 after a period f 4.3%
between 2012-2015. According to IMF (2017) the loss in public revenue was due to the
decision to freeze fuel pump prices and subsidize electricity prices. Local currency assets
left the country, depreciating the currency. Oof (2016) warned that for Suriname to return
to a sustained path for economic growth and development it needed a health
macroeconomic policy with price stability.
There is limited information regarding the immigration profile of Suriname (IOM, 2015). In
the 2015 report, in the period 2003-2012 the Central Bureau for Citizens Affairs of
Suriname reported 4,571 people had emigrated, while the Central Bureau of Statistics of the
Netherlands register 23,926 Surinamese immigrants. The top three countries where
Surinamese choose to migrate are the Netherlands, France and the US.
Unlike other countries in the region, Suriname does not seem to depend on remittances
according to data from the World Bank (Figure 6). Other sources estimated that
-10
-5
0
5
10
15
20
25
30
2000
2001
2002
2003
2004
2005
2006
2007
2008
2009
2010
2011
2012
2013
2014
2015
2016
2017
2018
2019
2020
2021
2022
GDP
grow
th (a
nnua
l %)
Guyana Belize Jamaica SurinameGrenada Barbados The Bahamas
-10
-5
0
5
10
15
20
25
30
2000
2001
2002
2003
2004
2005
2006
2007
2008
2009
2010
2011
2012
2013
2014
2015
2016
2017
2018
2019
2020
2021
2022
GDP
grow
th (a
nnua
l %)
Guyana Belize Jamaica SurinameGrenada Barbados The Bahamas

10
approximately 85% of remittances come from the Netherlands, and estimates for 2011 were
of USD 114 million, and in 2013 USD 113 million (IOM, 2015).
Figure 6: Personal remittances received as percentage of GDP, 2000-2016
Source: World Bank (2018).
There is limited public deficit (net lending/borrowing as percentage of GDP), or at least it is
only available until 2012 (Figure 7). By 2015, the public deficit reached almost -10% of
GDP, but the trend shows improvements starting as early as 2016.
0
5
10
15
20
25
30
2000 2001 2002 2003 2004 2005 2006 2007 2008 2009 2010 2011 2012 2013 2014 2015 2016
Pers
onal
rem
ittan
ces,
rece
ived
(% o
f GDP
)
Guyana Belize Jamaica SurinameGrenada Barbados Bahamas, The

11
Figure 7: General government revenue, expenditure, gross debt and net lending/borrowing as percentage of GDP, Suriname, 2000-2022
Source: (IMF-WEO, 2018).
In 2015, Suriname suffered the consequences of the drop in the prices of its key exports
(gold and oil) and the closure of the alumina production in late 2015 (IMF, 2016), which
translated into a hard drop in the government‟s revenues and expenditures (Figure 8).
Despite these challenges, the opening of a new oil refinery and a new gold mine are
considered in IMF estimates that will have a positive effect in the tax revenues, starting
2017.
-100
-50
0
50
100
150
200
250
300
350
-10
-5
0
5
10
15
20
25
30
35
2000
2001
2002
2003
2004
2005
2006
2007
2008
2009
2010
2011
2012
2013
2014
2015
2016
2017
2018
2019
2020
2021
2022
Gene
ral g
over
nmen
t gro
ss de
bt (%
GDP
)
Reve
nue,
expe
nditu
re an
d net
len
ding
/bor
rowi
ng (%
GDP
)
General government revenue General government total expenditureGeneral government net lending/borrowing General government gross debt

12
Figure 8: General government revenue and expenditure as percentage of GDP, Suriname and selected countries, 2000-2022
Note: Projections start after 2017. Source: IMF-WEO (2018).
0
5
10
15
20
25
30
35
2000
2001
2002
2003
2004
2005
2006
2007
2008
2009
2010
2011
2012
2013
2014
2015
2016
2017
2018
2019
2020
2021
2022
Gene
ral g
over
nmen
t rev
enue
(% of
GDP
)
Guyana Belize Jamaica SurinameGrenada The Bahamas Barbados
0
5
10
15
20
25
30
35
40
45
2000 2001 2002 2003 2004 2005 2006 2007 2008 2009 2010 2011 2012 2013 2014 2015 2016 2017 2018 2019 2020 2021 2022
Gene
ral g
over
nmen
t tota
l exp
endit
ure
(% o
f GDP
)
Guyana Belize JamaicaSuriname Grenada BarbadosThe Bahamas
0
5
10
15
20
25
30
35
2000
2001
2002
2003
2004
2005
2006
2007
2008
2009
2010
2011
2012
2013
2014
2015
2016
2017
2018
2019
2020
2021
2022
Gene
ral g
over
nmen
t rev
enue
(% of
GDP
)
Guyana Belize Jamaica SurinameGrenada The Bahamas Barbados

13
Figure 9: General government gross debt as percentage of GDP, Suriname and selected countries, 2000-2016
Note: Projections start after 2017. Source: IMF-WEO (2018)
Figure 10: Tax revenue as percentage of GDP, Suriname and selected countries, 2000-2016
Source: World Bank (2018).
0
20
40
60
80
100
120
140
160
180
2000
2001
2002
2003
2004
2005
2006
2007
2008
2009
2010
2011
2012
2013
2014
2015
2016
2017
2018
2019
2020
2021
2022
Gene
ral g
over
nmen
t gro
ss de
bt (%
of G
DP)
Guyana Belize Jamaica SurinameGrenada The Bahamas Barbados
0
5
10
15
20
25
30
35
2000 2001 2002 2003 2004 2005 2006 2007 2008 2009 2010 2011 2012 2013 2014 2015 2016
Tax r
even
ue(%
of G
DP)
Guyana Belize Jamaica SurinameGrenada Barbados Bahamas, The
0
20
40
60
80
100
120
140
160
180
2000
2001
2002
2003
2004
2005
2006
2007
2008
2009
2010
2011
2012
2013
2014
2015
2016
2017
2018
2019
2020
2021
2022
Gene
ral g
over
nmen
t gro
ss de
bt (%
of G
DP)
Guyana Belize Jamaica SurinameGrenada The Bahamas Barbados

14
The economic context also translated into the employment numbers. In the last years,
employability dropped from 50.6% in 2012 to 49.6% in 2017 (with IMF estimates for
2017). During this same period, the unemployment rate rose.
Figure 11: Tax revenue as percentage of GDP, Suriname and selected countries, 2000-2016
Source: World Bank (2018).
Suriname‟s labor force participation rate is the lowest among the selected countries. Its
distributions is with 69.3% in services, 19.5% in industry and 11.2% in agriculture (IMF,
2014b).
According to IMF (2014b) Suriname may come from high dependence for growth of the
extractive sector. The formal extractive sector is capital intensive and with moderate impact
on job creation. However, the increase in the price of gold in recent years may have
contributed to higher informal employment in the gold-mining sector and lower official
labor force participation. Nonetheless, uncertain prices of Suriname‟s export commodities
weigh on the employment outlook in the extractive sector. Labor-intensive sectors such as
services, agriculture, and construction together with government account for the bulk of
employment. However, growth has slowed in the agriculture sector, which is confronted
with increased competition from other Latin American countries, and there are limits to
increasing government employment.
0
5
10
15
20
25
30
35
2000 2001 2002 2003 2004 2005 2006 2007 2008 2009 2010 2011 2012 2013 2014 2015 2016
Tax r
even
ue(%
of G
DP)
Guyana Belize Jamaica SurinameGrenada Barbados Bahamas, The

15
Figure 12: Participation rate as percentage of population ages 15+, 2000-2017
Source: World Bank (2018).
Table 1: Employment and unemployment rate, Suriname, 2006 and 2016
Year Employment as a share of population
aged 15 years and above Unemployment rate % Annual % change % Annual % change
2006 49.3 12.3 2007 49.2 -0.2 10.7 -13.0 2008 45.5 -7.5 9.4 -12.1 2009 48.8 7.3 8.7 -7.4 2010 49.7 1.8 7.6 -12.6 2011 50.1 0.8 8.0 5.3 2012 50.6 1.0 8.0 0.0 2013 51.5 1.8 6.0 -25.0 2014 50.4 -2.1 7.0 16.7 2015 50.3 -0.2 8.3 18.6 2016 49.8 -1.0 11.0 32.5 2017 49.6 -0.4 9.1 -17.3 Source: IMF
0
10
20
30
40
50
60
70
80
2000 2001 2002 2003 2004 2005 2006 2007 2008 2009 2010 2011 2012 2013 2014 2015 2016 2017
Labo
r for
ce pa
rticip
ation
rate
(% o
f tot
al po
pulat
ion a
ges 1
5+)
(mod
eled I
LO es
timat
e)
Guyana Belize Jamaica SurinameGrenada Barbados Bahamas, The
16
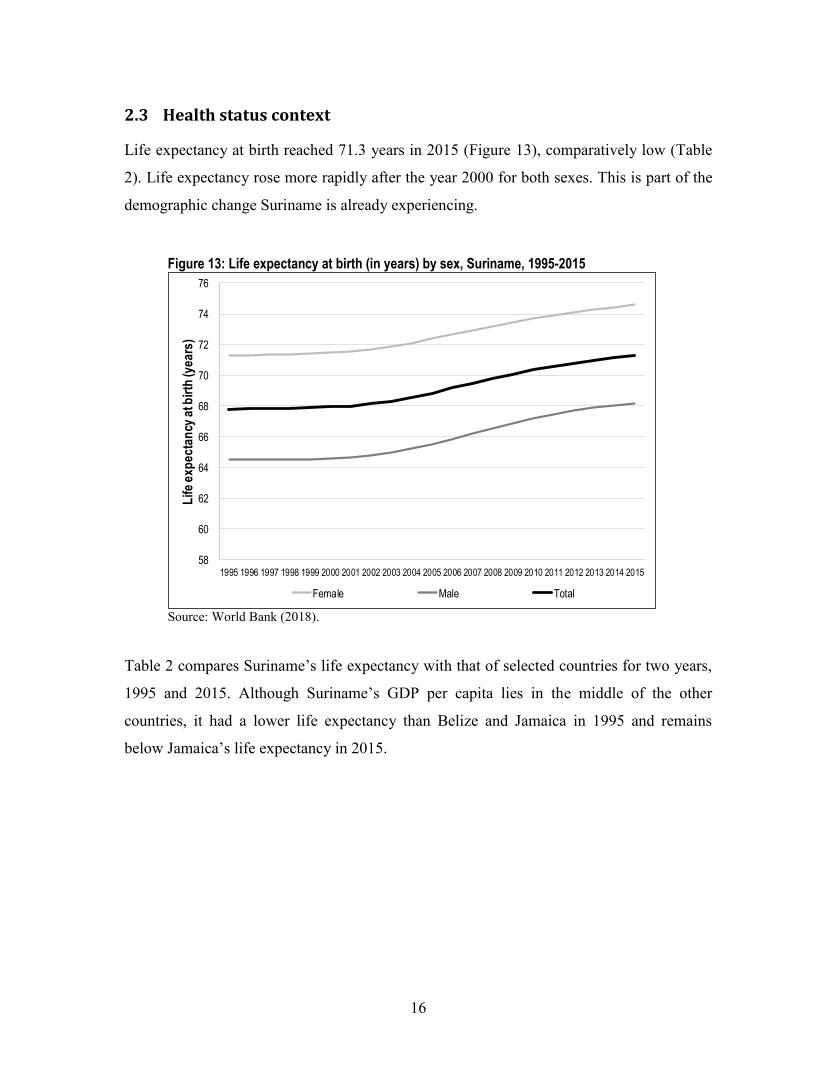
2.3 Health status context
Life expectancy at birth reached 71.3 years in 2015 (Figure 13), comparatively low (Table
2). Life expectancy rose more rapidly after the year 2000 for both sexes. This is part of the
demographic change Suriname is already experiencing.
Figure 13: Life expectancy at birth (in years) by sex, Suriname, 1995-2015
Source: World Bank (2018).
Table 2 compares Suriname‟s life expectancy with that of selected countries for two years,
1995 and 2015. Although Suriname‟s GDP per capita lies in the middle of the other
countries, it had a lower life expectancy than Belize and Jamaica in 1995 and remains
below Jamaica‟s life expectancy in 2015.
58
60
62
64
66
68
70
72
74
76
1995 1996 1997 1998 1999 2000 2001 2002 2003 2004 2005 2006 2007 2008 2009 2010 2011 2012 2013 2014 2015
Life
expe
ctan
cy at
birth
(yea
rs)
Female Male Total

17
Table 2: Life expectancy at birth, Suriname and selected countries, 1995 and 2015
Country 1995 2015 Change in years Guyana 64.1 66.5 2.4 Belize 69.6 70.3 0.7 Jamaica 71.9 75.8 3.9 Suriname 67.8 71.3 3.5 Grenada 69.3 73.5 4.2 Barbados 72.3 75.6 3.4 Bahamas, The 71.3 75.4 4.1 Source: World Bank (2018).
In the PAHO (2016) the burden of disease measured by number of disability adjusted life-
years (DALYs) in 2010 was 168,200, where 58% was from non-communicable diseases,
followed by 27% of communicable, maternal, neonatal, and nutritional disorders, and 15%
from injuries. The risk factors identified were dietary risks, high blood pressure and high
body-mass index.
Following the efforts around the world to reach the Millennium Development Goals in
2015, Suriname was able to lower the mortality rates associated with children (neonatal,
infant and under five years of age) between 1990 and 2015 (Figure 14). The same cannot be
said about the maternal mortality ratio (MMR) that rose between 1990 and 2002 from 127
to 271 deaths per 100,000 live births, respectively. Although after 2002 the MMR started
decreasing, until 2015 it still remained above the 1990 rate.

18
Figure 14: Neonatal, infant and children under 5 years of age per 1,000 live births and maternal mortality ratio per 100,000 live births, 1990-2016
Note: NMR: Neonatal mortality rate; IMR: Infant mortality rate; U5MR: Children
under 5 years of age; MMR: Maternal mortality ratio Source: World Bank (2018).
Figure 15 compares Suriname‟s the maternal mortality ratio with those of selected
countries. Suriname only performs better in this indicator when compared to Guyana,
which has a much lower GDP per capita.
22.2
10.6
39.8
17.8
46.4
20.0
127
155
0
50
100
150
200
250
300
0
10
20
30
40
50
60
1990
1991
1992
1993
1994
1995
1996
1997
1998
1999
2000
2001
2002
2003
2004
2005
2006
2007
2008
2009
2010
2011
2012
2013
2014
2015
2016
Mat
erna
l mor
talit
y rat
io(1
00,0
00 liv
e bi
rths)
NMR,
IMR,
U5M
R(p
er 1,
000 l
ive b
irths
)
NMR IMR U5MR MMR (right axis)

19
Figure 15: Maternal mortality ratio per 100,000 live births, Suriname and selected countries, 1990-2015
Source: World Bank (2018).
But, when analyzing access to prenatal care (Figure 16), Suriname reaches over 90% of
pregnant women, which should not be considered a low coverage level. Regardless,
compared to the selected countries, Suriname should aim at expanding access to prenatal
care which is associated with lower maternal mortality.
0
50
100
150
200
250
300
Mate
rnal
mor
tality
ratio
(per
100,0
00 liv
e birt
hs)
Guyana Belize Jamaica SurinameGrenada Barbados Bahamas, The

20
Figure 16: Pregnant women receiving prenatal care as percentage of total pregnant women, Suriname and selected countries, 2000-2014
Source: World Bank (2018).
In fact, Figure 17 shows that although coverage of births attended by skilled health staff in
Suriname also reaches 90% of total births but remains well below the other countries in the
region.
91 90 90 90 91
65
70
75
80
85
90
95
100
2000 2001 2002 2003 2004 2005 2006 2007 2008 2009 2010 2011 2012 2013 2014 2015
Preg
nant
wom
en re
ceivi
ng pr
enat
al ca
re(%
of t
otal)
Guyana Belize Jamaica SurinameGrenada Barbados Bahamas, The

21
Figure 17: Births attended by skilled health staff as percentage of total births, Suriname and selected countries, 2000-2014
Source: World Bank (2018).
Like the other countries in the region, Suriname is facing the epidemiological change of a
rising participation of non-communicable diseases as cause of death (Figure 18). In 2015,
non-communicable diseases represented three-quarters of the deaths, similar to The
Bahamas.
70.9
90.0 90.0
86.5
90.0
70
75
80
85
90
95
100
2000 2001 2002 2003 2004 2005 2006 2007 2008 2009 2010 2011 2012 2013 2014
Birth
s atte
nded
by s
kille
d he
alth
staf
f(%
of t
otal)
Guyana Belize Jamaica SurinameGrenada Barbados Bahamas, The

22
Figure 18: Distribution of causes of death (percentage of total), Suriname and selected countries, 2000 and 2015
Source: World Bank (2018).
2.4 Health sector overview
Larye, Goede, and Barten (2015) a review of the Surinamese health sector. Some of the key
points are that the individuals‟ right to health is clear in the constitution. The Ministry of
Health (MoH) leads the state‟s effort to protect the public health. As such, the primary tasks
of the MoH include: 1) management of human and material resources, including
pharmaceuticals and other medical supplies; 2) supervision of health institutions; 3)
oversight of medical practice; and 4) monitoring compliance with legislation related to the
environment and human health (Larye et al., 2015).
In their description (Larye et al., 2015), the MoH, through the Bureau of Public Health
(BOG, per its name in Dutch) delivers and coordinates population-based programs for
prevention and treatment of specific diseases. It also promotes the well-being of
communities. On the other hand, the Regional Health Service (RDG, per its name in Dutch)
provides preventative and health care at publicly funded clinics. RGD polyclinics offer a
wide range of outpatient services, including diagnostics. Access to these polyclinics
28.6
19.7
18.6
17.6
14.7
11.4
25.3
59.4 64
.6
73.4
69.9
80.4 85
.1
64.6
12.0 15
.6
8.0
12.3
4.8 3.4
10.1
20.3
18.0
11.6 13
.5
13.3
13.3 17
.1
67.1
66.3
78.8
75.0 80
.7 82.7
73.9
12.6 15
.5
9.5 11.3
6.0 4.0
8.9
0
10
20
30
40
50
60
70
80
90
Guya
na
Beliz
e
Jama
ica
Surin
ame
Gren
ada
Barb
ados
Baha
mas,
The
Guya
na
Beliz
e
Jama
ica
Surin
ame
Gren
ada
Barb
ados
Baha
mas,
The
Guya
na
Beliz
e
Jama
ica
Surin
ame
Gren
ada
Barb
ados
Baha
mas,
The
Communicable diseases and maternal,prenatal and nutrition conditions
Non-communicable diseases Injury
Perc
enta
je of
tota
l
2000 2015

23
includes coastal population, poor and “near-poor” identified by the Ministry of Social
Affairs (MSA).
The more urbanized areas in the coastal regions, the general practitioners (GPs) operate
private clinics. Service payment at these providers are from private insurance or out-of-
pocket payments. In the more rural areas in the interior regional, Medical Missions (MZ,
per its name in Dutch) are non-governmental organization (NGOs) provide primary health
care services.
Figure 19 shows an overview of the health system as discussed with experts in 2011
(Giovanella, Feo, Faria, & Tobar, 2012; MOH, 2011). The Ministry of Finance collects
taxes, allocates budgetary resources to the MOH and it also managed SZF‟s contributions.
Figure 19: Overview of payers, providers and beneficiaries of the health system, 2011
Note: The dashed line represents the option of individuals to get health insurance coverage from SZF. For
further details, see the sources below. Source: Giovanella et al. (2012); MOH (2011)
In November 2017, after the implementation of the 2014, Suriname‟s health sector
financing changed to what is shown in Figure 20. SZF became a single fund for the
Surinamese population. Although, the financing still comes from different subsectors.
Ministry of Finance
Governmental Institutions
Companies /individuals
Out of pocket payers individuals
Out of pocket payers companies
Ministry of Defense and
Ministry of Justice and Police
Ministry of Social Affairs and Housing
Ministry of HealthState Health Insurance
Foundation
Private insurance firms
PHC, Hospitals, Laboratories, etc.
RGD, Hospitals, Laboratories, etc.
MZ PHC, Hospitals, Labs, PCS, RGD, JTV,
COVAB, BTD, etc.
GPs, RGD GPs, MZ GPs, Hospital,
Labs, etc.
GPs, RGD GPs, MZ GPs, Hospital,
Labs, etc.
GPs, RGD GPs, MZ GPs, Hospital,
Labs, etc.
Company clinic with company GP, Hospital, Labs, etc.
Employees andfamilies
Poor and near-poor in the coastal
area
Persons in the Hinterland with MZ
card
Public employees and dependents,
company employees and
dependents, private individuals
Company employees and
dependents, private individuals
with insurance plans
Individuals with noinsurance
Company employee with
access to company clinic
PAYE
RSPR
OVI
DERS
BEN
EFIC
IARI
ES

24
Figure 20: Suriname’s health sector financing
Source: Author based on interviews in Suriname.
2.4.1 System Resources In the case of health workers, according to the World Health Organization (WHO), a
country requires a minimum of 10 physicians per 10,000 inhabitants and 25 health workers
(physicians, nurses and obstetricians) per 10,000 inhabitants. In Suriname, the ratio was
about 8 physicians in 2004. In the case of health workers, the ratio was 61 per 10,000
inhabitants in 2004. Yet, in the last years the government has subsidized the education of
physicians that work in the public sector. Despite this effort, health workers are mainly
concentrated in the coastal urban areas, particularly in Paramaribo.
According to PAHO (2017):
“It has been the policy of successive governments to scale up the number of health
workers to address shortages. Concrete measures in training and education are under
way. Between 2013 and 2015, enrollment doubled in the Medical Faculty of the
Anton de Kom University of Suriname (29). In 2013, the Ministry of Health
approved the development of a residency training program in family medicine and a
revolving fund was established to support residents to continue their training abroad
(mainly in the Netherlands). The Central Institute for Training in Nursing and Allied
Professions (COVAB) (30) has increased specialized training for geriatric, diabetes,
SZF
Public employees 0 - 16 60 +Private
coverage 17 – 59
MOF Ministry of Home AffairsHousehold
Ministry of Social Affairs
8%salary
4% salary
Market premium Tariff(8 age
brackets) Tariff Law (2014)
Hospitals Medical doctors
Medical Mission DrugsSpecialized
doctorsDiagnostic
examsRGD
SRD 165/person

25
and dialysis nursing. Accredited courses for doctors, nurses, and other health
professionals have been provided by the Foundation for Continuing Education of
Medical Professionals (SPAOGS) for the past 10 years (31). In 2013, the Scientific
Research Center of the Academic Hospital Paramaribo was established to improve
research capacity among health workers (32).”
In terms of health infrastructure, according to MOH (2011) the installed capacity in 2011
was:
- 56 MZ primary health clinics and health posts
- 43 RGD Health Care Facilities
- 146 private clinics
- 5 hospitals 2 private and 3 public and 1 Psychiatric Hospital
- 40 dental units located in 26 of the RGD clinics
- 3 private medical laboratories and one medical laboratory in every hospital
- 10 retirement homes and two small nursing homes
The National Plan (MOH, 2011) also new investments in infrastructure. PAHO (2017)
reports the same 43 PHC clinics in the coastal area (RGD Health Care Facilities) and 56
MZ clinics.
2.4.2 Financing The total health expenditure (THE) in Suriname is below The Bahamas and Barbados, but
higher than the other selected countries. THE is important to the extent it is an indicator of
the investment on health which is in turn associated with the well-being of the population
and economic growth (Hernández & Poulliler, 2007).

26
Figure 21: THE per capita (int$, PPP, constant 2011), Suriname and selected countries, 1995-2014
Source: World Bank (2018).
Suriname is classified as a high-middle income country and its THE as a percentage of
GDP was 5.7% in 2014, and as shown in Figure 21, its per capita health expenditure is at
int$ 979. The distribution of health spending shows that 36.6% of the expenditure is made
by the government, 15% is social security expenses, 12% is out-of-pocket (OOP) expenses
and 36.4% is other private expenses (expense in insurance premiums). The health insurance
of the population is the mechanism that predominates in the financing of health, which
generates low out-of-pocket spending of households and effective financial protection.
According to the National Health Accounts 2006, health expenditure was focused on
curative care while the first level of care received the lowest allocation of monies: hospitals
35.0%, followed by private general practitioners with 12.6%, pharmaceuticals 11.5%,
medical specialists 9.2%, laboratory services 4.8%, dentists 3.9% and the RGD 3.3%
(MOH, 2011).
379
489476
979728
1,014
1,819
0
200
400
600
800
1,000
1,200
1,400
1,600
1,800
2,000
1995 1996 1997 1998 1999 2000 2001 2002 2003 2004 2005 2006 2007 2008 2009 2010 2011 2012 2013 2014
Tota
l hea
lth ex
pend
iture
per c
apita
(int$
, PPP
,cons
tant
2011
)
Guyana Belize Jamaica SurinameGrenada Barbados Bahamas, The

27
Figure 22: Distribution of health expenditure by sources, 2000-2015
Source: WHO (2018).
Comparing to the selected countries, Suriname has managed to maintain an OOP below
20% of total health expenditure with high private insurance and public spending that
finances SZF for the “the poor and near-poor”. According to Kromodihardjo (2018) SZF
covered 151,891 in 2015 (29% of the population) and in 2018 it reached 351,870 (64% of
the population).
Public spending is essential to improve equity. Low-income people would be able to
allocate their resources to other basic needs instead of spending on health. If the financing
is insufficient and the benefits package does not cover all the basic health needs, inequities
towards the most disadvantaged will prevail.
Figure 23 shows the combination of OOP expenditure and general government health
expenditure (GGHE) for Suriname and selected countries in four years. Considering that
when OOP as percentage of THE rises above 20% the risk of incurring catastrophic health
expenditures rises (Xu et al., 2010), it is a policy goal to reduce the participation of OOP in
THE. On the other hand, according to Xu et al. (2010), the countries that had reached
universal health coverage had at least a GGHE of 5-6% of GDP. Therefore, health
34.424.6 25.3 22.8 21.2 19.0
31.6 31.2 33.3 35.5 34.7 36.3 38.1 37.0 36.6
17.6
20.2 16.4 16.9 16.9 18.5
18.8 20.3 16.0 17.4 16.3 14.3 14.5 15.9 15.0
15.420.5
18.1 17.0 15.9 15.3
11.4 11.9 12.6 11.5 11.9 12.1 11.6 11.7 12.0
32.7 34.7 40.3 43.3 46.0 47.238.1 36.5 38.1 35.6 37.0 37.3 35.8 35.5 36.4
0
10
20
30
40
50
60
70
80
90
100
2000 2001 2002 2003 2004 2005 2006 2007 2008 2009 2010 2011 2012 2013 2014
Perc
enta
ge of
tota
l hea
lth ex
pend
iture
GHE SSHE OOP OPvHE

28
financing policies should move towards the lower right quadrant (OOP<20% of THE and
GGHE>6% of GDP).
Figure 23: General government health expenditure versus out-of-pocket health expenditure, Suriname and selected countries, 2000, 2005, 2010 and 2015
Note: The year 2000 is represented as a lighter color of the series. Source: WHO (2018).
The selected countries have an OOP expenditure above the desired level, and a GGHE
below the desired level in all four years. From the year 2000 to 2015 most try to move
towards lowering OOP and raising GGHE, the figure clearly shows the challenges.
Suriname, on the other hand, stands out as always have an OOP below 20% of THE.
Although in 2005 and 2010 GGHE dropped it increased in 2015, but not to the level of the
year 2000.
0
10
20
30
40
50
60
70
0 1 2 3 4 5 6 7 8
Out-o
f-poc
ket e
xpen
ditur
e (%
THE)
GGHE (% GDP)Guyana Belize Jamaica Suriname Grenada
Barbados Bahamas OOP < 20% GGHE > 6%

29
2.4.3 Health policies The National Health Sector Plan (NHSP) 2011-2018 (MOH, 2011) addresses three strategic
areas of intervention: i) prevention and reduction of the burden of non-communicable
diseases, communicable diseases, mental diseases, and health over the life course; ii) for
health systems and services delivery prioritize leadership, stewardship and governance,
health financing, human resources for health, health services, improving ha health
information systems, and pharmaceutical and new technologies; iii) for determinants of
health emphasis on environmental and occupational health, social and economic
determinants of health, and emergencies and disasters.
In the case of health financing it states “Health financing policy requires decisions on how
to raise funds, how to pool them, and how to use them equitably and efficiently.” (MOH,
2011). The NHSP 2011-2018 called for assessments to increase resources but at the same
time it acknowledges the need to make decisions about service priorities including service
realignments and moving resources to where they will do the most good.
A milestone in health policy was the passing of the Basic Health Insurance Law in 2014.
According to PAHO (2017) this law ensures that “every resident has “access to basic health
insurance.” According to the Law, the government subsidizes children under 16, those over
age 60, and pregnant women (ILO, 2014). Employees pay up to 50% of the premium and
employers cover the other half; the government pays the coverage of those unable to pay.
The basic health care package includes access to primary health care services, secondary
care, and a defined package of tertiary services (e.g., oncology, renal dialysis, cardiology,
and surgery). The law sets payment caps for specialized services such as renal dialysis,
MRI, cancer medication, etc. This limits accessibility to the full treatment course for some
diseases, forcing patients and their families to spend considerable amounts of money to
initiate or continue lifesaving treatments (PAHO, 2017).
The social security system underwent an important reform in 2014. The transformation of
SZF implied a social insurance model that overlaps with what used to be the Ministry of
Social Affairs (MSA) public health insurance.
In 2016, WHO and the government of Suriname set as a key policy:

30
“Health system’s organization and management - may cause the system to
perform below its potential for reducing health inequities due to e.g.: fragmentation,
weak administrative and managerial capacity. Proposed policy options include:
Enhanced and coherent coordination of the different subsystems of the national
health system; enhanced evidence-based managerial effectiveness towards health
inequity reduction goals; enforcing Primary Health Care (PHC), including
intersectoral action, referral system, telemedicine and the integration of preventive
services.”
The concern to improve equitable access of the population to health is on the agenda of the
country and the health financing policy is consistent with this purpose. The need to achieve
greater efficiency in the system and in general to achieve the right to health is highlighted.
III. Fiscal space conceptual framework, methods and data Heller (2006) provides this definition of fiscal space:
“the capacity of government to provide additional budgetary resources for a desired
purpose without any prejudice to the sustainability of its financial position”.
This definition highlights two key issues: first, fiscal space means additional resources,
which means new resources; second, fiscal space has an upper bound defined by the
financial sustainability of those resources in time.
Tandon and Cashin (2010) provide the following definition of fiscal space for health:
“the ability of governments to increase spending for the sector without jeopardizing
the government‟s long-term solvency or crowding out expenditure in other sectors
needed to achieve other development objectives.”
When analyzing and estimating fiscal space, it is important to understand all the
components of health expenditure and of public health expenditure. For example, total
health expenditure (THE) includes both private and public spending. We breakdown these
components below.

31
Private health expenditure (PvHE) includes out-of-pocket health expenditure (OOP) and
other private spending. OOP is what households spend when they receive care.5 This
includes physician‟s fees, hospital fees, drugs purchased, etc. In case there is some health
insurance coverage, OOP should be net of any reimbursements. OOP is the most inefficient
and inequitable way of spending for health. Demand for health care, or health service
seeking behavior, should be based on need for care and not on the household‟s ability to
pay. To the extent people hold back their demand for care, the health problem could get
worse and later require more or more expensive services. From the equity point of view, if
demand depends on the household‟s ability to pay, higher income households will demand
and receive more care than lower income households, making it inequitable.
Public health expenditure or general government health expenditure (GGHE) includes:
social security health expenditure (SSHE) and government health expenditure (GHE).
SSHE resources come from mandatory contributions that are linked to formal workers,
while GHE resources come from general taxes. So, in this context, general government
includes the public institution that manages social security contributions for health. These
resources may only be used for it social security beneficiaries. In some circumstances social
security funds may also be complemented with public resources (from general taxation).
Tandon and Cashin (2010) present their fiscal space analysis based on the government‟s
intertemporal budget constraint. The left-hand side represents the use of public resources in
all sectors, while the right-hand side represents the sources of public resources. The
equation is:
Where:
:
5 See Xu (2005) for a more detailed explanation.

32
They also consider the fact that within the public sector, the health sector also faces another
constraint set by the government‟s priorities. The priority for health can be expressed as:
Where,
The government‟s priority for health is represented by kt. An important issue is that kt can
either be fixed or vary. An analysis of overall government‟s fiscal space implies changes in
Gt; while an analysis of reprioritization implies changes in kt.
Social security health expenditure could be represented as:
Where,
The formulas above provide a general framework for fiscal space analysis.
Heller (2005b, 2006) describes six sources for fiscal space: 1) reprioritization of health
sector spending; 2) efficiency gains; 3) raising revenue; 4) borrowing (from internal and
foreign sources); 5) foreign aid; y 6) monetary expansion (seigniorage or inflation).
Heller (2006) discusses limitations or key considerations associated with these sources. For
example, increasing foreign debt or foreign aid could have a negative macroeconomic
impact through the exchange rate.6 This is an example of how the analysis of each source
must include the possible impacts it may have on other areas.
6 An inflow of foreign resources increases the supply of foreign currency which con decrease the Exchange rate making Suriname‟s exports more expensive, imports cheaper, resulting in a negative impact on Surinam‟s

33
Another key issue Heller (2006) emphasizes is that the creation of fiscal space must be
analyzed within a financial sustainability framework. The very definition of fiscal space is
subject to not compromising financial sustainability. Financial sustainability implies the
ability of the government to finance its programs and to comply with debt payments in the
future. This means that the creation of fiscal space must consider the following:
1) A rise in expenditure in the short and long run must be financed with revenues in
the short and long run;
2) The analysis of the programs that require financing must include the implications in
the medium term; and
3) The medium-term analysis must consider the government‟s priorities in the medium
term.
Hence, a complete fiscal space analysis must include:
1) The program that requires financing is a one-time expenditure. For example,
training of human resources in the public sector could be a one-time only
commitment.
2) The program does imply new expenditure commitments in the future. For example,
building a hospital commits the government to later finance the necessary
equipment, personnel, and maintenance.
3) The program has impacts on other sectors. For example, financing a raise in salaries
of health sector personnel (physicians, nurses and others) could put pressure on the
government to raise salaries in other sector, i.e., education (teachers).
In what follows, we discuss the basic condition for fiscal space, i.e., economic growth and
stability, followed by a conceptual framework for each of the main space sources.
3.1 Basic condition: Economic growth and stability
Economic growth is a necessary (but not sufficient) condition for the creation of fiscal
space (FS) (Heller, 2005a, 2005b, 2006). Macroeconomic policy should aim at achieving
economic growth and stability. International organizations, like the International Monetary
trade account. This in turn has a negative impact on the aggregate demand and a slowdown in the economy. If the new resources are partially spent on imports this could decrease the impact on the exchange rate.

34
Fund (IMF), work with countries to define basic conditions to reach these goals. Lack of
compliance with these types of commitments could affect the flow of foreign aid and loans
(Heller, 2006).
In some studies, economic growth was considered as a source of fiscal space. In this
analysis, we consider economic growth as a basic necessary condition, because it is an
endogenous variable of the economy on health expenditure, this means it is not a specific
policy to create fiscal space. Also, growth itself does not generate more resources, it must
also be stable in time.
Although GHE as a percentage of GDP could rise whether GDP rises or not, Heller (2006)
limits the creation of fiscal space to the economic sustainability and stability. This is
equivalent to assuming a sound economic situation. Hence, growth does not need to be
extraordinary, only stable (Durán-Valverde & Pacheco, 2012).
We measure the relationship between a sustained growth in GDP and GHE using the
expenditure-revenue (measured as GDP) elasticity using the equation:
If the elasticity is greater than one implies an increase in GHE, values less than one implies
a decrease in the GHE as percentage of GDP. When the elasticity is equal to one, the
changes in GHE follow the changes in GDP, i.e., kt is constant, and hence GHE as
percentage to GDP stays the same. So, if GDP increases by 5%, GHE also increases by 5%.
We use the World Bank (2018) series to compute the expenditure-revenue elasticity of
GHE. The GDP series is available for the period 1960-2015. Although generally it is
preferable to use the same source for the projection, the WB does not provide GDP
projections. We use IMF‟s GDP projections which are available until 2022 (IMF-WEO,
2018).
3.2 New revenues
Fiscal space generated from new revenues refers to the changes in policies that generate
revenues by sector. In the case of GHE, it refers to the revenues the government generates

35
through tax collections. In the case of SSHE it refers to contributions to social security for
health. We break down these sources below.
3.2.1 Taxes Tax revenues are based on the tax base, the tax rate, and the tax collection management.
Tax collection also depends on economic growth, although we consider the rise in income
due to economic growth is considered as an endogenous effect in this analysis (see section
3.1).
In this section we discuss the tools to create fiscal space with exogenous changes. For
example, changes in a tax rate on personal income, expanding the tax base for a specific
tax, changes in the management of tax collection or creating a new tax.
Direct taxes refer to taxes on income, while indirect taxes are taxes on consumption (i.e.,
value-added tax or VAT). There are also taxes that target the consumption of some specific
good or service, which the literature denominates “sin taxes”. This is the case of taxes on
gambling, tobacco, alcoholic beverages, sugar or processed foods. Some countries choose
to allocate revenues generated from these taxes to specific sector. For example, to the
extent that the health sector bears the burden of tobacco consumption, the revenues from
the tobacco tax could be allocated to the health sector. This means that the government is
earmarking the collection of this tax.
Some studies argue that the size of the informal sector in the labor market also has an
impact on the ability to collect taxes (Durán-Valverde & Pacheco, 2012; Gordon & Li,
2009; Rao & Seth, 2009; Tandon & Cashin, 2010). We discuss informal workers in the next
section.
3.2.2 Social security contributions for health Social security for health is generally a fund generated by contributions from employers
and/or workers and the funds may only be used to finance health services for social security
beneficiaries. Beneficiaries may be only the workers, and, in some cases, beneficiaries may
include workers‟ families.
Tandon and Cashin (2010) link the level of contributions to the proportion of workers in the
formal sector, salaries, poverty rates, average family size and the dependence rate. As in the

36
case of taxes, the tools to generate changes in revenues from contributions are changes in
the contribution rates or implementing policies to raise formality. Expanding coverage does
not to family members only raises expenditures without accompanying it with the
equivalent rise in revenues. In any case, contribution rates should be determined by
actuarial studies so that they cover the expected expenditure of the service coverage
provided.
3.3 Efficiency gains
Improving efficiency in the public spending also creates fiscal space (Heller, 2005a, 2005b,
2006; Tandon & Cashin, 2010). It is important to point out that this source does not
increase government revenues, it only reflects a better way of spending the limited
resources. In terms of creating fiscal space, it means doing the same with less resources, in
such a way, that resources become available for the health sector.
Efficiency gains do not have to come from the health sector, it could be obtained from any
sector. Studies propose different ways to improve efficiency in public spending, including:
Policies that reduce corruption;
Policies that improve governance;
Improve the coordination and conditions of foreign aid; and
Improve the execution of public spending.
When efficiency gains are specific to the health sector, it may keep those gains within the
sector as its own fiscal space. The argument for allocating efficiency gains from other
sectors to the health sector, could be trickier and requires political support.
There are different ways the health sector could improve its efficiency. For example, the
provider payment mechanisms have different incentives for efficiency. A fee-for-service
payment could provide an incentive towards overuse of services. A per capita payment
transfers the risk to the provider and provides an incentive towards more use of preventive
care, which could be more cost-effective (efficient).
We base our analysis of efficiency gains either on studies that estimate efficiency gains in
Suriname or from general estimates available. This limits the scope of this analysis.

37
3.4 Reprioritization of health expenditure
Reprioritization, by definition, does not generate new resources. It changes the allocation of
existing resources by changing the criteria for prioritization. Tandon and Cashin (2010) link
the priority of the health sector to the country‟s income level. Countries with higher
income, give the health sector a higher priority.
Any sector‟s priority can be measured as its participation in the general governments
expenditure. Reprioritization can occur in two ways: reducing the resources allocated to a
sector and reallocating them to the health sector; or allocating more to the health sector
when new resources become available.
Heller (2005b, 2006) argues that reprioritization should imply a reduction of inefficient or
unproductive programs. This criterium should not be confused with improving efficiency. It
does not imply being more efficient, it simply eliminates inefficient or unproductive
programs or activities. Implicit to this source of fiscal space is the need for assessments of
programs regarding their effectiveness and the attainment of goals.
3.5 Foreign aid
Foreign aid is an important source for fiscal space in line with the Millennium
Development Goals (MDGs) and now the Sustainable Development Goals (SDGs). A key
issue is the sustainability and predictability of the future flows of foreign aid. Short-term
commitments must be accompanied by an assessment of future financial sustainability of
the spending it is linked (Heller, 2006).
Another key issue is that it is a source that depends on decisions and priorities of third
parties, and although it should be considered as a source for fiscal space, it must be done so
with caution.
3.6 Borrowing
Borrowing is another source of fiscal space, but it is obviously linked to future repayment
of the debt. Unlike foreign aid, debt is linked to future payments. Special attention should
be given to whether the way these resources are spent will generate the necessary returns to
fulfill the payment of the debt, so that the commitment is in fact sustainable and does not

38
jeopardize the government‟s financial situation (Heller, 2005b, 2006). Programs that
increase human capital could be associated with greater development in the future. The two
key factors to consider are whether the program generates new returns or if it will have an
impact in the government debt payment commitments. This means that the revenue raised
from debt it is not recommended that it be allocated to current expenditure.
3.7 Printing money
Printing money or increase monetary supply may generate new resources for fiscal space.
This source of financing is known as seigniorage. But, it has a negative impact on the
economy because it generates inflation which could in turn affect the economy‟s real
growth. It is also important to keep in mind that the poor population bears the burden of
inflation, which means it is an equitable source of financing. We include it to be thorough
conceptually, but it is never recommended.
IV. Fiscal space estimates and analysis
4.1 Economic growth
The estimate of fiscal space generated by economic growth is based on the evolution of
GDP and GHE. Figure 24 shows two key variables: GDP annual growth and GDP per
capita (measured as international dollars (int$) adjusted by purchasing power parity (PPP)
constant using 2011 as the base year). Between 1975 and 2000, GDP growth in Suriname
shows large fluctuations. Between 2000 and 2014, the growth rate stayed positive and
averaged 2.0%. But, in fact, starting 2011, the GDP growth rate fell from 5.8% in 2011 to -
5.1% in 2016.

39
Figure 24: GDP growth (1976-2016) and GDP per capita (int$, PPP, constant 2011) (1990-2016)
Source: World Bank (2018).
Data on the GDP per capita is available only starting 1990. As expected, its fluctuations
follow the GDP growth rate. As mentioned above, GDP per capita starts increasing 2000
when it was int$9,731 reaching int$15,419 in 2013 and then dropping to int$13,878 in
2016.
Figure 25 shows the annual growth of GGHE, GHE and SSHE on top, and these health
expenditures expressed as percentage of GDP on the bottom. Both GGHE and GHE move
in the same direction during the period 2001-2015, while SSHE moves in the opposite
direction. This happens whether reviewing the expenditure indicators measured as annual
growth rates or as percentage of GDP.
-20-15-10-505
1015
1976
1977
1978
1979
1980
1981
1982
1983
1984
1985
1986
1987
1988
1989
1990
1991
1992
1993
1994
1995
1996
1997
1998
1999
2000
2001
2002
2003
2004
2005
2006
2007
2008
2009
2010
2011
2012
2013
2014
2015
201
6
GDP
grow
th(a
nnua
l % c
hang
e)
10,545
15,419
13,878
02,0004,0006,0008,000
10,00012,00014,00016,00018,000
1976
1977
1978
1979
1980
1981
1982
1983
1984
1985
1986
1987
1988
1989
1990
1991
1992
1993
1994
1995
1996
1997
1998
1999
2000
2001
2002
2003
2004
2005
2006
2007
2008
2009
2010
2011
2012
2013
2014
2015
2016
GDP
per c
apita
(int$
, PPP
, con
stan
t 201
1)

40
Figure 25: GGHE, GHE and SSHE (annual growth and as percentage of GDP), Suriname, 2001-2015
Source: IMF-WEO (2018); WHO (2018).
Figure 26 also shows the annual growth rates of these three health expenditure indicators
from the public sector relative to the annual growth rate of GDP, keeping in mind that the
annual growth rate (percentage change) of the expenditure over the annual growth rate
represents the income elasticity of the expenditure. If we consider all the estimates of
expenditure-revenue elasticity for the period, the average elasticity for GGHE is -0.008, for
GHE is 0.510 and for SSHE is -0.657.
-60
-40
-20
0
20
40
60
2001 2002 2003 2004 2005 2006 2007 2008 2009 2010 2011 2012 2013 2014 2015Healt
h exp
endi
ture
grow
th
(% ch
ange
)
GGHE GHE SSHE
0
1
2
3
4
5
2000 2001 2002 2003 2004 2005 2006 2007 2008 2009 2010 2011 2012 2013 2014 2015
Healt
h exp
endi
ture
(% G
DP)
GGHE GHE SSHE

41
Figure 26: Annual growth of GDP versus annual growth of GGHE, GHE, SSHE, Suriname, 2001-2015
Source: IMF-WEO (2018); WHO (2018).
Generally, not all the observations should be used in estimating the average elasticity.
Some observations should be treated as outliers. We consider three scenarios following the
literature: an optimistic, a neutral and a pessimistic. These scenarios have different
implications for the fiscal sustainability (Hay & Williams, 2003). Of the 15 observations
for the elasticity, we eliminate 5 observations to build the following scenarios:
Pessimistic scenario: We eliminate the five highest elasticities (positive values).
Neutral scenario: We eliminate 3 of the lowest and 2 of the highest elasticities. This
scenario should generate the more “stable” average elasticity.
Optimistic scenario: We eliminate the five lowest elasticities (negative values).
-50
-40
-30
-20
-10
0
10
20
30
40
50
-4 -2 0 2 4 6 8
Healt
h exp
endi
ture
(ann
ual %
chan
ge)
GDP (annual % change)
GGHE GHE SSHE

42
To project health expenditures we proceed with the computations we describe below. First,
we calculate the percentage change of the health expenditure using the IMF annual GDP
growth projections (IMF-WEO, 2018):
We calculate the health expenditure for every year until the year 2022. The fiscal space for
2022 is the difference between the expenditure in the year 2022 minus the expenditure of
the base year, 2015.
We present the results of these estimates in Table 3 for the three health expenditures
(GGHE, GHE and SSHE). For each scenario we show the average expenditure-elasticity
and the annual projections of the expenditure (as percentage of GDP) and the annual
change in percentage points (pp).
As mentioned before, GGHE is the sum of GHE and SSHE, and there it is also the
combination of both effects. GGHE has a negative elasticity in the pessimistic scenario.
With a negative elasticity a rise in GDP (positive economic growth) translates into a fall in
GGHE as a percentage of GDP. Because GDP falls drastically in 2016, GGHE as
percentage of GDP rises from 3.857% in 2015 to 5.028%. Since the economy‟s projections
are positive in the following years, GGHE stars decreasing. The average annual change in
percentage point in the pessimistic scenario is 0.037 pp. This means that between 2015 and
2022 GGHE as percentage of GDP would drop 0.261pp.
The neutral scenario has a positive but lower than one elasticity (0.765). This means that a
1% growth in GDP increase GGHE in 0.765% with means that GGHE as the percentage of
GDP falls. GGHE rises between 2016 and 2017, but then drops in the rest of the projected
period. This means that the average change in percentage points of the neutral scenario is
only 0.002, and the cumulative change 0.013. By 2022, GGHE would be 3.87% which
leaves Suriname at 2.13 percentage points from the target of 6% of GDP.

43
Finally, the optimistic scenarios, shows a drop in GGHE in 2016, and period of
recuperation between 2017 and 2020, and then a drop again between 2021 and 2022. This
means that in 2022 GGHE as percentage of GDP could reach 3.983% of GDP, only slightly
higher than the neutral scenario.
Table 3: Income elasticities of health expenditure, health expenditure as % of GDP, annual change in percentage points (pp), average annual and cumulative fiscal space
Elasticity 2016 2017 2018 2019 2020 2021 2022 Average Cumulative GGHE Pessimistic GGHE (%GDP) -1.588 5.028 4.086 3.854 3.775 3.688 3.641 3.595
∆ pp 1.172 -0.943 -0.232 -0.079 -0.087 -0.047 -0.046 -0.037 -0.261 Neutral GGHE (%GDP) 0.765 3.963 3.974 3.963 3.946 3.923 3.897 3.870
∆ pp 0.106 0.011 -0.011 -0.017 -0.023 -0.026 -0.027 0.002 0.013 Optimistic GGHE (%GDP) 1.739 3.522 3.928 4.008 4.017 4.020 4.003 3.983
∆ pp -0.335 0.406 0.080 0.008 0.003 -0.017 -0.020 0.018 0.127 GHE Pessimistic GHE (%GDP) -1.854 3.717 2.803 2.613 2.569 2.525 2.520 2.519
∆ pp 0.933 -0.914 -0.190 -0.044 -0.043 -0.005 -0.002 -0.0379 -0.265 Neutral GHE (%GDP) 1.226 2.710 2.703 2.710 2.721 2.737 2.754 2.773
∆ pp -0.074 -0.007 0.007 0.011 0.016 0.017 0.019 -0.0016 -0.011 Optimistic GHE (%GDP) 3.087 2.102 2.643 2.769 2.814 2.865 2.895 2.926
∆ pp -0.682 0.541 0.126 0.045 0.051 0.030 0.031 0.0203 0.142 SSHE Pessimistic SSHE (%GDP) -2.362 1.496 1.217 1.134 1.098 1.055 1.025 0.995
∆ pp 0.423 -0.279 -0.083 -0.036 -0.043 -0.030 -0.030 -0.011 -0.077 Neutral SSHE (%GDP) 0.225 1.170 1.181 1.170 1.153 1.131 1.106 1.081
∆ pp 0.098 0.011 -0.011 -0.017 -0.023 -0.024 -0.026 0.001 0.008 Optimistic SSHE (%GDP) 1.408 1.021 1.164 1.186 1.179 1.165 1.144 1.120
∆ pp -0.051 0.143 0.022 -0.008 -0.013 -0.022 -0.024 0.007 0.048 Source: IMF-WEO (2018); WHO (2018).
As mentioned earlier, if we separate the funds, the projections of each fund behave
differently. The range of the elasticities of GHE for the three scenarios is wider than in the
case of GGHE. The estimated elasticities are -1.854, 1.226 and 3.087 for the pessimistic,
neutral and optimistic scenarios. In both the pessimistic and neutral scenarios, the GHE as
percentage of GDP in 2022 is lower than the baseline year (2015). This is mainly driven by
the drop in GDP growth in 2016.
Unlike GHE, SSHE is countercyclical to GGHE. With a much large (in absolute terms)
negative elasticity in the pessimistic scenario, SSHE shows a cumulative decrease of -0.077

44
percentage points between 2015 and 2022. The neutral scenario leaves SSHE at the same
level compared to the baseline.
These results must be interpreted with caution. IMF projection include the expectations of
future economic policies, if any. Also, it is important to keep in mind that economic growth
is a necessary, but not a sufficient condition to create fiscal space. These results show that
Suriname must generate the necessary conditions to stabilize the economy and this must
also be combined with other actions so create the necessary fiscal space.
4.2 New revenue
Figure 27 shows revenue data from the IMF from the period 2001 to 2012 for Suriname and
to 2016 for selected countries. Up until 2012, Suriname‟s government revenue was high
compared to other countries in the region. Between 2002 and 2006 government revenue as
percentage of GDP grew at a stable rate, and then it spiked in 2007 and began a more
volatile trend. In 2007 government revenue represents 29.4% of GDP and it dropped to
21.7% in 2010 and has slowly risen since then.

45
Figure 27: Public revenues as percentage of GDP, Suriname and selected countries, 2001-2016
Source: IMF-GFSY (2018).
An article by EIU (2017) that analyzes the economy in Suriname states how the revenue
decreased in 2016 to 13.8% of GDP. This translated into drops in direct, indirect and non-
tax revenue. This is the period of recession and devaluation of the Surinamese dollar. The
expectation is an improvement in the economy in 2018 driven by mining output and
exports, because of the investments in 2017. This should translate in an improvement of
government revenues.
The same database from IMF, shows that Suriname‟s government revenues was mainly
based on taxes (Figure 28 and Figure 29). According to this source, social contributions are
zero in this period.
25.0
21.3 21.9 21.722.9
24.1
29.4
24.3
27.7
21.7
24.525.7
0
5
10
15
20
25
30
35
2001 2002 2003 2004 2005 2006 2007 2008 2009 2010 2011 2012 2013 2014 2015 2016
Gove
rnm
ent r
even
ue (%
GDP
)
Belize Jamaica Suriname Barbados Bahamas, The

46
Figure 28: Revenue by source as percentage of total revenue, Suriname, 2001-2012
Note: Suriname does not show revenues from social contributions. Source: IMF-GFSY (2018).
Figure 29: Revenue by source as percentage of GDP, Suriname, 2001-2012
Source: IMF-GFSY (2018).
Suriname‟s Income Tax Law includes a 36% tax rate for companies in the country. The
only withholding tax applicable in Suriname is dividend tax of 25% on the dividend
80.476.2 77.3 77.1
71.9 69.464.2
71.5
62.2
72.075.4 76.2
4.64.4 5.0 5.3
6.1 9.2 17.910.3
12.05.7 3.3 0.0
15.0 19.5 17.7 17.6 22.0 21.5 17.9 18.225.8 22.2 21.4 23.8
25.0
21.3 21.9 21.7 22.9 24.1
29.4
24.327.7
21.724.5 25.7
0
5
10
15
20
25
30
35
40
45
50
0
10
20
30
40
50
60
70
80
90
100
2001 2002 2003 2004 2005 2006 2007 2008 2009 2010 2011 2012
Gove
rnm
ent r
even
ue (%
GDP
)
Perc
enta
ge of
tota
l reve
nue
Taxes Social contributions Grants Other revenue Revenue (% GDP) [right axis]
20.116.2 17.0 16.7 16.5 16.7 18.9 17.3 17.2 15.7
18.5 19.5
3.8
4.1 3.9 3.8 5.05.2
5.3
4.47.1
4.85.2 6.1
25.0
21.3 21.9 21.722.9
24.1
29.4
24.3
27.7
21.7
24.525.7
0
5
10
15
20
25
30
35
2001 2002 2003 2004 2005 2006 2007 2008 2009 2010 2011 2012
Gove
rnm
ent r
even
ue (%
GDP
)
Taxes Social contributions Grants Other revenue Revenue

47
payments made to shareholders. Personal taxation includes personal income tax including
wage tax, dividend tax, and wealth tax. Imported goods are subject to import duties. By
Decree of the Minister of Finance, investors in the production sector can request an
exemption of the import duty to a maximum of 75% to the import of investment goods
(heavy equipment).
The mineral sector has tax incentives including: import duties exemption (results in a
reduction of investment costs), accelerated depreciation, and reinvestment reserve.
Social security contributions for health include 4% of salary paid by the employer, starting
with a 2% base rate that rises with income until the employee reaches 60 years of age. For
self-employed, the contribution rate is 4% and rises with income. The information on social
security contributions appears to have a problem of underreporting which may be linked to
the reporting from the private sector. This is discussed further in section 4.2.2.
In accordance to the information from the IMF, the main source of revenues for the
government comes from taxation (Figure 30). Direct taxes have a higher participation
compared to indirect taxes. This suggests that revenues may be progressive, i.e., people
with higher incomes pay proportionately more than people with lower incomes.
Figure 30: Revenue by source as percentage of total revenue, Suriname, 2012-2016
Source: MoF.
39.4 42.6 38.7 32.9 36.0
35.6 36.5 37.6 46.9 38.5
25.0 20.9 23.8 20.2 25.5
75.0 79.1 76.2 79.8
74.5
0
10
20
30
40
50
60
70
80
90
100
2012 2013 2014 2015 2016
Perc
enta
ge of
tota
l reve
nue
Direct tax Indirect tax Non-tax revenue Tax revenue

48
4.2.1 Taxes Heller (2005b) suggests that low income countries should aim a collecting at least 15% of
GDP from taxation. Figure 31 compares tax revenues as percentage of GDP among Latin
American and Caribbean countries in 2012.7 In this year, Suriname‟s tax revenues was
19.5% above those countries with similar GDP per capita like Brazil with a tax revenue of
13.7% and Mexico with a tax revenue of 9.9%. But, when compared with countries in the
Caribbean, Suriname‟s tax revenue is comparative low. Caribbean small states have a tax
revenue of 22.6% of GDP, while Barbados‟ reaches 24.2% of GDP.
Figure 31: Tax revenues as percentage of GDP, Latin American and Caribbean countries and some aggregates, 2012
Note: Countries/aggregates are in ascending order of GDP per capita ($int, PPP,
Constant 2011). Source: World Bank (2018).
Figure 32 shows the evolution of tax revenue as percentage of GDP for Suriname and
selected countries. Suriname‟s tax revenues fall during the period of the international
financial crisis (2008-2010) and rise right after until 2012.
7 We compare 2012, because that is the last year with information available from Suriname in World Bank (2018).
16.1
14.7
15.0
10.7 11.7
10.8 12
.8 14.5
22.5 24
.323
.023
.016
.5 18.7
13.0
13.3
19.1
14.3
13.3
22.6
13.1
13.7
19.5
9.924
.218
.818
.513
.021
.719
.016
.311
.926
.419
.818
.414
.510
.0
0
10
20
30
40
50
60
Sub-
Saha
ran
Afric
aHo
ndur
asNi
cara
gua
Sout
h Asia
Lowe
r midd
le inc
ome
Guat
emala
Para
guay
El S
alvad
orBe
lize
Jam
aica
Domi
nica
St. V
incen
t and
the…
Peru
Gren
ada
Domi
nican
Rep
ublic
Colom
biaSt
. Luc
iaW
orld
Costa
Rica
Carib
bean
small
stat
esLa
tin A
meric
a & C
aribb
ean
Braz
ilSu
rinam
eM
exico
Barb
ados
Urug
uay
Antig
ua a
nd B
arbu
daAr
gent
inaSt
. Kitts
and N
evis
Chile
Centr
al Eu
rope
and
the
Baltic
sBa
hama
s, Th
eTr
inida
d an
d To
bago
Euro
pean
Unio
nEu
ro a
rea
High
inco
meNo
rth A
meric
a
Tax r
even
ue (%
GDP
)

49
Figure 32: Tax revenue as percentage of GDP, Suriname and selected countries, 2001-2016
Source: World Bank (2018).
Suriname has a similar tax system as that of most countries in the world, with a general
structure of direct and indirect taxes. Direct taxes include taxes on personal income and
profits from businesses and enterprises. Indirect taxes include those on consumption like
value added tax, import duties, and other specific taxes on consumption.
Figure 33 shows tax revenue by type of tax as percentage of GDP for Suriname between
2001 and 2012. Revenues from indirect taxes reached 11.3% of GDP in 2012, while
revenue from direct taxes was 8.2% of GDP. Throughout the period the participation of
indirect taxes in revenue is larger than direct taxes. This suggests that tax collection may be
regressive, although some authors argue that taxes on good and services are not necessarily
regressive (Ebrill, Keen, Bodin, & Summers, 2002).
0
5
10
15
20
25
30
2001 2002 2003 2004 2005 2006 2007 2008 2009 2010 2011 2012 2013 2014 2015 2016
Tax r
even
ue (%
GDP
)
Belize Jamaica Suriname Barbados Bahamas, The

50
Figure 33: Tax revenue by direct/indirect tax as percentage of GDP, Suriname, 2001-2012
Source: IMF-GFSY (2018).
A. Direct taxes
Direct taxation tends to be progressive. Figure 34 shows the types of direct taxes as
percentage of GDP between 2001 and 2012 in Suriname. As the figure clearly shows, the
most important direct tax is on income, profits and capital gains. Property tax generates
only a very small portion of direct tax revenue.
7.85.9 5.0 6.0 6.4 6.2 7.4 6.6 7.1 6.1 7.2 8.2
12.3
10.4 11.9 10.7 10.1 10.511.5
10.8 10.29.6
11.211.3
20.1
16.2 17.0 16.7 16.5 16.718.9
17.3 17.215.7
18.519.5
0
5
10
15
20
25
2001 2002 2003 2004 2005 2006 2007 2008 2009 2010 2011 2012
Tax r
even
ue (%
GDP
)
Direct taxes Indirect taxes Tax revenue (% GDP)

51
Figure 34: Direct tax revenue as percentage of GDP, 2001-2012
Source: IMF-GFSY (2018).
B. Indirect taxes
Figure 35 shows the different types of indirect tax revenues as percentage of GDP. The
international financial crisis also had an impact in this type of revenue with indirect tax
revenue falling between 2007 and 2010.
7.8
5.85.0
5.9 6.4 6.17.4
6.5 7.06.0
7.28.2
7.8
5.9
5.0
6.06.4 6.2
7.4
6.67.1
6.1
7.2
8.2
0
1
2
3
4
5
6
7
8
9
2001 2002 2003 2004 2005 2006 2007 2008 2009 2010 2011 2012
Dire
ct ta
x rev
enue
(% G
DP)
Income, profits, and capital gains Payroll and workforce Property Direct taxes

52
Figure 35: Indirect tax revenue as percentage of GDP, 2001-2012
Source: IMF-GFSY (2018).
Figure 36 shows the participation of each type of indirect tax in indirect tax revenue.
During the period between 2001 and 2012, revenue from trade taxes decreased its
importance from 21.2% in 2001 to 17.0% in 2012. Taxes on specific services rose from
15.1% to 23.6% and general taxes on goods and services also rose from 31.3% to 37.5%.
7.05.8
7.46.2 5.5
6.7 7.6 7.0 7.0 6.67.9 8.1
5.0
4.43.7
3.83.8
3.23.1
3.0 2.4 2.2
2.5 2.3
0.3
0.20.9
0.70.7 0.6
0.80.8
0.70.7
0.8 0.9
12.3
10.4
11.9
10.710.1 10.5
11.510.8
10.29.6
11.2 11.3
0
2
4
6
8
10
12
14
2001 2002 2003 2004 2005 2006 2007 2008 2009 2010 2011 2012
Indi
rect
tax r
even
ue (%
GDP
)
Goods & services International trade and transactions Other Indirect taxes

53
Figure 36: Distribution of indirect tax revenue, 2001-2012
Source: IMF-GFSY (2018).
C. Indirect taxes: sin taxes
Figure 37 shows the participation of sin taxes revenue as a percentage of total government
revenue based on information provided by the Ministry of Finance. According to his
information, between 2014 and 2016, the excise on tobacco and cigarettes almost doubled,
while the excise on beer maintained its participation in the total revenue.
31.3 28.938.0 40.4 43.0 37.7 35.6 36.3 36.8 37.9 34.2 37.5
8.6 8.26.8 6.9 6.9
8.1 10.7 9.6 10.5 10.59.1 8.4
15.1 17.015.7 8.8 2.7 17.9 18.3 16.7 18.9 18.6 25.3 23.6
31.2 32.0 23.7 26.7 27.721.2 20.0 21.2 19.6 19.2 18.3 17.0
8.7 8.76.9 7.9 8.4 7.9 6.0 6.0 4.0 3.4 3.2 2.9
2.6 2.07.2 6.7 7.4 5.8 7.3 7.2 7.3 7.8 7.2 8.3
0
10
20
30
40
50
60
70
80
90
100
2001 2002 2003 2004 2005 2006 2007 2008 2009 2010 2011 2012
Perc
enta
ge of
indi
rect
tax r
even
ue
G&S: General goods & services G&S: ExcisesG&S: Profits of fiscal monopolies G&S: Specific servicesG&S: Use of goods or perform activities Trade: Customs & other import dutiesTrade: Taxes on exports Trade: OtherOther: Other

54
Figure 37: Revenue from sin taxes as percentage of total revenue, 2012-2016
Source: Ministry of Finance.
In a 2015, Suriname‟s Minister of Health, in a presentation showed that “Suriname
committed to ratifying and implementing the World Health Organization‟s Framework
Convention on Tobacco Control (FCTC) in 2008.” (Blokland, 2015). Research presented
showed that:
2007 National Household Drug Prevalence Survey found nearly 40% of males and
10% of females currently smoked
•2009 GYTS and GSHS survey found that half of all adolescents surveyed are
subject to second hand smoke
•2011 indoor air quality testing exceeded WHO standards by 29 times
Finally in 2013, the Legislation S.B. 2013 no. 39 was passed which included (Blokland,
2015):
Smoking ban in indoor public places
Tobacco advertising ban
A ban on the sale of tobacco products to minors and the use of vending machines
A ban on electronic cigarettes
Pictorial health warnings required on packaging
0.6 0.6 0.7 0.9 1.3
2.4 2.4 2.4
2.7 2.3
0
1
1
2
2
3
3
4
4
2012 2013 2014 2015 2016
Perc
enta
ge of
tota
l reve
nue
Excise on beer Excise on tobacco and cigarettes

55
The development, implementation, and monitoring a national tobacco control
strategic plan
Promote epidemiological surveillance
Promote inter-sectoral collaboration for legislation implementation
Establishment of Tobacco Bureau to promote research and strengthen cessation
programming
Compliance and enforcement regulations
Strict penalties for non-compliance
Allows for the development of future regulations to ensure full implementation of
the law
Blokland (2015) also presented the case of alcohol taxation in Suriname. First, as general
background, laws on alcohol pricing and taxation have existed since 1891. These laws had
minor changes in 1953, 1994 and 2000. In 2004, the excise tax was increased. In 2008,
excise stamps for alcohol and tobacco were implemented with the help of a newly
established Special Excise Stamp Control Unit. Finally, in 2011, the new administration
announced that the excise tax would be raised from 33% to 68% as part of other fiscal
measures.
In 2015 alcohol taxation was:
▪ Duties (50%)
▪ VAT (10%)
▪ Statistic Tax (1.5%)
▪ Consent Tax (0.5%)
▪ Excise Tax (based on alcohol type and % of alcohol, see table below)

56
Table 4: Suriname’s excise tax structure, 2015
Alcoholic beverages Excise tax Tariff per liter
Whisky US$ 6.75 Rum US$ 2.00 Category 1: 0-30 vol. % alc. US$ 3.30 Category 1: 0-30 vol. % alc. US$ 4.50 Category 1: 0-30 vol. % alc. US$ 6.75 Category 1: 0-30 vol. % alc. US$ 8.25 Wines US$ 0.12 per vol. % alc. Beers US$ 50.00 per hectoliter (US$ 0.50 per liter) Source: Blokland (2015).
Figure 38: Alcohol sales trends, 2005-2011
Source: Blokland (2015).
There are other sin taxes that could be considered to create fiscal space, for example, on
sugars.
D. Tax expenditure
Tax expenditure is the estimated revenue losses from special exclusions, exemptions,
deductions, credits, deferrals, and preferential tax rates in income tax law. It can include
subsidies. In Suriname‟s Title IV consultation with the IMF (IMF, 2014a) states that the

57
focus of the consultation was “on measures to strengthen fiscal sustainability and external
stability, as well as policies to enhance the financial sector resilience, structural
competitiveness and inclusive growth”. Their analysis showed a large long run fiscal
sustainability gap that needed to be addressed. One of the key issues was to implement
spending restraint as part of the adjustment effort. In this sense, they agreed to the need of
improving the targeting electricity and water subsidies that represented over 2% of GDP in
2014, if 15% is allocated to health this would be at least an additional 0.3 percentage points
for health.
4.2.2 Social security contributions for health Figure 39 presents information from the IMF regarding the sources of revenue for seven
countries including Suriname in 2012. According to this information, Suriname and the
other selected countries do not have revenue from social security contributions. Their
revenue comes from taxes, grants (sporadically) and other types of revenue. Figure 40
shows the participation of SSHE in THE for countries in the region in 2013. Suriname‟s
SSHE represents 29.6% of total health expenditure.

58
Figure 39: Sources of revenue as percentage of revenue, Suriname and selected countries, 2012
Source: IMF-GFSY (2018).
Figure 40: Social security health expenditure as percentage of total health expenditure, Latin American and Caribbean countries, 2013
Source: World Bank.
WHO‟s new methodology of System Health Accounts 2011 (SHA 2011) (OECD, Eurostat,
& WHO, 2011) is being used to estimate health expenditures and the data has been
87.5 92.8
76.2
93.0 89.5
2.60.0
0.0
1.40.0
9.8 7.2
23.8
5.6 10.5
0
10
20
30
40
50
60
70
80
90
100
Belize Jamaica Suriname Barbados The Bahamas
Perc
enta
ge of
reve
nue
Taxes Social contributions Grants Other revenue
0.0 1.6 1.8 4.2 5.7 8.6 10.6 13
.413
.9 17.5 19.6
20.6 22.6 24.8 26.6 28.5
29.6 32
.3 34.2 36.6 44
.260
.0 64.1
0
10
20
30
40
50
60
70
80
90
100
Cuba
Guya
naSa
int Lu
ciaCh
ileAn
tigua
and B
arbu
daBe
lize
Vene
zuela
Para
guay
Hond
uras
Guate
mala
Nica
ragu
aPe
ruEc
uado
rDo
minic
an R
epub
licEl
Salv
ador
Mexic
oSu
rinam
eBo
livia
Pana
maAr
genti
naUr
ugua
yCo
sta R
icaCo
lombia
Socia
l sec
urity
healt
h exp
endit
ure
(% T
HE)

59
published since last year in the Global Health Expenditure Dataset. The GHED includes
Compulsory Financing Arrangements (CFA) as % of Current Health Expenditure (CHE).
CFA includes government schemes and compulsory prepaid schemes. Figure 41 shows how
after the Insurance Law of 2014 the CFA in Suriname raised its participation in the CHE
from about 38.8% to 70.2%. This rise has been driven by the Social Health Insurance
component (Figure 42).
Figure 41: Compulsory Financing Arrangements (CFA) as % of Current Health Expenditure (CHE), Suriname and selected countries, 2000-2016
Source: WHO (2018).
0
10
20
30
40
50
60
70
80
90
100
2000 2001 2002 2003 2004 2005 2006 2007 2008 2009 2010 2011 2012 2013 2014 2015 2016
Com
pulso
ry F
inan
cing A
rrang
emen
ts (C
FA) a
s %
of C
urre
nt H
ealth
Expe
nditu
re (C
HE)
Guyana Belize Jamaica SurinameGrenada Barbados Bahamas

60
Figure 42: Social Health Insurance (SHI) as % of Current Health Expenditure (CHE), Suriname and selected countries, 2000-2016
Source: WHO (2018).
Social security contributions for health should not necessarily be considered as part of the
resources for fiscal space. Generally speaking social security funds for health cannot be
spent on non-beneficiaries. Hence, if either the base (and therefore the number of
beneficiaries) is expanded or the contribution rate (by either employer or employer) is
increased, the new resources would still be only for the social security beneficiaries.
The sustainability of the health social security should be assessed. If revenues are not
projected to cover expected costs of coverage, this could strain the public sector to finance
the difference. So, it is important for this subsector to be self-sustained.
On the other hand, if health social security increases its population coverage, this could
reduce the resource needs for the public subsector.
4.3 Efficiency gains
One of the most attractive sources to create fiscal space is efficiency gains. The health
sector in Suriname is moving towards a single fund system that could generate important
efficiency gains in the future. To the extent SZF can generate the payment mechanisms
0
5
10
15
20
25
30
35
40
45
50
2000 2001 2002 2003 2004 2005 2006 2007 2008 2009 2010 2011 2012 2013 2014 2015 2016
Socia
l Hea
lth In
sura
nce (
SHI) a
s % o
f Cur
rent
He
alth E
xpen
ditu
re (C
HE)
Guyana Belize Jamaica Suriname Grenada Barbados

61
necessary to improve health results, there is a possibility of efficiency gains within the
health sector.
- Payment mechanisms to physicians
- Payment mechanisms to hospitals
- Strengthening primary health care
- Drug procurement
In 2018 a “…mission was organized at the request of Miriam Naarendorp, Head of the
Pharmaceutical Inspectorate, with the objective of reviewing and establishing the required
procedures for BGVS to procure key health products through the PAHO Strategic Fund. As
part of the adoption process, it was decided to start a pilot project and use the Fund to
procure Cytotoxic, Immuno-Biologicals, ARV and selected high cost medicines and after
successful conclusion of the pilot, review the possibility to expand the list of medicines to
be procured through PAHO and assess the possibility of requesting technical cooperation
on Supply Chain Management.” (PAHO, 2018).
4.4 Reprioritization of health expenditure
Reprioritization is another possible source of fiscal space. Figure 43 the participation of
general government health expenditure as the percentage of total government expenditure.
Suriname‟s health sector maintains a stable participation since 2007 within the
government‟s budget. The Bahamas and Belize are increasing the priority of the health
sector, but Suriname still has a higher allocation to health than the other countries.

62
Figure 43: General government health expenditure as percentage of government expenditure, Suriname and selected countries, 1995-2014
Source: World Bank (2018).
A key challenge when assessing reprioritization is the allocation of resources towards
health sector workers and to physicians.
Alternative, to the extent that Suriname can increase its government revenue,
reprioritization could be implemented by allocation those new resources towards the health
sector. This would avoid reallocating resources from other sectors to the health sector.
4.5 Donations
Creating fiscal space based on donations is generally not recommended (Escobar, 2010;
Heller, 2006; Sharma, 2016). Donations are based on third party decisions, which may not
be predictable. This could generate uncertainty and instability for the health sector. It is
important to keep in mind that the creation of fiscal space should always consider the
sustainability of the source of new resources.
Figure 44 compares the participation of external resources for health as the percentage of
total health expenditure. Suriname used to be highly dependent on external sources, but it
0
5
10
15
20
25
1995 1996 1997 1998 1999 2000 2001 2002 2003 2004 2005 2006 2007 2008 2009 2010 2011 2012 2013 2014
Gene
ral g
over
nmen
t hea
lth ex
pend
iture
(% g
over
nmen
t exp
endit
ure)
Guyana Belize Jamaica Suriname
Grenada Barbados Bahamas, The

63
has been able to decrease this dependence to levels below 10% of total health expenditure
since 2002 and to levels below 5% of total health expenditure since 2011.
Figure 44: External resources for health as percentage of total health expenditure, Suriname and selected countries, 1995-2014
Source: IMF-GFSY (2018).
According to the GHED data from WHO (Figure 45) shows that many of the peaks in the
previous figure were related to investments with external resources. SHA 2011 separates
investments in health from current health expenditures. The tendency in any case for
Suriname has been to decrease its dependence on external resources to less than 2% of the
current health expenditure. In terms of GDP, external resources began a clear downward
tendency in 2010, and remains below 0.1% of GDP since 2012.
0
5
10
15
20
25
30
1995 1996 1997 1998 1999 2000 2001 2002 2003 2004 2005 2006 2007 2008 2009 2010 2011 2012 2013 2014
Exte
rnal
reso
urce
s for
healt
h(%
tota
l hea
lth ex
pend
iture
)
Guyana Belize Jamaica SurinameGrenada Barbados Bahamas, The

64
Figure 45: External health expenditure (EXT) as percentage of current health expenditure (CHE) and as percentage of GDP, Suriname, 2000-2016
Source: WHO (2018).
In sum this does not seem like a source of financial space that could have a significant
impact in the total health expenditure in Suriname. Another issue associated with external
source is that it could crowd out the allocation of government revenue to the health sector.
4.6 Borrowing
The case of borrowing for health is also not a recommended source of fiscal space (Heller,
2006; Tandon & Cashin, 2010). One argument is that if the country is highly indebted, it
shouldn‟t increase its debt. In the case of Suriname, as seen above, the macroeconomic
policies implemented are in line with constraining the public debt and moving towards
fiscal sustainability, especially against external shocks.
V. Conclusions and recommendations The goal of this report is to provide an analysis of the fiscal space for health in Suriname.
We presented the conceptual framework for the analysis and followed with the analysis and
tentative estimates. In general, most cases show that governments have the capacity to
0.0
0.1
0.2
0.3
0.4
0.5
0.6
0.7
0.8
0.9
1.0
0
2
4
6
8
10
12
14
16
18
20
2000 2001 2002 2003 2004 2005 2006 2007 2008 2009 2010 2011 2012 2013 2014 2015 2016
Exte
rnal
Healt
h Exp
endi
ture
(EXT
) as a
s % G
ross
Do
mest
ic Pr
oduc
t (GD
P)
Exte
rnal
Healt
h Exp
endi
ture
(EXT
) as %
of C
urre
nt
Healt
h Exp
endi
ture
(CHE
)
External Health Expenditure (EXT) as % of Current Health Expenditure (CHE)External Health Expenditure (EXT) as as % Gross Domestic Product (GDP)

65
generate fiscal space. Suriname has been recuperating from a recent economic crisis and
has a positive outlook for the coming years.
Economic growth is one of the sources with the greatest potential and, together with the
increase in efficiency in health spending, are the most politically feasible.
These results must be interpreted with caution (Table 5). IMF projection include the
expectations of future economic policies, if any. Also, it is important to keep in mind that
economic growth is a necessary, but not a sufficient condition to create fiscal space. These
results show that Suriname must generate the necessary conditions to stabilize the economy
and this must also be combined with other actions so create the necessary fiscal space.
There is a positive outlook in economic growth in the near future.
As a main issue to be addressed is the reduction of the fiscal deficit. While 2014 was bad,
2015 was worse, with a current account deficit swelled to 16% of GDP and a fiscal deficit
of 8.8% of GDP. Also, inflation needs to be brought under control and wage increases held
in check. The IMF also called for a reform of the country‟s civil service and a more
aggressive central bank, raising interest rates to slow the pace of currency depreciation and
to restore confidence in the local currency (MacDonald, 2017).
There is an increasing pressure under the Insurance Law, because they already must meet
their commitments in pension payments since workers earn their right to pension with only
10 years of contributions.
A reduction and improved targeting of tax expenditures appears to be the most relevant
source, but that also implies a strong commitment from the government in light of the
political resistance it may bring. In this sense, targeting the subsidies so that the most
vulnerable populations are not affected is a key policy.
External financing is that Suriname has been moving away from at least as part of the
current expenditure. This is a reasonable policy and hence is not a desirable source for
fiscal space.
Going from the current level of public spending on health to 6% of GDP defined as a goal
implies a considerable effort, after the crisis the new measures being considered are in line
with the possibility of increasing the resources allocated to health.

66
Table 5: Sources of fiscal space for Suriname and recommendations Sources Technical Recommendation
Economic growth Low, only in the optimistic scenario there is
a slight rise in GGHE in the first years, but then it drops
Economic growth is key
Reprioritization Medium, it is subject to the ability of the
government to raise its revenue, these new resources could be allocated towards the health sector.
Is in line with fiscal sustainability measures
New revenues
General taxation Medium, restructuring of tax system in line with fiscal sustainability goal
Assess inequities in taxation
Sin taxes Medium, Suriname is committed to improve
taxation of goods that have a negative impact on health. Should consider taxing sugar products
Assess a new tax
Social security contributions
Low, most of the funding is coming from the governments
Improve system to collect contributions
Tax expenditures High, a targeting of electricity and water
subsidies could generate at least 0.3 percentage points for health
Assess
Efficiency High, mainly from improving payment to providers and physicians
Provider payment mechanisms through SZF
Donations Low Not recommended
Borrowing Low Not recommended Source: Author.

67
References
Blokland, D. M. (2015). Decisive action on Prevention – Suriname sets a regulatory framework for effectively reducing tobacco use and increasing alcohol taxes. Paper presented at the Forum of Key Stakeholders on NCD Issues in the Caribbean, Barbados.
Caribbean Development Bank. (2014). Country strategy paper 2014/2018. The Republic of Suriname. Staff Report: Caribbean Development Bank. Retrieved from:
Durán-Valverde, F., & Pacheco, J. F. (2012). Fiscal space and the extension of social protection: Lessons learnt from developing countries: Bolivia, Botswana, Brazil, Costa Rica, Lesotho, Namibia, Thailand and South Africa. ESS Extension of Social Security N, 33. doi:http://bit.ly/1iM3tAd
Ebrill, L., Keen, M., Bodin, J.-P., & Summers, V. (2002). The Allure of VAT. Finance & Development, 39(2). Retrieved from http://www.imf.org/external/pubs/ft/fandd/2002/06/ebrill.htm#author
EIU. (2017). Suriname: Fiscal deficit narrows gradually. The Economist Inteligence Unit, 2. Retrieved from The Economist Inteligence Unit: Suriname: Economy: Forecast website: http://country.eiu.com/article.aspx?articleid=1835351767&Country=Suriname&topic=Economy&subtopic=Forecast&subsubtopic=Fiscal+policy+outlook&u=1&pid=1506600134&oid=1506600134&uid=1# Retrieved from http://country.eiu.com/article.aspx?articleid=1835351767&Country=Suriname&topic=Economy&subtopic=Forecast&subsubtopic=Fiscal+policy+outlook&u=1&pid=1506600134&oid=1506600134&uid=1#
Escobar, L. E. (2010). Honduras: espacio fiscal para la inversión social y productiva (Vol. 4). Tegucigalpa, Honduras: PNUD-Honduras.
Giovanella, L., Feo, O., Faria, M., & Tobar, S. (2012). Health Systems in South America: Challenges to the universality, integrality and equity (pp. 836). Rio de Janeiro: ISAGS-UNASUR. Retrieved from:
Gordon, R., & Li, W. (2009). Tax structures in developing countries: Many puzzles and a possible explanation. Journal of public Economics, 93(7), 855-866.
Hay, R., & Williams, G. (2003). Fiscal space and sustainability from the perspective of the health sector. Presented at the High-Level Forum for the Health MDGs, Selected papers.
Heller, P. S. (2005a). Back to Basics-Fiscal Space: What it is and how to get it. Finance and Development-English Edition, 42(2), 32-33.
Heller, P. S. (2005b) Understanding fiscal space. International Monetary Fund.
Heller, P. S. (2006). The prospects of creating „fiscal space‟for the health sector. Health Policy and Planning, 21(2), 75-79. Retrieved from https://heapol.oxfordjournals.org/content/21/2/75.full.pdf

68
Hernández, P., & Poulliler, J.-P. (2007). Gasto en salud y crecimiento económico. Presupuesto y Gasto Público, 4(49), 20.
Suriname: National Basic Health Insurance Law (No. 114 of 2014), Law No. 114 of 2014 C.F.R. (2014).
IMF-GFSY. (2018). Government Finance Statistics Yearbook Retrieved from http://data.imf.org/?sk=a0867067-d23c-4ebc-ad23-d3b015045405&sId=1435697914186. from International Monetary Fund http://data.imf.org/?sk=a0867067-d23c-4ebc-ad23-d3b015045405&sId=1435697914186
IMF-WEO. (2018). World Economic Outlook. Retrieved from: http://www.imf.org/external/pubs/ft/weo/2017/02/weodata/index.aspx
IMF. (2014a). 2014 Article IV Consultation: Staff Report; Press Release; and Statement by the Authorities of Suriname. IMF Country Report No. 14/316. Washington, D.C.: International Monetary Fund. Retrieved from:
IMF. (2014b). Suriname: Selected Issues Paper. IMF Country Report No. 14/317. Washington, D.C.: International Monetary Fund. Retrieved from:
IMF. (2016). IMF Executive Board Approves US$478 Million Stand-By Arrangement for Suriname [Press release]. Retrieved from https://www.imf.org/en/News/Articles/2015/09/14/01/49/pr16251
IMF. (2017). Executive Board Concludes 2016 Article IV Consultation. Retrieved from: https://www.imf.org/en/News/Articles/2017/01/24/PR1714-Suriname-IMF-Executive-Board-Concludes-2016-Article-IV-Consultation
IOM. (2015). Suriname Migration Profile: A study on emigration from, and immigration into Suriname (pp. 172). Georgetown, Guyana/Paramaribo, Suriname: International Organization for Migration/Ministry of Foreign Affairs of the Republic of Suriname. Retrieved from: https://publications.iom.int/books/suriname-migration-profile-study-emigration-and-immigration-suriname
Kromodihardjo, R. (2018). The State Health Foundations’ progress towards Universal Health Coverage. Paper presented at the 12th Caribbean Conference on National Health Financing Initiatives, Paramaribo, Suriname.
Larye, S., Goede, H., & Barten, F. (2015). Moving toward universal access to health and universal health coverage: a review of comprehensive primary health care in Suriname. Revista Panamericana de Salud Pública, 37, 415-421. Retrieved from https://scielosp.org/article/ssm/content/raw/?resource_ssm_path=/media/assets/rpsp/v37n6/v37n6a07.pdf
MacDonald, S. B. (2017). Suriname‟s Economic Crisis. Retrieved from https://www.csis.org/analysis/surinames-economic-crisis
MOH. (2011). Suriname: National Health Sector Plan 2011-2018 (pp. 100). Paramaribo: Ministry of Health. Retrieved from:
OECD, Eurostat, & WHO. (2011). A System of Health Accounts: 2011 Edition (2011 ed. Vol. 2011): OECD Publishing.

69
Oof, G. (2016). Inflation and economic activity. Paramaribo: Centra Bank Van Suriname. Retrieved from:
PAHO. (2016). Disease and condition Master sheets for HiAP-National Consensus Workshop Suriname. Health in All Policies. Washington, DC: PAHO. Retrieved from: https://www.paho.org/sur/index.php?option=com_content&view=article&id=494:health-in-all-policies-suriname&Itemid=563
PAHO. (2017) Health in the Americas. Washington, D.C.: Pan American Health Organization.
PAHO. (2018). Suriname: Increasing Access to medicines and Health Technologies-PAHO Strategic Fund [Press release]. Retrieved from https://www.paho.org/sur/index.php?option=com_content&view=article&id=520:increasing-access-to-medicines-and-health-technologies-paho-strategic-fund&Itemid=563
Rao, M. G., & Seth, A. (2009). Fiscal Space for Achieving the Millennium Development Goals and Implementing the Tenth Plan in Bhutan. Economic and Political Weekly, 44(35), 51-59. Retrieved from http://www.jstor.org/stable/25663493
Sharma, J. (2016). An assessment of fiscal space for health in Bhutan. The International journal of health planning and management, 31(3), 296-308. doi:10.1002/hpm.2295
Suriname Planning Bureau Foundation. (2017). Policy development Plan 2017-2021. Part 1. Development priorities of Suriname. . Paramaribo: Government of the Republic of Suriname. Retrieved from:
Tandon, A., & Cashin, C. (2010) Assessing public expenditure on health from a fiscal space perspective. Health, Nutrition and Population Discussion Paper. Washington: World Bank.
UNDP. (2018). Human Development Index Retrieved from http://hdr.undp.org/en/data#. Retrieved November 2017, from UNITED NATIONS DEVELOPMENT PROGRAMME http://hdr.undp.org/en/data#
United Nations. (2018). World economic situation and prospects 2018. New York, NY: Naciones Unidas. Retrieved from: https://www.un.org/development/desa/dpad/document_gem/global-economic-monitoring-unit/world-economic-situation-and-prospects-wesp-report/
United Nations Population Division. (2017). Quinquennial Population by Five-Year Age Groups - Male & Female Retrieved from https://population.un.org/wpp/Download/Standard/Population/. Retrieved November 2018, from United Nations https://population.un.org/wpp/Download/Standard/Population/
WHO. (2018). Global Health Expenditure Database.
World Bank. (2018). World Development Indicators. World Development Indicators. Retrieved from: http://databank.worldbank.org/data/reports.aspx?source=world-development-indicators

70
Xu, K. (2005). Distribución del gasto en salud y gastos catastróficos: metodología. FER/EIP Discussion Paper. http://www.who.int/iris/handle/10665/85626 Retrieved from http://www.who.int/iris/handle/10665/85626
Xu, K., Saksena, P., Jowett, M., Indikadahena, I., Kutzin, J., & Evans, D. B. (2010). Exploring the thresholds of health expenditure for protection against financial risk. World Health Report (2010) Background Paper,(19). Retrieved from http://www.who.int/healthsystems/topics/financing/healthreport/19THE-thresv2.pdf?ua=1


