Page 1
Fiscal Year 2016 (ending March 31, 2017)
First Quarter Results (3-month results ended June 30, 2016)
Brother Industries, Ltd. August 8, 2016
Information on this report, other than historical facts, refers to future prospects and performance, and has been prepared by our Management on the basis of information available at the time of the announcement. This covers various risks, including, but not limited to, economic conditions, customer demand, foreign currency exchange rates, tax rules, regulation and other factors. As a result, actual future performance may differ from any forecasts contained on this report.
Page 2
© 2016 Brother Industries, Ltd. All Rights Reserved. 2
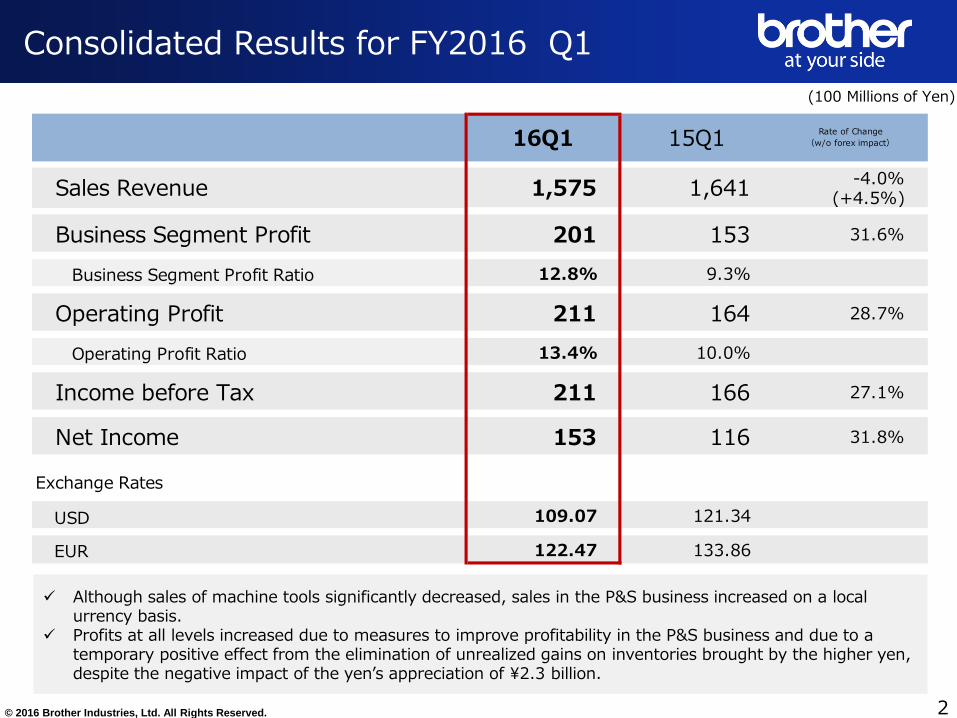
Although sales of machine tools significantly decreased, sales in the P&S business increased on a local urrency basis.
Profits at all levels increased due to measures to improve profitability in the P&S business and due to a temporary positive effect from the elimination of unrealized gains on inventories brought by the higher yen, despite the negative impact of the yen’s appreciation of ¥2.3 billion.
Consolidated Results for FY2016 Q1
16Q1 15Q1Rate of Change
(w/o forex impact)
-4.0%(+4.5%)
Business Segment Profit 201 153 31.6%
Business Segment Profit Ratio 12.8% 9.3%
Operating Profit 211 164 28.7%
Operating Profit Ratio 13.4% 10.0%
Income before Tax 211 166 27.1%
Net Income 153 116 31.8%
Exchange Rates
USD 109.07 121.34
EUR 122.47 133.86
1,641Sales Revenue 1,575
(100 Millions of Yen)
Page 3
© 2016 Brother Industries, Ltd. All Rights Reserved. 3
Main Factors for Changes in Business Segment Profit
Page 4
© 2016 Brother Industries, Ltd. All Rights Reserved. 4
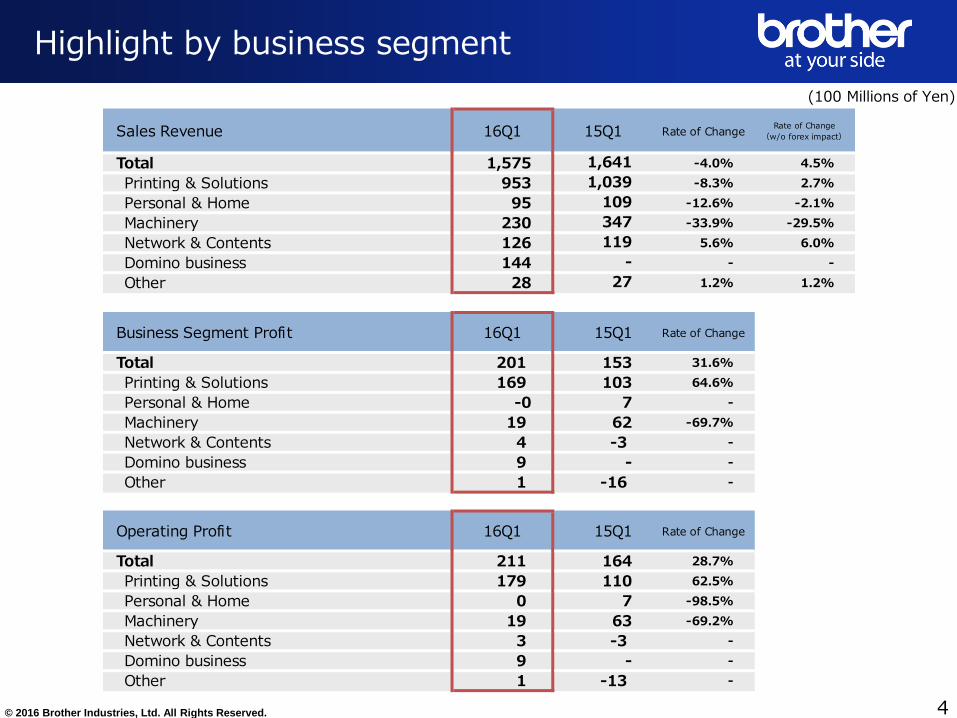
Highlight by business segment
Sales Revenue 16Q1 15Q1 Rate of ChangeRate of Change
(w/o forex impact)
Total 1,575 1,641 -4.0% 4.5%
Printing & Solutions 953 1,039 -8.3% 2.7%
Personal & Home 95 109 -12.6% -2.1%
Machinery 230 347 -33.9% -29.5%
Network & Contents 126 119 5.6% 6.0%
Domino business 144 - - -
Other 28 27 1.2% 1.2%
Business Segment Profit 16Q1 15Q1 Rate of Change
Total 201 153 31.6%
Printing & Solutions 169 103 64.6%
Personal & Home -0 7 -
Machinery 19 62 -69.7%
Network & Contents 4 -3 -
Domino business 9 - -
Other 1 -16 -
Operating Profit 16Q1 15Q1 Rate of Change
Total 211 164 28.7%
Printing & Solutions 179 110 62.5%
Personal & Home 0 7 -98.5%
Machinery 19 63 -69.2%
Network & Contents 3 -3 -
Domino business 9 - -
Other 1 -13 -
(100 Millions of Yen)
Page 5
© 2016 Brother Industries, Ltd. All Rights Reserved.
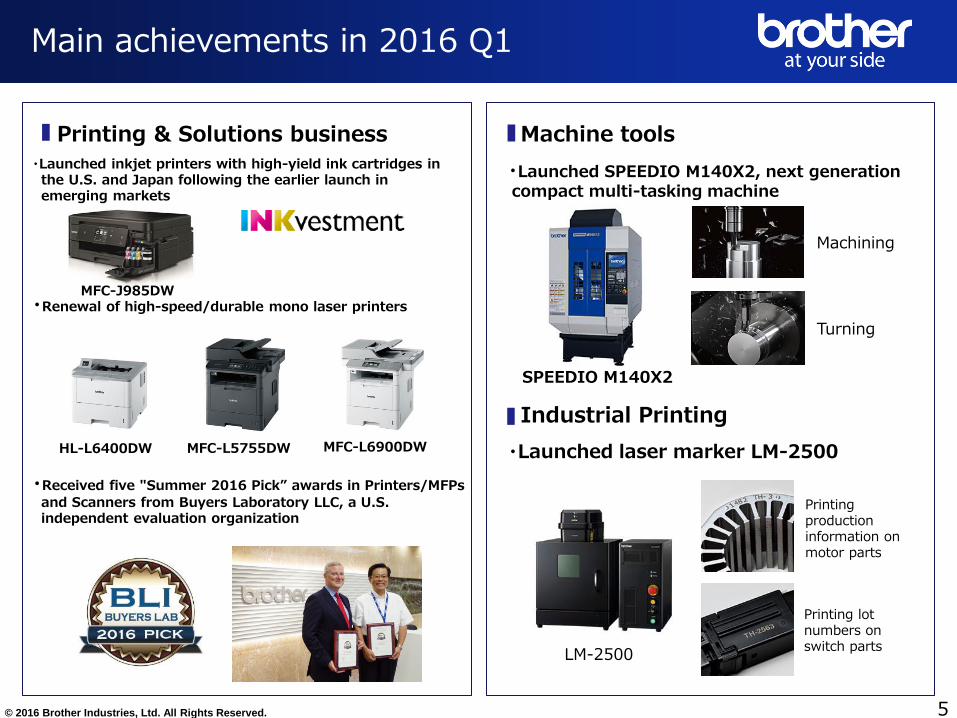
Printing & Solutions business
・Launched inkjet printers with high-yield ink cartridges in the U.S. and Japan following the earlier launch in emerging markets
・Renewal of high-speed/durable mono laser printers
・Received five "Summer 2016 Pick” awards in Printers/MFPs
and Scanners from Buyers Laboratory LLC, a U.S. independent evaluation organization
5
Main achievements in 2016 Q1
Machine tools
・Launched SPEEDIO M140X2, next generation compact multi-tasking machine
Industrial Printing
・Launched laser marker LM-2500 MFC-L6900DW MFC-L5755DW
LM-2500
Printing production information on motor parts
Printing lot numbers on switch parts
SPEEDIO M140X2
Machining
Turning
HL-L6400DW
MFC-J985DW
Page 6
© 2016 Brother Industries, Ltd. All Rights Reserved.
Consolidated Forecast for FY 2016
( ending March 31, 2017)
<Main points for revised forecast> ・Sales revenue The assumed exchange rates have been revised and the negative forex impact of approximately ¥21 billion has been factored into the forecast.
・Business segment profit Although the negative forex impact of approximately ¥7 billion has been factored into the forecast, the forecast has been upwardly revised in light of our progress at the end of Q1.
6
FY16Previous
forecast
Rate of
ChangeFY15 Act
Rate of Change
(w/o forex impact)
-6.2%(+4.7%)
Business Segment Profit 500 460 8.7% 549 -9.0%
Business Segment Profit Ratio 7.8% 7.0% 8.1%
Operating Profit 485 450 7.8% 586 -17.3%
Operating Profit Ratio 7.6% 6.8% 8.6%
Income before Tax 485 450 7.8% 572 -15.2%
Net Income 335 315 6.3% 412 -18.8%
Exchange Rates
USD 106.09 110.00 120.16
EUR 117.25 125.00 132.36
Sales Revenue 6,8216,400 6,575 -2.7%
(100 Millions of Yen)
Page 7
© 2016 Brother Industries, Ltd. All Rights Reserved. 7
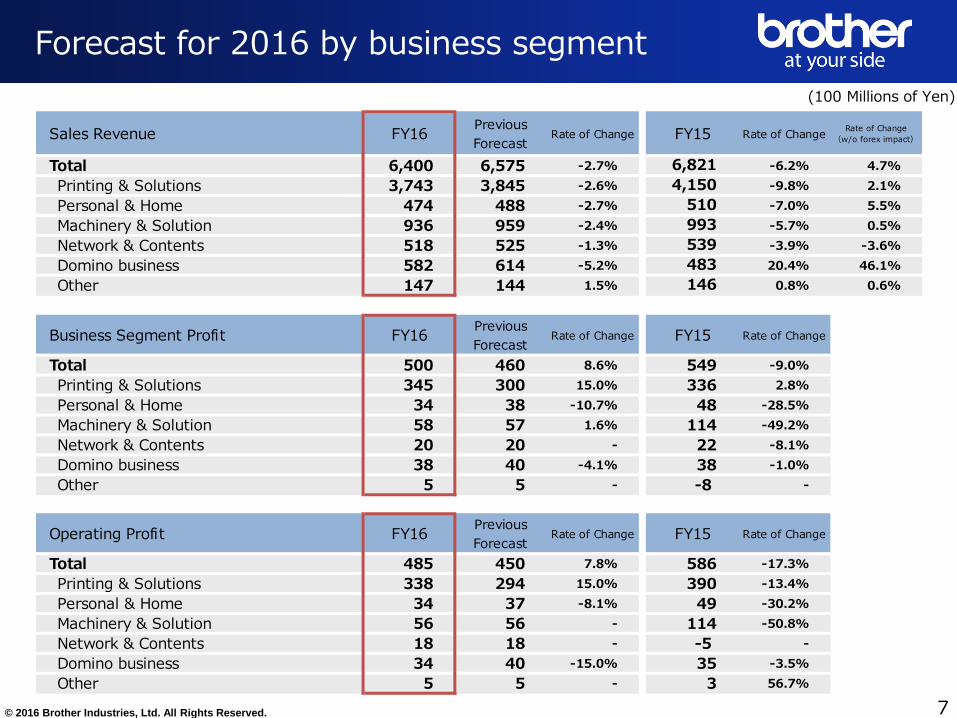
Forecast for 2016 by business segment
Sales Revenue FY16Previous
ForecastRate of Change FY15 Rate of Change
Rate of Change
(w/o forex impact)
Total 6,400 6,575 -2.7% 6,821 -6.2% 4.7%
Printing & Solutions 3,743 3,845 -2.6% 4,150 -9.8% 2.1%
Personal & Home 474 488 -2.7% 510 -7.0% 5.5%
Machinery & Solution 936 959 -2.4% 993 -5.7% 0.5%
Network & Contents 518 525 -1.3% 539 -3.9% -3.6%
Domino business 582 614 -5.2% 483 20.4% 46.1%
Other 147 144 1.5% 146 0.8% 0.6%
Business Segment Profit FY16Previous
ForecastRate of Change FY15 Rate of Change
Total 500 460 8.6% 549 -9.0%
Printing & Solutions 345 300 15.0% 336 2.8%
Personal & Home 34 38 -10.7% 48 -28.5%
Machinery & Solution 58 57 1.6% 114 -49.2%
Network & Contents 20 20 - 22 -8.1%
Domino business 38 40 -4.1% 38 -1.0%
Other 5 5 - -8 -
Operating Profit FY16Previous
ForecastRate of Change FY15 Rate of Change
Total 485 450 7.8% 586 -17.3%
Printing & Solutions 338 294 15.0% 390 -13.4%
Personal & Home 34 37 -8.1% 49 -30.2%
Machinery & Solution 56 56 - 114 -50.8%
Network & Contents 18 18 - -5 -
Domino business 34 40 -15.0% 35 -3.5%
Other 5 5 - 3 56.7%
(100 Millions of Yen)
Page 8
© 2016 Brother Industries, Ltd. All Rights Reserved.
922 840
3,6663,390 3,299
15Q1 16Q1 15TY Previous
Forecast
16TY
8
15Q1 16Q1 ChangeChange
x FX 15TYPrevious
Forecast 16TY ChangeChange
x FX
Sales Revenue 1,039 953 -8.3% 2.7% 4,150 3,846 3,743 -9.8% 2.1%
Communications & Printing equipment 922 840 -8.9% 2.0% 3,666 3,390 3,299 -10.0% 1.9%
Americas 348 327 -6.2% 7.2% 1,393 1,252 1,225 -12.1% 1.3%
Europe 307 252 -17.9% -8.4% 1,221 1,124 1,043 -14.6% -1.3%
Asia & Others 166 142 -14.8% -0.2% 600 559 543 -9.5% 3.5%
Japan 100 119 19.3% 19.3% 453 455 488 7.8% 9.9%
Electronic stationery 118 113 -3.5% 8.0% 484 456 444 -8.1% 4.0%
Americas 57 54 -4.9% 7.3% 230 213 209 -9.4% 3.6%
Europe 35 33 -6.8% 3.6% 147 138 129 -12.5% 0.8%
Asia & Others 17 16 -3.6% 13.1% 69 65 63 -8.8% 4.9%
Japan 8 10 20.6% 20.6% 38 40 44 17.3% 17.3%
Business Segment Profit 103 169 336 300 345
Operating Profit 110 179 390 294 338
<Sales Revenue> Communications & Printing equipment
<Sales Revenue> Electronic stationery
<Operating Profit>
118 113
484 456 444
15Q1 16Q1 15TY Previous
Forecast
16TY
110
179
390
294338
10.6%18.8%
9.4% 7.6% 9.0%
15Q1 16Q1 15TY Previous
Forecast
16TY
Printing & Solutions Sales Revenue & Operating Profit
(100 Millions of Yen)
Page 9
© 2016 Brother Industries, Ltd. All Rights Reserved.
70
49
3734
6.8%
0.1% 9.6%7.6% 7.2%
15Q1 16Q1 15TY Previous
Forecast
16TY
109 95
510 488 474
15Q1 16Q1 15TY Previous
Forecast
16TY
9
Personal & Home Sales Revenue & Operating Profit
15Q1 16Q1 ChangeChange
x FX 15TYPrevious
Forecast 16TY ChangeChange
x FX
Sales Revenue 109 95 -12.6% -2.1% 510 488 474 -7.0% 5.5%
Americas 61 49 -19.8% -7.9% 304 282 278 -8.6% 5.8%
Europe 22 23 3.6% 13.1% 101 97 92 -9.6% 2.7%
Asia & Others 17 15 -12.7% 0.1% 62 62 60 -2.2% 9.6%
Japan 9 9 -3.2% -3.2% 43 47 45 3.8% 3.8%
Business Segment Profit 7 -0 48 38 34
Operating Profit 7 0 49 37 34
<Sales Revenue> <Operating Profit>
(100 Millions of Yen)
Page 10
© 2016 Brother Industries, Ltd. All Rights Reserved.
63
19
114
56 56
18.2%
8.5%
11.5%
5.8% 6.0%
15Q1 16Q1 15TY Previous
Forecast
16TY
78 66
307 314 299225118
504 443 443
45
45
181202 194
15Q1 16Q1 15TY Previous
Forecast
16TY
10
Machinery Business Sales Revenue & Operating Profit
ISM
Machine tools
Industrial Parts
347
230
993 959 936
<Sales Revenue> <Operating Profit>
15Q1 16Q1 ChangeChange
x FX15TY
Previous
Forecast16TY Change
Change
x FX
Sales Revenue 347 230 -33.9% -29.5% 993 959 936 -5.7% 0.5%
Industrial sewing machines 78 66 -15.1% -4.8% 307 314 299 -2.7% 10.4%
Machine tools 225 118 -47.3% -44.9% 504 443 443 -12.1% -9.2%
Industrial Parts 45 45 1.4% 4.9% 181 202 194 6.9% 10.5%
Business Segment Profit 62 19 114 57 58
Operating Profit 63 19 114 56 56
(100 Millions of Yen)
Page 11
© 2016 Brother Industries, Ltd. All Rights Reserved. 11
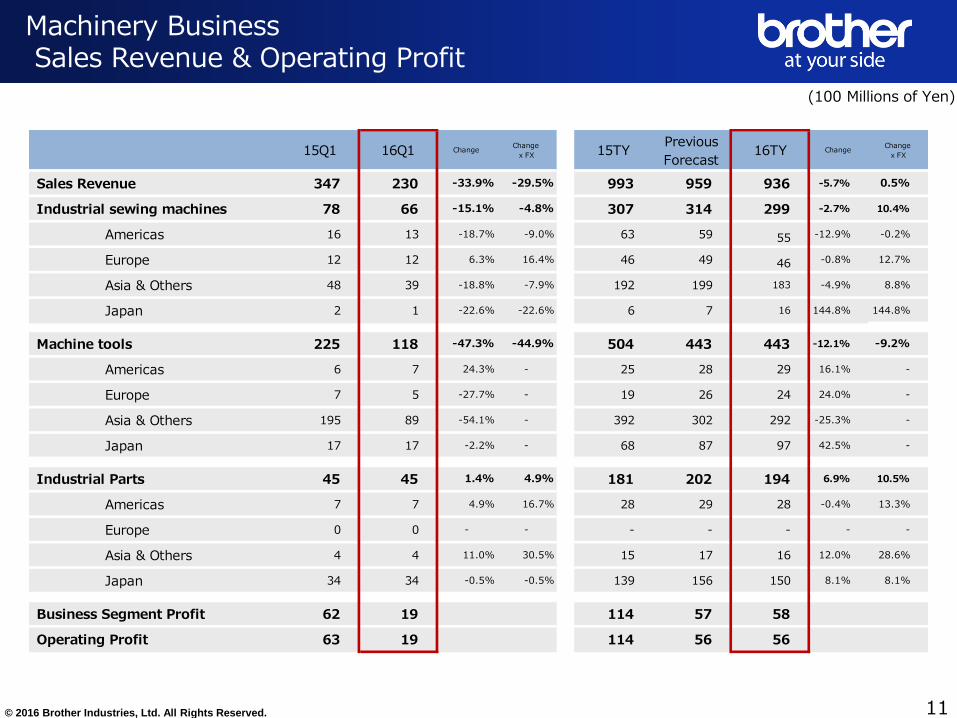
Machinery Business Sales Revenue & Operating Profit
15Q1 16Q1 ChangeChange
x FX 15TYPrevious
Forecast16TY Change
Change
x FX
Sales Revenue 347 230 -33.9% -29.5% 993 959 936 -5.7% 0.5%
Industrial sewing machines 78 66 -15.1% -4.8% 307 314 299 -2.7% 10.4%
Americas 16 13 -18.7% -9.0% 63 59 55 -12.9% -0.2%
Europe 12 12 6.3% 16.4% 46 49 46 -0.8% 12.7%
Asia & Others 48 39 -18.8% -7.9% 192 199 183 -4.9% 8.8%
Japan 2 1 -22.6% -22.6% 6 7 16 144.8% 144.8%
Machine tools 225 118 -47.3% -44.9% 504 443 443 -12.1% -9.2%
Americas 6 7 24.3% - 25 28 29 16.1% -
Europe 7 5 -27.7% - 19 26 24 24.0% -
Asia & Others 195 89 -54.1% - 392 302 292 -25.3% -
Japan 17 17 -2.2% - 68 87 97 42.5% -
Industrial Parts 45 45 1.4% 4.9% 181 202 194 6.9% 10.5%
Americas 7 7 4.9% 16.7% 28 29 28 -0.4% 13.3%
Europe 0 0 - - - - - - -
Asia & Others 4 4 11.0% 30.5% 15 17 16 12.0% 28.6%
Japan 34 34 -0.5% -0.5% 139 156 150 8.1% 8.1%
Business Segment Profit 62 19 114 57 58
Operating Profit 63 19 114 56 56
(100 Millions of Yen)
Page 12
© 2016 Brother Industries, Ltd. All Rights Reserved.
-3
3
-5
18 18
-2.9%
2.2% -0.9%
3.4% 3.5%
15Q1 16Q1 15TY Previous
Forecast
16TY
119 126
539 525 518
15Q1 16Q1 15TY Previous
Forecast
16TY
12
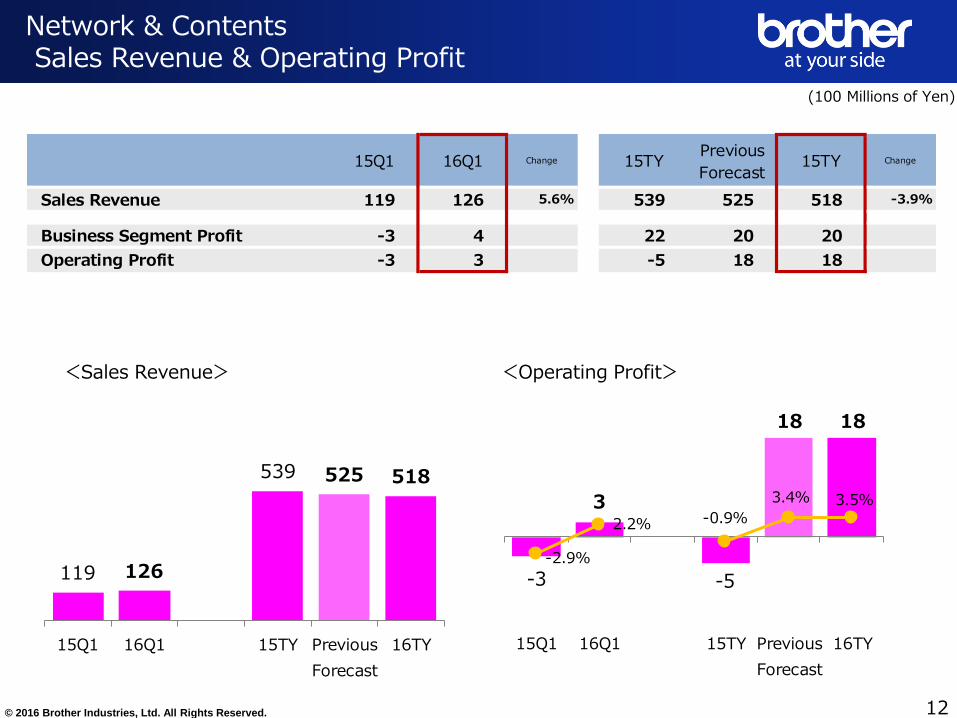
Network & Contents Sales Revenue & Operating Profit
<Sales Revenue> <Operating Profit>
15Q1 16Q1 Change 15TYPrevious
Forecast15TY Change
Sales Revenue 119 126 5.6% 539 525 518 -3.9%
Business Segment Profit -3 4 22 20 20
Operating Profit -3 3 -5 18 18
(100 Millions of Yen)
Page 13
© 2016 Brother Industries, Ltd. All Rights Reserved. 13
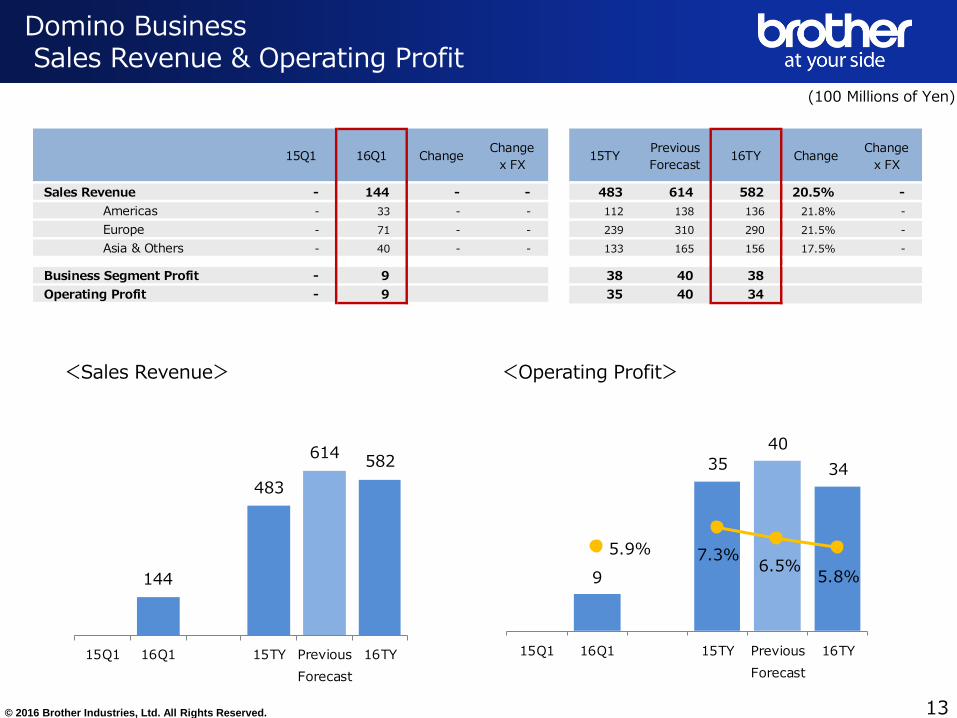
Domino Business Sales Revenue & Operating Profit
15Q1 16Q1 ChangeChange
x FX15TY
Previous
Forecast16TY Change
Change
x FX
Sales Revenue - 144 - - 483 614 582 20.5% -
Americas - 33 - - 112 138 136 21.8% -
Europe - 71 - - 239 310 290 21.5% -
Asia & Others - 40 - - 133 165 156 17.5% -
Business Segment Profit - 9 38 40 38
Operating Profit - 9 35 40 34
144
483
614582
15Q1 16Q1 15TY Previous
Forecast
16TY
9
35
40
34
5.9% 7.3%6.5%
5.8%
15Q1 16Q1 15TY Previous
Forecast
16TY
<Sales Revenue> <Operating Profit>
(100 Millions of Yen)
Page 14
© 2016 Brother Industries, Ltd. All Rights Reserved.
62 66
415376 372
76 86
349 377 349
14
Inventories (100 Millions of yen)
R&D expenses (100 Millions of Yen)
Capital expenditure / Depreciation & amortization (100 Millions of Yen)
(Number of months)
R&D expenses / Capital expenditure / Depreciation and amortization / Inventories
15Q1 Act
16TY Previous Forecast
15TY Act
16Q1 Act
Inventories Inventories / Cost of sales
Capital expenditure Depreciation & amortization
*Jun-15 actual for Inventories does not include Domino business figures.
16TY Fct
1,071
1,251 1,2921,224 1,302
1,400 1,3751,269
1,133
3.64.2
3.5 3.74.0 4.0 3.9 4.1 4.0
Jun-14 Sep-14 Dec-14 Mar-15 Jun-15 Sep-15 Dec-15 Mar-16 Jun-16
104 97
460 454 446
15Q1 Act
16TY Previous Forecast
15TY Act
16Q1 Act
16TY Fct