88
Fiscal Year 2018-2019 Annual Report for the

Fiscal Year
2018-2019
Annual Report
for the
Table of Contents
Page
Executive Summary 1
Monthly Operations Report Summary 2
Plant Performance 9
Environmental, Health and Safety 14
System Assessment and Status 16
Personnel 16
Training 16
Customer Service 17
Energy Generation Facility 18
EGF Preventative Maintenance 18
ITS Program 19
Repairs & Replacements 19
Modifications & Improvements 26
Energy Distribution System 28
EDS Preventative Maintenance 28
Routine Maintenance & Emergency Repairs 28
DES Projects 37
Outstanding Issues and Recommendations 40
Sales and Marketing 41
Utilities and Fuel Procurement 42
Financial Report 46
Appendix 1 – Customer List 47
Appendix 2 – Consumption & Revenues 49
Appendix 3 – Customer Rate Reconciliation 51
Appendix 4 – CNE Invoice Reconciliation (FEA) 66
Exhibit 1 – Performance Guarantee Calculations 72
Exhibit 2 – Information Technology System Program 76
Exhibit 3 – Constellation Assets 84

Executive Summary
On behalf of Constellation NewEnergy, Inc. (CNE), operator of the Metro Nashville District
Energy System (DES), I am pleased to present the sixteenth “Annual Report” to the Metropolitan
Government of Nashville and Davidson County, Tennessee (Metro).
The DES is made up of two basic parts, the Energy Generation Facility (EGF) and the Energy
Distribution System (EDS). This report summarizes activities related to the performance of the
DES for the period July 1, 2018 through June 30, 2019.
CNE has been operating and managing the Nashville District Energy System for over fifteen years.
A two-year contract extension was negotiated and executed when the initial contract term expired
on December 17, 2018.
CNE’s work force continues to operate and maintain the DES in a manner that produces
outstanding results. Both steam and chilled water availability and reliability were greater than 99%
and all contractual guarantees were met. CNE’s environmental record remains intact with zero
excursions, violations or fines. All data, records, reporting requirements and submittals are kept
up to date and in order. CNE employees continue to volunteer, participate in community service
projects, fund-raising activities and the DES customers are reported to be happy with the services
they are being provided.
Sincerely,
Tim Hestle
Plant/General Manager

- 2 -
Monthly Operations Report Summary
Constellation NewEnergy, Inc. (CNE) submits a written report to the Metro Nashville District Energy System (DES) team on or about the 10 th day of each month to convey the operational activities of the prior month. These reports are broken up in to four major sections. The first item included in each report is the Summary. This section gives an overview of the entire report, addresses news, events, and other business activities. The next section is Operations, which includes plant reliability and efficiency data, environmental, health & safety, accidents, personnel, and employee training. The third section of the report lists and discusses all Maintenance activities in and around the Energy Generation Facility (EGF). Items covered in this section include the building and grounds, warranty issues, preventive and predictive maintenance and construction projects. The final section of these reports is about the Energy Distribution System (EDS). Items discussed in this section are customers, sales and marketing, system maintenance and repairs, and distribution system projects.
Operations Summary
The EGF continued to furnish reliable steam and chilled water service to the DES customers over
the past twelve months. There was one chilled water outage, one steam outage and one cold plant
outage.
• A seven-hour chilled water outage took place February 18, 2019 to replace the isolation
valves on #5 Chiller.
• A cold plant outage took place April 5, 2019 to allow NES to make repairs to their
equipment in the EGF switch gear yard prior to isolating their Central feed for the NFL
draft.
• On June 28, 2019, a seven-hour steam outage was required to replace the feed water bypass
valve on #1 boiler.
Some DES customers requested service interruptions so they could make repairs in their respective
buildings and some sections of the EDS were isolated to make steam and chilled water repairs.
Apart from these, there have been no significant service interruptions.
The plant is fully staffed with an outstanding work force. There were two reportable and zero lost
time accidents for the year. Training classes were conducted in conjunction with the monthly
Safety Meetings. Employees also received training related to plant systems, equipment and
corporate programs and requirements. For the sixteenth consecutive year, there were no
environmental excursions or violations.
Maintenance activities were performed as scheduled in the EGF and in the EDS. A great deal of
planning and coordination go into the project work both in the plant and in the distribution
system.
Communications with the DES customers are performed on a routine basis. Any issues they might
have are dealt with courteously and expeditiously. According to the annual customer survey, they
are satisfied with the services we are providing.

- 3 -
News, Events & Other Business
Routine business activities such as the Monthly Operations Meeting and Natural Gas Purchasing
conference calls were conducted as scheduled each month. Other news and events include the
following:
• A quarterly review was held with the plant’s chemical vendor July 13, 2018
• Metro Fire Department conducted fire safety training July 24, 2018
• Exelon insurance carrier conducted a Boiler and Machinery site evaluation July 24, 2018
• An insurance property appraisal was conducted July 27, 2018
• A draft copy of FY18 Annual Report issued to Metro July 31, 2018
• Met with Trane regarding a new control system August 9, 2018
• MNDES Advisory Board met in EGF conference room August 16, 2018. A presentation was
made by FVB during this meeting.
• Reviewed Annual Report with TEG August 27, 2018
• A special meeting of the MNDES Advisory Board was held in EGF conference room
September 18, 2018. Metro notified the board of their plans to move forward with an RFP to
sell the DES and/or operate the DES.
• Employees participated in a Habitat for Humanity project in Gallatin, TN October 3, 2018
• Plant GM attended Tennessee Chamber of Commerce meeting October 15, 2018
• Employees, family members and friends participated in the Nashville Walk to End
Alzheimer’s October 25, 2018
• Plant GM attended Tennessee Titans Suite Holders meeting October 29, 2018
• Employees participated in the Making Strides Against Breast Cancer walk November 3,
2018
• A meeting was held with Metro and Rolling Mill Hill developers regarding the possibility of
reopening Crockett Street through the EGF parking lot.
• CNE employees enjoyed their annual Thanksgiving potluck lunch November 16, 2018
• The plant’s 15-year anniversary occurred December 17, 2018. Metro gave Constellation a 2-
year contract extension.
• Employees celebrated at their annual Christmas Lunch held December 21, 2018.
• Several meetings were held to discuss the possibility of reopening Crockett Street.
• EDS and EGF tours were conducted for Metro RFP respondents January 8, 2019
• Employees enjoyed a BBQ Lunch provided by Trane January 11, 2019
• A quarterly review was held with the plant’s chemical vendor January 18, 2019
• Submitted required Environmental reports and documents to the proper authorities
throughout the month of January.
• Natural Gas meeting with International F. C. Stone, Metro and CNE February 11, 2019

- 4 -
• CNE’s Plant/General Manager attended the annual Tennessee Chamber of Commerce
meeting February 19, 2019
• MNDES Advisory Board met in EGF Conference Room February 21, 2019
• CNE’s Management Team met with Nashville employees March 13, 2019
• Metro issued a letter of intent to Engie to sell the MNDES on March 22, 2019
• Stored propane was sold back to vendor March 25, 2019
• NES conducted a power outage April 5, 2019 which took the plant down for approximately
four hours. CNE coordinated the timing of the outage with NES & the MNDES customers to
lessen its impact.
• Engie Representatives were onsite, at the EGF, April 10th – 12th performing due diligence
activities. CNE & TEG personnel assisted Engie in this effort.
• CNE’s Plant GM and OPS Manager attended the Tennessee 811 annual meeting on April 24,
2019.
• CNE has protested Metro’s letter of intent to sell Engie the MNDES. CNE had a hearing
with Metro’s Purchasing Agent April 24, 2019.
• CNE’s Office Coordinator attended a meeting with the Sumner County Habitat for Humanity
organization to investigate potential volunteer activities.
• CNE Managers attended a fund raiser for “Live Love Nashville”. This organization aids
under privileged children in the Nashville area.
• CNE Managers also attended a fund raiser for “Jovenes en Camino”, an Orphans Home in
Honduras.
• State Building Facility Managers toured the EGF May 1, 2019.
• CNE continued to provide Engie with due diligence information during the month of May.
• A quarterly water treatment review was held with the plant’s chemical vendor May 3, 2019.
• NES re-energized the central electrical feed to the EGF May 8, 2019. This was shut down for
the NFL draft.
• CNE managers attended the Association of Energy Engineers annual meeting May 10, 2019.
• The MNDES Advisory Board met in the EGF Conference Room May 16, 2019.
• The 27th Annual CNE/NDE Golf Tournament was held May 18, 2019.
• The annual MNDES Customer meeting was held in the Downtown Partnership Meeting
Room May 23, 2019.
• Metro’s purchasing agent issued a determination letter May 23, 2019 regarding CNE’s
protest of RFQ 1044673.
• CNE filed a Notice of Appeal to the Procurement Appeals Board on May 30, 2019 regarding
RFQ 1044673.
• CNE Managers attended National Boiler Service Annual Meeting on June 7, 2019

- 5 -
Community Service Activities
Constellation employees continue to participate in community service and fund-raising activities.
The following are examples of service activities:
• Employees participated in a Habitat for Humanity project in Gallatin, TN October 3, 2018.
CNE employees painted the porches and shutters on this Habitat for Humanity house. They
also moved appliances. The organization plans to sell this house to raise money to purchase
more property.
Participants included (l to r): Eddie Wisdom, Daniel Steger, Steven Wheeler, Angela West, Tim Hestle and Andy Street.

- 6 -
• On Saturday October 27, 2018, CNE employees and family members participated in the
“2017 Walk to End Alzheimer's - Nashville Walk”. This 2.5 mile walk around Rolling Mill
Hill began and ended at the Music City Hall of Fame Park across the street from the Country
Music Hall of Fame. This group walked in the rain on one of the first cool mornings of the
month. I am proud to report the group exceeded their fund-raising goal.
Participants included (l to r): Elecia Adcock, Ray Adcock, Jan Watt, Tim Hestle, Katherine Bowman, Steve Bowman
and Gayle Bowman.

- 7 -
• On Saturday, November 3, 2018, CNE employees and family members met at the Energy
Generation Facility to participate in the 4.5 mile “2018 Making Strides Against Breast
Cancer Nashville Walk”. It began and ended at Nissan Stadium after circling downtown.
With our walk to and from the stadium, we logged an extra mile.
Participants included: (kneeling) Angela West & Elecia Adcock (standing) Anna Moeller, Kara Moeller, Lynn Moeller,
Doug Moeller, Ray Adcock, Gayle Bowman and Steve Bowman

- 8 -
Constellation/Nashville District Energy Invitational Golf Tournament
The 26th Annual Constellation/Nashville District Energy Invitational Golf Tournament was held at
Twelve Stones Golf Course in Goodlettsville, Tennessee on May 18, 2019. This was the 16th
consecutive year the event was organized and put on by Constellation NewEnergy, Inc. Players
included NDES customers, contractors, vendors, employees, family and friends. The winning team
shot a 13 under par round of 59. Their nearest competitor shot 63. Ed Ezell won the “Closest-to-the-
Pin” contest and Chad Pace was awarded the prize for the “Longest Drive” contest. First place team
members and the individual contest winners each received a trophy and a cash prize.
First Place Team: Ron Richards, Andrew Orel, Zack Rushing and Ricky Gibbs
Ed Ezell Chad Pace
Constellation sponsored a Hole-in-One contest on all the par 3 holes and provided lunch for
participants. This year’s event was another tremendous success, and everyone is already looking
forward to the next one.

- 9 -
Plant Performance
Facility Operations
Plant Reliability The EGF continued to provide reliable service to the DES customers. With the exception of
uncontrollable circumstances, the guarantees are to maintain 150 psig of export steam pressure
leaving the EGF and deliver 43.3-degree F chilled water to each customer. The following items
describe minor incidents, short in duration, when the EGF experienced an excursion outside
parameters of the performance guarantees.
• On July 11, 2018, NES had an electrical power glitch on their 161kV line which caused the
chillers, condenser water and chilled water pumps to trip offline. All equipment was
immediately restarted. The chilled water supply temperature reached 47.2°F before returning
to normal approximately 50 minutes later.
• On July 20, 2018, Trane requested #3 Chiller be started to check for proper operation. The
chiller did not load up properly and the send out temperature gradually rose to 45°F before
an additional chiller was started. Trane found a problem with the purge unit and made the
repair. The chilled water supply temperature returned to normal in approximately 90
minutes.
• On September 18, 2018, at approximately 5:00 p.m., #4 Boiler tripped off line due to flame
failure. The boiler was immediately restarted, but system pressure was below 150 psi for 30
minutes with a low pressure of 138 psi.
• On September 19, 2018, at approximately 8:40 p.m., #4 Boiler tripped off line again due to
flame failure. This time another boiler was placed in service. System pressure and was below
150 psi for 30 minutes with a low pressure of 129 psi. The cause of the failure is still under
investigation.
• On September 28, 2018, at approximately 12:10 p.m., the pressure dropped to 139 psi while
putting another boiler online due to an increase in load demand. The steam system was
below 150 psi for approximately 45 minutes.
• On December 23, 2018, #3 Boiler tripped off line. #2 Boiler was immediately started. The
steam pressure was below 150 psi for approximately 60 minutes reaching a low of 120 psi.
• On December 24, 2018, #3 Boiler tripped again. This was due to a flame scanner
malfunction. Another Boiler was started, but steam pressure went below 150 psi for
approximately 90 minutes reaching a low of 64 psi. Repairs were made to the existing flame
scanner and a new flame scanner was ordered.
• On January 15, 2019, the chilled water temperature was above the 43.3 ℉ guarantee for 34
minutes. On January 22, 2019, the chilled water temperature was above the guarantee for 60
minutes. Both of these excursions were the result of swapping chillers to perform annual
maintenance. The highest temperature reading during these times was 44.2℉.
• On January 21, 2019, the steam pressure dropped below 150 psi for approximately 105
minutes due to an issue with the damper controller on #4 Boiler that would not allow the
firing rate to exceed 55%. This has been corrected.

- 10 -
• On February 18, 2019, the chilled water temperature was above the 43.3 ℉ for
approximately 7 hours due to the scheduled chilled water outage to replace valves in the
Plant.The outage was scheduled for 12 hours but was completed early due to the diligence of
CNE employees and contractors.
• On March 9, 2019, a lightning strike caused Switch Gear 1A to trip off line. The plant was
immediately re-started. Steam pressure was below 150 psi for approximately 60 minutes,
reaching a low of 102 psi. The chilled water temperature was above 43.3 ℉ for
approximately 16 minutes, which is not a reportable incident. SWG 1A had to go through an
extensive rebuild.
• On April 5, 2019 , the plant was shutdown to allow NES to perform maintenance on the air
switches on their side of the electrical switchyard. The chilled water temperature was above
43.3℉ for approximately 5 hours and the steam was below 150 psi for approximately 7
hours.
• On May 7, 2019, while restoring chilled water service to the Renaissance Hotel after they
had made repairs inside their building, the valves were opened too quickly. As the building
refilled, the system chilled water temperature went above 43.3℉ for approximately 40
minutes. The highest temperature recorded was 46.3℉.
• On June 28, 2019, CNE Maintenance personnel replaced a feedwater bypass valve at the
Plant which required the steam system to be shutdown. The steam pressure was below 150
psi for approximately 7 hours.
Constellation is required to report upsets that last longer than thirty minutes. The following table
includes every minute the plant was outside the contractual service delivery parameters, whether
reportable or not, and not necessarily down. Reliability does not include scheduled outages
allowed per the Amended and Restated Management Agreement (ARMA).
Downtime
Availability
Reliability Scheduled Unscheduled
Boilers 840 minutes 420 minutes 99.84% 99.92%
Chillers 720 minutes 290 minutes 99.86% 99.94%
- 11 -
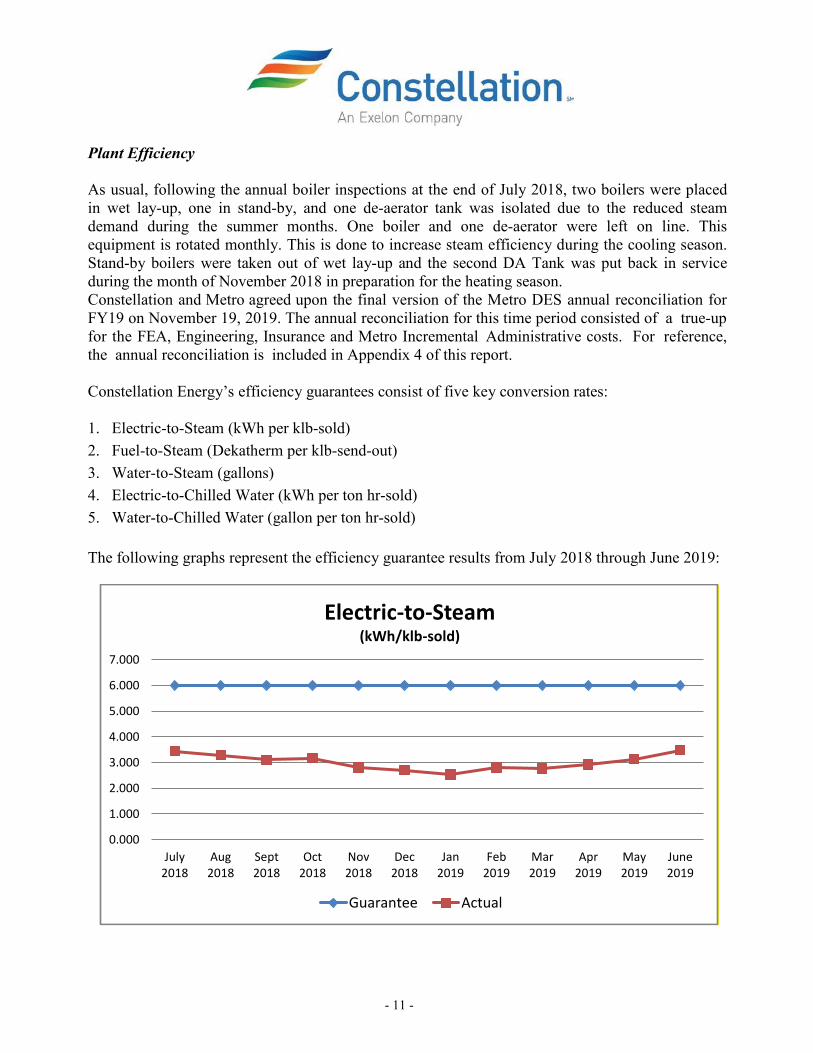
Plant Efficiency As usual, following the annual boiler inspections at the end of July 2018, two boilers were placed
in wet lay-up, one in stand-by, and one de-aerator tank was isolated due to the reduced steam
demand during the summer months. One boiler and one de-aerator were left on line. This
equipment is rotated monthly. This is done to increase steam efficiency during the cooling season.
Stand-by boilers were taken out of wet lay-up and the second DA Tank was put back in service
during the month of November 2018 in preparation for the heating season.
Constellation and Metro agreed upon the final version of the Metro DES annual reconciliation for
FY19 on November 19, 2019. The annual reconciliation for this time period consisted of a true-up
for the FEA, Engineering, Insurance and Metro Incremental Administrative costs. For reference,
the annual reconciliation is included in Appendix 4 of this report.
Constellation Energy’s efficiency guarantees consist of five key conversion rates:
1. Electric-to-Steam (kWh per klb-sold)
2. Fuel-to-Steam (Dekatherm per klb-send-out)
3. Water-to-Steam (gallons)
4. Electric-to-Chilled Water (kWh per ton hr-sold)
5. Water-to-Chilled Water (gallon per ton hr-sold)
The following graphs represent the efficiency guarantee results from July 2018 through June 2019:
0.000
1.000
2.000
3.000
4.000
5.000
6.000
7.000
July2018
Aug2018
Sept2018
Oct2018
Nov2018
Dec2018
Jan2019
Feb2019
Mar2019
Apr2019
May2019
June2019
Electric-to-Steam(kWh/klb-sold)
Guarantee Actual

- 12 -
1.000
1.200
1.400
1.600
1.800
July2018
Aug2018
Sept2018
Oct2018
Nov2018
Dec2018
Jan2019
Feb2019
Mar2019
Apr2019
May2019
June2019
Fuel-to-Steam(Dth/klb-send out)
Guarantee Actual
0
500000
1000000
1500000
2000000
2500000
July2018
Aug2018
Sept2018
Oct2018
Nov2018
Dec2018
Jan2019
Feb2019
Mar2019
Apr2019
May2019
June2019
Water-to-Steam(gallons)
Guarantee Actual

- 13 -
0.000
0.250
0.500
0.750
1.000
1.250
1.500
July2018
Aug2018
Sept2018
Oct2018
Nov2018
Dec2018
Jan2019
Feb2019
Mar2019
Apr2019
May2019
June2019
Electric-to-Chilled Water(kWh/ton hr-sold)
Guarantee Actual
0.000
1.000
2.000
3.000
4.000
5.000
6.000
July2018
Aug2018
Sept2018
Oct2018
Nov2018
Dec2018
Jan2019
Feb2019
Mar2019
Apr2019
May2019
June2019
Water-to-Chilled Water(gals/ton hr-sold)
Guarantee Actual

- 14 -
Environmental, Health and Safety
Environmental There have been no environmental violations since the plant began commercial operations in
December 2003.
Storm water samples were collected, inspections conducted, and a report was generated quarterly. A
Storm Water Pollution Prevention Plan (SWPPP) and a Spill Prevention Controls and
Countermeasures (SPCC) refresher training class was also conducted.
The Metro Health Department conducted Radon testing in the EGF 4/23/19 – 4/25/19. All test
results were within acceptable limits.
Regulatory Compliance
Required reporting activities were submitted as follows:
• The Semi-Annual Emissions Monitoring Report for January-June 2018 was sent to the Metro
Nashville Health Department on July 18, 2018.
• The Semi-Annual Monitoring Report for July-December 2018 was sent to the Metro Health
Department on January 10, 2019.
• The Title V Certificate of Compliance for 2018 was sent to the EPA on January 10, 2019. A
copy was also sent to the Metro Health Department the same day.
• The Annual Emission Inventory Report for 2018 was sent to the Metro Health Department
on January 31, 2019. The Annual Emission Fees were also sent in on that date.
• The Tier II report was sent to the State Emergency Planning Committee, Davidson County
LEPC and the Nashville Fire Department on January 22, 2019.
• The Annual Greenhouse Gas Report was sent to the U.S. EPA on February 15, 2019.
• The Metro Health Department conducted the Annual Site Inspection and Record Review on
April 4, 2019 and found no issues.
• The Metro Health Department renewed the Operating Permit for 5 years on May 31, 2019.
Health Due to the increasing cost of health insurance and Constellation’s commitment to their employee’s
wellbeing, several programs are offered throughout the year. Many Nashville employees have
taken advantage of the Healthy Habits Program, Healthy Eating Program and two Walking
Challenge Programs.

- 15 -
Safety CNE plant personnel continue to conduct themselves in a safe manner. There were two reportable
accidents in the past year. An employee slipped on a ladder while exiting the EDS tunnel and
injured his shoulder. Another employee injured his hand while repairing this same ladder.
Monthly safety meetings were coordinated and scheduled by the CNE site Safety
Officer. Training classes are conducted in conjunction with each safety meeting. Safety and
accident reports are issued and posted each month.
The refrigerant alarm and gas monitors are checked weekly. Preventative maintenance and
calibrations are performed monthly on the portable gas monitors used in the EDS. Fire
extinguishers are also checked monthly.
Per OSHA, the NEC and NFPA 70E 1910 Subpart S, our arc flash Personal Protective Equipment
was sent out for inspection and recertification as required.
Accident Report
Total OSHA Lost Time Total
Accidents Reportable Accidents Lost Days
July 2018 0 0 0 0
August 1 1 0 0
September 0 0 0 0
October 0 0 0 0
November 0 0 0 0
December 1 1 0 0
January 2019 0 0 0 0
February 0 0 0 0
March 0 0 0 0
April 0 0 0 0
May 0 0 0 0
June 0 0 0 0
Total 2 2 0 0

- 16 -
System Assessment and Status Personnel
The plant is fully staffed with an exceptional work force. CNE prides itself on keeping employees
engaged which results in a very low turnover rate. The consequences of having an aging
workforce have been several employees missing work to deal with medical issues this year. While
this has not impacted Metro, it has resulted in a substantial amount of overtime for CNE.
Training
To maintain and operate the facility safely, reliably and efficiently a significant amount of
employee training is required. The following demonstrates some of the training that was
conducted throughout the year:
• Managers participated in Exelon Innovation Training in July 2018.
• Employees received computer Phishing Awareness Training in July 2018.
• Employees completed Exelon D&I Awareness Training in August 2018.
• Employees received corporate “Respectful Workplace” training February 12-13, 2019.
• Employees completed corporate FERC Training & Phishing Awareness
Training in May 2019.
Training classes conducted in conjunction with our monthly safety meetings included:
• Fire Safety (Annual Fire Extinguisher refresher conducted by the Metro Fire Department)
• Accident Investigation, Reporting & Record Keeping
• Tool & Equipment Safety
• Compressed Gas Cylinder Safety & Hot Work
• Confined Space Entry
• Storm Water Pollution Prevention Plan & Spill Prevention, Controls & Countermeasures
• Bloodborne Pathogens, Heat Stress & Cold Stress
• Steam Safety & Refrigerant Safety (conducted by the Constellation’s Plant Safety Officer)
• Lock out/Tag out
• Safe Work Practices
• Elevated Work & Vehicle Safety
• Personal Protective Equipment
• Chemical Safety & Hazard Communications

- 17 -
Customer Service
CNE personnel routinely communicate with the customers each month through e-mails, phone calls
or visits. When customers have heating or cooling issues inside their buildings, we assist them
with trouble-shooting and attempt to resolve their problems. When a service interruption is
required, whether it is project related or an emergency, activities are coordinated closely with the
customers to keep the impact to a minimum.
The annual MNDES customer meeting took place May 23, 2019 in the Downtown Partnership
conference room. MNDES Contract Administrator personnel made a power point presentation
regarding the state of the EDS, upcoming projects, fuel costs, water treatment and several other
issues.
DES customers are routinely invited to participate in the Constellation/Nashville District Energy
Annual Golf Tournament, attend Tennessee Titans football games, or meet for breakfast or lunch.
These relationships help further a positive image of the DES in the community and promote
existing building owners to assist us in our sales efforts.
CNE’s Customer Service Representative reviews each customers meter readings monthly. For those
who do not meet their contractual chilled water return temperature requirements, a Thermal-
Inefficiency-Fuel-Surcharge (TIFS) penalty is assessed. TIFS are added directly to customer
invoices.
When a customer habitually exceeds their contractual demand capacity, the meter data is sent to
the MNDES Contract Administrator for review and evaluation. The reason for the excursion is
investigated and suggestions are made to keep it from reoccurring. If a capacity adjustment is
deemed appropriate, a letter is sent to the customer with an explanation of the adjustment and its
duration.

- 18 -
Energy Generation Facility and Equipment Maintenance
During normal operation, preventative, predictive and routine maintenance items must be scheduled
and completed. During the summer months the lawn is mowed weekly and landscaping is routinely
manicured. This includes trimming trees and shrubs, putting mulch in the beds, maintaining the
irrigation system and removing dead plants. The building and grounds are policed daily and the
lighting is maintained year-round. The carpeting is shampooed in the office areas and the tile floors
are stripped, waxed and sealed annually.
EGF Preventive and Predictive Maintenance
The following items were accomplished to increase equipment life, reliability, efficiency and
safety:
CNE personnel perform daily equipment inspections, check bearing temperatures, oil levels, belt
tensions, etc. In addition, preventative maintenance is performed on the following equipment
monthly: HVAC units, cooling towers cell, condenser water pumps, chilled water pumps, boiler
feed water pumps, condensate pumps, motors, instrument air compressors and driers. The roof
surface is inspected and cleaned. The propane system is also test fired and leak checked monthly.
Annual pressure vessel inspections are scheduled to be completed during the cooling season. The
inspections are conducted by F. M. Global. They are State Certified Boiler Inspectors, working as a
subcontractor to our insurance carrier. These inspections are required in order to renew our
operating permits. Boiler inspections consist of a visual examination of the mud drum, steam drum,
economizer, tubes and fire box. #2 and #4 boilers and #1 de-aerator tank were inspected in July
2018. #1 and #3 boilers and #2 de-aerator tank were most recently inspected in June 2019. All
units received a passing grade and their respective permits have been renewed. #2 and #4 boilers
and #1 de-aerator are scheduled to be re-inspected in July 2019.
Inspections were witnessed by our chemical vendor’s representative and plant personnel. When
units are off line for inspection, preventative maintenance is performed on the forced draft fans, low
water cut out switches and other associated equipment.
Annual chiller inspections are scheduled and executed during the heating season as a good
maintenance practice. These inspections include opening the condensers and cleaning the tubes,
performing vibration analysis and taking oil sample analysis on each chiller. Eddy current testing
was conducted on the evaporator and condenser on #1, #5 and #9 Chillers. Controls and purge units
were also checked for proper operation.
As part of the Preventive and Predictive maintenance program CNE had a contractor take alignment
and vibration readings on all pumps, fans and motors. These readings are compared to the previous
year’s readings. Misalignment Issues discovered with #4 Boiler Feed Water Pump and #2
Condenser water pump were addressed. All other equipment readings were within acceptable
limits.
Infrared testing was conducted on all electrical switchgears and starters. No problems were found
during this testing.

- 19 -
The high-voltage switch gear preventive maintenance was scheduled and executed during the fall
on the following equipment: transformers, vacuum breakers, relays, load break switches, infrared
inspections and oil sample analysis.
Annual maintenance costs for these activities: $126,507.82 (excludes salaried personnel & corporate
overhead).
Information Technology System Program
The Information Technology System Program is reviewed with Metro annually. The last review
was conducted on August 27, 2018. A copy of the program is included in Exhibit 2 of this report. A
few minor changes have been made during the past 12 months.
Repairs and Replacements
From time to time emergency repairs and replacements must be made. The following are examples
of the routine maintenance and emergency repairs that have been performed in the EGF:
July 2018
• Mow/weed eat/herbicide property/trimmed shrubs (weekly from March -November)
• Repaired lawn irrigation system
• Checked & repaired plant computers
• Replaced plant server
• Repaired plant lighting
• Began replacement of softener controls
• Installed gantry and hoist on mezzanine
• Replaced Control Room door lock
• Repaired water column leak on #2 Boiler
• Replaced thermometers on #1 Boiler
• Repaired low water cut out - #1 and #3 Boilers
• Repaired DA Tank vent lines
• Repaired Boiler Feed Water Valves
• Replaced HVAC unit in Control Room
• Replaced ceiling tiles in Control Room
• Repaired refrigerant alarm
• Installed new cooling tower blow down meter and valve
• Repaired propane pump switch
• Repaired leak in Vaporizer
• Checked equipment after NES power glitch
• Assisted contractor repair tube leak in #1 Boiler

- 20 -
August 2018
• Replaced softener controls
• Fabricated cooling tower make-up line spool piece
• Repaired softener sample line
• Repaired low water cut out on #1 Boiler
• Repaired low water cut out on #3 Boiler
• Trane reprogrammed Dyna-view on #8 Chiller
• Repaired 1B & 9A Chiller starters
• Checked PRV's at DA
• Installed motorized ball valve to blow down instrument air compressor
• #2 CWP motor bearing replacement
• Replaced #4 Boiler Walchem probe
• Replaced actuator on cooling tower blow down valve
• Cleared nozzles on #1 and #9 cooling towers
• Repaired float switch on #18 cooling tower
• Assisted Roto-Rooter clear floor drains
• Checked & adjusted packing on all pumps
• Repaired cooling tower M/U line leak
• Replaced wheels on hand truck
• Disconnect switches on transformers during daily blasts (DES-148)
• Assisted geologist remove seismograph equipment (DES-148)
September 2018
• Checked softener flow meter
• Trane checked 6A Chiller (Thrust bearing needs to be replaced)
• Removed refrigerant from 6A Chiller
• Repaired control air piping
• Checked #1 chilled water pump and VFD
• Checked #4 Boiler continuous blow down valve
• Checked cooling tower level transmitter
• John Bouchard and Son’s replaced pressure switch on fire sprinkler system
• Checked & adjusted packing on all pumps
October 2018
• Replaced #4 Boiler safety switch & checked wiring
• Trane replaced thrust bearing in 6A Chiller
• Check flow meter on #6 chiller
• Adjusted regeneration frequency on softeners
• Sent #2 CWP motor out for repair

- 21 -
• Repaired #14 Cooling Tower fan shroud
• Repaired #4 chiller inlet valve
• Checked cooling tower level transmitter
• Checked & adjusted packing on all pumps
• Repaired Camera 3
• Replaced battery in MBC 4
• Replaced gauge on #3 BFWP
• Trane replaced temp. sensor on #9 Chiller
• Trane replaced purge sensor on #8 Chiller
• Sealed transformer cabinets
• Repaired door knob on mezzanine level
• Replaced battery in AED
• Repaired breakroom sink
• Siemens worked on boiler communications with Insite
November 2018
• Repaired gas valve on #3 Boiler
• Checked & adjusted packing on all pumps
• Checked Softener control valves
• Repaired #1 Softener limit switch
• Repaired #2 CWP motor
• Repaired #1 DA low level alarm
• Repaired #4 Boiler Walchem B/D Valve
• Repaired #2 Boiler Walchem B/D Valve
• Repaired starter and vibration switch on #7 cooling tower
• Checked fan on #18 cooling tower
• Cleaned flow meter on #2 Softener
• Replaced toilet flush valves in Men's Room
• Repaired service air compressor
• Adjusted belts on #5, 10 & 18 cooling tower fans
• CE Power performed main SWG auto transfer investigation
December 2018
• Adjusted #4 Boiler O₂
• Installed chain operators on DA Tank isolation valves
• Checked & adjusted packing on all pumps
• Repaired service air compressor
• Repaired MBC 6
• Repaired #3 Boiler flame scanner

- 22 -
• Repaired Genie Lift
• Replaced #4 Boiler Walchem
• Repaired #14 cooling tower inlet valve
• Replaced solenoid on #9 Chiller
• Checked plant water meters
• Winterized Boiler Room
January 2019
• Repaired & insulated cooling tower equalizing line
• Installed rebuilt motor on #2 CWP
• Checked & adjusted packing on all pumps
• Replaced leaking section of cooling tower makeup line
• Repaired MBC-449 Chemical Tank
• Replaced #3 Boiler flame scanner
• Repaired faucet on lab sink
• Repaired Genie Lift
• Adjusted belt on #4 Cooling Tower
• Replaced gauges on BFWPs
• Repaired #3 Boiler feed water valve
• Repaired starter on #3 BFWP motor
• Replaced sensor in burner O₂ analyzer
• Checked/replaced Softener controls
• Repaired chilled water makeup meter
• Assist MWS repair leak on plant water meter
• Replaced empty compressed gas cylinders
• Repaired low water cut out switch on #1 Boiler
• Repaired oil pump on #7 Chiller
• Replaced purge sensor on #4B Chiller
February 2019
• Replaced damaged ceiling tiles in hallway
• Repaired actuator on #17 cooling tower
• Checked & adjusted packing on all pumps
• Cleaned evaporator flow tube on #2 chiller
• Repaired regulator on #6 chiller
• Repaired refrigerator in break room
• Repaired drain on #18 Cooling Tower
• Painted chiller condenser covers

- 23 -
• Replaced gauge on #5 CWP
• Replaced gauges on #3 BFWP
• Repaired #17 cooling tower isolation valve
• Repaired starter on #3 BFWP motor
• Replaced isolation valves on #5 Chiller (scheduled outage)
• Checked Softener controls
• Assist MWS replace plant water meter scanner
• Moved furniture/striped & waxed tile/shampooed carpets
March 2019
• Repaired manlift
• Painted chillers
• Checked & adjusted packing on all pumps
• Repaired #2 Softener controls
• Repaired actuator on #5 chiller
• Repaired starter on #13 cooling tower
• Adjusted belts on #12 cooling tower
• Checked plant water meters
• Repaired valve on #9 chiller evaporator
• Replaced fan shaft & bearings on #5 Cooling tower
• Repaired #3 boiler blow down meter
• Forklift Systems repaired boom lift
• Repaired SWG 1A
• Repaired refrigerant alarm
• Re-certify test equipment
• Had test gauge re-certified
April 2019
• Repaired cooling tower drain lines
• Replaced flash tank site glass
• Checked & adjusted packing on all pumps
• Replaced temperature gauge on Forklift
• Check issue security camera #10
• Remove curtains in Boiler Room
• Repaired #1 Softener controls
• Repair #2 CWP Motor
• Repaired #3 VFD
• Checked firing rate on #3 Boiler
• Checked condensate leak between DA Tanks

- 24 -
• Checked for instrument air leaks
• Replaced fan shaft & bearings on #5 Cooling tower
• Replaced fan shaft & bearings on #18 Cooling tower
• Repaired #6 Chiller
• Repaired Condensate Return Tank controls
• Replaced air regulators on #2 & #3 Boilers
• NES Power Outage
• Researched Plant efficiency for TEG
• Assisted with Engie due diligence requests
May 2019
• Trimmed shrubs
• Repaired communications with #5 chiller
• Repaired #5 CWP packing gland
• Repaired cooling tower B/D strainer
• Repaired #3 Softener controls
• #2 CWP Motor returned from shop
• Repaired burner fuel valve on #2 boiler
• Installed booster pump on condensing water sample line
• Checked DA PRV controls
• Assisted with Engie due diligence requests
• Repaired switch on fire sprinkler system
June 2019
• Repaired Flash Tank Sight Glass
• Repaired cooling tower level controller
• Repaired #1 Softener controls
• Repaired EGF fire suppression air compressor
• #10 Security Camera replacement in progress
• Check city water meters
• Investigated #5 CWP trip
• Replaced spool piece on #2 DA vent line
• Replaced #4 Chiller Dynaview Controller
• Picked up Service truck generator from shop
• Replaced #1 Boiler Feed Water Bypass valve (outage)
• Roof leaks repaired
Annual maintenance costs for these activities: $360,870.95 (excludes salaried personnel & corporate
overhead).

- 25 -
EGF Emergency Repair Projects
EMR18-001 Propane Vaporizer Emergency Leak Repair
Glycol was discovered leaking around the burner. Goodwin’s Boiler & Piping
Maintenance Service, LLC was engaged to locate and repair the vaporizer July 2,
2108. The floor was replaced in the rear firebox. The boiler inspector inspected and
approved the repair May 19, 2018. The casing, insulation and siding were replaced.
The vaporizer was placed back in service.
EMR18-002 Emergency Tube Leak Repair in #1 Boiler
A tube leak was discovered by an operator while making his rounds July 10, 2018.
Goodwin’s Boiler & Piping Maintenance Service, LLC was engaged to locate and
repair the leak July 11, 2108. One tube was repaired in the lower northeast corner and
a second tube adjacent to the repaired tube was plugged. Repairs were completed July
19, 2018. The boiler inspector inspected and approved the repair July 23, 2018.
Refractory, insulation and sheet metal was replaced and the boiler was placed back in
service.

- 26 -
Modifications and Improvements The following are improvements that were performed in and around the Energy Generation Facility
and in the Energy Distribution System:
Cooling Tower Sample Line Pump Cooling Tower Chemical Controller
# 1 Deaerator Chainwheel #2 Deaerator Chainwheel

- 27 -
Control Room HVAC unit
5th & Broadway Chilled Water Supply Connection 5th & Broadway Chilled Water Return Connection

- 28 -
Energy Distribution System
Preventive and Predictive Maintenance All the direct buried portions of the EDS are checked monthly by means of thermographic
imaging. When a hot spot is detected, it indicates a possible piping leak. Depending on the severity
of the thermal temperature variance from the surrounding area, a determination is made whether to
dig up the affected area.
Constellation Energy maintenance personnel perform monthly inspections of EDS tunnels, as
well as, the State steam tunnel and the A. A. Birch (AAB) building tunnel. Monthly manhole
inspections are also conducted. The condition of the structures, piping, supports, insulation, seals,
lighting and ventilation is documented. Any deficiencies noted are prioritized and scheduled for
repair accordingly.
CNE personnel have been very diligent in monitoring condensate return quality. When
unacceptable levels of iron and hardness contamination are discovered, the condensate return is
placed to drain either in the customers building or in the EDS tunnel. This water is not suitable for
use in the boilers. Since Constellation Energy has limited control over what the DES customers
return, alternative remedies continue to be explored for this problem.
When the customer meter readings are taken for the preceding month, the readings are reviewed.
If they vary 30% high or low, from their three-year average, Instrumentation personnel check the
questionable metering devices for calibration as required in the customer buildings.
The air compressor in the Andrew Jackson Building mechanical room, which operates the Pressure
Reducing Valve on the State steam loop, is inspected monthly and maintenance is performed as
required. An alarm on this air compressor is tested on a regular basis. Sump pump alarms in
Manhole D, Manhole 18 and in the AAB Tunnel are also tested periodically. Tempering Stations on
the condensate return system in the Fairlane Hotel and in the Municipal Auditorium are inspected
for proper operation monthly.
The chilled water loop is being treated with a biocide to kill localized bacteria at customer interfaces
and clean heat exchanger surfaces. Samples are being taken at several customer buildings
periodically and tests indicate an improvement has been made. Bacteria levels are now below
acceptable limits. An option being considered to make further improvement includes installing a
side stream filter at the EGF.
Routine Maintenance and Emergency Repairs
Some repairs can be made without disrupting service to the customers while others require
sections of the system to be shut down. When possible, CNE will hire an on-line leak repair
contractor to facilitate steam leak repairs without interrupting service to the DES customers.
Several expansion joints, valves and flanges were repaired throughout the system during the past
year using this technique.
- 29 -
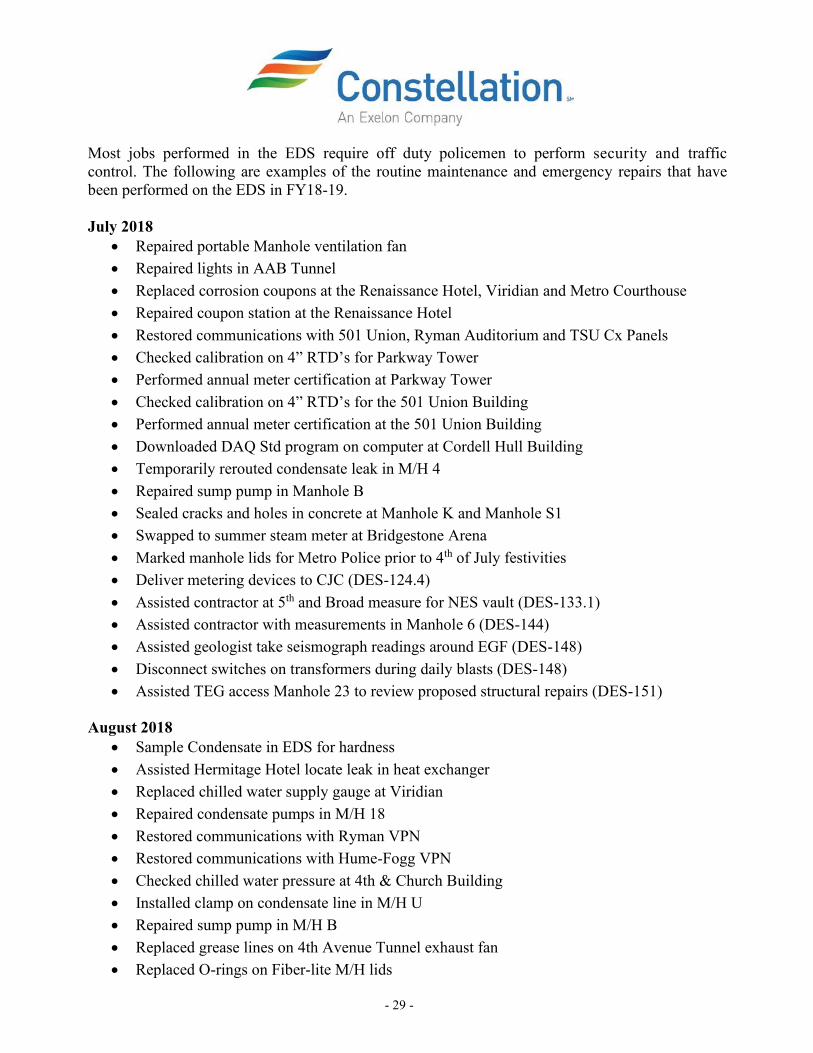
Most jobs performed in the EDS require off duty policemen to perform security and traffic
control. The following are examples of the routine maintenance and emergency repairs that have
been performed on the EDS in FY18-19.
July 2018
• Repaired portable Manhole ventilation fan
• Repaired lights in AAB Tunnel
• Replaced corrosion coupons at the Renaissance Hotel, Viridian and Metro Courthouse
• Repaired coupon station at the Renaissance Hotel
• Restored communications with 501 Union, Ryman Auditorium and TSU Cx Panels
• Checked calibration on 4” RTD’s for Parkway Tower
• Performed annual meter certification at Parkway Tower
• Checked calibration on 4” RTD’s for the 501 Union Building
• Performed annual meter certification at the 501 Union Building
• Downloaded DAQ Std program on computer at Cordell Hull Building
• Temporarily rerouted condensate leak in M/H 4
• Repaired sump pump in Manhole B
• Sealed cracks and holes in concrete at Manhole K and Manhole S1
• Swapped to summer steam meter at Bridgestone Arena
• Marked manhole lids for Metro Police prior to 4th of July festivities
• Deliver metering devices to CJC (DES-124.4)
• Assisted contractor at 5th and Broad measure for NES vault (DES-133.1)
• Assisted contractor with measurements in Manhole 6 (DES-144)
• Assisted geologist take seismograph readings around EGF (DES-148)
• Disconnect switches on transformers during daily blasts (DES-148)
• Assisted TEG access Manhole 23 to review proposed structural repairs (DES-151)
August 2018
• Sample Condensate in EDS for hardness
• Assisted Hermitage Hotel locate leak in heat exchanger
• Replaced chilled water supply gauge at Viridian
• Repaired condensate pumps in M/H 18
• Restored communications with Ryman VPN
• Restored communications with Hume-Fogg VPN
• Checked chilled water pressure at 4th & Church Building
• Installed clamp on condensate line in M/H U
• Repaired sump pump in M/H B
• Replaced grease lines on 4th Avenue Tunnel exhaust fan
• Replaced O-rings on Fiber-lite M/H lids

- 30 -
• Assisted CNE Corporate Safety Officer with EDS ladder review
• Assisted TEG access Manhole D for review (DES-138)
• Meeting with TPAC regarding Manhole 6 steam service interruptions (DES-144)
• Assisted TEG access Manhole L to review proposed structural repairs (DES-153)
• Assisted TEG access Manhole K to review proposed structural repairs (DES-154)
September 2018
• Sample Condensate in EDS for hardness
• Fabricated trap assembly for M/H 9
• Changed name on meter at Bobby Hotel
• Repair steam system air compressor in the Andrew Jackson Building
• Repaired State steam system auto-dialer
• Checked condensate level controller in M/H 18
• Repaired and replaced sump pumps in AAB Tunnel
• Repaired alarm in AAB Tunnel
• Relocated sump pump controls in AAB Tunnel
• Repaired sump pump in M/H B
• Repaired steam transmitter at the Metro Courthouse
• Repaired sump pump disconnect switch in M/H 9
• Fabricated new M/H lid puller
• Assisted Hermitage Hotel isolate steam leak in their mechanical room
• Attempted to free up steam valve in M/H 6A. Valve is not operational.
• Repaired portable sump pump on service truck
• Repaired steam leaks in 4th & Church Building pipe chase
• Tested steam valves on Union Street 9/7/18 (DES-144)
• Isolated steam between M/H 5 and M/H 23 on Union Street for Manhole 6 project 9/29/18
(DES-144)
• 7th & Broadway condensate line repair pre-bid held 9/18/18 (DES-155)
• Broadway Tunnel Anchor repair pre-bid held 9/18/18 (DES-156)
October 2018
• Repaired AAB sump pumps & alarm
• Replaced trap assembly in M/H 9
• Changed display on Cx Panel at Renaissance Hotel
• Repaired air compressor at Andrew Jackson Building for State steam PRV
• Replaced steam flow converter in metering panel at State Capitol
• Replaced block valves on steam transmitter at Cordell Hull
• Repaired M/H D1 sump pump and alarm
• Repaired steam leak in chase at 4th & Church

- 31 -
• Repair steam leak on trap in Andrew Jackson Building
• Assisted MWS test backflow preventer at Fairlane Hotel
• Checked for chilled water leaks in EDS
• Coupled Sheraton Hotel so they could clean their chilled water heat exchanger. Decoupled
upon completion.
• Took photos in M/H 9 for TEG
• Changed MCH meter panel IP Address
• Replaced O-rings on M/H M lids
• Purchased belts for tunnel exhaust fans
• Replaced leaking chilled water drain valve near Nissan Stadium
• Purchased & installed new welding machine on service truck
• Assisted with CJC Metering installation (DES-124)
• Checked steam isolation valves on Union Street (DES-144)
• Isolate steam between M/H 5 and M/H 23 for M/H 6 Repair Project. Restored steam upon
completion. (DES-144)
• Performed emergency chilled water leak repair at 4th Avenue and Union Street (EMR18-
003)
November 2018
• AAB Sump pump and alarm repairs
• M/H B Sump pump and alarm repairs
• Ordered frequency converter in Cx panel at Bobby Hotel
• Checked steam meter at Wildhorse Saloon
• Reset totalizers at Sheraton and Nashville Public Library
• Assisted AAB repair steam leak in mechanical room
• Replaced broken lid at M/H 19
• Replaced sump pump float switch in M/H B1
• Repaired condensate pumps in M/H 18
• Checked steam valve at Hyatt Place Hotel
• Met with John Sevier reps regarding building renovations
• Checked for chilled water leaks in EDS
• Check for safety valves in State steam loop
• Repaired generator on service truck
• CJC Metering installation (DES-124)
• Assisted TEG with review of M/H 6 work (DES-144)
• Assisted TEG with access to 7th Ave. Tunnel (DES-155)
• Isolated condensate in 7th Ave. Tunnel (DES-155)
• Restored condensate in 7th Ave. Tunnel (DES-155)
- 32 -
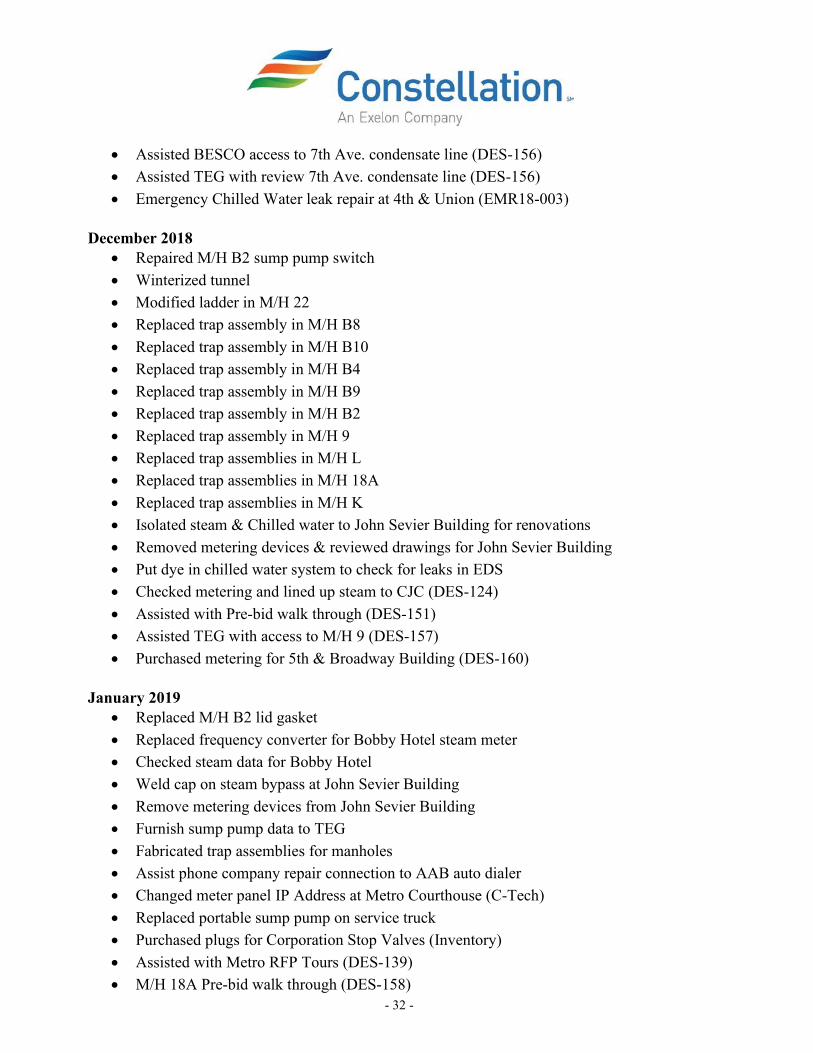
• Assisted BESCO access to 7th Ave. condensate line (DES-156)
• Assisted TEG with review 7th Ave. condensate line (DES-156)
• Emergency Chilled Water leak repair at 4th & Union (EMR18-003)
December 2018
• Repaired M/H B2 sump pump switch
• Winterized tunnel
• Modified ladder in M/H 22
• Replaced trap assembly in M/H B8
• Replaced trap assembly in M/H B10
• Replaced trap assembly in M/H B4
• Replaced trap assembly in M/H B9
• Replaced trap assembly in M/H B2
• Replaced trap assembly in M/H 9
• Replaced trap assemblies in M/H L
• Replaced trap assemblies in M/H 18A
• Replaced trap assemblies in M/H K
• Isolated steam & Chilled water to John Sevier Building for renovations
• Removed metering devices & reviewed drawings for John Sevier Building
• Put dye in chilled water system to check for leaks in EDS
• Checked metering and lined up steam to CJC (DES-124)
• Assisted with Pre-bid walk through (DES-151)
• Assisted TEG with access to M/H 9 (DES-157)
• Purchased metering for 5th & Broadway Building (DES-160)
January 2019
• Replaced M/H B2 lid gasket
• Replaced frequency converter for Bobby Hotel steam meter
• Checked steam data for Bobby Hotel
• Weld cap on steam bypass at John Sevier Building
• Remove metering devices from John Sevier Building
• Furnish sump pump data to TEG
• Fabricated trap assemblies for manholes
• Assist phone company repair connection to AAB auto dialer
• Changed meter panel IP Address at Metro Courthouse (C-Tech)
• Replaced portable sump pump on service truck
• Purchased plugs for Corporation Stop Valves (Inventory)
• Assisted with Metro RFP Tours (DES-139)
• M/H 18A Pre-bid walk through (DES-158)

- 33 -
• Assemble/order metering for 5th & Broadway Building (DES-160)
• 5th & Broadway Chilled Water Connection Pre-bid walk through (DES-160)
February 2019
• Repaired RTD at Cordell Hull
• Repaired steam meter at Bobby Hotel
• Assisted contractor access M/H B3
• Checked sump pumps and alarm in AAB Tunnel
• Repaired lighting in AAB Tunnel
• Repaired lighting in EDS Tunnel
• Added isolation valves to Chilled Water transmitters at Sheraton Hotel
• Added isolation valves to Chilled Water transmitters at Renaissance Hotel
• Assisted C. K. Masonry with Manhole cover replacement survey
• Review John Sevier metering drawings
• Assisted TEG with Manhole cover replacement survey
• Assisted TEG with Condensate pump test at M/H 18
• Replaced condensate pump in M/H 18
• Assisted contractor with access to State Tunnel
• Installed fittings on new portable sump pump on service truck
• Assisted AAB repair steam leak in their mechanical room
• Fabricated trap assemblies for manholes
• Pre-bid walk through (DES-151)
• Prep for Chilled water connection service interruption (DES-160)
• Isolated Chilled Water to Renaissance Buildings (DES-160)
• Pre-bid walk through (DES-160)
• Assisted TEG with review of Broadway Tunnel work (DES-164)
March 2019
• Repaired steam leak at Municipal Auditorium
• Assisted Metro Water sample water entering M/H 18
• Assisted contractor access M/H 6
• Repaired M/H 18 Sump Pump Controller
• Repaired expansion joint table in 4th Ave. Tunnel
• Assist contractor with M/H lids & frames
• 7th Ave. Chilled Water leak test
• 5th Ave. Chilled Water leak test
• Cleaned up M/H 23 (DES-151)
• Assisted TEG with project review (DES-151)
• Assisted contractor access to M/H 18 (DES-158)

- 34 -
• Assisted TEG with project review (DES-158)
• Assisted TEG with review of Broadway Tunnel work (DES-164)
• Assisted TEG with project review (DES-165)
• Assisted TEG with project review (DES-166)
April 2019
• Assisted with Engie Due Diligence
• Repaired AJ Air Compressor and alarm
• Repair connection with Ryman VPN
• Repair connection with Bridgestone Arena Meter
• Repair connection with Cordell Hull Meter
• Repaired HP steam transmitter at AAB
• Repaired steam leak in M/H B8
• Repaired M/H 9 Sump Pump
• Repaired M/H 18 Sump Pumps
• Replaced M/H B Sump Pump
• Check on metering for 5th & Broadway (DES-160)
• Emergency Chilled Water Leak Repair in M/H N2 (EMR19-002)
May 2019
• Investigated source of hardness in condensate return (Hermitage Hotel)
• Repaired steam leak at TN Tower
• Repaired security gate at Viridian
• Investigate/correct hot spot at entrance to Sheraton Hotel
• Isolate/restore Chilled Water to Renaissance Hotel for customer
• Isolate/restore Steam to Sheraton Hotel for customer
• Isolate steam to War Memorial Building for customer
• Repaired M/H M Sump Pump
• Repaired M/H 18 Sump Pumps
• Replaced ventilation grate at M/H 18
• Repaired steam leak in M/H 4
• Repaired steam leak in M/H C
• Check Chilled Water flow at TN Tower
• Check Chilled Water flow at Nashville City Center
• Assist TEG with access to M/H L (DES-153) and M/H B2 (DES-159)
• Check on metering for 5th & Broadway (DES-160)
• Emergency Chilled Water Leak Repair in M/H N2 (EMR19-002)

- 35 -
June 2019
• Replaced shedder bar in MCCC Steam Meter
• Investigated condensate return issue at Symphony
• Replaced lids at M/H D3 and M/H 22
• Isolated and restored chilled water service to the Nashville Public Library for customer to
make internal repairs
• Isolated and restored steam service to the Fairlane Hotel for customer to make internal
repairs
• Repaired State tunnel PRV Air Compressor
• Repaired M/H B2 Sump Pump
• Checked chilled water flow at Metro Courthouse. Heat exchanger appears to be fouled.
• Furnished metering data to Cordell Hull. Customer checking building efficiency.
• Installed DAQ Std program on Cordell Hull Computer
• Deliver metering for 5th & Broad contractor (DES-160)
• Assist TEG with access to M/H 6 (DES-161)
• Assist TEG with access to M/H 20 (DES-169)
Annual maintenance costs for EDS activities: $391,812.54 (excludes salaried personnel & corporate
overhead).
EDS Emergency Repair Projects
EMR18-003 Emergency Chilled Water Leak Repair at 4th Avenue & Union Street
CNE Maintenance personnel were asked to mark a Tennessee One Call at the
intersection of 4th Avenue North and Union Street about 1:00 pm on October 31,
2019. Green dye was observed coming through the pavement. CNE personnel
immediately barricaded the intersection and began contacting contractors to excavate
the area and make repairs.
CNE’s CSR contacted the two affected customers and CNE Maintenance personnel
isolated the chilled water. A repair clamp was installed on the 6” line and service was
restored at approximately 10:00 pm. Chilled water make-up decreased from
~130,000 gal/day to ~35,000 gal/day after this repair. The insulation and backfill was
completed on November 9, 2018. Final paving was completed on December 8, 2018.
The crosswalk striping was completed on February 2, 2019. The T&M backup
documentation has been reviewed and approved. CNE has issued an invoice to
Metro.
EMR19-001 Emergency Steam Leak Repair at Municipal Auditorium
On February 28, 2018, a steam leak was reported in the Municipal Auditorium
mechanical room. CNE personnel investigated and found a gauge line leaking on the
DES side of the first valve inside the building. S. M. Lawrence company was
engaged to make the repair which took place March 1, 2019. S. M. Lawrence had
Warren Insulation insulate the repaired line on March, 12, 2019.

- 36 -
EMR19-002 Emergency Chilled Water Leak Repair at Manhole N2
During the routine monthly manhole inspections, CNE found a chilled water leak in
Manhole N2. BESCO was engaged to make the necessary emergency repairs. As this
line only servers Nissan Stadium, at the customer’s request, service isolation was
postponed until 3:00 pm April 18, 2019. CNE isolated and began draining this line at
the requested time. BESCO removed and replaced the leaking 2” piping and valves in
the bypass line. CNE restored service to the stadium by approximately 11:00 pm the
same day. BESCO returned the following day and installed additional fittings to
assist with draining this line in the future.

- 37 -
DES Projects
Below is a brief description of the DES projects performed during FY19 in various stages of
completion.
DES-124.4 Criminal Justice Center New Service Installation
This project was substantially completed in FY18 except for a few items. The
questions on the red-line drawings were answered on July 18, 2018 and the record
drawings were delivered July 23, 2018. CNE personnel delivered metering devices to
CJC contractor for installation. The contractor provided conduit and electric power.
CNE personnel landed the wire connections on devices and tested the meter panel on
December 11, 2018. The steam and chilled water service to the new building
commenced on December 12, 2018.
DES-135 Exploratory Excavation and Chilled Water Leak Repairs
Chilled water make-up was >135,000 gallons per day until October 31, 2018. The
Chilled water make-up dropped to approximately 35,000 gallons per day following
EMR18-003 Emergency Leak Repairs at 4th and Union.
At the request of the Metro, CNE conducted several tests in November 2018 by
isolating sections of the chilled water distribution system to determine the leak rates.
The first test involved the area between Manhole 5C on 5th Avenue North to
Deaderick Street between 4th and 5th Avenues. The second test involved the area
between Manhole 5C on 5th Avenue North to Union Street and west on Union
between 5th Avenue and 7th Avenue. The final test conducted was from 1st Avenue
North, near Fort Nashboro, going north to the new CJC and A. A. Birch Buildings
and included the lines to the Nissan Stadium. None of these tests indicated a
substantial leak.
DES-144 Manhole 6 Structural Repairs
The pre-bid meeting was held at 9:00 a.m. on July 11, 2018 to review the proposed
project work. Bids were received on July 20, 2018. Metro approved the proposal
August 29, 2018. The work was done in two phases. The first phase of this project
began on September 29, 2018. The steam system was isolated between Manholes 5
and 23 at 10:00 p.m. Concrete repairs in the vault took place on September 30, 2018.
The structural steel work was completed on October 9, 2018 and steam service was
restored by 4:00 p.m. A walkthrough was conducted October 22, 2018 and a punch
list developed. Punch list items were completed on November 14, 2018. A
representative from TEG reviewed and reported all items were satisfactorily
completed.
DES-148 Rolling Mill Hill- Site I Development (Peabody Plaza)
This project began in early April 2018. Blasting started on May 1, 2018. The
contractor installed seismograph equipment at the plant and performed a building
survey prior to the start of blasting. Vibratech also installed seismograph equipment
on May 2, 2018 and performed a site survey documenting pre-blast conditions.

- 38 -
Blasting tripped the plant off line May 21, 2018. Since that time, CNE closely
monitored each blast daily. The final blast was performed on August 11, 2018. Metro
had Vibratech perform a post-blast site survey to document conditions on August 31,
2018.
DES-149 1st and Molloy Exploratory Excavation and Steam Line Repair
This project was substantially completed in FY18. The backup documentation was
approved by Metro on July 20, 2018. CNE issued an invoice for this work in early
August 2018.
DES-150 Federal Courthouse Construction Related Costs
The construction for the new Federal Courthouse began in August 2018. Metro was
originally informed that blasting would be required. Due to the close proximity of the
site to the 7th Avenue Tunnel, Metro DES Representatives and CNE developed an
Emergency Response Plan. This would allow service to be furnished to the Nashville
Public Library and/or the Hume Fogg High School in the event blasting damaged the
piping or tunnel structure. CNE, TEG and TEG’s Structural Engineer met with the
Federal Courthouse contractors on August 21, 2018 to discuss our concerns regarding
the proximity of the MNDES 7th Avenue Tunnel to their site and potential blasting.
An email was sent on September 18th from a representative with the Federal
Courthouse Contractor informing DES that they will not be blasting on the project
site.
DES-151 Manhole 23 Structural Repairs
CNE Maintenance personnel assisted a TEG with gathering measurements and
photos to prepare drawings and a scope of work for this project on July 31, 2018. A
Pre-bid Meeting was held on December 12, 2018. Bids were received on January 11,
2019. The contract was awarded to F. M. Sylvan and a Pre-Construction Meeting was
held February 1, 2019. Work was completed on March 27, 2019. A punch list was
issued March 28, 2019. The punch list items were completed in early April 2019.
DES-155 7th & Broadway Condensate Leak Repair
A pre-bid walkthrough was conducted on September 18, 2018 with three mechanical
contractors to review the replacement of a section of the 6” condensate piping at the
intersection of the 7th and Broadway tunnels. The contract was awarded to F. M.
Sylvan on October 31, 2018. The project began on November 28, 2018 and was
completed on November 29, 2018. A final walkthrough was conducted on December
5, 2018. No punch list items were found. An invoice was issued December 19, 2018.
DES-156 Broadway Tunnel Anchor Repair at B-65
A pre-bid walkthrough was conducted on September 18, 2018 with three mechanical
contractors to review the replacement of an anchor kicker at Station B-65 in the
Broadway tunnel. The contract was awarded to BESCO on October 31, 2018. The
project began on November 14, 2018 and was completed on November 15, 2018. A
walkthrough was conducted on November 16, 2018 and a punch list was developed.
The punch list items were completed on November 21, 2018 and a follow-up review

- 39 -
on November 28, 2018 found no deficiencies. An invoice was issued to Metro on
December 19, 2018.
DES-158 Manhole 18A Structural Repairs
A Pre-bid Meeting and walk through was held on January 23, 2019. The bids were
due on February 6, 2019. BESCO was awarded the contract. The project was
completed March 28, 2019. The backup documentation for this project has been
reviewed and approved and CNE issued an invoice to Metro.
A brace was added to the steam line in M/H 18 as a change order until the failed
expansion joint anchor table can be repaired. CNE’s disputed charges have been
resolved.
DES-160 5th & Broadway Chilled Water Service Connection
A Pre-bid Meeting was held at 9:00 a.m. on January 7, 2019. Bids were received
January 22, 2019 and the project was awarded to S. M. Lawrence Company. A pre-
construction meeting was held with the Renaissance Hotel, City Space Office Tower,
TEG, S. M. Lawrence and CNE representatives on February 5, 2019. The project
began on February 27, 2019 at 10:00 p.m. and was completed at 11:00 a.m. February
28, 2019. Metering equipment was delivered to the Contractor on June 18, 2019.
DES-162 3rd & Molloy Hotel Chilled Water Service Connection
TEG issued preliminary drawings for review on June 21, 2019.
DES-164 Broadway Tunnel Structural Repairs
Proshot Concrete has been awarded the contract to make repairs. The work began on
February 5, 2019. Work was completed mid- March 2019. Punch list items were
completed April 30, 2019.
.
DES-165 A. A. Birch Tunnel Structural Repairs
Proshot Concrete has been awarded the contract to make repairs. Work was
completed March 27, 2019. Punch list items were completed by the April 30, 2019.
DES-166 4th Avenue and 7th Avenue Tunnel Repairs
Proshot Concrete has been awarded the contract to make repairs. Work was
completed March 27, 2019. Punch list items were completed by the April 30, 2019.

- 40 -
Outstanding Issues and Recommendations
Each year CNE meets with Metro representatives to discuss outstanding issues and project
recommendations. Below is a list of those items.
Outstanding Issues
• Potential Sale of DES • Chilled water leak near Tennessee Performing Arts Center • New service contract with Hyatt Centric Hotel
Recommendations for FY 20
• Pipe insulation restoration in manholes and in the tunnels
• Manhole and Tunnel Structural Steel Rehabilitation and Corrosion Prevention
• Install electric hoist to access Broadway tunnel in 5th & Broad parking garage
• Install a side stream filter on the chilled water system
• Build a maintenance platform under the 7th Avenue Tunnel exhaust fan
• Investigate the installation of additional Division Valves
• Investigate system expansion
o Add additional equipment to existing plant for potential new customers
o Add new service lines from plant to allow for system redundancy and to serve
potential new customers south of Broadway
o Investigate the possibility of a satellite plant
• Pursue service contract with:
o Peabody Union Building (east of EGF)
o Marriott Hotel (1st Avenue &and Molly)
• Potential projects that should be customer funded:
o Polisher on Condensate return system
o Oxygen Trim on burners
o Capacitor Bank on Electrical feed to plant

- 41 -
Sales and Marketing
Sales and Marketing Review Due to the amount of development taking place south of Broadway, the potential exists for
system expansion. Metro has actively begun to try and sell system remaining capacity.
The following table, furnished by Thermal Engineering Group, Inc. on May 15, 2019, indicates
the remaining current system capacity.
System Capacity
Diversity Factor 66.54% 74.60% Chilled Water (tons) Steam (pph)
Installed capacity including redundant equipment 23,400 260,000
Installed capacity 20,800 195,000
System losses 600 19,430
Max Allowable Customer Load 20,200 166,433
Maximum System Peaks 18,584 148,065
Net Undiversified Capacity Available for Sale 1,616 18,368
Net Diversified Capacity Available for Sale 2,429 24,622
Diversified Potential for Contract Capacities 34,328 331,948
Contract Capacity for Existing Customers 30,359 284,616
Potential Contract Capacity for Sale 3,969 47,332
Customers currently on the system that are redeveloping their property:
• The Nashville Convention Center is being converted to a dual tower mixed use complex
called the 5th & Broadway.
• The Criminal Justice Center is building a new jail on the existing site.
Ongoing activities include the following:
• A Sales and Marketing Report is included in the Monthly Operations Report.
• The DES e-Newsletter is produced and issued semi-annually.
• The Annual CNE/NDE Golf Tournament is held each year for existing and potential new
customers as well as strategic partners.
• CNE participates in meetings and social events with business groups, engineers and
developers throughout the year.
• CNE provides presentations and tours of the EGF to point out the positive attributes of the
system.

- 42 -
Utilities and Fuel Procurement
During FY18-19, CNE was proactive in the procurement of fuel and risk management. CNE made
a propane purchase recommendation. Natural gas procurement recommendations were made by
Trane Energy Supply Services and International F. C. Stone Financial, Inc. In a collaborative effort
with Metro, CNE made procurement decisions based upon a matrix of pricing and consumption
factors including but not limited to then-current pricing conditions, future pricing conditions,
technical and fundamental pricing trends, consumption variances as a function of incremental
demand and conservation, product availability and budgetary considerations. When Trane’s
contract expired in December 2018, CNE engaged Insight Sourcing Group, LLC to provide fuel
consulting services.
Natural gas was purchased from Constellation NewEnergy – Gas Division, LLC (CNEG) under the
terms and conditions of an agreement between CNE and CNEG for a service period through
December 2020. The costs include the amount paid to CNEG for the cost of gas (including
transportation to the Nashville city gate), Piedmont for the cost of transportation from the city gate
to the plant, risk management fees, but it does not include the Fuel Efficiency Adjustment (FEA).
The following is a report of the natural gas purchased in FY18-19:
Natural Gas
Month Quantity (DT) Unit Cost Amount
July, 2018 30,273.2 $3.7260 $112,797.01
August 31,219.5 $3.6611 $114,298.51
September 31,793.3 $3.6750 $116,839.07
October 43,222.4 $3.6391 $157,289.86
November 66,902.6 $3.8840 $259,852.53
December 73,986.8 $4.8639 $359,861.79
January, 2019 85,819.0 $4.2384 $363,733.69
February 67,053.6 $3.5332 $236,912.77
March 66,526.2 $3.6565 $243,256.03
April 41,257.3 $3.7696 $155,521.61
May 32,693.3 $3.7350 $122,110.69
June 29,925.4 $3.6908 $110,449.27
Total 600,672.6 $3.9171 $2,352,922.83

- 43 -
100,000 gallons of propane was purchased from TARGA December 4, 2018 and placed in storage.
Since the plant did not have a natural gas curtailment, the propane was sold back to TARGA March
25, 2019.
The following is a report of propane used:
Propane
Month Quantity (DT) Unit Cost Amount
July, 2018 0 N/A $0.00
August 0 N/A $0.00
September 0 N/A $0.00
October 0 N/A $0.00
November 37 $24.4416 $904.34
December 49 $24.8347 $1,216.90
January, 2019 278 $24.8049 $6,895.76
February 0 N/A $0.00
March 0 N/A $0.00
April 0 N/A $0.00
May 8 $25.3947 $203.16
June 0 N/A $0.00
Total 372 $24.7853 $9.220.16

- 44 -
During FY18-19, electricity was purchased each month based on the Nashville Electric
Service rate schedule. Quantities reported in the Monthly Reports are taken from plant meters. The
difference between the plant meter readings and billed quantities have been reconciled in Appendix
4 & Exhibit 1 of this report.
Electricity
Month Quantity (Kwh) Unit Cost Amount
July, 2018 8,001,140 $0.08606 $688,583.72
August 7,980,812 $0.08555 $682,785.18
September 7,212,408 $0.08580 $618,834.33
October 4,879,980 $0.09041 $441,182.05
November 2,892,540 $0.08233 $238,129.36
December 2,826,208 $0.08706 $246,046.12
January, 2019 2,662,996 $0.08663 $230,708.59
February 2,877,924 $0.09966 $286,800.27
March 3,118,948 $0.08705 $271,511.00
April 3,887,520 $0.08254 $320,888.28
May 5,631,584 $0.07783 $438,291.50
June 6,336,008 $0.08259 $523,280.94
Total 58,308,068 $0.08553 $4,987,041.34
- 45 -
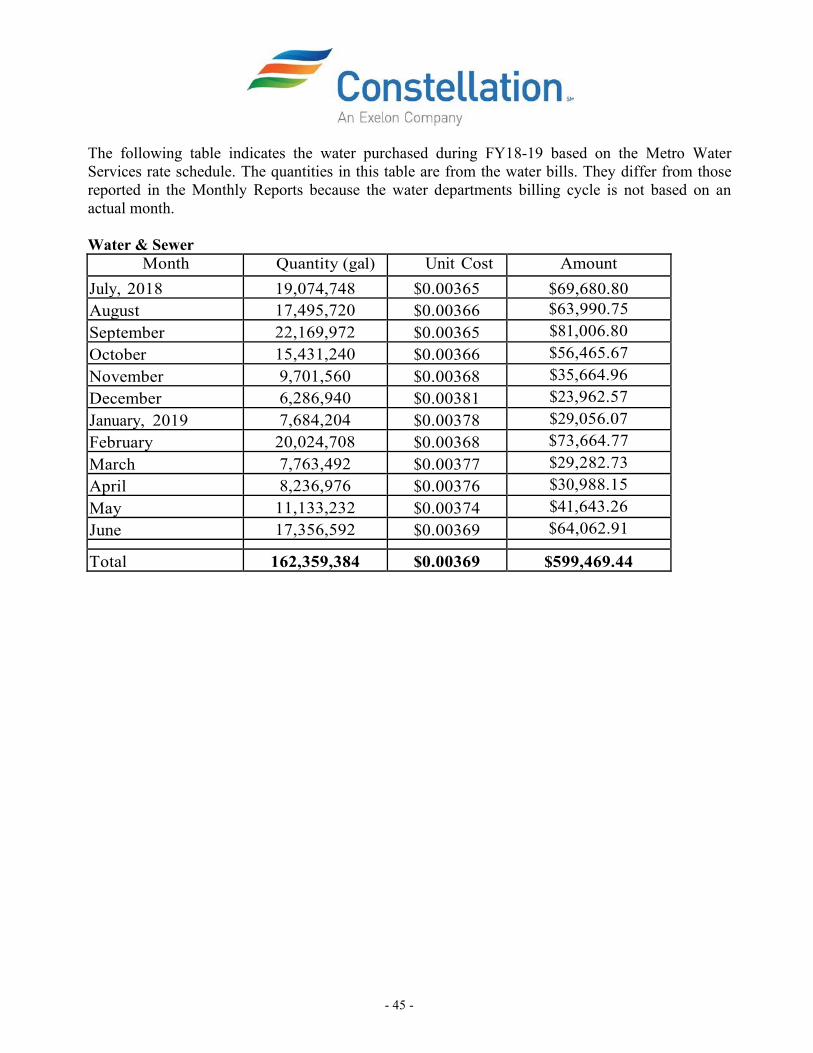
The following table indicates the water purchased during FY18-19 based on the Metro Water
Services rate schedule. The quantities in this table are from the water bills. They differ from those
reported in the Monthly Reports because the water departments billing cycle is not based on an
actual month.
Water & Sewer
Month Quantity (gal) Unit Cost Amount
July, 2018 19,074,748 $0.00365 $69,680.80
August 17,495,720 $0.00366 $63,990.75
September 22,169,972 $0.00365 $81,006.80
October 15,431,240 $0.00366 $56,465.67
November 9,701,560 $0.00368 $35,664.96
December 6,286,940 $0.00381 $23,962.57
January, 2019 7,684,204 $0.00378 $29,056.07
February 20,024,708 $0.00368 $73,664.77
March 7,763,492 $0.00377 $29,282.73
April 8,236,976 $0.00376 $30,988.15
May 11,133,232 $0.00374 $41,643.26
June 17,356,592 $0.00369 $64,062.91
Total 162,359,384 $0.00369 $599,469.44

- 46 -
Financial Report
The following is an explanation of the Appendices associated with this financial report.
Appendix 1 – Customer List
This chart lists the number of customers served by the District Energy System (DES). The
customers are sorted according to three categories:
• Private Customers
• State of Tennessee Customers
• Metropolitan Nashville (Metro) Customers
Appendix 2 – Revenues
This chart summarizes the revenues charged per month by DES to each customer for FY18-19.
Appendix 3 – Customer Rate Reconciliation
Monthly Reconciliation charts from July 2018 to June 2019 are found in this appendix. The final
chart is a Summary Reconciliation table for FY18-19. These tables detail the amount allocable to
customers to the amount allocated to customers. The difference in the allocable amount and the
amount allocated to customers is paid by Metro and is called the Metro Funding Amount (MFA).
• Facilities Capital Charge – The debt service on revenue bonds issued for the project.
• System Operator Charge – Includes the system operator’s fee which is most of the
operations and maintenance costs of the system.
• EDS Improvements Charge – Due to a CPI adjustment of 1.021%, the annual replacement
and repair allowance was $199,343 for FY18-19.
• Metro Incremental Administrative Charge – Per the customer service agreement, these
charges are the “actual, reasonable and necessary” cost over and above current Metro
operating costs to manage the DES system and operator.
• Pass Through Charges
o Water Treatment & Chemicals – actual costs of chemicals to treat water
o Engineering – The engineering costs required for any non-capital projects,
customer related issues, meetings, etc.
o Insurance – The cost to maintain all-risk property insurance and business insurance
policies.
o EDS Electricity – The cost of electricity for tunnel lights and safety equipment.
o EDS Surcharge – Surcharge to private customers only to cap their annual cost of
any EDS repairs made by Metro ($79,640).
o Water and Sewer – Actual costs charged by Metro Water Services
• Energy Charges
o Electricity
o Natural Gas
o Propane
Appendix 4 – CEPS Invoice Reconciliation (FEA)
Exhibit 1 – Performance Guarantee Calculation

- 47 -
Appendix 1

-48-
Metro Nashville District Energy System Customers
Private State Metro
1 Bobby Hotel (fka Wells Fargo) 18 Andrew Jackson 32 A.A. Birch
2 Parkway Tower 19 Cordell Hull 33 Metro Courthouse
3 Sheraton Hotel 20 John Sevier 34 Municipal Auditorium
4 Hermitage Hotel 21 War Memorial 35 Criminal Justice Center
5 501 Union Building 22 Library & Archives 36 Bridgestone Arena
6 4th & Church Building 23 Supreme Court 37 Nissan Stadium
7 Fifth-Third Financial Center 24 State Capitol 38 Hume-Fogg High School
8 Renaissance Hotel 25 James K. Polk 39 Nashville Public Library
9 City Space (fka Ren. Office Tower) 26 Citizens Plaza 40 Music City Center
10 St. Mary’s Catholic Church 27 Snodgrass Tennessee Tower
11 Nashville City Center 28 Tennessee State University
12 Wildhorse Saloon 29 Tennessee Performing Arts Center
13 Ryman Auditorium 30 Legislative Plaza
14 Schermerhorn Symphony Center 31 Rachael Jackson
15 Viridian Residential Tower
16 Hyatt Place Hotel
17 Fairlane Hotel (fka 401 Union)

Appendix 2
-49-
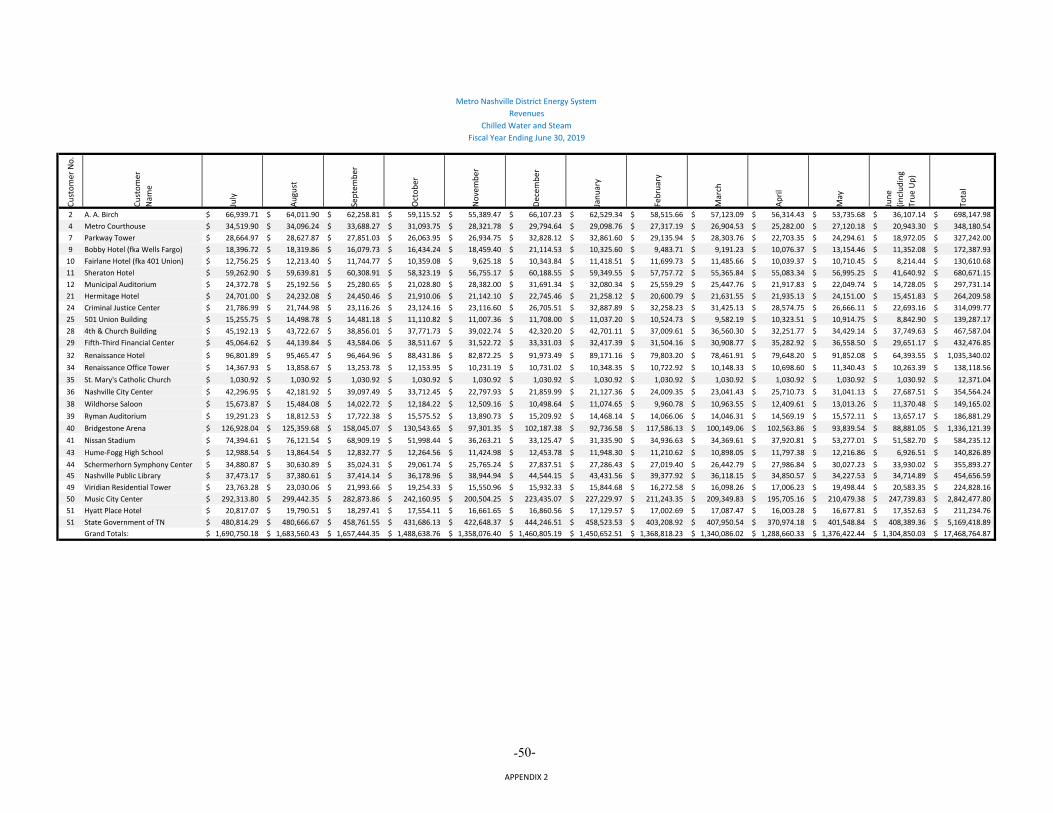
Cust
omer
No.
Cust
omer
Nam
e
July
Augu
st
Sept
embe
r
Oct
ober
Nov
embe
r
Dece
mbe
r
Janu
ary
Febr
uary
Mar
ch
April
May
June
(incl
udin
gTr
ue U
p)
Tota
l
2 A. A. Birch 66,939.71$ 64,011.90$ 62,258.81$ 59,115.52$ 55,389.47$ 66,107.23$ 62,529.34$ 58,515.66$ 57,123.09$ 56,314.43$ 53,735.68$ 36,107.14$ 698,147.98$4 Metro Courthouse 34,519.90$ 34,096.24$ 33,688.27$ 31,093.75$ 28,321.78$ 29,794.64$ 29,098.76$ 27,317.19$ 26,904.53$ 25,282.00$ 27,120.18$ 20,943.30$ 348,180.54$7 Parkway Tower 28,664.97$ 28,627.87$ 27,851.03$ 26,063.95$ 26,934.75$ 32,828.12$ 32,861.60$ 29,135.94$ 28,303.76$ 22,703.35$ 24,294.61$ 18,972.05$ 327,242.00$9 Bobby Hotel (fka Wells Fargo) 18,396.72$ 18,319.86$ 16,079.73$ 16,434.24$ 18,459.40$ 21,114.53$ 10,325.60$ 9,483.71$ 9,191.23$ 10,076.37$ 13,154.46$ 11,352.08$ 172,387.93$
10 Fairlane Hotel (fka 401 Union) 12,756.25$ 12,213.40$ 11,744.77$ 10,359.08$ 9,625.18$ 10,343.84$ 11,418.51$ 11,699.73$ 11,485.66$ 10,039.37$ 10,710.45$ 8,214.44$ 130,610.68$11 Sheraton Hotel 59,262.90$ 59,639.81$ 60,308.91$ 58,323.19$ 56,755.17$ 60,188.55$ 59,349.55$ 57,757.72$ 55,365.84$ 55,083.34$ 56,995.25$ 41,640.92$ 680,671.15$12 Municipal Auditorium 24,372.78$ 25,192.56$ 25,280.65$ 21,028.80$ 28,382.00$ 31,691.34$ 32,080.34$ 25,559.29$ 25,447.76$ 21,917.83$ 22,049.74$ 14,728.05$ 297,731.14$21 Hermitage Hotel 24,701.00$ 24,232.08$ 24,450.46$ 21,910.06$ 21,142.10$ 22,745.46$ 21,258.12$ 20,600.79$ 21,631.55$ 21,935.13$ 24,151.00$ 15,451.83$ 264,209.58$24 Criminal Justice Center 21,786.99$ 21,744.98$ 23,116.26$ 23,124.16$ 23,116.60$ 26,705.51$ 32,887.89$ 32,258.23$ 31,425.13$ 28,574.75$ 26,666.11$ 22,693.16$ 314,099.77$25 501 Union Building 15,255.75$ 14,498.78$ 14,481.18$ 11,110.82$ 11,007.36$ 11,708.00$ 11,037.20$ 10,524.73$ 9,582.19$ 10,323.51$ 10,914.75$ 8,842.90$ 139,287.17$28 4th & Church Building 45,192.13$ 43,722.67$ 38,856.01$ 37,771.73$ 39,022.74$ 42,320.20$ 42,701.11$ 37,009.61$ 36,560.30$ 32,251.77$ 34,429.14$ 37,749.63$ 467,587.04$29 Fifth-Third Financial Center 45,064.62$ 44,139.84$ 43,584.06$ 38,511.67$ 31,522.72$ 33,331.03$ 32,417.39$ 31,504.16$ 30,908.77$ 35,282.92$ 36,558.50$ 29,651.17$ 432,476.85$32 Renaissance Hotel 96,801.89$ 95,465.47$ 96,464.96$ 88,431.86$ 82,872.25$ 91,973.49$ 89,171.16$ 79,803.20$ 78,461.91$ 79,648.20$ 91,852.08$ 64,393.55$ 1,035,340.02$34 Renaissance Office Tower 14,367.93$ 13,858.67$ 13,253.78$ 12,153.95$ 10,231.19$ 10,731.02$ 10,348.35$ 10,722.92$ 10,148.33$ 10,698.60$ 11,340.43$ 10,263.39$ 138,118.56$35 St. Mary's Catholic Church 1,030.92$ 1,030.92$ 1,030.92$ 1,030.92$ 1,030.92$ 1,030.92$ 1,030.92$ 1,030.92$ 1,030.92$ 1,030.92$ 1,030.92$ 1,030.92$ 12,371.04$36 Nashville City Center 42,296.95$ 42,181.92$ 39,097.49$ 33,712.45$ 22,797.93$ 21,859.99$ 21,127.36$ 24,009.35$ 23,041.43$ 25,710.73$ 31,041.13$ 27,687.51$ 354,564.24$38 Wildhorse Saloon 15,673.87$ 15,484.08$ 14,022.72$ 12,184.22$ 12,509.16$ 10,498.64$ 11,074.65$ 9,960.78$ 10,963.55$ 12,409.61$ 13,013.26$ 11,370.48$ 149,165.02$39 Ryman Auditorium 19,291.23$ 18,812.53$ 17,722.38$ 15,575.52$ 13,890.73$ 15,209.92$ 14,468.14$ 14,066.06$ 14,046.31$ 14,569.19$ 15,572.11$ 13,657.17$ 186,881.29$40 Bridgestone Arena 126,928.04$ 125,359.68$ 158,045.07$ 130,543.65$ 97,301.35$ 102,187.38$ 92,736.58$ 117,586.13$ 100,149.06$ 102,563.86$ 93,839.54$ 88,881.05$ 1,336,121.39$41 Nissan Stadium 74,394.61$ 76,121.54$ 68,909.19$ 51,998.44$ 36,263.21$ 33,125.47$ 31,335.90$ 34,936.63$ 34,369.61$ 37,920.81$ 53,277.01$ 51,582.70$ 584,235.12$43 Hume-Fogg High School 12,988.54$ 13,864.54$ 12,832.77$ 12,264.56$ 11,424.98$ 12,453.78$ 11,948.30$ 11,210.62$ 10,898.05$ 11,797.38$ 12,216.86$ 6,926.51$ 140,826.89$44 Schermerhorn Symphony Center 34,880.87$ 30,630.89$ 35,024.31$ 29,061.74$ 25,765.24$ 27,837.51$ 27,286.43$ 27,019.40$ 26,442.79$ 27,986.84$ 30,027.23$ 33,930.02$ 355,893.27$45 Nashville Public Library 37,473.17$ 37,380.61$ 37,414.14$ 36,178.96$ 38,944.94$ 44,544.15$ 43,431.56$ 39,377.92$ 36,118.15$ 34,850.57$ 34,227.53$ 34,714.89$ 454,656.59$49 Viridian Residential Tower 23,763.28$ 23,030.06$ 21,993.66$ 19,254.33$ 15,550.96$ 15,932.33$ 15,844.68$ 16,272.58$ 16,098.26$ 17,006.23$ 19,498.44$ 20,583.35$ 224,828.16$50 Music City Center 292,313.80$ 299,442.35$ 282,873.86$ 242,160.95$ 200,504.25$ 223,435.07$ 227,229.97$ 211,243.35$ 209,349.83$ 195,705.16$ 210,479.38$ 247,739.83$ 2,842,477.80$51 Hyatt Place Hotel 20,817.07$ 19,790.51$ 18,297.41$ 17,554.11$ 16,661.65$ 16,860.56$ 17,129.57$ 17,002.69$ 17,087.47$ 16,003.28$ 16,677.81$ 17,352.63$ 211,234.76$S1 State Government of TN 480,814.29$ 480,666.67$ 458,761.55$ 431,686.13$ 422,648.37$ 444,246.51$ 458,523.53$ 403,208.92$ 407,950.54$ 370,974.18$ 401,548.84$ 408,389.36$ 5,169,418.89$
Grand Totals: 1,690,750.18$ 1,683,560.43$ 1,657,444.35$ 1,488,638.76$ 1,358,076.40$ 1,460,805.19$ 1,450,652.51$ 1,368,818.23$ 1,340,086.02$ 1,288,660.33$ 1,376,422.44$ 1,304,850.03$ 17,468,764.87$
Metro Nashville District Energy System
Chilled Water and SteamFiscal Year Ending June 30, 2019
Revenues
APPENDIX 2
-50-

Appendix 3
-51-

Cust
omer
Num
ber
Cust
omer
Nam
e
Cap
acity
Ope
ratin
g
ED
SIm
prov
emen
t
Met
roIn
crem
enta
l
Wat
er A
ndS
ewer
Che
mic
alTr
eatm
ent
Eng
inee
ring
Insu
ranc
e
ED
S E
lect
ricity
ED
S M
aint
Cos
tsA
lloc
TIFS
Ele
ctric
ity
Nat
ural
Gas
Pro
pane
Tota
l
2 A. A. Birch 115,280.03$ 204,356.30$ 9,170.28$ 27,084.49$ 24,563.48$ 8,473.87$ 1,385.96$ 572.68$ 3,517.24$ -$ 14,286.46$ 182,245.15$ 106,770.41$ 441.63$ 698,147.98$4 Metro Courthouse 54,713.77$ 95,402.77$ 4,281.24$ 12,644.37$ 14,527.11$ 4,854.95$ 646.98$ 267.46$ 1,642.03$ -$ 4,321.01$ 102,011.23$ 52,678.59$ 189.03$ 348,180.54$7 Parkway Tower 49,863.72$ 92,371.03$ 4,144.70$ 12,242.26$ 12,954.03$ 4,230.13$ 626.48$ 258.54$ 1,589.73$ 8,508.96$ 2,582.41$ 100,020.11$ 37,634.37$ 215.53$ 327,242.00$9 Bobby Hotel (fka Wells Fargo) 19,803.46$ 36,571.61$ 1,641.31$ 4,824.05$ 7,506.81$ 2,694.14$ 242.04$ 93.80$ 628.15$ 3,056.04$ 1,179.61$ 54,157.47$ 39,882.64$ 106.80$ 172,387.93$
10 Fairlane Hotel (fka 401 Union) 19,034.29$ 34,526.41$ 1,549.30$ 4,575.91$ 5,259.39$ 1,703.21$ 234.18$ 96.69$ 594.23$ 3,723.12$ 1,621.44$ 38,259.75$ 19,341.11$ 91.65$ 130,610.68$11 Sheraton Hotel 105,495.88$ 185,830.93$ 8,339.08$ 24,629.29$ 24,272.85$ 9,381.24$ 1,260.25$ 520.79$ 3,198.41$ 14,759.04$ 1,674.20$ 161,045.81$ 139,776.78$ 486.60$ 680,671.15$12 Municipal Auditorium 52,681.79$ 98,568.54$ 4,422.62$ 13,063.60$ 7,849.02$ 3,143.99$ 668.54$ 275.83$ 1,696.37$ -$ 4,491.49$ 58,623.33$ 51,947.84$ 298.18$ 297,731.14$21 Hermitage Hotel 50,769.85$ 87,222.10$ 3,914.32$ 11,560.17$ 8,832.75$ 2,802.65$ 591.49$ 244.64$ 1,501.27$ 3,321.96$ 6,229.14$ 62,668.47$ 24,447.46$ 103.31$ 264,209.58$24 Criminal Justice Center 86,356.66$ 143,546.84$ 6,442.58$ 19,025.64$ 2,315.51$ 1,433.13$ 973.46$ 402.91$ 2,470.82$ -$ -$ 17,548.49$ 33,400.05$ 183.68$ 314,099.77$25 501 Union Building 20,109.39$ 35,134.82$ 1,576.78$ 4,656.67$ 5,785.36$ 1,888.15$ 238.34$ 98.48$ 604.73$ 2,792.88$ 30.04$ 45,839.86$ 20,463.08$ 68.59$ 139,287.17$28 4th & Church Building 250,176.60$ -$ -$ -$ 16,874.40$ 5,298.95$ 795.73$ 328.57$ -$ -$ 34.40$ 141,959.54$ 51,827.19$ 291.66$ 467,587.04$29 Fifth-Third Financial Center 60,925.44$ 129,279.85$ 5,798.98$ 17,132.90$ 17,007.84$ 4,224.94$ 876.95$ 360.71$ 2,224.62$ 9,440.04$ 3,652.90$ 181,551.68$ -$ -$ 432,476.85$32 Renaissance Hotel 159,343.90$ 274,620.62$ 12,324.14$ 36,397.51$ 46,227.74$ 15,514.44$ 1,862.51$ 770.05$ 4,726.69$ 17,550.00$ 531.52$ 279,192.94$ 185,513.45$ 764.51$ 1,035,340.02$34 Renaissance Office Tower 14,873.86$ 31,607.23$ 1,417.78$ 4,188.73$ 9,640.31$ 2,534.67$ 214.39$ 88.19$ 543.90$ 2,727.00$ 1,372.95$ 68,909.55$ -$ -$ 138,118.56$35 St. Mary's Catholic Church 11,971.92$ -$ -$ -$ -$ -$ -$ -$ -$ 399.12$ -$ -$ -$ -$ 12,371.04$36 Nashville City Center 49,668.20$ 105,357.50$ 4,725.96$ 13,962.64$ 16,750.87$ 3,910.47$ 714.69$ 293.96$ 1,812.98$ 9,041.04$ 2,638.70$ 145,687.23$ -$ -$ 354,564.24$38 Wildhorse Saloon 18,584.75$ 34,633.38$ 1,553.98$ 4,590.02$ 6,224.03$ 1,924.59$ 234.87$ 96.93$ 596.05$ 2,193.96$ 543.74$ 59,888.05$ 18,043.36$ 57.31$ 149,165.02$39 Ryman Auditorium 20,511.41$ 38,096.46$ 1,708.18$ 5,032.10$ 10,300.09$ 3,376.68$ 254.83$ 101.56$ 657.00$ 2,127.12$ -$ 70,676.49$ 33,922.74$ 116.63$ 186,881.29$40 Bridgestone Arena 206,561.23$ 391,983.23$ 17,587.06$ 51,950.16$ 65,341.99$ 18,377.62$ 2,658.68$ 1,096.46$ 6,745.96$ -$ 2,239.85$ 475,729.79$ 95,597.79$ 251.57$ 1,336,121.39$41 Nissan Stadium 87,823.56$ 185,925.02$ 8,339.90$ 24,639.82$ 28,347.01$ 6,126.76$ 1,261.16$ 518.76$ 3,199.37$ -$ 1,212.70$ 236,841.06$ -$ -$ 584,235.12$43 Hume-Fogg High School 29,117.82$ 53,317.38$ 2,392.40$ 7,066.34$ 2,261.30$ 888.30$ 361.64$ 149.31$ 917.62$ -$ 6,494.78$ 22,531.74$ 15,267.65$ 60.61$ 140,826.89$44 Schermerhorn Symphony Center 182,332.32$ -$ -$ -$ 12,793.06$ 4,491.28$ 573.48$ 236.70$ -$ -$ -$ 104,221.65$ 51,087.88$ 156.90$ 355,893.27$45 Nashville Public Library 82,668.00$ -$ -$ -$ 34,662.43$ 11,894.81$ 893.83$ 369.25$ -$ -$ 2,946.91$ 214,355.28$ 106,490.02$ 376.06$ 454,656.59$49 Viridian Residential Tower 148,469.76$ -$ -$ -$ 7,249.70$ 1,674.63$ 430.45$ 177.07$ -$ -$ 10,615.60$ 56,210.95$ -$ -$ 224,828.16$50 Music City Center 930,813.36$ 110,894.52$ -$ 90,742.55$ 132,886.46$ 45,157.83$ 6,625.13$ 2,734.08$ -$ -$ 404.85$ 988,587.29$ 531,792.57$ 1,839.16$ 2,842,477.80$51 Hyatt Place Hotel 130,527.84$ -$ -$ -$ 5,080.34$ 1,967.16$ 439.91$ 182.13$ -$ -$ 4,278.13$ 36,506.45$ 32,149.21$ 103.59$ 211,234.76$S1 State Government of TN 1,638,010.10$ 1,281,139.20$ -$ -$ 153,489.53$ 55,670.47$ -$ 4,056.58$ 24,817.34$ -$ 62,031.94$ 1,201,929.29$ 745,274.90$ 2,999.54$ 5,169,418.89$
Grand Totals: 4,596,488.91$ 3,650,385.74$ 101,330.59$ 390,009.22$ 679,003.41$ 223,639.06$ 25,065.97$ 14,392.13$ 63,684.51$ 79,640.28$ 135,414.77$ 5,107,198.65$ 2,393,309.09$ 9,202.54$ 17,468,764.87$Rate Calculation Totals: 5,584,931.97$ 5,170,980.79$ 169,528.32$ 502,129.10$ 679,197.60$ 223,752.63$ 36,247.58$ 14,406.24$ 65,138.59$ 79,640.28$ 135,414.77$ 5,107,992.67$ 2,396,219.65$ 9,219.16$ 20,174,799.35$Deviation: (988,443.06)$ (1,520,595.05)$ (68,197.73)$ (97,441.42)$ (195.51)$ (113.57)$ (5,559.91)$ 14.11$ (1,454.08)$ -$ -$ (807.10)$ (2,944.88)$ (17.60)$ (2,706,034.48)$
Metro Nashville District Energy System
Chilled Water and SteamFiscal Year Ending June 30, 2019
Revenues
APPENDIX 3-52-

Cust
omer
Num
ber
Cust
omer
Nam
e
Cap
acity
Ope
ratin
g
ED
SIm
prov
emen
t
Met
roIn
crem
enta
l
Wat
er A
ndS
ewer
Che
mic
alTr
eatm
ent
Eng
inee
ring
Insu
ranc
e
ED
SE
lect
ricity
ED
S M
aint
Cos
ts A
lloc
TIFS
Ele
ctric
ity
Nat
ural
Gas
Pro
pane
Tota
l
2 A. A. Birch 10,604.48$ 16,627.21$ 728.34$ 2,026.42$ 3,527.67$ 651.79$ 82.56$ -$ 363.47$ -$ 595.21$ 27,017.25$ 4,715.31$ -$ 66,939.71$4 Metro Courthouse 5,020.14$ 7,758.55$ 339.87$ 945.60$ 1,853.41$ 353.76$ 38.54$ -$ 169.60$ -$ 227.97$ 14,891.55$ 2,920.91$ -$ 34,519.90$7 Parkway Tower 4,576.74$ 7,527.45$ 329.70$ 917.31$ 1,410.99$ 212.61$ 37.34$ -$ 164.53$ 709.08$ 277.61$ 12,501.61$ -$ -$ 28,664.97$9 Bobby Hotel (fka Wells Fargo) 1,686.95$ 2,728.38$ 119.51$ 332.50$ 1,219.13$ 240.08$ 13.54$ -$ 59.64$ 254.67$ -$ 9,531.39$ 2,210.93$ -$ 18,396.72$
10 Fairlane Hotel (fka 401 Union) 1,749.70$ 2,811.49$ 123.15$ 342.63$ 741.65$ 121.35$ 13.96$ -$ 61.45$ 310.26$ -$ 6,104.31$ 376.30$ -$ 12,756.25$11 Sheraton Hotel 9,657.00$ 15,119.16$ 662.29$ 1,842.64$ 2,805.25$ 575.56$ 75.07$ -$ 330.51$ 1,229.92$ 14.75$ 20,956.19$ 5,994.56$ -$ 59,262.90$12 Municipal Auditorium 4,846.18$ 8,034.54$ 351.91$ 979.09$ 889.00$ 134.87$ 39.85$ -$ 175.61$ -$ 4.66$ 8,881.09$ 35.98$ -$ 24,372.78$21 Hermitage Hotel 4,664.48$ 7,089.19$ 310.56$ 864.05$ 1,231.66$ 186.27$ 35.22$ -$ 154.98$ 276.83$ 441.07$ 9,420.07$ 26.62$ -$ 24,701.00$24 Criminal Justice Center 7,887.22$ 11,655.65$ 510.64$ 1,420.71$ -$ -$ 57.94$ -$ 254.83$ -$ -$ -$ -$ -$ 21,786.99$25 501 Union Building 1,839.10$ 2,857.84$ 125.19$ 348.31$ 861.98$ 169.41$ 14.20$ -$ 62.47$ 232.74$ 5.44$ 7,189.05$ 1,550.02$ -$ 15,255.75$28 4th & Church Building 20,848.05$ -$ -$ -$ 2,545.34$ 383.54$ 47.42$ -$ -$ -$ -$ 21,367.78$ -$ -$ 45,192.13$29 Fifth-Third Financial Center 5,620.52$ 10,577.95$ 463.19$ 1,288.71$ 2,258.23$ 340.28$ 52.36$ -$ 231.15$ 786.67$ -$ 23,445.56$ -$ -$ 45,064.62$32 Renaissance Hotel 14,569.61$ 22,326.81$ 978.07$ 2,721.19$ 6,816.04$ 1,195.30$ 110.92$ -$ 488.08$ 1,462.50$ -$ 39,535.63$ 6,597.74$ -$ 96,801.89$34 Renaissance Office Tower 1,374.15$ 2,586.17$ 113.24$ 315.07$ 1,035.94$ 156.10$ 12.80$ -$ 56.51$ 227.25$ 9.90$ 8,480.80$ -$ -$ 14,367.93$35 St. Mary's Catholic Church 997.66$ -$ -$ -$ -$ -$ -$ -$ -$ 33.26$ -$ -$ -$ -$ 1,030.92$36 Nashville City Center 4,580.48$ 8,620.58$ 377.48$ 1,050.24$ 2,777.12$ 418.46$ 42.67$ -$ 188.37$ 753.42$ -$ 23,488.13$ -$ -$ 42,296.95$38 Wildhorse Saloon 1,705.13$ 2,822.92$ 123.64$ 344.00$ 969.50$ 186.77$ 14.00$ -$ 61.70$ 182.83$ -$ 7,667.83$ 1,595.55$ -$ 15,673.87$39 Ryman Auditorium 1,962.37$ 3,206.41$ 140.44$ 390.74$ 1,360.88$ 246.33$ 15.91$ -$ 70.08$ 177.26$ -$ 10,102.45$ 1,618.36$ -$ 19,291.23$40 Bridgestone Arena 18,944.77$ 31,969.27$ 1,400.18$ 3,895.61$ 6,476.79$ 1,132.10$ 158.54$ -$ 698.73$ -$ 77.65$ 56,050.46$ 6,123.94$ -$ 126,928.04$41 Nissan Stadium 8,083.21$ 15,212.78$ 666.15$ 1,853.36$ 5,407.32$ 814.79$ 75.31$ -$ 332.43$ -$ 46.59$ 41,902.67$ -$ -$ 74,394.61$43 Hume-Fogg High School 2,691.91$ 4,342.18$ 190.20$ 529.16$ 397.86$ 74.49$ 21.55$ -$ 94.92$ -$ 309.84$ 3,766.47$ 569.96$ -$ 12,988.54$44 Schermerhorn Symphony Center 15,194.36$ -$ -$ -$ 1,468.60$ 303.36$ 34.18$ -$ -$ -$ -$ 14,661.64$ 3,218.73$ -$ 34,880.87$45 Nashville Public Library 6,889.00$ -$ -$ -$ 3,097.62$ 567.80$ 53.25$ -$ -$ -$ 207.36$ 22,695.24$ 3,962.90$ -$ 37,473.17$49 Viridian Residential Tower 12,372.48$ -$ -$ -$ 1,227.61$ 184.98$ 25.70$ -$ -$ -$ 228.89$ 9,723.62$ -$ -$ 23,763.28$50 Music City Center 77,567.78$ 9,241.21$ -$ 7,082.89$ 17,062.63$ 3,522.15$ 394.93$ -$ -$ -$ 286.19$ 139,856.08$ 37,299.94$ -$ 292,313.80$51 Hyatt Place Hotel 10,877.32$ -$ -$ -$ 882.15$ 181.74$ 26.18$ -$ -$ -$ 84.41$ 6,851.01$ 1,914.26$ -$ 20,817.07$S1 State Government of TN 136,594.48$ 106,761.60$ -$ -$ 19,843.83$ 3,928.12$ -$ -$ 2,574.07$ -$ 3,233.36$ 171,093.02$ 36,785.81$ -$ 480,814.29$
Grand Totals: 393,405.27$ 299,877.34$ 8,053.75$ 29,490.23$ 88,168.20$ 16,282.01$ 1,493.94$ -$ 6,593.13$ 6,636.69$ 6,050.90$ 717,180.90$ 117,517.82$ -$ 1,690,750.18$Rate Calculation Totals: 481,337.65$ 438,531.70$ 14,127.36$ 39,305.42$ 88,190.71$ 16,285.43$ 2,191.67$ -$ 7,049.94$ 6,636.69$ 6,050.90$ 717,287.94$ 117,517.85$ 1,934,513.26$Deviation: (87,932.38)$ (138,654.36)$ (6,073.61)$ (9,815.19)$ (22.51)$ (3.42)$ (697.73)$ -$ (456.81)$ -$ -$ (107.04)$ (0.03)$ (243,763.08)$
Metro Nashville District Energy System
Chilled Water and SteamJuly, 2018
Revenues
Appendix 3-53-

Cust
omer
Num
ber
Cust
omer
Nam
e
Capa
city
Ope
ratin
g
EDS
Impr
ovem
ent
Met
roIn
crem
enta
l
Wat
er A
ndSe
wer
Chem
ical
Trea
tmen
t
Engi
neer
ing
Insu
ranc
e
EDS
Elec
tric
ity
EDS
Mai
ntCo
sts A
lloc
TIFS
Elec
tric
ity
Nat
ural
Gas
Prop
ane
Tota
l
2 A. A. Birch 10,604.48$ 16,627.21$ 728.34$ 2,026.42$ 3,027.40$ 733.38$ 82.52$ -$ 303.60$ -$ 619.67$ 24,603.32$ 4,655.56$ -$ 64,011.90$4 Metro Courthouse 5,020.14$ 7,758.55$ 339.87$ 945.60$ 1,707.48$ 420.19$ 38.51$ -$ 141.67$ -$ 311.20$ 14,564.81$ 2,848.22$ -$ 34,096.24$7 Parkway Tower 4,576.74$ 7,527.45$ 329.70$ 917.31$ 1,308.02$ 257.63$ 37.32$ -$ 137.44$ 709.08$ 260.53$ 12,566.65$ -$ -$ 28,627.87$9 Bobby Hotel (fka Wells Fargo) 1,832.45$ 3,002.21$ 131.50$ 365.86$ 1,118.60$ 282.95$ 14.88$ -$ 54.81$ 254.67$ -$ 9,135.10$ 2,126.83$ -$ 18,319.86$
10 Fairlane Hotel (fka 401 Union) 1,749.70$ 2,811.49$ 123.15$ 342.63$ 654.97$ 139.12$ 13.95$ -$ 51.33$ 310.26$ -$ 5,673.40$ 343.40$ -$ 12,213.40$11 Sheraton Hotel 9,657.00$ 15,119.16$ 662.29$ 1,842.64$ 2,655.42$ 703.69$ 75.03$ -$ 276.06$ 1,229.92$ 110.66$ 21,172.94$ 6,135.00$ -$ 59,639.81$12 Municipal Auditorium 4,846.18$ 8,034.54$ 351.91$ 979.09$ 1,107.84$ 221.63$ 39.83$ -$ 146.69$ -$ 186.37$ 9,161.91$ 116.57$ -$ 25,192.56$21 Hermitage Hotel 4,664.48$ 7,089.19$ 310.56$ 864.05$ 1,101.28$ 217.63$ 35.20$ -$ 129.45$ 276.83$ 444.18$ 9,074.76$ 24.47$ -$ 24,232.08$24 Criminal Justice Center 7,887.22$ 11,655.65$ 510.64$ 1,420.71$ -$ -$ 57.91$ -$ 212.85$ -$ -$ -$ -$ -$ 21,744.98$25 501 Union Building 1,839.10$ 2,857.84$ 125.19$ 348.31$ 762.28$ 192.57$ 14.19$ -$ 52.19$ 232.74$ 21.74$ 6,611.87$ 1,440.76$ -$ 14,498.78$28 4th & Church Building 20,848.05$ -$ -$ -$ 2,181.09$ 429.58$ 47.39$ -$ -$ -$ -$ 20,216.56$ -$ -$ 43,722.67$29 Fifth-Third Financial Center 5,620.52$ 10,577.95$ 463.19$ 1,288.71$ 2,066.04$ 406.93$ 52.32$ -$ 193.08$ 786.67$ -$ 22,684.43$ -$ -$ 44,139.84$32 Renaissance Hotel 14,569.61$ 22,326.81$ 978.07$ 2,721.19$ 6,347.38$ 1,433.05$ 110.86$ -$ 407.69$ 1,462.50$ -$ 38,898.76$ 6,209.55$ -$ 95,465.47$34 Renaissance Office Tower 1,374.15$ 2,586.17$ 113.24$ 315.07$ 939.03$ 184.95$ 12.79$ -$ 47.21$ 227.25$ 31.68$ 8,027.13$ -$ -$ 13,858.67$35 St. Mary's Catholic Church 997.66$ -$ -$ -$ -$ -$ -$ -$ -$ 33.26$ -$ -$ -$ -$ 1,030.92$36 Nashville City Center 4,580.48$ 8,620.58$ 377.48$ 1,050.24$ 2,467.71$ 486.04$ 42.64$ -$ 157.35$ 753.42$ -$ 23,645.98$ -$ -$ 42,181.92$38 Wildhorse Saloon 1,705.13$ 2,822.92$ 123.64$ 344.00$ 898.15$ 216.71$ 13.99$ -$ 51.53$ 182.83$ -$ 7,773.28$ 1,351.90$ -$ 15,484.08$39 Ryman Auditorium 1,962.37$ 3,206.41$ 140.44$ 390.74$ 1,222.52$ 288.92$ 15.90$ -$ 58.54$ 177.26$ -$ 9,715.35$ 1,634.08$ -$ 18,812.53$40 Bridgestone Arena 18,944.77$ 31,969.27$ 1,400.18$ 3,895.61$ 5,892.44$ 1,326.78$ 158.43$ -$ 583.65$ -$ -$ 55,544.93$ 5,643.62$ -$ 125,359.68$41 Nissan Stadium 8,083.21$ 15,212.78$ 666.15$ 1,853.36$ 5,296.19$ 1,043.13$ 75.24$ -$ 277.68$ -$ 23.30$ 43,590.50$ -$ -$ 76,121.54$43 Hume-Fogg High School 2,691.91$ 4,342.18$ 190.20$ 529.16$ 397.10$ 103.40$ 21.54$ -$ 79.28$ -$ 386.71$ 4,267.73$ 855.33$ -$ 13,864.54$44 Schermerhorn Symphony Center 15,194.36$ -$ -$ -$ 1,139.27$ 292.78$ 34.16$ -$ -$ -$ -$ 11,648.26$ 2,322.06$ -$ 30,630.89$45 Nashville Public Library 6,889.00$ -$ -$ -$ 2,866.07$ 695.99$ 53.22$ -$ -$ -$ 209.77$ 22,201.68$ 4,464.88$ -$ 37,380.61$49 Viridian Residential Tower 12,372.48$ -$ -$ -$ 1,098.73$ 216.41$ 25.68$ -$ -$ -$ 253.64$ 9,063.12$ -$ -$ 23,030.06$50 Music City Center 77,567.78$ 9,241.21$ -$ 7,078.26$ 17,089.83$ 4,496.37$ 394.67$ -$ -$ -$ 118.66$ 145,073.64$ 38,381.93$ -$ 299,442.35$51 Hyatt Place Hotel 10,877.32$ -$ -$ -$ 737.57$ 194.92$ 26.17$ -$ -$ -$ 142.16$ 6,126.58$ 1,685.79$ -$ 19,790.51$S1 State Government of TN 136,594.48$ 106,761.60$ -$ -$ 18,417.96$ 4,766.18$ -$ -$ 2,150.10$ -$ 3,892.93$ 169,423.76$ 38,659.66$ -$ 480,666.67$
Grand Totals: 393,550.77$ 300,151.17$ 8,065.74$ 29,518.96$ 82,500.37$ 19,750.93$ 1,494.34$ -$ 5,512.20$ 6,636.69$ 7,013.20$ 710,466.45$ 118,899.61$ -$ 1,683,560.43$Rate Calculation Totals: 481,337.65$ 438,531.70$ 14,127.36$ 39,305.42$ 82,520.81$ 19,754.89$ 2,191.67$ -$ 5,888.90$ 6,636.69$ 7,013.20$ 710,569.72$ 118,899.60$ -$ 1,926,777.61$Deviation: (87,786.88)$ (138,380.53)$ (6,061.62)$ (9,786.46)$ (20.44)$ (3.96)$ (697.33)$ -$ (376.70)$ -$ -$ (103.27)$ 0.01$ -$ (243,217.18)$
Metro Nashville District Energy System
Chilled Water and SteamAugust, 2018
Revenues
Apendix 3-54-

Cust
omer
Num
ber
Cust
omer
Nam
e
Cap
acity
Ope
ratin
g
ED
SIm
prov
emen
t
Met
roIn
crem
enta
l
Wat
er A
ndS
ewer
Che
mic
alTr
eatm
ent
Eng
inee
ring
Insu
ranc
e
ED
SE
lect
ricity
ED
S M
aint
Cos
ts A
lloc
TIFS
Ele
ctric
ity
Nat
ural
Gas
Pro
pane
Tota
l
2 A. A. Birch 11,253.18$ 17,609.24$ 771.36$ 2,146.11$ 3,497.39$ 688.19$ 82.52$ -$ 345.88$ -$ 651.87$ 21,360.11$ 3,852.96$ -$ 62,258.81$4 Metro Courthouse 5,330.54$ 8,221.58$ 360.15$ 1,002.03$ 2,026.35$ 416.55$ 38.51$ -$ 161.50$ -$ 334.99$ 12,818.45$ 2,977.62$ -$ 33,688.27$7 Parkway Tower 4,846.41$ 7,957.09$ 348.53$ 969.67$ 1,478.55$ 251.99$ 37.32$ -$ 156.27$ 709.08$ 292.04$ 10,804.08$ -$ -$ 27,851.03$9 Bobby Hotel (fka Wells Fargo) 1,940.77$ 3,174.05$ 139.03$ 386.80$ 1,037.54$ 232.62$ 14.88$ -$ 62.34$ 254.67$ 34.39$ 6,469.45$ 2,333.19$ -$ 16,079.73$
10 Fairlane Hotel (fka 401 Union) 1,854.75$ 2,974.64$ 130.30$ 362.51$ 733.42$ 133.03$ 13.95$ -$ 58.42$ 310.26$ -$ 4,837.35$ 336.14$ -$ 11,744.77$11 Sheraton Hotel 10,248.39$ 16,013.08$ 701.45$ 1,951.59$ 3,159.73$ 705.73$ 75.03$ -$ 314.53$ 1,229.92$ 162.97$ 18,753.52$ 6,992.97$ -$ 60,308.91$12 Municipal Auditorium 5,129.85$ 8,490.54$ 371.88$ 1,034.66$ 1,252.05$ 218.08$ 39.83$ -$ 166.75$ -$ 529.34$ 7,851.12$ 196.55$ -$ 25,280.65$21 Hermitage Hotel 4,956.39$ 7,517.43$ 329.32$ 916.24$ 1,334.63$ 229.48$ 35.20$ -$ 147.67$ 276.83$ 470.53$ 8,152.06$ 84.68$ -$ 24,450.46$24 Criminal Justice Center 8,390.53$ 12,374.29$ 542.13$ 1,508.31$ -$ -$ 57.91$ -$ 243.09$ -$ -$ -$ -$ -$ 23,116.26$25 501 Union Building 1,952.36$ 3,027.72$ 132.64$ 369.01$ 919.32$ 193.55$ 14.19$ -$ 59.47$ 232.74$ 2.86$ 6,035.10$ 1,542.22$ -$ 14,481.18$28 4th & Church Building 20,848.05$ -$ -$ -$ 2,051.92$ 349.71$ 47.39$ -$ -$ -$ -$ 15,558.94$ -$ -$ 38,856.01$29 Fifth-Third Financial Center 5,912.59$ 11,127.64$ 487.26$ 1,355.67$ 2,380.63$ 405.73$ 52.32$ -$ 218.49$ 786.67$ 17.04$ 20,840.02$ -$ -$ 43,584.06$32 Renaissance Hotel 15,476.02$ 23,667.48$ 1,036.80$ 2,884.61$ 6,814.11$ 1,281.90$ 110.86$ -$ 464.90$ 1,462.50$ -$ 38,223.16$ 5,042.62$ -$ 96,464.96$34 Renaissance Office Tower 1,445.55$ 2,720.56$ 119.13$ 331.44$ 1,058.39$ 180.38$ 12.79$ -$ 53.42$ 227.25$ 60.41$ 7,044.46$ -$ -$ 13,253.78$35 St. Mary's Catholic Church 997.66$ -$ -$ -$ -$ -$ -$ -$ -$ 33.26$ -$ -$ -$ -$ 1,030.92$36 Nashville City Center 4,818.51$ 9,068.55$ 397.10$ 1,104.82$ 2,710.87$ 462.01$ 42.64$ -$ 178.06$ 753.42$ -$ 19,561.51$ -$ -$ 39,097.49$38 Wildhorse Saloon 1,805.06$ 2,983.29$ 130.67$ 363.54$ 902.91$ 155.37$ 13.99$ -$ 58.59$ 182.83$ -$ 7,364.13$ 62.34$ -$ 14,022.72$39 Ryman Auditorium 2,078.61$ 3,390.27$ 148.50$ 413.15$ 1,394.66$ 274.37$ 15.90$ -$ 66.59$ 177.26$ -$ 8,229.43$ 1,533.64$ -$ 17,722.38$40 Bridgestone Arena 20,037.26$ 33,761.12$ 1,478.67$ 4,113.97$ 11,543.27$ 2,267.96$ 158.43$ -$ 663.03$ -$ -$ 71,448.21$ 12,573.15$ -$ 158,045.07$41 Nissan Stadium 8,503.25$ 16,003.32$ 700.76$ 1,949.67$ 5,602.31$ 954.80$ 75.24$ -$ 314.22$ -$ 98.03$ 34,707.59$ -$ -$ 68,909.19$43 Hume-Fogg High School 2,853.02$ 4,593.47$ 201.20$ 559.79$ 351.13$ 74.12$ 21.54$ -$ 90.22$ -$ 575.90$ 2,915.01$ 597.37$ -$ 12,832.77$44 Schermerhorn Symphony Center 15,194.36$ -$ -$ -$ 1,874.79$ 406.86$ 34.16$ -$ -$ -$ -$ 13,861.57$ 3,652.57$ -$ 35,024.31$45 Nashville Public Library 6,889.00$ -$ -$ -$ 3,534.72$ 736.72$ 53.22$ -$ -$ -$ 221.83$ 20,361.92$ 5,616.73$ -$ 37,414.14$49 Viridian Residential Tower 12,372.48$ -$ -$ -$ 1,228.28$ 209.34$ 25.68$ -$ -$ -$ 364.99$ 7,792.89$ -$ -$ 21,993.66$50 Music City Center 77,567.78$ 9,241.21$ -$ 7,078.26$ 19,876.36$ 4,235.37$ 394.67$ -$ -$ -$ -$ 129,022.66$ 35,457.55$ -$ 282,873.86$51 Hyatt Place Hotel 10,877.32$ -$ -$ -$ 692.48$ 158.81$ 26.17$ -$ -$ -$ 226.57$ 4,610.12$ 1,705.94$ -$ 18,297.41$S1 State Government of TN 136,594.48$ 106,761.60$ -$ -$ 20,661.93$ 4,412.67$ -$ -$ 2,449.86$ -$ 3,765.93$ 146,840.56$ 37,274.52$ -$ 458,761.55$
Grand Totals: 400,174.17$ 310,678.17$ 8,526.88$ 30,801.85$ 98,117.74$ 19,635.34$ 1,494.34$ -$ 6,273.30$ 6,636.69$ 7,809.69$ 645,463.42$ 121,832.76$ -$ 1,657,444.35$Rate Calculation Totals: 481,337.65$ 438,531.70$ 14,127.36$ 39,305.42$ 98,140.15$ 19,639.68$ 2,191.67$ -$ 6,334.71$ 6,636.69$ 7,809.69$ 645,548.92$ 121,851.77$ -$ 1,881,455.41$Deviation: (81,163.48)$ (127,853.53)$ (5,600.48)$ (8,503.57)$ (22.41)$ (4.34)$ (697.33)$ -$ (61.41)$ -$ -$ (85.50)$ (19.01)$ -$ (224,011.06)$
Metro Nashville District Energy System
Chilled Water and SteamSeptember, 2018
Revenues
Appendix 3-55-

Cust
omer
Num
ber
Cust
omer
Nam
e
Cap
acity
Ope
ratin
g
ED
SIm
prov
emen
t
Met
roIn
crem
enta
l
Wat
er A
ndS
ewer
Che
mic
alTr
eatm
ent
Eng
inee
ring
Insu
ranc
e
ED
S E
lect
ricity
ED
S M
aint
Cos
ts A
lloc
TIFS
Ele
ctric
ity
Nat
ural
Gas
Pro
pane
Tota
l
2 A. A. Birch 11,253.18$ 17,609.24$ 771.36$ 2,146.11$ 2,374.85$ 669.34$ 82.52$ -$ 357.13$ -$ 1,320.90$ 15,315.12$ 7,215.77$ -$ 59,115.52$4 Metro Courthouse 5,330.54$ 8,221.58$ 360.15$ 1,002.03$ 1,534.69$ 434.36$ 38.51$ -$ 166.74$ -$ 453.00$ 9,500.21$ 4,051.94$ -$ 31,093.75$7 Parkway Tower 4,846.41$ 7,957.09$ 348.53$ 969.67$ 1,119.80$ 321.59$ 37.32$ -$ 161.36$ 709.08$ 215.66$ 7,985.08$ 1,392.36$ -$ 26,063.95$9 Bobby Hotel (fka Wells Fargo) 1,940.77$ 3,174.05$ 139.03$ 386.80$ 752.36$ 204.93$ 14.88$ -$ 64.37$ 254.67$ 108.13$ 4,718.05$ 4,676.20$ -$ 16,434.24$
10 Fairlane Hotel (fka 401 Union) 1,854.75$ 2,974.64$ 130.30$ 362.51$ 447.39$ 127.84$ 13.95$ -$ 60.33$ 310.26$ 18.82$ 3,284.97$ 773.32$ -$ 10,359.08$11 Sheraton Hotel 10,248.39$ 16,013.08$ 701.45$ 1,951.59$ 2,314.43$ 641.45$ 75.03$ -$ 324.76$ 1,229.92$ 333.70$ 13,807.11$ 10,682.28$ -$ 58,323.19$12 Municipal Auditorium 5,129.85$ 8,490.54$ 371.88$ 1,034.66$ 588.11$ 167.54$ 39.83$ -$ 172.18$ -$ 637.17$ 3,207.60$ 1,189.44$ -$ 21,028.80$21 Hermitage Hotel 4,956.39$ 7,517.43$ 329.32$ 916.24$ 873.28$ 252.49$ 35.20$ -$ 152.47$ 276.83$ 581.62$ 5,503.92$ 514.87$ -$ 21,910.06$24 Criminal Justice Center 8,390.53$ 12,374.29$ 542.13$ 1,508.31$ -$ -$ 57.91$ -$ 250.99$ -$ -$ -$ -$ -$ 23,124.16$25 501 Union Building 1,952.36$ 3,027.72$ 132.64$ 369.01$ 495.60$ 140.42$ 14.19$ -$ 61.41$ 232.74$ -$ 3,427.78$ 1,256.95$ -$ 11,110.82$28 4th & Church Building 20,848.05$ -$ -$ -$ 1,496.85$ 425.64$ 47.39$ -$ -$ -$ -$ 11,667.10$ 3,286.70$ -$ 37,771.73$29 Fifth-Third Financial Center 5,912.59$ 11,127.64$ 487.26$ 1,355.67$ 1,723.12$ 501.23$ 52.32$ -$ 225.59$ 786.67$ 323.76$ 16,015.82$ -$ -$ 38,511.67$32 Renaissance Hotel 15,476.02$ 23,667.48$ 1,036.80$ 2,884.61$ 4,465.84$ 1,264.10$ 110.86$ -$ 480.02$ 1,462.50$ -$ 25,836.07$ 11,747.56$ -$ 88,431.86$34 Renaissance Office Tower 1,445.55$ 2,720.56$ 119.13$ 331.44$ 995.32$ 289.53$ 12.79$ -$ 55.15$ 227.25$ 99.99$ 5,857.24$ -$ -$ 12,153.95$35 St. Mary's Catholic Church 997.66$ -$ -$ -$ -$ -$ -$ -$ -$ 33.26$ -$ -$ -$ -$ 1,030.92$36 Nashville City Center 4,818.51$ 9,068.55$ 397.10$ 1,104.82$ 1,940.37$ 564.43$ 42.64$ -$ 183.85$ 753.42$ 256.91$ 14,581.85$ -$ -$ 33,712.45$38 Wildhorse Saloon 1,805.06$ 2,983.29$ 130.67$ 363.54$ 540.70$ 153.56$ 13.99$ -$ 60.50$ 182.83$ 18.87$ 4,681.19$ 1,250.02$ -$ 12,184.22$39 Ryman Auditorium 2,078.61$ 3,390.27$ 148.50$ 413.15$ 1,014.13$ 288.93$ 15.90$ -$ 68.75$ 177.26$ -$ 5,941.31$ 2,038.71$ -$ 15,575.52$40 Bridgestone Arena 20,037.26$ 33,761.12$ 1,478.67$ 4,113.97$ 7,867.74$ 2,261.56$ 158.43$ -$ 684.59$ -$ -$ 51,084.93$ 9,095.38$ -$ 130,543.65$41 Nissan Stadium 8,503.25$ 16,003.32$ 700.76$ 1,949.67$ 2,691.23$ 782.84$ 75.24$ -$ 324.44$ -$ 122.53$ 20,845.16$ -$ -$ 51,998.44$43 Hume-Fogg High School 2,853.02$ 4,593.47$ 201.20$ 559.79$ 168.13$ 45.93$ 21.54$ -$ 93.16$ -$ 666.58$ 2,059.18$ 1,002.56$ -$ 12,264.56$44 Schermerhorn Symphony Center 15,194.36$ -$ -$ -$ 1,348.59$ 381.30$ 34.16$ -$ -$ -$ -$ 8,412.44$ 3,690.89$ -$ 29,061.74$45 Nashville Public Library 6,889.00$ -$ -$ -$ 3,302.45$ 938.32$ 53.22$ -$ -$ -$ 262.82$ 17,230.94$ 7,502.21$ -$ 36,178.96$49 Viridian Residential Tower 12,372.48$ -$ -$ -$ 709.49$ 206.38$ 25.68$ -$ -$ -$ 1,008.36$ 4,931.94$ -$ -$ 19,254.33$50 Music City Center 77,567.78$ 9,241.21$ -$ 7,078.26$ 14,015.56$ 3,964.31$ 394.67$ -$ -$ -$ -$ 92,047.96$ 37,851.20$ -$ 242,160.95$51 Hyatt Place Hotel 10,877.32$ -$ -$ -$ 462.60$ 126.91$ 26.17$ -$ -$ -$ 366.51$ 3,122.28$ 2,572.32$ -$ 17,554.11$S1 State Government of TN 136,594.48$ 106,761.60$ -$ -$ 15,221.49$ 4,273.12$ -$ -$ 2,529.56$ -$ 4,841.54$ 109,506.66$ 51,957.68$ -$ 431,686.13$
Grand Totals: 400,174.17$ 310,678.17$ 8,526.88$ 30,801.85$ 68,464.12$ 19,428.05$ 1,494.34$ -$ 6,477.35$ 6,636.69$ 11,636.87$ 460,571.91$ 163,748.36$ -$ 1,488,638.76$Rate Calculation Totals: 481,337.65$ 438,531.70$ 14,127.36$ 39,305.42$ 68,480.93$ 19,432.51$ 2,191.67$ -$ 6,540.71$ 6,636.69$ 11,636.87$ 460,641.15$ 163,895.74$ -$ 1,712,758.40$Deviation: (81,163.48)$ (127,853.53)$ (5,600.48)$ (8,503.57)$ (16.81)$ (4.46)$ (697.33)$ -$ (63.36)$ -$ -$ (69.24)$ (147.38)$ -$ (224,119.64)$
Metro Nashville District Energy System
Chilled Water and SteamOctober, 2018
Revenues
Appendix 3-56-

Cust
omer
Num
ber
Cust
omer
Nam
e
Cap
acity
Ope
ratin
g
ED
SIm
prov
emen
t
Met
roIn
crem
enta
l
Wat
er A
ndS
ewer
Che
mic
alTr
eatm
ent
Eng
inee
ring
Insu
ranc
e
ED
SE
lect
ricity
ED
S M
aint
Cos
ts A
lloc
TIFS
Ele
ctric
ity
Nat
ural
Gas
Pro
pane
Tota
l
2 A. A. Birch 11,253.18$ 17,609.24$ 771.36$ 2,146.11$ 1,205.55$ 635.10$ 82.52$ -$ 346.36$ -$ 1,964.20$ 8,181.13$ 11,157.28$ 37.44$ 55,389.47$4 Metro Courthouse 5,330.54$ 8,221.58$ 360.15$ 1,002.03$ 1,018.20$ 446.81$ 38.51$ -$ 161.72$ -$ 487.26$ 5,130.52$ 6,103.98$ 20.48$ 28,321.78$7 Parkway Tower 4,846.41$ 7,957.09$ 348.53$ 969.67$ 989.23$ 416.36$ 37.32$ -$ 156.49$ 709.08$ 215.66$ 4,998.68$ 5,272.54$ 17.69$ 26,934.75$9 Bobby Hotel (fka Wells Fargo) 1,940.77$ 3,174.05$ 139.03$ 386.80$ 619.47$ 409.58$ 14.88$ -$ 62.43$ 254.67$ 159.54$ 2,451.16$ 8,817.43$ 29.59$ 18,459.40$
10 Fairlane Hotel (fka 401 Union) 1,854.75$ 2,974.64$ 130.30$ 362.51$ 229.99$ 124.00$ 13.95$ -$ 58.51$ 310.26$ 164.68$ 1,160.44$ 2,233.65$ 7.50$ 9,625.18$11 Sheraton Hotel 10,248.39$ 16,013.08$ 701.45$ 1,951.59$ 1,711.24$ 883.55$ 75.03$ -$ 314.97$ 1,229.92$ 167.62$ 8,234.96$ 15,172.46$ 50.91$ 56,755.17$12 Municipal Auditorium 5,129.85$ 8,490.54$ 371.88$ 1,034.66$ 606.55$ 416.03$ 39.83$ -$ 166.98$ -$ 534.24$ 2,371.61$ 9,189.00$ 30.83$ 28,382.00$21 Hermitage Hotel 4,956.39$ 7,517.43$ 329.32$ 916.24$ 572.86$ 230.36$ 35.20$ -$ 147.88$ 276.83$ 581.62$ 2,914.10$ 2,654.96$ 8.91$ 21,142.10$24 Criminal Justice Center 8,390.53$ 12,374.29$ 542.13$ 1,508.31$ -$ -$ 57.91$ -$ 243.43$ -$ -$ -$ -$ -$ 23,116.60$25 501 Union Building 1,952.36$ 3,027.72$ 132.64$ 369.01$ 384.84$ 168.37$ 14.19$ -$ 59.55$ 232.74$ -$ 2,370.04$ 2,288.22$ 7.68$ 11,007.36$28 4th & Church Building 20,848.05$ -$ -$ -$ 1,224.97$ 582.68$ 47.39$ -$ -$ -$ -$ 7,273.69$ 9,015.71$ 30.25$ 39,022.74$29 Fifth-Third Financial Center 5,912.59$ 11,127.64$ 487.26$ 1,355.67$ 939.84$ 260.37$ 52.32$ -$ 218.79$ 786.67$ 596.41$ 9,785.16$ -$ -$ 31,522.72$32 Renaissance Hotel 15,476.02$ 23,667.48$ 1,036.80$ 2,884.61$ 2,517.35$ 1,279.85$ 110.86$ -$ 465.55$ 1,462.50$ 138.05$ 12,179.20$ 21,581.56$ 72.42$ 82,872.25$34 Renaissance Office Tower 1,445.55$ 2,720.56$ 119.13$ 331.44$ 787.59$ 218.20$ 12.79$ -$ 53.49$ 227.25$ 168.73$ 4,146.46$ -$ -$ 10,231.19$35 St. Mary's Catholic Church 997.66$ -$ -$ -$ -$ -$ -$ -$ -$ 33.26$ -$ -$ -$ -$ 1,030.92$36 Nashville City Center 4,818.51$ 9,068.55$ 397.10$ 1,104.82$ 815.63$ 225.96$ 42.64$ -$ 178.31$ 753.42$ 333.29$ 5,059.70$ -$ -$ 22,797.93$38 Wildhorse Saloon 1,805.06$ 2,983.29$ 130.67$ 363.54$ 418.81$ 188.65$ 13.99$ -$ 58.67$ 182.83$ 77.20$ 3,586.68$ 2,690.74$ 9.03$ 12,509.16$39 Ryman Auditorium 2,078.61$ 3,390.27$ 148.50$ 413.15$ 637.82$ 267.02$ 15.90$ -$ 66.68$ 177.26$ -$ 3,337.70$ 3,346.59$ 11.23$ 13,890.73$40 Bridgestone Arena 20,037.26$ 33,761.12$ 1,478.67$ 4,113.97$ 3,807.07$ 1,224.05$ 158.43$ -$ 663.96$ -$ 367.60$ 25,393.52$ 6,274.64$ 21.06$ 97,301.35$41 Nissan Stadium 8,503.25$ 16,003.32$ 700.76$ 1,949.67$ 533.73$ 147.87$ 75.24$ -$ 314.66$ -$ 134.79$ 7,899.92$ -$ -$ 36,263.21$43 Hume-Fogg High School 2,853.02$ 4,593.47$ 201.20$ 559.79$ 69.07$ 70.20$ 21.54$ -$ 90.34$ -$ 715.59$ 352.44$ 1,891.97$ 6.35$ 11,424.98$44 Schermerhorn Symphony Center 15,194.36$ -$ -$ -$ 905.21$ 370.92$ 34.16$ -$ -$ -$ -$ 4,794.01$ 4,451.64$ 14.94$ 25,765.24$45 Nashville Public Library 6,889.00$ -$ -$ -$ 3,254.08$ 1,213.21$ 53.22$ -$ -$ -$ 283.07$ 15,664.26$ 11,549.34$ 38.76$ 38,944.94$49 Viridian Residential Tower 12,372.48$ -$ -$ -$ 230.40$ 63.83$ 25.68$ -$ -$ -$ 1,515.63$ 1,342.94$ -$ -$ 15,550.96$50 Music City Center 77,567.78$ 9,241.21$ -$ 7,078.26$ 7,511.58$ 3,433.90$ 394.67$ -$ -$ -$ -$ 44,979.36$ 50,129.28$ 168.21$ 200,504.25$51 Hyatt Place Hotel 10,877.32$ -$ -$ -$ 309.82$ 179.79$ 26.17$ -$ -$ -$ 459.80$ 1,315.51$ 3,481.56$ 11.68$ 16,661.65$S1 State Government of TN 136,594.48$ 106,761.60$ -$ -$ 10,914.76$ 5,502.93$ -$ -$ 2,453.30$ -$ 7,091.36$ 61,162.51$ 91,859.18$ 308.25$ 422,648.37$
Grand Totals: 400,174.17$ 310,678.17$ 8,526.88$ 30,801.85$ 42,215.66$ 18,959.59$ 1,494.34$ -$ 6,282.07$ 6,636.69$ 16,156.34$ 246,085.70$ 269,161.73$ 903.21$ 1,358,076.40$Rate Calculation Totals: 481,337.65$ 438,531.70$ 14,127.36$ 39,305.42$ 42,229.55$ 18,972.51$ 2,191.67$ -$ 6,343.48$ 6,636.69$ 16,156.34$ 246,127.01$ 269,500.46$ 904.34$ 1,582,364.18$Deviation: (81,163.48)$ (127,853.53)$ (5,600.48)$ (8,503.57)$ (13.89)$ (12.92)$ (697.33)$ -$ (61.41)$ -$ -$ (41.31)$ (338.73)$ (1.13)$ (224,287.78)$
Metro Nashville District Energy System
Chilled Water and SteamNovember, 2018
Revenues
Appendix 3-57-

Cust
omer
Num
ber
Cust
omer
Nam
e
Cap
acity
Ope
ratin
g
ED
SIm
prov
emen
t
Met
roIn
crem
enta
l
Wat
er A
ndS
ewer
Che
mic
alTr
eatm
ent
Eng
inee
ring
Insu
ranc
e
ED
SE
lect
ricity
ED
S M
aint
Cos
ts A
lloc
TIFS
Ele
ctric
ity
Nat
ural
Gas
Pro
pane
Tota
l
2 A. A. Birch 11,253.18$ 17,259.90$ 771.36$ 2,146.11$ 1,143.71$ 1,043.84$ 82.52$ -$ 229.52$ -$ 1,786.37$ 10,522.06$ 19,804.09$ 64.57$ 66,107.23$4 Metro Courthouse 5,330.54$ 8,058.47$ 360.15$ 1,002.03$ 698.46$ 564.80$ 38.51$ -$ 107.16$ -$ 443.37$ 5,231.65$ 7,933.63$ 25.87$ 29,794.64$7 Parkway Tower 4,846.41$ 7,799.26$ 348.53$ 969.67$ 881.03$ 703.48$ 37.32$ -$ 103.70$ 709.08$ 186.26$ 6,717.96$ 9,494.47$ 30.95$ 32,828.12$9 Bobby Hotel (fka Wells Fargo) 1,940.77$ 3,111.09$ 139.03$ 386.80$ 425.85$ 460.19$ 14.88$ -$ 41.36$ 254.67$ 180.22$ 2,653.33$ 11,468.95$ 37.39$ 21,114.53$
10 Fairlane Hotel (fka 401 Union) 1,854.75$ 2,915.63$ 130.30$ 362.51$ 149.40$ 144.88$ 13.95$ -$ 38.77$ 310.26$ 274.02$ 1,064.77$ 3,074.58$ 10.02$ 10,343.84$11 Sheraton Hotel 10,248.39$ 15,695.41$ 701.45$ 1,951.59$ 1,107.43$ 1,012.68$ 75.03$ -$ 208.72$ 1,229.92$ 160.86$ 8,446.40$ 19,287.79$ 62.88$ 60,188.55$12 Municipal Auditorium 5,129.85$ 8,322.12$ 371.88$ 1,034.66$ 421.56$ 474.67$ 39.83$ -$ 110.65$ -$ 619.24$ 2,677.57$ 12,448.72$ 40.59$ 31,691.34$21 Hermitage Hotel 4,956.39$ 7,368.29$ 329.32$ 916.24$ 391.10$ 313.09$ 35.20$ -$ 97.98$ 276.83$ 590.22$ 3,196.43$ 4,260.48$ 13.89$ 22,745.46$24 Criminal Justice Center 8,390.53$ 12,128.77$ 542.13$ 1,508.31$ 44.41$ 90.23$ 57.91$ -$ 161.31$ -$ -$ 155.57$ 3,614.56$ 11.78$ 26,705.51$25 501 Union Building 1,952.36$ 2,967.66$ 132.64$ 369.01$ 269.22$ 218.82$ 14.19$ -$ 39.47$ 232.74$ -$ 2,379.32$ 3,122.39$ 10.18$ 11,708.00$28 4th & Church Building 20,848.05$ -$ -$ -$ 854.12$ 730.59$ 47.39$ -$ -$ -$ 34.40$ 7,780.12$ 11,986.45$ 39.08$ 42,320.20$29 Fifth-Third Financial Center 5,912.59$ 10,906.97$ 487.26$ 1,355.67$ 768.97$ 469.28$ 52.32$ -$ 144.98$ 786.67$ 597.09$ 11,849.23$ -$ -$ 33,331.03$32 Renaissance Hotel 15,476.02$ 23,197.94$ 1,036.80$ 2,884.61$ 1,694.94$ 1,551.53$ 110.86$ -$ 308.49$ 1,462.50$ 94.34$ 14,447.31$ 29,611.61$ 96.54$ 91,973.49$34 Renaissance Office Tower 1,445.55$ 2,666.61$ 119.13$ 331.44$ 623.04$ 380.22$ 12.79$ -$ 35.45$ 227.25$ 170.65$ 4,718.89$ -$ -$ 10,731.02$35 St. Mary's Catholic Church 997.66$ -$ -$ -$ -$ -$ -$ -$ -$ 33.26$ -$ -$ -$ -$ 1,030.92$36 Nashville City Center 4,818.51$ 8,888.71$ 397.10$ 1,104.82$ 475.31$ 290.07$ 42.64$ -$ 118.16$ 753.42$ 733.34$ 4,237.91$ -$ -$ 21,859.99$38 Wildhorse Saloon 1,805.06$ 2,924.11$ 130.67$ 363.54$ 210.04$ 159.49$ 13.99$ -$ 38.88$ 182.83$ 69.42$ 2,801.88$ 1,792.88$ 5.85$ 10,498.64$39 Ryman Auditorium 2,078.61$ 3,323.02$ 148.50$ 413.15$ 454.47$ 354.81$ 15.90$ -$ 44.18$ 177.26$ -$ 3,750.27$ 4,435.29$ 14.46$ 15,209.92$40 Bridgestone Arena 20,037.26$ 33,091.47$ 1,478.67$ 4,113.97$ 3,219.51$ 2,170.09$ 158.43$ -$ 439.97$ -$ 584.57$ 25,098.90$ 11,756.21$ 38.33$ 102,187.38$41 Nissan Stadium 8,503.25$ 15,685.96$ 700.76$ 1,949.67$ 357.12$ 217.94$ 75.24$ -$ 208.51$ -$ 120.95$ 5,306.07$ -$ -$ 33,125.47$43 Hume-Fogg High School 2,853.02$ 4,502.35$ 201.20$ 559.79$ 90.09$ 102.96$ 21.54$ -$ 59.86$ -$ 636.18$ 670.30$ 2,747.53$ 8.96$ 12,453.78$44 Schermerhorn Symphony Center 15,194.36$ -$ -$ -$ 639.96$ 501.21$ 34.16$ -$ -$ -$ -$ 5,111.05$ 6,336.11$ 20.66$ 27,837.51$45 Nashville Public Library 6,889.00$ -$ -$ -$ 2,478.03$ 1,788.94$ 53.22$ -$ -$ -$ 300.91$ 17,140.28$ 15,842.12$ 51.65$ 44,544.15$49 Viridian Residential Tower 12,372.48$ -$ -$ -$ 191.69$ 116.98$ 25.68$ -$ -$ -$ 1,503.26$ 1,722.24$ -$ -$ 15,932.33$50 Music City Center 77,567.78$ 9,241.21$ -$ 7,078.26$ 5,512.66$ 4,610.36$ 394.67$ -$ -$ -$ -$ 47,443.99$ 71,353.51$ 232.63$ 223,435.07$51 Hyatt Place Hotel 10,877.32$ -$ -$ -$ 168.01$ 166.70$ 26.17$ -$ -$ -$ 482.01$ 1,454.35$ 3,674.02$ 11.98$ 16,860.56$S1 State Government of TN 136,594.48$ 106,761.60$ -$ -$ 7,510.72$ 6,653.37$ -$ -$ 1,625.64$ -$ 6,729.59$ 59,471.01$ 118,513.72$ 386.38$ 444,246.51$
Grand Totals: 400,174.17$ 306,816.55$ 8,526.88$ 30,801.85$ 30,780.85$ 25,291.22$ 1,494.34$ -$ 4,162.76$ 6,636.69$ 16,297.27$ 256,048.86$ 372,559.11$ 1,214.64$ 1,460,805.19$Rate Calculation Totals: 481,337.65$ 432,133.73$ 14,127.36$ 39,305.42$ 30,791.62$ 25,310.08$ 2,191.67$ -$ 4,203.54$ 6,636.69$ 16,297.27$ 256,098.63$ 373,260.40$ 1,216.90$ 1,682,910.96$Deviation: (81,163.48)$ (125,317.18)$ (5,600.48)$ (8,503.57)$ (10.77)$ (18.86)$ (697.33)$ -$ (40.78)$ -$ -$ (49.77)$ (701.29)$ (2.26)$ (222,105.77)$
Metro Nashville District Energy System
Chilled Water and SteamDecember, 2018
Revenues
Appendix 3-58-

Cust
omer
Num
ber
Cust
omer
Nam
e
Cap
acity
Ope
ratin
g
ED
SIm
prov
emen
t
Met
roIn
crem
enta
l
Wat
er A
ndS
ewer
Che
mic
alTr
eatm
ent
Eng
inee
ring
Insu
ranc
e
ED
S E
lect
ricity
ED
S M
aint
Cos
ts A
lloc
TIFS
Ele
ctric
ity
Nat
ural
Gas
Pro
pane
Tota
l
2 A. A. Birch 11,253.18$ 16,835.71$ 771.36$ 2,146.11$ 1,206.18$ 883.10$ 82.52$ -$ 214.39$ -$ 1,849.56$ 8,719.66$ 18,233.97$ 333.60$ 62,529.34$4 Metro Courthouse 5,330.54$ 7,860.41$ 360.15$ 1,002.03$ 823.01$ 495.15$ 38.51$ -$ 100.10$ -$ 458.49$ 4,935.62$ 7,556.50$ 138.25$ 29,098.76$7 Parkway Tower 4,846.41$ 7,607.60$ 348.53$ 969.67$ 1,050.99$ 621.52$ 37.32$ -$ 96.87$ 709.08$ 244.39$ 7,002.93$ 9,158.73$ 167.56$ 32,861.60$9 Bobby Hotel (fka Wells Fargo) 1,940.77$ 3,034.63$ 139.03$ 386.80$ 240.99$ 145.99$ 14.88$ -$ 38.64$ 254.67$ 187.68$ 1,641.70$ 2,258.50$ 41.32$ 10,325.60$
10 Fairlane Hotel (fka 401 Union) 1,854.75$ 2,843.98$ 130.30$ 362.51$ 227.45$ 178.00$ 13.95$ -$ 36.21$ 310.26$ 246.80$ 1,181.33$ 3,960.51$ 72.46$ 11,418.51$11 Sheraton Hotel 10,248.39$ 15,309.66$ 701.45$ 1,951.59$ 1,299.45$ 943.71$ 75.03$ -$ 194.96$ 1,229.92$ 158.30$ 7,589.15$ 19,294.93$ 353.01$ 59,349.55$12 Municipal Auditorium 5,129.85$ 8,117.62$ 371.88$ 1,034.66$ 495.13$ 473.61$ 39.83$ -$ 103.36$ -$ 618.90$ 2,928.26$ 12,537.85$ 229.39$ 32,080.34$21 Hermitage Hotel 4,956.39$ 7,187.19$ 329.32$ 916.24$ 357.01$ 228.67$ 35.20$ -$ 91.53$ 276.83$ 593.51$ 2,305.59$ 3,909.12$ 71.52$ 21,258.12$24 Criminal Justice Center 8,390.53$ 11,830.65$ 542.13$ 1,508.31$ 147.61$ 265.03$ 57.91$ -$ 150.68$ -$ -$ 453.35$ 9,370.26$ 171.43$ 32,887.89$25 501 Union Building 1,952.36$ 2,894.72$ 132.64$ 369.01$ 257.99$ 162.36$ 14.19$ -$ 36.86$ 232.74$ -$ 2,241.42$ 2,693.63$ 49.28$ 11,037.20$28 4th & Church Building 20,848.05$ -$ -$ -$ 1,020.99$ 678.59$ 47.39$ -$ -$ -$ -$ 7,581.03$ 12,300.02$ 225.04$ 42,701.11$29 Fifth-Third Financial Center 5,912.59$ 10,639.01$ 487.26$ 1,355.67$ 902.72$ 360.87$ 52.32$ -$ 135.43$ 786.67$ 513.10$ 11,271.75$ -$ -$ 32,417.39$32 Renaissance Hotel 15,476.02$ 22,627.77$ 1,036.80$ 2,884.61$ 1,951.01$ 1,462.01$ 110.86$ -$ 288.16$ 1,462.50$ 82.52$ 10,200.05$ 31,021.30$ 567.55$ 89,171.16$34 Renaissance Office Tower 1,445.55$ 2,601.10$ 119.13$ 331.44$ 710.92$ 284.20$ 12.79$ -$ 33.11$ 227.25$ 174.01$ 4,408.85$ -$ -$ 10,348.35$35 St. Mary's Catholic Church 997.66$ -$ -$ -$ -$ -$ -$ -$ -$ 33.26$ -$ -$ -$ -$ 1,030.92$36 Nashville City Center 4,818.51$ 8,670.33$ 397.10$ 1,104.82$ 525.31$ 210.00$ 42.64$ -$ 110.37$ 753.42$ 424.90$ 4,069.96$ -$ -$ 21,127.36$38 Wildhorse Saloon 1,805.06$ 2,852.26$ 130.67$ 363.54$ 217.55$ 136.88$ 13.99$ -$ 36.32$ 182.83$ 58.32$ 2,965.46$ 2,270.23$ 41.54$ 11,074.65$39 Ryman Auditorium 2,078.61$ 3,241.36$ 148.50$ 413.15$ 449.16$ 281.87$ 15.90$ -$ 41.27$ 177.26$ -$ 2,882.82$ 4,653.11$ 85.13$ 14,468.14$40 Bridgestone Arena 20,037.26$ 32,278.31$ 1,478.67$ 4,113.97$ 3,078.58$ 1,467.03$ 158.43$ -$ 410.98$ -$ 654.61$ 18,113.05$ 10,749.03$ 196.66$ 92,736.58$41 Nissan Stadium 8,503.25$ 15,300.59$ 700.76$ 1,949.67$ 257.48$ 102.93$ 75.24$ -$ 194.77$ -$ 95.22$ 4,155.99$ -$ -$ 31,335.90$43 Hume-Fogg High School 2,853.02$ 4,391.71$ 201.20$ 559.79$ 63.86$ 78.50$ 21.54$ -$ 55.92$ -$ 645.08$ 624.37$ 2,409.23$ 44.08$ 11,948.30$44 Schermerhorn Symphony Center 15,194.36$ -$ -$ -$ 660.14$ 398.21$ 34.16$ -$ -$ -$ -$ 4,779.31$ 6,108.49$ 111.76$ 27,286.43$45 Nashville Public Library 6,889.00$ -$ -$ -$ 2,955.79$ 1,505.31$ 53.22$ -$ -$ -$ 306.22$ 16,730.03$ 14,722.63$ 269.36$ 43,431.56$49 Viridian Residential Tower 12,372.48$ -$ -$ -$ 225.65$ 90.21$ 25.68$ -$ -$ -$ 1,503.26$ 1,627.40$ -$ -$ 15,844.68$50 Music City Center 77,567.78$ 9,241.21$ -$ 7,078.26$ 6,508.10$ 4,267.01$ 394.67$ -$ -$ -$ -$ 45,046.15$ 75,741.06$ 1,385.73$ 227,229.97$51 Hyatt Place Hotel 10,877.32$ -$ -$ -$ 198.91$ 170.62$ 26.17$ -$ -$ -$ 484.23$ 1,152.94$ 4,143.57$ 75.81$ 17,129.57$S1 State Government of TN 136,594.48$ 106,761.60$ -$ -$ 9,416.85$ 6,470.88$ -$ -$ 1,518.55$ -$ 6,220.83$ 66,199.54$ 123,088.82$ 2,251.98$ 458,523.53$
Grand Totals: 400,174.17$ 302,127.42$ 8,526.88$ 30,801.85$ 35,248.83$ 22,362.26$ 1,494.34$ -$ 3,888.48$ 6,636.69$ 15,519.93$ 240,807.71$ 376,181.49$ 6,882.46$ 1,450,652.51$Rate Calculation Totals: 481,337.65$ 424,364.76$ 14,127.36$ 39,305.42$ 35,262.89$ 22,383.91$ 2,191.67$ -$ 3,926.59$ 6,636.69$ 15,519.93$ 240,861.75$ 376,908.53$ 6,895.76$ 1,669,722.91$Deviation: (81,163.48)$ (122,237.34)$ (5,600.48)$ (8,503.57)$ (14.06)$ (21.65)$ (697.33)$ -$ (38.11)$ -$ -$ (54.04)$ (727.04)$ (13.30)$ (219,070.40)$
Metro Nashville District Energy System
Chilled Water and SteamJanuary, 2019
Revenues
Appendix 3-59-

Cust
omer
Num
ber
Cust
omer
Nam
e
Cap
acity
Ope
ratin
g
ED
SIm
prov
emen
t
Met
roIn
crem
enta
l
Wat
er A
ndS
ewer
Che
mic
alTr
eatm
ent
Eng
inee
ring
Insu
ranc
e
ED
S E
lect
ricity
ED
S M
aint
Cos
ts A
lloc
TIFS
Ele
ctric
ity
Nat
ural
Gas
Pro
pane
Tota
l
2 A. A. Birch 11,253.18$ 16,835.71$ 771.36$ 2,146.11$ 2,520.89$ 675.92$ 82.57$ -$ 265.74$ -$ 1,682.93$ 10,924.47$ 11,356.78$ -$ 58,515.66$4 Metro Courthouse 5,330.54$ 7,860.41$ 360.15$ 1,002.03$ 1,569.06$ 358.27$ 38.54$ -$ 124.08$ -$ 521.35$ 5,401.65$ 4,751.11$ -$ 27,317.19$7 Parkway Tower 4,846.41$ 7,607.60$ 348.53$ 969.67$ 1,791.76$ 412.17$ 37.34$ -$ 120.07$ 709.08$ 148.38$ 6,605.98$ 5,538.95$ -$ 29,135.94$9 Bobby Hotel (fka Wells Fargo) 1,940.77$ 3,034.63$ 139.03$ 386.80$ 329.11$ 84.57$ 14.89$ -$ 47.89$ 254.67$ 191.12$ 1,713.86$ 1,346.37$ -$ 9,483.71$
10 Fairlane Hotel (fka 401 Union) 1,854.75$ 2,843.98$ 130.30$ 362.51$ 674.47$ 175.51$ 13.95$ -$ 44.89$ 310.26$ 205.67$ 2,242.49$ 2,840.95$ -$ 11,699.73$11 Sheraton Hotel 10,248.39$ 15,309.66$ 701.45$ 1,951.59$ 3,075.42$ 822.84$ 75.08$ -$ 241.65$ 1,229.92$ 150.76$ 10,161.15$ 13,789.81$ -$ 57,757.72$12 Municipal Auditorium 5,129.85$ 8,117.62$ 371.88$ 1,034.66$ 803.81$ 305.12$ 39.85$ -$ 128.11$ -$ 399.90$ 2,281.35$ 6,947.14$ -$ 25,559.29$21 Hermitage Hotel 4,956.39$ 7,187.19$ 329.32$ 916.24$ 732.01$ 176.04$ 35.23$ -$ 113.46$ 276.83$ 599.86$ 2,731.25$ 2,546.97$ -$ 20,600.79$24 Criminal Justice Center 8,390.53$ 11,830.65$ 542.13$ 1,508.31$ 535.11$ 290.67$ 57.97$ -$ 186.77$ -$ -$ 1,041.30$ 7,874.79$ -$ 32,258.23$25 501 Union Building 1,952.36$ 2,894.72$ 132.64$ 369.01$ 575.91$ 129.87$ 14.20$ -$ 45.69$ 232.74$ -$ 2,494.21$ 1,683.38$ -$ 10,524.73$28 4th & Church Building 20,848.05$ -$ -$ -$ 1,782.49$ 435.27$ 47.42$ -$ -$ -$ -$ 7,449.72$ 6,446.66$ -$ 37,009.61$29 Fifth-Third Financial Center 5,912.59$ 10,639.01$ 487.26$ 1,355.67$ 1,780.89$ 261.37$ 52.32$ -$ 167.86$ 786.67$ 471.72$ 9,588.80$ -$ -$ 31,504.16$32 Renaissance Hotel 15,476.02$ 22,627.77$ 1,036.80$ 2,884.61$ 4,046.79$ 1,128.60$ 110.94$ -$ 357.18$ 1,462.50$ 144.41$ 10,679.82$ 19,847.76$ -$ 79,803.20$34 Renaissance Office Tower 1,445.55$ 2,601.10$ 119.13$ 331.44$ 1,253.35$ 183.94$ 12.79$ -$ 41.04$ 227.25$ 169.96$ 4,337.37$ -$ -$ 10,722.92$35 St. Mary's Catholic Church 997.66$ -$ -$ -$ -$ -$ -$ -$ -$ 33.26$ -$ -$ -$ -$ 1,030.92$36 Nashville City Center 4,818.51$ 8,670.33$ 397.10$ 1,104.82$ 1,120.47$ 164.44$ 42.64$ -$ 136.80$ 753.42$ 370.94$ 6,429.88$ -$ -$ 24,009.35$38 Wildhorse Saloon 1,805.06$ 2,852.26$ 130.67$ 363.54$ 440.86$ 110.54$ 14.00$ -$ 45.02$ 182.83$ 58.32$ 2,255.90$ 1,701.78$ -$ 9,960.78$39 Ryman Auditorium 1,860.81$ 2,989.69$ 136.96$ 381.05$ 1,092.62$ 244.28$ 14.68$ -$ 47.19$ 177.26$ -$ 4,006.06$ 3,115.46$ -$ 14,066.06$40 Bridgestone Arena 20,037.26$ 32,278.31$ 1,478.67$ 4,113.97$ 9,088.96$ 1,612.05$ 158.49$ -$ 509.40$ -$ 277.71$ 37,706.76$ 10,324.55$ -$ 117,586.13$41 Nissan Stadium 8,503.25$ 15,300.59$ 700.76$ 1,949.67$ 966.07$ 141.78$ 75.24$ -$ 241.41$ -$ 119.02$ 6,938.84$ -$ -$ 34,936.63$43 Hume-Fogg High School 2,853.02$ 4,391.71$ 201.20$ 559.79$ 133.99$ 56.38$ 21.55$ -$ 69.31$ -$ 640.32$ 920.47$ 1,362.88$ -$ 11,210.62$44 Schermerhorn Symphony Center 15,194.36$ -$ -$ -$ 1,396.03$ 317.79$ 34.18$ -$ -$ -$ -$ 5,886.05$ 4,190.99$ -$ 27,019.40$45 Nashville Public Library 6,889.00$ -$ -$ -$ 5,180.37$ 1,024.65$ 53.26$ -$ -$ -$ 282.10$ 16,134.96$ 9,813.58$ -$ 39,377.92$49 Viridian Residential Tower 12,372.48$ -$ -$ -$ 446.07$ 65.47$ 25.68$ -$ -$ -$ 1,435.21$ 1,927.67$ -$ -$ 16,272.58$50 Music City Center 77,567.78$ 9,241.21$ -$ 7,081.70$ 13,906.39$ 3,242.67$ 394.86$ -$ -$ -$ -$ 55,199.56$ 44,609.18$ -$ 211,243.35$51 Hyatt Place Hotel 10,877.32$ -$ -$ -$ 483.26$ 160.98$ 26.19$ -$ -$ -$ 462.02$ 1,650.04$ 3,342.88$ -$ 17,002.69$S1 State Government of TN 129,782.48$ 101,300.16$ -$ -$ 17,911.68$ 4,595.82$ -$ -$ 1,787.69$ -$ 4,769.13$ 70,043.09$ 73,018.87$ -$ 403,208.92$
Grand Totals: 393,144.37$ 296,414.31$ 8,515.34$ 30,773.19$ 73,637.84$ 17,177.01$ 1,493.86$ -$ 4,721.25$ 6,636.69$ 13,100.83$ 286,752.70$ 236,450.84$ -$ 1,368,818.23$Rate Calculation Totals: 481,337.65$ 424,364.76$ 14,127.36$ 39,305.42$ 73,664.77$ 17,193.57$ 2,191.67$ -$ 4,866.87$ 6,636.69$ 13,100.83$ 286,800.27$ 236,912.77$ -$ 1,600,502.63$Deviation: (88,193.28)$ (127,950.45)$ (5,612.02)$ (8,532.23)$ (26.93)$ (16.56)$ (697.81)$ -$ (145.62)$ -$ -$ (47.57)$ (461.93)$ -$ (231,684.40)$
Metro Nashville District Energy System
Chilled Water and SteamFebruary, 2019
Revenues
Appendix 3-60-

Cust
omer
Num
ber
Cust
omer
Nam
e
Cap
acity
Ope
ratin
g
ED
SIm
prov
emen
t
Met
roIn
crem
enta
l
Wat
er A
ndS
ewer
Che
mic
alTr
eatm
ent
Eng
inee
ring
Insu
ranc
e
ED
SE
lect
ricity
ED
S M
aint
Cos
ts A
lloc
TIFS
Ele
ctric
ity
Nat
ural
Gas
Pro
pane
Tota
l
2 A. A. Birch 11,253.18$ 16,835.71$ 771.36$ 2,146.11$ 1,087.89$ 683.38$ 82.57$ -$ 293.64$ -$ 1,699.59$ 9,725.79$ 12,533.40$ 10.47$ 57,123.09$4 Metro Courthouse 5,330.54$ 7,860.41$ 360.15$ 1,002.03$ 670.06$ 362.70$ 38.54$ -$ 137.10$ -$ 554.63$ 5,264.33$ 5,319.60$ 4.44$ 26,904.53$7 Parkway Tower 4,846.41$ 7,607.60$ 348.53$ 969.67$ 775.11$ 408.52$ 37.34$ -$ 132.67$ 709.08$ 117.83$ 6,648.07$ 5,698.17$ 4.76$ 28,303.76$9 Bobby Hotel (fka Wells Fargo) 1,940.77$ 3,034.63$ 139.03$ 386.80$ 151.55$ 81.81$ 14.89$ -$ 52.92$ 254.67$ 170.46$ 1,768.68$ 1,194.02$ 1.00$ 9,191.23$
10 Fairlane Hotel (fka 401 Union) 1,854.75$ 2,843.98$ 130.30$ 362.51$ 294.41$ 176.61$ 13.95$ -$ 49.60$ 310.26$ 199.57$ 2,198.58$ 3,048.59$ 2.55$ 11,485.66$11 Sheraton Hotel 10,248.39$ 15,309.66$ 701.45$ 1,951.59$ 1,132.85$ 743.90$ 75.08$ -$ 267.02$ 1,229.92$ 150.76$ 9,161.20$ 14,382.01$ 12.01$ 55,365.84$12 Municipal Auditorium 5,129.85$ 8,117.62$ 371.88$ 1,034.66$ 311.86$ 283.91$ 39.85$ -$ 141.56$ -$ 295.17$ 2,493.79$ 7,221.58$ 6.03$ 25,447.76$21 Hermitage Hotel 4,956.39$ 7,187.19$ 329.32$ 916.24$ 375.27$ 217.49$ 35.23$ -$ 125.36$ 276.83$ 542.73$ 3,095.84$ 3,570.68$ 2.98$ 21,631.55$24 Criminal Justice Center 8,390.53$ 11,830.65$ 542.13$ 1,508.31$ 234.39$ 237.29$ 57.97$ -$ 206.37$ -$ -$ 1,998.54$ 6,413.59$ 5.36$ 31,425.13$25 501 Union Building 1,952.36$ 2,894.72$ 132.64$ 369.01$ 197.99$ 108.40$ 14.20$ -$ 50.49$ 232.74$ -$ 2,005.80$ 1,622.48$ 1.36$ 9,582.19$28 4th & Church Building 20,848.05$ -$ -$ -$ 798.58$ 461.49$ 47.42$ -$ -$ -$ -$ 6,853.70$ 7,544.76$ 6.30$ 36,560.30$29 Fifth-Third Financial Center 5,912.59$ 10,639.01$ 487.26$ 1,355.67$ 800.34$ 279.13$ 52.32$ -$ 185.48$ 786.67$ 422.07$ 9,988.23$ -$ -$ 30,908.77$32 Renaissance Hotel 15,476.02$ 22,627.77$ 1,036.80$ 2,884.61$ 1,604.36$ 1,058.87$ 110.94$ -$ 394.68$ 1,462.50$ 72.20$ 11,127.05$ 20,588.92$ 17.19$ 78,461.91$34 Renaissance Office Tower 1,445.55$ 2,601.10$ 119.13$ 331.44$ 534.19$ 186.31$ 12.79$ -$ 45.35$ 227.25$ 165.91$ 4,479.31$ -$ -$ 10,148.33$35 St. Mary's Catholic Church 997.66$ -$ -$ -$ -$ -$ -$ -$ -$ 33.26$ -$ -$ -$ -$ 1,030.92$36 Nashville City Center 4,818.51$ 8,670.33$ 397.10$ 1,104.82$ 530.26$ 184.94$ 42.64$ -$ 151.16$ 753.42$ 377.69$ 6,010.56$ -$ -$ 23,041.43$38 Wildhorse Saloon 1,805.06$ 2,852.26$ 130.67$ 363.54$ 211.37$ 109.04$ 14.00$ -$ 49.75$ 182.83$ 59.99$ 3,727.24$ 1,456.58$ 1.22$ 10,963.55$39 Ryman Auditorium 1,860.81$ 2,989.69$ 136.96$ 381.05$ 481.48$ 259.46$ 14.68$ -$ 52.13$ 177.26$ -$ 3,915.41$ 3,774.23$ 3.15$ 14,046.31$40 Bridgestone Arena 20,037.26$ 32,278.31$ 1,478.67$ 4,113.97$ 3,123.55$ 1,281.94$ 158.49$ -$ 562.88$ -$ 277.71$ 28,890.07$ 7,939.58$ 6.63$ 100,149.06$41 Nissan Stadium 8,503.25$ 15,300.59$ 700.76$ 1,949.67$ 454.11$ 158.38$ 75.24$ -$ 266.75$ -$ 119.02$ 6,841.84$ -$ -$ 34,369.61$43 Hume-Fogg High School 2,853.02$ 4,391.71$ 201.20$ 559.79$ 55.81$ 56.04$ 21.55$ -$ 76.59$ -$ 635.56$ 537.13$ 1,508.39$ 1.26$ 10,898.05$44 Schermerhorn Symphony Center 15,194.36$ -$ -$ -$ 639.11$ 341.69$ 34.18$ -$ -$ -$ -$ 5,331.23$ 4,898.13$ 4.09$ 26,442.79$45 Nashville Public Library 6,889.00$ -$ -$ -$ 2,081.21$ 985.25$ 53.26$ -$ -$ -$ 260.40$ 15,144.44$ 10,695.66$ 8.93$ 36,118.15$49 Viridian Residential Tower 12,372.48$ -$ -$ -$ 204.96$ 71.48$ 25.68$ -$ -$ -$ 1,391.90$ 2,031.76$ -$ -$ 16,098.26$50 Music City Center 77,567.78$ 9,241.21$ -$ 7,081.70$ 5,619.09$ 3,150.83$ 394.86$ -$ -$ -$ -$ 57,141.02$ 49,112.32$ 41.02$ 209,349.83$51 Hyatt Place Hotel 10,877.32$ -$ -$ -$ 190.95$ 148.23$ 26.19$ -$ -$ -$ 508.67$ 1,967.20$ 3,366.10$ 2.81$ 17,087.47$S1 State Government of TN 143,406.48$ 112,223.04$ -$ -$ 6,713.15$ 4,064.13$ -$ -$ 2,079.82$ -$ 5,242.58$ 63,123.90$ 71,038.12$ 59.32$ 407,950.54$
Grand Totals: 406,768.37$ 307,337.19$ 8,515.34$ 30,773.19$ 29,273.90$ 16,101.22$ 1,493.86$ -$ 5,321.32$ 6,636.69$ 13,264.44$ 271,470.71$ 242,926.91$ 202.88$ 1,340,086.02$Rate Calculation Totals: 481,337.65$ 424,364.76$ 14,127.36$ 39,305.42$ 29,282.73$ 16,112.29$ 2,191.67$ -$ 5,377.77$ 6,636.69$ 13,264.44$ 271,511.00$ 243,256.03$ 203.16$ 1,546,970.97$Deviation: (74,569.28)$ (117,027.57)$ (5,612.02)$ (8,532.23)$ (8.83)$ (11.07)$ (697.81)$ -$ (56.45)$ -$ -$ (40.29)$ (329.12)$ (0.28)$ (206,884.95)$
Metro Nashville District Energy System
Chilled Water and SteamMarch, 2019
Revenues
Appendix 3-61-

Cust
omer
Num
ber
Cust
omer
Nam
e
Cap
acity
Ope
ratin
g
ED
SIm
prov
emen
t
Met
roIn
crem
enta
l
Wat
er A
ndS
ewer
Che
mic
alTr
eatm
ent
Eng
inee
ring
Insu
ranc
e
ED
SE
lect
ricity
ED
S M
aint
Cos
ts A
lloc
TIFS
Ele
ctric
ity
Nat
ural
Gas
Pro
pane
Tota
l
2 A. A. Birch 11,253.18$ 16,835.71$ 771.36$ 2,146.11$ 1,330.71$ 715.08$ 82.57$ -$ 275.11$ -$ 1,249.70$ 12,076.75$ 9,578.15$ -$ 56,314.43$4 Metro Courthouse 5,330.54$ 7,860.41$ 360.15$ 1,002.03$ 593.62$ 289.21$ 38.54$ -$ 128.45$ -$ 306.89$ 6,060.62$ 3,311.54$ -$ 25,282.00$7 Parkway Tower 4,846.41$ 7,607.60$ 348.53$ 969.67$ 514.59$ 191.86$ 37.34$ -$ 124.30$ 709.08$ 91.64$ 6,290.56$ 971.77$ -$ 22,703.35$9 Bobby Hotel (fka Wells Fargo) 1,940.77$ 3,034.63$ 139.03$ 386.80$ 292.23$ 133.63$ 14.89$ -$ 49.59$ 254.67$ 127.41$ 2,354.59$ 1,348.13$ -$ 10,076.37$
10 Fairlane Hotel (fka 401 Union) 1,854.75$ 2,843.98$ 130.30$ 362.51$ 270.12$ 126.44$ 13.95$ -$ 46.47$ 310.26$ 196.53$ 2,543.70$ 1,340.36$ -$ 10,039.37$11 Sheraton Hotel 10,248.39$ 15,309.66$ 701.45$ 1,951.59$ 1,173.11$ 771.53$ 75.08$ -$ 250.18$ 1,229.92$ 128.14$ 10,245.82$ 12,998.47$ -$ 55,083.34$12 Municipal Auditorium 5,129.85$ 8,117.62$ 371.88$ 1,034.66$ 346.80$ 179.21$ 39.85$ -$ 132.63$ -$ 457.03$ 3,842.86$ 2,265.44$ -$ 21,917.83$21 Hermitage Hotel 4,956.39$ 7,187.19$ 329.32$ 916.24$ 445.90$ 234.09$ 35.23$ -$ 117.46$ 276.83$ 476.08$ 3,928.99$ 3,031.41$ -$ 21,935.13$24 Criminal Justice Center 8,390.53$ 11,830.65$ 542.13$ 1,508.31$ 189.84$ 111.42$ 57.97$ -$ 193.35$ -$ -$ 4,080.41$ 1,670.14$ -$ 28,574.75$25 501 Union Building 1,952.36$ 2,894.72$ 132.64$ 369.01$ 254.13$ 119.82$ 14.20$ -$ 47.30$ 232.74$ -$ 3,017.73$ 1,288.86$ -$ 10,323.51$28 4th & Church Building 20,848.05$ -$ -$ -$ 599.75$ 236.66$ 47.42$ -$ -$ -$ -$ 8,966.43$ 1,553.46$ -$ 32,251.77$29 Fifth-Third Financial Center 5,912.59$ 10,639.01$ 487.26$ 1,355.67$ 1,006.34$ 316.33$ 52.32$ -$ 173.78$ 786.67$ 231.72$ 14,321.23$ -$ -$ 35,282.92$32 Renaissance Hotel 15,476.02$ 22,627.77$ 1,036.80$ 2,884.61$ 2,047.46$ 1,080.18$ 110.94$ -$ 369.77$ 1,462.50$ -$ 18,462.48$ 14,089.67$ -$ 79,648.20$34 Renaissance Office Tower 1,445.55$ 2,601.10$ 119.13$ 331.44$ 486.18$ 152.82$ 12.79$ -$ 42.49$ 227.25$ 143.66$ 5,136.19$ -$ -$ 10,698.60$35 St. Mary's Catholic Church 997.66$ -$ -$ -$ -$ -$ -$ -$ -$ 33.26$ -$ -$ -$ -$ 1,030.92$36 Nashville City Center 4,818.51$ 8,670.33$ 397.10$ 1,104.82$ 671.17$ 210.97$ 42.64$ -$ 141.62$ 753.42$ 141.63$ 8,758.52$ -$ -$ 25,710.73$38 Wildhorse Saloon 1,805.06$ 2,852.26$ 130.67$ 363.54$ 300.86$ 146.11$ 14.00$ -$ 46.60$ 182.83$ 33.33$ 4,870.98$ 1,663.37$ -$ 12,409.61$39 Ryman Auditorium 1,860.81$ 2,989.69$ 136.96$ 381.05$ 549.82$ 268.77$ 14.68$ -$ 48.84$ 177.26$ -$ 5,045.25$ 3,096.06$ -$ 14,569.19$40 Bridgestone Arena 20,037.26$ 32,278.31$ 1,478.67$ 4,113.97$ 3,624.37$ 1,363.60$ 158.49$ -$ 527.36$ -$ -$ 31,742.06$ 7,239.77$ -$ 102,563.86$41 Nissan Stadium 8,503.25$ 15,300.59$ 700.76$ 1,949.67$ 1,102.90$ 346.68$ 75.24$ -$ 249.92$ -$ 154.72$ 9,537.08$ -$ -$ 37,920.81$43 Hume-Fogg High School 2,853.02$ 4,391.71$ 201.20$ 559.79$ 104.84$ 61.41$ 21.55$ -$ 71.75$ -$ 516.54$ 2,097.34$ 918.23$ -$ 11,797.38$44 Schermerhorn Symphony Center 15,194.36$ -$ -$ -$ 657.39$ 337.66$ 34.18$ -$ -$ -$ -$ 7,535.22$ 4,228.03$ -$ 27,986.84$45 Nashville Public Library 6,889.00$ -$ -$ -$ 1,741.83$ 819.46$ 53.26$ -$ -$ -$ 231.47$ 16,339.40$ 8,776.15$ -$ 34,850.57$49 Viridian Residential Tower 12,372.48$ -$ -$ -$ 341.13$ 107.23$ 25.68$ -$ -$ -$ 946.49$ 3,213.22$ -$ -$ 17,006.23$50 Music City Center 77,567.78$ 9,241.21$ -$ 7,081.70$ 5,914.99$ 2,850.79$ 394.86$ -$ -$ -$ -$ 60,655.91$ 31,997.92$ -$ 195,705.16$51 Hyatt Place Hotel 10,877.32$ -$ -$ -$ 203.83$ 143.08$ 26.19$ -$ -$ -$ 393.16$ 1,810.08$ 2,549.62$ -$ 16,003.28$S1 State Government of TN 136,594.48$ 106,761.60$ -$ -$ 6,215.13$ 3,238.11$ -$ -$ 1,948.60$ -$ 6,863.32$ 67,901.24$ 41,451.70$ -$ 370,974.18$
Grand Totals: 399,956.37$ 301,875.75$ 8,515.34$ 30,773.19$ 30,979.04$ 14,552.15$ 1,493.86$ -$ 4,985.57$ 6,636.69$ 12,689.46$ 320,834.66$ 155,368.25$ -$ 1,288,660.33$Rate Calculation Totals: 481,337.65$ 424,364.76$ 14,127.36$ 39,305.42$ 30,988.15$ 14,559.68$ 2,191.67$ -$ 5,038.48$ 6,636.69$ 12,689.46$ 320,888.28$ 155,521.61$ -$ 1,507,649.21$Deviation: (81,381.28)$ (122,489.01)$ (5,612.02)$ (8,532.23)$ (9.11)$ (7.53)$ (697.81)$ -$ (52.91)$ -$ -$ (53.62)$ (153.36)$ -$ (218,988.88)$
Metro Nashville District Energy System
Chilled Water and SteamApril, 2019
Revenues
Appendix 3-62-

Cust
omer
Num
ber
Cust
omer
Nam
e
Cap
acity
Ope
ratin
g
ED
SIm
prov
emen
t
Met
roIn
crem
enta
l
Wat
er A
ndS
ewer
Che
mic
alTr
eatm
ent
Eng
inee
ring
Insu
ranc
e
ED
SE
lect
ricity
ED
S M
aint
Cos
ts A
lloc
TIFS
Ele
ctric
ity
Nat
ural
Gas
Pro
pane
Tota
l
2 A. A. Birch 11,253.18$ 16,835.71$ 771.36$ 2,146.11$ 1,589.47$ 636.79$ 82.57$ -$ -$ -$ 533.21$ 15,721.98$ 4,151.49$ 13.81$ 53,735.68$4 Metro Courthouse 5,330.54$ 7,860.41$ 360.15$ 1,002.03$ 838.98$ 355.03$ 38.54$ -$ -$ -$ 170.09$ 8,473.01$ 2,682.47$ 8.93$ 27,120.18$7 Parkway Tower 4,846.41$ 7,607.60$ 348.53$ 969.67$ 697.84$ 222.10$ 37.34$ -$ -$ 709.08$ 274.93$ 8,250.31$ 329.70$ 1.10$ 24,294.61$9 Bobby Hotel (fka Wells Fargo) 1,940.77$ 3,034.63$ 139.03$ 386.80$ 528.07$ 205.65$ 14.89$ -$ -$ 254.67$ 20.66$ 5,399.32$ 1,225.89$ 4.08$ 13,154.46$
10 Fairlane Hotel (fka 401 Union) 1,854.75$ 2,843.98$ 130.30$ 362.51$ 369.53$ 139.64$ 13.95$ -$ -$ 310.26$ 163.01$ 3,773.06$ 746.97$ 2.49$ 10,710.45$11 Sheraton Hotel 10,248.39$ 15,309.66$ 701.45$ 1,951.59$ 1,681.64$ 870.88$ 75.08$ -$ -$ 1,229.92$ -$ 15,381.83$ 9,513.16$ 31.65$ 56,995.25$12 Municipal Auditorium 5,129.85$ 8,117.62$ 371.88$ 1,034.66$ 481.15$ 148.26$ 39.85$ -$ -$ -$ 209.47$ 6,415.96$ 100.70$ 0.34$ 22,049.74$21 Hermitage Hotel 4,956.39$ 7,187.19$ 329.32$ 916.24$ 653.78$ 314.47$ 35.23$ -$ -$ 276.83$ 428.47$ 5,970.35$ 3,072.51$ 10.22$ 24,151.00$24 Criminal Justice Center 8,390.53$ 11,830.65$ 542.13$ 1,508.31$ 297.65$ 101.02$ 57.97$ -$ -$ -$ -$ 3,632.90$ 303.94$ 1.01$ 26,666.11$25 501 Union Building 1,952.36$ 2,894.72$ 132.64$ 369.01$ 338.74$ 142.41$ 14.20$ -$ -$ 232.74$ -$ 3,775.58$ 1,058.83$ 3.52$ 10,914.75$28 4th & Church Building 20,848.05$ -$ -$ -$ 911.24$ 273.44$ 47.42$ -$ -$ -$ -$ 12,348.99$ -$ -$ 34,429.14$29 Fifth-Third Financial Center 5,912.59$ 10,639.01$ 487.26$ 1,355.67$ 1,116.75$ 335.10$ 52.32$ -$ -$ 786.67$ 231.72$ 15,641.41$ -$ -$ 36,558.50$32 Renaissance Hotel 15,476.02$ 22,627.77$ 1,036.80$ 2,884.61$ 3,425.42$ 1,520.17$ 110.94$ -$ -$ 1,462.50$ -$ 30,478.66$ 12,786.64$ 42.55$ 91,852.08$34 Renaissance Office Tower 1,445.55$ 2,601.10$ 119.13$ 331.44$ 550.72$ 165.25$ 12.79$ -$ -$ 227.25$ 99.14$ 5,788.06$ -$ -$ 11,340.43$35 St. Mary's Catholic Church 997.66$ -$ -$ -$ -$ -$ -$ -$ -$ 33.26$ -$ -$ -$ -$ 1,030.92$36 Nashville City Center 4,818.51$ 8,670.33$ 397.10$ 1,104.82$ 1,145.43$ 343.71$ 42.64$ -$ -$ 753.42$ -$ 13,765.17$ -$ -$ 31,041.13$38 Wildhorse Saloon 1,805.06$ 2,852.26$ 130.67$ 363.54$ 400.51$ 151.74$ 14.00$ -$ -$ 182.83$ -$ 6,290.16$ 819.76$ 2.73$ 13,013.26$39 Ryman Auditorium 1,860.81$ 2,989.69$ 136.96$ 381.05$ 700.86$ 307.90$ 14.68$ -$ -$ 177.26$ -$ 6,459.81$ 2,534.66$ 8.43$ 15,572.11$40 Bridgestone Arena 20,037.26$ 32,278.31$ 1,478.67$ 4,113.97$ 3,079.60$ 982.62$ 158.49$ -$ -$ -$ -$ 30,185.63$ 1,519.93$ 5.06$ 93,839.54$41 Nissan Stadium 8,503.25$ 15,300.59$ 700.76$ 1,949.67$ 2,185.98$ 655.95$ 75.24$ -$ -$ -$ 95.22$ 23,810.35$ -$ -$ 53,277.01$43 Hume-Fogg High School 2,853.02$ 4,391.71$ 201.20$ 559.79$ 188.11$ 85.93$ 21.55$ -$ -$ -$ 397.52$ 2,749.73$ 765.75$ 2.55$ 12,216.86$44 Schermerhorn Symphony Center 15,194.36$ -$ -$ -$ 907.02$ 434.98$ 34.18$ -$ -$ -$ -$ 9,214.04$ 4,228.58$ 14.07$ 30,027.23$45 Nashville Public Library 6,889.00$ -$ -$ -$ 1,873.30$ 856.65$ 53.26$ -$ -$ -$ 207.36$ 16,672.72$ 7,649.79$ 25.45$ 34,227.53$49 Viridian Residential Tower 12,372.48$ -$ -$ -$ 576.30$ 172.93$ 25.68$ -$ -$ -$ 346.43$ 6,004.62$ -$ -$ 19,498.44$50 Music City Center 77,567.78$ 9,241.21$ -$ 7,081.70$ 7,993.44$ 3,568.87$ 394.86$ -$ -$ -$ -$ 74,134.19$ 30,396.19$ 101.14$ 210,479.38$51 Hyatt Place Hotel 10,877.32$ -$ -$ -$ 295.96$ 167.44$ 26.19$ -$ -$ -$ 359.84$ 2,901.95$ 2,042.31$ 6.80$ 16,677.81$S1 State Government of TN 136,594.48$ 106,761.60$ -$ -$ 8,805.03$ 4,033.21$ -$ -$ -$ -$ 4,116.48$ 104,986.21$ 36,131.59$ 120.24$ 401,548.84$
Grand Totals: 399,956.37$ 301,875.75$ 8,515.34$ 30,773.19$ 41,632.52$ 17,192.14$ 1,493.86$ -$ -$ 6,636.69$ 7,653.55$ 438,226.00$ 122,060.86$ 406.17$ 1,376,422.44$Rate Calculation Totals: 481,337.65$ 424,364.76$ 14,127.36$ 39,305.42$ 41,643.26$ 17,197.29$ 2,191.67$ -$ -$ 6,636.69$ 7,653.55$ 438,291.50$ 122,110.69$ 406.31$ 1,595,266.15$Deviation: (81,381.28)$ (122,489.01)$ (5,612.02)$ (8,532.23)$ (10.74)$ (5.15)$ (697.81)$ -$ -$ -$ -$ (65.50)$ (49.83)$ (0.14)$ (218,843.71)$
Metro Nashville District Energy System
Chilled Water and SteamMay, 2019
Revenues
Appendix 3-63-

Cust
omer
Num
ber
Cust
omer
Nam
e
Cap
acity
Ope
ratin
g
ED
SIm
prov
emen
t
Met
roIn
crem
enta
l
Wat
er A
ndS
ewer
Che
mic
alTr
eatm
ent
Eng
inee
ring
Insu
ranc
e
ED
SE
lect
ricity
ED
S M
aint
Cos
ts A
lloc
TIFS
Ele
ctric
ity
Nat
ural
Gas
Pro
pane
Tota
l
2 A. A. Birch 11,253.18$ 16,835.71$ 771.36$ 2,146.11$ 2,266.81$ 457.96$ 82.57$ -$ 522.40$ -$ 333.25$ 18,473.62$ 137.33$ -$ 53,280.30$4 Metro Courthouse 5,330.54$ 7,860.41$ 360.15$ 1,002.03$ 1,321.92$ 358.12$ 38.54$ -$ 243.91$ -$ 51.77$ 9,952.21$ 2,525.32$ -$ 29,044.92$7 Parkway Tower 4,846.41$ 7,607.60$ 348.53$ 969.67$ 1,052.68$ 210.30$ 37.34$ -$ 236.03$ 709.08$ 257.48$ 9,823.71$ -$ -$ 26,098.83$9 Bobby Hotel (fka Wells Fargo) 1,940.77$ 3,034.63$ 139.03$ 386.80$ 856.78$ 212.14$ 14.89$ -$ 94.16$ 254.67$ -$ 6,452.85$ 1,100.34$ -$ 14,487.06$
10 Fairlane Hotel (fka 401 Union) 1,854.75$ 2,843.98$ 130.30$ 362.51$ 513.57$ 116.79$ 13.95$ -$ 88.25$ 310.26$ 152.34$ 4,274.72$ 381.16$ -$ 11,042.58$11 Sheraton Hotel 10,248.39$ 15,309.66$ 701.45$ 1,951.59$ 2,349.90$ 705.72$ 75.08$ -$ 475.05$ 1,229.92$ 135.68$ 17,577.92$ 6,345.36$ -$ 57,105.72$12 Municipal Auditorium 5,129.85$ 8,117.62$ 371.88$ 1,034.66$ 605.00$ 121.06$ 39.85$ -$ 251.85$ -$ -$ 6,666.07$ 5.34$ -$ 22,343.18$21 Hermitage Hotel 4,956.39$ 7,187.19$ 329.32$ 916.24$ 847.39$ 202.57$ 35.23$ -$ 223.03$ 276.83$ 479.25$ 6,495.32$ 894.01$ -$ 22,842.77$24 Criminal Justice Center 8,390.53$ 11,830.65$ 542.13$ 1,508.31$ 877.78$ 337.47$ 57.97$ -$ 367.15$ -$ -$ 6,264.72$ 4,353.66$ -$ 34,530.37$25 501 Union Building 1,952.36$ 2,894.72$ 132.64$ 369.01$ 519.12$ 142.15$ 14.20$ -$ 89.83$ 232.74$ -$ 4,376.11$ 1,032.24$ -$ 11,755.12$28 4th & Church Building 20,848.05$ -$ -$ -$ 1,560.56$ 311.76$ 47.42$ -$ -$ -$ -$ 15,131.33$ -$ -$ 37,899.12$29 Fifth-Third Financial Center 5,912.59$ 10,639.01$ 487.26$ 1,355.67$ 1,443.21$ 288.32$ 52.32$ -$ 329.99$ 786.67$ 248.27$ 16,273.07$ -$ -$ 37,816.38$32 Renaissance Hotel 15,476.02$ 22,627.77$ 1,036.80$ 2,884.61$ 4,909.39$ 1,258.88$ 110.94$ -$ 702.17$ 1,462.50$ -$ 29,846.12$ 7,468.88$ -$ 87,784.08$34 Renaissance Office Tower 1,445.55$ 2,601.10$ 119.13$ 331.44$ 764.74$ 152.77$ 12.79$ -$ 80.68$ 227.25$ 78.91$ 6,569.40$ -$ -$ 12,383.76$35 St. Mary's Catholic Church 997.66$ -$ -$ -$ -$ -$ -$ -$ -$ 33.26$ -$ -$ -$ -$ 1,030.92$36 Nashville City Center 4,818.51$ 8,670.33$ 397.10$ 1,104.82$ 1,749.19$ 349.44$ 42.64$ -$ 268.93$ 753.42$ -$ 16,230.01$ -$ -$ 34,384.39$38 Wildhorse Saloon 1,805.06$ 2,852.26$ 130.67$ 363.54$ 771.64$ 209.73$ 14.00$ -$ 88.49$ 182.83$ 168.29$ 5,989.24$ 1,492.52$ -$ 14,068.27$39 Ryman Auditorium 1,860.81$ 2,989.69$ 136.96$ 381.05$ 1,035.82$ 294.02$ 14.68$ -$ 92.75$ 177.26$ -$ 7,438.11$ 2,338.85$ -$ 16,760.00$40 Bridgestone Arena 20,037.26$ 32,278.31$ 1,478.67$ 4,113.97$ 5,158.83$ 1,287.84$ 158.49$ -$ 1,001.41$ -$ -$ 45,187.62$ 6,908.27$ -$ 117,610.67$41 Nissan Stadium 8,503.25$ 15,300.59$ 700.76$ 1,949.67$ 3,802.65$ 759.67$ 75.24$ -$ 474.58$ -$ 83.31$ 31,569.79$ -$ -$ 63,219.51$43 Hume-Fogg High School 2,853.02$ 4,391.71$ 201.20$ 559.79$ 259.71$ 78.94$ 21.55$ -$ 136.27$ -$ 368.96$ 1,617.37$ 726.48$ -$ 11,215.00$44 Schermerhorn Symphony Center 15,194.36$ -$ -$ -$ 1,269.08$ 404.52$ 34.18$ -$ -$ -$ -$ 13,182.87$ 4,055.08$ -$ 34,140.09$45 Nashville Public Library 6,889.00$ -$ -$ -$ 2,603.49$ 762.51$ 53.26$ -$ -$ -$ 173.60$ 18,511.64$ 6,509.88$ -$ 35,503.38$49 Viridian Residential Tower 12,372.48$ -$ -$ -$ 847.89$ 169.39$ 25.68$ -$ -$ -$ 117.54$ 6,896.55$ -$ -$ 20,429.53$50 Music City Center 77,567.78$ 9,241.21$ -$ 7,081.70$ 13,037.69$ 3,815.20$ 394.86$ -$ -$ -$ -$ 100,021.02$ 32,511.49$ -$ 243,670.95$51 Hyatt Place Hotel 10,877.32$ -$ -$ -$ 494.40$ 167.94$ 26.19$ -$ -$ -$ 308.75$ 3,642.09$ 1,857.73$ -$ 17,374.42$S1 State Government of TN 136,594.48$ 106,761.60$ -$ -$ 13,125.32$ 3,731.93$ -$ -$ 3,700.15$ -$ 5,264.89$ 114,734.05$ 29,805.32$ -$ 413,717.74$
Grand Totals: 399,956.37$ 301,875.75$ 8,515.34$ 30,773.19$ 64,044.56$ 16,907.14$ 1,493.86$ -$ 9,467.08$ 6,636.69$ 8,222.29$ 523,197.53$ 110,449.26$ -$ 1,481,539.06$Rate Calculation Totals: 481,337.65$ 424,364.76$ 14,127.36$ 39,305.42$ 64,062.91$ 16,910.79$ 2,191.67$ -$ 9,567.60$ 6,636.69$ 8,222.29$ 523,280.94$ 110,449.27$ -$ 1,700,457.35$Deviation: (81,381.28)$ (122,489.01)$ (5,612.02)$ (8,532.23)$ (18.35)$ (3.65)$ (697.81)$ -$ (100.52)$ -$ -$ (83.41)$ (0.01)$ -$ (218,918.29)$
Metro Nashville District Energy System
Chilled Water and SteamJune, 2019
Revenues
Appendix 3-64-

Cust
omer
Num
ber
Cust
omer
Nam
e
Cap
acity
Ope
ratin
g
ED
SIm
prov
emen
t
Met
roIn
crem
enta
l
Wat
er A
ndS
ewer
Che
mic
alTr
eatm
ent
Eng
inee
ring
Insu
ranc
e
ED
SE
lect
ricity
ED
S M
aint
Cos
ts A
lloc
TIFS
Ele
ctric
ity
Nat
ural
Gas
Pro
pane
Tota
l
2 A. A. Birch (18,460.73)$ -$ -$ 1,570.55$ (215.04)$ -$ 395.43$ 572.68$ -$ -$ -$ (396.11)$ (621.68)$ (18.26)$ (17,173.16)$4 Metro Courthouse (8,631.91)$ -$ -$ 732.87$ (128.13)$ -$ 184.68$ 267.46$ -$ -$ -$ (213.40)$ (304.25)$ (8.94)$ (8,101.62)$7 Parkway Tower (7,753.86)$ -$ -$ 710.94$ (116.56)$ -$ 178.52$ 258.54$ -$ -$ -$ (175.51)$ (222.32)$ (6.53)$ (7,126.78)$9 Bobby Hotel (fka Wells Fargo) (3,123.64)$ -$ -$ 257.69$ (64.87)$ -$ 64.77$ 93.80$ -$ -$ -$ (132.01)$ (224.14)$ (6.58)$ (3,134.98)$
10 Fairlane Hotel (fka 401 Union) (3,012.61)$ -$ -$ 265.55$ (46.98)$ -$ 66.77$ 96.69$ -$ -$ -$ (79.37)$ (114.82)$ (3.37)$ (2,828.14)$11 Sheraton Hotel (16,302.02)$ -$ -$ 1,428.11$ (193.02)$ -$ 359.60$ 520.79$ -$ -$ -$ (442.38)$ (812.02)$ (23.86)$ (15,464.80)$12 Municipal Auditorium (8,309.07)$ -$ -$ 758.82$ (59.84)$ -$ 190.46$ 275.83$ -$ -$ -$ (155.86)$ (306.47)$ (9.00)$ (7,615.13)$21 Hermitage Hotel (8,123.01)$ -$ -$ 669.67$ (83.42)$ -$ 168.92$ 244.64$ -$ -$ -$ (120.21)$ (143.32)$ (4.21)$ (7,390.94)$24 Criminal Justice Center (13,323.08)$ -$ -$ 1,101.12$ (11.28)$ -$ 278.21$ 402.91$ -$ -$ -$ (78.30)$ (200.89)$ (5.90)$ (11,837.21)$25 501 Union Building (3,092.41)$ -$ -$ 269.95$ (51.76)$ -$ 68.00$ 98.48$ -$ -$ -$ (84.15)$ (116.90)$ (3.43)$ (2,912.22)$28 4th & Church Building -$ -$ -$ -$ (153.50)$ -$ 226.87$ 328.57$ -$ -$ -$ (235.85)$ (306.57)$ (9.01)$ (149.49)$29 Fifth-Third Financial Center (9,441.50)$ -$ -$ 998.78$ (179.24)$ -$ 249.07$ 360.71$ -$ -$ -$ (153.03)$ -$ -$ (8,165.21)$32 Renaissance Hotel (24,555.52)$ -$ -$ 2,109.03$ (412.35)$ -$ 531.73$ 770.05$ -$ -$ -$ (721.37)$ (1,080.36)$ (31.74)$ (23,390.53)$34 Renaissance Office Tower (2,329.94)$ -$ -$ 244.19$ (99.10)$ -$ 60.90$ 88.19$ -$ -$ -$ (84.61)$ -$ -$ (2,120.37)$35 St. Mary's Catholic Church -$ -$ -$ -$ -$ -$ -$ -$ -$ -$ -$ -$ -$ -$ -$36 Nashville City Center (7,677.86)$ -$ -$ 813.96$ (177.97)$ -$ 202.98$ 293.96$ -$ -$ -$ (151.95)$ -$ -$ (6,696.88)$38 Wildhorse Saloon (2,876.11)$ -$ -$ 266.62$ (58.87)$ -$ 66.93$ 96.93$ -$ -$ -$ (85.92)$ (104.31)$ (3.06)$ (2,697.79)$39 Ryman Auditorium (3,110.43)$ -$ -$ 279.62$ (94.15)$ -$ 70.12$ 101.56$ -$ -$ -$ (147.48)$ (196.30)$ (5.77)$ (3,102.83)$40 Bridgestone Arena (31,700.91)$ -$ -$ 3,019.24$ (618.72)$ -$ 757.11$ 1,096.46$ -$ -$ -$ (716.35)$ (550.28)$ (16.17)$ (28,729.62)$41 Nissan Stadium (13,375.36)$ -$ -$ 1,436.40$ (310.08)$ -$ 358.21$ 518.76$ -$ -$ -$ (264.74)$ -$ -$ (11,636.81)$43 Hume-Fogg High School (4,796.20)$ -$ -$ 410.12$ (18.40)$ -$ 103.10$ 149.31$ -$ -$ -$ (45.80)$ (88.03)$ (2.59)$ (4,288.49)$44 Schermerhorn Symphony Center -$ -$ -$ -$ (112.13)$ -$ 163.44$ 236.70$ -$ -$ -$ (196.04)$ (293.42)$ (8.62)$ (210.07)$45 Nashville Public Library -$ -$ -$ -$ (306.53)$ -$ 254.96$ 369.25$ -$ -$ -$ (472.23)$ (615.85)$ (18.09)$ (788.49)$49 Viridian Residential Tower -$ -$ -$ -$ (78.50)$ -$ 122.27$ 177.07$ -$ -$ -$ (67.02)$ -$ -$ 153.82$50 Music City Center -$ -$ -$ 5,781.60$ (1,161.86)$ -$ 1,887.88$ 2,734.08$ -$ -$ -$ (2,034.25)$ (3,049.00)$ (89.57)$ 4,068.88$51 Hyatt Place Hotel -$ -$ -$ -$ (39.60)$ -$ 125.76$ 182.13$ -$ -$ -$ (97.70)$ (186.89)$ (5.49)$ (21.79)$S1 State Government of TN (1,123.66)$ -$ -$ -$ (1,268.32)$ -$ -$ 4,056.58$ -$ -$ -$ (2,556.26)$ (4,310.09)$ (126.63)$ (5,328.38)$
Grand Totals: (191,119.83)$ -$ -$ 23,124.83$ (6,060.22)$ -$ 7,136.69$ 14,392.13$ -$ -$ -$ (9,907.90)$ (13,847.91)$ (406.82)$ (176,689.03)$Rate Calculation Totals: (191,119.83)$ -$ -$ 30,464.06$ (6,060.88)$ -$ 9,947.54$ 14,406.24$ -$ -$ -$ (9,914.44)$ (13,865.07)$ (407.31)$ (166,549.69)$Deviation: -$ -$ -$ 7,339.23$ (0.66)$ -$ 2,810.85$ 14.11$ -$ -$ -$ (6.54)$ (17.16)$ (0.49)$ (10,139.34)$
Metro Nashville District Energy System
Chilled Water and SteamFiscal Year 18 - 19 True Up
Revenues
Appendix 3-65-

Appendix 4
-66-

1 REV: 12 DATE: 07/29/193 NASHVILLE, TENNESSEE
4 CNE INVOICE RECONCILIATION - FY 2018 - 201956 SALES SUMMARY FROM CUSTOMER METER READS 1 2 3 4 5 67 MONTH 7 8 9 10 11 12 1 2 3 4 5 6 TOTAL8 STEAM SALES Previously invoiced, lbs 16,384,926 17,258,126 18,176,813 27,324,850 45,110,217 51,304,036 58,543,258 44,830,771 44,000,442 24,920,342 18,518,639 15,731,584 382,104,0049 Reconciled, lbs 16,384,926 17,258,126 18,176,813 27,324,850 45,110,217 51,304,036 58,543,258 44,830,771 44,000,442 24,920,342 18,518,639 15,731,584 382,104,004
10 CHW SALES Previously invoiced, ton-hrs 8,669,006 8,630,350 7,847,216 5,214,050 2,774,971 2,751,071 2,558,241 2,995,155 3,203,082 4,292,897 6,211,811 6,829,230 61,977,08011 Reconciled, ton-hrs 8,669,006 8,630,350 7,847,216 5,214,050 2,774,971 2,751,071 2,558,241 2,995,155 3,203,082 4,292,897 6,211,811 6,829,230 61,977,08012 SUMMARY FROM CUSTOMER METER READS from INVOICES (paste link)13 START DATE 07/01/18 08/01/18 09/01/18 10/01/18 11/01/18 12/01/18 01/01/19 02/01/19 03/01/19 04/01/19 05/01/19 06/01/18 06/01/1814 END DATE 07/31/18 08/31/18 09/30/18 10/31/18 11/30/18 12/31/18 01/31/19 02/28/19 03/31/19 04/30/19 05/31/19 06/30/19 06/30/1915 CHW SALES ton-hrs 8,669,006 8,630,350 7,847,216 5,214,050 2,774,971 2,751,071 2,558,241 2,995,155 3,203,082 4,292,897 6,211,811 6,829,230 61,977,08016 CHW SENDOUT ton-hrs 8,966,400 8,931,200 8,098,600 5,393,500 2,928,400 2,915,700 2,706,000 3,132,900 3,358,500 4,473,200 6,512,700 7,276,400 64,693,50017 CHW ELECTRIC kWh 7,857,776 7,853,600 7,086,380 4,718,653 2,685,337 2,614,507 2,432,063 2,675,759 2,931,489 3,738,563 5,516,669 6,211,667 56,322,46318 CHW MUW galls 16,279,000 16,080,000 14,139,000 8,296,000 3,532,000 3,413,000 3,132,107 4,682,000 5,236,000 8,009,000 12,284,000 13,884,000 108,966,10719 STEAM SALES mlbs 16,385 17,258 18,177 27,325 45,110 51,304 58,543 44,831 44,000 24,920 18,519 15,732 382,10420 STEAM SENDOUT mlbs 22,326 22,849 23,620 31,848 48,093 53,345 61,830 48,707 48,439 31,041 25,168 22,192 439,45821 STEAM PRODUCTION mlbs 26,298 26,320 27,265 38,124 57,619 63,573 72,066 58,092 0 35,993 28,821 26,315 460,48622 NATURAL GAS mmBtu 30,273 31,220 31,793 43,222 66,903 73,987 85,819 67,054 66,526 41,257 32,693 29,925 600,67323 PROPANE mmBtu 0 0 0 0 37 49 278 0 8 0 16 0 38824 STEAM ELECTRIC kWh 56,455 56,610 56,406 85,046 123,374 135,057 148,361 126,112 121,765 72,959 57,963 54,864 1,094,97225 CONDENSATE RETURN galls 2,149,600 2,045,600 2,388,800 3,142,000 4,201,400 5,057,300 6,020,500 4,620,700 4,540,600 2,883,600 2,219,200 1,611,800 40,881,10026 mlbs 17,532 16,684 19,483 25,626 34,266 41,247 49,102 37,686 37,032 23,518 18,099 13,146 333,42127 °F 185 °F 193 °F 186 °F 180 °F 179 °F 174 °F 175 °F 175 °F 175 °F 181 °F 193 °F 197 °F 18028 STEAM MUW galls 635,690 797,000 546,810 889,100 2,093,440 1,858,030 1,980,870 1,637,270 1,624,550 1,020,360 919,710 1,237,360 15,240,19029 mlbs 5,305 6,651 4,563 7,420 17,470 15,506 16,531 13,664 13,557 8,515 7,675 10,326 127,18430 Days in Service 31 31 30 31 30 31 31 28 31 30 31 395 73031 Efficiency - Cooling kWh/ton-hr-Sold 0.906 0.910 0.903 0.905 0.968 0.950 0.951 0.893 0.915 0.871 0.888 0.910 0.90932 Efficiency - Heating Dth/klb-Sendout 1.356 1.366 1.346 1.357 1.392 1.388 1.392 1.377 1.374 1.329 1.300 1.348 1.368333435
-67-

1 REV: 12 DATE: 07/29/193 NASHVILLE, TENNESSEE
4 CNE INVOICE RECONCILIATION - FY 2018 - 201956 UTILITY INVOICES (Paste Link)7 Month of Service 7 8 9 10 11 12 1 2 3 4 5 6 TOTAL8 ELECTRIC SERVICE (NES)9 Service Dates From 7/1/2018 8/1/2018 8/1/2018 10/1/2018 11/1/2018 12/1/2018 1/1/2019 2/1/2019 3/1/2019 4/1/2019 5/1/2019 5/1/2019 7/1/2018
10 To 7/31/2018 8/31/2018 8/31/2018 10/31/2018 11/30/2018 12/31/2018 1/31/2019 2/28/2019 3/31/2019 4/30/2019 5/31/2019 5/31/2019 5/31/201911 PEAK Demand kW 16,464 15,904 15,512 13,608 6,272 6,216 6,086 8,064 7,112 9,240 12,600 13,608 16,46412 Service Period Use kWh 8,001,140 7,980,812 7,212,408 4,879,980 2,892,540 2,826,208 2,662,996 2,877,924 3,118,948 3,887,520 5,631,584 6,336,008 58,308,06813 Service Period Charge $ 688,583.72$ 682,785.18$ 618,834.33$ 441,182.05$ 238,129.36$ 246,046.12$ 230,708.59$ 286,800.27$ 271,511.00$ 320,888.28$ 438,291.50$ 523,280.94$ 4,987,041.34$14 Average Charge $/kWh 0.086100$ 0.085600$ 0.085800$ 0.090400$ 0.082300$ 0.087100$ 0.086600$ 0.099700$ 0.087100$ 0.082500$ 0.077800$ 0.082600$ 0.085529$15 NATURAL GAS SERVICE16 Service Dates From 7/1/2018 8/1/2018 9/1/2018 10/1/2018 11/1/2018 12/1/2018 1/1/2019 2/1/2019 3/1/2019 4/1/2019 5/1/2019 6/1/2019 7/1/201817 To 7/31/2018 8/31/2018 9/30/2018 10/31/2018 11/30/2018 12/31/2018 1/31/2019 2/28/2019 3/31/2019 4/30/2019 5/31/2019 6/30/2019 6/30/201918 UTILITY CEPS INVOICE DATA ENTRY Start 443,865 472,370 501,755 531,526 571,894 634,578 704,055 784,495 847,526 910,050 948,696 974,75519 Ending 472,370 501,755 531,526 571,894 634,578 704,055 784,495 847,526 910,050 948,696 974,755 1,002,89220 UTILITY METER Multiplier 10 10 10 10 10 10 10 10 10 10 10 1021 HEAT FACTOR 1.062 1.062 1.068 1.071 1.067 1.065 1.067 1.064 1.064 1.068 1.068 1.06422 Service Period Use CCF 285,050 293,850 297,710 403,680 626,840 694,770 804,400 630,310 625,240 386,460 260,590 281,370 5,590,27023 Dth 30,273.2 31,219.5 31,793.3 43,222.4 66,902.6 73,986.8 85,819.0 67,053.6 66,526.2 41,257.3 32,693.3 29,925.4 600,672.624 Service Period Charges25 CONSULTANTS $ $6,474.24 $6,474.24 $6,474.24 $6,474.24 $6,474.24 $6,474.24 $6,474.24 $6,474.24 $6,474.24 $6,474.24 $6,474.24 $6,474.24 77,690.8826 NASHVILLE GAS $ 19,491.76$ 19,927.08$ 20,191.02$ 25,448.57$ 36,341.78$ 39,600.62$ 45,043.59$ 36,411.25$ 36,168.64$ 24,544.60$ 20,519.87$ 14,077.21$ 337,765.9927 CNEG $ 86,831.01$ 87,897.19$ 90,173.81$ 125,367.05$ 217,036.51$ 313,786.93$ 312,215.86$ 194,027.28$ 200,613.15$ 124,502.77$ 95,116.58$ 89,897.82$ 1,937,465.9628 TOTAL $ 112,797.01$ $114,298.51 116,839.07$ 157,289.86$ 259,852.53$ 359,861.79$ 363,733.69$ 236,912.77$ 243,256.03$ 155,521.61$ 122,110.69$ 110,449.27$ 2,352,922.83$29 Average Charge $/Dth 3.7260$ 3.6611$ 3.6750$ 3.6391$ 3.8840$ 4.8639$ 4.2384$ 3.5332$ 3.6565$ 3.7696$ 3.7350$ 3.6908$ 3.9171$30 WATER SERVICE (DOMESTIC AND PLANT)31 Service Dates From 7/1/2018 8/1/2018 8/1/2018 10/1/2018 11/1/2018 12/1/2018 1/1/2019 2/1/2019 3/1/2019 4/1/2019 5/1/2019 5/1/2019 7/1/201832 To 7/31/2018 8/31/2018 8/31/2018 10/31/2018 11/30/2018 12/31/2018 1/31/2019 2/28/2019 3/31/2019 4/30/2019 5/31/2019 5/31/2019 5/31/201933 UTILITY CEPS INVOICE DATA ENTRY34 DOMESTIC Start35 Ending36 PLANT METER #1 Start37 Ending38 PLANT METER #2 Start39 Ending40 Service Period Use41 DOMESTIC CCF 40 43 52 35 25 20 26 20 17 16 11 15 32042 PLANT METER #1 CCF 25,501 23,390 29,639 20,630 12,970 8,405 10,273 26,771 10,379 11,012 14,884 23,204 217,05843 PLANT METER #2 CCF 044 TOTAL CCF 25,541 23,433 29,691 20,665 12,995 8,425 10,299 26,791 10,396 11,028 14,895 23,219 217,37845 PLANT ONLY CCF 25,501 23,390 29,639 20,630 12,970 8,405 10,273 26,771 10,379 11,012 14,884 23,204 217,05846 GALLONS 19,074,748 17,495,720 22,169,972 15,431,240 9,701,560 6,286,940 7,684,204 20,024,708 7,763,492 8,236,976 11,133,232 17,356,592 162,359,38447 Service Period Charges48 DOMESTIC WATER $ 113.95$ 120.37$ 139.63$ 103.25$ 81.85$ 71.15$ 83.99$ 71.15$ 64.73$ 62.59$ 51.89$ 60.45$ 1,025.00$49 SEWER $ 229.89$ 242.85$ 281.73$ 208.29$ 165.09$ 143.49$ 169.41$ 143.49$ 130.53$ 126.21$ 104.61$ 121.89$ 2,067.48$50 PLANT WATER $ 48,257.72$ 44,266.31$ 56,090.10$ 39,042.31$ 24,549.10$ 16,598.67$ 20,134.25$ 51,337.47$ 20,331.03$ 21,527.83$ 28,849.56$ 44,588.57$ 415,572.92$51 SEWER $ 20,779.24$ 19,061.22$ 24,153.34$ 16,811.82$ 10,568.92$ 6,849.26$ 8,368.42$ 21,812.66$ 8,456.44$ 8,971.52$ 12,127.20$ 18,908.00$ 176,868.04$52 STATE FEE @ 10% 300.00$ 300.00$ 342.00$ 300.00$ 300.00$ 300.00$ 300.00$ 300.00$ 300.00$ 300.00$ 510.00$ 384.00$ 3,936.00$53 TOTAL 69,680.80$ 63,990.75$ 81,006.80$ 56,465.67$ 35,664.96$ 23,962.57$ 29,056.07$ 73,664.77$ 29,282.73$ 30,988.15$ 41,643.26$ 64,062.91$ 599,469.44$54 PLANT, WATER ONLY $ 48,257.72$ 44,266.31$ 56,090.10$ 39,042.31$ 24,549.10$ 16,598.67$ 20,134.25$ 51,337.47$ 20,331.03$ 21,527.83$ 28,849.56$ 44,588.57$ 415,572.92$55 Average Charge $/kGall 2.5299$ 2.5301$ 2.5300$ 2.5301$ 2.5304$ 2.6402$ 2.6202$ 2.5637$ 2.6188$ 2.6136$ 2.5913$ 2.5690$ 2.5596$565758 MONTHLY FEAs 0 0 0 0 0 0 0 0 0 0 0 0 059 Service Dates From 7/1/2018 8/1/2018 9/1/2018 10/1/2018 11/1/2018 12/1/2018 1/1/2019 2/1/2019 3/1/2019 4/1/2019 5/1/2019 6/1/2019 7/1/201860 To 7/31/2018 8/31/2018 9/30/2018 10/31/2018 11/30/2018 12/31/2018 1/31/2019 2/28/2019 3/31/2019 4/30/2019 5/31/2019 6/30/2019 6/30/201961 STEAM ELECTRIC $900.76 $1,004.56 $1,129.52 $1,783.46 $3,030.39 $3,762.54 $4,393.02 $3,561.18 $3,097.56 $1,578.95 $1,033.73 $816.05 $26,091.7262 FUEL GAS $4,720.84 $4,601.09 $5,012.70 $6,605.88 $9,647.93 $13,398.61 $13,174.84 $9,293.20 $9,749.02 $7,635.32 $6,763.80 $5,221.70 $95,824.9363 WATER $21.47 $40.72 $19.67 -$52.18 -$416.82 -$450.67 -$539.85 -$255.37 -$84.95 $19.72 $43.91 $16.60 -$1,637.7564 CHW ELECTRIC $27,803.46 $26,779.98 $25,585.07 $17,675.64 $4,967.26 $6,289.97 $5,760.14 $12,093.98 $9,764.58 $16,291.54 $20,176.88 $20,448.42 $193,636.9265 FUEL GAS $0.00 $0.00 $0.00 $0.00 $0.00 $0.00 $0.00 $0.00 $0.00 $0.00 $0.00 $0.00 $0.0066 WATER $18,488.44 $18,489.34 $17,113.68 $12,067.44 $6,981.41 $7,279.72 $6,746.67 $7,077.82 $7,580.86 $9,492.05 $13,167.07 $14,110.00 $138,594.5067 51,934.97$ 50,915.69$ 48,860.64$ 38,080.24$ 24,210.17$ 30,280.17$ 29,534.82$ 31,770.81$ 30,107.07$ 35,017.58$ 41,185.39$ 40,612.77$ $452,510.326869 STEAM CAPACITY TEST ADJUSTMENTS70 Month 7 8 9 10 11 12 TOTAL71 NATURAL GAS72 USAGE CREDIT MCF 073 Dth 074 $ -$75 ELECTRIC76 USAGE CREDIT kWh 077 $ -$78 WATER79 USAGE CREDIT kGallon 0
File: NDE FEA Reconciliation FY 18 - 19 Page 2 of 11 Printstamp: 7/29/2019 12:13 PM-68-

1 REV: 12 DATE: 07/29/193 NASHVILLE, TENNESSEE
4 CNE INVOICE RECONCILIATION - FY 2018 - 201980 $ -$81 PLANT STEAM82 SEND-OUT CREDIT mlb 083848586 PLANT READINGS (Paste Link)87 Month 7 8 9 10 11 12 1 2 3 4 5 6 TOTAL88 DATE OF READINGS From 7/1/2018 8/1/2018 9/1/2018 10/1/2018 11/1/2018 12/1/2018 1/1/2019 2/1/2019 3/1/2019 4/1/2019 5/1/2019 6/1/2019 7/1/201889 (coincides with Customer Dates) To 7/31/2018 8/31/2018 9/30/2018 10/31/2018 11/30/2018 12/31/2018 1/31/2019 2/28/2019 3/31/2019 4/30/2019 5/31/2019 6/30/2019 6/30/201990 ELECTRIC METERS91 SWG-2A Start Reading 26,297.00 26,826.98 27,887.42 28,919.27 29,445.03 29,918.33 30,579.44 31,262.84 31,611.68 31,724.44 32,221.25 32,974.5792 End Reading 26,826.98 27,887.42 28,919.27 29,445.03 29,918.33 30,579.44 31,262.84 31,611.68 31,724.44 32,221.25 32,974.57 33,478.7093 Period Use in units = 1,000 x kWh 529,980 1,060,440 1,031,850 525,760 473,300 661,110 683,400 348,840 112,760 496,810 753,320 504,130 7,181,70094 SWG-2B Start Reading 71,472.43 73,155.13 74,452.28 76,173.80 77,458.80 78,253.07 78,258.11 78,259.94 78,286.83 78,875.54 79,623.77 80,840.9195 End Reading 73,155.13 74,452.28 76,173.80 77,458.80 78,253.07 78,258.11 78,259.94 78,286.83 78,875.54 79,623.77 80,840.91 81,707.6596 Period Use in units = 1,000 x kWh 1,682,700 1,297,150 1,721,520 1,285,000 794,270 5,040 1,830 26,890 588,710 748,230 1,217,140 866,740 10,235,22097 SWG-3A Start Reading 58,656.10 60,611.22 62,554.99 63,475.53 64,106.65 64,162.63 64,794.24 65,104.73 65,470.80 65,646.69 65,820.40 67,146.7098 End Reading 60,611.22 62,554.99 63,475.53 64,106.65 64,162.63 64,794.24 65,104.73 65,470.80 65,646.69 65,820.40 67,146.70 68,821.9599 Period Use in units = 1,000 x kWh 1,955,120 1,943,770 920,540 631,120 55,980 631,610 310,490 366,070 175,890 173,710 1,326,300 1,675,250 10,165,850
100 SWG-3B Start Reading 137,078.86 139,018.78 140,869.58 142,721.11 143,795.78 144,449.92 145,070.65 145,904.13 147,162.73 148,474.03 149,810.05 150,698.03101 End Reading 139,018.78 140,869.58 142,721.11 143,795.78 144,449.92 145,070.65 145,904.13 147,162.73 148,474.03 149,810.05 150,698.03 152,456.70102 Period Use in units = 1,000 x kWh 1,939,920 1,850,800 1,851,530 1,074,670 654,140 620,730 833,480 1,258,600 1,311,300 1,336,020 887,980 1,758,670 15,377,840103 SWG-4A Start Reading 15,359,453.00 15,567,129.00 15,764,605.00 15,946,148.00 16,064,767.00 16,219,685.00 16,369,602.00 16,506,067.00 16,648,445.00 16,697,608.00 16,856,461.00 17,138,065.00104 End Reading 15,567,129.00 15,764,605.00 15,946,148.00 16,064,767.00 16,219,685.00 16,369,602.00 16,506,067.00 16,648,445.00 16,697,608.00 16,856,461.00 17,138,065.00 17,459,762.00105 Period Use in units = 1 x kWh 207,676 197,476 181,543 118,619 154,918 149,917 136,465 142,378 49,163 158,853 281,604 321,697 2,100,309106 SWG-4B Start Reading 1,255,856.00 1,737,404.00 2,237,927.00 2,685,634.00 3,047,767.00 3,191,993.00 3,347,211.00 3,491,951.00 3,648,020.00 3,932,477.00 4,149,261.00 4,350,912.00107 End Reading 1,737,404.00 2,237,927.00 2,685,634.00 3,047,767.00 3,191,993.00 3,347,211.00 3,491,951.00 3,648,020.00 3,932,477.00 4,149,261.00 4,350,912.00 4,534,315.00108 Period Use in units = 1 x kWh 481,548 500,523 447,707 362,133 144,226 155,218 144,740 156,069 284,457 216,784 201,651 183,403 3,278,459109 SWG-5A Start Reading 7,451,242.00 7,683,391.00 7,892,959.00 8,111,203.00 8,299,977.00 8,375,428.00 8,442,629.00 8,505,093.00 8,673,120.00 8,705,065.00 8,873,021.00 9,065,931.00110 End Reading 7,683,391.00 7,892,959.00 8,111,203.00 8,299,977.00 8,375,428.00 8,442,629.00 8,505,093.00 8,673,120.00 8,705,065.00 8,873,021.00 9,065,931.00 9,271,530.00111 Period Use in units = 1 x kWh 232,149 209,568 218,244 188,774 75,451 67,201 62,464 168,027 31,945 167,956 192,910 205,599 1,820,288112 SWG-5B Start Reading 9,152,622.00 9,377,526.00 9,621,275.00 9,813,602.00 9,971,519.00 10,119,515.00 10,280,642.00 10,407,798.00 10,429,078.00 10,644,128.00 10,784,823.00 10,970,966.00113 End Reading 9,377,526.00 9,621,275.00 9,813,602.00 9,971,519.00 10,119,515.00 10,280,642.00 10,407,798.00 10,429,078.00 10,644,128.00 10,784,823.00 10,970,966.00 11,158,410.00114 Period Use in units = 1 x kWh 224,904 243,749 192,327 157,917 147,996 161,127 127,156 21,280 215,050 140,695 186,143 187,444 2,005,788115 MCC-1 Start Reading 22,715,662.80 22,986,528.80 23,250,687.20 23,514,908.90 23,695,120.90 23,761,717.80 23,823,142.10 23,873,874.90 23,952,758.70 24,009,818.00 24,106,075.10 24,299,944.40116 End Reading 22,986,528.80 23,250,687.20 23,514,908.90 23,695,120.90 23,761,717.80 23,823,142.10 23,873,874.90 23,952,758.70 24,009,818.00 24,106,075.10 24,299,944.40 24,513,575.70117 Period Use in units = 1 x kWh 270,866 264,158 264,222 180,212 66,597 61,424 50,733 78,884 57,059 96,257 193,869 213,631 1,797,913118 MCC-2 Start Reading 22,338,092.50 22,623,088.50 22,860,986.10 23,070,861.70 23,217,000.00 23,290,719.70 23,346,919.10 23,382,561.30 23,049,012.00 23,107,429.40 23,264,570.40 23,492,424.20119 End Reading 22,623,088.50 22,860,986.10 23,070,861.70 23,217,000.00 23,290,719.70 23,346,919.10 23,382,561.30 23,449,012.00 23,107,429.40 23,264,570.40 23,492,424.20 23,741,436.60120 Period Use in units = 1 x kWh 284,996 237,898 209,876 146,138 73,720 56,199 35,642 66,451 58,417 157,141 227,854 249,012 1,803,344121 MCC-3 Start Reading 5,369,086.70 5,376,032.30 5,379,208.50 5,390,442.20 5,417,290.10 5,474,365.70 5,546,201.70 5,628,009.70 5,694,098.70 5,654,430.60 5,673,060.30 5,678,254.40122 End Reading 5,376,032.30 5,379,208.50 5,390,442.20 5,417,290.10 5,474,365.70 5,546,201.70 5,628,009.70 5,694,098.70 5,754,430.60 5,673,060.30 5,678,254.40 5,679,667.10123 Period Use in units = 1 x kWh 6,946 3,176 11,234 26,848 57,076 71,836 81,808 66,089 60,332 18,630 5,194 1,413 410,582124 MCC-4 Start Reading 7,707,252.20 7,756,418.70 7,809,508.80 7,854,308.40 7,911,644.50 7,975,922.80 8,036,863.70 8,100,685.80 8,158,748.80 8,218,271.30 8,271,711.50 8,323,981.10125 End Reading 7,756,418.70 7,809,508.80 7,854,308.40 7,911,644.50 7,975,922.80 8,036,863.70 8,100,685.80 8,158,748.80 8,218,271.30 8,271,711.50 8,323,981.10 8,377,027.70126 Period Use in units = 1 x kWh 49,167 53,090 44,800 57,336 64,278 60,941 63,822 58,063 59,523 53,440 52,270 53,047 669,777127 NOTES:128129130131 OTHER METERS (Paste Link)132 FT_6120: Propane Gas Available for Use 8,550.00 13,901.30 13,901.30 13,901.30 13,901.30 13,500.00 12,960.00 14,310.00 14,310.00 14,220.00 14,220.00 14,040.00133 Ending Inventory 8,550.00 13,901.30 13,901.30 13,901.30 13,500.00 12,960.00 9,900.00 14,310.00 14,220.00 14,220.00 14,040.00 14,040.00134 Period Use in units = Gallons 0.00 0.00 0.00 0.00 401.30 540.00 3,060.00 0.00 90.00 0.00 180.00 0.00 4,271135 Period Use in units = Gallons Per DT 10.989 10.989 10.989 10.989 10.989 10.989 10.989 10.989 10.989 10.989 10.989 10.989136 FIQY_3000: Stm Sendout Start Reading 5,527,837 5,550,163 5,573,012 5,596,632 5,628,480 5,676,573 5,745,195 5,807,025 5,855,732 5,904,171 5,935,212 5,960,380137 End Reading 5,550,163 5,573,012 5,596,632 5,628,480 5,676,573 5,745,195 5,807,025 5,855,732 5,904,171 5,935,212 5,960,380 5,982,572138 Period Use in units = 1 x MLB 22,326 22,849 23,620 31,848 48,093 53,345 61,830 48,707 48,439 31,041 25,168 22,192 439,458139 WQ_1800: CHW Sendout Start Reading 872,333,900 881,300,300 890,231,500 898,330,100 903,723,600 906,652,000 909,567,700 912,273,700 915,406,600 918,765,100 923,238,300 929,751,000140 End Reading 881,300,300 890,231,500 898,330,100 903,723,600 906,652,000 909,567,700 912,273,700 915,406,600 918,765,100 923,238,300 929,751,000 937,027,400141 Period Use in units = 1 x TON-HRS 8,966,400 8,931,200 8,098,600 5,393,500 2,928,400 2,915,700 2,706,000 3,132,900 3,358,500 4,473,200 6,512,700 7,276,400 64,693,500142 FT_8100: Cond. Return Start Reading 372,096,200 374,245,800 376,291,400 378,680,200 381,822,200 386,023,600 391,080,900 397,101,400 401,722,100 406,262,700 409,146,300 411,365,500143 End Reading 374,245,800 376,291,400 378,680,200 381,822,200 386,023,600 391,080,900 397,101,400 401,722,100 406,262,700 409,146,300 411,365,500 412,977,300144 Period Use in units = 1 x GALL 2,149,600 2,045,600 2,388,800 3,142,000 4,201,400 5,057,300 6,020,500 4,620,700 4,540,600 2,883,600 2,219,200 1,611,800 40,881,100145 WQ_8100: Cond. Return Start Reading 242,210 244,889 247,572 250,580 254,382 259,409 265,279 272,306 277,683 282,989 286,501 289,418146 End Reading 244,889 247,572 250,580 254,382 259,409 265,279 272,306 277,683 282,989 286,501 289,418 291,588147 Period Use in units = 1 x mmBtu 2,679 2,683 3,008 3,802 5,027 5,870 7,027 5,377 5,306 3,512 2,917 2,170 49,378148 Condensate Return Temp 185 °F 193 °F 186 °F 180 °F 179 °F 174 °F 175 °F 175 °F 175 °F 181 °F 193 °F 197 °F 180 °F149 FT_4500: MUW, Stm. Start Reading 156,767,670 157,403,360 158,200,360 158,747,170 159,636,270 161,729,710 163,587,740 165,568,610 167,205,880 168,830,430 169,850,790 170,770,500150 End Reading 157,403,360 158,200,360 158,747,170 159,636,270 161,729,710 163,587,740 165,568,610 167,205,880 168,830,430 169,850,790 170,770,500 172,007,860151 Period Use in units = 1 x GALL 635,690 797,000 546,810 889,100 2,093,440 1,858,030 1,980,870 1,637,270 1,624,550 1,020,360 919,710 1,237,360 15,240,190152 FT_4200: MUW, CW. Start Reading 1,496,237,000 1,512,516,000 1,528,596,000 1,542,735,000 1,551,031,000 1,554,563,000 1,557,976,000 1,557,969,000 1,562,651,000 1,567,887,000 1,575,896,000 1,588,180,000153 End Reading 1,512,516,000 1,528,596,000 1,542,735,000 1,551,031,000 1,554,563,000 1,557,976,000 1,557,969,000 1,562,651,000 1,567,887,000 1,575,896,000 1,588,180,000 1,602,064,000154 Period Use in units = 1 x GALL 16,279,000 16,080,000 14,139,000 8,296,000 3,532,000 3,413,000 3,132,107 4,682,000 5,236,000 8,009,000 12,284,000 13,884,000 108,966,107
File: NDE FEA Reconciliation FY 18 - 19 Page 3 of 11 Printstamp: 7/29/2019 12:13 PM-69-

1 REV: 12 DATE: 07/29/193 NASHVILLE, TENNESSEE
4 CNE INVOICE RECONCILIATION - FY 2018 - 2019155 FT_4100: MUW, CHW. Start Reading 166,744,800 168,816,100 171,703,000 174,860,000 178,675,900 179,681,400 180,723,200 181,936,200 183,040,000 184,273,100 185,718,400 187,418,200156 End Reading 168,816,100 171,703,000 174,860,000 178,675,900 179,681,400 180,723,200 181,936,200 183,040,000 184,273,100 185,718,400 187,418,200 189,346,500157 Period Use in units = 1 x GALL 2,071,300 2,886,900 3,157,000 3,815,900 1,005,500 1,041,800 1,213,000 1,103,800 1,233,100 1,445,300 1,699,800 1,928,300 22,601,700158 2" PLANT WATER Start Reading in 10 x scft 15,299,900 15,372,900 15,372,900 15,372,900 15,372,900 1,512,500 1,605,300 1,753,600 1,893,900 2,047,800 2,204,100 2,376,600159 UTILITY METER Start Reading in 10 x scft 15,372,900 15,372,900 15,372,900 15,372,900 15,372,900 1,605,300 1,753,600 1,893,900 2,047,800 2,204,100 2,376,600 2,484,900160 Period Use in units = 1 x SCFT 73,000 0 0 0 0 92,800 148,300 140,300 153,900 156,300 172,500 108,300 1,045,400161 6" PLANT WATER Start Reading 2,203,035 2,227,730 2,253,470 2,276,710 2,293,970 2,302,825 2,311,030 2,319,080 2,327,710 2,337,070 2,349,570 2,367,770162 UTILITY METER End Reading 2,227,730 2,253,470 2,276,710 2,293,970 2,302,825 2,311,030 2,319,080 2,327,710 2,337,070 2,349,570 2,367,770 2,388,790163 Period Use in units = 1 x SCFT 24,695 25,740 23,240 17,260 8,855 8,205 8,050 8,630 9,360 12,500 18,200 21,020 185,755164 2" DOMESTIC WATER Start Reading 3,662,000.0 3,705,000.0 3,759,000.0 3,800,000.0 3,825,000.0 3,847,000.0 3,866,000.0 3,894,000.0 3,910,000.0 3,926,000.0 3,938,000.0 3,952,000.0165 UTILITY METER End Reading 3,705,000.0 3,759,000.0 3,800,000.0 3,825,000.0 3,847,000.0 3,866,000.0 3,894,000.0 3,910,000.0 3,926,000.0 3,938,000.0 3,952,000.0 3,962,000.0166 Period Use in units = 1 x SCFT 43,000 54,000 41,000 25,000 22,000 19,000 28,000 16,000 16,000 12,000 14,000 10,000 300,000167168169 PERFORMANCE CALCULATIONS170 Month 7 8 9 10 11 12 13 14 15 16 17 18 TOTAL171 ELECTRIC-to-STEAM CONVERSION172 Emainutility kWh 8,001,140 7,980,812 7,212,408 4,879,980 2,892,540 2,826,208 2,662,996 2,877,924 3,118,948 3,887,520 5,631,584 6,336,008 58,308,068173 Echw,metered kWh 7,809,859 7,805,532 7,039,358 4,670,343 2,640,598 2,569,577 2,386,400 2,633,489 2,884,752 3,692,456 5,468,771 6,165,577 55,766,711174 Esteam,metered kWh 56,113 56,266 56,034 84,184 121,354 132,777 145,630 124,152 119,855 72,070 57,464 54,460 1,080,359175 Esteam,unmetered kWh 948 839 909 2,164 5,479 5,819 7,162 5,189 4,394 2,280 1,075 997 37,255176 CAPACITY TEST ADJUSTMENT, kWh 0 0 0 0 0 0 0 0 0 0 0 0 0177 Esteam,total kWh 57,061 57,105 56,943 86,348 126,833 138,596 152,792 129,341 124,249 74,350 58,539 55,457 1,117,614178 Customer Steam, Sn+e lbs 16,384,926 17,258,126 18,176,813 27,324,850 45,110,217 51,304,036 58,543,258 44,830,771 44,000,442 24,920,342 18,518,639 15,731,584 382,104,004179 nelec, actual kWh/klb 3.483 3.309 3.133 3.160 2.812 2.701 2.610 2.885 2.824 2.984 3.161 3.525 2.925180 FUEL GAS-to-STEAM CONVERSION181 Metered Plant Steam Send-out lbs 22,326,000 22,849,000 23,620,000 31,848,000 48,093,000 53,345,000 61,830,000 48,707,000 48,439,000 31,041,000 25,168,000 22,192,000 439,458,000182 CAPACITY TEST ADJUSTMENT, lbs 0 0 0 0 0 0 0 0 0 0 0 0 0183 ADJUSTED Plant Steam SO lbs 22,326,000 22,849,000 23,620,000 31,848,000 48,093,000 53,345,000 61,830,000 48,707,000 48,439,000 31,041,000 25,168,000 22,192,000 439,458,000184 Natural Gas use, NG Dth 30,273.2 31,219.5 31,793.3 43,222.4 66,902.6 73,986.8 85,819.0 67,053.6 66,526.2 41,257.3 32,693.3 29,925.4 600,672.6185 Propane Gas use, P gallon 0 0 0 0 401 540 3,060 0 90 0 180 0 4,271186 Dth 0 0 0 0 37 49 278 0 8 0 16 0 388187 CAPACITY TEST ADJUSTMENT, Dth 0.0 0.0 0.0 0.0 0.0 0.0 0.0 0.0 0.0 0.0 0.0 0.0 0188 TOTAL FUEL GAS USE Dth 30,273.2 31,219.5 31,793.3 43,222.4 66,939.6 74,035.8 86,097.0 67,053.6 66,534.2 41,257.3 32,709.3 29,925.4 601,060.6189 nhhv,actual Dth/klb 1.356 1.366 1.346 1.357 1.392 1.388 1.392 1.377 1.374 1.329 1.300 1.348 1.3680190 Condensate Return, CR gallon 2,149,600 2,045,600 2,388,800 3,142,000 4,201,400 5,057,300 6,020,500 4,620,700 4,540,600 2,883,600 2,219,200 1,611,800 40,881,100191 % of SO 78.53% 73.02% 82.48% 80.46% 71.25% 77.32% 79.42% 77.37% 76.45% 75.76% 71.91% 59.24% 75.87%192 Condensate Return Energy mmBtu 2,679 2,683 3,008 3,802 5,027 5,870 7,027 5,377 5,306 3,512 2,917 2,170 49,378193 Condensate Return Temperature avg 185 °F 193 °F 186 °F 180 °F 179 °F 174 °F 175 °F 175 °F 175 °F 181 °F 193 °F 197 °F 180 °F194 nhhv,guarantee Dth/klb GUARANTEED MAX RATE 1.676195 CES FEA RATE 1.591196 WATER-to-STEAM CONVERSION197 Metered Steam Makeup, MW Gallons 635,690 797,000 546,810 889,100 2,093,440 1,858,030 1,980,870 1,637,270 1,624,550 1,020,360 919,710 1,237,360 15,240,190198 CAPACITY TEST ADJUSTMENT, Gallons 0 0 0 0 0 0 0 0 0 0 0 0 0199 ADJUSTED Steam Makeup, MW Gallons 635,690 797,000 546,810 889,100 2,093,440 1,858,030 1,980,870 1,637,270 1,624,550 1,020,360 919,710 1,237,360 15,240,190200 Actual Steam Makeup, nwater Gallons 642,047 804,970 552,278 897,991 2,114,374 1,876,610 2,000,679 1,653,643 1,640,796 1,030,564 928,907 1,249,734 15,392,592201 Guarantee Steam Makeup, nguar. Gallons 675,995 869,339 583,373 877,366 1,949,651 1,705,914 1,794,646 1,554,032 1,608,358 1,060,737 996,686 1,275,570 14,951,668202 ELECTRICITY-to-CHW CONVERSION203 Emainutility kWh 8,001,140 7,980,812 7,212,408 4,879,980 2,892,540 2,826,208 2,662,996 2,877,924 3,118,948 3,887,520 5,631,584 6,336,008 58,308,068204 CAPACITY TEST ADJUSTMENT, kWh 0 0 0 0 0 0 0 0 0 0 0 0 0205 Echw,metered kWh 7,809,859 7,805,532 7,039,358 4,670,343 2,640,598 2,569,577 2,386,400 2,633,489 2,884,752 3,692,456 5,468,771 6,165,577 55,766,711206 Esteam,total kWh 57,061 57,105 56,943 86,348 126,833 138,596 152,792 129,341 124,249 74,350 58,539 55,457 1,117,614207 Echw,unmetered kWh 134,220 118,175 116,107 123,289 125,109 118,035 123,804 115,094 109,947 120,714 104,274 114,974 1,423,743208 Echw,total kWh 7,944,079 7,923,707 7,155,465 4,793,632 2,765,707 2,687,612 2,510,204 2,748,583 2,994,699 3,813,170 5,573,045 6,280,551 57,190,454209 Customer CHW, CHWs+e Ton-hrs 8,669,006 8,630,350 7,847,216 5,214,050 2,774,971 2,751,071 2,558,241 2,995,155 3,203,082 4,292,897 6,211,811 6,829,230 61,977,080210 nelec, actual kWh/ton-hr 0.916 0.918 0.912 0.919 0.997 0.977 0.981 0.918 0.935 0.888 0.897 0.920 0.923211 CW-to-CHW CONVERSION212 Condenser Water Makeup, CM Gallons 16,279,000 16,080,000 14,139,000 8,296,000 3,532,000 3,413,000 3,132,107 4,682,000 5,236,000 8,009,000 12,284,000 13,884,000 108,966,107213 Customer CHW, CHWs+e Ton-hrs 8,669,006 8,630,350 7,847,216 5,214,050 2,774,971 2,751,071 2,558,241 2,995,155 3,203,082 4,292,897 6,211,811 6,829,230 61,977,080214 nwater,actual Gallons/ton-hr 1.8778 1.8632 1.8018 1.5911 1.2728 1.2406 1.2243 1.5632 1.6347 1.8656 1.9775 2.0330 1.7582215216217 METER CHECKS AND ESTIMATES218 WATER METER CHECKS 7 8 9 10 11 12 1 2 3 4 5 6 TOTAL219 Utility Meters - Utility Dates gallons 19,074,748 17,495,720 22,169,972 15,431,240 9,701,560 6,286,940 7,684,204 20,024,708 7,763,492 8,236,976 11,133,232 17,356,592 162,359,384220 Utility Meters - Customer Dates gallons 730,759 192,535 173,835 129,105 66,235 755,517 1,169,498 1,113,996 1,221,185 1,262,624 1,426,436 967,314 9,209,039221 variance (line 184-line 183) gallons -18,343,989 -17,303,185 -21,996,137 -15,302,135 -9,635,325 -5,531,423 -6,514,706 -18,910,712 -6,542,307 -6,974,352 -9,706,796 -16,389,278 -153,150,345222 % of TOTAL (line 183) -96% -99% -99% -99% -99% -88% -85% -94% -84% -85% -87% -94% -94.33%223 Plant Meters224 CHW gallons 2,071,300 2,886,900 3,157,000 3,815,900 1,005,500 1,041,800 1,213,000 1,103,800 1,233,100 1,445,300 1,699,800 1,928,300 22,601,700225 CW gallons 16,279,000 16,080,000 14,139,000 8,296,000 3,532,000 3,413,000 3,132,107 4,682,000 5,236,000 8,009,000 12,284,000 13,884,000 108,966,107226 STEAM gallons 635,690 797,000 546,810 889,100 2,093,440 1,858,030 1,980,870 1,637,270 1,624,550 1,020,360 919,710 1,237,360 15,240,190227 TOTAL gallons 18,985,990 19,763,900 17,842,810 13,001,000 6,630,940 6,312,830 6,325,977 7,423,070 8,093,650 10,474,660 14,903,510 17,049,660 146,807,997
File: NDE FEA Reconciliation FY 18 - 19 Page 4 of 11 Printstamp: 7/29/2019 12:13 PM-70-
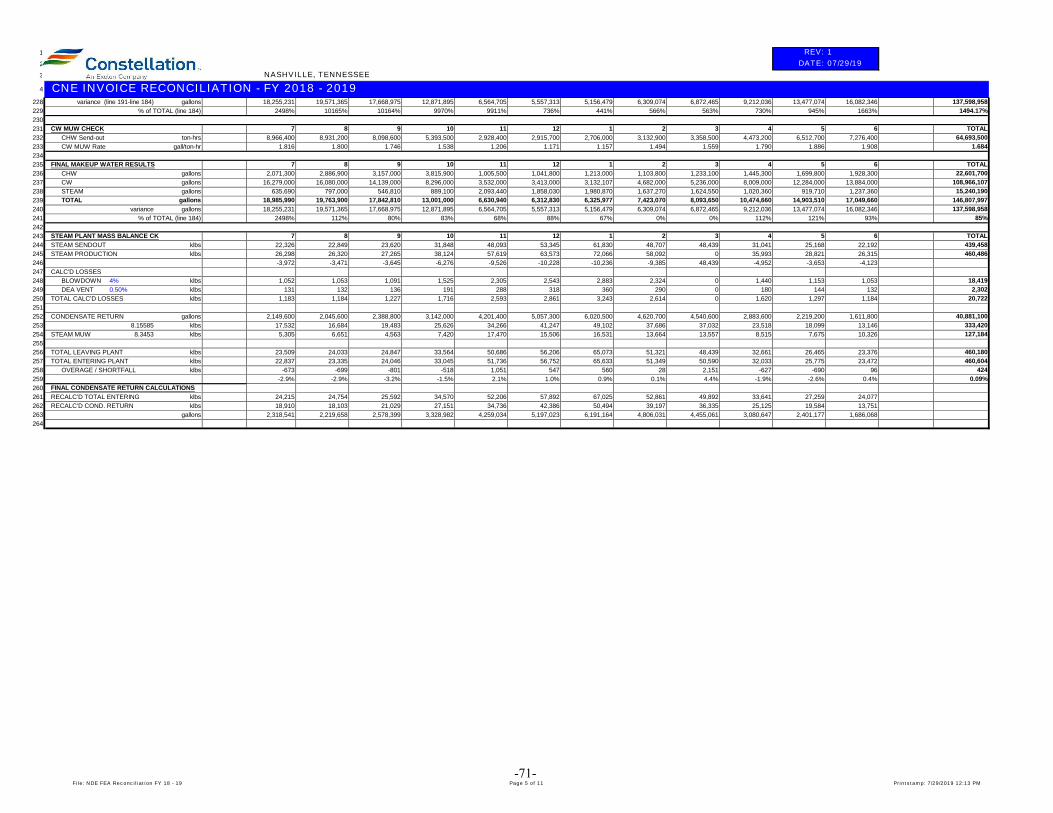
1 REV: 12 DATE: 07/29/193 NASHVILLE, TENNESSEE
4 CNE INVOICE RECONCILIATION - FY 2018 - 2019228 variance (line 191-line 184) gallons 18,255,231 19,571,365 17,668,975 12,871,895 6,564,705 5,557,313 5,156,479 6,309,074 6,872,465 9,212,036 13,477,074 16,082,346 137,598,958229 % of TOTAL (line 184) 2498% 10165% 10164% 9970% 9911% 736% 441% 566% 563% 730% 945% 1663% 1494.17%230231 CW MUW CHECK 7 8 9 10 11 12 1 2 3 4 5 6 TOTAL232 CHW Send-out ton-hrs 8,966,400 8,931,200 8,098,600 5,393,500 2,928,400 2,915,700 2,706,000 3,132,900 3,358,500 4,473,200 6,512,700 7,276,400 64,693,500233 CW MUW Rate gall/ton-hr 1.816 1.800 1.746 1.538 1.206 1.171 1.157 1.494 1.559 1.790 1.886 1.908 1.684234235 FINAL MAKEUP WATER RESULTS 7 8 9 10 11 12 1 2 3 4 5 6 TOTAL236 CHW gallons 2,071,300 2,886,900 3,157,000 3,815,900 1,005,500 1,041,800 1,213,000 1,103,800 1,233,100 1,445,300 1,699,800 1,928,300 22,601,700237 CW gallons 16,279,000 16,080,000 14,139,000 8,296,000 3,532,000 3,413,000 3,132,107 4,682,000 5,236,000 8,009,000 12,284,000 13,884,000 108,966,107238 STEAM gallons 635,690 797,000 546,810 889,100 2,093,440 1,858,030 1,980,870 1,637,270 1,624,550 1,020,360 919,710 1,237,360 15,240,190239 TOTAL gallons 18,985,990 19,763,900 17,842,810 13,001,000 6,630,940 6,312,830 6,325,977 7,423,070 8,093,650 10,474,660 14,903,510 17,049,660 146,807,997240 variance gallons 18,255,231 19,571,365 17,668,975 12,871,895 6,564,705 5,557,313 5,156,479 6,309,074 6,872,465 9,212,036 13,477,074 16,082,346 137,598,958241 % of TOTAL (line 184) 2498% 112% 80% 83% 68% 88% 67% 0% 0% 112% 121% 93% 85%242243 STEAM PLANT MASS BALANCE CK 7 8 9 10 11 12 1 2 3 4 5 6 TOTAL244 STEAM SENDOUT klbs 22,326 22,849 23,620 31,848 48,093 53,345 61,830 48,707 48,439 31,041 25,168 22,192 439,458245 STEAM PRODUCTION klbs 26,298 26,320 27,265 38,124 57,619 63,573 72,066 58,092 0 35,993 28,821 26,315 460,486246 -3,972 -3,471 -3,645 -6,276 -9,526 -10,228 -10,236 -9,385 48,439 -4,952 -3,653 -4,123247 CALC'D LOSSES248 BLOWDOWN 4% klbs 1,052 1,053 1,091 1,525 2,305 2,543 2,883 2,324 0 1,440 1,153 1,053 18,419249 DEA VENT 0.50% klbs 131 132 136 191 288 318 360 290 0 180 144 132 2,302250 TOTAL CALC'D LOSSES klbs 1,183 1,184 1,227 1,716 2,593 2,861 3,243 2,614 0 1,620 1,297 1,184 20,722251252 CONDENSATE RETURN gallons 2,149,600 2,045,600 2,388,800 3,142,000 4,201,400 5,057,300 6,020,500 4,620,700 4,540,600 2,883,600 2,219,200 1,611,800 40,881,100253 8.15585 klbs 17,532 16,684 19,483 25,626 34,266 41,247 49,102 37,686 37,032 23,518 18,099 13,146 333,420254 STEAM MUW 8.3453 klbs 5,305 6,651 4,563 7,420 17,470 15,506 16,531 13,664 13,557 8,515 7,675 10,326 127,184255256 TOTAL LEAVING PLANT klbs 23,509 24,033 24,847 33,564 50,686 56,206 65,073 51,321 48,439 32,661 26,465 23,376 460,180257 TOTAL ENTERING PLANT klbs 22,837 23,335 24,046 33,045 51,736 56,752 65,633 51,349 50,590 32,033 25,775 23,472 460,604258 OVERAGE / SHORTFALL klbs -673 -699 -801 -518 1,051 547 560 28 2,151 -627 -690 96 424259 -2.9% -2.9% -3.2% -1.5% 2.1% 1.0% 0.9% 0.1% 4.4% -1.9% -2.6% 0.4% 0.09%260 FINAL CONDENSATE RETURN CALCULATIONS261 RECALC'D TOTAL ENTERING klbs 24,215 24,754 25,592 34,570 52,206 57,892 67,025 52,861 49,892 33,641 27,259 24,077262 RECALC'D COND. RETURN klbs 18,910 18,103 21,029 27,151 34,736 42,386 50,494 39,197 36,335 25,125 19,584 13,751263 gallons 2,318,541 2,219,658 2,578,399 3,328,982 4,259,034 5,197,023 6,191,164 4,806,031 4,455,061 3,080,647 2,401,177 1,686,068264
File: NDE FEA Reconciliation FY 18 - 19 Page 5 of 11 Printstamp: 7/29/2019 12:13 PM-71-

Exhibit 1
-72-

1 REV: 12 DATE: 07/29/193 NASHVILLE, TENNESSEE
4 CNE INVOICE RECONCILIATION - FY 2018 - 201956 FINALIZE FUEL EFFICIENCY ADJUSTMENTS78 SUMMARY ELECTRIC FEA FUEL GAS FEA WATER FEA System TOTAL Include FEA9 STEAM SYSTEM $25,124.36 $95,967.97 ($1,128.59) $119,963.74 in INVOICE YES
10 CHILLED WATER SYSTEM $175,235.34 $0.00 $138,483.04 $313,718.38 (YES/NO) NO11 TOTAL $200,359.70 $95,967.97 $137,354.45 $433,682.12 YES1213 ELECTRICITY-TO-STEAM CONVERSION14 CONTRACTUAL GUARANTEE 6.000 kWh per mlb sold CNE PENALTY/BONUS CALCULATION PENALTY BONUS15 Metering Inaccuracy Buffer 0% RATE VARIANCE kWh per mlb sold 0.000 3.07516 GUARANTEED MAX QUANTITY 6.000 kWh per mlb sold STEAM SOLD 382,104 mlb17 CEPS FUEL EFFICIENCY ADJUSTMENT 6.000 kWh per mlb sold VARIANCE in kWh = RATE VARIANCE x STEAM SOLD 0 1,175,01018 CEPS ACTUAL CONVERSION RATE 2.925 kWh per mlb sold AVERAGE ELECTRIC PRICE $0.0855 / kWh19 CEPS PENALTY / BONUS $0.00 $25,124.3620 NOTE: Penalty at 100% of variance and Bonus at 25% of variance21 FUEL GAS-TO-STEAM CONVERSION22 CONTRACTUAL GUARANTEE (varies by Condensate Return, see below) CNE PENALTY/BONUS CALCULATION PENALTY BONUS23 Given Condensate Return at 76% of Send-out RATE VARIANCE Dth. per mlb sold 0.000 0.22324 180 °F avg. Temp. STEAM SEND-OUT 439,458 mlb25 GUARANTEED MAX QUANTITY 1.676 Dth.per mlb sold VARIANCE in Dth. = RATE VARIANCE x STEAM SOLD 0 97,99926 CEPS FUEL EFFICIENCY ADJUSTMENT 1.591 Dth.per mlb sold AVERAGE FUEL PRICE $3.9171 / Dth.27 CEPS ACTUAL CONVERSION RATE 1.368 Dth.per mlb sold CEPS PENALTY / BONUS $0.00 $95,967.9728 NOTE: Penalty at 100% of variance and Bonus at 25% of variance29 WATER-TO-STEAM CONVERSION30 CONTRACTUAL GUARANTEE (varies by Plant Send-out, see below)) CNE PENALTY/BONUS CALCULATION PENALTY BONUS31 PLANT LOSSES 15% VARIANCE in gallons = GMQ - CES ACTUAL USE -440,924 032 VOLUMETRIC CONVERSION 7.4805 gallons per cft AVERAGE WATER PRICE $2.5596 / kGall33 CONDENSATE RETURN SPEC. VOL. 8.15585 gall per lb CEPS PENALTY / BONUS -$1,128.59 $0.0034 GUARANTEED MAX QUANTITY 14,951,668 gallons Average water pice excludes sewer.35 CEPS ACTUAL USE 15,392,592 gallons36 NOTE: Penalty at 100% of variance and Bonus at 25% of variance37 ELECTRICITY-TO-CHILLED WATER CONVERSION38 CONTRACTUAL GUARANTEE 1.055 kWh per ton-hr sold CNE PENALTY/BONUS CALCULATION PENALTY BONUS39 Metering Inaccuracy Buffer 0% RATE VARIANCE kWh per ton-hr sold 0.000 0.13240 GUARANTEED MAX QUANTITY 1.055 kWh per ton-hr sold CHILLED WATER SOLD 61,977,080 ton-hrs41 CEPS FUEL EFFICIENCY ADJUSTMENT 1.055 kWh per ton-hr sold VARIANCE in kWh = RATE VARIANCE x CHW SOLD 0 8,195,36542 CEPS ACTUAL CONVERSION RATE 0.923 kWh per ton-hr sold AVERAGE ELECTRIC PRICE $0.0855 / kWh43 CEPS PENALTY / BONUS $0.00 $175,235.3444 NOTE: Penalty at 100% of variance and Bonus at 25% of variance45 WATER-TO-CHILLED WATER CONVERSION46 CONTRACTUAL GUARANTEE 5.250 gall per ton-hr sold CNE PENALTY/BONUS CALCULATION PENALTY BONUS47 Metering Inaccuracy Buffer 0% RATE VARIANCE gall per ton-hr sold 0.000 3.49248 GUARANTEED MAX QUANTITY 5.250 gall per ton-hr sold CHILLED WATER SOLD 61,977,080 ton-hrs49 CEPS FUEL EFFICIENCY ADJUSTMENT 5.250 gall per ton-hr sold VARIANCE in gallons = RATE VARIANCE x CHW SOLD 0 216,413,56350 CEPS ACTUAL CONVERSION RATE 1.758 gall per ton-hr sold AVERAGE WATER PRICE $2.5596 / kGall51 CEPS PENALTY / BONUS $0.00 $138,483.0452 NOTE: Penalty at 100% of variance and Bonus at 25% of variance53545556 COMPARISON PREVIOUSLY BILLED VS. RECONCILED AMOUNTS57 STEAM SYSTEM CHILLED WATER SYSTEM58 CALCULATED RECONCILED VARIANCE CALCULATED RECONCILED VARIANCE59 ELECTRIC $26,091.72 $25,124.36 ($967.36) ELECTRIC $193,636.92 $175,235.34 ($18,401.58)60 FUEL GAS $95,824.93 $95,967.97 $143.04 FUEL GAS $0.00 $0.00 $0.0061 WATER ($1,637.75) ($1,128.59) $509.16 WATER $138,594.50 $138,483.04 ($111.46)62 TOTAL $120,278.90 $119,963.74 ($315.16) TOTAL $332,231.42 $313,718.38 ($18,513.04)636465 COMPARISON AMOUNT COLLECTED BY METRO VS 97-13 CAP66 METRO PAID METRO OWES67 STEAM CHILLED WATER TOTAL CNE CUSTOMER68 ELECTRIC $16,004.25 $114,861.52 $130,865.7769 FUEL GAS $57,161.89 $0.00 $57,161.8970 WATER ($1,377.66) $87,166.70 $85,789.0471 TOTAL $71,788.48 $202,028.22 $273,816.70 $244,976.30 $28,840.4072
FEA COLLECTED BY METRO
FILE: NDE FEA Reconciliation FY 18 - 19 PRINTSTAMP: 7/29/2019 12:13 PM
-73-

FILE: NDE FEA Reconciliation FY 18 - 19
NASHVILLE, TENNESSEEEXHIBIT 1 - CALCULATION DETAIL FOR PLANT PERFORMANCE PER APPENDIX 19
ELECTRICITY-TO-STEAM CONVERSION
(1) E (MainUtility) = total electric use per main utility meters 58,308,068 kWh(2) E (Steam,metered) = metered electric use for steam plant 1,080,359 kWh
MCC-3 410,582MCC-4 669,777
(3) E (CHW,metered) = metered electric use for chilled water plant 55,766,711 kWhSWGR-2A 7,181,700SWGR-2B 10,235,220SWGR-3A 10,165,850SWGR-3B 15,377,840SWGR-4A 2,100,309SWGR-4B 3,278,459SWGR-5A 1,820,288SWGR-5B 2,005,788MCC-1 1,797,913MCC-2 1,803,344
(4) Esteam,unmetered = un-metered electric use for steam plant = [ (2) / (1) ] x [ (1) - (2) - (3) ] 27,070 kWh *(5) Echw,unmetered = un-metered electric use for chilled water plant = (1) - (2) - (3) - (4) 1,433,928 kWh *(6) Esteam,total = total electric use for steam plant = (2) + (4) 1,107,429 kWh *(7) Customer Steam Sales, metered + unmetered 382,104,004 lbs
n (elec): Actual Steam Plant Electric Conversion = (6) / [ (7) x 0.001 ] = 2.898 kWh/klb
NATURAL GAS-TO-STEAM CONVERSION
(8) NG = Total Natural Gas Use per main utility meters 600,672.6 Dth(9) P = Total Propane Gas 388 Dth
(10) HHV = Higher Heating Value of Propane 1.002052 Btu/scft(11) SO = Plant Steam Send Out 439,458,000 lbs***
Meter Reading at the beginning, n-1 5,527,837Meter Reading at the end, n 5,982,572Units of Measure 1 x SCFT
n (HHV): Actual Plant Efficiency = [ (8) + (9) x (10) ] / [ (11) x 0.001) ] = 1.368 Dth/klb
(12) CR = Condensate Return per plant meter 40,881,100 gallons **Meter Reading at the beginning, n-1 372,096,200Meter Reading at the end, n 412,977,300Units of Measure 1 x SCFT
(13) H = Condensate Return energy 49,378 mmBtuMeter Reading at the beginning, n-1 242,210Meter Reading at the end, n 291,588Units of Measure 1 x MMBTU
T (cr,avg): Average Condensate Return Temperature = 180 °F
PAGE 7 of 11 PRINTSTAMP: 7/29/2019 12:13 PM-74-

FILE: NDE FEA Reconciliation FY 18 - 19
NASHVILLE, TENNESSEEEXHIBIT 1 - CALCULATION DETAIL FOR PLANT PERFORMANCE PER APPENDIX 19
WATER-TO-STEAM CONVERSION
(14) MW = Steam system makeup water plant meter 15,240,190 gallonsMeter Reading at the beginning, n-1 156,767,670Meter Reading at the end, n 172,007,860Units of Measure 1 x SCFT
n (water): Actual steam plant water use = (14) * 1.01 = 15,392,592 gallons
G (water): Guaranteed steam plant water use = [ (11) / 8.15585 - (12) = 14,951,668 gallons
ELECTRICITY-TO-CHILLED WATER CONVERSION
(15) E (chw,total) = Total CHW Electric use = (3) + (5) = 57,200,639 kWh *(16) Customer CHW Sales, metered + unmetered 61,977,080 kWh
n (elec): Actual chilled water plant electric conversion = (15) / (16) = 0.923 kw/ton
CONDENSER WATER-TO-CHILLED WATER CONVERSION
(17) CM = Condenser water makeup plant meter 105,827,000 gallons **Meter Reading at the beginning, n-1 1,496,237,000Meter Reading at the end, n 1,602,064,000Units of Measure 1 x GALL
n (water): Actual chilled water plant conversion = (17) / (16) = 1.708 gal/ton-hr
NOTES: * - There is a 13,053 kWh variance from the FEA due to rounding errors resulting from monthly vs. annualsummation.
** - Estimated due to incorrect totalization resulting from "low flow cut-off".*** - Meter Change out
PAGE 8 of 11 PRINTSTAMP: 7/29/2019 12:13 PM-75-

Exhibit 2
-76-

Revision 12 7/30/19
Information Technology Services Program for
-77-

Revision 12 7/30/19
Table of Contents
Networks ……………………………………………………………………………………Page 1
Hardware ……………………………………………………………………………………Page 1
Software …………………………………………………………………………………….Page 2
Connectivity………………………………………………………………………………... Page 2
Metro Access to Data …………...…………………………………………………………. Page 2
Data Backup and Storage ………………………………………………………………..… Page 3
Support and Service ….……………………………………………………………………. Page 3
Program Review………………………………………………………………………….….Page 4
Hardware Inventory ……………………………..……….…………………………………Page 5
-78-

Revision 12 7/30/19
Page 1
Networks
The Operating System Network for the Metro Nashville District Energy System (DES) Energy
Generation Facility (EGF) was provided and installed by Siemens Building Technologies. This
System controls all the equipment and machinery in the plant using the Siemens proprietary
Apogee and Insite software. This system was approved and accepted by Metro prior to plant start
up.
Metro had a T-1, fiber optic, line installed to the EGF so that Metro representatives could access
the Metro.gov network from the Metro office.
Constellation NewEnergy, Inc. (CNE) installed an Administrative Computer Network to be used
for non-operating, office functions; such as, the Computerized Maintenance Management System
data base (CMMS), e-mail, reporting, accounting, customer billing, etc. The following addresses
equipment, programs and scheduled activities to support this network.
Hardware
The computer equipment in the EGF belongs to Metro. CNE is obligated to provide equipment
which meets or exceeds industry standards. The following table shows equipment acquired by
CNE for the Nashville DES:
Equipment
Server
Dell PowerEdge T620/duel Xeon e5-2640 2.5GHz Processor/ 4x4 GB RAM/4x1TB SATA HDs/PERC
H310/ RAID 5 Configuration/DVD drive
Firewall
Sonicwall TZ 400
Desktop Computer
Lenovo ThinkCentre M92P Series with Intel i5 Processor, 4 GB Ram, AMD Radon HD 7350 graphics
adapter, 500 GB HD & DVDRW
Monitor
Dell Professional P2312H 23” Ultra Sharp LCD Flat Panel
Laptop Computer
Lenovo ThinkPad L530 notebook, with Intel i7 3520 QM Processor, 15.6 HD Display, 8 GB Ram,
500 GB HD, DVDRW, Centrino N2230 & Bluetooth
Docking Station
ThinkPad MiniDock replicator
Ultra slim keyboard & mouse
Per industry standards, computer hardware should be replaced every three to five years. This
equipment was most recently replaced in 2013. The mother board on the Siemens server was
replaced under warranty in 2016. The CNE server was replaced with a solid-state Dell T330 in
2018. An equipment inventory is located on page 5 of this document.
CNE has a performance contract with Metro to operate and manage the Nashville DES. With the
exception of a designated work station in the Metro office, CNE will have exclusive use of and
responsibility for this equipment in the same way CNE has exclusive rights to boilers, chillers,
pumps, etc., as long as the ARMA is in effect.
-79-

Revision 12 7/30/19
Page 2
Software
Each server has the following software installed:
Operating System Microsoft 8 R2 Server/Microsoft Server 2016
Data base Microsoft SQL 2008
AntiVirus Malwarebytes
Each computer has the following software installed:
Operating System Microsoft 7 Professional
Microsoft Office 2010 Word, Excel, Power Point, Outlook, One Note, Office Publisher
AntiVirus Malwarebytes
Additional software installed on specific machines includes:
• Microsoft Office, Access - Administrative Operations Representative and the Office
Coordinator.
• Adobe Acrobat X - General Manager and the Administrative Operations Representative.
• I-Maint - Control Room, Plant Operations Manager, Operations Supervisor, Maintenance
Supervisor, Instrumentation & Electrical Supervisor and Metro office.
Connectivity
Metro Constellation
Internet Connection Fiber optic Comcast Cable
CNE accesses customer meter data through the internet. The State has granted CNE access to their
building meters through a VPN at no cost. Metro building meters are accessed through the fiber
optic line Metro installed to the EGF.
Metro Access to Data
A Dell server, furnished by CNE, is located in the Metro office at the EGF. The purpose of this
server is to give Metro administrative access to plant data. This server acts as a work station and
contains a copy of network data for Metro’s use. CNE personnel check to insure the required data
files are transferred from the CNE Administrative server to the Metro Server daily. Information
stored on the Metro office server includes a copy of the Siemens SQL data base, the I-
Maint/CMMS data base, the EGF control room shift readings, the customer billing system data
base (updated twice per month by the Administrative Operations Representative) and customer
meter data (updated once per month by the Customer Service Representative).
-80-

Revision 12 7/30/19
Page 3
Data Backup and Storage
CNE’s Administrative Server is backed up continuously. The offsite, online repository used by
CNE is Carbonite.
The Siemens SQL database is also backed up to Carbonite. Other trend data is manually backed
up on two external drives every Monday, the last day of the month and when any changes or
updates are made.
Metro, at their own expense, backed up their Server data to Mozy. Mozy was purchased by
Carbonite, so now Metro’s data is backed up to Carbonite daily.
If issues cause data not to transfer, CNE will assist a Metro Representative with trouble shooting.
CNE personnel check to see if there have been any software security updates and make corrections
to reestablish connectivity. Metro checks their backup at least once per month. From time to time,
Metro has to purge old data or purchase additional storage space.
Support and Service
Administrative System
A three year extended service plan was purchased from Lenovo for all of the new hardware. CNE
has contracted with a third party vendor, FrontGate Technology Solutions, LLC, for ITS service
and support. These services include:
1. Installation and set up of new work stations and servers. Fully test and verify set up.
2. Provide information technology consulting, support and maintenance services to maintain
the IT infrastructure at the Energy Generation Facility. This includes: Server and desktop
hardware support, troubleshooting, repairing or replacement of system components and
peripherals.
3. Hardware support will include and may not be limited to: memory upgrades, hard disk
replacement, network card replacement, system board replacement and hardware
accessories installation.
4. Software support includes installation, configuration, and troubleshooting of the supported
applications. This will also include monthly patches, anti-virus and security upgrades.
5. Response time for critical system and system-down issues will be within 4 hours and non-
critical system tasks will be resolved within 24 hours. An on-site equipment inspection will
be performed at least once per month.
-81-

Revision 12 7/30/19
Page 4
Operating System
Constellation Energy purchased a Bronze Level service agreement with Siemens to maintain,
repair, replace and install all software upgrades on their proprietary system. These services include:
annual software updates, annual network maintenance, annual preventative maintenance to MBC
40 devices, data protection and data recovery, routine backups, online diagnostics and operator
coaching.
Program Review
The Information Technology Services Program is reviewed with Metro annually and updated as
required. A summary of revisions and changes will be included in the Annual Report. If no changes
are made, a statement to that effect will be included.
-82-

Revision 12 7/30/19
Page 5
Hardware Inventory
There are three servers, four laptops and eleven desktop workstations. Below is a detailed list of
what is included at each workstation and where each is located (Equipment descriptions are located
in the Hardware section of this program above).
Office Location Computer ID Number Monitor Keyboard &
Mouse
Data Room 2 Servers G4SLBY1 (Siemens)
8P8RMN2 (CNE) 2-23” Flat Panels 1-each
Metro Office 1 Server 4501BP1 1-17” Flat Panel 1-each
General Manager 1 Laptop R9-W1C7R-12/12 1-24” Flat Panel 1-each
Operations Manager 1 Laptop R9-W1C7T-12/12 1-23” Flat Panel 1-each
Finance & Administration
Representative 1 Laptop R9-W1C7V-12/12 1-23” Flat Panel 1-each
Customer Service
Representative 1 Desktop 1S3212CTOMJXTNXA 1-23” Flat Panel 1-each
Instrumentation &
Electrical Supervisor
1 Desktop 1S3212CTOMJXTNXD 1-23” Flat Panel 1-each
Instrumentation & Controls
Technician 1 Laptop R9-W1C7W-12/12 N/A N/A
Maintenance Supervisor 1 Desktop 1S3212CTOMJXTNXB 1-23” Flat Panel 1-each
Operations Supervisor 2 Desktops 1S3212CTOMJXTNXC
1S3212CTOMJXTNXE 2-23” Flat Panels 1-each
Office Coordinator 1 Desktop 1S3212CTOMJXTNMV 1-23” Flat Panel 1-each
Control Room 3 Desktops
1S3212CTOMJXTNMR
1S3212CTOMJXTNMT
1S3212CTOMJXTNMW
8-17” Flat Panels 1-each
Control Room (SE-2) 1 Desktop ESO6826516 1-17” Flat Panel 1-each
Control Room (Security) 1 Desktop BYPC8M2 1-17” Flat Panel 1-each
-83-

Exhibit 3
-84-

Constellation NewEnergy, Inc. Assets (Equipment used at MNDES owned by CNE)
• 2011 GMC Canyon Crew Cab Pickup Truck
• 2015 Chevrolet 3500 Crew Cab Flatbed Pickup Truck
• 2016 Ford F-150 Crew Cab Pickup Truck
• Ecom Combustion Analyzer
• Fluke Multi-meter
• Fluke Insulation Tester (megger)
• Greenlee Circuit Analyzer
• Fluke Clamp Meter
• Fluke 87 Multi-meter
• Salisbury Audio/Visual Voltage Detector
• Quad Tech Decade Resistor
• Fluke 719 Pro Pressure Calibrator
• Piecal Thermocouple Tester
• Altek loop Calibrator
• Fluke 45 Dual Display Multi-meter
• Hart Scientific Temperature Bath
• Miller Bobcat 225 Welding Machine
• Miller Bobcat 250 Welding Machine
• Hytorc Hydraulic Torque Wrench System
• Milwaukee Electric Mag-base drill press
• Ryobi portable pressure washer
• Miller Filtair 130 Welding Fume Extractor
• Miller CST 280 Welding Machine
• Goodway RAM-4 Tube Cleaning Machine
• Goodway Cooling Tower Vacuum System
• Vestil 2,000 lb. Capacity Aluminum A Frame
• Vestil 4,000 lb. Capacity Aluminum A Frame
• Vestil 8,000 lb. Capacity Steel A Frame
• 2,000 lb. Capacity Electric Chain Hoist
• 1,000 lb. Capacity Electric Chain Hoist
• 3 – Bucks of scaffolding with braces, safety pins, handrails, walk boards and kick plates
• Hyster Model S50XM Lift Truck
• Buffalo Vaneaxial Exhaust Fan
• Generac XG 10000E Generator
• H&H Pump Com Hydraulic Powered Dewatering Pump (Green Machine)
• Trane 3,400 lb. Refrigerant Recovery Tank
• Service First Refrigerant Recovery Machine
-85-

• Distribution Truck hand tools, cones, pry bars, hoses, pumps, etc.
• Phillips AED & cabinet
• Epson Video Projector
• 5-OKI desk top printers
• 2-HP printers
• 27” JVC TV
• JVC VCR/DVR
• Poulan Push Mower
• Echo Weed eater
• Echo back pack blower
• 2 – Kerosene torpedo heaters
• Ricoh Copier (Leased)
-86-


