133
FISCAL YEAR 2018 QUARTER 2 REPORT January 1 to March 31, 2018 With Semi-Annual Indicators for October 1, 2017 through March 31, 2018
FISCAL YEAR 2018
QUARTER 2 REPORT January 1 to March 31, 2018
With Semi-Annual Indicators for October 1, 2017
through March 31, 2018


DISCLAIMER The authors’ views expressed in this publication do not necessarily reflect the views of the U.S. Agency for International
Development or the U.S. government.
FISCAL YEAR 2018
QUARTER 2 REPORT January 1 to March 31, 2018
With Semi-Annual Indicators for October 1, 2017
through March 31, 2018
Contract No. AID-OAA-1-15-00004

GHSC-PSM Quarter 2 Report, Fiscal Year 2018 | ii

GHSC-PSM Quarter 2 Report, Fiscal Year 2018 | iii
CONTENTS
EXECUTIVE SUMMARY .............................................................................................. 1
A. INTRODUCTION ................................................................................................. 3
A1. Background ............................................................................................................ 4
A2. About This Report ................................................................................................ 4
B. PROGRESS BY HEALTH AREA ......................................................................... 5
B1. HIV/AIDS ............................................................................................................... 5
In Brief ..........................................................................................................................................................5
Working to Achieve the First 90: Diagnosis .......................................................................................6
Working to Achieve the Second 90: Treatment ................................................................................7
Working to Achieve the Third 90: Viral Load Suppression.......................................................... 10
Collaborating to Achieve Voluntary Medical Male Circumcision Targets................................. 11
Strategic Sourcing of HIV Commodities ............................................................................................ 11
Improving Supply Chain Visibility ........................................................................................................ 12
B2. Malaria ................................................................................................................. 13
In Brief ....................................................................................................................................................... 13
Country Support ..................................................................................................................................... 13
Distribution Support .............................................................................................................................. 16
Commodity Procurement, Sourcing, and Delivery ......................................................................... 18
B3. Family Planning and Reproductive Health ....................................................... 20
In Brief ....................................................................................................................................................... 20
Addressing PRH Priorities .................................................................................................................... 20
Commodity Procurement ..................................................................................................................... 23
Sourcing ..................................................................................................................................................... 23
Country Support ..................................................................................................................................... 24
B4. Maternal, Newborn, and Child Health .............................................................. 26
In Brief ....................................................................................................................................................... 26
Improving Availability of Data on MNCH Commodities............................................................... 27
Providing Technical Leadership in MNCH ........................................................................................ 28
B5. Other Emerging Health Threats ....................................................................... 30
In Brief ....................................................................................................................................................... 30
Supporting the Zika Response ............................................................................................................. 30
Addressing Ebola Legacy Waste in Guinea ....................................................................................... 30
C. PROGRESS BY OBJECTIVE .............................................................................. 32
C1. Global Commodity Procurement and Logistics .............................................. 32

GHSC-PSM Quarter 2 Report, Fiscal Year 2018 | iv
In Brief ....................................................................................................................................................... 32
C1a. Global Supply Chain: Focused on Safe, Reliable, Continuous Supply ........................... 32
Ensuring Supply Timeliness and Velocity ........................................................................................... 33
Providing Better Visibility into Data and Use of Data .................................................................... 34
Gaining More Health Through Better Value .................................................................................... 34
C1b. Project Performance ................................................................................................................. 36
Timeliness of Delivery ........................................................................................................................... 37
Cycle Time ................................................................................................................................................ 38
Total Landed Cost .................................................................................................................................. 39
C2. Systems Strengthening Technical Assistance .................................................. 41
In Brief ....................................................................................................................................................... 41
C2a. Activities and Achievements ................................................................................................... 42
Workforce Development ..................................................................................................................... 43
Management Information Systems ...................................................................................................... 44
Warehousing and Distribution ............................................................................................................ 45
Leadership, Governance, and Procurement ..................................................................................... 46
Country-Level Process Improvement ................................................................................................ 47
Forecasting and Supply Planning .......................................................................................................... 48
C2b. Project Performance ................................................................................................................. 49
Percentage of Countries Conducting Quarterly Supply Plan Updates ...................................... 49
C3. Global Collaboration .......................................................................................... 51
In Brief ....................................................................................................................................................... 51
C3a. Activities and Achievements ................................................................................................... 51
Strategic Engagement ............................................................................................................................. 51
Research and Innovation ....................................................................................................................... 52
Building Awareness and Advocacy for Change in Supply Chain Issues ...................................... 53
Collaborating Across GHSC-PSM Health Areas ............................................................................. 55
Collaborating with Other GHSC Projects ........................................................................................ 56
C3b. Project Performance ................................................................................................................. 57
People Trained ......................................................................................................................................... 57
Annex A. M&E Indicators ......................................................................................... A1
GHSC-PSM Quarter 2 Report, Fiscal Year 2018 | v
ACRONYMS
3PL third-party logistics
ACT artemisinin-based combination therapy
ALu artemether-lumefantrine
ART antiretroviral therapy
ARTMIS Automated Requisition Tracking Management Information System
ARV antiretroviral
ASAQ artesunate + amodiaquine
BI&A Business Intelligence and Analytics
CAPeT Commodity Accountability Performance Tracking
CARhs Coordinated Assistance for Reproductive Health Supplies
CDC U.S. Centers for Disease Control and Prevention
CHAI Clinton Health Access Initiative
COP Country Operational Plan
CYP couple years of protection
DMPA IM depot medroxyprogesterone acetate intramuscular
DRC Democratic Republic of the Congo
DTG dolutegravir
eLMIS electronic logistics management information system
EPA Environmental Protection Agency
EUV end-use verification
FASP forecasting and supply planning
FP/RH family planning/reproductive health
FY fiscal year
GDSN Global Data Synchronization NetworkTM
GHSC-PSM Global Health Supply Chain Program-Procurement and Supply Management
HSCSS health supply chain systems strengthening
IDIQ indefinite delivery, indefinite quantity
LabEQIP Laboratory Efficiency and Quality Improvement Planning
LLIN long-lasting insecticide-treated net
M&E monitoring and evaluation
MCH maternal and child health
MNCH maternal, newborn, and child health
MOP Malaria Operational Plan
NMCP National Malaria Control Program
OC oral contraceptive
OGAC Office of the U.S. Global AIDS Coordinator and Health Diplomacy
ORS oral rehydration salt
OTD on-time delivery
OTIF on-time in-full delivery
PEPFAR U.S. President’s Emergency Plan for AIDS Relief
PMI U.S. President’s Malaria Initiative

GHSC-PSM Quarter 2 Report, Fiscal Year 2018 | vi
PPMR Procurement Planning and Monitoring Report
PPMR-HIV Procurement Planning and Monitoring Report – HIV/AIDS
PPMRm Procurement Planning and Monitoring Report – malaria
PSBI possible severe bacterial infection
Q quarter
QA quality assurance
RDC regional distribution center
RDT rapid diagnostic test
RHSC Reproductive Health Supplies Coalition
RTK rapid test kit
SKU stock-keeping unit
SP sulphadoxine-pyrimethamine
TLD tenofovir, lamivudine, dolutegravir
TO task order
UMPP unusable medical and pharmaceutical product
UNAIDS Joint United Nations Programme on HIV/AIDS
UNFPA United Nations Population Fund
UNICEF United Nations Children’s Fund
UNOPS United Nations Office for Project Services
VAN Visibility Analytics Network
VMMC voluntary medical male circumcision
WAHO West African Health Organization
WHO World Health Organization

GHSC-PSM Quarter 2 Report, Fiscal Year 2018 | 1
EXECUTIVE SUMMARY
The USAID Global Health Supply Chain Program-Procurement and Supply Management (GHSC-
PSM) project is pleased to present this report summarizing our work and performance for Fiscal
Year 2018 (FY18) Quarter 2 (Q2). We describe here our work to provide lifesaving
commodities and to build efficient, reliable, and cost-effective health supply chains to deliver
health products for the U.S. President’s Emergency Plan for AIDS Relief (PEPFAR), the U.S.
President’s Malaria Initiative (PMI), USAID’s population and reproductive health (PRH) program,
and USAID’s maternal and child health (MCH) program.
GHSC-PSM Results
In this reporting period (January through March 2018),
GHSC-PSM:
Procured $301 million and delivered $187 million
in health commodities, an increase of $43.8
million and $11.3 million, respectively, over Q1
Achieved 73 percent on-time delivery (OTD) this
quarter
Improved our on-time in-full (OTIF) rate to 67
percent
Reduced overall cycle time across health areas
and fulfillment methods by 5 percent since last
quarter
Attained overall supply chain costs of 13.9
percent and logistics costs of 9.12 percent of the
total U.S. dollar delivered for the last half year
Expanded our country presence to 32 field offices, adding Mali to the countries we
support
Over the life of the project, we have procured more than $1 billion in health commodities. The
scale of just a subset of our deliveries is summarized in the box above.
Our OTD averaged 73 percent for Q2 (versus 72 percent for Q1), which represents steady
performance but not yet achievement of our FY18 target of 80 percent (see Exhibit 1 on the
next page). Our backlog of late orders is down 14 percent from Q1, and now comprises 4.3
percent of annual volume. Our OTIF rate increased significantly in Q2, reflecting the reduction
in our backlog, and, at 67 percent, is converging on our OTD rate. Our OTD and OTIF rates
and reduced backlog provide evidence of the overall sustained success of our process
improvements. We note, however, that our performance with regard to malaria deliveries (46
percent OTD) is lagging, and improving the timeliness of our delivery of malaria products is a
major focus of ongoing process assessment and improvement.
To date, GHSC-PSM has
delivered:
Antiretroviral therapy (ART) to
provide more than 2.5 million
person-years of HIV
treatment
Antimalarials to treat nearly
74 million infections
Contraceptives to provide
28 million couple years of
protection (CYP)
(See Annex A for an explanation of
the methodology used to calculate
these numbers.)

GHSC-PSM Quarter 2 Report, Fiscal Year 2018 | 2
Exhibit 1. OTD and OTIF Over the Last Three Quarters
Other major performance indicators are also improving, including overall landed cost, or the
total cost of freight, warehousing, insurance, and headquarters associated with delivering one
U.S. dollar of product. These decreased 34 percent from 21.02 percent in FY17 to 13.94
percent for the first half of FY18. These are now $0.14 per U.S. dollar of commodity
delivered. Logistics costs are 9.12 percent of the total U.S. dollar delivered for the last half year.
Meeting Global Health Objectives. GHSC-PSM continued to contribute meaningfully to our
clients’ global health objectives this quarter.
HIV. We supported 22 countries that offer treatment to millions of patients in transitioning to
the new fixed-dose combination tenofovir/lamivudine/dolutegravir (TLD) as their first-line
regimen for people living with HIV/AIDS. The transition fulfills the World Health Organization’s
(WHO’s) latest clinical recommendations and reflects an urgent priority of PEPFAR under
Ambassador Deborah Birx. GHSC-PSM supported USAID’s involvement in the ST3, an
interagency group tasked with ensuring U.S. government support for a rapid transition to TLD.
Given the limited number of approved suppliers and unpredicted challenges in their ability to
produce promised stock, GHSC-PSM’s timely placement, at USAID’s request, of TLD orders
well in advance of the rapid increase in country demand was well advised. We maintained
excellent supplier relations to help ensure supply and helped countries incorporate planning for
the TLD transition in their work plans to decrease risk and manage demand.
GHSC-PSM also worked to help improve availability of HIV rapid test kits (RTKs), which are
procured under the separate GHSC-RTK contract. In addition to helping countries forecast and
quantify the number of RTKs they need, we conducted a survey of countries to identify issues
influencing RTK availability. Major actionable findings from the survey are the need for improved
stock management planning practices and for close coordination of service delivery activities
with the procurement process. These findings, coupled with PEPFAR’s emphasis on index
testing1 and the yield of HIV testing, will inform strategies and technical support activities to
strengthen country RTK forecasting and quantification and overall supply chain performance.
1 Index testing is the practice of testing family members and partners of people diagnosed with HIV.
31%
72% 73%
32%
49%
67%
0%
20%
40%
60%
80%
100%
OTD

GHSC-PSM Quarter 2 Report, Fiscal Year 2018 | 3
Malaria. Substantiated by evidence provided by GHSC-PSM, PMI is standardizing its long-lasting
insecticide-treated net (LLIN) procurements through SKU rationalization and discouraging
customization. This will produce opportunities for improved supply chain performance
and flexibility, leading to savings in lead time and costs.
PRH. GHSC-PSM began implementing a five-year sourcing strategy for family planning and
reproductive health (FP/RH) commodity procurements, including contracting a new oral
contraceptives supplier.
MNCH. GHSC-PSM continued its work on improving the appropriate management of oxytocin.
We participated in finalizing and disseminating the oxytocin advocacy messaging framework in
collaboration with PATH and the Reproductive Health Supplies Coalition (RHSC). We worked
with the group of experts that participated in the oxytocin evidence review meeting last quarter
to draft a journal article on the evidence around management of oxytocin and quality.
Increasing Data Visibility. Across health areas, GHSC-PSM continues to collect, manage, and
share data on commodity availability as a global good. Most notably, we are working to bring
visibility to hidden portions of country supply chains. For example, in addition to continuing to
provide valuable information on the availability and use of malaria commodities, the new version
of the End Use Verification (EUV) survey will provide information on maternal, newborn, and
child health (MNCH) commodities in many facilities for the first time. GHSC-PSM also made
progress in getting information on stock levels and distribution patterns in countries like South
Sudan, which does not have a functioning logistics management information system (LMIS).
Innovating in Procurement. GHSC-PSM continues to implement new ways to use
competitive, commercial approaches to supplier contracting to maximize value to the U.S.
Government and supported countries. This quarter, we incorporated trade packaging services
into a contract, a first for a USAID contract and a boon to social marketing programs. We
concluded a demanding competition for transport that selected best value options for more
than 2,500 lanes. We concluded long-term agreements for male condoms, personal lubricant,
and oral contraceptives, and evaluated best-and-final offers for malaria rapid diagnostic tests.
GHSC-PSM also released solicitations for long-term agreements for ARVs, VMMC kits, 218
standard essential medicines, one- and two-rod implants, and IUDs.
Collaborating Globally. The scale, scope, and complexity of managing a global supply chain
require our collaboration with many global and local partners to ensure the availability of health
commodities. We contributed evidence to inform development of global guidelines and data to
support global efforts to allocate product to meet countries’ needs. We worked to achieve
common standards with other donors (e.g., in packaging, in service requirements) to enable
more rational, efficient, and large-scale contracting for supplies and services. In all these
initiatives, we provided critical information on supply chain considerations that can make the
difference between success and failure of global health programs. By integrating our work across
health sectors and sharing information, resources, activities, and capabilities, we can achieve
together what we could never achieve alone.
GHSC-PSM Quarter 2 Report, Fiscal Year 2018 | 4
SECTION A
INTRODUCTION
A1. Background
The USAID GHSC-PSM project works to ensure uninterrupted supplies of health commodities
to save lives and to create a healthier future for all. The project directly supports five global
health areas of importance to the U.S. government:
The U.S. President’s Emergency Plan for AIDS Relief to help reach the Joint United
Nations Programme on HIV/AIDS (UNAIDS) global 90-90-90 HIV/AIDS testing,
treatment, and viral load suppression targets
The U.S. President’s Malaria Initiative to reduce malaria deaths and substantially
decrease malaria morbidity, towards the long-term goal of elimination
USAID’s Population and Reproductive Health program to ensure that key reproductive
health commodities are available for safe and reliable family planning
USAID’s maternal and child health program to prevent child and maternal deaths
Other public health threats as they emerge, with support for Zika at this time
The project purchases and delivers health commodities, offers comprehensive technical
assistance to strengthen national supply chain systems, and provides global supply chain
leadership to ensure that lifesaving health supplies reach those most in need.
A2. About This Report
We are pleased to present our performance report for FY18 Q2 (January 1 through March 31).
This report includes calculations of all required quarterly and semiannual metrics from the
project’s monitoring and evaluation (M&E) plan.
GHSC-PSM is a matrixed project that integrates work across two axes: health areas and
technical objectives. To reflect our work in each of these areas, the report is organized as
follows:
Section B summarizes major activities in each of the five health areas (HIV/AIDS,
malaria, PRH, MNCH, and other public health threats).
Section C describes activities under each of the three main technical objectives
(global commodity procurement and logistics, systems strengthening, and global
collaboration). Because our M&E indicators are structured around our objectives, in
Section C we also discuss key indicator results.
Annex A provides performance and context indicators for January 1 through
March 31, 2018 (quarterly indicators) and for October 1, 2017 through March 31, 2018
(semi-annual indicators).
Given the size and complexity of GHSC-PSM, this report summarizes our primary efforts this
quarter and reflects only a fraction of the project’s efforts each day to help people around the
world live healthier lives.
GHSC-PSM Quarter 2 Report, Fiscal Year 2018 | 5
SECTION B
PROGRESS BY HEALTH AREA
In this section, we summarize GHSC-PSM’s support for each of the five health areas (HIV/AIDS,
malaria, PRH, MNCH, and other public health threats) over the last quarter.
B1. HIV/AIDS
In Brief
26 countries procured HIV/AIDS commodities and
30 countries received systems strengthening
support with HIV/AIDS funding under the contract
this quarter.
GHSC-PSM continues to support the achievement of
PEPFAR goals by ensuring that country supply chains
support the transition of patients on antiretrovirals (ARVs)
to the preferred drug, TLD. The project has also supported
USAID Missions as they develop country operational plans
(COPs) for 2018.
We concluded a study on challenges in maintaining
continuous supply of rapid test kits (RTKs) and
continued supporting viral load testing scale-up.
Procurement of HIV/AIDS
Commodities
FY18 Q2:
$200 million
including $123 million in ARVs
Life of Project:
$836 million
including $534 million in ARVs
----------------
We have delivered enough ARVs
to provide 2.5 million person-
years of HIV treatment.
We undertook sourcing activities for ARVs, lab equipment and supplies, voluntary medical
male circumcision (VMMC) kits, essential medicines, and male condoms and lubricants.
We expanded efforts to enhance visibility into country stocks of HIV commodities
through the Procurement Planning and Monitoring Report-HIV (PPMR-HIV). We are exploring
ways to extend visibility into lower levels of the supply chain.
GHSC-PSM supports the PEPFAR goal of controlling the HIV/AIDS epidemic. With PEPFAR
funding, we work to help countries achieve epidemic control under the UNAIDS 90-90-90
framework — so that 90 percent of people living with HIV know their status, 90 percent of
people who know their status are on treatment, and 90 percent of people on treatment have
suppressed viral loads.
The project provided technical assistance to 30 countries to strengthen national supply chains
and improve health commodity availability. GHSC-PSM is actively supporting PEPFAR’s strategy
for 2017 to 2020, which focuses on 13 priority high-burden countries. These countries are
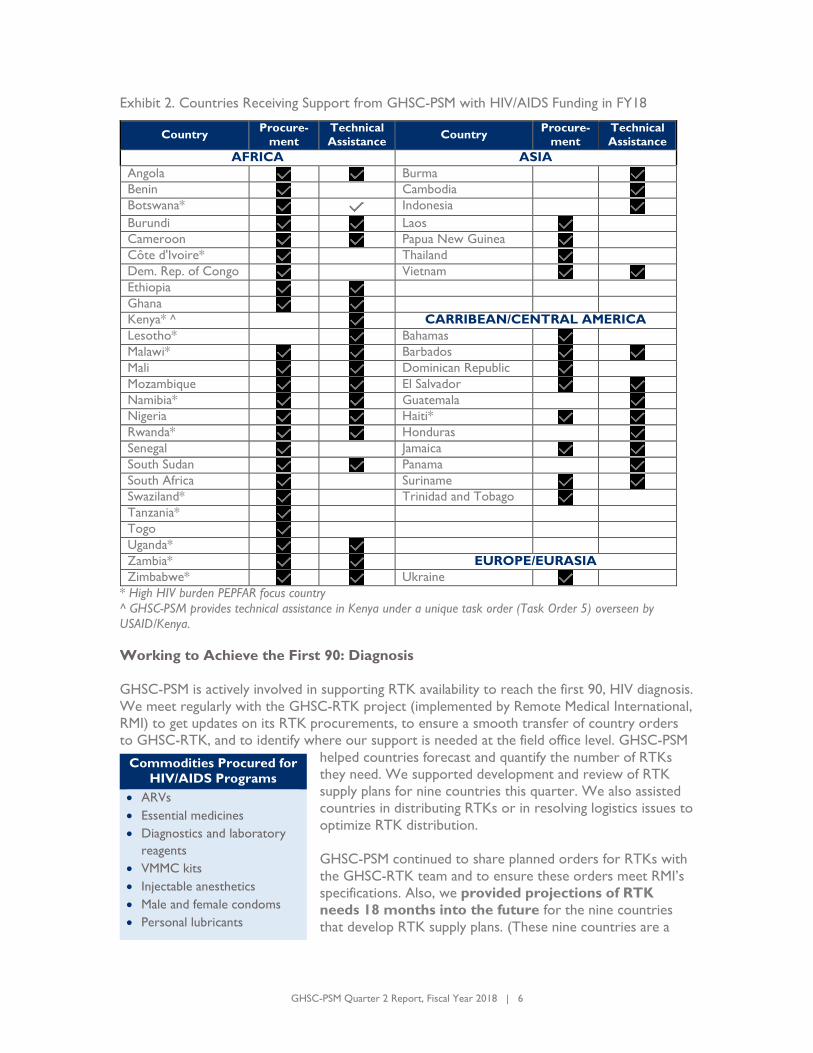
indicated by an asterisk in Exhibit 2.
GHSC-PSM Quarter 2 Report, Fiscal Year 2018 | 6
Exhibit 2. Countries Receiving Support from GHSC-PSM with HIV/AIDS Funding in FY18
Country Procure-
ment
Technical
Assistance Country
Procure-
ment
Technical
Assistance
AFRICA ASIA
Angola Burma Benin Cambodia Botswana* Indonesia Burundi Laos
Cameroon Papua New Guinea
Côte d'Ivoire* Thailand
Dem. Rep. of Congo Vietnam Ethiopia
Ghana
Kenya* ^ CARRIBEAN/CENTRAL AMERICA
Lesotho* Bahamas
Malawi* Barbados Mali Dominican Republic
Mozambique El Salvador Namibia* Guatemala Nigeria Haiti* Rwanda* Honduras Senegal Jamaica South Sudan Panama South Africa Suriname Swaziland* Trinidad and Tobago
Tanzania*
Togo
Uganda*
Zambia* EUROPE/EURASIA
Zimbabwe* Ukraine
* High HIV burden PEPFAR focus country
^ GHSC-PSM provides technical assistance in Kenya under a unique task order (Task Order 5) overseen by
USAID/Kenya.
Working to Achieve the First 90: Diagnosis
GHSC-PSM is actively involved in supporting RTK availability to reach the first 90, HIV diagnosis.
We meet regularly with the GHSC-RTK project (implemented by Remote Medical International,
RMI) to get updates on its RTK procurements, to ensure a smooth transfer of country orders
to GHSC-RTK, and to identify where our support is needed at the field office level. GHSC-PSM
helped countries forecast and quantify the number of RTKs
they need. We supported development and review of RTK
supply plans for nine countries this quarter. We also assisted
countries in distributing RTKs or in resolving logistics issues to
optimize RTK distribution.
GHSC-PSM continued to share planned orders for RTKs with
the GHSC-RTK team and to ensure these orders meet RMI’s
specifications. Also, we provided projections of RTK
needs 18 months into the future for the nine countries
that develop RTK supply plans. (These nine countries are a
Commodities Procured for
HIV/AIDS Programs
ARVs
Essential medicines
Diagnostics and laboratory
reagents
VMMC kits
Injectable anesthetics
Male and female condoms
Personal lubricants
GHSC-PSM Quarter 2 Report, Fiscal Year 2018 | 7
major source of demand for RTKs,
accounting for 70 percent of RTKs
delivered to date by GHSC-RTK). This
helps GHSC-RTK plan its procurements
with manufacturers and helps ensure test
kit availability.
In Q1, GHSC-PSM conducted a 47
question, open-ended, multiple-choice
country program survey to better
understand GHSC-PSM’s role in
supporting the supply chain for RTKs and
to identify issues hindering countries'
ability to provide testing services. The
survey had an 85 percent response rate (22 out of 26 countries completed the survey). This
quarter, we analyzed and presented the survey results to USAID. Findings noted correlations,
not causality. Two key findings of the survey were:
In those countries experiencing RTK stockouts, reasons included delayed shipments and
inefficient distribution as well as a need for improved stock management
planning practices.
There is a need to coordinate service delivery activities more closely with the
procurement process. Fifty-eight percent of responding countries test through
unplanned campaigns, and 43 percent of those countries that responded reported
stockouts at all levels in the last two years. Most countries hold campaigns to promote
HIV testing, but information on campaigns is not always shared with the entities
responsible for providing the RTKs.
These findings and PEPFAR’s emphasis on index testing2 will inform strategies and technical
support activities to strengthen RTK forecasting and quantification and overall supply chain
performance in several key GHSC-PSM countries. We will start planning this technical support
for countries in May 2018.
Working to Achieve the Second 90: Treatment
To help achieve treatment goals, this quarter, GHSC-PSM was heavily engaged in supporting the
planned transition to TLD. We also advanced long-term contracts for other ARVs (as described
in the strategic sourcing section below).
2 Index testing is the practice of testing family members and partners of people diagnosed with HIV.
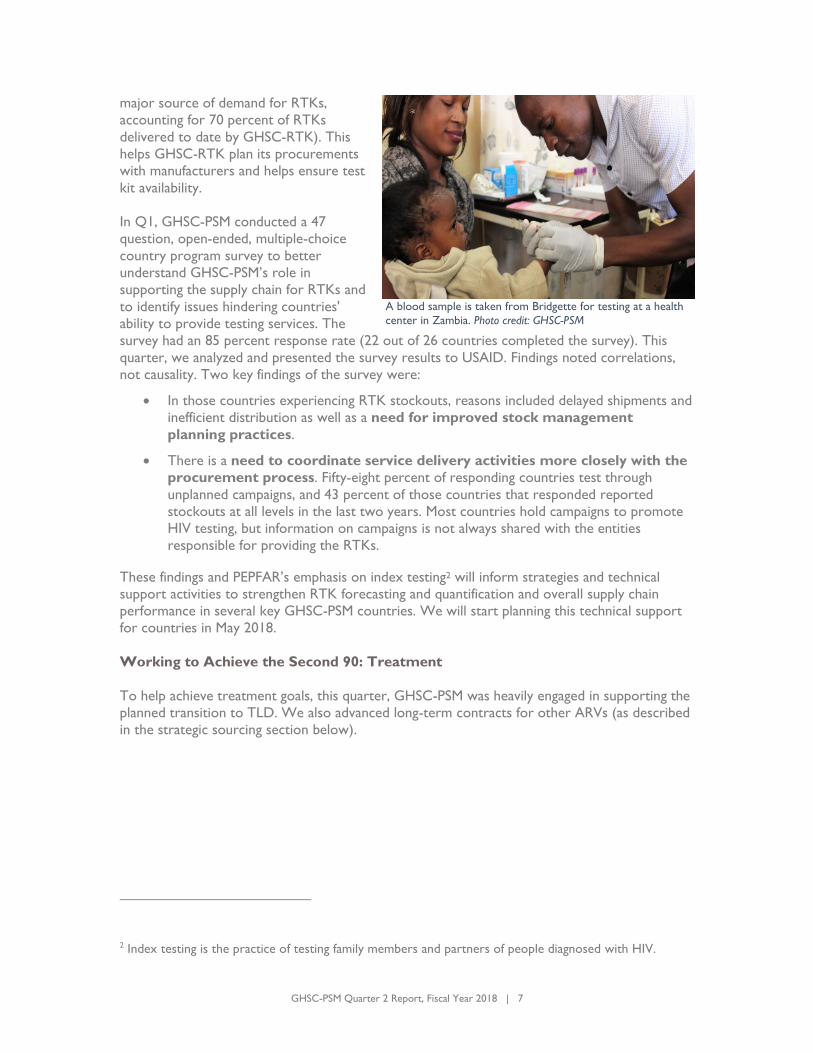
A blood sample is taken from Bridgette for testing at a health
center in Zambia. Photo credit: GHSC-PSM

GHSC-PSM Quarter 2 Report, Fiscal Year 2018 | 8
Transitioning to TLD
The World Health Organization (WHO) recommends TLD as an alternative first-line regimen
due to its clinical benefits, which include improved tolerability, higher antiretroviral efficacy,
lower rates of treatment discontinuation, a higher genetic barrier to resistance, and fewer drug
interactions than other ARVs. PEPFAR aims to transition all its funded countries to using TLD as
the preferred first-line regimen over the next 18 months. GHSC-PSM is actively supporting
22 countries, which offer treatment to millions of patients, in transitioning to TLD.
Honing the Strategy
GHSC-PSM worked in close collaboration with USAID in developing a TLD strategy to
anticipate and mitigate challenges that emerge with the large-scale rollout of any new product,
including TLD. The strategy for TLD comprises:
Engaging with TLD manufacturers to continually update our information on their
production capacity
Conducting updated country demand forecasts and mapping these against supplier
capacity to ensure forward planning for more than a dozen countries
Continuously monitoring market health through updates on supplier approvals to
produce TLD, country registrations, and supplier production capacity
Preparing for rapid order fulfillment
Conducting periodic inventory analytics to support TLD ramp-up
Conducting inventory analytics to support the drawdown of legacy ARV products to
prevent wastage
Engaging directly with each GHSC-PSM-supported country regarding its TLD transition
plan and supporting use of the quantification tool
Communicating actively with other major buyers through USAID (e.g., the Global Fund
and countries like Kenya and South Africa that do not procure commodities through
GHSC-PSM) to gain as much visibility as possible into the timing and quantity of their
planned orders
Placing orders with suppliers, in consultation with USAID and other U.S. government
agencies, to reflect country prioritization of the Office of the U.S. Global AIDS
Coordinator and Health Diplomacy (OGAC)
An important aspect of the strategy, at USAID’s
request, was to place orders for TLD well in
advance of the rapid increase in country
demand (see box). Given the limited number of
approved suppliers, supplier delays, and
unpredicted challenges in their ability to produce
promised stock, this critical part of the strategy
has paid off over the quarter. The TLD
transition has had and will continue to require
excellent supplier relations and frequent
Early USAID TLD Orders Through
GHSC-PSM Stimulate Supplier
Production
“The ‘early’ orders placed by GHSC-PSM
have been essential and instrumental in
jump-starting production of DTG active
pharmaceutical ingredient and TLD
finished packs. We very much appreciate
your efforts to place and follow through
on these essential early stocking orders.”
Alan Staple
Clinton Health Access Initiative (CHAI)

GHSC-PSM Quarter 2 Report, Fiscal Year 2018 | 9
communication with countries to decrease risk and ensure supply.
GHSC-PSM brought these considerations to an interagency TLD Global Strategy meeting on
March 9. Attendees included U.S. government agency staff working on the TLD transition from
the USAID Office of HIV/AIDS and its Supply Chain for Health division, the U.S. Centers for
Disease Control and Prevention (CDC), and OGAC. The project shared data on TLD demand
in relation to global supply, the dates when countries plan to start their transitions to TLD, and
quantities of legacy ARVs (i.e., existing ARV stock) that need to be used before shifting patients
to TLD. Attendees developed scenarios for meeting demand based on projected global supply,
allocating various quantities of TLD to countries by projected transition dates. The projected
start of each country’s transition depended on how advanced the country’s TLD transition plan
is, the quantity of its legacy stock, and whether TLD is already included in the country’s national
treatment guidelines.
Based on the data provided at the meeting, OGAC developed and communicated a strategy for
transitioning countries to TLD, including the dates when TLD will be provided to each country,
and the quantities to be provided. GHSC-PSM is following up with countries to help them revise
their transition plans and will review those plans in early April. In the meantime, GHSC-PSM is
helping countries ensure an adequate stock of legacy first-line ARVs to avoid treatment
interruption until the new TLD is in stock. We are working closely with USAID and suppliers,
where possible, to cancel previous orders for ARVs that are being replaced by orders for TLD.
We also are helping countries comply with the PEPFAR policy to decrease the use of
nevirapine-containing adult ARVs as expeditiously as possible.
Ramping Up: Ensuring Supply Meets Demand
GHSC-PSM serves as the interface between suppliers and countries to ensure TLD supply
and demand align. Given that supplier capacity is less than previously projected, we are
helping countries modify their TLD transitions plans. This will change over time, and we are in
daily touch with USAID and the approved suppliers to match country demand with supply. A
TLD transition working group of USAID and GHSC-PSM market dynamics, strategic sourcing,
forecasting and supply planning, warehousing, commodity security, system strengthening, and
procurement experts continues to meet weekly and on an ad hoc basis.
As noted, GHSC-PSM is in frequent discussion with the two U.S. Food and Drug Administration
(FDA)-approved suppliers of TLD to monitor their available stock and production plans. GHSC-
PSM developed and maintains a regularly updated tracker of TLD supply and demand, which is
shared with USAID in real time. The project also monitors suppliers’ efforts to obtain FDA
approval of their products, following progress in their dossier submissions and other steps in the
FDA approval process.
Preparing Countries
GHSC-PSM is supporting USAID/Washington and in-country Missions to manage TLD transition
in PEPFAR countries. Complementing GHSC-PSM’s work with suppliers and with USAID on
country allocations, we have kept our field offices fully informed about the TLD
situation through frequent communications. During this quarter, we sent field offices a TLD
Country Program Guidance and Checklist; an updated note on TLD, including approved
suppliers; and an update about the original list of OGAC-prioritized countries to begin the
transition.
GHSC-PSM Quarter 2 Report, Fiscal Year 2018 | 10
Working to Achieve the Third 90: Viral Load Suppression
Reaching the third 90 requires scaling up viral load monitoring of patients on ART. Viral load
monitoring indicates whether a patient’s treatment is effective. A suppressed viral load
decreases the likelihood of transmitting HIV to a partner, which is critical to decreasing new
HIV infections and ultimately stemming the HIV epidemic.
GHSC-PSM continues to support countries with the challenges that can occur when scaling up
viral load testing. Challenges can range from low utilization and breakdowns of instruments
(with limited servicing and maintenance available) to breaks in the cold chain during reagent
delivery. In Q2, the project continued to work closely with USAID, the CDC, and the Global
Fund to pursue a viral load scale-up strategy that is rooted in laboratory optimization, ensures
consistency in prices paid by countries for lab commodities to the extent possible, improves the
consistency of the products provided, and improves on-time delivery.
GHSC-PSM advocates for a network as opposed to a traditional approach to lab procurement.
Using reagent rental and all-inclusive procurement, this approach translates into a lower and
predictable price per test, easier budgeting, higher supplier performance, greater
coordination, transfer of risk to the manufacturer/distributor, and other benefits.
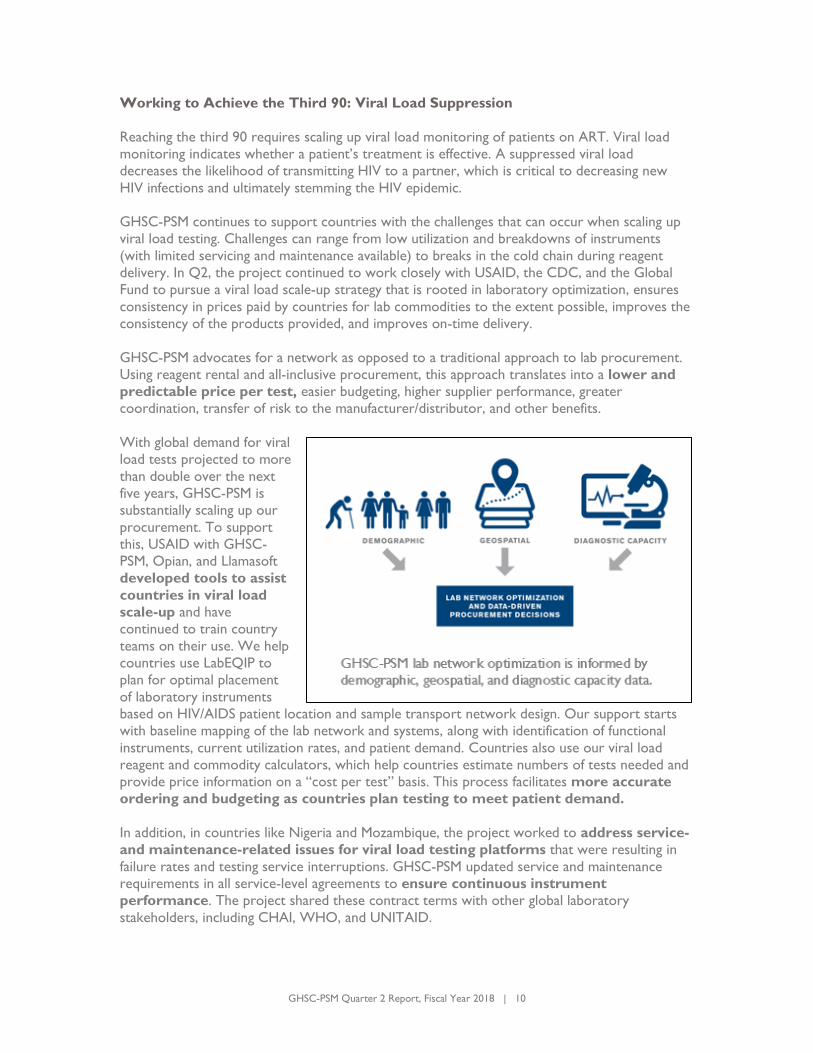
With global demand for viral
load tests projected to more
than double over the next
five years, GHSC-PSM is
substantially scaling up our
procurement. To support
this, USAID with GHSC-
PSM, Opian, and Llamasoft
developed tools to assist
countries in viral load
scale-up and have
continued to train country
teams on their use. We help
countries use LabEQIP to
plan for optimal placement
of laboratory instruments
based on HIV/AIDS patient location and sample transport network design. Our support starts
with baseline mapping of the lab network and systems, along with identification of functional
instruments, current utilization rates, and patient demand. Countries also use our viral load
reagent and commodity calculators, which help countries estimate numbers of tests needed and
provide price information on a “cost per test” basis. This process facilitates more accurate
ordering and budgeting as countries plan testing to meet patient demand.
In addition, in countries like Nigeria and Mozambique, the project worked to address service-
and maintenance-related issues for viral load testing platforms that were resulting in
failure rates and testing service interruptions. GHSC-PSM updated service and maintenance
requirements in all service-level agreements to ensure continuous instrument
performance. The project shared these contract terms with other global laboratory
stakeholders, including CHAI, WHO, and UNITAID.

GHSC-PSM Quarter 2 Report, Fiscal Year 2018 | 11
Collaborating to Achieve Voluntary Medical Male Circumcision Targets
GHSC-PSM provides procurement support to PEPFAR's VMMC program. On January 24,
GHSC-PSM hosted the USAID Office of HIV/AIDS VMMC biannual headquarters partner
meeting. This meeting brought together staff from USAID and implementing partners who
support VMMC service delivery with PEPFAR funding. Participants discussed key programmatic
challenges to achieving VMMC program goals, including the need for procurement
standardization, and identified potential solutions and next steps. GHSC-PSM presented data on
countries’ procurement of anesthetics and of VMMC kits by type, supply plan coverage, product
prices, and lead times to inform partners’ supply planning. We also highlighted the gap in
information on demand for VMMC kits in many countries that limits our ability to optimally
stock kits, develop sourcing strategies, avoid emergency orders, and avoid service disruptions
that hinder achieving VMMC targets. In order to mitigate the risk of having poor demand data,
GHSC-PSM provides technical assistance to countries to conduct VMMC quantification and
supply planning exercises. Sensitization of implementing partners to the need for demand data
with sufficient lead time for procurement was part of GHSC-PSM’s message at the partners’
meeting.
In Q2, GHSC-PSM also published a VMMC Reference Guide
(http://www.ghsupplychain.org/resources/) that provides an overview of PEPFAR-approved kit
types and components, as well as guidance for ordering, prices, and lead times.
Strategic Sourcing of HIV Commodities
In Q2, GHSC-PSM released solicitations and started evaluating bids for a broad range of
commodities used in HIV programs. The new contracts will expand the supplier base and
reduce procurement lead times by three to four weeks. Several of these solicitations require
vendor-managed inventory, by which vendors maintain an inventory of products purchased by
the project that can be picked up when needed. This reduces order fulfillment time because
suppliers distribute this inventory rather than manufacturing product for each individual order.
Vendor-managed inventory also reduces the need for (and costs of) GHSC-PSM to manage
inventory of these products in our regional distribution centers (RDCs).
Below we summarize the range of HIV products for which we conducted strategic sourcing activities
in Q2. For each, we defined product requirements, developed strategies to address any challenges
associated with that commodity group, released a solicitation, and started evaluating offers:
ARVs. While PEPFAR is encouraging all countries to transition to TLD, other ARVs are
still needed to meet demand until TLD is available. They are needed also for those who
require alternative second- and third-line regimens because they cannot tolerate one of
the drugs in the TLD fixed combination. GHSC-PSM also continues to procure pediatric
ARVs and is working to ensure that countries are using the optimal regimens depending
on the weight and/or age of the child. Availability of several pediatric products is an
ongoing global challenge.
VMMC kits. These contracts will expand the VMMC supplier base and will include
tiered fixed pricing that establishes firm prices based on volumes.
Essential medicines. The solicitation covers 218 standard essential medicines included in our catalog.
GHSC-PSM Quarter 2 Report, Fiscal Year 2018 | 12
Negotiation and Execution of Male Condom and Lubricant IDIQs
GHSC-PSM negotiated and executed three indefinite delivery, indefinite quantity contracts
(IDIQs) for male condoms and personal lubricants. These contracts contain requirements for
vendor-managed inventory services. Staff from GHSC-PSM, USAID, and the GHSC-Quality
Assurance project (GHSC-QA, implemented by FHI360) visited the selected male condom and
lubricant suppliers to prepare for seamless implementation of the new contracts. These new
supply contracts offer reduced product pricing, due to more competitive pricing and
dropping of the two highest-priced suppliers, and a broader range of product options to
better support USAID social marketing partners. In addition, one contract strategically leverages
supplier warehousing capacity for vendor-managed inventory services for male condoms, which
is expected to reduce transport and warehousing costs associated with maintaining stock at
GHSC-PSM’s RDCs.
Improving Supply Chain Visibility
GHSC-PSM continues to develop and expand the PPMR-HIV, a data-gathering tool and data
visualization platform focused on HIV/AIDS. Modeled on similar tools developed for
reproductive health and malaria commodities (the PPMR and PPMRm, respectively), PPMR-HIV
provides donors with data on stock status for RTKs and first- and second-line adult and
pediatric ARVs. PPMR-HIV takes stock monitoring a step further than PPMR and PPMRm, in that
PPMR-HIV includes information on stock levels below the central level. As of Q2, countries that
report HIV commodity stock status are Cameroon, Ghana, Mozambique, Nigeria, Tanzania, and
Zambia. We began onboarding Burundi, Côte d’Ivoire, Haiti, Malawi, Uganda, and Zimbabwe,
which are expected to begin reporting in Q3. Another eight countries will start reporting by the
end of the fiscal year, for a total of 20 countries, including all 13 PEPFAR priority countries.
Central to this effort has been outreach to the Global Fund to support collaborative efforts
aimed at coordinating shipments across the two major global procurers in this space. We
anticipate that this collaboration will launch formally in the coming quarter.
Reliable stock visibility is essential to the successful management of supply chains in country and
critical for commodity security tasks that take place at GHSC-PSM headquarters including order
prioritization, effective supply planning, and increasing collaboration with service delivery
partners and donors. To improve stock data visibility, GHSC-PSM has begun a monthly stock
reporting initiative aimed at collecting and reporting stock data more frequently
(working towards monthly reporting) and from the lowest possible level of the supply
chain (working towards site level stock reporting). In anticipation of revising stock-level
reporting frequency and depth, in Q2 GHSC-PSM surveyed 20 PEPFAR priority countries to
assess the availability of reliable HIV stock data. GHSC-PSM will continue efforts next quarter
including defining an action plan for improving stock data visibility for the remainder of 2018.

GHSC-PSM Quarter 2 Report, Fiscal Year 2018 | 13
B2. Malaria
In Brief
Procurement of Malaria
Commodities
FY18 Q2:
$86 million
Life of Project:
$286 million
----------------
We have delivered enough
antimalarials to treat nearly 74
million infections.
A total of 24 countries procured malaria
commodities, and 25 countries received systems
strengthening support with malaria funding under the
contract this quarter.
GHSC-PSM refined our quality assurance (QA)
approach to lower costs and lead times, while
minimizing risk and ensuring product quality.
The project supported distribution of LLINs to provide
protection from malaria for tens of millions of
people in Angola, Burundi, Ethiopia, Ghana,
Madagascar, Mali, Nigeria, and South Sudan.
The project continued to provide technical leadership
in promoting malaria commodity market health
for secure supply.
Under the PMI-funded malaria task order, GHSC-PSM supplies lifesaving prevention and
treatment medicines, rapid diagnostic tests (RDTs), and LLINs. We offer partner countries new
approaches to strategic planning, logistics, data visibility, analytics, and capacity building. We also
provide technical guidance to strengthen global supply, demand, financing, and introduction of
new malaria commodities.
In this reporting period, GHSC-PSM procured malaria commodities valued at $86 million
for 24 countries. Through technical guidance, we also are strengthening national supply
chains and improving health commodity availability in 25 countries. The countries we
support are listed in Exhibit 3 on the following page.
GHSC-PSM received confirmation that PMI intends to use the GHSC-PSM mechanism for
technical assistance for its new country programs in Cameroon and Niger. In Q2, GHSC-
PSM met with key in-country counterparts to get a deeper understanding of their existing
malaria prevention programs and health commodity supply chain systems and to obtain
stakeholder and counterpart input on priorities for supply chain systems strengthening technical
assistance. During Q2, GHSC-PSM officially established field offices and started technical support
activities in Mali and Sierra Leone.
Country Support
GHSC-PSM provided wide-ranging supply chain systems strengthening support in 25 countries in
Q2 with a focus on improving the availability of malaria commodities.
GHSC-PSM Quarter 2 Report, Fiscal Year 2018 | 14
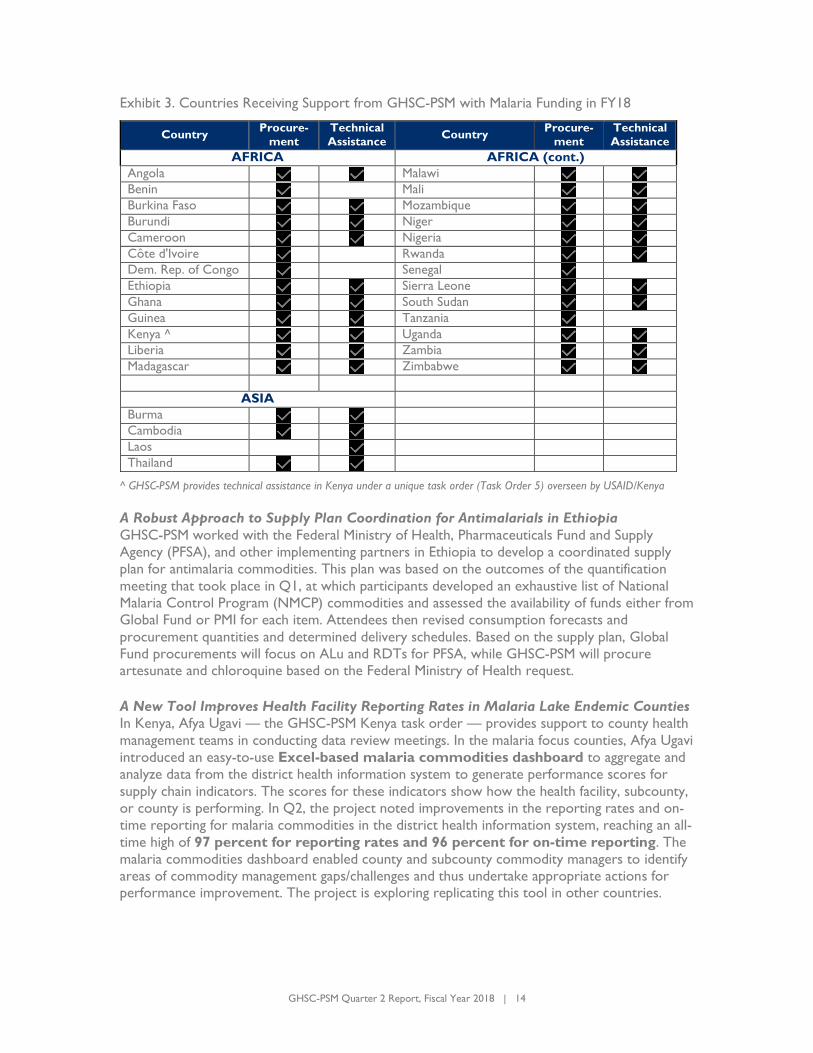
Exhibit 3. Countries Receiving Support from GHSC-PSM with Malaria Funding in FY18
Country Procure-
ment
Technical
Assistance Country
Procure-
ment
Technical
Assistance
AFRICA AFRICA (cont.)
Angola Malawi Benin Mali Burkina Faso Mozambique Burundi Niger Cameroon Nigeria Côte d'Ivoire Rwanda Dem. Rep. of Congo Senegal
Ethiopia Sierra Leone Ghana South Sudan Guinea Tanzania
Kenya ^ Uganda Liberia Zambia Madagascar Zimbabwe
ASIA
Burma
Cambodia
Laos
Thailand
^ GHSC-PSM provides technical assistance in Kenya under a unique task order (Task Order 5) overseen by USAID/Kenya
A Robust Approach to Supply Plan Coordination for Antimalarials in Ethiopia
GHSC-PSM worked with the Federal Ministry of Health, Pharmaceuticals Fund and Supply
Agency (PFSA), and other implementing partners in Ethiopia to develop a coordinated supply
plan for antimalaria commodities. This plan was based on the outcomes of the quantification
meeting that took place in Q1, at which participants developed an exhaustive list of National
Malaria Control Program (NMCP) commodities and assessed the availability of funds either from
Global Fund or PMI for each item. Attendees then revised consumption forecasts and
procurement quantities and determined delivery schedules. Based on the supply plan, Global
Fund procurements will focus on ALu and RDTs for PFSA, while GHSC-PSM will procure artesunate and chloroquine based on the Federal Ministry of Health request.
A New Tool Improves Health Facility Reporting Rates in Malaria Lake Endemic Counties
In Kenya, Afya Ugavi — the GHSC-PSM Kenya task order — provides support to county health
management teams in conducting data review meetings. In the malaria focus counties, Afya Ugavi
introduced an easy-to-use Excel-based malaria commodities dashboard to aggregate and
analyze data from the district health information system to generate performance scores for
supply chain indicators. The scores for these indicators show how the health facility, subcounty,
or county is performing. In Q2, the project noted improvements in the reporting rates and on-
time reporting for malaria commodities in the district health information system, reaching an all-
time high of 97 percent for reporting rates and 96 percent for on-time reporting. The
malaria commodities dashboard enabled county and subcounty commodity managers to identify
areas of commodity management gaps/challenges and thus undertake appropriate actions for performance improvement. The project is exploring replicating this tool in other countries.

GHSC-PSM Quarter 2 Report, Fiscal Year 2018 | 15
Commodity Accountability Performance Tracking in Malawi GHSC-PSM worked with Ministry of Health district staff in collaboration with the National
Malaria Control Program to conduct Commodity Accountability Performance Tracking (CAPeT)
visits. CAPeT is a rigorous data analysis and verification process focused on identifying
factors contributing to discrepancies between logistics data and malaria case data, reporting
malaria commodity stockouts, and working with facility staff to identify facility-specific
interventions to address highlighted gaps. This is part of ongoing efforts to improve service
delivery point accountability through reporting for malaria commodities.
Collaboration to Ensure Primary Care Facilities Receive the Commodities They Need
GHSC-PSM provided technical and operational support to malaria commodity ordering and
distribution through the Zimbabwe Assisted Pull System (ZAPS) across all 10 provinces. ZAPS
integrates the distribution of health commodities previously distributed through four parallel
systems into one system for primary-care-level facilities. The project, with NatPharm, UNICEF,
and Global Fund co-support, distributes malaria, tuberculosis, and other essential medicines.
GHSC-PSM provides direct operational support including transport services, LMIS forms, and
LMIS hardware and software for the ZAPS ordering and distribution system. Also, GHSC-PSM
covered the FY18 Q2 procurement of ACTs to accommodate the transition in Global Fund
grants to ensure continuous supply during malaria season. This coordination will ensure we
better meet the needs of the facilities and avoid stockouts and overstocks.
Supportive Supervision in Rwanda
GHSC-PSM provided supportive supervision of all 30 district pharmacies serving 586 public
health facilities. Supportive supervision is a key activity aimed at reinforcing Rwanda’s quality
management improvement approach (QMIA) at district pharmacies. Through this supervision,
the project assessed performance against key supply chain indicators, provided on-the-job
mentorship in warehousing and inventory management best practices, assessed district
pharmacy use of an electronic logistics management information system (eLMIS), and promoted
use of data at the health facilities. Logistics management information systems are used to ensure
data visibility throughout each supply chain function for decision making. The eLMIS, provides
program managers quicker access to data. By encouraging use of the eLMIS’ electronic
reports, automated workflows, and email notifications, district pharmacies can dramatically
decrease processing time for requisitions.
Data Visibility in South Sudan
GHSC-PSM is developing a visual database platform to map supply chain activities in
South Sudan. As part of this effort, the project will pilot a Juba-based call center in the coming
months. We will use routine structured phone communications — much like telemarketers in
the United States — with last-mile delivery partners and facilities to capture and aggregate stock
status information on key commodities, such as ARVs, HIV RTKs, malaria, and FP/RH products.
Unlike other countries where LMIS data are available, South Sudan’s security situation, lack of
infrastructure, and financial challenges make it all but impossible to implement complex LMIS
solutions. If successful, the call center will serve the same purpose at a fraction of the cost.
GHSC-PSM Quarter 2 Report, Fiscal Year 2018 | 16
Training Master Trainers in
Nigeria to Roll Out the
Malaria Commodity Logistics
System
GHSC-PSM trained 50
government of Nigeria
master trainers in
preparation for the rollout
of new malaria commodity
logistics system tools and
related standard operating
procedures. Over the last five
years, infrequent use of
reporting tools by service
delivery point staff resulted in
data inaccuracies and impeded
staff ability to use supply chain
management tools for decision
making. The master trainers will
go on to train local government and service delivery personnel responsible for malaria
commodity inventory management in five PMI focus states (Bauchi, Ebonyi, Plateau, Sokoto, and
Zamfara). GHSC-PSM’s training boosted participants’ skills in delivering training content using
adult learning training methodologies, which will help ensure effective implementation and use of
the new tools.
Currently, facilities use the eLMIS to place orders and capture consumption data, but they do
not use the easily generated reports and prefer to go to the district pharmacies for that analysis.
We trained the district pharmacies to conduct QMIA workshops with health facility
store managers to highlight findings from field visits, share knowledge and experience, and
discuss supply chain challenges and ways to mitigate them.
Distribution Support
In Q2, many countries launched or continued
large-scale LLIN campaigns as a key prevention
strategy. These are massive initiatives to ensure
beneficiaries, particularly in high-impact areas, receive
the nets they need in advance of the rainy season.
While the actual distributions can last just a few weeks,
logistics, supply planning, procurement, and pre-
positioning the nets take months.
Under the direction of PMI, GHSC-PSM supported
newly launched campaigns in Ghana and Thailand,
ongoing campaigns in Ethiopia and Nigeria, and
distributions in South Sudan. The project also
supported Madagascar in preparing to launch its new
campaign. Strong planning and efficient, accountable
systems are making a difference in the cost of these
large-scale campaigns (see box).
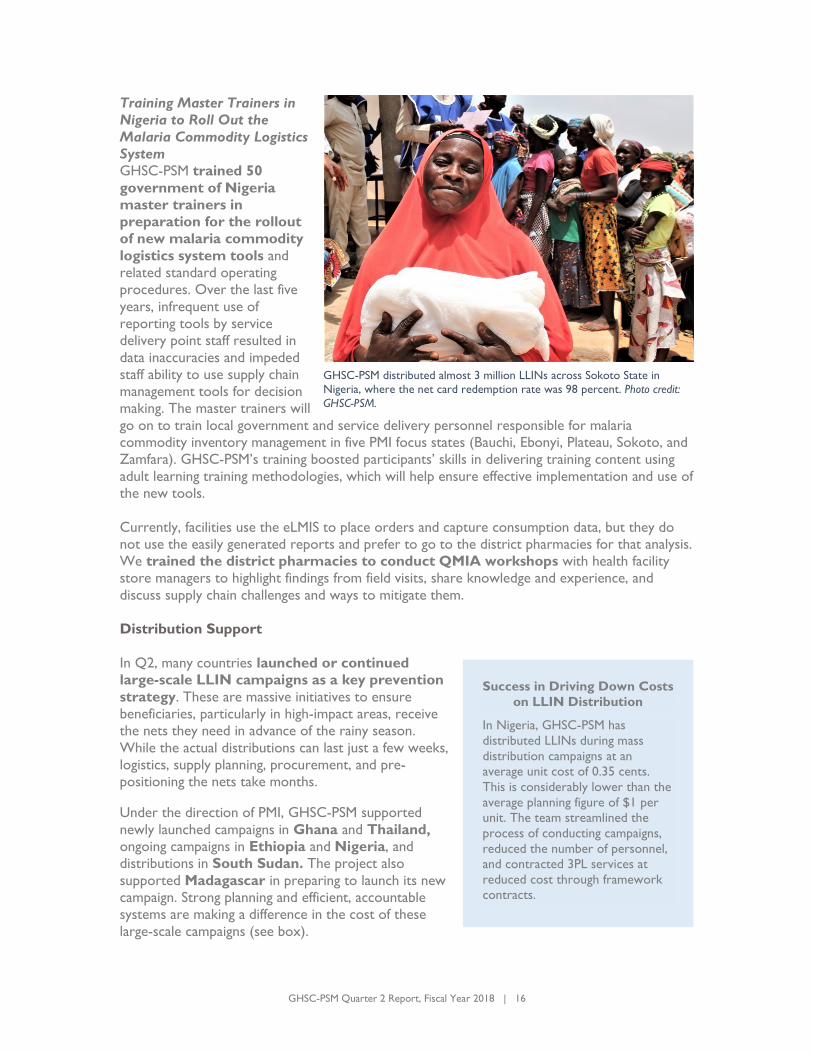
GHSC-PSM distributed almost 3 million LLINs across Sokoto State in
Nigeria, where the net card redemption rate was 98 percent. Photo credit:
GHSC-PSM.
Success in Driving Down Costs
on LLIN Distribution
In Nigeria, GHSC-PSM has
distributed LLINs during mass
distribution campaigns at an
average unit cost of 0.35 cents.
This is considerably lower than the
average planning figure of $1 per
unit. The team streamlined the
process of conducting campaigns,
reduced the number of personnel,
and contracted 3PL services at
reduced cost through framework
contracts.
GHSC-PSM Quarter 2 Report, Fiscal Year 2018 | 17
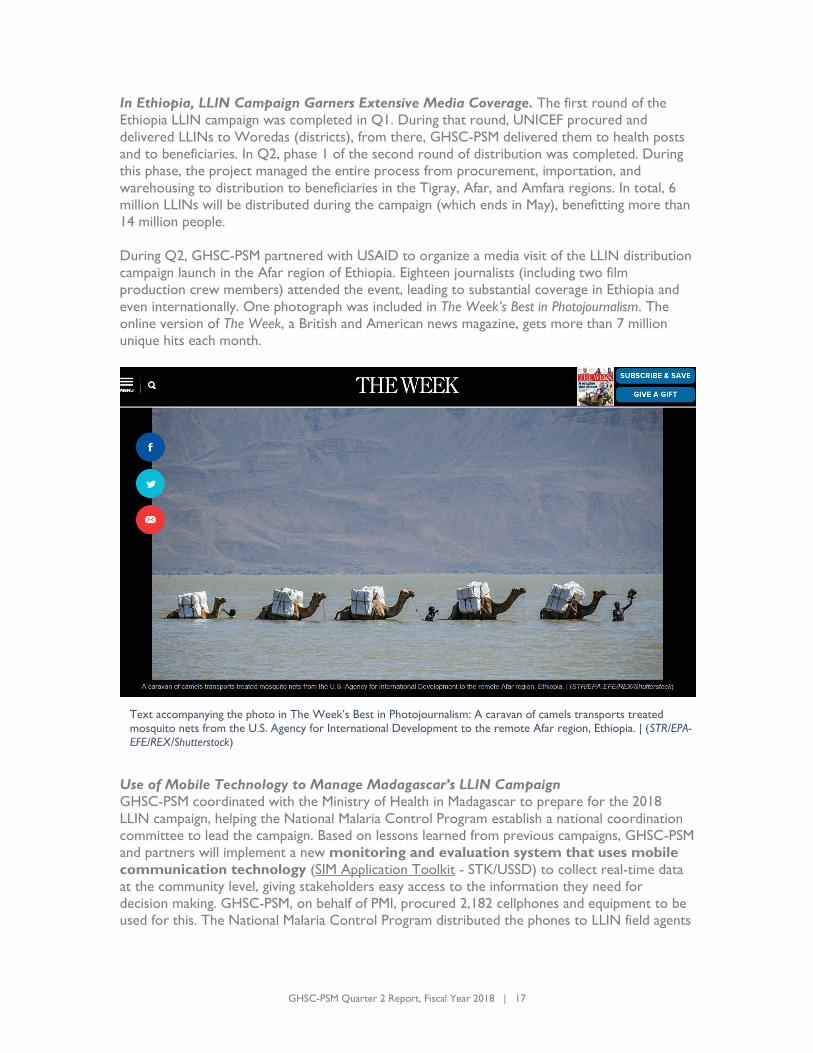
In Ethiopia, LLIN Campaign Garners Extensive Media Coverage. The first round of the
Ethiopia LLIN campaign was completed in Q1. During that round, UNICEF procured and
delivered LLINs to Woredas (districts), from there, GHSC-PSM delivered them to health posts
and to beneficiaries. In Q2, phase 1 of the second round of distribution was completed. During
this phase, the project managed the entire process from procurement, importation, and
warehousing to distribution to beneficiaries in the Tigray, Afar, and Amfara regions. In total, 6
million LLINs will be distributed during the campaign (which ends in May), benefitting more than
14 million people.
During Q2, GHSC-PSM partnered with USAID to organize a media visit of the LLIN distribution
campaign launch in the Afar region of Ethiopia. Eighteen journalists (including two film
production crew members) attended the event, leading to substantial coverage in Ethiopia and
even internationally. One photograph was included in The Week’s Best in Photojournalism. The
online version of The Week, a British and American news magazine, gets more than 7 million
unique hits each month.
Use of Mobile Technology to Manage Madagascar’s LLIN Campaign
GHSC-PSM coordinated with the Ministry of Health in Madagascar to prepare for the 2018
LLIN campaign, helping the National Malaria Control Program establish a national coordination
committee to lead the campaign. Based on lessons learned from previous campaigns, GHSC-PSM
and partners will implement a new monitoring and evaluation system that uses mobile
communication technology (SIM Application Toolkit - STK/USSD) to collect real-time data
at the community level, giving stakeholders easy access to the information they need for
decision making. GHSC-PSM, on behalf of PMI, procured 2,182 cellphones and equipment to be
used for this. The National Malaria Control Program distributed the phones to LLIN field agents
Text accompanying the photo in The Week’s Best in Photojournalism: A caravan of camels transports treated
mosquito nets from the U.S. Agency for International Development to the remote Afar region, Ethiopia. | (STR/EPA-
EFE/REX/Shutterstock)

GHSC-PSM Quarter 2 Report, Fiscal Year 2018 | 18
in all communities and installed corresponding IT equipment at headquarters to capture data and
provide timely feedback. PMI also is funding LLIN campaign M&E activities.
LLIN Distribution Success Hinges on Collaboration and Coordination in South Sudan
In South Sudan, GHSC-PSM led routine distribution of 500,000 LLINs across eight states.
Developing a plan that ensured LLINs were distributed to sites and verifying last-mile delivery
was a complex process that required coordination with more than 10 implementing partners.
These collaborations were critical to succeeding in the complex work environment and
provided key insights in developing and implementing GHSC-PSM’s distribution and resupply
plans.
Commodity Procurement, Sourcing, and Delivery
GHSC-PSM’s provision of malaria commodities this quarter entailed procurement, quality
assurance, deliveries, support for transferring/redistributing stocks, and response to
emergencies, as summarized below.
Procurement. Since the start of the project, GHSC-PSM
has procured malaria commodities for 27 countries (all
of the PMI countries plus two USAID-designated malaria
countries). Over the life of the project, we have
procured $286 million in malaria commodities, including
$86 million this quarter. This includes the first
procurement of malaria commodities for
Cameroon, which was recently added to the project’s
malaria portfolio.
Strategic Sourcing
In February 2018, PMI issued its annual technical
guidance. The procurement and supply chain guidance
reflected recommendations and analysis conducted by GHSC-PSM in 2017. The new
guidance calls for significant stock-keeping unit (SKU) rationalization (i.e., reduction in the
number of product options) and reduction in customization for LLIN procurements. This will
produce opportunities for improved supply chain performance and flexibility, leading
to lead time and cost savings. Preliminary analysis projects significant savings starting with
FY2018 Malaria Operational Plan (MOP) procurements. Additional cost savings and lead time
improvements may be negotiated in the future as we move toward strategic long-term agreements with our suppliers.
The new guidance also indicates that PMI will no longer allow sole-source selection of RDTs
based on health worker training concerns. GHSC-PSM analysis indicates that this will reduce
price variation, produce potential overall savings, and mitigate significant global capacity risks.
This new RDT policy, buttressed by GHSC-PSM analysis, informed the development of a new
RDT contracting strategy and order allocation methodology. In Q2, GHSC-PSM
completed best and final offer negotiations with RDT suppliers to enter into strategic long-term
agreements. These contracts, coupled with the strategic order allocation methodology, are
designed to support sustainable pricing, supply diversity, and long-term market health.
Commodities Procured for
Malaria Programs
Artemisinin-based combination
therapies (ACTs)
Laboratory consumables
LLINs
Malaria rapid diagnostic tests
(mRDTs)
Other nonpharma
Other pharma
Severe malaria
Sulfadoxine-pyrimethamine (SP)

GHSC-PSM Quarter 2 Report, Fiscal Year 2018 | 19
Lab Throughput Improves Quality Assurance Lead Times
GHSC-PSM is directly responsible for ensuring the quality of the malaria commodities that we
deliver.3 In Q2, the project processed the highest volume of malaria orders to date, while also
achieving our best QA performance to date, with 98.5 percent of commodity QA
processes completed within estimated QA lead times. Exhibit 4 on the following page shows
QA throughput in Q2. This was due to significant improvements in the lab network, especially
capacity to meet contractual lead times for sulfadoxine-pyrimetamine + amodiaquine dispersible
tablet (SPAQ DT), ASAQ, and generic ALu. Also, GHSC-PSM provided improved forecasts of
future test requests to the lab network and stayed in constant contact with labs to ensure our
requirements were met. All three primary pharmaceutical quality control laboratories have
increased their staff and equipment to improve lab throughput.
Exhibit 4. QA throughput and timeliness at all-time highs in FY18 Q2
Visibility to React Quickly The PPMRm provides quarterly data on central-level stock availability for critical malaria
commodities (such as ACT, artesunate injectable, sulfadoxine-pyrimethamine, and malaria
RDTs) in 23 countries. Cameroon, as a new PMI country, reported on its malaria stocks and
expected deliveries for the first time in Q2. These data on upcoming shipments and stock on
hand provide PMI and GHSC-PSM visibility into the current and projected stock status of
countries on a high level. More importantly, they allow PMI and our project to take critical
actions to address challenges to stock availability.
3 Quality assurance for other GHSC-PSM-procured commodities is provided by the GHSC-QA contract,
which is implemented by FHI 360.

GHSC-PSM Quarter 2 Report, Fiscal Year 2018 | 20
B3. Family Planning and Reproductive Health
In Brief
16 countries procured FP/RH commodities and
20 countries4 received systems strengthening support with PRH funding this quarter.
GHSC-PSM continued to play a global leadership
role, such as chairing the Systems Strengthening
Working Group of the Reproductive Health Supplies
Coalition, facilitating an interactive session at the West
Africa Health Organization Early Warning System
Workshop, and closely coordinating with donors and
interested parties in prioritizing limited supply of
one-rod implants.
Procurement of FP/RH
Commodities
FY18 Q2:
$15 million
Life of Project:
$58 million
----------------
We have delivered enough
contraceptives to provide 28.4
million CYP.
Our work addressing core priorities included providing market analysis, tracking contraceptive
security, enhancing visibility of FP/RH supplies, and ensuring commodity quality.
The PRH task order serves as the primary vehicle through which USAID procures and provides
FP/RH commodities for USAID health programs; offers technical assistance to improve supply
systems and commodity security in partner countries; and provides technical leadership to
strengthen global supply, increase financing, and introduce FP/RH commodities. This quarter,
GHSC-PSM procured $15 million in FP/RH commodities5 for 16 countries. We also
worked to strengthen national supply chains and improve contraceptive availability in
20 countries. The countries we support are listed in Exhibit 5 on the following page.
Addressing PRH Priorities
GHSC-PSM addressed USAID/Office of Population and Reproductive Health global priorities in
three areas: global leadership in PRH policy, planning, and advocacy; knowledge management in
response to program needs; and support to the field in implementing effective and sustainable
PRH programs. We provide below examples of our work in these areas.
Tracking Contraceptive Security
GHSC-PSM supported the redesign of the Contraceptive Security Indicators and Index to
develop a new tool that combines elements of both. This will help program managers,
advocates, and decision-makers track country progress toward contraceptive security. GHSC-
PSM also is now conducting the survey every two years. In Q2, the project conducted a rapid
market analysis survey of past users and potential future users of the Contraceptive Security
Indicators and Index. We found that respondents’ levels of familiarity with and use of the tools
were mixed. Respondents reported on their diverse applications of the tools, from monitoring a
country’s contraceptive security status, assessing public sector funding needs, and advocating for
4 All procurement and delivery figures for the PRH TO include Ebola procurements. 5 Per USAID guidance, all condom procurements are counted under the HIV/AIDS task order.

GHSC-PSM Quarter 2 Report, Fiscal Year 2018 | 21
timely action by government counterparts, to tracking a country’s progress following
introduction of a new product or initiative to expand access. Survey participants suggested
several new channels for disseminating the Contraceptive Security Indicators and Index and
advised on user preferences for accessing and viewing the data.
Exhibit 5. Countries Receiving Support from GHSC-PSM with FP/PRH Funding in FY18
Country Procure-
ment
Technical
Assistance Country
Procure
-ment
Technical
Assistance
AFRICA AFRICA (cont.)
Angola Mozambique Benin Nigeria Burundi Rwanda Cameroon Senegal
Dem. Rep. of Congo Sierra Leone
Ethiopia South Sudan Ghana Tanzania
Guinea Togo
Kenya ^ Uganda Liberia Zambia Madagascar
Malawi ASIA
Mali Afghanistan
Bangladesh
CARRIBEAN/LATIN AMERICA Nepal Guatemala^^ Pakistan Haiti
^ GHSC-PSM provides technical assistance in Kenya under a unique task order (Task Order 5) overseen by USAID/Kenya.
^^ FP/PRH funding to Guatemala was put on hold in April 2018.
Analyzing Supply Chain Reform Interventions
GHSC-PSM developed three landscape analyses on supply chain reform interventions in Q2,
specifically, reviews of informed push models in supply management, incentive alignment, and
social accountability. We submitted the final draft of the informed push models review to
USAID and will submit the reports on aligning incentives and social accountability in Q3.
Collaborating with Global Stakeholders
In Q2, the project continued to build global partners’ awareness of and support for the U.S.
government’s PRH priorities and programs, and to support USAID’s leadership in FP/RH
commodity availability.
In February, GHSC-PSM presented our work on increasing data visibility to improve stock
availability at a meeting convened by Track20. Track20 promotes use of service statistics to
track progress in achieving the global FP2020 initiative’s goal, which is to increase the number of
modern-method users by 120 million women and girls between 2012 and 2020 in 69 low and
middle-income countries. At the meeting, 12 global organizations, including GHSC-PSM,
discussed the platforms they use to collect family planning data. Attendees put forth a
recommended set of indicators for monitoring progress in achieving FP2020’s goals. Subsequent
discussions with in-country stakeholders will work to achieve global consensus on a short list of
service statistics-based indicators for this purpose.

GHSC-PSM Quarter 2 Report, Fiscal Year 2018 | 22
GHSC-PSM worked to leverage our supply chain workforce initiatives through People that
Deliver, a global partnership of organizations focusing on professionalizing health supply chain
personnel. We participated in the People that Deliver board meeting, where we sought to align
our workforce initiatives with global approaches to health supply chain workforce strengthening
and to build relationships with other key partners. At the meeting, People that Deliver updated
its strategic goals, selected three countries for advocacy efforts (Benin, Ethiopia, and Nigeria),
and added four new members to the board, including GHSC-PSM’s Workforce Development
Manager. We plan to continue aligning our workforce development activities with People that
Deliver’s approaches, particularly in the three selected advocacy focus countries.
The project also attended the General Membership Meeting of the RHSC in March. GHSC-
PSM’s active participation included chairing the Systems Strengthening Working Group,
moderating a panel discussion on the market conditions that attract a manufacturer to bring its
product to market, speaking on three other panels, and participating in a meeting on
consumables and equipment for long-acting reversible contraceptives. Outcomes of the meeting
included several new initiatives for the Systems Strengthening Working Group, including one
focused on availability of consumables for long-acting methods.
Enhancing Visibility of Data on Family Planning Supplies
Throughout Q2, GHSC-PSM contributed to development of the Global Family Planning
Visibility and Analytics Network (Global FP VAN). This network is the reproductive
health community’s highly ambitious undertaking to increase supply chain visibility and improve
collaboration across major procurers of contraceptives for global health programs. RHSC, the
institutional home of the Global FP VAN, managed an innovative collaborative process to select
the technology solutions partner that will develop the virtual collaborative platform. GHSC-PSM
participated extensively in this process, providing IT expertise and serving as one of the super
users that interacted with prospective vendors to define functional requirements and test
solutions.
Collaborating Globally to Avert Stockouts and Expiries
In Q2, the GHSC-PSM PPMR team processed data from 67 country reports. Based on data in
the PPMR, the project worked with the Coordinated Assistance for Reproductive Health
Supplies (CARhs) group to:
Arrange a new shipment of 50,000 units of combined oral contraceptives for Togo.
Expedite a shipment of combined oral contraceptives to Nigeria to avoid a prolonged
national stockout; 10 pallets were rescheduled to be sent by air while the rest of the
order is traveling by ocean.
Helped Burundi address an oversupply of IUDs, DMPA-IM, and two-rod implants. The
following transfers enabled Burundi to avoid expiries while alleviating stock shortages in
other countries:
o Transfer of 15,000 IUDs from Burundi to Togo and 40,000 units to Burkina Faso
o Transfer of 360,000 units of DMPA-IM from Burundi to Togo
o Transfer of 50,000 units of two-rod implants from Burundi to Democratic Republic of the Congo (DRC)
GHSC-PSM co-facilitated a workshop with the West African Health Organization (WAHO) to
improve the West and Central Africa Early Warning System for Contraceptives. The world’s

GHSC-PSM Quarter 2 Report, Fiscal Year 2018 | 23
lowest contraceptive rates are found in West Africa, and, WAHO, an active CARhs member,
often supports contraceptive transfers between its member countries through the CARhs
process. At the workshop, 45 participants from 14 West African countries explored ways to
improve quality of data on contraceptive stocks and increase data use. They also developed a
revised protocol for product transfers between WAHO countries.
Commodity Procurement
In this section, we summarize GHSC-PSM activities related to procuring FP/RH commodities this
quarter.
Maintaining Buffer Stock of One- and Two-Rod
Implants
Due to shortages of one- and two-rod implants, GHSC-PSM
placed strategic inventories of these products at our regional
distribution center in Belgium. Maintaining stocks of these
high-demand products will serve as a buffer against global
supply shortages, enabling us to remain responsive to
countries’ demand and to better manage allocation among
countries.
Collaborating to Address Scarce Supply
This quarter, to mitigate tight global
supply, GHSC-PSM collaborated with
manufacturers, country recipients, the
RHSC’s Coordinated Supply Planning
Group, and CARhs to prioritize country
orders and to mete out limited
supply of DMPA-IM and one-rod implants
through split shipments. Our insight into
stock levels from multiple sources (see
box) has helped the global community
ensure reliable, timely supply and
continuously reinforces the benefits of
using data for decision making.
Procuring Non-catalog Products
GHSC-PSM regularly responds to country needs for products that are not in our product
catalog. In Q2, the project continued to manage comprehensive procurement actions (e.g.,
release tenders, evaluate offers, negotiate contracts) to fulfil these needs. GHSC-PSM placed
orders for pregnancy kits for Madagascar and for consumable kits for Uganda. We delivered
essential medicines and consumables for the Ebola survivors program in Guinea, Liberia, and
Sierra Leone (approximately 240 line items).
Sourcing
This quarter, GHSC-PSM made significant progress with sourcing FP/RH commodities, summarized
below.
Commodities Procured for
FP/RH Programs
Consumable kits for implants
Contraceptive implants
Cyclebeads®
Injectables
Intrauterine devices
Oral contraceptive pills
Data Visibility to Stay Ahead of Challenges
GHSC-PSM routinely analyzes data on in-country
stock levels collected through three mechanisms to
inform planning:
The PPMR data provides current information on
central stock levels.
Our M&E system’s information on stock levels at
lower levels of the supply chain helps us
understand whether central shortages represent
national shortages.
PipeLine data and countries’ supply plans help us
understand consumption trends and when others’
deliveries are due, facilitating planning over the
medium term.

GHSC-PSM Quarter 2 Report, Fiscal Year 2018 | 24
Negotiating and Executing a New IDIQ for Oral Contraceptives
GHSC-PSM leveraged the project’s aggregate buying power to successfully negotiate and
execute a new IDIQ for the supply of oral contraceptives, including combined oral
contraceptives, progestin-only pills, and emergency
contraceptives. The new supply contract offers
reduced product pricing, a broader range of
product options, and, for the first time on a
USAID contract, trade packaging services for
oral contraceptives to better support USAID social
marketing partners (see box). This diversified the
supplier base, which has been an important long-
term goal for USAID.
Issuing requests for quotation
The project issued new tenders for implant
contraceptives and intrauterine devices in March,
aimed at expanding the supplier base through IDIQs
for these categories.
Implementing a Five-Year Sourcing Strategy
This quarter, GHSC-PSM started implementing a
five-year sourcing strategy (for 2018 to 2023) that
will guide FP/RH commodity procurement in the
near- (one year), medium- (three year), and long-
(five year) terms. Product-specific sourcing goals and strategic initiatives are tailored to the
unique constraints, opportunities, risks, and contexts of specific products and supply markets to
provide better overall value to USAID. The strategy is intended to be dynamic and will be
revisited on an annual basis, ensuring that GHSC-PSM’s procurement is continually
supportive of USAID’s broader programmatic goals and global FP/RH market
health in the long term.
Country Support
Below, we illustrate the technical assistance that
GHSC-PSM provided to strengthen in-country
supply chains for FP/RH commodities this reporting
period.
Improving data visibility
GHSC-PSM, on behalf of USAID, continues to build
on the previous project’s work in implementing a
country-wide eLMIS system in Rwanda, designed to
improve data accuracy and facilitate real-time
visibility into health commodity stock status at the
central, district, and service delivery levels. This e-
LMIS was implemented at the Ministry of Health, all
30 district pharmacies, 43 hospitals, four referral
hospitals, and 527 health centers. Despite this
nationwide implementation, utilization of the
system remained low. As a result of GHSC-PSM’s
Trade Packaging Services: An
Important First
for Social Marketing Programs
Social marketing programs are major
distributors of FP/RH commodities,
including oral contraceptives. Up until
now, these programs have repackaged
and branded products on their arrival in
country. This introduces potential risk to
product quality, lengthens lead time, and
increases costs due to the procurement
of additional packaging materials and
labor. Under GHSC-PSM’s new IDIQ
with one oral contraceptive supplier, the
supplier will provide customized trade
packaging for social marketing
organizations at the factory so the
product arrives in country pre-branded
and packaged.
District pharmacy staff monitor health facility
stock levels, product expiration dates,
consumption trends, and distribution status
through the new e-LMIS in Rwanda. Photo
credit: GHSC-PSM

GHSC-PSM Quarter 2 Report, Fiscal Year 2018 | 25
advocacy in support of the eLMIS, the government recently endorsed the system and issued a
mandate that all reporting must come through the system.
As a result of this mandate, along with additional
mentoring activities and supportive supervision, in Q2,
utilization of the e-LMIS was 100 percent at
district pharmacies and 98 percent at health
centers. Stakeholders are noting improvements in
their ability to monitor health commodities through
the e-LMIS, which is helping them make informed
orders, manage their stocks, and prevent expiries (see
box). The project continues to provide support to
maintain these high utilization levels while improving
data accuracy across the public health supply chain.
In South Sudan, GHSC-PSM collaborated with partners
to increase availability and access to FP/RH
commodities at the facility level outside of Juba. Recognizing the existing in-country supply
chain’s challenges in distributing individual products, GHSC-PSM facilitated the co-packaging
of different FP/RH products into cartons. For example, quantities of long-acting reversible
contraceptive methods were packaged together and sent to facilities with training on how to
administer these methods. These FP/RH cartons were distributed alongside established essential
medicine kits that are managed through the Health Pooled Fund. GHSC-PSM determined that
co-packaging product and aligning distribution with already established and functioning supply
chains was the best way to ensure contraceptive commodity availability in the absence of a
robust functioning LMIS and resupply system. Up until the project’s intervention, an active
distribution of contraceptives was lacking for several years. This innovative approach also
addresses the country-wide challenges associated with product and data visibility at the facility
level. Rather than tracking the movement of thousands of individual items through the supply
chain, the focus is on tracking the more limited number of cartons that contain a variety of
FP/RH products.
Dramatic Reduction in Cycle
Time
“Cycle time [improved] from five days
to one hour only, when I am ordering a
pharmaceutical commodity....You
report what you see since you have
every service delivery point in your
database, so it's easier to know their
health commodity status.”
Prudence Kwiera
Pharmacist Assistant
Huye District Pharmacy, Rwanda
GHSC-PSM Quarter 2 Report, Fiscal Year 2018 | 26
B4. Maternal, Newborn, and Child Health
In Brief
Procurement of MNCH
Commodities
FY18 Q2:
$225,718
Life of Project:
$1.4 million
GHSC-PSM supported MNCH in 20 countries.
This quarter, we procured $225,718 in MNCH commodities.
GHSC-PSM continued to support appropriate
management of oxytocin.
GHSC-PSM provided technical leadership on MNCH
supply chain challenges through participation in
international meetings.
Under the task order for maternal, newborn, and child health, GHSC-PSM works to help end
child and maternal deaths by increasing access to quality-assured medicines and supplies for
MNCH. In collaboration with USAID, the project provides global technical leadership on MNCH
commodities and ensures that supply chain management considerations are included in global
dialogue and initiatives. GHSC-PSM focused on three key areas during this reporting period:
commodity quality, data availability, and coordination with other MNCH partners.
GHSC-PSM supports MNCH programs in 20 countries, as shown in Exhibit 6 on the following page.
Ensuring the Availability of High-Quality MNCH Commodities
GHSC-PSM continued our work to increase appropriate management of oxytocin this
quarter. Oxytocin is the WHO-recommended first-line medicine for prevention and treatment
of post-partum hemorrhage, the most common cause of maternal mortality. While oxytocin is
widely available in most countries, it is heat sensitive and degrades quickly when exposed to
temperatures above 25ºC for extended periods of time. Building on the results of the technical
consultation on appropriate management of oxytocin held in October 2017, GHSC-PSM
collaborated with partners to author a robust technical review of the evidence on
oxytocin quality issues.
In collaboration with PATH and the RHSC, GHSC-PSM published a messaging framework that
translated technical recommendations into actionable advocacy messages to promote
appropriate management of oxytocin. The Oxytocin Messaging Framework was officially
launched during the Maternal Health Supplies Caucus meeting at the RHSC annual membership
meeting in March.
Also, GHSC-PSM initiated support to the Family Health Directorate to integrate oxytocin
into the existing cold chain infrastructure in Ghana. As in many other settings, oxytocin
currently is not distributed or stored at the recommended 2 to 8ºC as it flows through the
public supply chain. Several studies conducted in Ghana have indicated that poor-quality
oxytocin is widely available. The Ministry of Health asked GHSC-PSM to assist in ensuring the
quality of oxytocin. As a first step, the project convened productive meetings with key
stakeholders to gauge implementing partner interest in collaboration.
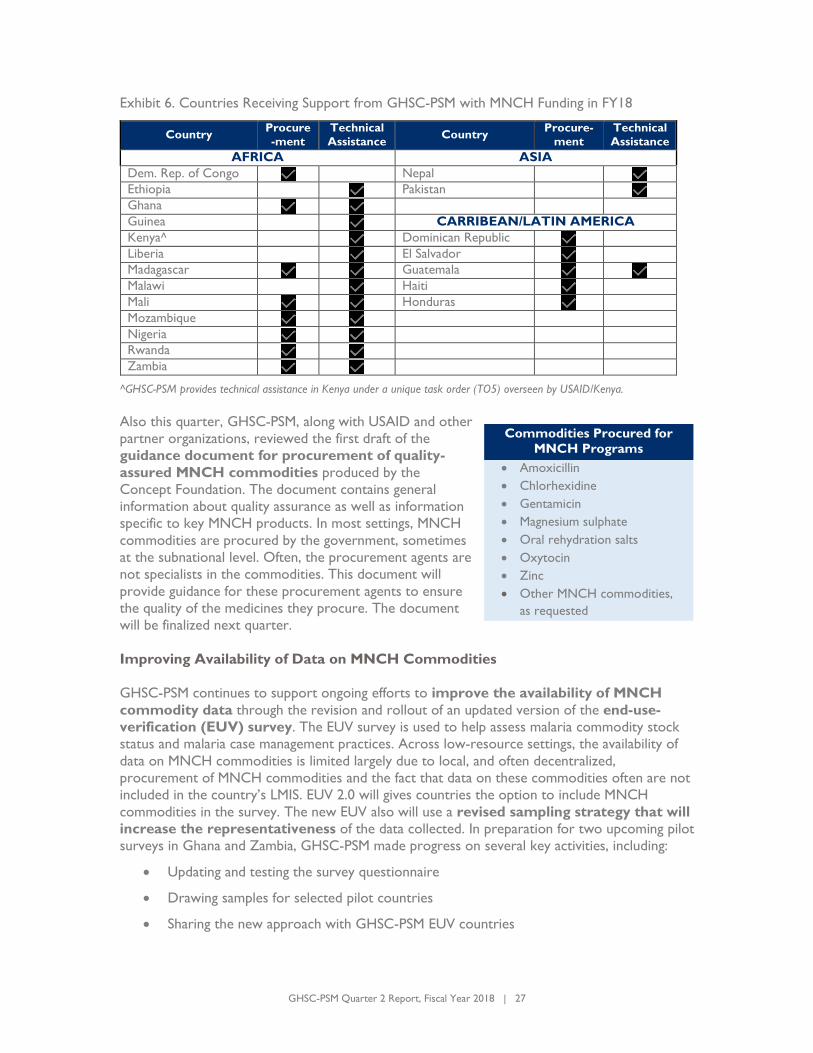
GHSC-PSM Quarter 2 Report, Fiscal Year 2018 | 27
Exhibit 6. Countries Receiving Support from GHSC-PSM with MNCH Funding in FY18
Country Procure
-ment
Technical
Assistance Country
Procure-
ment
Technical
Assistance
AFRICA ASIA
Dem. Rep. of Congo Nepal Ethiopia Pakistan Ghana
Guinea CARRIBEAN/LATIN AMERICA
Kenya^ Dominican Republic
Liberia El Salvador
Madagascar Guatemala Malawi Haiti
Mali Honduras
Mozambique
Nigeria
Rwanda
Zambia
^GHSC-PSM provides technical assistance in Kenya under a unique task order (TO5) overseen by USAID/Kenya.
Also this quarter, GHSC-PSM, along with USAID and other
partner organizations, reviewed the first draft of the
guidance document for procurement of quality-
assured MNCH commodities produced by the
Concept Foundation. The document contains general
information about quality assurance as well as information
specific to key MNCH products. In most settings, MNCH
commodities are procured by the government, sometimes
at the subnational level. Often, the procurement agents are
not specialists in the commodities. This document will
provide guidance for these procurement agents to ensure
the quality of the medicines they procure. The document
will be finalized next quarter.
Improving Availability of Data on MNCH Commodities
GHSC-PSM continues to support ongoing efforts to improve the availability of MNCH
commodity data through the revision and rollout of an updated version of the end-use-
verification (EUV) survey. The EUV survey is used to help assess malaria commodity stock
status and malaria case management practices. Across low-resource settings, the availability of
data on MNCH commodities is limited largely due to local, and often decentralized,
procurement of MNCH commodities and the fact that data on these commodities often are not
included in the country’s LMIS. EUV 2.0 will gives countries the option to include MNCH
commodities in the survey. The new EUV also will use a revised sampling strategy that will
increase the representativeness of the data collected. In preparation for two upcoming pilot
surveys in Ghana and Zambia, GHSC-PSM made progress on several key activities, including:
Updating and testing the survey questionnaire
Drawing samples for selected pilot countries
Sharing the new approach with GHSC-PSM EUV countries
Commodities Procured for
MNCH Programs
Amoxicillin
Chlorhexidine
Gentamicin
Magnesium sulphate
Oral rehydration salts
Oxytocin
Zinc
Other MNCH commodities,
as requested

GHSC-PSM Quarter 2 Report, Fiscal Year 2018 | 28
Revising the EUV protocol and accompanying materials
GHSC-PSM provided significant technical assistance at
all levels of the health supply chain to integrate child
health commodities into Ethiopia’s national
LMIS. In that country, integrated, community-based
approaches to managing newborn and child health are
widely implemented at primary-healthcare levels.
However, child health commodities — such as those
used for neonatal sepsis, pneumonia, and diarrhea —
are often managed in an ad hoc manner, resulting in
supply and service delivery disruptions. Since the
official launch of the integration, reporting rates for
child health commodities have improved, while
stockout rates have declined. In the last quarter, the
number of service delivery points reporting on
availability of amoxicillin DT, oral rehydration salt
(ORS)-zinc co-packs, and chlorhexidine has increased
by 33 percent, 25 percent, and 53 percent,
respectively. For amoxicillin DT and ORS-zinc co-
packs, stockout rates have declined from 10.2
percent to 5.3 percent and from 4 percent to 1.8
percent, respectively.
Providing Technical Leadership in MNCH
In January, GHSC-PSM contributed to a
meeting convened by WHO in
collaboration with UNICEF and the
Gates Foundation on new guidelines
for the management of sick young
infants with possible severe
bacterial infection (PSBI) where
referral is not feasible. Recent research
has shown that when hospitalization is
not possible, a safe, effective, and simpler
antibiotic treatment can be provided in
lower-level facilities. The new guidelines
promoting this approach could help save
some of the 600,000 lives lost to neonatal infections each year. Participants from 14 countries in
Africa and Asia6 shared their experiences with implementing the guidelines and identified key
actions that stakeholders must take to introduce and implement the guidelines. GHSC-PSM
advised countries on how to ensure availability of the medicines that are critical to
successful management of neonatal infections.
6 From Africa: Burkina Faso, Burundi, Congo, DRC, Ethiopia, Malawi, Niger, Nigeria, Tanzania, Zambia,
and Zimbabwe. From Asia: Bangladesh, Indonesia, and Pakistan.
Ensuring Meds Are in Place
Every one of the countries that had experience
implementing the PSBI guidelines commented on
issues with product availability or quality. To help
countries address these critical issues, GHSC-PSM
outlined how they should:
Forecast their commodity needs
Detail appropriate technical specifications in tender
documents
Include PSBI commodities in their LMIS
GHSC-PSM is working to ensure the availability of high-quality medicines so that
babies like Queen, pictured here being
weighed at a clinic in Zambia, have the best
chance for a healthy start in life. Photo credit:
GHSC-PSM

GHSC-PSM Quarter 2 Report, Fiscal Year 2018 | 29
GHSC-PSM chaired a Maternal Health Supplies Caucus meeting that identified initiatives for
2018 to increase availability of quality-assured commodities, including new focus
commodities such as blood pressure cuffs and antihypertensives. The Caucus developed a new
working group to move these initiatives forward.
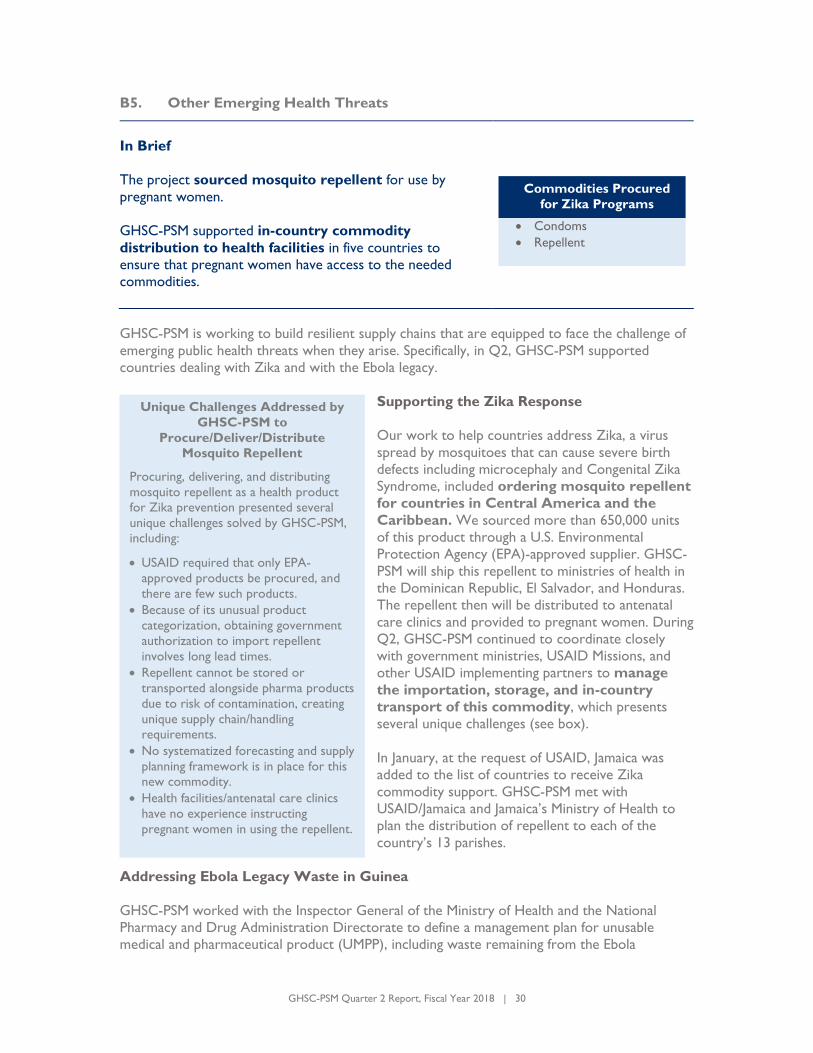
GHSC-PSM Quarter 2 Report, Fiscal Year 2018 | 30
B5. Other Emerging Health Threats
In Brief
The project sourced mosquito repellent for use by
pregnant women.
GHSC-PSM supported in-country commodity
distribution to health facilities in five countries to
ensure that pregnant women have access to the needed
commodities.
Commodities Procured
for Zika Programs
Condoms
Repellent
GHSC-PSM is working to build resilient supply chains that are equipped to face the challenge of
emerging public health threats when they arise. Specifically, in Q2, GHSC-PSM supported
countries dealing with Zika and with the Ebola legacy.
Supporting the Zika Response
Our work to help countries address Zika, a virus
spread by mosquitoes that can cause severe birth
defects including microcephaly and Congenital Zika
Syndrome, included ordering mosquito repellent
for countries in Central America and the
Caribbean. We sourced more than 650,000 units
of this product through a U.S. Environmental
Protection Agency (EPA)-approved supplier. GHSC-
PSM will ship this repellent to ministries of health in
the Dominican Republic, El Salvador, and Honduras.
The repellent then will be distributed to antenatal
care clinics and provided to pregnant women. During
Q2, GHSC-PSM continued to coordinate closely
with government ministries, USAID Missions, and
other USAID implementing partners to manage
the importation, storage, and in-country
transport of this commodity, which presents
several unique challenges (see box).
In January, at the request of USAID, Jamaica was
added to the list of countries to receive Zika
commodity support. GHSC-PSM met with
USAID/Jamaica and Jamaica’s Ministry of Health to
plan the distribution of repellent to each of the
country’s 13 parishes.
Addressing Ebola Legacy Waste in Guinea
GHSC-PSM worked with the Inspector General of the Ministry of Health and the National
Pharmacy and Drug Administration Directorate to define a management plan for unusable
medical and pharmaceutical product (UMPP), including waste remaining from the Ebola
Unique Challenges Addressed by
GHSC-PSM to
Procure/Deliver/Distribute
Mosquito Repellent
Procuring, delivering, and distributing
mosquito repellent as a health product
for Zika prevention presented several
unique challenges solved by GHSC-PSM,
including:
USAID required that only EPA-
approved products be procured, and
there are few such products.
Because of its unusual product
categorization, obtaining government
authorization to import repellent
involves long lead times.
Repellent cannot be stored or
transported alongside pharma products
due to risk of contamination, creating
unique supply chain/handling
requirements.
No systematized forecasting and supply
planning framework is in place for this
new commodity.
Health facilities/antenatal care clinics
have no experience instructing
pregnant women in using the repellent.

GHSC-PSM Quarter 2 Report, Fiscal Year 2018 | 31
epidemic. The Ebola outbreak that devastated Guinea at the end of 2014 had significant adverse
effects on the already over-burdened national supply chain, leaving a legacy of pharmaceutical
waste at every level of the health-care system that required reverse logistics, treatment, and
disposal.
GHSC-PSM organized a physical
inventory in 505 health facilities,
transported waste to a central site, and
provided a method for sorting and
packaging the UMPP. We provided safety
training, scopes of work, and process
maps for the 92 health workers and 42
handlers involved in this process, as well
as protective equipment and vehicles.
Nearly 150 tons of medical and
pharmaceutical waste was collected,
sorted, and repackaged in appropriate
packaging and containers. This waste
awaits export for final destruction in
accordance with the Basel Convention at
an incineration site in France.
In Guinea, GHSC-PSM is working to collect, sort, and pack
150 tons of medical waste that was a legacy of the 2014
Ebola outbreak. Photo credit: GHSC-PSM

GHSC-PSM Quarter 2 Report, Fiscal Year 2018 | 32
SECTION C
PROGRESS BY OBJECTIVE
C1. Global Commodity Procurement and Logistics
In Brief
GHSC-PSM delivered 1,500 line-item orders this
quarter, with a value of $187 million. This reflects a 9
percent decrease in line-item orders and a 12 percent
increase in commodity value over FY18 Q1. It is double
the number of line items and triple the commodity value of deliveries for this period last year (FY17 Q2).
On average, GHSC-PSM delivered a line item about every 1.4 hours this quarter.
73 percent of line items were delivered on time,
based on the defined on-time window (within the
period 14 days before or seven days after the agreed
delivery date). Further, 67 percent of line items were delivered on-time and in-full (OTIF).
The Global Supply Chain
At a Glance
58 countries served
3,622 products in the catalog
provided by 277 suppliers
Five international freight
forwarders responsible for
2,678 shipping lanes
Three regional distribution
centers with inventory for rapid
response to orders
The project procured $301 million in health commodities. Procurement values have
reached $1.2 billion for total life of project. This is 17 percent higher than procurement last quarter, and 62 percent higher than this period last year.
We reduced our cycle time — how long it takes a customer’s order to be delivered
after the order has been received — by 5 percent from Q1 by streamlining our
procurement processes and initiating strategically priced blanket contracts.
The project more effectively leveraged data from our information system, ARTMIS, and
targeted data analytics to improve our demand/supply planning, increase our
flexibility in decision making, and identify opportunities to improve on-time delivery (OTD) and cycle time.
GHSC-PSM enhanced our global supply chain logistics flexibility through a refined
RDC strategy, implementing an available-to-promise capability, consolidating shipments for
long waiver lead time countries, and opening our Dubai warehouse for pharmaceutical products.
C1a. Global Supply Chain: Focused on Safe, Reliable, Continuous Supply
GHSC-PSM’s procurement strategy seeks to continuously identify opportunities to pursue three
main objectives:
Reduce response/cycle times, lead times, and transaction costs
Increase on-time deliveries
Balance price, delivery, and quality (i.e., achieve best value)

GHSC-PSM Quarter 2 Report, Fiscal Year 2018 | 33
In Q2, we built on Q1 successes by maintaining strong OTD while reducing cycle time and
lowering overall commodity and supply chain costs. We did so by focusing on the following
initiatives.
Ensuring Supply Timeliness and Velocity
Logistics Contracts
GHSC-PSM conducted our annual freight forwarder procurement. For our annual freight
payments of approximately $45 million, we managed a complex procurement process to select
third-party logistics (3PL) service providers that can provide superior service and increase value
through better visibility and shorter delivery times at the best price. Our procurement
process is summarized below.
Regional Distribution Centers and Inventory Management
In Q2, GHSC-PSM completed the final step in our RDC configuration by opening our Dubai
warehouse for pharmaceutical products, with multiple benefits (see box). In parallel, we defined
and implemented a revised regional distribution center
strategy focused on high-volume products (e.g., ARVs)
after conducting detailed analyses and simulations. Our
new strategy differs from our previous strategy that
focused on long-lead-time items only. The resulting new
approach will increase our flexibility to meet
changing demands and further improve on-time
delivery. Also, we deployed an Available-to-Promise
capability that provides real-time allocation of inventory
from our RDCs at the point that the order is received, which enables greater flexibility in our
inventory and improves the speed of decision making.
Other Initiatives to Achieve Greater Efficiencies
GHSC-PSM undertook additional initiatives to increase efficiencies in the supply chain, including:
Ensuring Best Value for Complex Logistics Needs
Prequalified bidders provided GHSC-PSM with rate quotes, transit times, and details on their door-to-
door transportation services (air, sea, and land) including duty waiver processing, export/import
clearance services, in-transit storage, and accessorial services. Bidders provided quotes for:
510 lanes by air. Each lane had six different weight categories across three temperature
gradients
254 lanes by ocean. Each lane had four different container types across U.S. flag/foreign flag
requirements
GHSC-PSM analyzed more than 500,000 data points for the evaluation. We implemented a Monte
Carlo simulation to approximate future real-world cost and transit time variability. This allowed
comparisons of 3PLs across the multitude of simulated demand scenarios for each combination of
country, lane, temperature, weight, and mode.
Selection criteria included operational maturity, professional network, IT capability, compliance,
transit time, and price. We also took into consideration USAID Mission and GHSC-PSM field office
assessments of existing providers’ performance.
In the contract awards, GHSC-PSM is designating primary and secondary providers for each lane.
Benefits of Dubai Regional
Distribution Center
Storage space in Dubai is up to 75
percent less expensive than previous
warehouse locations and offers more
shipping options by sea or air into the
countries served by GHSC-PSM.

GHSC-PSM Quarter 2 Report, Fiscal Year 2018 | 34
Streamlining processes for several countries that have long waiver times. For
each shipment of health commodities into a country, GHSC-PSM needs to request a
duty waiver. We deliver to several countries that have complex, time-consuming
processes to issue such waivers. For these countries, we now try to consolidate orders
into fewer, larger shipments to minimize the number of times we need to manage the
waiver process. We also now capture each of the 17 steps of the waiver process for
each order and review progress at our daily review meetings.
Including a vendor-managed inventory requirement in our new contracts for
no-logo condoms. Having condom manufacturers maintain our condoms in their
inventory provides the same ability to ship product on receipt of order as our RDCs
provide. It also reduces the time and costs associated with transporting stock to an
RDC and warehousing it there.
Focusing on suppliers’ performance in meeting their commitments. We
enhanced our supplier scorecards — the tool we use to measure supplier performance —
to include the supplier’s track record in meeting its promised goods available dates.
Shining a spotlight on suppliers’ pervasive challenges to meet their goods available date is
encouraging improvements in supplier timeliness.
Providing Better Visibility into Data and Use of Data
GHSC-PSM’s global supply chain continues to benefit from the accuracy, efficiency, and analytics
offered by our information system, ARTMIS. In Q2, we expanded our capability to use the
system and related data to pinpoint opportunities for improvements and enable
dashboards to provide timely feedback on progress. Also, we implemented several system
integration improvements that streamline order processing and alert the management
team to action, as needed.
We enhanced our early warning system to capture in-country inventory levels from countries’
supply plans. As we identify issues with inventory levels, we prioritize that item in our daily
review of active orders and for follow-up.
We also expanded our transportation optimization tool that codifies business rules for
International Commercial Terms, transportation modes, and shipment sizes. As an example, our
new tool will identify the number of shipments required to meet an order at the point of order
processing (as large orders may be several football fields in size). This will enable continual
improvement of OTD and reduce costs.
Gaining More Health Through Better Value
GHSC-PSM’s detailed analyses of key health commodity markets and our innovative commodity
sourcing strategies allow us to obtain the best value for the agencies and countries we serve,
improve cycle times, and support OTD. We have focused our efforts on increasing the share of
total procurement managed under long-term agreements (whereby we have an ongoing contract
with agreed-upon terms with a supplier) and reducing use of more labor-intensive one-off
contracting. Long-term agreements will reduce procurement lead times, in some cases
by up to three to four weeks. Agreements are tailored to address the challenges of
each commodity group’s market.
We are including requirements for vendor-managed inventory in several of our new contracts.

GHSC-PSM Quarter 2 Report, Fiscal Year 2018 | 35
Our Commodity Councils are strategic governance bodies that coordinate the cross-functional
development and implementation of sourcing strategies aimed at achieving best value and
supporting market health within specific product portfolios. Highlights of GHSC-PSM strategic
sourcing achievements in Q2, by commodity group, include:
HIV/AIDS Pharmaceuticals
GHSC-PSM worked collaboratively with USAID to develop a TLD transition strategy to support
PEPFAR’s directive to aggressively shift to TLD while minimizing waste of existing or legacy
ARVs. We worked closely with TLD and other ARV suppliers and countries to conduct
demand, supply capacity, and inventory analytics on both the ramp-up of TLD and ramp-down of
legacy ARV products. (Please see a more detailed discussion of this in Section B.1.)
Also, during Q2, the project defined product requirements, released a solicitation, and started
evaluating bids for our broad range of ARV products, reflecting our largest spend category
across GHSC-PSM.
Laboratory Equipment and Supplies for HIV Testing
The project continued its work collecting and analyzing critical business intelligence on viral load
prices by country, instrument mapping by country, and a reagent study that will be used to
inform strategic sourcing plans.
GHSC-PSM provided strategic and analytic support to USAID and OGAC for their response to
a supplier’s instrument protocol change. We provided global and country-level information to
inform cost negotiations.
In February, with project headquarters analytic support, two field offices entered into viral load
reagent procurements that are expected to result in $370,000 in total cost savings.
The project has actively engaged in developing reagent rental pricing structures, under which we
procure laboratory reagents, equipment, and equipment maintenance and service on a “per-
test” basis. The per-test price is all-inclusive (covering the cost of the instrument, service, and
reagents/supplies). The project has piloted reagent rental contracts in several countries. Also,
for reagent rental, GHSC-PSM is working with a major global health partner to harmonize key
performance indicators and terms and conditions for service-level agreements.
We also defined requirements and prepared a solicitation for strategic contracts covering 823
standard laboratory catalog items. When awarded, these contracts will streamline processing
and contribute to reduced cycle times.
VMMC Kits
We issued a solicitation for VMMC kits and expect to finalize contracts for kits by the end of
April. These will include tiered fixed pricing (whereby we obtain different pricing based on
volume) as well as vendor-managed inventory, where having the vendor manage kit inventory
for us would be advantageous.
Male Condom and Lubricants
GHSC-PSM negotiated and executed three IDIQs for the supply of male condoms and personal
lubricant. The new contracts offer reduced product pricing and a broader range of product
options to better support USAID social marketing partners. Also, one supplier’s contract calls
for the supplier to use its own warehousing capacity to provide vendor-managed inventory for
male condoms.

GHSC-PSM Quarter 2 Report, Fiscal Year 2018 | 36
Essential Medicines
We defined requirements and released a solicitation for a strategic contract that covers 218
standard essential medicines catalog items. Challenges in essential medicines procurement include
a long list of products and large, low-value orders. The new contracts will cover a consolidated list
of the most important essential medicines. They also will include fixed prices, so GHSC-PSM will
not need to negotiate prices for each order. The consolidated product list with fixed prices will
enable GHSC-PSM to streamline the procurement process, reduce cycle time, and mitigate
supplier delays.
Long-Lasting Insecticide-Treated Nets
As discussed in Section B2, PMI’s Annual Technical Guidance codifies a shift to significant SKU
rationalization (i.e., streamlined number of products offered) and reduces the options for
customizing LLINs. This policy change reflects GHSC-PSM’s in-depth analysis that showed SKU
rationalization and reduced LLIN customization will improve supply chain performance
and flexibility and will generate savings in lead time and costs.
Rapid Diagnostic Tests
The new PMI guidance also indicates that PMI will no longer allow sole-source selection of
RDTs based solely on health worker training concerns. GHSC-PSM analysis indicates that this
new approach will lead to decreased price variation, potential overall savings, and mitigation of
significant global capacity risks.
In Q2, GHSC-PSM evaluated offers for strategic long-term agreements with RDT suppliers.
These contracts, coupled with a strategic order allocation methodology, are designed to support
sustainable pricing, supply diversity, and long-term market health.
Oral Contraceptives
GHSC-PSM negotiated and executed a new IDIQ for the supply of oral contraceptives, including
combined-oral contraceptives, progestin-only pills, and emergency contraceptives. The new
supply contract offers reduced product pricing, a broader range of product options, and trade
packaging services for oral contraceptives to better support USAID social marketing partners.
Implants
GHSC-PSM developed and issued a solicitation that will result in new supply contracts for one-
and two-rod implants. New supply contracts are expected to expand the supply base, increase
sourcing flexibility, and deliver cost savings, while maintaining a high-level of quality and low risk.
Intrauterine Devices
We also developed and issued a solicitation for IUDs. Forthcoming supply contracts will provide
established product pricing and lead times.
C1b. Project Performance
In this section, we summarize findings on key indicators of global supply chain performance.
Additional detail on these and other indicators is provided in Annex A.
In Q2, GHSC-PSM continued to drive efficiencies in global supply chain processes, while
sustaining our OTD performance. In Q2, we averaged 73 percent OTD, reduced the
backlog to 4.3 percent of annual volume, and significantly increased deliveries. Cycle
time was reduced by 5 percent over the same period. This provides evidence that our
continuous improvement efforts have taken hold and are having a sustained impact.

GHSC-PSM Quarter 2 Report, Fiscal Year 2018 | 37
GHSC-PSM procured $301 million in commodities this quarter. The number of Q2
delivery commitments increased by 22 percent (from 1,226 to 1,498). This increase was
driven by a high number of orders for Ebola in three key countries. Our ability to maintain high
OTD with significant increases in our delivery commitments reflects the strength of our
improvement measures.
We almost tripled the number of deliveries in the past six months (3,142 deliveries)
compared to the first six months of FY17 (1,076 deliveries). This reflects our ability to scale
improved processes.
Timeliness of Delivery
GHSC-PSM measures on-time delivery in two ways. Our on-time in-full (OTIF) rate reflects the
number of on-time deliveries as a percentage of all actual deliveries in that period. OTD is
the number of on-time deliveries as a percentage of expected deliveries in that period. It is a
more accurate reflection of recent performance, while OTIF suppresses performance as late
orders from previous months get delivered.
Exhibit 7. OTD and OTIF over the Last Three Quarters
Exhibit 7 shows our OTD and OTIF over the last three quarters. OTD remained stable from
Q1 to Q2, with monthly performance that averaged 73 percent. Our percentage of line items
that are backlogged is down 12 percent from Q1, and now comprises 4.3 percent of annual
volume. Our OTIF increased significantly in Q2 and now is much closer to our OTD rate. This
reflects the significant reduction in the backlog. (Delivery of backlog decreases OTIF, which
reflects the month of delivery, but not OTD, which reflects the month of commitment.)
Our OTD and OTIF rates and reduced backlog provide evidence of the sustained success of our
process improvements.
31%
72% 73%
32%
49%
67%
0%
20%
40%
60%
80%
100%
OTD
OTIF

GHSC-PSM Quarter 2 Report, Fiscal Year 2018 | 38
Exhibit 8. Monthly OTIF and OTD in Q2
Exhibit 8 shows our OTIF and OTD in Q2 across all health commodities. We see our weakest
quarterly OTD performance with malaria commodities. Our OTD for malaria commodities
dropped from 59 percent in FY2018 Q1 to 46 percent in Q2. The drop was driven by three
factors: poor supplier performance, the lagging effect of earlier orders for which our delivery
commitments were poorly set, and a large number of deliveries to three countries with long
waiver lead times. (Note: all GHSC-PSM deliveries require that the country receiving the
product waive duties on USAID donations. The process of receiving a waiver is protracted in
some countries). We have implemented initiatives to address supplier performance, increase the
accuracy of our delivery commitments, and reduce long waiver lead times. As such, we expect
to see a rebound in OTD of malaria commodities in Q3.
Cycle Time
Cycle time is the industry’s standard indicator of
supply chain responsiveness, measuring how long it
takes for a customer’s order to be delivered once
the order has been received. For GHSC-PSM,
cycle time is the time from order entry to delivery
of goods to the recipient (in most cases to a
country’s central warehouse). We use this
indicator to identify bottlenecks in the fulfillment
process that may impact our ability to deliver
orders on time and to identify opportunities for improving efficiency.
Reductions in Cycle Time
We achieved a 45 percent reduction
in cycle time for core sourcing
functions (order entry through initial
sourcing) in the last quarter.

GHSC-PSM Quarter 2 Report, Fiscal Year 2018 | 39
Exhibit 9. Cycle Time (October 2017 through March 2018)
GHSC-PSM’s overall cycle time is down by 5 percent this quarter, fueled by a 66 percent
reduction in cycle time for FP/RH commodities and a 17 percent reduction for malaria
commodities. GHSC-PSM is on target to reach our annual targets.
Our initiatives to reduce cycle time in specific targeted segments are showing results. For
example, we saw an average reduction of 45 percent in the segment from USAID approval
to our release of a purchase order for those orders initiated in Q2 versus Q1. This is a leading
indicator that points to promising future results.
While malaria commodities have comparatively longer cycle times (due mainly to quality
assurance processes that can take up to eight weeks after production), malaria cycle times
already are close to targets set for the end of FY18.
Total Landed Cost
Our semiannual indicator Total Landed Cost measures the total cost of all supply chain operations
and expenses associated with delivery of one U.S. dollar of product. Our total landed cost
results demonstrate that we are achieving significant cost efficiencies for the taxpayer. These are
a direct result of:
Our global network optimization (moving from five to three strategically located
warehouses)
Reduced warehouse costs and efficiencies
Use of:
o A 4PL model that continuously recompetes shipping lanes
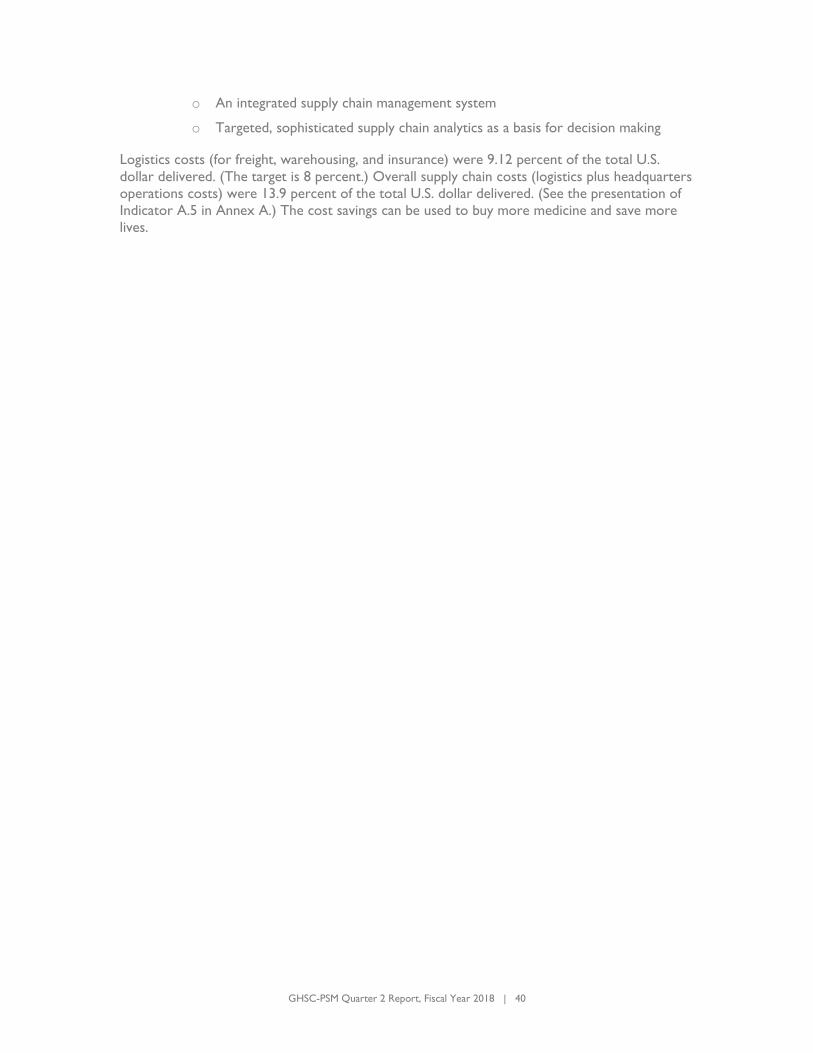
GHSC-PSM Quarter 2 Report, Fiscal Year 2018 | 40
o An integrated supply chain management system
o Targeted, sophisticated supply chain analytics as a basis for decision making
Logistics costs (for freight, warehousing, and insurance) were 9.12 percent of the total U.S.
dollar delivered. (The target is 8 percent.) Overall supply chain costs (logistics plus headquarters
operations costs) were 13.9 percent of the total U.S. dollar delivered. (See the presentation of
Indicator A.5 in Annex A.) The cost savings can be used to buy more medicine and save more
lives.

GHSC-PSM Quarter 2 Report, Fiscal Year 2018 | 41
C2. Systems Strengthening Technical Assistance
In Brief
GHSC-PSM continued start-up activities in Mali
and began start-up in Niger and Sierra Leone, with
funding emphasis on malaria.
The project made significant strides in advancing
training programs associated with health supply chain workforce development.
GHSC-PSM continued to provide LMIS support
to 16 countries, tailoring our support to the infrastructure and priorities of each.
Systems strengthening
through country programs
32 country-specific and regional
field offices (with offices opening
in Niger and Sierra Leone soon)
43 countries supported
More than 1,200 staff
The project helped integrate use of global positioning system (GPS) into
warehousing and distribution planning in Ethiopia, and supported contracting
for private-sector service provision in Ghana, achieving significant savings and other value.
We developed supply chain flow diagrams for all countries we support, giving
stakeholders a consolidated view of these complex networks to facilitate planning and
process improvement.
GHSC-PSM received 88 total supply plans from 23 countries, including 76 required plans. The team reviewed 53 supply plans to provide technical feedback.
A strong national health system requires a supply chain that consistently provides affordable,
high-quality medicines and other health products at all health service delivery points. GHSC-PSM
maintains field offices in 32 countries and has provided long- and/or short-term technical
assistance to ministries of health and other key stakeholders in 43 countries to achieve these
ends.
GHSC-PSM’s vision is for every country to have a government-led health supply chain that is
integrated, optimized, accountable, agile, lean, and able to sustainably supply
quality products to all citizens. Each supply chain system should emphasize automated data
capture, real-time end-to-end data visibility, pharmaceutical-grade infrastructure, and efficient
distribution. Each supply chain should be managed by supply chain professionals in a culture of
quality improvement. GHSC-PSM works to achieve this vision through four key methods:
Strategy: Developing project-wide global technical approaches and assisting country
teams in applying these to their context.
Implementation: Providing technical assistance and tools and building technical
capacity to help country teams implement activities.
Monitoring: Engaging continuously with country teams to monitor and support
technical progress toward long-term goals.
Thought Leadership: Curating, creating, and disseminating content related to technical knowledge in health supply chain management.

GHSC-PSM Quarter 2 Report, Fiscal Year 2018 | 42
C2a. Activities and Achievements
In Q2, GHSC-PSM continued to maintain our existing
30 field offices and added offices in two new countries
— Mali and Niger. In Mali, the new country office is
already moving forward with installing a prefabricated
warehouse to provide critically needed central-level
storage for health commodities in the country’s
capital, Bamako (see box).
We are helping countries develop strategies to
achieve improved and self-sustaining supply
chains. This starts with understanding a supply
chain’s strengths, weaknesses, and national priorities for improvement. We use several tools to
support this, including the National Supply Chain Assessment (NSCA) tool. In January, GHSC-
PSM contributed technical input to help USAID finalize version 2.0 of the 11-module NSCA
tool. An NSCA provides a comprehensive view of a country’s national supply chain maturity and
performance. Outcomes
and recommendations
from a NSCA help
identify areas requiring
intervention and
facilitate stakeholder
coordination to ensure
strategic
improvements in the
national public-sector-
financed supply chain. The
NSCA tool will be applied
by GHSC-PSM and USAID
in Uganda in May 2018.
GHSC-PSM uses global technical approaches (co-created by USAID and GHSC-PSM
headquarters and field staff) as suggested ‘standards’ against which countries should consider
selecting and sequencing in-country system strengthening activities. In Q2, GHSC-PSM worked
to systematically apply our global technical approaches and effectively model implementation to
individual countries. This process is owned by the GHSC-PSM field office in collaboration with
the USAID Mission, with inputs from USAID and GHSC-PSM staff at headquarters. Field offices
refer to health supply chain systems strengthening (HSCSS) global technical approaches as they
engage with USAID Mission and government staff to match HSCSS activities to country
priorities. Field office teams conduct their own systems strengthening work, in addition to
collaborating with and following up short-term technical assistance from GHSC-PSM
headquarters. GHSC-PSM headquarters specialists review country work plans and provide
technical feedback on all activities with reference to sequencing, methods, timing, etc. We also
review proposed methodologies and approaches in detailed scopes of work for new activities to
be supported by short-term technical assistance. All technical assistance activities are aligned
with indicators from the country’s approved M&E plan, and it is envisaged that the activities
contribute to the relevant indicators.
A Quick and Cost-Effective
Storage Solution:
Prefabricated Warehouses
Prefabricated warehouses are made for
rapid, cost-effective deployment. They
consist of pre-engineered modular
components and fittings that can be
erected quickly and easily, while being
easily maintained and operated by local
personnel.
A pregnant woman visits a pharmacy in the Dosso region of Niger, one of
GHSC-PSM’s newest PMI-supported countries. Photo credit: GHSC-PSM
GHSC-PSM Quarter 2 Report, Fiscal Year 2018 | 43
Following are highlights of where and how GHSC-PSM has applied HSCSS approaches globally
and in specific countries.
Workforce Development
GHSC-PSM continues to provide support to Angola, Burma, Ethiopia, Mozambique,
Nepal, Nigeria, Pakistan, and Rwanda to strengthen their public health supply chain
workforces. These interventions will help build
sustainable workforces through professionalization and
systematic approaches to workforce development.
In January, GHSC-PSM hosted the Workforce
Development Technical Workshop, bringing
together 33 representatives from USAID, eight project
country offices, and a range of partners including APICS
(a leading association for supply chain management), the
Bill & Melinda Gates Foundation, the Global Fund, and
People that Deliver. This was the first of a series of
HSCSS technical workshops designed to share with
other stakeholders our work in the health supply chain
sector, review notable technical interventions, discuss
key learnings, look forward, and make necessary
adjustments for future activities.
Following the workshop, GHSC-PSM updated and
circulated the Workforce Development Global Technical
Approach and more detailed resource documents. The project then hosted a workforce
development webinar in multiple time zones to orient field teams to these documents.
In Q3, the project will launch a five-module certificate series designed to better equip our
global staff with knowledge and approaches that can be applied to local country contexts. Our
aim is for each country we support to have skilled professionals who assume end-to-end
responsibility for the performance of their country’s public health supply chain, become change
agents, and foster institutionalized policies and procedures to finance, develop, support, and
retain a sufficient health supply chain workforce.
In Angola, GHSC-PSM adapted, translated, and facilitated the use of the project’s health
supply chain workforce self-assessment tool to identify opportunities for strengthening
the skills of health supply chain managers. Angola’s National School of Public Health reviewed
the results of the assessment and agreed to partner with GHSC-PSM in developing a curriculum
for a Masters specialization in public health supply chain management. This will be the first
Masters-level specialization of its kind in Angola, in association with the most prestigious
university in the country, University Agostinho Neto. The program will be offered at no cost to
current Ministry of Health employees with responsibilities in supply chain management, from
warehouse managers to senior national health program leaders. The potential impact is
significant, as almost all graduates of the school of public health go on to work for the Ministry
of Health.
Supply Chain Systems
Strengthening Technical Areas
Forecasting and supply planning
Governance and leadership
Global standards
Health-care waste management
Laboratory networks
Management information systems
Process improvement
Procurement
Strategy and design
VMMC
Warehousing and distribution
Workforce development
GHSC-PSM Quarter 2 Report, Fiscal Year 2018 | 44
In Pakistan, to promote training and
career opportunities for the next
generation of supply chain professionals,
GHSC-PSM supported an internship
program for both undergraduate and
graduate students (see box). The first
cohort of 11 interns from various
backgrounds and leading universities
recently completed the program.
Participants contributed to developing
family planning commodity forecasts for provinces, received international procurement training,
and staffed the management information system helpdesk. As a measure of success of the
internship program, four of the nine post-graduate interns were inducted as short-term training,
IT, and human resources officers for the WHO-funded Vaccine Logistics Management
Information System. One of the interns also continues to work as a short-term human
resources officer for GHSC-PSM.
Management Information Systems
GHSC-PSM continues to provide support to Angola, Botswana, Burma, Cambodia,
Guatemala, Guinea, Haiti, Kyrgyzstan, Lesotho, Madagascar, Malawi, Mozambique,
Nepal, Pakistan, Rwanda, and Zambia with their supply chain information systems.
Although at different levels of supply chain maturity, these countries are on a path to developing
end-to-end visibility, with data-driven mechanisms to support evidenced-based decision making.
In Burma, GHSC-PSM onboarded six regional LMIS managers and officers to oversee and
ensure the collection of essential stock data at the township level, for the first time
effectively capturing data at this level. This milestone is part of an ambitious LMIS initiative
that includes implementing an integrated LMIS roadmap to streamline visibility of available stock
throughout the country.
Recognizing that simple-to-use, low-cost tools are often more effective and readily adopted,
GHSC-PSM used free, open-source technology to
help develop an Online Logistics Information
Integrator (www.integrador.org) in Guatemala.
Using the Integrator, personnel in charge of logistics
management at the 16 hospitals providing ARV
treatment upload their monthly balance and
requisition forms online. This process eliminates the
cut-and-paste operation previously used to
consolidate all logistics information at the central
level of the national HIV/AIDS program, resulting in
considerable time savings (see box).
The Integrator offers numerous features that will enable data review and support decision
making. The platform can generate a variety of reports that can be used to:
Identify potential stockouts
Review trends in consumption patterns
“I congratulate GHSC-PSM for introducing the
internship program. It contributes not only to
capacity building of young talent but also helps in
identifying shining stars who could be absorbed
within the government for sustainable strengthening
of supply chain systems.”
Mr. Fazal Nabi Khan
Secretary, Population Welfare Department, Government
of Khyber Pakhtunkhwa
Pakistan
Time Savings from Adopting a
Low-Cost Information Tool
In Guatemala, thanks to the GHSC-PSM-
developed Online Logistics Information
Integrator, an operation that once took
one person almost two weeks to
complete now takes just one day.
GHSC-PSM Quarter 2 Report, Fiscal Year 2018 | 45
Monitor availability of ARVs (organized by first-, second-, and third-line ARVs) at USAID-priority hospitals
The Online Logistics Information Integrator is empowering staff from the national HIV/AIDS
program to better understand their entire logistics network for ARVs. This tool could be
integrated or used as a complement to any future nationwide LMIS.
In Lesotho, GHSC-PSM accelerated the expansion of an “informed push” system nationwide,
using electronic data to track and manage Lesotho’s health commodity supply chain system. This
automated system allows health facility staff to use electronic tablets to upload
information about commodity stock levels and quantities of stock received from the central
warehouse. By connecting to the National Ministry of Health’s web-based platform for health
records, the application automatically calculates the quantities the facility needs to
ensure continuous supply of critical health commodities and avert waste of unused
supplies. This automated system
alleviates the burden on often-
understaffed facilities of manually
entering stock data into paper-based
records and manually doing the
calculations to forecast supply needs (see
box).
By implementing a web-based “push”
supply request system, facility staff
improved data clarity and reduced
delivery times to ensure commodity
availability in last-mile storage sites. Also, the electronic system enhances data visibility and
transparency at all levels of the health system — an improvement that can reduce overall cost
and improve the ability of health officials at the central, district, and facility levels to analyze
supply chain data for critical decision making. Project staff currently are working to expand the
informed push system and providing training on the system for additional government
facilities, nonprofit facilities run by the Christian Health Association of Lesotho, and private-
sector clinics.
Warehousing and Distribution
GHSC-PSM continues to provide support to Ethiopia, Lesotho, Liberia, Ghana, Rwanda,
and Zambia to improve their warehousing and distribution systems. Our approaches seek to
improve data-driven decision making across the supply chain, optimize in-country warehouse
networks, and increase efficiencies in warehousing and distribution operations. Promoting
alternative ownership and management models for medical stores and distribution is another
key approach.
In Ethiopia, GHSC-PSM is working with the Pharmaceuticals Fund and Supply Agency (PFSA),
the country’s public health supply chain agency, to encourage the use of GPS data to inform
distribution and warehousing decisions. PFSA (with UNOPS support) is installing GPS
trackers on all its vehicles. GHSC-PSM is supporting PFSA’s use of GPS data tracking to:
Increase vehicle use
Reduce poor driver performance
Saving Time Through Automation
In Lesotho, GHSC-PSM has supported one-third of
the nation’s health facilities in using a tablet-based
system to upload supply chain data. The electronic
informed push system saves valuable time by
automatically calculating the average monthly
consumption of commodities — a previously time-
consuming and error-prone exercise that was done
manually using a calculator for each of the 100 or so
items a facility ordered.
— Attribution (e.g., name, title, and organization). Use the Box Attribution style here.
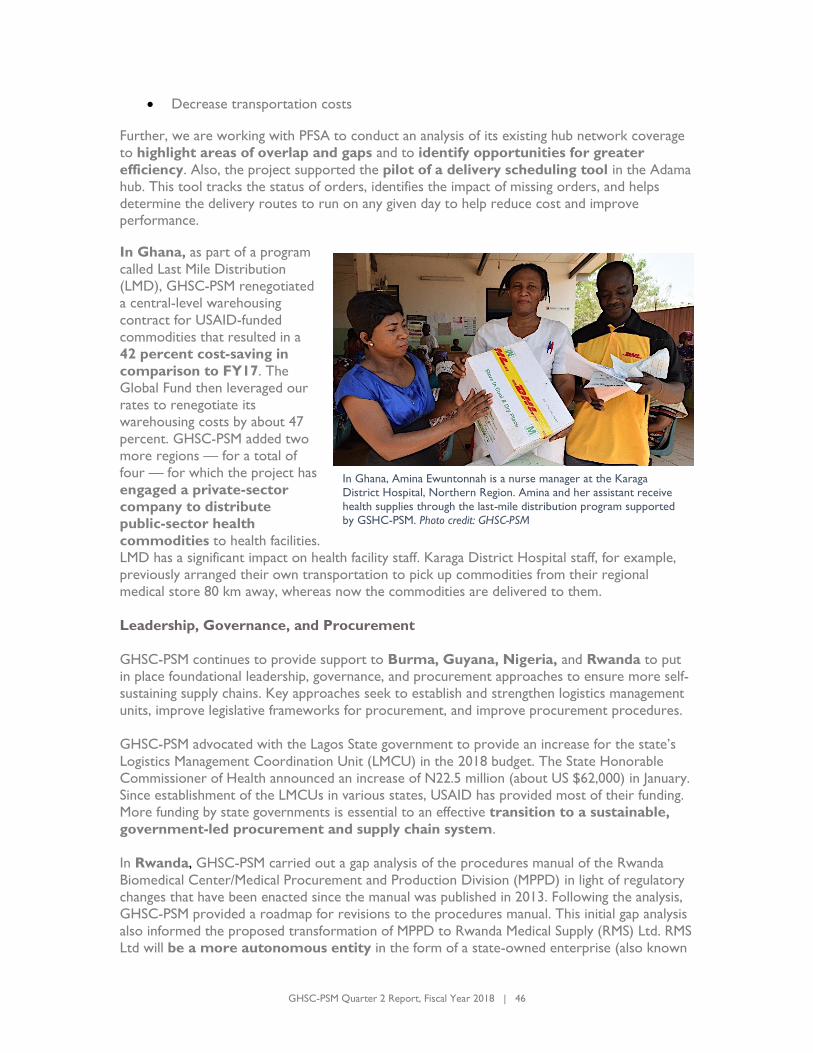
GHSC-PSM Quarter 2 Report, Fiscal Year 2018 | 46
Decrease transportation costs
Further, we are working with PFSA to conduct an analysis of its existing hub network coverage
to highlight areas of overlap and gaps and to identify opportunities for greater
efficiency. Also, the project supported the pilot of a delivery scheduling tool in the Adama
hub. This tool tracks the status of orders, identifies the impact of missing orders, and helps
determine the delivery routes to run on any given day to help reduce cost and improve performance.
In Ghana, as part of a program
called Last Mile Distribution
(LMD), GHSC-PSM renegotiated
a central-level warehousing
contract for USAID-funded
commodities that resulted in a
42 percent cost-saving in
comparison to FY17. The
Global Fund then leveraged our
rates to renegotiate its
warehousing costs by about 47
percent. GHSC-PSM added two
more regions — for a total of
four — for which the project has
engaged a private-sector
company to distribute
public-sector health
commodities to health facilities.
LMD has a significant impact on health facility staff. Karaga District Hospital staff, for example,
previously arranged their own transportation to pick up commodities from their regional
medical store 80 km away, whereas now the commodities are delivered to them.
Leadership, Governance, and Procurement
GHSC-PSM continues to provide support to Burma, Guyana, Nigeria, and Rwanda to put
in place foundational leadership, governance, and procurement approaches to ensure more self-
sustaining supply chains. Key approaches seek to establish and strengthen logistics management
units, improve legislative frameworks for procurement, and improve procurement procedures.
GHSC-PSM advocated with the Lagos State government to provide an increase for the state’s
Logistics Management Coordination Unit (LMCU) in the 2018 budget. The State Honorable
Commissioner of Health announced an increase of N22.5 million (about US $62,000) in January.
Since establishment of the LMCUs in various states, USAID has provided most of their funding.
More funding by state governments is essential to an effective transition to a sustainable,
government-led procurement and supply chain system.
In Rwanda, GHSC-PSM carried out a gap analysis of the procedures manual of the Rwanda
Biomedical Center/Medical Procurement and Production Division (MPPD) in light of regulatory
changes that have been enacted since the manual was published in 2013. Following the analysis,
GHSC-PSM provided a roadmap for revisions to the procedures manual. This initial gap analysis
also informed the proposed transformation of MPPD to Rwanda Medical Supply (RMS) Ltd. RMS
Ltd will be a more autonomous entity in the form of a state-owned enterprise (also known
In Ghana, Amina Ewuntonnah is a nurse manager at the Karaga
District Hospital, Northern Region. Amina and her assistant receive
health supplies through the last-mile distribution program supported
by GSHC-PSM. Photo credit: GHSC-PSM
GHSC-PSM Quarter 2 Report, Fiscal Year 2018 | 47
as a parastatal). RMS Ltd will merge with all 30
district-level warehouses, for important savings
(see box).
GHSC-PSM has been working to increase service
delivery point ordering and reporting in Uganda. As a
result of targeted supervision by the Joint Medical Store
and spot checks by GHSC-PSM, the percentage of 645
service delivery points ordering and reporting malaria
commodities increased from 83 percent in
November/December to 97 percent in January/February.
Country-Level Process Improvement
GHSC-PSM field offices assist with analyzing, evaluating, and developing recommendations for
system and process improvements, optimization, and/or operations sustainment efforts for
countries.
Health supply chains in the countries supported by GHSC-PSM are managed by complex networks
of host-government ministries, international donors, not-for-profit nongovernmental
organizations, and commercial-sector entities. Different entities have different roles and
responsibilities, depending on the health area and the level of the supply chain. Ensuring the supply
chain works to meet citizens’ needs requires close coordination and planning across all these
entities. Coordination starts with a clear understanding of who does what in the supply chain.
To this end, this quarter, GHSC-PSM developed supply chain flow diagrams for all GHSC-PSM-
supported countries. (As an illustration, the flow diagram for Mozambique is provided as Exhibit
10 on the following page.) These flow diagrams graphically depict the flow of products through
the supply chain from supply planning to the delivery of health commodities to patients. The
flow diagrams allow all parties to review the same information about the totality of
the health supply chain in the country. They can be used to facilitate collaborative planning
around allocation of resources and responsibilities and to envision how the supply chain system
could be improved or redesigned.
Revised Approach has Potential
to Yield Significant Savings
The merging of MPPD with 30 district
warehouses could potentially
reduce the costs of medicines by
up to 20 percent by eliminating one
layer of mark-up.
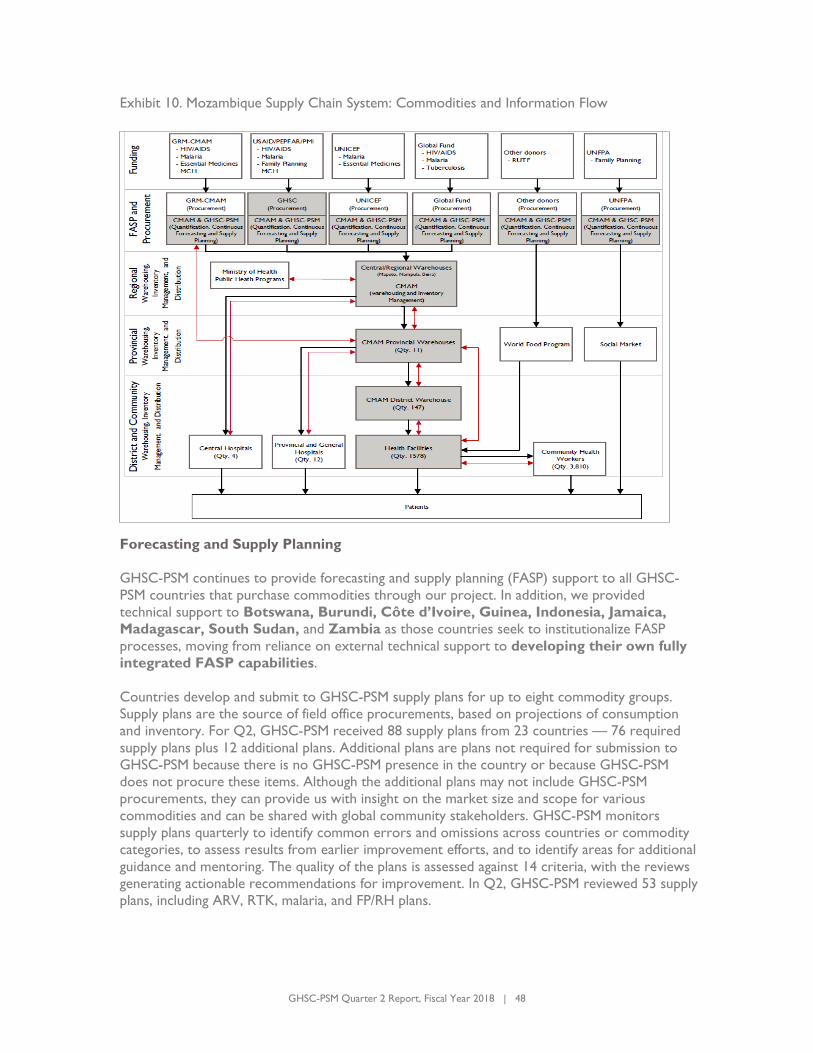
GHSC-PSM Quarter 2 Report, Fiscal Year 2018 | 48
Exhibit 10. Mozambique Supply Chain System: Commodities and Information Flow
Forecasting and Supply Planning
GHSC-PSM continues to provide forecasting and supply planning (FASP) support to all GHSC-
PSM countries that purchase commodities through our project. In addition, we provided
technical support to Botswana, Burundi, Côte d’Ivoire, Guinea, Indonesia, Jamaica,
Madagascar, South Sudan, and Zambia as those countries seek to institutionalize FASP
processes, moving from reliance on external technical support to developing their own fully
integrated FASP capabilities.
Countries develop and submit to GHSC-PSM supply plans for up to eight commodity groups.
Supply plans are the source of field office procurements, based on projections of consumption
and inventory. For Q2, GHSC-PSM received 88 supply plans from 23 countries — 76 required
supply plans plus 12 additional plans. Additional plans are plans not required for submission to
GHSC-PSM because there is no GHSC-PSM presence in the country or because GHSC-PSM
does not procure these items. Although the additional plans may not include GHSC-PSM
procurements, they can provide us with insight on the market size and scope for various
commodities and can be shared with global community stakeholders. GHSC-PSM monitors
supply plans quarterly to identify common errors and omissions across countries or commodity
categories, to assess results from earlier improvement efforts, and to identify areas for additional
guidance and mentoring. The quality of the plans is assessed against 14 criteria, with the reviews
generating actionable recommendations for improvement. In Q2, GHSC-PSM reviewed 53 supply
plans, including ARV, RTK, malaria, and FP/RH plans.
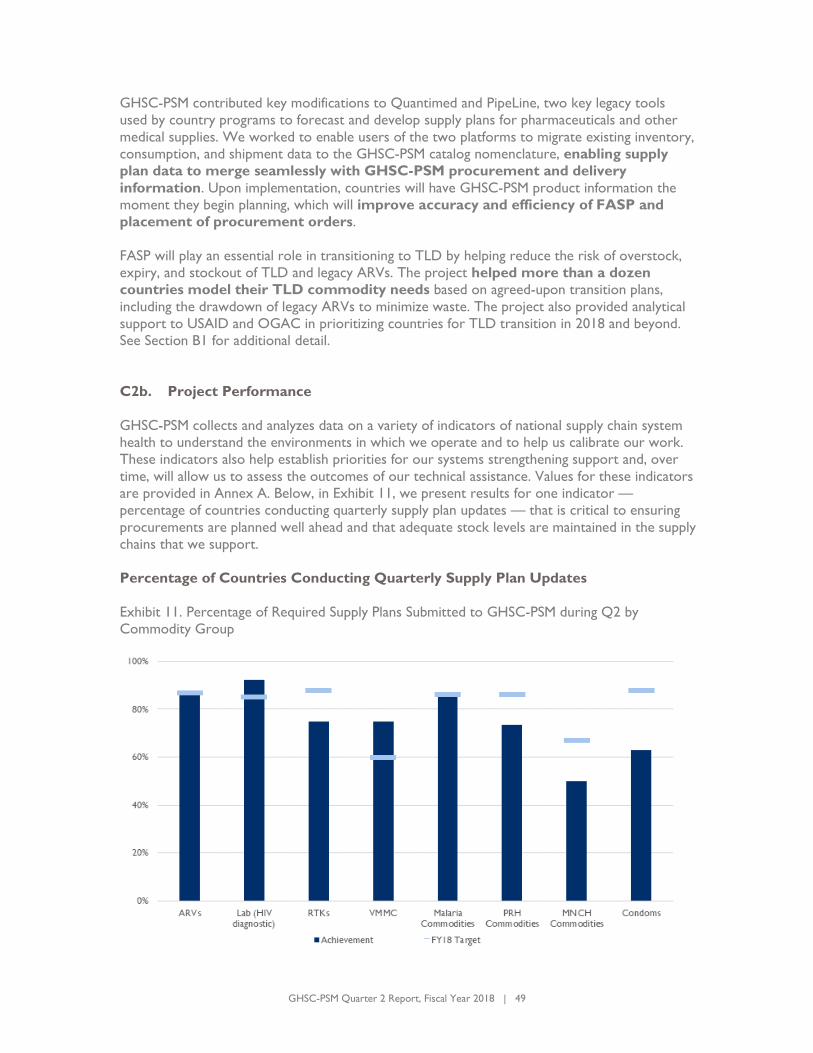
GHSC-PSM Quarter 2 Report, Fiscal Year 2018 | 49
GHSC-PSM contributed key modifications to Quantimed and PipeLine, two key legacy tools
used by country programs to forecast and develop supply plans for pharmaceuticals and other
medical supplies. We worked to enable users of the two platforms to migrate existing inventory,
consumption, and shipment data to the GHSC-PSM catalog nomenclature, enabling supply
plan data to merge seamlessly with GHSC-PSM procurement and delivery
information. Upon implementation, countries will have GHSC-PSM product information the
moment they begin planning, which will improve accuracy and efficiency of FASP and
placement of procurement orders.
FASP will play an essential role in transitioning to TLD by helping reduce the risk of overstock,
expiry, and stockout of TLD and legacy ARVs. The project helped more than a dozen
countries model their TLD commodity needs based on agreed-upon transition plans,
including the drawdown of legacy ARVs to minimize waste. The project also provided analytical
support to USAID and OGAC in prioritizing countries for TLD transition in 2018 and beyond.
See Section B1 for additional detail.
C2b. Project Performance
GHSC-PSM collects and analyzes data on a variety of indicators of national supply chain system
health to understand the environments in which we operate and to help us calibrate our work.
These indicators also help establish priorities for our systems strengthening support and, over
time, will allow us to assess the outcomes of our technical assistance. Values for these indicators
are provided in Annex A. Below, in Exhibit 11, we present results for one indicator —
percentage of countries conducting quarterly supply plan updates — that is critical to ensuring
procurements are planned well ahead and that adequate stock levels are maintained in the supply
chains that we support.
Percentage of Countries Conducting Quarterly Supply Plan Updates
Exhibit 11. Percentage of Required Supply Plans Submitted to GHSC-PSM during Q2 by
Commodity Group
GHSC-PSM Quarter 2 Report, Fiscal Year 2018 | 50
Under the quantification paradigm supported by GHSC-PSM, supply plans take a regularly
updated, forward-looking view of demand for 18 months. This comprehensive, systematic,
and long-term approach to supply planning provides visibility into monthly demand even if
a single quarterly update is not submitted.
Across all commodity groups, 76 required quarterly supply plans were submitted, representing
almost 77 percent of the Q2 required supply plan expectation. This ranged from 92 percent of
required supply plans submitted for lab (HIV diagnostics), 87 percent for ARVs, and 86 percent
for malaria commodities to 50 percent (3 of 6) for MNCH commodities. The supply plan
submission rates are slightly down across all health areas; the number of supply plans submitted
this quarter remained steady but the number of supply plans expected increased since the
previous quarter.
GHSC-PSM Quarter 2 Report, Fiscal Year 2018 | 51
C3. Global Collaboration
In Brief
GHSC-PSM conducted market dynamics research for HIV/AIDS, malaria, and FP/RH to identify ways to strengthen markets for key commodities.
The project made significant progress in implementing a plan to incorporate global
standards throughout our supply chain. This will help improve efficiency, reduce costs, and improve end-to-end data visibility.
GHSC-PSM continued to participate actively in global fora, sharing data and promoting
new approaches, and to test innovations in our global and country-level procurement and
logistics work.
C3a. Activities and Achievements
Our global collaboration in Q2 focused on strategic engagement, market dynamics, and other
research, awareness, and advocacy efforts. We are also working to scale successful innovations
in multiple countries and within the global health supply chain space. The scale, scope, and
complexity of managing a global supply chain require us to collaborate with many global and
local partners to ensure the availability of health commodities. By integrating our work across
health sectors and sharing information, resources, activities, and capabilities, we can achieve together what we could never achieve alone.
Strategic Engagement
As described throughout this report, GHSC-PSM engages actively with other global players to
promote availability of health commodities. We do so by providing supply chain expertise to
important global fora; working with other global partners to allocate scarce supply; promoting
harmonization in standards and practices; and working to manage commodity stock information
as a global good. Our contributions are recapped below.
Providing Supply Chain Expertise to Important Global Fora
GHSC-PSM represents the supply chain point of view in key global meetings to ensure donors
and governments take supply chain considerations into account when planning their programs.
This helps them get timely access to the commodities needed for their programs. Participation
in these meetings also helps GHSC-PSM stay current with emerging requirements so we are
ready to respond to global health commodity needs. Specifically, this quarter, GHSC-PSM:
Hosted and presented data at the USAID Office of HIV/AIDS Voluntary Medical Male
Circumcision biannual headquarters partner meeting
Chaired the Systems Strengthening Working Group of the General Members Meeting of
the RHSC
Co-facilitated a workshop with WAHO to improve the West and Central Africa Early
Warning System for Contraceptives, including the quality of contraceptive stock data
and data use
Presented at the Track20 meeting on platforms used to collect family planning data

GHSC-PSM Quarter 2 Report, Fiscal Year 2018 | 52
Participated in the People that Deliver board meeting on professionalizing health supply
chain personnel and joined the board of that organization
Moderated a panel on market conditions that attract manufacturers to the market for
the General Members Meeting of the RHSC
Participated in a meeting on consumables for long-acting reversible contraceptives at the
General Members Meeting of the RHSC
Facilitated a Medicines for All (M4All) panel on prioritizing drugs for chemistry improvements
Collaborating to Allocate Scarce Supply
Through our PPMR and PPMR-HIV processes, we supported donor review and planning around
commodity overstocks and low stocks. To address scarce supply of DMPA-IM and one-rod
implants, we collaborated with manufacturers, country recipients, the RHSC’s Coordinated
Supply Planning Group, and CARhs to prioritize country orders and allocate supply.
Promoting Harmonization
GHSC-PSM shares our methods with the global community to promote broad
improvement in product availability. For example, this quarter, we shared our contractual
service and maintenance terms to ensure continuous instrument performance for viral load
testing platforms. We shared these contract terms with CHAI, WHO, and UNITAID so all
global laboratory stakeholders can align on requirements that promote performance.
As a further example, we facilitated harmonization of packaging requirements among major
contraceptive and condom procurers.
Managing Commodity Stock Information as a Global Good
GHSC-PSM serves as an information resource on commodity availability, sharing our supply
chain information and collecting and managing additional country data on stocks. As described in
Section B, through the PPMR process in the HIV, malaria, and FP/RH sectors, GHSC-PSM
manages collection of data on country-level stocks of critical health commodities. These data are
shared with countries and donors in user-friendly dashboards to inform planning and
prioritization. Every quarter, based on this information, the global community considers actions
to address imbalances (such as redistributing stock to mitigate stockouts and minimize waste).
GHSC-PSM is an active participant in developing the Global FP VAN, which will increase
supply chain visibility and improve collaboration between USAID and other major procurers of
contraceptives. This quarter, GHSC-PSM served as a super user, interacting with potential
software solution providers to explore functional requirements for the system and helped
elaborate the technical requirements for that contract.
Research and Innovation
GHSC-PSM is engaged in cutting-edge research that helps shape global markets to meet
countries’ needs for health commodities and that explores better ways to get these products to
the people who need them.
Market Dynamics
We continued a robust program of research into the health commodity marketplace, with
significant progress this quarter. Insights from our market dynamics research inform our
GHSC-PSM Quarter 2 Report, Fiscal Year 2018 | 53
approaches to working with the private sector to ensure long-term market
responsiveness, efficiency, and sustainability.
China active pharmaceutical ingredient import-export data. GHSC-PSM is working to
understand how China’s new Blue Skies environmental program is affecting its export of raw
materials, starting materials, and active pharmaceutical ingredients used by health commodity
manufacturers. This quarter, we contracted a data provider and received the first two months
of data on Chinese exports of 29 antiretroviral, essential medicine, condom, and malaria
products. These data will support our analysis of pricing and volume trends over time to better
understand input market volatility facing manufacturers, which, in turn, will inform our procurement strategies.
Manufacturing and chemistry improvements. GHSC-PSM collaborates with M4ALL and
Project Optimize to explore the development of new, more scalable, and more cost-effective
technologies for manufacturing global health medicines. In Q2, we analyzed key first-line
products (lamivudine and emtricitabine) to inform PEPFAR decision making around the priority
drug list and Project Optimize strategies. Also, GHSC-PSM leveraged market dynamics models
developed in 2017 to analyze emtricitabine. This is informing M4ALL’s strategies for improving the manufacturing chemistry for this product.
GHSC-PSM also participated in the first M4ALL Institute Steering Committee on March 29. We
joined a panel with CHAI and Medicines Patent Pool that considered how to promote
manufacturer uptake of optimized M4ALL processes. We also facilitated a panel on USAID’s
experience with ARVs to inform approaches to prioritizing drugs for chemistry improvements.
Private market development. At the March 22 RHSC membership meeting, GHSC-PSM
facilitated a discussion with PT Tunggal and Bayer on manufacturer insights on private market
development. They described the market conditions that attract a manufacturer to bring its
product to market. A key insight from the discussion is that manufacturers often begin market
evaluations through a market segmentation approach. The next conversation in this continuing
effort to understand private market development will focus on learning how manufacturers conduct market segmentation.
Country-level private sector landscape analysis. At the country level, GHSC-PSM project
commissioned QuintilesIMS to conduct a private sector supply chain landscape analysis of HIV,
malaria, tuberculosis, maternal and child health, and family planning commodities and RDTs in
Nigeria. The landscape analysis was funded using both core and field funds from all health
elements. The analysis included a qualitative study involving targeted interviews with
stakeholders throughout the private sector supply chain and a quantitative study of the private
sector in eight states - Bauchi, Cross River, Ebonyi, Kano, Lagos, Oyo, Rivers, and Sokoto - and
five wholesale markets – in Aba, Kano, Lagos, Onitsha, and Port Harcourt. We submitted the
two reports for the Private Sector Supply Chain Landscape Activity to USAID this quarter.
Building Awareness and Advocacy for Change in Supply Chain Issues
GHSC-PSM works to build awareness of key supply chain issues and advocates for change
around them at global and country levels. Examples are provided below.
Global Standards
Use of global standards has been a strategic enabler of supply chain efficiency,
effectiveness, and innovation for numerous industries across the globe. Adoption of global
standards has become a central part of the entire GHSC program to reduce costs, enhance

GHSC-PSM Quarter 2 Report, Fiscal Year 2018 | 54
efficiencies, and improve the availability of health commodities worldwide. To this end, in Q2,
GHSC-PSM:
Incorporated requirements for product identification, labeling, and data exchange in
accordance with GS1 standards in our new health commodity contracts
Developed and shared a GHSC-PSM Global Standards Technical Implementation Guideline to
support suppliers who are new to global standards to help them understand how to
meet the new requirement
Completed integration of our information system, ARTMIS, with the Global Data
Synchronization NetworkTM (GDSN)
Conducted pilot projects with Abbott and with Johnson & Johnson, in which we
successfully received master data for a select number of pharmaceutical products and
laboratory supplies
Launched our GDSN community enablement initiative, which provides supplier
outreach and onboarding
Co-hosted two supplier webinars in February and March, in partnership with our GDSN
data pool provider, 1WorldSync
Published a Business Case for the Implementation of Global Standards that describes the
benefits to the global health community from implementing global standards
Launched our web landing page (http://ghsupplychain.org/globalstandards), where all our
global standards publications can be accessed
Other Advocacy
In other advocacy activities, GHSC-PSM:
Completed the user survey on the Contraceptive Security Indicators and Index
to understand how stakeholders use the tool to monitor a country’s contraceptive
security status, assess public sector funding needs, track progress after introducing a
new commodity or implementing a program to expand access, or advocate for timely
government action.
Co-published a messaging framework around management of oxytocin with
PATH and the RHSC. This messaging framework translates technical recommendations
from a previous global consultation on oxytocin into actionable advocacy messages to
promote appropriate management of oxytocin.
Participated in a small group of international organizations that reviewed a draft
guidance document on procurement of MNCH commodities. The document
will be used to help non-specialists ensure the quality of the MNCH medicines they
procure.
Continued to advocate for a network as opposed to a traditional approach to
lab procurement. This approach uses reagent rental and all-inclusive procurement. It
translates into a lower and predictable price per test, easier budgeting, higher supplier
performance, greater coordination, transfer of risk to the manufacturer/distributor, and
other benefits.
Worked to leverage our supply chain workforce initiatives through People that
Deliver, a global partnership of organizations focusing on professionalizing health supply

GHSC-PSM Quarter 2 Report, Fiscal Year 2018 | 55
chain personnel. We plan to continue aligning our workforce development activities
with People that Deliver’s approaches, particularly in the three selected advocacy focus
countries (Benin, Ethiopia, and Nigeria).
Continued our country-level advocacy. For example, in Mali, with strong advocacy
and leadership from GHSC-PSM, the leading governmental, multilateral, and
nongovernmental organizations, agreed to form a technical working group to
discuss and update supply plans for various health commodities. This new
mechanism, led by the Ministry of Health, represents a significant milestone designed to
improve upon existing processes. The group brings together a small team of key
technical experts to review data and act quickly to eliminate bottlenecks in the supply
chain and avoid risks of overstock, expiry, and stockout.
Successfully advocated with the Lagos State government to provide an
increase for the state’s Logistics Management Coordination Unit (LMCU) in
the 2018 budget. More funding by state governments is essential for an effective
transition to a sustainable, government-led procurement and supply chain
system.
Collaborating Across GHSC-PSM Health Areas
The GSHC-PSM contract combines procurement and supply chain support for all global health
areas into one contract for the first time. This consolidation has generated benefits for all health
areas that are felt every day. Below we summarize four areas — data visibility, contracting,
innovation and research, and training — where the cross-pollination and benefits of
consolidation were particularly notable this quarter.
Data Visibility
GHSC-PSM can apply lessons learned and best practices from work in one health area to
another. For example, the long-standing PPMR and the emerging Global FP VAN approaches for
FP/RH commodities are directly informing development of PPMR-HIV. Also, lessons
from core PRH activities to use and align various data sources (i.e., PipeLine, supply plans, and
PPMR) to understand the state of FP/RH commodity security are informing a similar HIV
initiative targeting HIV commodity security.
Ministries of Health have gleaned information on malaria commodity stock levels and
commodity use from EUV surveys for years. In developing EUV 2.0, GHSC-PSM has improved
the methods for conducting these surveys and incorporated collection of data on MNCH
commodities. This will fill a critical gap in data on MNCH commodity stock status at
the facility levels for the first time in many countries.
Contracting
GHSC-PSM continued to leverage our methods, approaches, and infrastructure across all four
health areas in Q2. For example, the combined volume of shipping to transport our HIV,
malaria, FP/RH, and MNCH commodities generated substantial 3PL provider interest in our
solicitation for 3PL services and helped us negotiate favorable terms in our 3PL service
contracts.
Some suppliers manufacture products for multiple health areas (e.g., for both HIV and FP/RH).
GHSC-PSM leverages significant spend in one health area to get attention for small orders for
another health area that otherwise might not be prioritized.
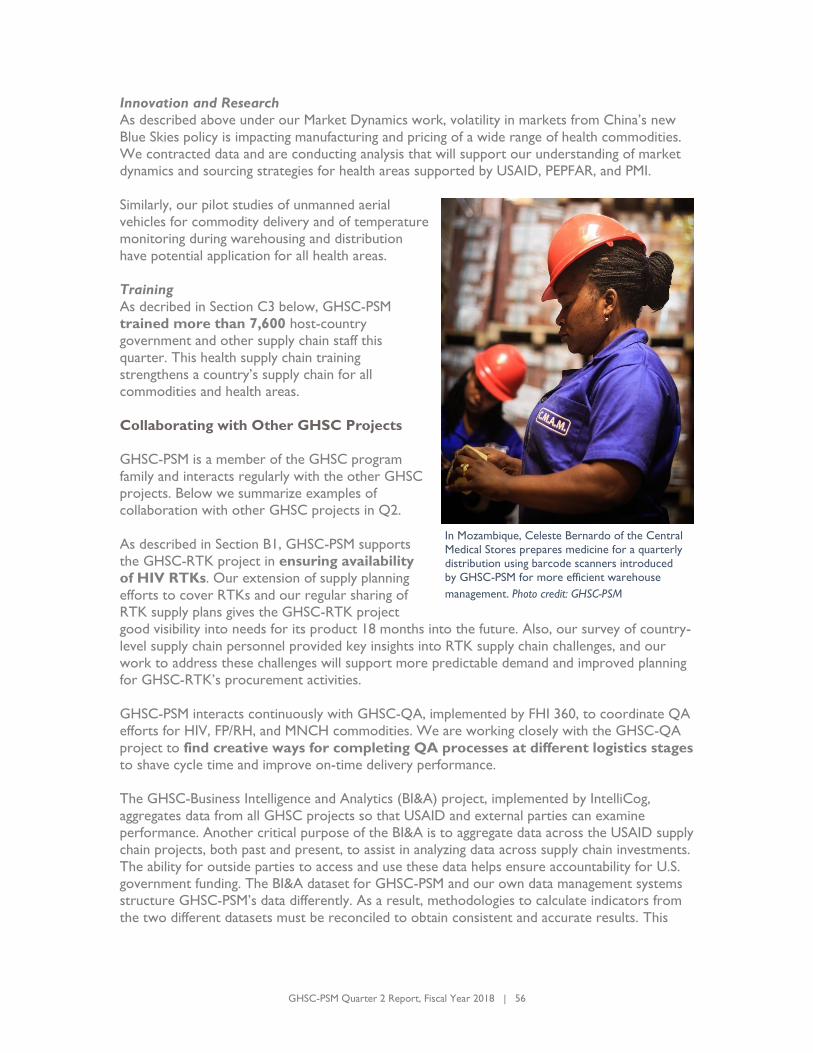
GHSC-PSM Quarter 2 Report, Fiscal Year 2018 | 56
Innovation and Research
As described above under our Market Dynamics work, volatility in markets from China’s new
Blue Skies policy is impacting manufacturing and pricing of a wide range of health commodities.
We contracted data and are conducting analysis that will support our understanding of market
dynamics and sourcing strategies for health areas supported by USAID, PEPFAR, and PMI.
Similarly, our pilot studies of unmanned aerial
vehicles for commodity delivery and of temperature
monitoring during warehousing and distribution
have potential application for all health areas.
Training
As decribed in Section C3 below, GHSC-PSM
trained more than 7,600 host-country
government and other supply chain staff this
quarter. This health supply chain training
strengthens a country’s supply chain for all
commodities and health areas.
Collaborating with Other GHSC Projects
GHSC-PSM is a member of the GHSC program
family and interacts regularly with the other GHSC
projects. Below we summarize examples of
collaboration with other GHSC projects in Q2.
As described in Section B1, GHSC-PSM supports
the GHSC-RTK project in ensuring availability
of HIV RTKs. Our extension of supply planning
efforts to cover RTKs and our regular sharing of
RTK supply plans gives the GHSC-RTK project
good visibility into needs for its product 18 months into the future. Also, our survey of country-
level supply chain personnel provided key insights into RTK supply chain challenges, and our
work to address these challenges will support more predictable demand and improved planning
for GHSC-RTK’s procurement activities.
GHSC-PSM interacts continuously with GHSC-QA, implemented by FHI 360, to coordinate QA
efforts for HIV, FP/RH, and MNCH commodities. We are working closely with the GHSC-QA
project to find creative ways for completing QA processes at different logistics stages
to shave cycle time and improve on-time delivery performance.
The GHSC-Business Intelligence and Analytics (BI&A) project, implemented by IntelliCog,
aggregates data from all GHSC projects so that USAID and external parties can examine
performance. Another critical purpose of the BI&A is to aggregate data across the USAID supply
chain projects, both past and present, to assist in analyzing data across supply chain investments.
The ability for outside parties to access and use these data helps ensure accountability for U.S.
government funding. The BI&A dataset for GHSC-PSM and our own data management systems
structure GHSC-PSM’s data differently. As a result, methodologies to calculate indicators from
the two different datasets must be reconciled to obtain consistent and accurate results. This
In Mozambique, Celeste Bernardo of the Central
Medical Stores prepares medicine for a quarterly
distribution using barcode scanners introduced
by GHSC-PSM for more efficient warehouse
management. Photo credit: GHSC-PSM

GHSC-PSM Quarter 2 Report, Fiscal Year 2018 | 57
quarter, GHSC-PSM and GHSC-BI&A staff worked to align queries to calculate values for
some priority performance indicators such as OTD.
GHSC-PSM serves as a primary aggregator of information on the GHSC program for USAID.
This quarter, we worked with USAID and contractors under the GHSC-Technical Assistance
multiple-award contract to assemble information on procurement and supply chain
activities across all U.S. government-supported countries.
C3b. Project Performance
People Trained
A key performance measure related to global collaboration and cross-cutting activities is the
number of people trained. This indicator provides a basic illustration of where the project is
focusing its capacity-building resources and where it might expect related supply chain outcomes
to improve.
A high number of individuals were trained in Q2, with a total of 7,602 trainees (3,925 men and
3,677 women). Nigeria alone trained 3,815 people (2,046 men and 1,769 women).
Most trainings were cross-cutting, meaning they addressed topics relevant to multiple
health areas. For funding source, 19 percent were trained with HIV/AIDS funding; 39 percent
with malaria funding; 37 percent with FP/RH funding; and 4 percent with MNCH funding.
The focus of trainings was:
69 percent on warehousing and inventory management
11 percent on MIS
7 percent on governance and finance
7 percent on transportation and distribution
3 percent on human resources capacity development
2 percent on forecasting and supply planning
1 percent on quality assurance
<1 percent on M&E
<1 percent on strategy and planning

USAID GLOBAL HEALTH SUPPLY CHAIN PROGRAM Procurement and Supply Management project
Annex A. M&E IndicatorsThe Global Health Supply Chain Program-Procurement and Supply Management (GHSC-PSM) project tracks a full array of performance indicators that span commodity procurement and logistics, global collaboration, and several cross-cutting issues (e.g. training). Our commodity procurement and logistics indicators capture efficiency, effectiveness, quality, and cost of our service delivery, in line with the industry-standard Supply Chain Operations Reference (SCOR) model. Other indicators reflect performance of project partners (e.g. vendors), providing insight into how we plan, procure, and deliver high-quality health commodities through our management of subcontractors. Our global collaboration and cross-cutting indicators track contributions to the global community as well as project-wide services and contributions (e.g. number of innovations developed). In-country performance indicators capture the availability of stock at central and subnational warehouses, the extent of health facility-level stockouts by product, health element, and country, health facility reporting rates to the logistics management information system (LMIS), product loss while under GHSC-PSM control, project-led innovations, trainings, and support to developing or updating supply chain policies, regulations, and standard operating procedures. Finally, our context indicators provide information on the country supply chain environments in which we operate to inform decision-making and monitor critical assumptions.
Data Use
GHSC-PSM advocates for transparent access to appropriate data as a means of encouraging accountability, transparency, and evidence-based management. In the following tables, we capture the program activities and results, as specified in the project’s Monitoring and Evaluation plan.
The GSHC-PSM field offices and headquarters use the data captured here to continuously improve results. The overall goal of the program is to ensure uninterrupted supplies of health commodities; the data that inform these indicators contribute to this. A visual management system of our progress (updated and utilized daily) allows managers to hone in on and troubleshoot these individual orders. Across all field offices, GHSC-PSM and our partners and counterparts actively use ARTMIS and in-country logistics management information system (LMIS) data to monitor stock levels and inform procurement planning. This quarter, a new On-Time Delivery dashboard has allowed unprecedented access and visibility into our OTD data, which was limited to static spreadsheets in the past. As stakeholders utilize the data, we continue to create and roll out new, innovative, and useful tools to foster an environment where evidence is used for decision-making.
Methodology Notes for Measuring Impact
In this report, we share the following results, each based on products delivered between the start of the project through March 31, 2018:
1. Number of years of antiretroviral (ARV) treatments delivered by GHSC-PSMThis report only includes Adult Efavirenz/Lamivudine/Tenofovir (TLE) and Nevirapine/Lamivudine/Zidovudine (NLZ). Doses for calculating treatments are based on World Health Organization (WHO)-recommended guidelines. The calculation of patient-years allows GHSC-PSM to monitor effectiveness and efficiency by a standard unit.
2. Number of full doses of malaria treatmentIncludes malaria treatments delivered over the life of the project, with “full dose” based on WHO-recommended treatment guidelines. Specific medicines counted are limited to those used only for treatments, and not primarily as prophylaxis. Specifically, it includes only Artemether/Lumefantrine and Artesunate/Amodiaquine formulas this quarter.
GHSC-PSM Quarter 1 Report, Fiscal Year 2018 | Annex A. M&E Indicators | 1

3. Number of Couple Years Protection (CYP) provided by delivered contraceptives
CYP is a standard indicator calculated by multiplying the quantity of each contraceptive method distributed by a conversion factor, to yield an estimate of the duration of contraceptive protection provided per unit of that method. The CYP for each method is then summed for all methods to obtain a total CYP figure. CYP conversion factors are based on how a method is used, failure rates, wastage, and how many units of the method are typically needed to provide one year of contraceptive protection for a couple. The calculation takes into account that some methods, e.g., condoms and oral contraceptives, may be used incorrectly and then discarded, or that intrauterine devices (IUDs) and implants may be removed before their life span is realized. This GHSC-PSM measure includes all condoms, IUDs, and hormone (oral, injectable, and implantable) contraceptives delivered over the life of the project, with the conversion factor provided by USAID/MEASURE (see https://www.usaid.gov/what-we-do/global-health/family-planning/couple-years-protection-cyp for details).
Explanatory notes on current data Data for the project’s core logistics indicators were fully generated using ARTMIS and LMIS reports. This includes all data for both on-time, in-full (OTIF) and on-time delivery (OTD), cycle time, total landed costs, and price variance. The Global Supply Chain team is actively using system-generated data on a daily basis.
Delivery data presented in this report reflect orders captured in the system and marked as delivered or expected to be delivered between January 1 and March 31, 2018 at the time that the data were analyzed (April 24, 2018). Given that indicator A16, “percentage of backlogged line items,” must be calculated two weeks after the reporting period end date, data were analyzed on April 15, 2018 for A16. Because GHSC-PSM continues to clean and update the data in the system daily, as described below, data pulled at a different point in time for the same time period may reflect additional updates. GHSC-PSM will continue to push for timely data entry; however, some degree of data lag is inherent in the global supply chain data system. Due to continuous data quality assessment actions, the figure presented in the annual report may differ slightly from a calculation derived from previously reported data.
During this reporting period, Q2 FY18, some noteworthy milestones were reached: • The OTD Dashboard was launched through a series of presentations and written guidelines.• Namibia country data quality assessment was conducted• Participation in Track20 consultation meeting on family planning service statistics• Regular contributions to reinforce USAID evidence base
Data Quality GHSC-PSM continues its commitment to providing internal and external stakeholders with the highest possible data quality. This is accomplished through a range of continuous actions specifically designed to identify, validate, and revise incorrect data. Actions include:1. Ad hoc data quality improvement: When users identify inaccurate data, they report the necessary changes to the ARTMIS HelpDesk. Progress for resolving data-quality tickets is reviewed twice a week.
GHSC-PSM Quarter 1 Report, Fiscal Year 2018 | Annex A. M&E Indicators | 2

2. Comprehensive DQA:Each quarter, key data underlying the OTD calculations for line items with a delivery date in the current quarter are fully validated through two independent mechanisms. a. Actual delivery date validation The actual delivery date is the date that GHSC-PSM delivers a line item to the recipient. To assess the quality of this data field in ARTMIS, we survey data from each commodity group and confirm that the data fields are accurate to >95% (with < 5% α or β errors). If a group does not pass this rigorous test, evidence is inspected to confirm the ARTMIS data of each and every line item within that group. If applicable, the original scan of the proof of delivery (PoD) is retrieved, examined, and verified. After each line item was reviewed, we corrected any discrepancies before calculating the reported data.
b. Agreed delivery date (ADD) The ADD is the date that GHSC-PSM commits to deliver a line item to the recipient. It is established at the time that a requisition order (RO) is approved and is the point of reference for determining if an order was delivered on time. Because the ADD is now system-generated – it is automatically designated according to product specifications and other attributes – it is not subject to input error. However, if an ADD is modified for any reason, this risk is re-introduced. All adjusted ADDs were validated and the following attributes were confirmed: 1) they were only changed for reasons considered valid by USAID, and 2) they were substantiated with the requisite approvals and backup documentation. This systematic review demonstrated that actual delivery dates and ADDs in ARTMIS are valid.
Field Office Reporting and Data Validation
Each quarter, the field offices face an expedited data collection, reporting, and analysis schedule. They must submit their indicator data within five working days of the period end. Once the data are transmitted by field offices, the GHSC-PSM headquarters M&E team conduct a systematic review to validate the data before additional analysis and aggregation can be done. Working closely with technical and M&E staff in the field, we ensure that each data point is uniformly high quality and can be harmonized across the project. This schedule allows us to be responsive to the quick turnaround required for appropriate document review and finalization. However, it makes it difficult for teams to digest the results, incorporate evidence, and report on the usage of indicator data in this document. We continue to promote additional feedback measures that will contribute to even greater usage.
Summary of Performance
The following tables include indicator values for performance indicators, presented by quarter, health area, and tracer product, as relevant. These performance indicators assess the outcomes of routine supply chain operations. While the performance on many of these indicators may not be immediately attributable to GHSC-PSM’s activities in the short term, all are related to the project’s long-term goal of ensuring an uninterrupted supply of health commodities in country public health systems.
We also report on context indicators, providing values by country. With each indicator table, we provide a definition of the indicator, our analysis, and known data limitations. For country performance indicators, targets are set in-country through consultations that include field offices, USAID missions, government counterparts, and project technical staff and leadership. Progress on these indicators, including B1, B2, B3, and C10, will be monitored against the country-level targets and reported in the annual report; no aggregated project- or task order-level targets will be set.
GHSC-PSM Quarter 1 Report, Fiscal Year 2018 | Annex A. M&E Indicators | 3

Context Indicators
Context indicators are meant to provide high-level insight into the public health commodity supply chain systems that GHSC- PSM and our partners are working to strengthen. They guide strategic direction for stakeholders (including GHSC-PSM field offices, ministries of health, donors, NGOs, and others) working to improve supply chain performance. GHSC-PSM will routinely monitor these indicators to identify areas where systems strengthening is needed and to assess the effectiveness of system strengthening approaches. With the collective contribution of GHSC-PSM and other key stakeholders, we expect to see improvements in these indicators over time.
The majority of context indicators are compiled from existing in-country data platforms such as LMIS and warehouse management systems, which GHSC-PSM is working to strengthen in many countries to enable governments to more fully use the data for supply chain decision-making. GHSC-PSM compiles context indicator data for all countries in which the project maintains a field office, regardless of the extent of the project’s engagement in the country. Therefore, the results in a given country, for a specific point in time, are not solely a consequence of GHSC-PSM’s activities, but rather are reflective of the many stakeholders and elements that influence in-country supply chain performance.
Beyond system strengthening activities, these contextual data (including data from the Procurement Planning and Monitoring Report [PPMR], Procurement Planning and Monitoring Report for Malaria [PPMRm], Pipeline, and other platforms, in addition to GHSC-PSM’s context indicators) are the basis for the GHSC-PSM-led regional approach to address commodity imbalances across countries. GHSC-PSM works with the international donor community to identify and respond immediately to shortages of life-saving commodities.
GHSC-PSM Quarter 1 Report, Fiscal Year 2018 | Annex A. M&E Indicators | 4
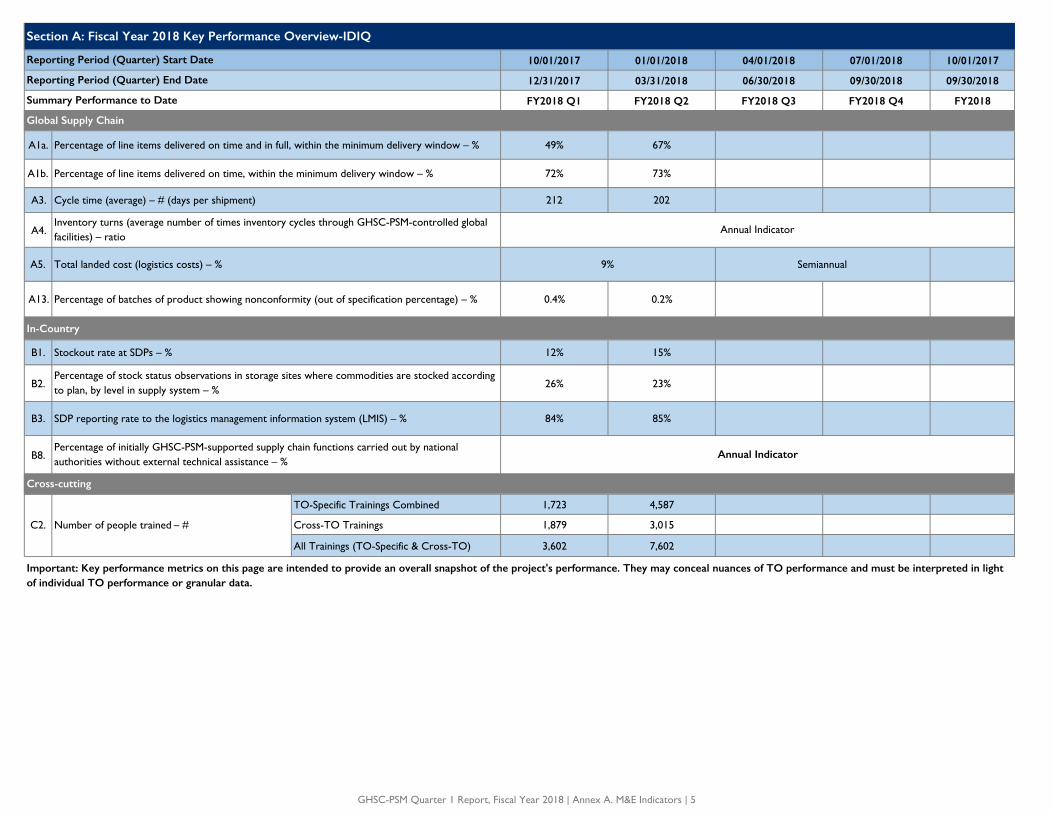
10/01/2017 01/01/2018 04/01/2018 07/01/2018 10/01/2017
12/31/2017 03/31/2018 06/30/2018 09/30/2018 09/30/2018
FY2018 Q1 FY2018 Q2 FY2018 Q3 FY2018 Q4 FY2018
A1a. 49% 67%
A1b. 72% 73%
A3. 212 202
A4.
A5.
A13. 0.4% 0.2%
B1. 12% 15%
B2. 26% 23%
B3. 84% 85%
B8.
TO-Specific Trainings Combined 1,723 4,587
Cross-TO Trainings 1,879 3,015
All Trainings (TO-Specific & Cross-TO) 3,602 7,602
Important: Key performance metrics on this page are intended to provide an overall snapshot of the project's performance. They may conceal nuances of TO performance and must be interpreted in light of individual TO performance or granular data.
C2.
Percentage of initially GHSC-PSM-supported supply chain functions carried out by national authorities without external technical assistance – %
Number of people trained – #
Percentage of batches of product showing nonconformity (out of specification percentage) – %
Percentage of stock status observations in storage sites where commodities are stocked according to plan, by level in supply system – %
SDP reporting rate to the logistics management information system (LMIS) – %
Cross-cutting
Annual Indicator
Section A: Fiscal Year 2018 Key Performance Overview-IDIQ
Global Supply Chain
Summary Performance to Date
Reporting Period (Quarter) End Date
Stockout rate at SDPs – %
Reporting Period (Quarter) Start Date
Percentage of line items delivered on time, within the minimum delivery window – %
Semiannual
Annual Indicator
Percentage of line items delivered on time and in full, within the minimum delivery window – %
Cycle time (average) – # (days per shipment)
Inventory turns (average number of times inventory cycles through GHSC-PSM-controlled global facilities) – ratio
Total landed cost (logistics costs) – %
In-Country
9%
GHSC-PSM Quarter 1 Report, Fiscal Year 2018 | Annex A. M&E Indicators | 5

IDIQ
FY18Target*
TO1FY18
Target*2017 Q3
2017 Q4
2018 Q1
2018 Q2
TO2FY18
Target*2017 Q3
2017 Q4
2018 Q1
2018 Q2
TO3FY18
Target*2017 Q3
2017 Q4
2018 Q1
2018 Q2
TO4FY18
Target*2017 Q3
2017 Q4
2018 Q1
2018 Q2
A1aPercentage of line items delivered on time and in full, within the minimum delivery window – %(in parentheses: Total number of line items delivered)
80% N/A25%
(809)35%
(985)50%
(1,505)61%
(1,042)N/A
15%(125)
14%(108)
32%(82)
43%(137)
N/A5%
(20)28%(57)
62%(42)
94%(311)
N/A0%(1)
100%(1)
80%(15)
70%(10)
A1bPercentage of line items delivered on time within the minimum delivery window – %(in parentheses: Total number of ADDs in the quarter)
80% N/A N/A31%
(1181)73%
(1,061)69%
(1,013)N/A N/A
19%(77)
59%(66)
46%(145)
N/A N/A59%(29)
79%(34)
94%(331)
N/A N/A50%(2)
85%(13)
100%(8)
A2Percentage of QA processes completed within the total estimated QA lead times - %
N/A 80% 81% 74% 82% 99% N/A N/A
A3 Cycle time (average) – # (days per line item delivered) 158 154 185 206 212 262 234 313 316 267RDC: 176
Direct Drop: 224
220 250
RDC: 236
Direct Drop: 217
RDC: 189
Direct Drop: 129
N/A 310 26 190 235
A4Inventory turns (average number of times inventory cycles through GHSC-PSM-controlled global facilities) – ratio
4 3 3 N/A
A5 Total landed cost (logistics costs) – % 8% N/A N/A N/A N/A
A6aAbsolute percent supply plan error, with variants mean absolute percent error (MAPE) and forecast bias – %
30%
A6bAbsolute percent forecast error, with variants mean absolute percent error (MAPE) and forecast bias – %
35%
A7Percentage of line items imported using a temporary registration waiver (temporary waiver percentage) – %
Not required
N/A N/A N/A N/ANot
requiredN/A N/A N/A N/A
Not required
35% 65% N/A N/ANot
requiredN/A N/A N/A N/A
A8Average percentage of shelf life remaining for warehoused commodities, weighted by the value of each commodity’s stock (product at risk percentage) – %
78% 77% 79% 82% 81% 70% 61% 61% 74% 74% 75% 65% 75% 81% 84% N/A
A2 (QA lead times) is not reported for TO1, TO3, or TO4. Reason: QA processes for these TOs are managed by the GHSC-QA project.
A7 (temporary waiver percentage) is not reported. Reason: The project is still operationalizing sources and indicator calculations.
*Targets reflect anticipated project performance by end of FY18 (September 30, 2018).
9% 2% 19%
3.3 Annual 2.0 Annual 2.1 Annual
7% 7% 15% 16%
See A6b indicator pages for detailed data for this indicator.
Section B: Fiscal Year 2018 Key Performance Overview by Task Order
Performance to Date
Global Supply Chain
Task Order 4Task Order 1 Task Order 2 Task Order 3
See A6a indicator pages for detailed data for this indicator.
14%
GHSC-PSM Quarter 1 Report, Fiscal Year 2018 | Annex A. M&E Indicators | 6

IDIQ
FY18Target*
TO1FY18
Target*2017 Q3
2017 Q4
2018 Q1
2018 Q2
TO2FY18
Target*2017 Q3
2017 Q4
2018 Q1
2018 Q2
TO3FY18
Target*2017 Q3
2017 Q4
2018 Q1
2018 Q2
TO4FY18
Target*2017 Q3
2017 Q4
2018 Q1
2018 Q2
FY18Target*
2017 Q3
2017 Q4
2018 Q1
2018 Q2
A10 75% 82% 74% 71% 70% 30% 0.1% 11.0% 24% 29% 95% 100% 98% 99% 99% 55% N/A 98% 100% 100% N/A
A12
A13 N/A <1% 0% 2% 0.4% 0.2% N/A N/A N/A
Suppliers 81% 87% N/A N/A 90% 94% N/A N/A 85% 94% N/A N/A N/A N/A N/A N/A
Laboratory QA 76% 46% 77% 86%
Freight forwarders 69% 64% 76% 73%
A15 N/A 90% 100% 67% N/A N/A N/A
A16 <5% N/A N/A N/A 5% 4% N/A N/A N/A 6% 7% N/A N/A N/A 1% 2% N/A N/A N/A 10% 0% N/A
B1 8% 5% 6% 9% 21% 19% 13% 16% 31% 29% 13% 18% N/A
B2 29% 35% 33% 34% 13% 21% 25% 24% 10% 14% 19% 15% 5% 30% 29% 13% N/A
B3 91% 90% 83% 88% 85% 83% 83% 89% 79% 80% 79% 82% 77% 78% 72% 80% N/A
B4Not
requiredNot
requiredNot
requiredNot
requiredN/A
A9 and A11 have been dropped from the GHSC-PSM M&E plan with approval from USAID.
A13 (out of specification percentage) is not reported for TO1, TO3, or TO4. Reason: QA processes for these TOs are managed by the GHSC-QA project.
A14 (average vendor rating score) is not reported for QA vendors for TO1, TO3, or TO4. Reason: QA processes for these TOs are managed by the GHSC-QA project. Supplier scorecard is undergoing revisions; data to be reported in a future report.
A15 (QA investigation report submission) is not reported for TO1, TO3, or TO4. Reason: QA processes for these TOs are managed by the GHSC-QA project.
*Targets reflect anticipated project performance by end of FY18 (September 30, 2018).
Annual 6.3 AnnualAnnual5.9
Percentage of backlogged line items – %
Set at the country
level
Set at the country
level
Set at the country
level
Set at the country
level
Stockout rate at SDPs – %
Percentage of stock status observations in storage sites where commodities are stocked according to plan, by level in supply system – %
SDP reporting rate to the logistics management information system (LMIS) – %
Average rating of in-country data confidence at the central, subnational, and SDP levels – rating (0-9 scale)
N/A
5.4
Percentage of product procured using a framework contract (framework contract percentage) – %
Percentage of price variance between the median unit price paid during the quarter and the median unit price paid over the life of the project – %
Percentage of batches of product for which the final result is showing nonconformity (out of specification percentage) – %
A14
Percentage of QA investigation reports submitted within 30 calendar days of outcome determination (QA investigation report submission) – %
See A12 indicator page for detailed data for this indicator. Target not required.
Not required
Not required
Not required
Not required
Performance to Date
In-Country Performance and Sustainability
Cross-Cutting
Indicator
Task Order 1 Task Order 2 Task Order 3 Task Order 4
Average vendor rating score – ratingNot
required
100%
5.7 Annual
GHSC-PSM Quarter 1 Report, Fiscal Year 2018 | Annex A. M&E Indicators | 7
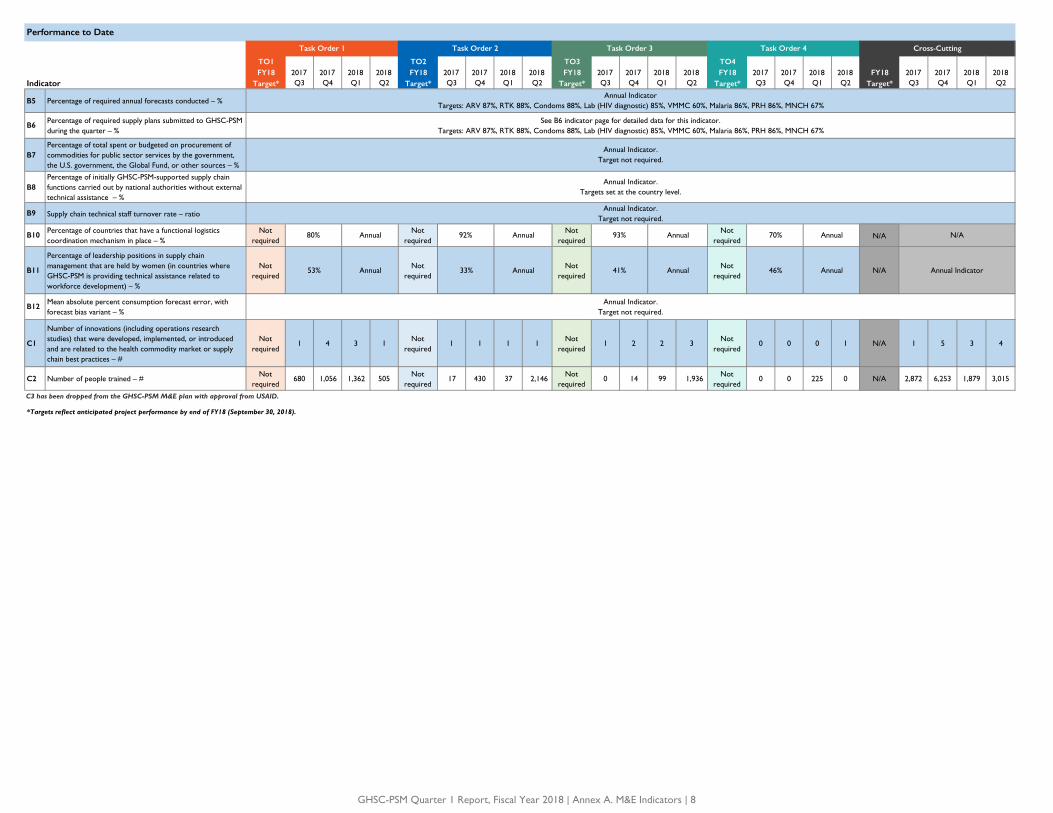
TO1FY18
Target*2017 Q3
2017 Q4
2018 Q1
2018 Q2
TO2FY18
Target*2017 Q3
2017 Q4
2018 Q1
2018 Q2
TO3FY18
Target*2017 Q3
2017 Q4
2018 Q1
2018 Q2
TO4FY18
Target*2017 Q3
2017 Q4
2018 Q1
2018 Q2
FY18Target*
2017 Q3
2017 Q4
2018 Q1
2018 Q2
B5 Percentage of required annual forecasts conducted – %
B6Percentage of required supply plans submitted to GHSC-PSM during the quarter – %
B7Percentage of total spent or budgeted on procurement of commodities for public sector services by the government, the U.S. government, the Global Fund, or other sources – %
B8Percentage of initially GHSC-PSM-supported supply chain functions carried out by national authorities without external technical assistance – %
B9 Supply chain technical staff turnover rate – ratio
B10Percentage of countries that have a functional logistics coordination mechanism in place – %
Not required
Not required
Not required
Not required
N/A
B11
Percentage of leadership positions in supply chain management that are held by women (in countries where GHSC-PSM is providing technical assistance related to workforce development) – %
Not required
Not required
Not required
Not required
N/A
B12Mean absolute percent consumption forecast error, with forecast bias variant – %
C1
Number of innovations (including operations research studies) that were developed, implemented, or introduced and are related to the health commodity market or supply chain best practices – #
Not required
1 4 3 1Not
required1 1 1 1
Not required
1 2 2 3Not
required0 0 0 1 N/A 1 5 3 4
C2 Number of people trained – #Not
required680 1,056 1,362 505
Not required
17 430 37 2,146 Not
required0 14 99 1,936
Not required
0 0 225 0 N/A 2,872 6,253 1,879 3,015
C3 has been dropped from the GHSC-PSM M&E plan with approval from USAID.
*Targets reflect anticipated project performance by end of FY18 (September 30, 2018).
Annual Indicator.Target not required.
Annual Indicator
80% Annual 92% Annual 93% Annual 70%
Annual 46% Annual53% Annual 33% Annual 41%
Performance to Date
Cross-Cutting
Indicator
Task Order 1 Task Order 2 Task Order 3 Task Order 4
Annual IndicatorTargets: ARV 87%, RTK 88%, Condoms 88%, Lab (HIV diagnostic) 85%, VMMC 60%, Malaria 86%, PRH 86%, MNCH 67%
Annual Indicator.Targets set at the country level.
N/A
See B6 indicator page for detailed data for this indicator.Targets: ARV 87%, RTK 88%, Condoms 88%, Lab (HIV diagnostic) 85%, VMMC 60%, Malaria 86%, PRH 86%, MNCH 67%
Annual
Annual Indicator.Target not required.
Annual Indicator. Target not required.
GHSC-PSM Quarter 1 Report, Fiscal Year 2018 | Annex A. M&E Indicators | 8
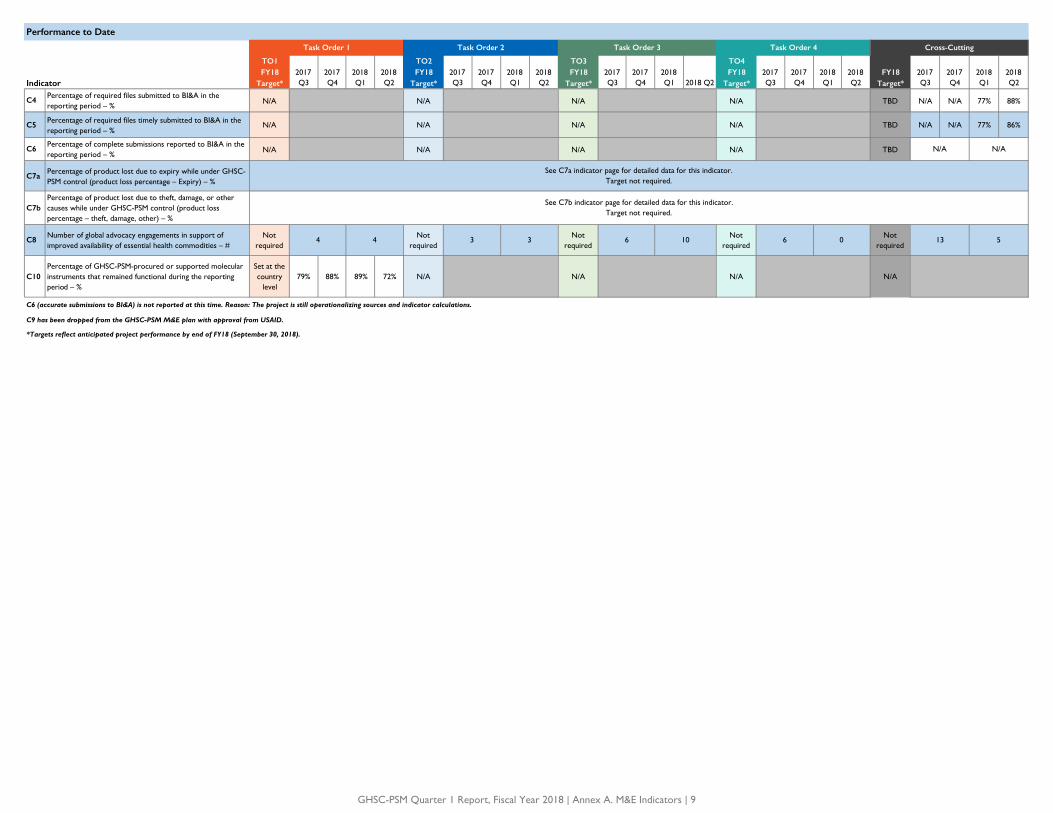
Performance to Date
TO1FY18
Target*2017 Q3
2017 Q4
2018 Q1
2018 Q2
TO2FY18
Target*2017 Q3
2017 Q4
2018 Q1
2018 Q2
TO3FY18
Target*2017 Q3
2017 Q4
2018 Q1 2018 Q2
TO4FY18
Target*2017 Q3
2017 Q4
2018 Q1
2018 Q2
FY18Target*
2017 Q3
2017 Q4
2018 Q1
2018 Q2
C4Percentage of required files submitted to BI&A in the reporting period – %
N/A N/A N/A N/A TBD N/A N/A 77% 88%
C5Percentage of required files timely submitted to BI&A in the reporting period – %
N/A N/A N/A N/A TBD N/A N/A 77% 86%
C6Percentage of complete submissions reported to BI&A in the reporting period – %
N/A N/A N/A N/A TBD
C7aPercentage of product lost due to expiry while under GHSC-PSM control (product loss percentage – Expiry) – %
C7bPercentage of product lost due to theft, damage, or other causes while under GHSC-PSM control (product loss percentage – theft, damage, other) – %
C8Number of global advocacy engagements in support of improved availability of essential health commodities – #
Not required
Not required
Not required
Not required
Not required
C10Percentage of GHSC-PSM-procured or supported molecular instruments that remained functional during the reporting period – %
Set at the country
level79% 88% 89% 72% N/A N/A N/A N/A
C6 (accurate submissions to BI&A) is not reported at this time. Reason: The project is still operationalizing sources and indicator calculations.
C9 has been dropped from the GHSC-PSM M&E plan with approval from USAID.
*Targets reflect anticipated project performance by end of FY18 (September 30, 2018).
0 13 56
Indicator
Task Order 1 Task Order 3Task Order 2
4 4 3 3 6 10
Cross-Cutting
See C7a indicator page for detailed data for this indicator.Target not required.
See C7b indicator page for detailed data for this indicator.Target not required.
Task Order 4
N/A N/A
GHSC-PSM Quarter 1 Report, Fiscal Year 2018 | Annex A. M&E Indicators | 9

Task Order
FY18Target
FY2018 Q2 Year to Date*
TO1 N/A 61% 56%
TO2 N/A 43% 41%
TO3 N/A 94% 90%
TO4 N/A 70% 76%
All TOs 80% 67% 59%
▶
Data Notes
▶
▶
▶
▶
On-time, in-full performance improved from the previous quarter, from 49 to 67 percent. This result shows the outcome of the reduction in the backlog, and achievement in Q1 that has been sustained through Q2 (see indicator A16). With the bulk of lingering backlog now delivered, OTIF results have begun to rise and converge with OTD.
Line items are considered on time if they are delivered between 14 calendar days before and up to 7 calendar days after the agreed delivery date.
All male and female condom and lubricant deliveries are reported under TO1.
Targets reflect anticipated project performance by end of FY18 (September 30, 2018)*Year to Date performance is calculated using all data currently available, which may include data that was not available at the time of reporting for previous quarters. Current year to date figures may differ slightly from a calcuation derived from previously reported data.
Analysis
A1a. Percentage of line items delivered on time and in full, within the minimum delivery window
Measure DefinitionAchievement
Numerator: Number of line items delivered to the recipient on time and in full during the quarter.Denominator: Total number of line items delivered to the recipient during the quarter.Purpose: On time, in full (OTIF) is a measure of supply chain reliability. This indicator depicts the degree to which the right products are delivered on time (defined for the project as no more than 14 days before or 7 days after the agreed delivery date) and in the right quantity, as specified by the customer.
Indicator Performance FY2018 Q2
61%
43%
94%
70% 67%
0%
20%
40%
60%
80%
100%
Task Order 1 Task Order 2 Task Order 3 Task Order 4 All Task Orders
% o
f Shi
pmen
ts
Task Order 1 Task Order 2 Task Order 3 Task Order 4 All Task Orders
n=1,042
n=82
n=137
n=41
n=311 n=10 n=1,500
80%FY18 Target
GHSC-PSM Quarter 1 Report, Fiscal Year 2018 | Annex A. M&E Indicators | 10

Tot
al n
umbe
r of
line
item
s de
liver
ed
Num
ber
of li
ne it
ems
deliv
ered
on
time
and
in fu
ll
On
time
in fu
ll (%
)
Malaria
Tot
al n
umbe
r of
line
item
s de
liver
ed
Num
ber
of li
ne it
ems
deliv
ered
on
time
and
in fu
ll
On
time
in fu
ll (%
)
PRH - Method Level
Tot
al n
umbe
r of
line
item
s de
liver
ed
Num
ber
of li
ne it
ems
deliv
ered
on
time
and
in fu
ll
On
time
in fu
ll (%
)
Maternal and Child Health
Tot
al n
umbe
r of
line
item
s de
liver
ed
Num
ber
of l
ine
item
s de
liver
ed o
n tim
e an
d in
full
On
time
in fu
ll (%
)
1,042 640 61% Task Order 2 137 59 43% Task Order 3 311 292 94% Task Order 4 10 7 70%
103 44 43% ACTs 50 31 62% Combined Oral Contraceptives 8 5 63% Laboratory
67 58 87% LLIN 37 8 22% Copper-bearing Intrauterine Devices 8 8 100% Other Non-pharma
24 0 0% Other Pharma 1 1 100% Emergency Oral Contraceptives Other Pharma 10 7 70%
RDTs 6 3 50% Implantable Contraceptives 17 13 76%
591 413 70% Severe Malaria Medicines 12 3 25% Injectable Contraceptives 19 11 58%
77 47 61% Sulphadoxine-pyrimethamine 9 1 11% Progestin-only Pills 4 3 75%
84 33 39% All Other Non-pharma 22 12 55% Standard Days Method 2 1 50%
6 3 50% All Other TO3 Products 253 251 99%
62 28 45%
28 14 50%
Blank rows indicate that no line items for these product categories were delivered this quarter.
Prefab
Vehicles and Other Equipment
VMMC
HIV RTK
Laboratory
Other Non-pharma
Other Pharma
Other RTK
Pediatric ARVs
A1a. Percentage of line items delivered on time and in full, within the minimum delivery window (tracer product category)
HIV
Task Order 1
Adult ARVs
Condoms
Food and WASH
GHSC-PSM Quarter 1 Report, Fiscal Year 2018 | Annex A. M&E Indicators | 11
Task Order
FY18Target
FY2018 Q2 Year to Date*
TO1 N/A 69% 71%
TO2 N/A 46% 51%
TO3 N/A 94% 92%
TO4 N/A 89% 86%
All TOs 80% 73% 72%
▶
▶
▶
▶
▶
▶ All male and female condom and lubricant deliveries are reported under TO1.
▶ Targets reflect anticipated project performance by end of FY18 (September 30, 2018).
▶
Overall OTD performance has remained steady from the first quarter, at 72 percent in Q1 to 73 percent in Q2. The project also had a higher volume of commitments this quarter, rising from 1,174 at the time of reporting last quarter to 1,498 in Q2.
Task Order 3 saw a strong improvement, from 79 to 94 percent on-time deliveries from Q1 to Q2. The number of commitments also increased, due to Ebola orders with a large number of line items, nearly all of which were delivered on time.
Task Order 2 performance fell, from 59 percent in Q1 to 46 percent in Q2. This was driven by three factors: poor supplier performance, the lagging effect of earlier orders for which our delivery commitments were poorly set, and a large number of deliveries to three countries with long waiver lead times. The project has implemented initiatives to address supplier performance, increase the accuracy of our delivery commitments, and reduce long waiver lead times.
Task Order 1 performance fell slightly from the previous quarter, from 73 to 69 percent. There were improvements in some key product categories, including pediatric ARVs (59 to 73 percent) and condoms (62 to 81 percent).
Data Notes
Line items are considered on time if they are delivered between 14 calendar days before and up to 7 calendar days after the agreed delivery date.
*Year to Date performance is calculated using all data currently available, which may include data that were not available at the time of reporting for previous quarters. Current year-to-date figures may differ slightly from a calcuation derived from previously reported data.
Analysis
A1b. Percentage of line items delivered on time, within the minimum delivery window
Measure DefinitionAchievement
Numerator: Number of line items with an agreed delivery date during the quarter that were delivered to the recipient on time.Denominator: Total number of line items with an agreed delivery date during the quarter.Purpose: On time delivery (OTD) is an essential, industry-standard measure of supply chain reliability. It reflects the extent to which customers can be confident that their order will arrive at the right time, defined for the project as no more than 14 days before or 7 days after the agreed delivery date.
Indicator Performance FY2018 Q2
69%
46%
94% 89%
73%
0%
20%
40%
60%
80%
100%
Task Order 1 Task Order 2 Task Order 3 Task Order 4 All Task Orders
% o
f Lin
e Ite
ms
Del
iver
ed O
n T
ime
Task Order 1 Task Order 2 Task Order 3 Task Order 4 All Task Orders
80%FY18 Target
n=1,013n= 34n=331
n=145
n=9n=1,498
GHSC-PSM Quarter 1 Report, Fiscal Year 2018 | Annex A. M&E Indicators | 12
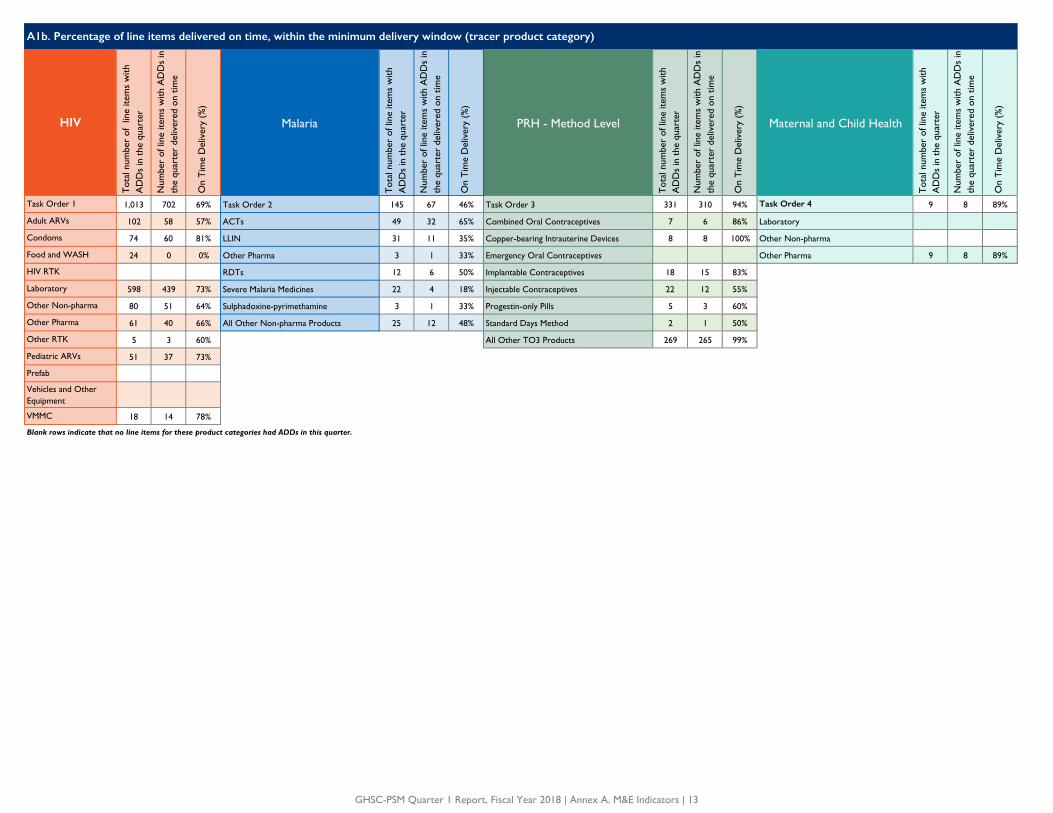
Tot
al n
umbe
r of
lin
e ite
ms
with
A
DD
s in
the
qua
rter
Num
ber
of li
ne it
ems
with
AD
Ds
in
the
quar
ter
deliv
ered
on
time
On
Tim
e D
eliv
ery
(%)
Malaria
Tot
al n
umbe
r of
line
item
s w
ith
AD
Ds
in t
he q
uart
er
Num
ber
of li
ne it
ems
with
AD
Ds
in
the
quar
ter
deliv
ered
on
time
On
Tim
e D
eliv
ery
(%)
PRH - Method Level
Tot
al n
umbe
r of
line
item
s w
ith
AD
Ds
in t
he q
uart
er
Num
ber
of li
ne it
ems
with
AD
Ds
in
the
quar
ter
deliv
ered
on
time
On
Tim
e D
eliv
ery
(%)
Maternal and Child Health
Tot
al n
umbe
r of
line
item
s w
ith
AD
Ds
in t
he q
uart
er
Num
ber
of li
ne it
ems
with
AD
Ds
in
the
quar
ter
deliv
ered
on
time
On
Tim
e D
eliv
ery
(%)
1,013 702 69% Task Order 2 145 67 46% Task Order 3 331 310 94% Task Order 4 9 8 89%
102 58 57% ACTs 49 32 65% Combined Oral Contraceptives 7 6 86% Laboratory
74 60 81% LLIN 31 11 35% Copper-bearing Intrauterine Devices 8 8 100% Other Non-pharma
24 0 0% Other Pharma 3 1 33% Emergency Oral Contraceptives Other Pharma 9 8 89%
RDTs 12 6 50% Implantable Contraceptives 18 15 83%
598 439 73% Severe Malaria Medicines 22 4 18% Injectable Contraceptives 22 12 55%
80 51 64% Sulphadoxine-pyrimethamine 3 1 33% Progestin-only Pills 5 3 60%
61 40 66% All Other Non-pharma Products 25 12 48% Standard Days Method 2 1 50%
5 3 60% All Other TO3 Products 269 265 99%
51 37 73%
18 14 78%
Blank rows indicate that no line items for these product categories had ADDs in this quarter.
Prefab
Vehicles and Other Equipment
VMMC
HIV RTK
Laboratory
Other Non-pharma
Other Pharma
Other RTK
Pediatric ARVs
A1b. Percentage of line items delivered on time, within the minimum delivery window (tracer product category)
HIV
Task Order 1
Adult ARVs
Condoms
Food and WASH
GHSC-PSM Quarter 1 Report, Fiscal Year 2018 | Annex A. M&E Indicators | 13
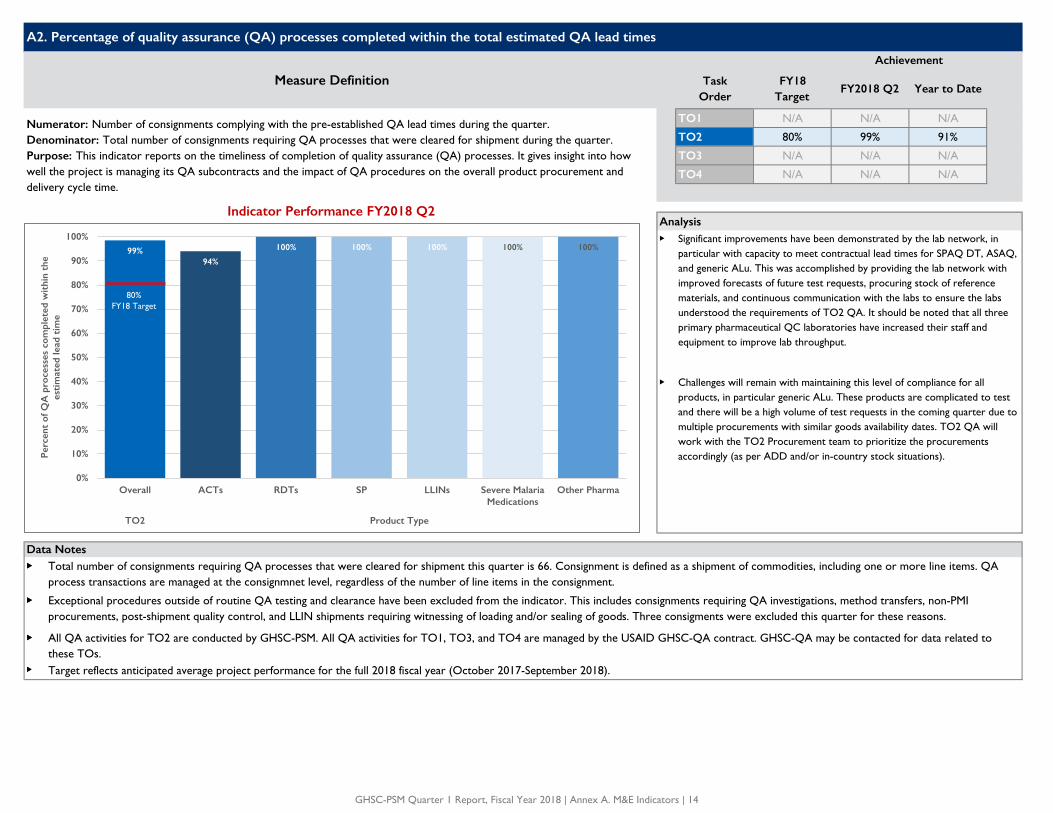
Task Order
FY18Target
FY2018 Q2 Year to Date
TO1 N/A N/A N/A
TO2 80% 99% 91%
TO3 N/A N/A N/A
TO4 N/A N/A N/A
▶
▶
▶▶
▶▶
▶▶
▶▶
Significant improvements have been demonstrated by the lab network, in particular with capacity to meet contractual lead times for SPAQ DT, ASAQ, and generic ALu. This was accomplished by providing the lab network with improved forecasts of future test requests, procuring stock of reference materials, and continuous communication with the labs to ensure the labs understood the requirements of TO2 QA. It should be noted that all three primary pharmaceutical QC laboratories have increased their staff and equipment to improve lab throughput.
Challenges will remain with maintaining this level of compliance for all products, in particular generic ALu. These products are complicated to test and there will be a high volume of test requests in the coming quarter due to multiple procurements with similar goods availability dates. TO2 QA will work with the TO2 Procurement team to prioritize the procurements accordingly (as per ADD and/or in-country stock situations).
Data NotesTotal number of consignments requiring QA processes that were cleared for shipment this quarter is 66. Consignment is defined as a shipment of commodities, including one or more line items. QA process transactions are managed at the consignmnet level, regardless of the number of line items in the consignment.
Exceptional procedures outside of routine QA testing and clearance have been excluded from the indicator. This includes consignments requiring QA investigations, method transfers, non-PMI procurements, post-shipment quality control, and LLIN shipments requiring witnessing of loading and/or sealing of goods. Three consigments were excluded this quarter for these reasons.
All QA activities for TO2 are conducted by GHSC-PSM. All QA activities for TO1, TO3, and TO4 are managed by the USAID GHSC-QA contract. GHSC-QA may be contacted for data related to these TOs.Target reflects anticipated average project performance for the full 2018 fiscal year (October 2017-September 2018).
A2. Percentage of quality assurance (QA) processes completed within the total estimated QA lead times
Measure Definition
Achievement
Numerator: Number of consignments complying with the pre-established QA lead times during the quarter.Denominator: Total number of consignments requiring QA processes that were cleared for shipment during the quarter.Purpose: This indicator reports on the timeliness of completion of quality assurance (QA) processes. It gives insight into how well the project is managing its QA subcontracts and the impact of QA procedures on the overall product procurement and delivery cycle time.
Indicator Performance FY2018 Q2Analysis
99%94%
100% 100% 100% 100% 100%
0%
10%
20%
30%
40%
50%
60%
70%
80%
90%
100%
Overall ACTs RDTs SP LLINs Severe Malaria Medications
Other Pharma
TO2 Product Type
Perc
ent
of Q
A p
roce
sses
com
plet
ed w
ithi
n th
e es
tim
ated
lead
tim
e
80%FY18 Target
GHSC-PSM Quarter 1 Report, Fiscal Year 2018 | Annex A. M&E Indicators | 14
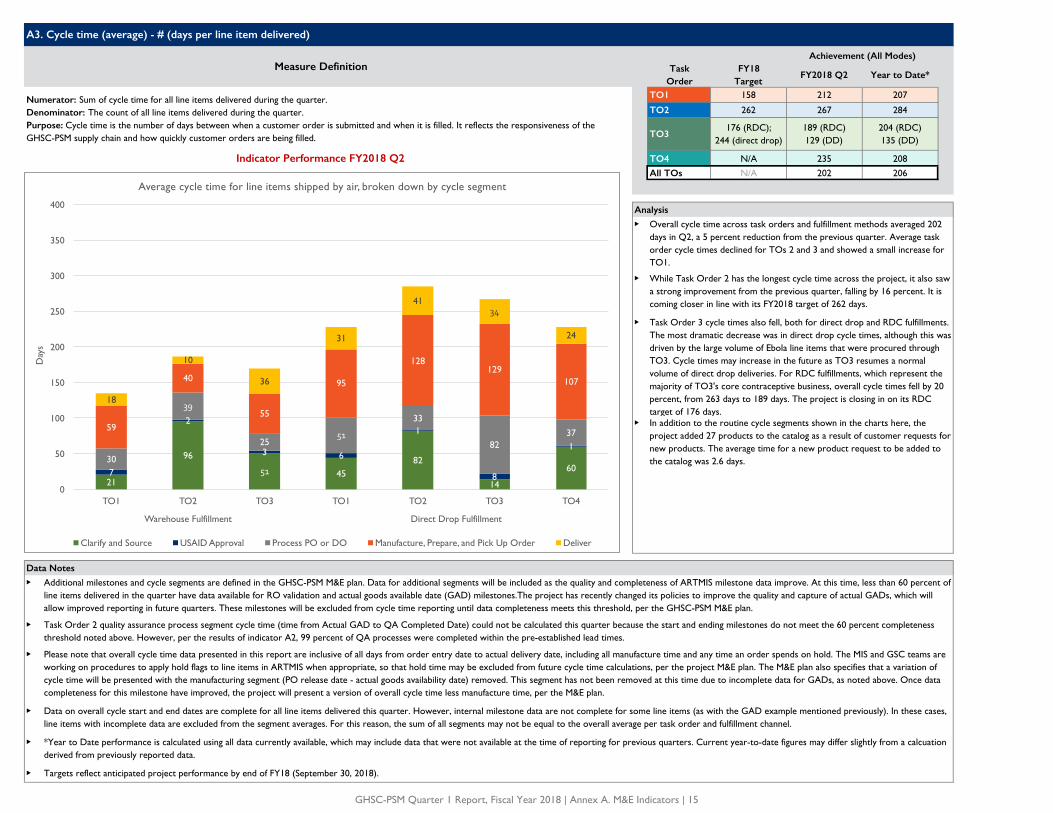
Task Order
FY18Target
FY2018 Q2 Year to Date*
TO1 158 212 207
TO2 262 267 284
TO3176 (RDC);
244 (direct drop)189 (RDC)129 (DD)
204 (RDC)135 (DD)
TO4 N/A 235 208
All TOs N/A 202 206
▶
▶
▶
▶
Data Notes
▶
▶
▶
▶
▶
▶
A3. Cycle time (average) - # (days per line item delivered)
Measure DefinitionAchievement (All Modes)
Numerator: Sum of cycle time for all line items delivered during the quarter.Denominator: The count of all line items delivered during the quarter.Purpose: Cycle time is the number of days between when a customer order is submitted and when it is filled. It reflects the responsiveness of the GHSC-PSM supply chain and how quickly customer orders are being filled.
Indicator Performance FY2018 Q2
Analysis
Overall cycle time across task orders and fulfillment methods averaged 202 days in Q2, a 5 percent reduction from the previous quarter. Average task order cycle times declined for TOs 2 and 3 and showed a small increase for TO1.
While Task Order 2 has the longest cycle time across the project, it also saw a strong improvement from the previous quarter, falling by 16 percent. It is coming closer in line with its FY2018 target of 262 days.
Task Order 3 cycle times also fell, both for direct drop and RDC fulfillments. The most dramatic decrease was in direct drop cycle times, although this was driven by the large volume of Ebola line items that were procured through TO3. Cycle times may increase in the future as TO3 resumes a normal volume of direct drop deliveries. For RDC fulfillments, which represent the majority of TO3's core contraceptive business, overall cycle times fell by 20 percent, from 263 days to 189 days. The project is closing in on its RDC target of 176 days.
Data on overall cycle start and end dates are complete for all line items delivered this quarter. However, internal milestone data are not complete for some line items (as with the GAD example mentioned previously). In these cases, line items with incomplete data are excluded from the segment averages. For this reason, the sum of all segments may not be equal to the overall average per task order and fulfillment channel.
*Year to Date performance is calculated using all data currently available, which may include data that were not available at the time of reporting for previous quarters. Current year-to-date figures may differ slightly from a calcuation derived from previously reported data.
Targets reflect anticipated project performance by end of FY18 (September 30, 2018).
In addition to the routine cycle segments shown in the charts here, the project added 27 products to the catalog as a result of customer requests for new products. The average time for a new product request to be added to the catalog was 2.6 days.
Additional milestones and cycle segments are defined in the GHSC-PSM M&E plan. Data for additional segments will be included as the quality and completeness of ARTMIS milestone data improve. At this time, less than 60 percent of line items delivered in the quarter have data available for RO validation and actual goods available date (GAD) milestones.The project has recently changed its policies to improve the quality and capture of actual GADs, which will allow improved reporting in future quarters. These milestones will be excluded from cycle time reporting until data completeness meets this threshold, per the GHSC-PSM M&E plan.
Task Order 2 quality assurance process segment cycle time (time from Actual GAD to QA Completed Date) could not be calculated this quarter because the start and ending milestones do not meet the 60 percent completeness threshold noted above. However, per the results of indicator A2, 99 percent of QA processes were completed within the pre-established lead times.
Please note that overall cycle time data presented in this report are inclusive of all days from order entry date to actual delivery date, including all manufacture time and any time an order spends on hold. The MIS and GSC teams are working on procedures to apply hold flags to line items in ARTMIS when appropriate, so that hold time may be excluded from future cycle time calculations, per the project M&E plan. The M&E plan also specifies that a variation of cycle time will be presented with the manufacturing segment (PO release date - actual goods availability date) removed. This segment has not been removed at this time due to incomplete data for GADs, as noted above. Once data completeness for this milestone have improved, the project will present a version of overall cycle time less manufacture time, per the M&E plan.
21
96
51 4582
14
607
2
3 6
1
8
130
39
2551
33
823759
40
55
95
128129
107
18
10
36
31
4134
24
0
50
100
150
200
250
300
350
400
TO1 TO2 TO3 TO1 TO2 TO3 TO4
Warehouse Fulfillment Direct Drop Fulfillment
Day
s
Average cycle time for line items shipped by air, broken down by cycle segment
Clarify and Source USAID Approval Process PO or DO Manufacture, Prepare, and Pick Up Order Deliver
GHSC-PSM Quarter 1 Report, Fiscal Year 2018 | Annex A. M&E Indicators | 15

Task Order
FY18Target
FY2018 Q2 Year to Date*
TO1 158 212 207
TO2 262 267 284
TO3176 (RDC);
244 (direct drop)189 (RDC)129 (DD)
204 (RDC)135 (DD)
TO4 N/A 235 208
All TOs N/A 202 206
▶
Data Notes
▶
▶
A3. Cycle time (average) - # (days per line item delivered)
Measure DefinitionAchievement (All Modes)
Numerator: Sum of cycle time for all line items delivered during the quarter.Denominator: The count of all line items delivered during the quarter.Purpose: Cycle time is the number of days between when a customer order is submitted and when it is filled. It reflects the responsiveness of the GHSC-PSM supply chain and how quickly customer orders re being filled.
Indicator Performance FY2018 Q2
Analysis
One line item was shipped from the RDC via land for Task Order 3, which is not pictured in the chart to the left. The item had an overall cycle time of 578 days. The item was an injectables order for Mozambique that was placed far in advance of the time it was required in country. The cycle included a long dwell time between the order entry date and recipient approval, as the order was not needed in country for nearly two years after the order entry date. The project is still working to develop policies for identifying dwell times that are the result of advanced planning, so that they may be removed from the active cycle times.
See above
Manufacture/Pick Up and Deliver segments have been combined for TO2 Director Drop via land in the above chart due to incomplete milestone data.
243
4378 64
97 10569
34 27
36
4
31
57 6
37
57
12
4372
6177
34
45
45
93
114
85 2458
37
50
62
72
66
91
518
2
58
0
50
100
150
200
250
300
350
400
TO1 TO3 TO1 TO2 TO3 TO4 TO1 TO1 TO2
Warehouse Fulfillment (Sea) Direct Drop Fulfillment (Sea) Warehouse Fulfillment
(Land)
Direct Drop Fulfillment (Land)
Day
s
Average cycle time for line items shipped by sea and land, broken down by cycle segment
Clarify and Source USAID Approval Process PO or DO
Manufacture/Prepare and Pick up Order Deliver Manufacture and Deliver
GHSC-PSM Quarter 1 Report, Fiscal Year 2018 | Annex A. M&E Indicators | 16

Land Land Air Sea Land
War
ehou
se F
ulfil
lmen
t
Dir
ect
Dro
p Fu
lfillm
ent
War
ehou
se F
ulfil
lmen
t
Dir
ect
Dro
p Fu
lfillm
ent
War
ehou
se F
ulfil
lmen
t
Dir
ect
Dro
p Fu
lfillm
ent
War
ehou
se F
ulfil
lmen
t
Dir
ect
Dro
p Fu
lfillm
ent
War
ehou
se F
ulfil
lmen
t
Dir
ect
Dro
p Fu
lfillm
ent
Dir
ect
Dro
p Fu
lfillm
ent
War
ehou
se F
ulfil
lmen
t
Dir
ect
Dro
p Fu
lfillm
ent
War
ehou
se F
ulfil
lmen
t
Dir
ect
Dro
p Fu
lfillm
ent
War
ehou
se F
ulfil
lmen
t
Dir
ect
Dro
p Fu
lfillm
ent
Dir
ect
Dro
p Fu
lfillm
ent
Dir
ect
Dro
p Fu
lfillm
ent
# of Line Items Delivered
1,042 16 583 5 121 14 303# of Line Items Delivered
137 11 85 30 11# of Line Items Delivered
311 25 262 16 7 1# of Line Items Delivered
10 8 2
Task Order 1 212 131 218 377 293 202 171 Task Order 2 267 177 298 264 126 Task Order 3 137 171 124 193 317 578 Task Order 4 235 230 254
Adult ARVs 241 116 251 246 194 ACTs 254 177 275Combined Oral Contraceptives
199 128 198 483 Laboratory
Condoms 208 214 377 312 94 LLIN 316 460 265 618Copper-bearing Intrauterine Devices
132 126 169 Other Pharma 235 230 254
Food and WASH 261 261 Other Pharma 76 76Emergency Oral Contraceptives
HIV RTK RDTs 271 271Implantable Contraceptives
260 222 359 156 386
Laboratory 190 191 350 173Severe Malaria Medicines
441 414Injectable Contraceptives
247 132 332 222 261 578
Other Non-pharma 221 228 179 217Sulphadoxine-pyrimethamine
277 277 Progestin-only Pills 219 287 151
Other Pharma 276 182 270 398 291All Other Non-pharma
140 170 263 77Standard Days Method
301 301
Other RTK 214 214All Other TO3 Products
116 115 308
Pediatric ARVs 258 88 270 298 228
Prefab
Vehicles and Other Equipment
VMMC 232 114 268 135 135
Blank rows indicate that no line items for these product categories were delivered this quarter.
Air Sea
Maternal and Child Health
A3. Cycle time (average) - Tracer product category
HIV A
ll ch
anne
ls a
nd m
odes
Air Sea Land
Malaria
All
chan
nels
and
mod
es
Air
All
chan
nels
and
mod
es
Sea
PRH - Method Level
All
chan
nels
and
mod
es
GHSC-PSM Quarter 1 Report, Fiscal Year 2018 | Annex A. M&E Indicators | 17

AchievementTask
OrderAnnualTarget
FY2018 Q1-2
TO1 N/A 7.1%
TO2 N/A 15.8%
TO3 N/A 9.3%
TO4 N/A 19.3%
All TOs 8% 9.1%
▶
▶
▶
▶
▶
▶
▶
▶
The largest cost category for the project is drop ship freight, which reflects the freight costs associated with direct drop shipments from suppliers to customers. The reflects the project's recent strategy of a relatively greater proportion of direct drops compared to RDC fulfillments (with the exception of TO3). As the project channels more orders through the RDCs, drop ship freight costs are expected to fall. Inbound and outbound freight and warehousing costs may then rise as a proportion of overall logistics spend, but costs are expected to remain under control as a result of savings from the new warehouse configuration and competitive freight lane procurement.
Task Order 3 fulfills most orders through RDCs, which is reflected in its relatively greater proportion of outbound freight costs compared to drop ship.
Improved efficiencies are also evident in the increased volume that GHSC-PSM has been able to deliver in the current period. FY2017 deliveries totaled approximately $400 million; GHSC-PSM has already delivered over $350 million in the first half of FY2018.
Per agreement with USAID, QA costs are not included in this indicator, since GHSC-PSM does not manage QA across all TOs. For TO2, where QA is managed by GHSC-PSM, the total landed cost with QA costs included is $11.8 million (up from $11.3 million without QA). As a percentage of commodities delivered, total landed costs rises from 15.8 percent to 16.6 percent with QA costs included.
Data Notes
Total landed costs includes all costs paid between October 2017 and March 2018, per Chemonics' financial management information system. Total value of commodtiies delivered includes total value of all line items delivered to customers with an actual delivery date during the same period, per ARTMIS. The indicator includes both GSC and decentralized procurement costs and delivery values.
Condom and lubricant deliveries and freight costs are reported under the TO that funded them.
The source for expenditures data is the project's Monthly Financial Statement. For this report, the project made one adjustment to correct for a large credit to the Warehousing cost category, recevied from a supplier for whom the project had previously stored a large quantity of product. This indicator was calcuatred with that credit removed, to more accurately capture actual Warehousing expenditures during the period.
Total landed costs for logistics, as a percentage of total value of commodities delivered, is 9.1 percent across all TOs. This represents a similar cost-per-dollar compared to FY2017 performance (also about 9 percent). The largest reduction is in Task Order 3, which saw its total landed costs fall to 9.3 percent in the first half of FY2018.
A5. Total landed cost (logistics costs only)
Measure Definition
Numerator: Sum of all logistics costs (in USD) paid by GHSC-PSM during the reporting period.Denominator: Total value of commodities delivered to customers during the reporting period.
Indicator Performance
Analysis$17.8
$11.3
$3.0
$0.2
$0
$2
$4
$6
$8
$10
$12
$14
$16
$18
TO1 TO2 TO3 TO4
Tota
l Lan
ded
Cos
t (
$ M
illio
n)
Inbound Freight Warehousing Loss Insurance Outbound Freight Drop Ship Freight Other costs
$294 m $32 mTotal Value of Commodities Delivered:
$71 m $1 m
7.1% 15.8%Total Landed Cost as a % of Comm. Value:
9.3% 19.3%
GHSC-PSM Quarter 1 Report, Fiscal Year 2018 | Annex A. M&E Indicators | 18
AchievementTask
OrderAnnualTarget
FY2018 Q1-2
TO1 N/A 12.2%
TO2 N/A 19.4%
TO3 N/A 14.6%
TO4 N/A 50.7%
All TOs N/A 13.9%
▶
▶
▶
▶
▶
▶
A5. Total landed costs (logistics and HQ operations costs)
Measure Definition
Numerator: Sum of all commodity-related and HQ operations costs (in USD) paid by GHSC-PSM during the reporting period.Denominator: Total value of commodities delivered to customers during the reporting period.
Indicator Performance
Analysis
Total landed costs, including all logistics costs and HQ supply chain operations, as a percentage of total value delivered, is 13.9 percent for the first half of FY2018.
The greatest headquaters cost reductions were in MIS and procurement. MIS costs were expected to fall after the initial buildout of ARTMIS was completed. Procurement costs, as a proportion of HQ operations costs, have fallen 20 percent compared to FY2017, while delivery volume has increased significantly. This suggests greater efficiencies across procurement, as the commodity teams have increased their output.
Per agreement with USAID, QA costs are not included in this indicator, since GHSC-PSM does not manage QA across all TOs. For TO2, where QA is managed by GHSC-PSM, the total landed cost (both logistics and HQ operations) included is $14.5 million, up from $13.8 with QA excluded. As a percentage of commodities delivered, total landed cost rises from 19.4 percent to 20.5 percent.
Data Notes
Total landed costs includes all costs paid between October 2017 and March 2018, per Chemonics' financial management information system. Total value of commodtiies delivered includes total value of all line items delivered to customers with an Actual Delivery Date during the same period, per ARTMIS. The indicator includes both GSC and decentralized procurement costs and delivery values.
Condom and lubricant deliveries and freight costs are reported under the TO that funded them.
The source for expenditures data is the project's Monthly Financial Statement. For this report, the project made one adjustment to correct for a large credit to the Warehousing cost category, recevied from a supplier for whom the project had previously stored a large quantity of product. This indicator was calcuatred with that credit removed, to more accurately capture actual Warehousing expenditures during the period.
$30.3
$13.8
$4.7
$0.5
$0
$5
$10
$15
$20
$25
$30
$35
TO1 TO2 TO3 TO4
Tota
l lan
ded
cost
($
Mill
ion)
Inbound Freight Warehousing Loss Insurance
Outbound Freight Drop Ship Freight Other costs Forecasting and Supply Planning
Procurement Warehousing and Distribution Monitoring and Evaluation MIS
$249 m $32 mTotal Value of Commodities Delivered:
$71 m $1 m
12.2% 19.4%Total Landed Cost (all) as a % of Comm. Value:
14.6% 50.7%
GHSC-PSM Quarter 1 Report, Fiscal Year 2018 | Annex A. M&E Indicators | 19
ProductFY18 Target:
MAPESupply plan error (%)
Supply plan bias (%)
MAPE (%) Supply plan
bias (%)
Adult ARV 30% 24% 24% 20% 20%
Pediatric ARV 30% 39% -39% 10% -10%
Lab 30% 48% 47% 20% 20%
▶
▶
▶
▶▶
▶▶ Supply plan error:
MAPE:
Supply plan bias (last four quarters):
Supply plan bias definitions are under review and may be refined in the future.
▶▶ ▶▶ ▶▶
Analysis
While supply plan error increased for adult and pediatric ARVs compared to the previous quarter, there was a small improvement for lab items. Mean absolute percent error over the last four quarters is within the targeted range for all categories.Variance for adult ARVs was driven by a large order of more than 2 million units for Tanzania, which had not appeared in early supply plans.
The Plan team is supporting the FASP team's review of country supply plans and recommending updates regarding alignment of supply plans and orders. They are also working with the Health Systems Strengthening lab team to identify areas where more data are needed, especially as related to large order quantities.
Data NotesPlanned quantities are drawn from an aggregation of country supply plans submitted in the prior quarter, including only the quanties that are forecasted to be procured through GHSC-PSM. Actual quantities are derived based on the requested delivery dates for products included in customer ROs submitted to ARTMIS.See GHSC-PSM's IDIQ Monitoring and Evaluation Plan for complete details on indicator defintions and calculations. Simplifed versions of the definitions are provided below for reference:
Supply plan bias:
Negative supply plan bias indicates fewer products requested compared to the forecast. Positive supply plan bias indicates more products ordered than forecasted. At the present time, GHSC-PSM does not measure supply plan accuracy for TO2 or TO4. Forecast accuracy (indicator A6b) is measured for TO3.Targets reflect anticipated project performance on the four-quarters MAPE indicator by end of FY18 (September 30, 2018).
Indicator Performance FY2018 Q2
A6a. Absolute percent supply plan error, with variants mean absolute percent error (MAPE) and supply plan bias
Measure Definition
FY2018 Q2 Last Four Quarters
Numerator: Absolute value of the differences between the actual quantities with requested delivery dates during the quarter minus the quantities planned for delivery according to country supply plans.Denominator: Sum of the actual quantities with requested delivery dates during the quarter.See Data Notes below for variant definitions.Purpose: This indicator looks at how well country commodity supply plans match the commodities which were actually delivered. It is used to assess the accuracy of country supply plans and to promote efficient supply management practices.
20%
10%
20%24
%
39%
48%
24%
-39%
47%
Adult ARV Pediatric ARV Lab-50%
-40%
-30%
-20%
-10%
0%
10%
20%
30%
40%
50%
60%
Perc
ent
Erro
r
Mean Absolute Percentage Error (MAPE, last 4 quarters) Absolute Percent Error (APE) - Q2 Supply Plan Bias - Q2
30%FY18 Target
GHSC-PSM Quarter 1 Report, Fiscal Year 2018 | Annex A. M&E Indicators | 20

Target Annual
ProductFY18 Target:
MAPE
Absolute percent error
(%)
Forecast bias (%)
MAPE (%) Forecast bias
(%)
Injectable 35% 42% 42% 33% 33%
Implant 35% 57% 57% 34% 34%
Combined Oral 35% 47% 47% 5% -5%
Copper IUD 35% 4% 4% 52% -52%
Progestin Pill 35% 0% 0% 122% -122%
Condoms 35% 20% 20% 6% 6%
▶
▶
▶▶
▶▶ Absolute percent error:
MAPE:
Forecast bias (last four quarters):
Forecast bias definitions are under review and may be refined in the future. ▶▶ ▶▶ ▶▶
Indicator Performance FY2018 Q2
A6b. Absolute percent forecast error, with variants mean absolute percent error (MAPE) and forecast bias
Measure Definition
FY2018 Q2 Last Four Quarters
Numerator: Absolute value of the differences between the actual quantities with requested delivery dates during the quarter minus the quantities planned for delivery according to the global demand forecast.Denominator: Sum of the actual quantities with requested delivery dates during the quarter.See Data Notes below for variant definitions.Purpose: This indicator looks at how well country global demand forecasts for commodities (based on the country supply plan together with variables such as country order history, data from planning groups, and global market dynamics) match the commodities actually delivered. It will be used to assess the accuracy of the global demand forecasts and promote efficient supply management practices.
Targets reflect anticipated project performance on the four-quarters MAPE indicator by end of FY18 (September 30, 2018).
Analysis
Copper IUDs and progestin-only pills had strong performance this quarter, due largely to lack of new demand and minimal changes to order quantities and requested delivery dates. However, variance in previous periods contributed to relatively greater rates of mean absolute percent error (MAPE) over the last four quarters.
Forecast variance for injectables, implants, and combined oral contraceptives was due to orders placed with less than one-quarter requested lead time, resulting in underforecasting.
Data NotesForecasted or planned quantities are drawn from the GHSC-PSM global demand forecasts for each product, which are based on an aggregation of country supply plans submitted in the prior quarter and additional inputs, such as country order history, data from coordinated planning groups, and global market dynamics indicators. Actual quantities are derived based on the requested delivery dates for products included in customer ROs submitted to ARTMIS.See GHSC-PSM's IDIQ Monitoring and Evaluation Plan for complete details on indicator defintions and calculations. Simplifed versions of the definitions are provided below for reference:
Forecast bias:
Negative forecast bias indicates fewer products requested compared to the forecast. Positive forecast bias indicates more products ordered than forecasted. At the present time, GHSC-PSM does not create demand forecasts for TO2 or TO4. Supply plan error (indicator A6a) is measured for TO1.
33% 34%
5%
52%
122%
6%
42%
57%
47%
4%0%
20%
42%
57%
47%
4%0%
20%
Injectable Implantable Combined Oral Contraceptive
Copper IUD Progestin-Only Pill Condoms-10%
10%
30%
50%
70%
90%
110%
130%
Perc
ent
Erro
r
Mean Absolute Percentage Error (MAPE, last 4 quarters) Absolute Percent Error (APE) - Q2 Forecast Bias - Q2
35%FY18 Target
GHSC-PSM Quarter 1 Report, Fiscal Year 2018 | Annex A. M&E Indicators | 21

Task Order
FY18Target
FY2018 Q2 Year to Date
TO1 78% 81% 81%
TO2 70% 74% 74%
TO3 75% 84% 82%
TO4 N/A N/A NA
All TOs NA 81% 81%
▶
▶
▶
▶▶
▶▶
▶▶
▶▶
A8. Average percentage of shelf life remaining for warehoused commodities, weighted by the value of each commodity’s stock (product at risk percentage)
Measure DefinitionAchievement
Numerator: Percentage of shelf life remaining at the end of the quarter, weighted by value of commodities, summed across all products.Denominator: Total value of commodities, summed across all products, at the end of the quarter.Purpose: This indicator, a measure of warehouse efficiency at GHSC-PSM regional distribution centers (RDCs) or stockpiles, can be used to gauge the amount of product that is at risk of expiration in a specified time. The information it provides helps maximize the efficiency of product turnover.
Indicator Performance FY2018 Q2
Analysis
Shelf life remaining was consistent from Q1, with overall percentages remaining the same (TO1 and TO4), or moving up slightly (TO3). All task orders are in line with their FY2018 targets.
Task Order 2 maintained strong shelf life performance while also significantly increasing inventory, from $566,502 at the end of Q1 to more than $4 million at the close of Q2. Most of the increased volume has already been allocated to country orders and is expected to continue moving, maintaining good shelf life performance.Task Order 3 shelf life remaining increased slightly from quarter 1, rising from 81 to 84 percent. Most of the increase is due to an inbound delivery of 1-rod implants, which replenished limited stock of this item with fresh product.
Targets reflect anticipated project performance by end of FY18 (September 30, 2018).
Data Notes
Total value of stock on hand as of March 31, 2018 is as follows: Task Order 1 - $18,099,855. Task Order 2 - $4,359,217. Task Order 3 - $11,471,066.
Task Order 1 stock on hand includes all condoms. No inventory is kept for Task Order 4.
Some expiries for Task Order 1 occurred this quarter. These quantities are excluded from the numerator and denominator of this indicator, as this stock was not available for allocation at the end of the quarter. See indicator C7a (percent of product loss due to expiry) for reporting on these expirations.
81%
74%
84%81%
0%
10%
20%
30%
40%
50%
60%
70%
80%
90%
100%
Task Order 1 Task Order 2 Task Order 3 All Task Orders
Perc
ent
of S
helf
Life
Rem
aini
ng
78%FY18 Target
70%FY18 Target
75%FY18 Target
GHSC-PSM Quarter 1 Report, Fiscal Year 2018 | Annex A. M&E Indicators | 22

Task Order
FY18Target
FY2018 Q2 Year to Date*
TO1 75% 70% 69%
TO2 30% 29% 25%
TO3 95% 99% 99%
TO4 55% 100% 100%
All TOs NA 60% 59%
▶
▶
▶
▶▶ ▶▶
▶
▶
▶
A10. Percentage of product procured using a framework contract (framework contract percentage)
Measure DefinitionAchievement
Numerator: Value of product purchased through framework contracts during the quarter.Denominator: Total value of commodities purchased during the quarter.Purpose: This indicator, which refers to the proportion of products purchased through framework contracts with suppliers, helps assess whether GHSC-PSM is promoting strategic sourcing to ensure the best value for customers. Framework contracts, in addition to being suited for negotiation for best value, also eliminate steps in the procurement process, enabling a quicker cycle time and reduced transaction costs.
Indicator Performance FY2018 Q2
Analysis
Trends in framework contracting have remained consistent with previous quarters, with Task Orders 3 and 4 using framework contracts for nearly all procurements from vendors.
Task Order 2 has increased its framework contract percentage from 24 to 29 percent, closing in on its FY2018 target. The increase was driven by increased use of these contract types for ACTs and other pharmaceuticals. Other large-volume product groups, such as LLINs and mRDTs, continue to use one-off contracts. However, a new RDT sourcing strategy is expected to use long-term agreements in the coming quarters. Task Order 1 use of framework contracts remained consistent with earlier quarters, with close to all ARV and VMMC procurements going through framework contracts. Condoms, which are usually procured under framework contracts, saw a drop in framework contracting percentage this quarter. This is due to a large order of female condoms for a country with specific distribution requirements, which required the use of a one off contract.
Procurement totals per task order are as follows: Task Order 1 (including all condoms and decentralized procurement): $199,888,164. Task Order 2: $86,371,532. Task Order 3: $14,551,670. Task Order 4: $225,718.*Year to Date performance is calculated using all data currently available, which may include changes to procurements that occurred in previous quarters, such as cancellations. Current year-to-date figures may differ slightly from a calculation derived from previously reported data.Targets reflect anticipated project performance by end of FY18 (September 30, 2018).
Data Notes
Commodities are considered "purchased" during the quarter if the "PO Released for Fulfillment Date" in ARTMIS is between January 1 and March 31, 2018.Framework contracts include indefinite delivery, indefinite quantity contracts (IDIQs), blanket purchase agreements (BPAs), and basic ordering agreements (BOAs). Non-framework contracts include firm fixed price and fixed unit price subcontracts, simplified purchase agreements, and other types of one-off purchase orders.
70%
29%
99% 100%
60%
0%
10%
20%
30%
40%
50%
60%
70%
80%
90%
100%
Task Order 1 Task Order 2 Task Order 3 Task Order 4 All Task Orders
Fram
ewor
k C
ontr
act
Perc
enta
ge
75%FY18 Target
30%FY18 Target
95%FY18 Target
55%FY18 Target
GHSC-PSM Quarter 1 Report, Fiscal Year 2018 | Annex A. M&E Indicators | 23
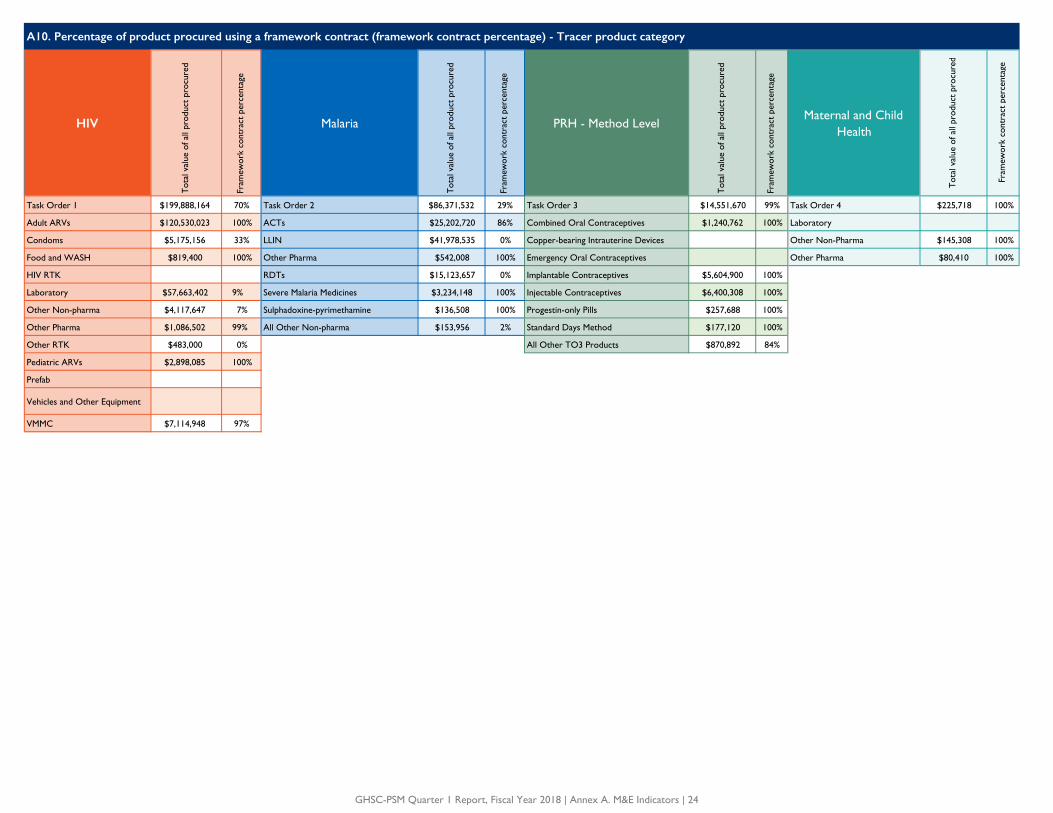
HIV
Tot
al v
alue
of a
ll pr
oduc
t pr
ocur
ed
Fram
ewor
k co
ntra
ct p
erce
ntag
e
Malaria
Tot
al v
alue
of a
ll pr
oduc
t pr
ocur
ed
Fram
ewor
k co
ntra
ct p
erce
ntag
e
PRH - Method Level
Tot
al v
alue
of a
ll pr
oduc
t pr
ocur
ed
Fram
ewor
k co
ntra
ct p
erce
ntag
e
Maternal and Child Health
Tot
al v
alue
of a
ll pr
oduc
t pr
ocur
ed
Fram
ewor
k co
ntra
ct p
erce
ntag
e
Task Order 1 $199,888,164 70% Task Order 2 $86,371,532 29% Task Order 3 $14,551,670 99% Task Order 4 $225,718 100%
Adult ARVs $120,530,023 100% ACTs $25,202,720 86% Combined Oral Contraceptives $1,240,762 100% Laboratory
Condoms $5,175,156 33% LLIN $41,978,535 0% Copper-bearing Intrauterine Devices Other Non-Pharma $145,308 100%
Food and WASH $819,400 100% Other Pharma $542,008 100% Emergency Oral Contraceptives Other Pharma $80,410 100%
HIV RTK RDTs $15,123,657 0% Implantable Contraceptives $5,604,900 100%
Laboratory $57,663,402 9% Severe Malaria Medicines $3,234,148 100% Injectable Contraceptives $6,400,308 100%
Other Non-pharma $4,117,647 7% Sulphadoxine-pyrimethamine $136,508 100% Progestin-only Pills $257,688 100%
Other Pharma $1,086,502 99% All Other Non-pharma $153,956 2% Standard Days Method $177,120 100%
Other RTK $483,000 0% All Other TO3 Products $870,892 84%
Pediatric ARVs $2,898,085 100%
Prefab
Vehicles and Other Equipment
VMMC $7,114,948 97%
A10. Percentage of product procured using a framework contract (framework contract percentage) - Tracer product category
GHSC-PSM Quarter 1 Report, Fiscal Year 2018 | Annex A. M&E Indicators | 24
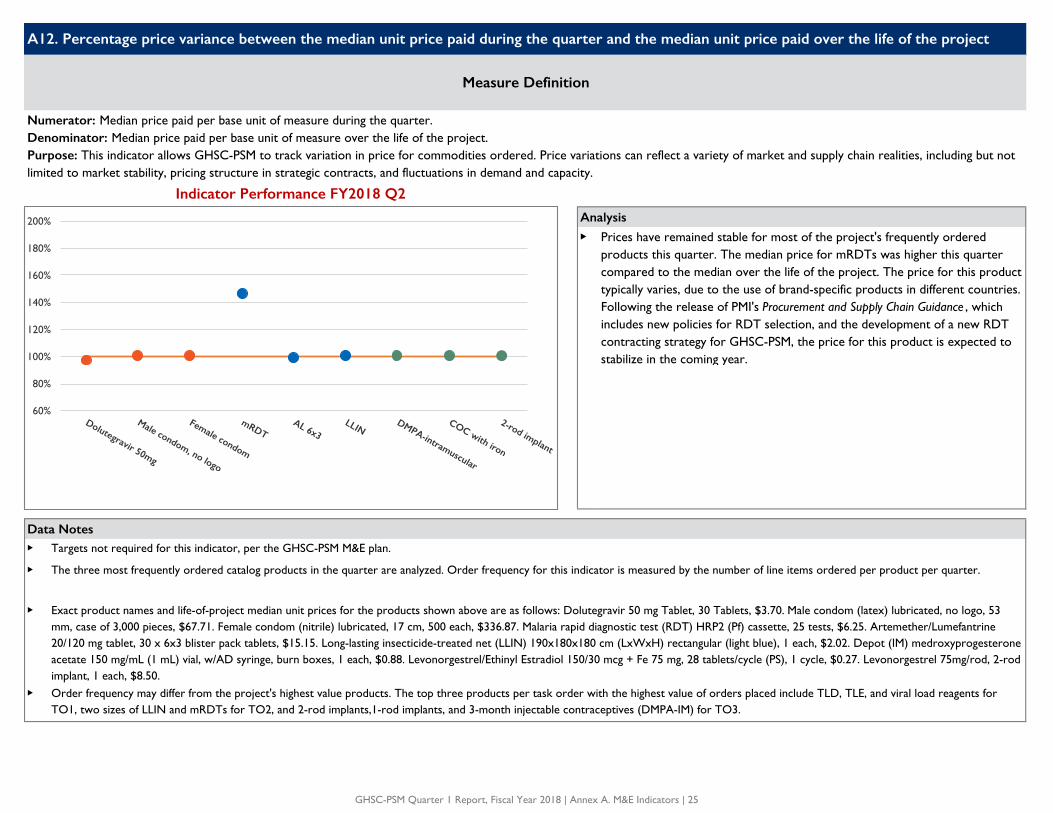
Analysis
▶
Data Notes▶
▶
▶
▶
Targets not required for this indicator, per the GHSC-PSM M&E plan.
The three most frequently ordered catalog products in the quarter are analyzed. Order frequency for this indicator is measured by the number of line items ordered per product per quarter.
Exact product names and life-of-project median unit prices for the products shown above are as follows: Dolutegravir 50 mg Tablet, 30 Tablets, $3.70. Male condom (latex) lubricated, no logo, 53 mm, case of 3,000 pieces, $67.71. Female condom (nitrile) lubricated, 17 cm, 500 each, $336.87. Malaria rapid diagnostic test (RDT) HRP2 (Pf) cassette, 25 tests, $6.25. Artemether/Lumefantrine 20/120 mg tablet, 30 x 6x3 blister pack tablets, $15.15. Long-lasting insecticide-treated net (LLIN) 190x180x180 cm (LxWxH) rectangular (light blue), 1 each, $2.02. Depot (IM) medroxyprogesterone acetate 150 mg/mL (1 mL) vial, w/AD syringe, burn boxes, 1 each, $0.88. Levonorgestrel/Ethinyl Estradiol 150/30 mcg + Fe 75 mg, 28 tablets/cycle (PS), 1 cycle, $0.27. Levonorgestrel 75mg/rod, 2-rod implant, 1 each, $8.50.
Order frequency may differ from the project's highest value products. The top three products per task order with the highest value of orders placed include TLD, TLE, and viral load reagents for TO1, two sizes of LLIN and mRDTs for TO2, and 2-rod implants,1-rod implants, and 3-month injectable contraceptives (DMPA-IM) for TO3.
A12. Percentage price variance between the median unit price paid during the quarter and the median unit price paid over the life of the project
Measure Definition
Numerator: Median price paid per base unit of measure during the quarter.Denominator: Median price paid per base unit of measure over the life of the project.Purpose: This indicator allows GHSC-PSM to track variation in price for commodities ordered. Price variations can reflect a variety of market and supply chain realities, including but not limited to market stability, pricing structure in strategic contracts, and fluctuations in demand and capacity.
Indicator Performance FY2018 Q2
Prices have remained stable for most of the project's frequently ordered products this quarter. The median price for mRDTs was higher this quarter compared to the median over the life of the project. The price for this product typically varies, due to the use of brand-specific products in different countries. Following the release of PMI's Procurement and Supply Chain Guidance , which includes new policies for RDT selection, and the development of a new RDT contracting strategy for GHSC-PSM, the price for this product is expected to stabilize in the coming year.
60%
80%
100%
120%
140%
160%
180%
200%
GHSC-PSM Quarter 1 Report, Fiscal Year 2018 | Annex A. M&E Indicators | 25

Task Order
FY18Target
FY2018 Q2 Year to Date
TO1 N/A N/A N/A
TO2 <1% 0.2% 0.3%
TO3 N/A N/A N/A
TO4 N/A N/A N/A
▶
▶▶ ▶▶
▶
A13. Percentage of batches of product for which the final result is showing nonconformity (out-of-specification-percentage)
Measure DefinitionAchievement
Numerator: Total number of batches of product showing nonconformity during the quarter.Denominator: Total number of batches tested during the quarter.Purpose: This indicator measures whether manufactured products meet acceptance criteria and critical quality standards as defined by regulatory authorities.
Indicator Performance FY2018 Q2
Analysis
One batch of co-blistered SP+AQ was found to be out of specification this quarter. The vendor has confimed that they will replace the product.
Data NotesTotal number of batches of malaria products tested this quarter is 458.All QA testing for TO2 is conducted by GHSC-PSM. All testing for TOs 1, 3, and 4 is conducted via the USAID GHSC-QA contract. GHSC-QA may be contacted for out-of-specification data for these TOs.Target reflects anticipated average project performance for the full 2018 fiscal year (October 2017-September 2018).
0% 0% 0% 0% 0%
2%
0%
1%
2%
3%
4%
5%
ACTs RDTs SP LLINs Severe malaria medications
Other Pharma
Out
of S
peci
ficat
ion
Perc
enta
ge
<1%FY18 Target
GHSC-PSM Quarter 1 Report, Fiscal Year 2018 | Annex A. M&E Indicators | 26

Task Order
FY2018 Q2 Lab QA
FY2018 Q2 Freight
Forwarders
TO1
TO2 86%
TO3
TO4
All TOs N/A 73%
▶
▶ Lab QA vendors (all TO2): Three labs were evaluated this quarter.
▶ Freight forwarders (no TO disaggregation): Five freight forwarders were evaluated this quarter.
▶ Supplier scorecard is undergoing revisions; data to be reported in a future report.
▶ Target not required for this indicator.
Data Notes
A14. Average vendor rating score
Measure Definition
Achievement
Indicator Performance FY2018 Q2
Numerator: Sum of all key vendor ratings.Denominator: Number of vendors from whom GHSC-PSM procured products/commodities, lab testing services, or freight forwarding during the quarter.Purpose: This indicator enables GHSC-PSM and USAID to monitor performance of their vendors. This information helps the project to better manage vendor relations and can be used as a factor in vendor selection. Project vendors include manufacturers of health commodities (suppliers), freight forwarders (third party logistics providers), and labs providing quality assurance testing of commodities.
▶ Significant improvements have been demonstrated by the lab network, in particular with capacity to meet contractual lead times for SPAQ DT, ASAQ, and generic ALu. This was accomplished by providing the lab network with improved forecasts of future test requests, procuring stock of reference materials, and continuous communication with the labs to ensure the labs understood the requirements of TO2 QA. It should be noted that all three primary pharmaceutical QC laboratories have increased their staff and equipment to improve lab throughput.
Analysis
Freight forwarder performance has remained steady since last quarter. A request for proposals for freight forwarders was released this quarter and awarded in April for a three-year period.
86%
73%
0%
20%
40%
60%
80%
100%
Lab QA Freight Forwarders
% o
f Shi
pmen
ts
TaskOrder1 TaskOrder2 TaskOrder3 TaskOrder4 AllTOs
GHSC-PSM Quarter 1 Report, Fiscal Year 2018 | Annex A. M&E Indicators | 27

Result (Total Score) Product QualityOrder Fullfillment (On Time In Full)
Invoicing Accuracy Service
TO1 (n=
TO2 (n=
TO3 (n=
All TOs
Criteria Reliability (Timeliness of Service) ResponsivenessCompleteness
(of Documentation)Cost Service
Title Does the lab provide on-time provision of completed test reports?
Does the lab provide prompt response after receipt of GHSC-PSM request for testing?
Frequency of modification to certificates of analysis (CoAs)
Submitted invoices for routine testing adhere to set IDIQ pricing
Qualitative: Adherence to other terms and conditions (not related to reliability, responsiveness, completeness, and cost)
Weight 43% 15% 18% 15% 10% 100%
Average Score (n=3) 82% 80% 97% 93% 80% 86%
# Component Numerator Denominator Score Indicator Weight Component WeightWeighted
Score
Number of shipments during the reporting period for which the actual ship date was within 3 calendar days of the estimated ship date
Number of shipments during the reporting period
648 698Port-to-door ship time reliability (Percentage of shipments that arrive within the required lead time for port-to-door shipping based on shipping lane and channel)(Disaggregated by ocean and air)
Number of shipments delivered during the reporting period which arrived within the approved window of the required lead time for the shipping lane per the GHSC-PSM lead time table
Number of shipments delivered during the reporting period
OCEAN (+7/-12 calendar days window) 66 138 48% 15%
AIR (+3/-10 calendar days window) 361 512 71% 15%
A14. Average vendor rating score - further score breakdowns by component
3PL Vendors (n=5)
36.3%
1a
1b
1–Reliability (Timeliness of Service)
20%50%
QA Lab Vendors (TO2 Only)
Total
Estimated ship date versus actual ship date (within 3 days)
93%
Commodity Suppliers
GHSC-PSM Quarter 1 Report, Fiscal Year 2018 | Annex A. M&E Indicators | 28

# Component Numerator Denominator Score Indicator Weight Component WeightWeighted
Score
Number of waiver shipments during the reporting period for which the booking date to waiver initiate date period was less than or equal to 4 business days
Number of waiver shipments during the reporting period
254 844Number of shipments booked during the reporting period for which booking was confirmed by the 3PL within 2 business days
Number of shipments booked during the reporting period
762 848
Number of shipments delivered without OSD
Number of shipments delivered during the reporting period
692 693
Number of invoices received during the reporting period which had no (cost) rating errors
Number of invoices received during the reporting period
464 693
Number of NCRs received for which an adequate response occurred within the allotted timeframe
Number of NCRs received
4 5
73.0%
80% 10%
Total Score
3–Quality of Shipment
10%
67% 10%
10%3a
Percentage of shipments delivered without OSD (overages, shortages, or damages) (cargo integrity) (when investigation finds 3PL at fault) (measure at end of investigation) historical
100%10%
4–Invoice Accuracy
10%
5–Compliance
10% 8%5a
Percentage of NCRs (non-conformance reports) adequately resolved within allotted timeframe(no NCRs = 100%)
7%4a
Invoice accuracy compared to contract price
Percentage of shipments for which booking was confirmed on time (within 2 business days) 90% 10%
3PL Vendors (n=5)
2–Responsiveness
20% 12%
2a
Percentage of shipments for which booking to waiver initiation cycle time was within 4 business days (waiver shipments only) 30% 10%
2c
GHSC-PSM Quarter 1 Report, Fiscal Year 2018 | Annex A. M&E Indicators | 29
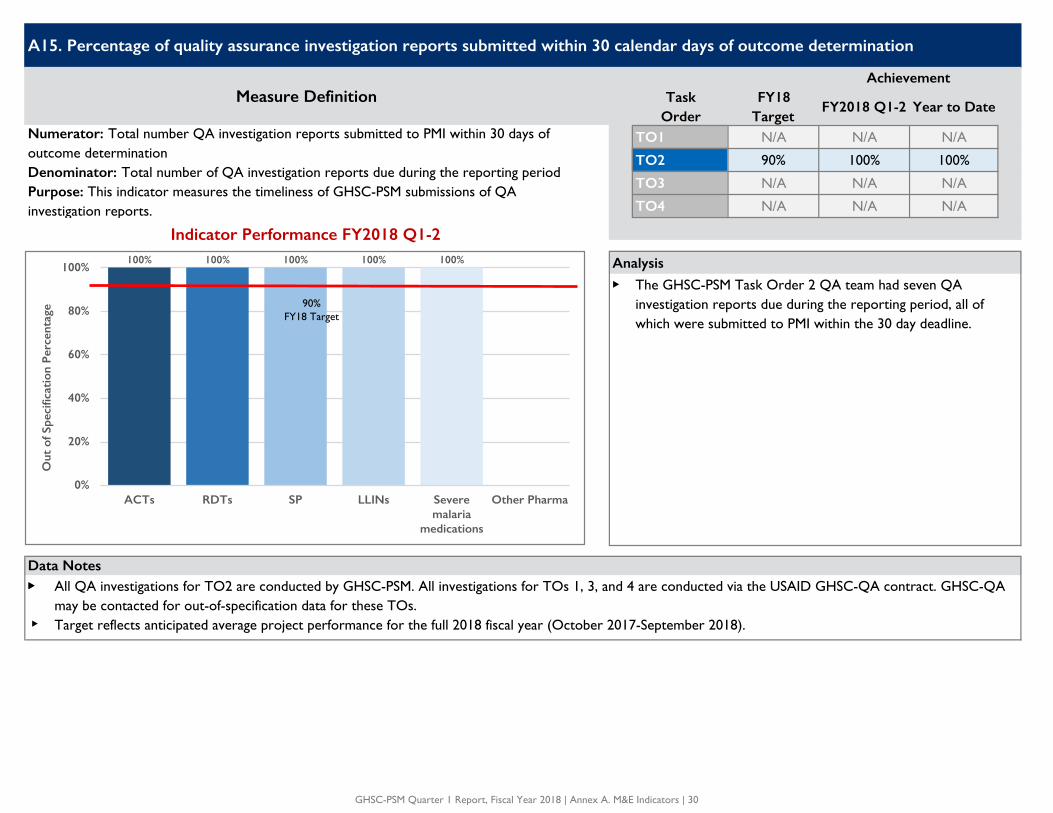
Task Order
FY18Target
FY2018 Q1-2 Year to Date
TO1 N/A N/A N/A
TO2 90% 100% 100%
TO3 N/A N/A N/A
TO4 N/A N/A N/A
▶
▶▶
▶
Analysis
The GHSC-PSM Task Order 2 QA team had seven QA investigation reports due during the reporting period, all of which were submitted to PMI within the 30 day deadline.
Data NotesAll QA investigations for TO2 are conducted by GHSC-PSM. All investigations for TOs 1, 3, and 4 are conducted via the USAID GHSC-QA contract. GHSC-QA may be contacted for out-of-specification data for these TOs.Target reflects anticipated average project performance for the full 2018 fiscal year (October 2017-September 2018).
A15. Percentage of quality assurance investigation reports submitted within 30 calendar days of outcome determination
Measure DefinitionAchievement
Numerator: Total number QA investigation reports submitted to PMI within 30 days of outcome determinationDenominator: Total number of QA investigation reports due during the reporting periodPurpose: This indicator measures the timeliness of GHSC-PSM submissions of QA investigation reports.
Indicator Performance FY2018 Q1-2100% 100% 100% 100% 100%
0%
20%
40%
60%
80%
100%
ACTs RDTs SP LLINs Severe malaria
medications
Other Pharma
Out
of S
peci
ficat
ion
Perc
enta
ge
90%FY18 Target
GHSC-PSM Quarter 1 Report, Fiscal Year 2018 | Annex A. M&E Indicators | 30

Task Order
FY18Target
TO1 NA
TO2 NA
TO3 NA
TO4 NA
All TOs <5%
▶
▶▶
▶▶ ▶▶
Analysis
Backlog percentage for the period is 4.3%, down from 4.8% in the previous quarter. This is in line with the target of 5% for FY2018 and has also begun to impact the project's OTIF results (see indicator A1a). On time, in full delivery has begun to rise, following a significant drawdown in the backlog in Q1. This suppressed OTIF performance for Q1, but has resulted in improvements for Q2. With the backlog remaining within the targeted level, we expect these OTIF results to be sustained.
Data NotesThe total number of line items with agreed delivery dates in the last 12 months are as follows: Task Order 1 (including all condoms for any TO) - 4,596. Task Order 2 - 426. Task Order 3 - 428. Task Order 4 - 25.The project currently has 0 undelivered line items with an ADD before the 12 month period of this indicator. Targets reflect anticipated project performance by end of FY18 (September 30, 2018).
Indicator Performance FY2018 Q2
0%
4%
FY2018 Q2
A16. Percentage of backlogged line items
Measure DefinitionAchievement
Numerator: Number of line items with an agreed delivery date (ADD) on or before the reporting period end date within a rolling 12-month period, that have not been canceled or put on hold and that are currently undelivered and late.Denominator: Total number of line items with an ADD on or before the reporting period end date, within a rolling 12-month period, that have not been canceled or put on hold.Purpose: Measuring and tracking backlogged items helps to prioritize and quickly resolve undelivered late orders to mitigate downstream impacts.
4%
7%
2%
4%
7%
2%0% 4%
0%
10%
20%
30%
40%
50%
Task Order 1 Task Order 2 Task Order 3 Task Order 4 All Task Orders
Perc
enta
ge o
f bac
klog
ged
orde
rs
<5%FY18 Target
GHSC-PSM Quarter 1 Report, Fiscal Year 2018 | Annex A. M&E Indicators | 31
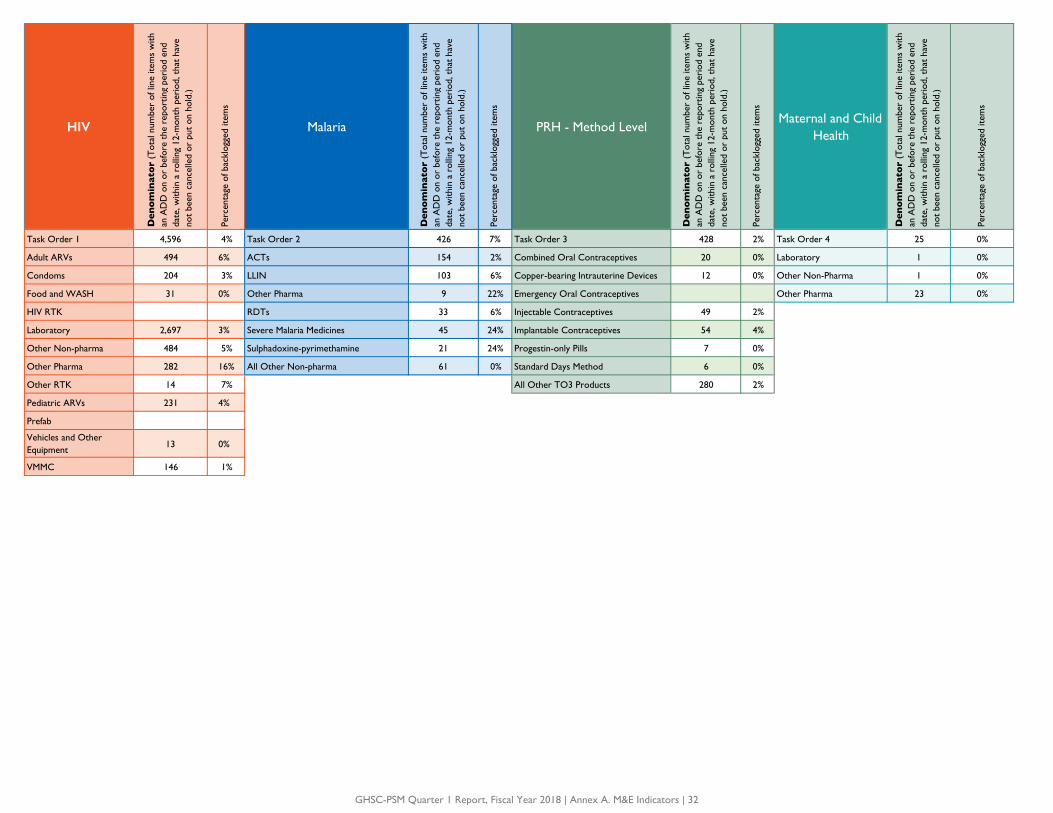
HIV
Den
omin
ator
(T
otal
num
ber
of li
ne it
ems
with
an
AD
D o
n or
bef
ore
the
repo
rtin
g pe
riod
end
da
te, w
ithin
a r
ollin
g 12
-mon
th p
erio
d, t
hat
have
no
t be
en c
ance
lled
or p
ut o
n ho
ld.)
Perc
enta
ge o
f bac
klog
ged
item
s
Malaria
Den
omin
ator
(Tot
al n
umbe
r of
line
item
s w
ith
an A
DD
on
or b
efor
e th
e re
port
ing
peri
od e
nd
date
, with
in a
rol
ling
12-m
onth
per
iod,
tha
t ha
ve
not
been
can
celle
d or
put
on
hold
.)
Perc
enta
ge o
f bac
klog
ged
item
s
PRH - Method Level
Den
omin
ator
(Tot
al n
umbe
r of
line
item
s w
ith
an A
DD
on
or b
efor
e th
e re
port
ing
peri
od e
nd
date
, with
in a
rol
ling
12-m
onth
per
iod,
tha
t ha
ve
not
been
can
celle
d or
put
on
hold
.)
Perc
enta
ge o
f bac
klog
ged
item
s
Maternal and Child Health
Den
omin
ator
(Tot
al n
umbe
r of
line
item
s w
ith
an A
DD
on
or b
efor
e th
e re
port
ing
peri
od e
nd
date
, with
in a
rol
ling
12-m
onth
per
iod,
tha
t ha
ve
not
been
can
celle
d or
put
on
hold
.)
Perc
enta
ge o
f bac
klog
ged
item
s
Task Order 1 4,596 4% Task Order 2 426 7% Task Order 3 428 2% Task Order 4 25 0%
Adult ARVs 494 6% ACTs 154 2% Combined Oral Contraceptives 20 0% Laboratory 1 0%
Condoms 204 3% LLIN 103 6% Copper-bearing Intrauterine Devices 12 0% Other Non-Pharma 1 0%
Food and WASH 31 0% Other Pharma 9 22% Emergency Oral Contraceptives Other Pharma 23 0%
HIV RTK RDTs 33 6% Injectable Contraceptives 49 2%
Laboratory 2,697 3% Severe Malaria Medicines 45 24% Implantable Contraceptives 54 4%
Other Non-pharma 484 5% Sulphadoxine-pyrimethamine 21 24% Progestin-only Pills 7 0%
Other Pharma 282 16% All Other Non-pharma 61 0% Standard Days Method 6 0%
Other RTK 14 7% All Other TO3 Products 280 2%
Pediatric ARVs 231 4%
Prefab
Vehicles and Other Equipment
13 0%
VMMC 146 1%
GHSC-PSM Quarter 1 Report, Fiscal Year 2018 | Annex A. M&E Indicators | 32
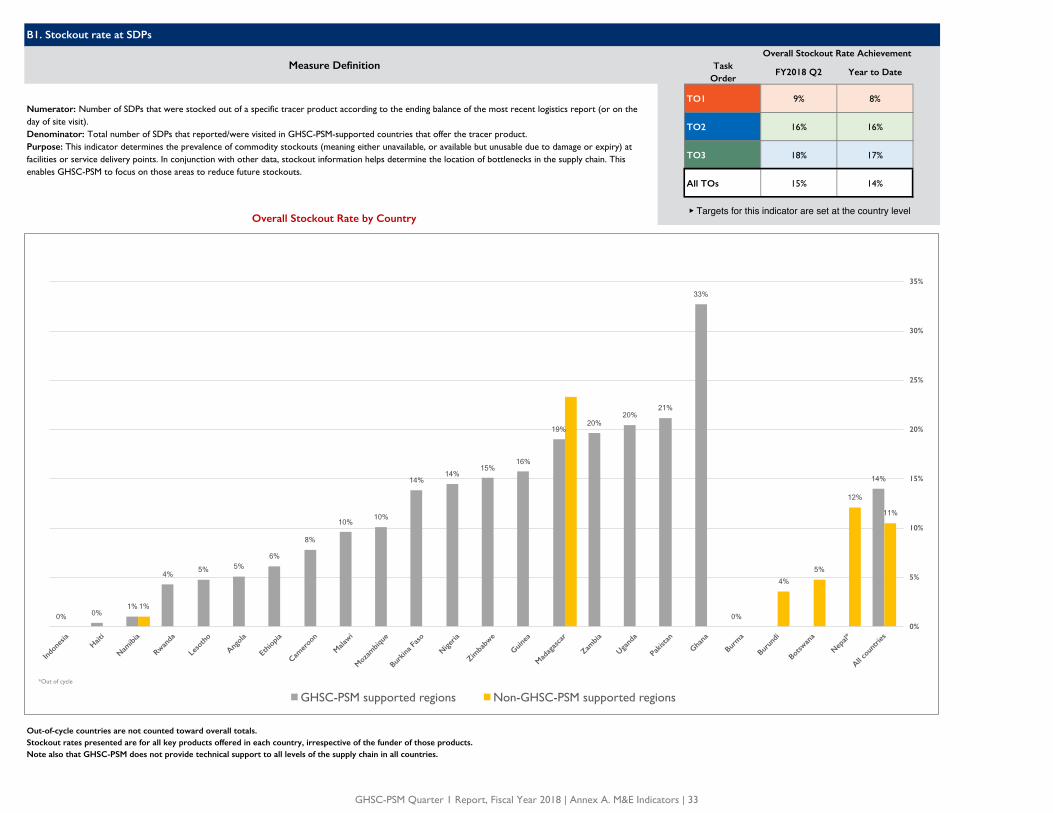
Task Order
FY2018 Q2 Year to Date
TO1 9% 8%
TO2 16% 16%
TO3 18% 17%
All TOs 15% 14%
Out-of-cycle countries are not counted toward overall totals. Stockout rates presented are for all key products offered in each country, irrespective of the funder of those products.Note also that GHSC-PSM does not provide technical support to all levels of the supply chain in all countries.
Numerator: Number of SDPs that were stocked out of a specific tracer product according to the ending balance of the most recent logistics report (or on the day of site visit).Denominator: Total number of SDPs that reported/were visited in GHSC-PSM-supported countries that offer the tracer product.Purpose: This indicator determines the prevalence of commodity stockouts (meaning either unavailable, or available but unusable due to damage or expiry) at facilities or service delivery points. In conjunction with other data, stockout information helps determine the location of bottlenecks in the supply chain. This enables GHSC-PSM to focus on those areas to reduce future stockouts.
B1. Stockout rate at SDPs
Measure DefinitionOverall Stockout Rate Achievement
Overall Stockout Rate by Country ▶ Targets for this indicator are set at the country level
0% 0% 1%
4% 5% 5% 6%
8%
10% 10%
14% 14%
15% 16%
19% 20%
20% 21%
33%
0%
14%
1%
4% 5%
12%
11%
0%
5%
10%
15%
20%
25%
30%
35%
GHSC-PSM supported regions Non-GHSC-PSM supported regions*Out of cycle
GHSC-PSM Quarter 1 Report, Fiscal Year 2018 | Annex A. M&E Indicators | 33
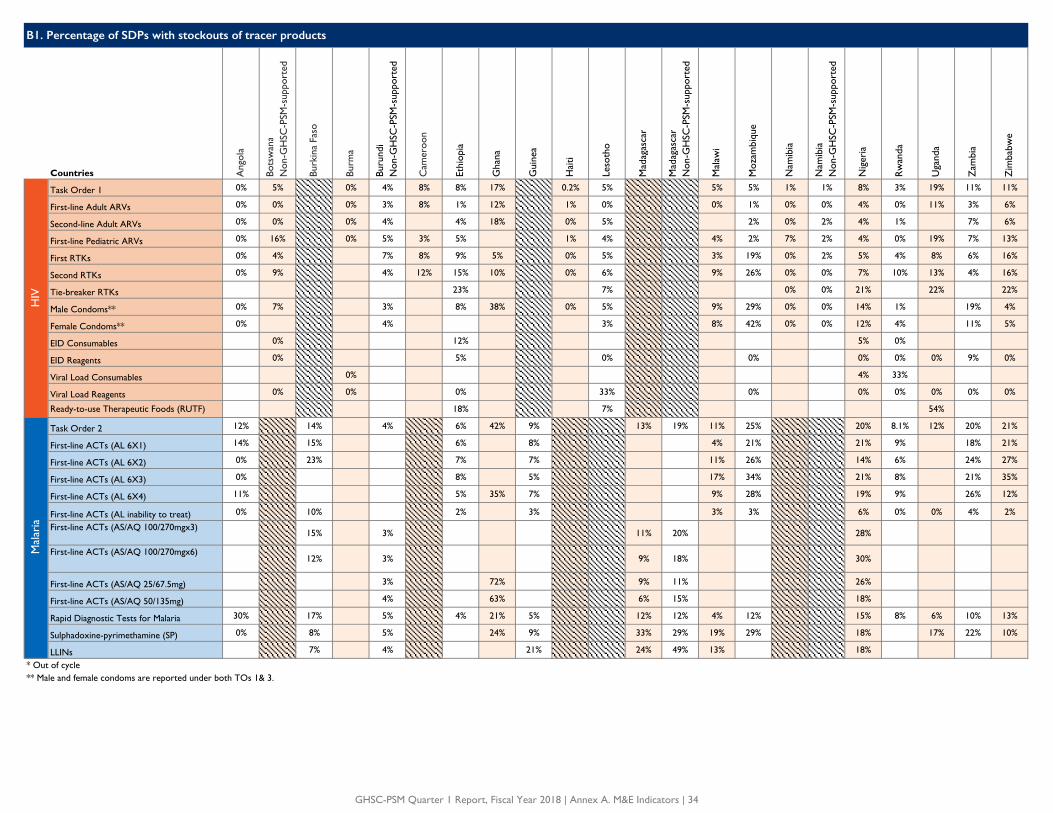
Countries Ang
ola
Bots
wan
aN
on-G
HSC
-PSM
-sup
port
ed
Burk
ina
Faso
Burm
a
Buru
ndi
Non
-GH
SC-P
SM-s
uppo
rted
Cam
eroo
n
Ethi
opia
Gha
na
Gui
nea
Hai
ti
Leso
tho
Mad
agas
car
Mad
agas
car
Non
-GH
SC-P
SM-s
uppo
rted
Mal
awi
Moz
ambi
que
Nam
ibia
Nam
ibia
N
on-G
HSC
-PSM
-sup
port
ed
Nig
eria
Rw
anda
Uga
nda
Zam
bia
Zim
babw
e
Task Order 1 0% 5% 0% 4% 8% 8% 17% 0.2% 5% 5% 5% 1% 1% 8% 3% 19% 11% 11%
First-line Adult ARVs 0% 0% 0% 3% 8% 1% 12% 1% 0% 0% 1% 0% 0% 4% 0% 11% 3% 6%
Second-line Adult ARVs 0% 0% 0% 4% 4% 18% 0% 5% 2% 0% 2% 4% 1% 7% 6%
First-line Pediatric ARVs 0% 16% 0% 5% 3% 5% 1% 4% 4% 2% 7% 2% 4% 0% 19% 7% 13%
First RTKs 0% 4% 7% 8% 9% 5% 0% 5% 3% 19% 0% 2% 5% 4% 8% 6% 16%
Second RTKs 0% 9% 4% 12% 15% 10% 0% 6% 9% 26% 0% 0% 7% 10% 13% 4% 16%
Tie-breaker RTKs 23% 7% 0% 0% 21% 22% 22%
Male Condoms** 0% 7% 3% 8% 38% 0% 5% 9% 29% 0% 0% 14% 1% 19% 4%
Female Condoms** 0% 4% 3% 8% 42% 0% 0% 12% 4% 11% 5%
EID Consumables 0% 12% 5% 0%
EID Reagents 0% 5% 0% 0% 0% 0% 0% 9% 0%
Viral Load Consumables 0% 4% 33%
Viral Load Reagents 0% 0% 0% 33% 0% 0% 0% 0% 0% 0%
Ready-to-use Therapeutic Foods (RUTF) 18% 7% 54%
Task Order 2 12% 14% 4% 6% 42% 9% 13% 19% 11% 25% 20% 8.1% 12% 20% 21%
First-line ACTs (AL 6X1) 14% 15% 6% 8% 4% 21% 21% 9% 18% 21%
First-line ACTs (AL 6X2) 0% 23% 7% 7% 11% 26% 14% 6% 24% 27%
First-line ACTs (AL 6X3) 0% 8% 5% 17% 34% 21% 8% 21% 35%
First-line ACTs (AL 6X4) 11% 5% 35% 7% 9% 28% 19% 9% 26% 12%
First-line ACTs (AL inability to treat) 0% 10% 2% 3% 3% 3% 6% 0% 0% 4% 2%
First-line ACTs (AS/AQ 100/270mgx3)15% 3% 11% 20% 28%
First-line ACTs (AS/AQ 100/270mgx6)12% 3% 9% 18% 30%
First-line ACTs (AS/AQ 25/67.5mg) 3% 72% 9% 11% 26%
First-line ACTs (AS/AQ 50/135mg) 4% 63% 6% 15% 18%
Rapid Diagnostic Tests for Malaria 30% 17% 5% 4% 21% 5% 12% 12% 4% 12% 15% 8% 6% 10% 13%
Sulphadoxine-pyrimethamine (SP) 0% 8% 5% 24% 9% 33% 29% 19% 29% 18% 17% 22% 10%
LLINs 7% 4% 21% 24% 49% 13% 18%
* Out of cycle ** Male and female condoms are reported under both TOs 1& 3.
Mal
aria
B1. Percentage of SDPs with stockouts of tracer productsH
IV
GHSC-PSM Quarter 1 Report, Fiscal Year 2018 | Annex A. M&E Indicators | 34
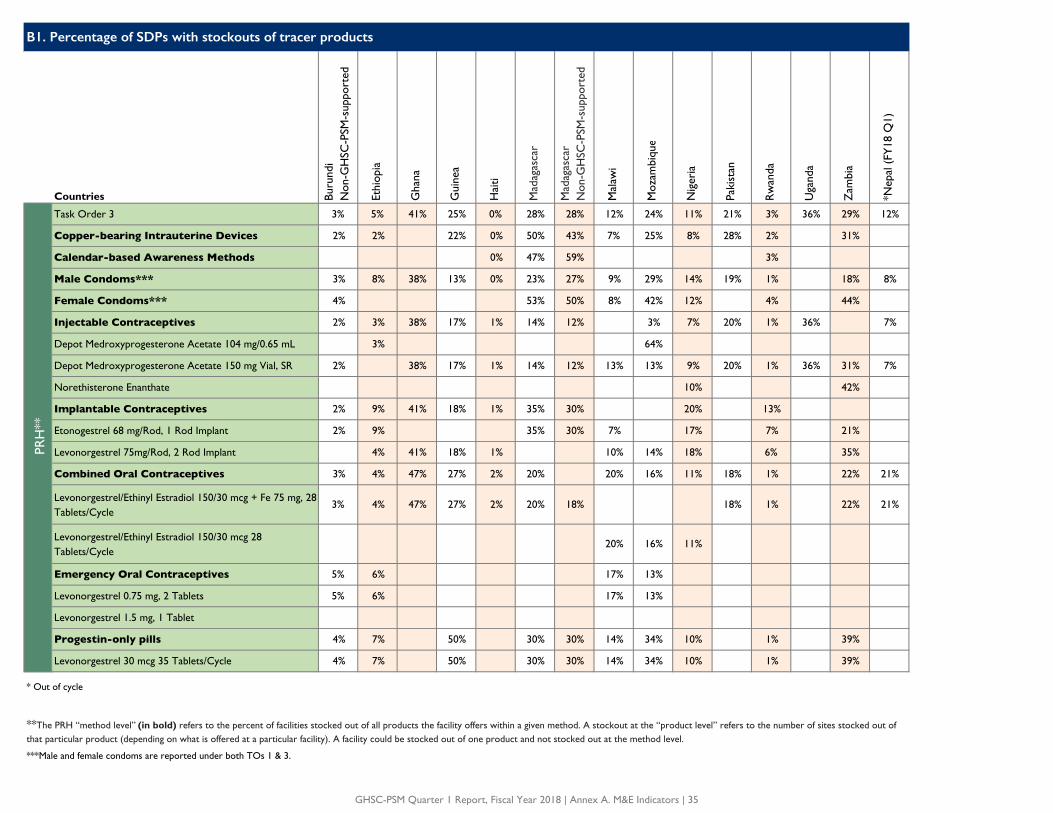
Countries Buru
ndi
Non
-GH
SC-P
SM-s
uppo
rted
Ethi
opia
Gha
na
Gui
nea
Hai
ti
Mad
agas
car
Mad
agas
car
Non
-GH
SC-P
SM-s
uppo
rted
Mal
awi
Moz
ambi
que
Nig
eria
Paki
stan
Rw
anda
Uga
nda
Zam
bia
*Nep
al (
FY18
Q1)
Task Order 3 3% 5% 41% 25% 0% 28% 28% 12% 24% 11% 21% 3% 36% 29% 12%
Copper-bearing Intrauterine Devices 2% 2% 22% 0% 50% 43% 7% 25% 8% 28% 2% 31%
Calendar-based Awareness Methods 0% 47% 59% 3%
Male Condoms*** 3% 8% 38% 13% 0% 23% 27% 9% 29% 14% 19% 1% 18% 8%
Female Condoms*** 4% 53% 50% 8% 42% 12% 4% 44%
Injectable Contraceptives 2% 3% 38% 17% 1% 14% 12% 3% 7% 20% 1% 36% 7%
Depot Medroxyprogesterone Acetate 104 mg/0.65 mL 3% 64%
Depot Medroxyprogesterone Acetate 150 mg Vial, SR 2% 38% 17% 1% 14% 12% 13% 13% 9% 20% 1% 36% 31% 7%
Norethisterone Enanthate 10% 42%
Implantable Contraceptives 2% 9% 41% 18% 1% 35% 30% 20% 13%
Etonogestrel 68 mg/Rod, 1 Rod Implant 2% 9% 35% 30% 7% 17% 7% 21%
Levonorgestrel 75mg/Rod, 2 Rod Implant 4% 41% 18% 1% 10% 14% 18% 6% 35%
Combined Oral Contraceptives 3% 4% 47% 27% 2% 20% 20% 16% 11% 18% 1% 22% 21%
Levonorgestrel/Ethinyl Estradiol 150/30 mcg + Fe 75 mg, 28 Tablets/Cycle
3% 4% 47% 27% 2% 20% 18% 18% 1% 22% 21%
Levonorgestrel/Ethinyl Estradiol 150/30 mcg 28 Tablets/Cycle
20% 16% 11%
Emergency Oral Contraceptives 5% 6% 17% 13%
Levonorgestrel 0.75 mg, 2 Tablets 5% 6% 17% 13%
Levonorgestrel 1.5 mg, 1 Tablet
Progestin-only pills 4% 7% 50% 30% 30% 14% 34% 10% 1% 39%
Levonorgestrel 30 mcg 35 Tablets/Cycle 4% 7% 50% 30% 30% 14% 34% 10% 1% 39%
* Out of cycle
***Male and female condoms are reported under both TOs 1 & 3.
B1. Percentage of SDPs with stockouts of tracer productsPR
H**
**The PRH “method level” (in bold) refers to the percent of facilities stocked out of all products the facility offers within a given method. A stockout at the “product level” refers to the number of sites stocked out of that particular product (depending on what is offered at a particular facility). A facility could be stocked out of one product and not stocked out at the method level.
GHSC-PSM Quarter 1 Report, Fiscal Year 2018 | Annex A. M&E Indicators | 35

Analysis
Angola Angola has reported a marked decrease in stockouts from last quarter, from 23 percent down to just 5 percent. Looking more closely, there were no stock outs of any HIV products this quarter with only malaria products reporting stockouts at 12% of SDPs. Three malaria products were responsible for this performance, namely 2 presentations of AL and rapid diagnostic tests. First-line ARVs have now experienced no stockouts for an entire year. This can be largely attributed to the transfer and exchange of ARVs among the nine supported SDPs.
Botswana First and second line adult ARVs reported no stockouts this period, as a result of adequate central-level stocks, timely replneishing to SDPs, and close management in pursuit of 90-90-90 targets. Five sites reported stockouts of pediatric ARVs, due in some cases to a failure by facilities to place orders on time. Stocking of male condoms improved this quarter, following a national shortage in FY2018 Q1. Procurements and deliveries from PEPFAR and UNFPA both served to alleviate this shortage.
Burkina Faso Burkina Faso’s stockout rate increased slightly from 11 percent last quarter to 14 percent this quarter. The largest increase came from ACTs (6x2) going from 11 to 23 percent stocked out, which in turn brought the “inability to treat” rate from 5 to 10 percent. Stockouts of RDTs increased from 5 percent to 17 percent due to delays in deliveries from other donors and the switch from a push to a pull system for all products, including free of charge commodities such as RDTs. GHSC-PSM will request that the National Malaria Control Program send a reminder to all regions and districts regarding implementation of the pull system, and the project will help to monitor its implementation.
Burma Burma maintains its debut performance from last quarter, with a second sequential quarter of no stockouts of HIV-tracer products. The early warning system continues to function well in the ART hospitals managing ARVs. Next quarter there are plans to expand stock monitoring to the remaining viral load laboratories.
Burundi Stockout rates for Burundi are generally low, averaging four percent or less across task orders. GHSC-PSM is working with the central medical store, CAMEBU, and the district health offices to improve inventory management, timely reporting and resolution of SDP stockouts, and prevention of stockouts through improved ordering.
Cameroon Data are reported from supportive supervision visits this quarter. While reporting is gradually improving, the reporting rate for the quarter is still generally low. As a result, data are reported from supportive supervision visits this quarter. The GHSC-PSM team is continuing to strengthen district teams and SDP staff on best practices, especially related to ordering.
Ethiopia Ethiopia’s overall stockout rate stayed largely the same, falling slightly from 6.7 percent to 6.1 percent this quarter, due primarily to stockouts of HIV/AIDS products reducing slightly from 8.6 percent to 7.8 percent. However, the rate remains higher than the country’s end-of-fiscal-year 2018 target of 5 percent. Rapid test kits showed the largest improvement, with stockouts falling from 14 to 9 and 26 to 15 percent for first and second RTKs, respectively. However, RTK distribution is not integrated into the national integrated pharmaceutical logistics system, and therefore facilities do not report consumption data using the standard form, resulting in under-reporting. GHSC-PSM in Ethiopia continues to implement measures to target improvements in facility stock availability, including advocating in coordination platforms at the national level, strengthening lab commodity supply management, working closely with logistics officers at the zonal and regional health bureau levels, and strengthening the feedback mechanism to facilities on data quality and logistics management.
B1. Stockout rate - granular-level analysis
Overall stockout rates saw a slight uptick this quarter from 12 to 14 percent. However, this was likely due to shifts in the number countries reporting and in the products they report. Guinea and Zimbabwe both reported within the current cycle for the first time this quarter and Ghana was unable to report this indicator last quarter but began reporting again this quarter. All three countries had stockout rates higher than the average.
Out of the twenty countries that reported both this quarter and last, seven reduced their stockout rates this quarter, three more had no change, four had a 1 percentage point or less increase, while the remaining six countries had increases of 3 percentage points (Pakistan, Uganda, and Burkina Faso), 4 points (Rwanda and Zimbabwe), 7 points (Zambia), and 9 points in Mozambique. Mozambique's increase was due in part to additional reporting systems coming on line to now enable reporting on malaria and family planning products.
Stockouts of HIV/AIDS products, at 8 percent, continue to be approximately half the rate of those of malaria and family planning products (16 and 15 percent, respectively).
Country Analysis
GHSC-PSM Quarter 1 Report, Fiscal Year 2018 | Annex A. M&E Indicators | 36
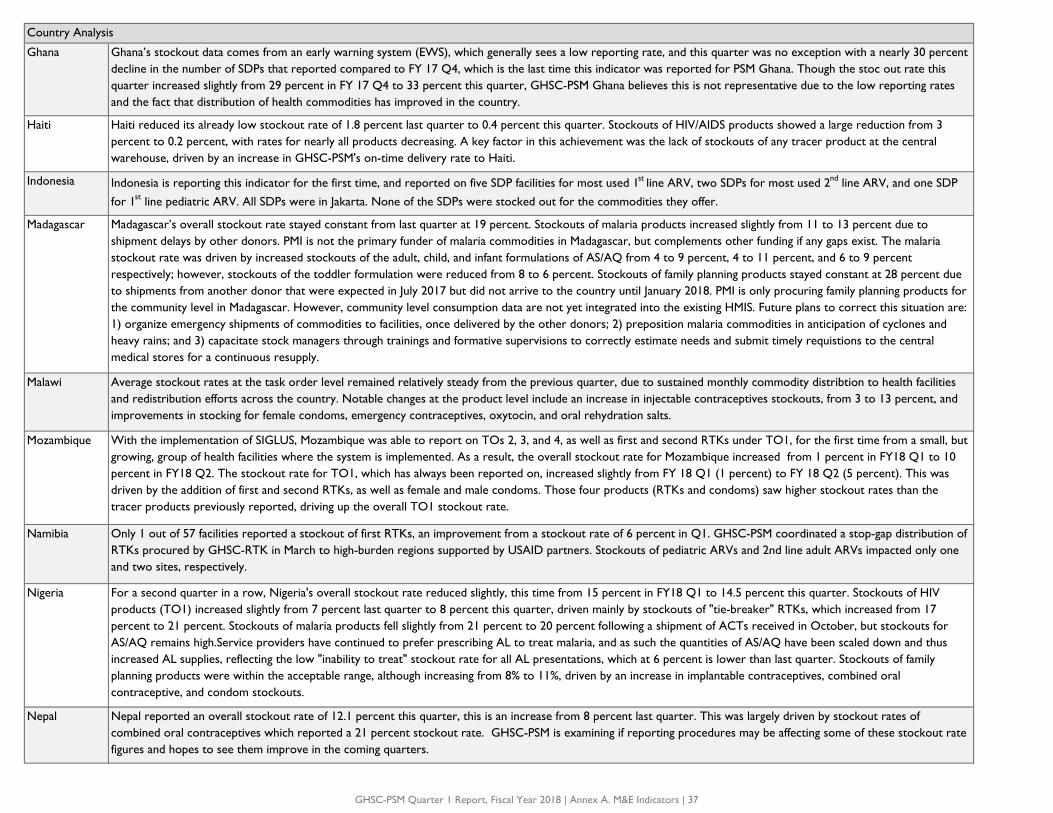
Country Analysis
Ghana Ghana’s stockout data comes from an early warning system (EWS), which generally sees a low reporting rate, and this quarter was no exception with a nearly 30 percent decline in the number of SDPs that reported compared to FY 17 Q4, which is the last time this indicator was reported for PSM Ghana. Though the stoc out rate this quarter increased slightly from 29 percent in FY 17 Q4 to 33 percent this quarter, GHSC-PSM Ghana believes this is not representative due to the low reporting rates and the fact that distribution of health commodities has improved in the country.
Haiti Haiti reduced its already low stockout rate of 1.8 percent last quarter to 0.4 percent this quarter. Stockouts of HIV/AIDS products showed a large reduction from 3 percent to 0.2 percent, with rates for nearly all products decreasing. A key factor in this achievement was the lack of stockouts of any tracer product at the central warehouse, driven by an increase in GHSC-PSM's on-time delivery rate to Haiti.
Indonesia Indonesia is reporting this indicator for the first time, and reported on five SDP facilities for most used 1st line ARV, two SDPs for most used 2nd line ARV, and one SDP
for 1st line pediatric ARV. All SDPs were in Jakarta. None of the SDPs were stocked out for the commodities they offer.
Madagascar Madagascar’s overall stockout rate stayed constant from last quarter at 19 percent. Stockouts of malaria products increased slightly from 11 to 13 percent due to shipment delays by other donors. PMI is not the primary funder of malaria commodities in Madagascar, but complements other funding if any gaps exist. The malaria stockout rate was driven by increased stockouts of the adult, child, and infant formulations of AS/AQ from 4 to 9 percent, 4 to 11 percent, and 6 to 9 percent respectively; however, stockouts of the toddler formulation were reduced from 8 to 6 percent. Stockouts of family planning products stayed constant at 28 percent due to shipments from another donor that were expected in July 2017 but did not arrive to the country until January 2018. PMI is only procuring family planning products for the community level in Madagascar. However, community level consumption data are not yet integrated into the existing HMIS. Future plans to correct this situation are: 1) organize emergency shipments of commodities to facilities, once delivered by the other donors; 2) preposition malaria commodities in anticipation of cyclones and heavy rains; and 3) capacitate stock managers through trainings and formative supervisions to correctly estimate needs and submit timely requistions to the central medical stores for a continuous resupply.
Malawi Average stockout rates at the task order level remained relatively steady from the previous quarter, due to sustained monthly commodity distribtion to health facilities and redistribution efforts across the country. Notable changes at the product level include an increase in injectable contraceptives stockouts, from 3 to 13 percent, and improvements in stocking for female condoms, emergency contraceptives, oxytocin, and oral rehydration salts.
Mozambique With the implementation of SIGLUS, Mozambique was able to report on TOs 2, 3, and 4, as well as first and second RTKs under TO1, for the first time from a small, but growing, group of health facilities where the system is implemented. As a result, the overall stockout rate for Mozambique increased from 1 percent in FY18 Q1 to 10 percent in FY18 Q2. The stockout rate for TO1, which has always been reported on, increased slightly from FY 18 Q1 (1 percent) to FY 18 Q2 (5 percent). This was driven by the addition of first and second RTKs, as well as female and male condoms. Those four products (RTKs and condoms) saw higher stockout rates than the tracer products previously reported, driving up the overall TO1 stockout rate.
Namibia Only 1 out of 57 facilities reported a stockout of first RTKs, an improvement from a stockout rate of 6 percent in Q1. GHSC-PSM coordinated a stop-gap distribution of RTKs procured by GHSC-RTK in March to high-burden regions supported by USAID partners. Stockouts of pediatric ARVs and 2nd line adult ARVs impacted only one and two sites, respectively.
Nigeria For a second quarter in a row, Nigeria's overall stockout rate reduced slightly, this time from 15 percent in FY18 Q1 to 14.5 percent this quarter. Stockouts of HIV products (TO1) increased slightly from 7 percent last quarter to 8 percent this quarter, driven mainly by stockouts of "tie-breaker" RTKs, which increased from 17 percent to 21 percent. Stockouts of malaria products fell slightly from 21 percent to 20 percent following a shipment of ACTs received in October, but stockouts for AS/AQ remains high.Service providers have continued to prefer prescribing AL to treat malaria, and as such the quantities of AS/AQ have been scaled down and thus increased AL supplies, reflecting the low "inability to treat" stockout rate for all AL presentations, which at 6 percent is lower than last quarter. Stockouts of family planning products were within the acceptable range, although increasing from 8% to 11%, driven by an increase in implantable contraceptives, combined oral contraceptive, and condom stockouts.
Nepal Nepal reported an overall stockout rate of 12.1 percent this quarter, this is an increase from 8 percent last quarter. This was largely driven by stockout rates of combined oral contraceptives which reported a 21 percent stockout rate. GHSC-PSM is examining if reporting procedures may be affecting some of these stockout rate figures and hopes to see them improve in the coming quarters.
GHSC-PSM Quarter 1 Report, Fiscal Year 2018 | Annex A. M&E Indicators | 37
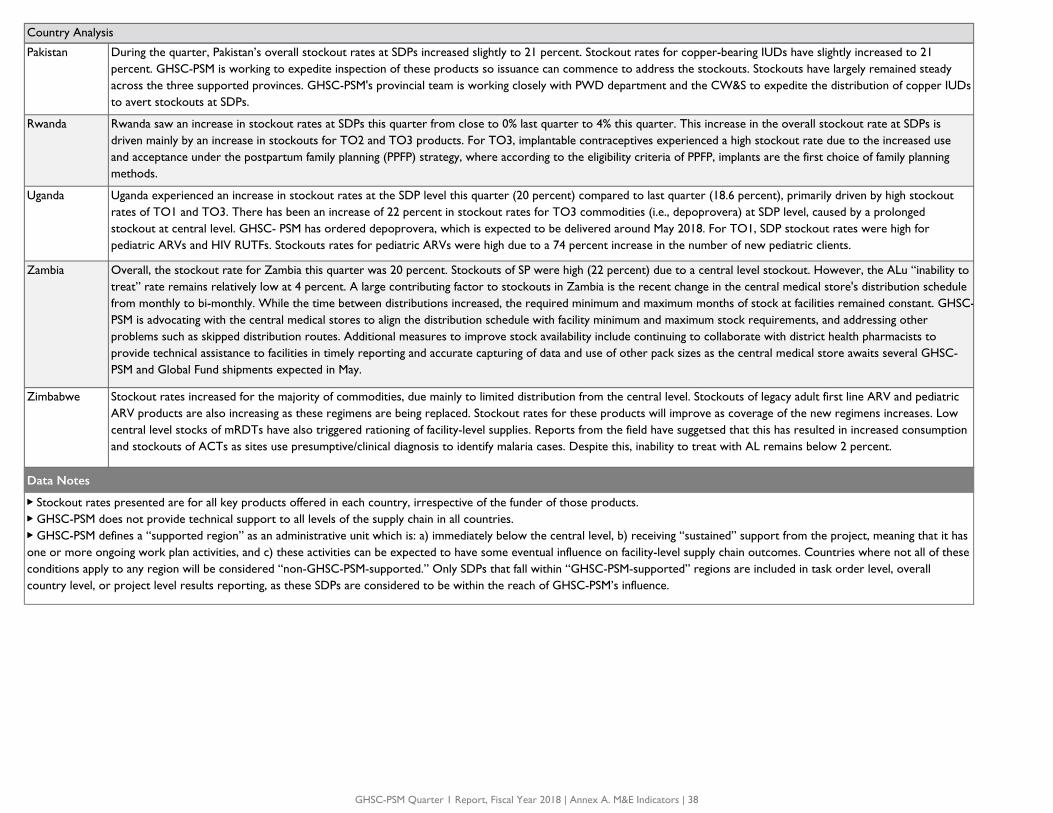
Country Analysis
Pakistan During the quarter, Pakistan’s overall stockout rates at SDPs increased slightly to 21 percent. Stockout rates for copper-bearing IUDs have slightly increased to 21 percent. GHSC-PSM is working to expedite inspection of these products so issuance can commence to address the stockouts. Stockouts have largely remained steady across the three supported provinces. GHSC-PSM's provincial team is working closely with PWD department and the CW&S to expedite the distribution of copper IUDs to avert stockouts at SDPs.
Rwanda Rwanda saw an increase in stockout rates at SDPs this quarter from close to 0% last quarter to 4% this quarter. This increase in the overall stockout rate at SDPs is driven mainly by an increase in stockouts for TO2 and TO3 products. For TO3, implantable contraceptives experienced a high stockout rate due to the increased use and acceptance under the postpartum family planning (PPFP) strategy, where according to the eligibility criteria of PPFP, implants are the first choice of family planning methods.
Uganda Uganda experienced an increase in stockout rates at the SDP level this quarter (20 percent) compared to last quarter (18.6 percent), primarily driven by high stockout rates of TO1 and TO3. There has been an increase of 22 percent in stockout rates for TO3 commodities (i.e., depoprovera) at SDP level, caused by a prolonged stockout at central level. GHSC- PSM has ordered depoprovera, which is expected to be delivered around May 2018. For TO1, SDP stockout rates were high for pediatric ARVs and HIV RUTFs. Stockouts rates for pediatric ARVs were high due to a 74 percent increase in the number of new pediatric clients.
Zambia Overall, the stockout rate for Zambia this quarter was 20 percent. Stockouts of SP were high (22 percent) due to a central level stockout. However, the ALu “inability to treat” rate remains relatively low at 4 percent. A large contributing factor to stockouts in Zambia is the recent change in the central medical store's distribution schedule from monthly to bi-monthly. While the time between distributions increased, the required minimum and maximum months of stock at facilities remained constant. GHSC-PSM is advocating with the central medical stores to align the distribution schedule with facility minimum and maximum stock requirements, and addressing other problems such as skipped distribution routes. Additional measures to improve stock availability include continuing to collaborate with district health pharmacists to provide technical assistance to facilities in timely reporting and accurate capturing of data and use of other pack sizes as the central medical store awaits several GHSC-PSM and Global Fund shipments expected in May.
Zimbabwe Stockout rates increased for the majority of commodities, due mainly to limited distribution from the central level. Stockouts of legacy adult first line ARV and pediatric ARV products are also increasing as these regimens are being replaced. Stockout rates for these products will improve as coverage of the new regimens increases. Low central level stocks of mRDTs have also triggered rationing of facility-level supplies. Reports from the field have suggetsed that this has resulted in increased consumption and stockouts of ACTs as sites use presumptive/clinical diagnosis to identify malaria cases. Despite this, inability to treat with AL remains below 2 percent.
▶▶ Stockout rates presented are for all key products offered in each country, irrespective of the funder of those products.▶▶ GHSC-PSM does not provide technical support to all levels of the supply chain in all countries.▶▶ GHSC-PSM defines a “supported region” as an administrative unit which is: a) immediately below the central level, b) receiving “sustained” support from the project, meaning that it has one or more ongoing work plan activities, and c) these activities can be expected to have some eventual influence on facility-level supply chain outcomes. Countries where not all of these conditions apply to any region will be considered “non-GHSC-PSM-supported.” Only SDPs that fall within “GHSC-PSM-supported” regions are included in task order level, overall country level, or project level results reporting, as these SDPs are considered to be within the reach of GHSC-PSM’s influence.
Data Notes
GHSC-PSM Quarter 1 Report, Fiscal Year 2018 | Annex A. M&E Indicators | 38
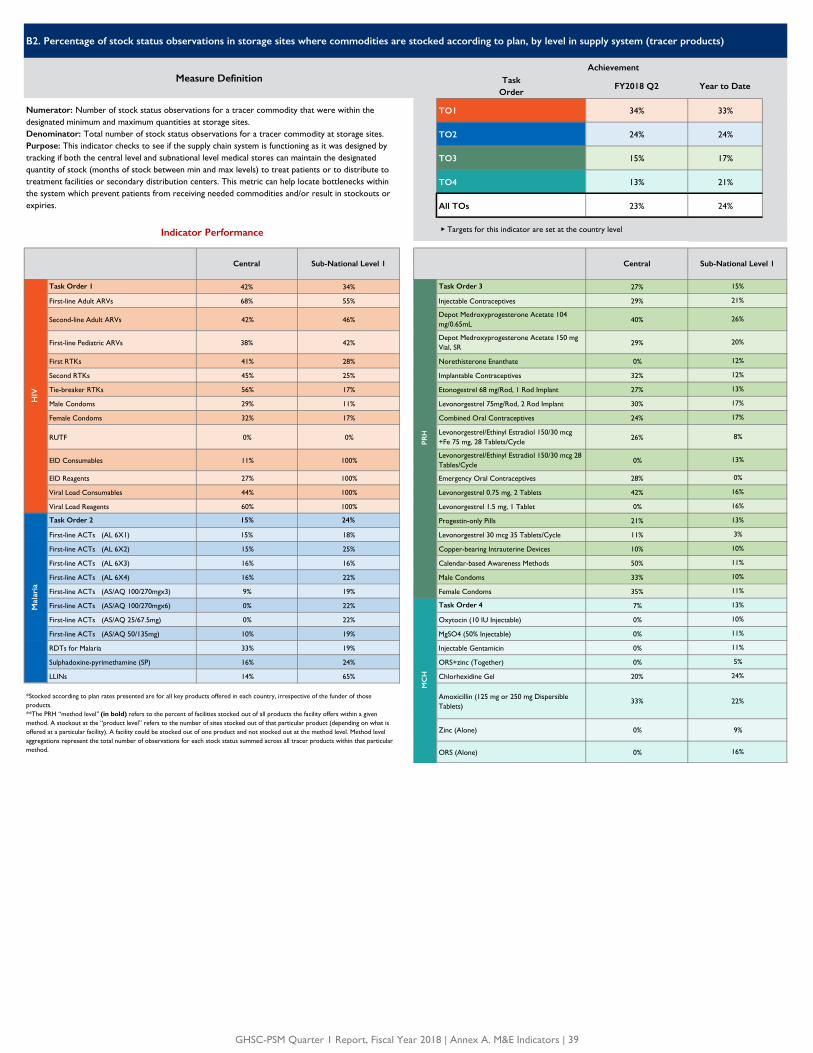
AchievementTask
OrderFY2018 Q2 Year to Date
TO1 34% 33%
TO2 24% 24%
TO3 15% 17%
TO4 13% 21%
All TOs 23% 24%
Central Sub-National Level 1 Central
Task Order 1 42% 34% Task Order 3 27%
First-line Adult ARVs 68% 55% Injectable Contraceptives 29%
Second-line Adult ARVs 42% 46%Depot Medroxyprogesterone Acetate 104 mg/0.65mL
40%
First-line Pediatric ARVs 38% 42%Depot Medroxyprogesterone Acetate 150 mg Vial, SR
29%
First RTKs 41% 28% Norethisterone Enanthate 0%
Second RTKs 45% 25% Implantable Contraceptives 32%
Tie-breaker RTKs 56% 17% Etonogestrel 68 mg/Rod, 1 Rod Implant 27%
Male Condoms 29% 11% Levonorgestrel 75mg/Rod, 2 Rod Implant 30%
Female Condoms 32% 17% Combined Oral Contraceptives 24%
RUTF 0% 0%Levonorgestrel/Ethinyl Estradiol 150/30 mcg +Fe 75 mg, 28 Tablets/Cycle
26%
EID Consumables 11% 100%Levonorgestrel/Ethinyl Estradiol 150/30 mcg 28 Tables/Cycle
0%
EID Reagents 27% 100% Emergency Oral Contraceptives 28%
Viral Load Consumables 44% 100% Levonorgestrel 0.75 mg, 2 Tablets 42%
Viral Load Reagents 60% 100% Levonorgestrel 1.5 mg, 1 Tablet 0%
Task Order 2 15% 24% Progestin-only Pills 21%
First-line ACTs (AL 6X1) 15% 18% Levonorgestrel 30 mcg 35 Tablets/Cycle 11%
First-line ACTs (AL 6X2) 15% 25% Copper-bearing Intrauterine Devices 10%
First-line ACTs (AL 6X3) 16% 16% Calendar-based Awareness Methods 50%
First-line ACTs (AL 6X4) 16% 22% Male Condoms 33%
First-line ACTs (AS/AQ 100/270mgx3) 9% 19% Female Condoms 35%
First-line ACTs (AS/AQ 100/270mgx6) 0% 22% Task Order 4 7%
First-line ACTs (AS/AQ 25/67.5mg) 0% 22% Oxytocin (10 IU Injectable) 0%
First-line ACTs (AS/AQ 50/135mg) 10% 19% MgSO4 (50% Injectable) 0%
RDTs for Malaria 33% 19% Injectable Gentamicin 0%
Sulphadoxine-pyrimethamine (SP) 16% 24% ORS+zinc (Together) 0%
LLINs 14% 65% Chlorhexidine Gel 20%
Amoxicillin (125 mg or 250 mg Dispersible Tablets)
33%
Zinc (Alone) 0%
ORS (Alone) 0%
Measure Definition
Indicator Performance
Numerator: Number of stock status observations for a tracer commodity that were within the designated minimum and maximum quantities at storage sites.Denominator: Total number of stock status observations for a tracer commodity at storage sites.Purpose: This indicator checks to see if the supply chain system is functioning as it was designed by tracking if both the central level and subnational level medical stores can maintain the designated quantity of stock (months of stock between min and max levels) to treat patients or to distribute to treatment facilities or secondary distribution centers. This metric can help locate bottlenecks within the system which prevent patients from receiving needed commodities and/or result in stockouts or expiries.
HIV
PRH
Mal
aria
MC
H
▶ Targets for this indicator are set at the country level
20%
12%
B2. Percentage of stock status observations in storage sites where commodities are stocked according to plan, by level in supply system (tracer products)
Sub-National Level 1
15%
21%
26%
12%
13%
17%
17%
8%
13%
0%
16%
16%
13%
3%
10%
11%
10%
*Stocked according to plan rates presented are for all key products offered in each country, irrespective of the funder of those products.**The PRH “method level” (in bold) refers to the percent of facilities stocked out of all products the facility offers within a given method. A stockout at the “product level” refers to the number of sites stocked out of that particular product (depending on what is offered at a particular facility). A facility could be stocked out of one product and not stocked out at the method level. Method level aggregations represent the total number of observations for each stock status summed across all tracer products within that particular method.
11%
13%
10%
9%
16%
11%
11%
5%
24%
22%
GHSC-PSM Quarter 1 Report, Fiscal Year 2018 | Annex A. M&E Indicators | 39

Central Sub-National Level 1 Central Sub-National Level 1
Task Order 3 38% 0% Task Order 4 0% 4%
Injectable Contraceptives 100% 0% Oxytocin (10 IU Injectable) 0% 0%
Depot Medroxyprogesterone Acetate 104 mg/0.65mL
MgSO4 (50% Injectable) 0% 0%
Depot Medroxyprogesterone Acetate 150 mg Vial, SR
100% 0% Injectable Gentamicin 0% 25%
Norethisterone Enanthate ORS+zinc (Together) 0% 0%
Implantable Contraceptives 0% 0% Chlorhexidine Gel 0% 0%
Etonogestrel 68 mg/Rod, 1 Rod ImplantAmoxicillin (125mg or 250mg Dispersible Tablets)
0% 0%
Levonorgestrel 75mg/Rod, 2 Rod Implants 0% 0% Zinc (Alone) 0% 0%
Combined Oral Contraceptives 0% 0% ORS (Alone) 0% 0%
Levonorgestrel/Ethinyl Estradiol 150/30 mcg +Fe 75 mg, 28 Tablets/Cycle
0% 0% PCV Vaccine
Emergency Oral Contraceptives
Levonorgestrel 0.75 mg, 2 Tablets
Levonorgestrel 1.5 mg, 1 Tablet
Progestin-only Pills
Levonorgestrel 30 mcg 35 Tablets/Cycle
Copper-bearing Intrauterine Devices 0% 0%
Calendar-based Awareness Methods
Male Condoms 100% 0%
Female Condoms
*Stocked according to plan rates presented are for all key products offered in each country, irrespective of the funder of those products.**The PRH “method level” refers to the percent of facilities stocked out of all products the facility offers within a given method. A stockout at the “product level” refers to the number of sites stocked out of that particular product (depending on what is offered at a particular facility). A facility could be stocked out of one product and not stocked out at the method level.
B2. Percentage of stock status observations in storage sites where commodities are stocked according to plan, by level in supply system (tracer products for out-of-cycle country - Nepal)
Indicator Performance
PRH
MC
H
GHSC-PSM Quarter 1 Report, Fiscal Year 2018 | Annex A. M&E Indicators | 40
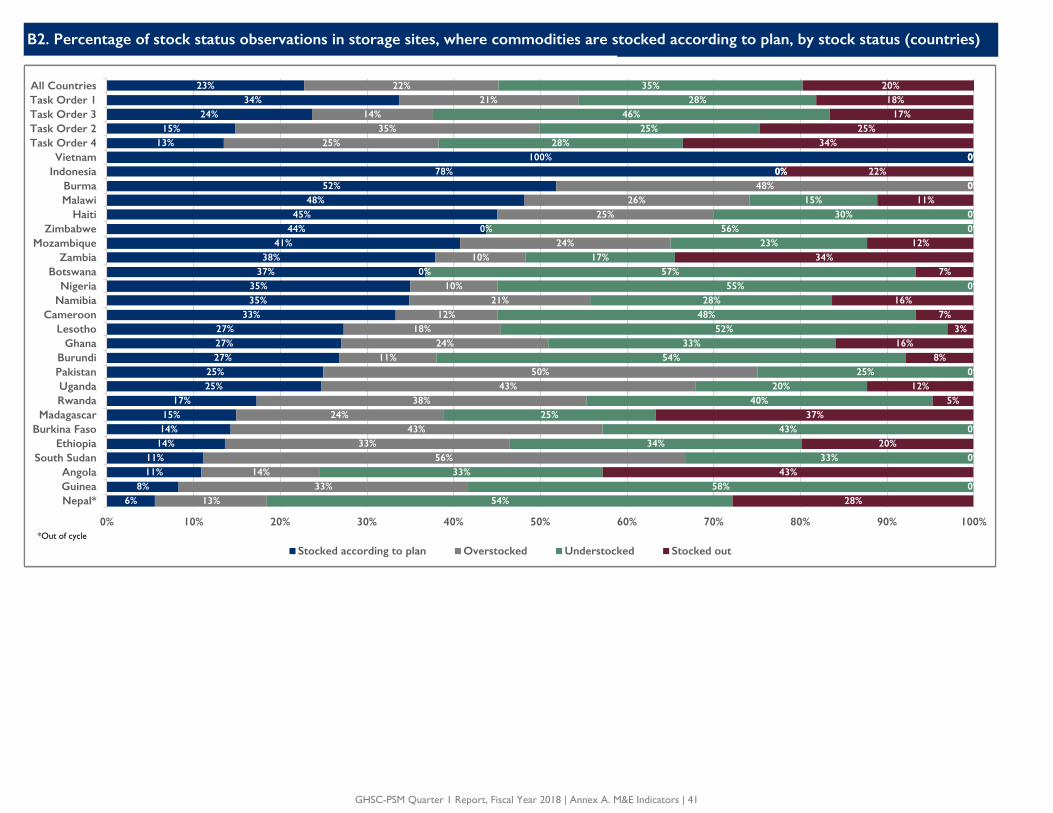
B2. Percentage of stock status observations in storage sites, where commodities are stocked according to plan, by stock status (countries)
5.56%8.33%
10.91%11.11%
13.58%14.29%14.89%
17.31%24.69%25.00%
26.76%27.09%27.27%
33.33%34.88%35.00%
36.67%37.93%
40.71%43.75%45.00%
48.15%51.85%
77.78%100.00%
13%15%
24%34%
23%
12.96%33.33%
13.73%55.56%
32.95%42.86%
23.89%37.98%
43.21%50.00%
11.27%23.82%
18.18%11.67%
20.93%10.00%
0.00%10.34%
24.33%0.00%
25.00%25.93%
48.15%0.00%
0.00%25%
35%14%
21%22%
53.70%58.33%
32.57%33.33%
33.61%42.86%
24.56%39.92%
19.75%25.00%
54.13%33.09%
51.52%48.33%27.91%
55.00%56.67%
17.24%22.70%
56.25%30.00%
14.81%0.00%
0.00%0.00%
28%25%
46%28%
35%
27.78%0.00%
42.80%0.00%
19.87%0.00%
4.78%12.35%
0.00%7.83%
16.00%3.03%
6.67%16.28%
0.00%6.67%
34.48%12.26%
0.00%0.00%
11.11%0.00%
22.22%0.00%
34%25%
17%18%
20%
0.00% 10.00% 20.00% 30.00% 40.00% 50.00% 60.00% 70.00% 80.00% 90.00% 100.00%
Nepal*GuineaAngola
South SudanEthiopia
Burkina FasoMadagascar
RwandaUganda
PakistanBurundi
GhanaLesotho
CameroonNamibiaNigeria
BotswanaZambia
MozambiqueZimbabwe
HaitiMalawiBurma
IndonesiaVietnam
Task Order 4Task Order 2Task Order 3Task Order 1All Countries
Stocked according to plan Overstocked Understocked Stocked out*Out of cycle
0.11
0.29
0.54
0.83
0.47
0.06
0.389
0.25
0.424
0.79
0.13
0.111
0.182
0.73
0.83
0.33
0.15
0.39
0.35
0.43
0.06
0.3
0.14
0.21
0.35
0.22
0.2
0.07
0.11
0.17
0.19
0.18
0.056
0.114
0.252
0.17
0.29
0.444
0.303
0.27
0
0.21
0.5
0.09
0.16
0.14
0.15
0.36
0.25
0.24
0.19
0.25
0.64
0.64
0.18
0
0.21
0.04
0.556
0.364
0.252
0
0.12
0.333
0.424
0
0
0.38
0.21
0.48
0.41
0.29
0.23
0.17
0.16
0.28
0.27
0.22
0.06
0
0.18
0
0.13
0.72
0.273
0.073
0.04
0.46
0.111
0.091
0
0.17
0.08
0.14
0.04
0.08
0.14
0.56
0.17
0.45
0.27
0.19
0.31
0 0.1 0.2 0.3 0.4 0.5 0.6 0.7 0.8 0.9 1
Nepal*Zimbabwe
ZambiaVietnamUganda
PakistanNigeria
NamibiaMozambique
MalawiMadagascar
Liberia Lesotho
HaitiGuyanaGhana
EthiopiaCameroon
BurundiBurkina Faso
AngolaTask order 4Task order 3Task order 2Task order 1All countries
Stocked according to plan Overstocked Understocked Stocked out*Out of cycle
6%8%
11%11%
14%14%15%
17%25%25%
27%27%27%
33%35%35%
37%38%
41%44%45%
48%52%
78%100%
13%15%
24%34%
23%
13%33%
14%56%
33%43%
24%38%
43%50%
11%24%
18%12%
21%10%
0%10%
24%0%
25%26%
48%0%
0%25%
35%14%
21%22%
54%58%
33%33%
34%43%
25%40%
20%25%
54%33%
52%48%28%
55%57%
17%23%
56%30%
15%0%
0%0%
28%25%
46%28%
35%
28%0%
43%0%
20%0%
37%5%
12%0%
8%16%
3%7%
16%0%
7%34%
12%0%0%
11%0%
22%0%
34%25%
17%18%
20%
0% 10% 20% 30% 40% 50% 60% 70% 80% 90% 100%
Nepal*GuineaAngola
South SudanEthiopia
Burkina FasoMadagascar
RwandaUganda
PakistanBurundi
GhanaLesotho
CameroonNamibiaNigeria
BotswanaZambia
MozambiqueZimbabwe
HaitiMalawiBurma
IndonesiaVietnam
Task Order 4Task Order 2Task Order 3Task Order 1All Countries
Stocked according to plan Overstocked Understocked Stocked out*Out of cycle
GHSC-PSM Quarter 1 Report, Fiscal Year 2018 | Annex A. M&E Indicators | 41

B2. Stocked according to plan - granular-level analysis
▶
▶
▶
▶
▶
▶
▶
▶
▶
Analysis
GHSC-PSM compiles indicator data for all countries in which the project maintains a field office, regardless of the extent of the project’s engagement in the country. Therefore, the results in a given country for a specific point in time are not solely a consequence of GHSC-PSM’s activities, but rather reflect the many stakeholders and elements that influence in-country supply chain performance.
Overall, 23 percent of tracer products were stocked within the minimum and maximum levels at storage sites this quarter. This is a slight decrease from 26 percent last quarter.
Tracer products were more likely to be stocked according to plan at the central level for HIV, PRH, and MNCH products (TO1: 42 percent central and 34 percent subnational 1; TO3: 27 percent central and 15 percent subnational 1; TO4: 25 percent central and 18 percent subnational 1). Malaria products were more likely to be stocked according to plan at the sub-national level 1 (TO2: 15 percent central and 24 percent subnational 1).
HIV products were stocked according to plan 34 percent of the time, a slight increase from last quarter (33 percent). First line ARVs were stocked according to plan 68 percent of the time at the central level and 55 percent of the time at the subnational level. Second line ARVs and first line pediatric ARVs both showed a slight decrease in stocked according to plan to 49 percent and 47 percent, respectively. Viral load reagents being stocked according to plan showed an increase from 47 percent to 60 percent but viral load consumables showed a decrease over last quarter from 70 percent to 44 percent. EID consumables and reagents showed a marked decrease from last quarter, dropping to 11 percent and 27 percent, respectively.
Malaria products were stocked according to plan 23 percent of the time, similar to last quarter's 25 percent. The products most likely to be stocked according to plan include include malaria rapid diagnostic tests (33 percent central level, 19 percent sub-national level 1), AL 6X2 (15 percent central level, 25 percent sub-national 1 level), and AL 6X4 (16 percent central level, 22 percent sub-national 1 level).
PRH products were stocked according to plan 15 percent of the time, a decrease from 19 percent in the previous quarter. The products most likely to be stocked according to plan include depot medroxyprogesterone acetate 104 mg/0.65 mL (40 percent central level), levonorgestrel 0.75 mg, 2 tablets (42 percent central level), levonorgestrel 75mg/rod, 2 rod implant (30 perecent central level), and calendar-based awarenss methods (50 percent central level).
MNCH products were stocked according to plan 13 percent of the time, a marked decrease from 29 percent last quarter. The products most likely to be stocked according to plan include amoxicillin (125 mg or 250 mg dispersible tablets) (38 percent central level, 22 percent sub-national level 1), and chlorhexidine gel (25 percent central level, 25 percent sub-national level 1).
Data notes
Q2 data do not include subnational level 2 observations as the data were deemed not complete enough to be included.
Stocked according to plan rates presented are for all key products offered in each country, irrespective of the funder of those products.
GHSC-PSM Quarter 1 Report, Fiscal Year 2018 | Annex A. M&E Indicators | 42

Angola
Botswana
Burkina Faso
Burma
Burundi
Cameroon
Ethiopia
Ghana
B2. Stocked according to plan - country-level analysis
Country Analysis
Angola has reported an increase of sites observed, namely provincial and central level, as stocked according to plan from 5 percent to 11 percent. Stockouts have slightly increased to 43 percent, compared to 38 percent last quarter due to an effort to keep facilities stocked rather than storing buffer at the provincial level. At the central level, the only HIV tracer product stocked out was female condoms. For malaria products, stockout rates for SP and RDTs rose to 15 percent and 28 percent, respectively. A major driver of stockout rates this quarter were PRH products, which at the provincial level had 47 percent of 540 stock observations marked as stocked out due to stockouts at the central level and a lack of MoH procurements.
Burkina Faso’s stocked according to plan rate fell from 29 percent to 14 percent; however, this represented a shift to overstocking, while understocking remained constant at 43 percent, with no stockouts at storage sites. Additionally, only central level data are included: district level data were not available in time for reporting.
This quarter Burma reported a decrease from 83% to 52% of sites stocked with minimum and maximum levels this quarter. The remainder of sites have been observed to be overstocked. This phenomenon is directly related to the National AIDS Program preparing to accept a transfer of patients that were previously treated by NGO implementing partners. These stock observations will adjust to appropriate levels once consumption of these transfer patients are incorporated into consumption data.
Ethiopia had a consistently low stocked according to plan rate, at 14 percent this quarter, down from 16 percent last quarter. Stockouts increased from 14 to 20 percent, and understocking from 30 to 34 percent. Stocking to plan is substantially higher at the central level (22 percent) than at the regional level (13 percent); however, understocking is more pronounced at the central level (44 percent) than at the regional level (32 percent). At the central level, 60 percent of malaria stock observations and 50 percent of MCH observations were stocked out. These numbers were reduced at the regional level (25 and 28 percent, respectively). It could be fairly concluded from the low facility stockout rates that more stock was pushed to facilities to accommodate seasonal variation of some commodities and programmatic changes like the appointment spacing model implementation. In addition, procurement is not in accordance with the min-max inventory system as it was designed. Several measures are being taken to improve warehouse stocking, including addressing product shortages at the central level, supporting the Pharmaceuticals Fund and Supply Agency (PFSA) to strengthen its inventory management system, working closely with PFSA hubs and regional health units to improve data quality at facilities and storage sites, and supporting PFSA to triangulate consumption and service data during the refill process.
The most commonly used first and second line adult ARVs were stocked according to plan throughout the reporting period. Other HIV products, including pediatric ARVs, RTKs, and lab products, were generally understocked due to procurement and delivery delays. Issues related with delayed procurement processes are expected to improve over the subsequent quarter through a robust supply planning and close monitoring of stock status, with the technical assistance of the seconded staff to CMS.
About one quarter of stock observations in Burundi were stocked according to plan this period, while more than half of observations were understocked. Observations for many HIV products at subnationa sites were not reported, due to difficulties in determining accurate consumption. GHSC-PSM is working with the national HIV/AIDS program to better define the most appropriate parameter for calculating average consumption.
Stocked according to plan status improved slightly for first line adult ARVs and pediatric ARVs since the previous quarter. Second line adult ARVs were understocked and stocked out, but a close substitute was available to mitigate the impact on patients. RTK performance was generally low, with high rates of understocking. Inventory management at the national and regional levels remains a focus of GHSC-PSM's technical assistance.
Ghana submitted data for January and February 2018 for this indicator. Overall, the rates for all stock statuses remained fairly consistent with the previous quarter, with the largest difference being the stocked out rate, which saw a 6% decline from 22% in FY18 Q1 to 16% in FY18 Q2. This drop in the stockout rate can be attributed to the streamlining of distributions from the central to regional levels and the fact that the stock report is increasingly being used to inform decision-making.
GHSC-PSM Quarter 1 Report, Fiscal Year 2018 | Annex A. M&E Indicators | 43

Country Analysis
Haiti
Indonesia
Madagascar
Malawi
Mozambique
Namibia
Nepal
Nigeria
Indonesia is reporting this indicator for the first time and was able to report on three tracer products—most used 1st line ARV, most used 2nd line ARV, and most used 1st line pediatric ARV. All observations for the most used 1st line ARV and 2nd line ARV were stocked according to plan; however 1st line pediatric ARV was only stocked according to plan 33% of the time (1 of 3 observations). The rest of the observations were marked as stocked out. As a result, Indonesia saw an overall stocked according to plan rate of 78% and a stockout rate of 22%.
Overall, the rates for all stock statuses remained consistent with the previous quarter, with the stocked according to plan and understocked rates remaining the same from last quarter at 41% and 23%, respectively. Meanwhile, the overstocked rate increased by 2% to 24%, and the stocked out rate decreased by the same amount, to 12%.
Haiti improved its stocked according to plan rate from 42 to 45 percent. However, understocking also increased from 12 to 30 percent, slightly more among family planning products. For HIV/AIDS products, only male condoms were understocked. The understocking of condoms is due to a new Ministry of Health strategy to prioritize long-term family planning methods, and therefore reducing the required stock levels for products such as condoms. GHSC-PSM will continue to monitor the evolution of the USAID mission's recent strategy shift from consumption-based procurement to a quota-based system for stock replenishments, as well as the new Ministry of Health strategy regarding the prioritization of long-term family planning methods.
Overall results improved from the previous quarter, from 18 to 35 percent of observatations stocked according to plan in Q2. Stockouts of first RTKs and pediatric ARVs flipped to overstocks during the quarter, as new orders arrived. MoHSS allowed a limited procuremnet mandate to the central medical stores, which resulted in faster order processing and improved stockholding. However, delayed ARV procurements limit CMS's ability to plan deliveries. GHSC-PSM is reviewing options for providing procurement support.
Madagascar maintained its 15 percent rate of stocked according to plan at the central and regional level since last quarter, while stockouts increased from 30 to 37 percent. Stockouts were 18 percent for malaria products, 36 percent for family planning products, and 81 percent for maternal and child health products. For malaria products, stocking according to plan improved at the district level from 19 to 23 percent, particularly in the zones where GHSC-PSM provides support. However, at the central level products are all understocked or stocked out. Stockouts of family planning products, as previously noted, are in part due to late deliveries by other donors, particularly a shipment that arrived six months late. For maternal and child health products, there is not yet a consistent mechanism of procuring, and for now a push distribution of free MCH commodities is being organized based on stock available in country. GHSC-PSM has mobilized reources, and first shipments are expected in June and July and later in the year. At the central level, the project will focus on ensuring adherence to the supply plans in the timing of placing orders and coordinating with other family planning partners to address stock imbalances through re-distribution and emergency orders.
Indicator performance is generally strong for HIV and PRH products, at 67 and 75 percent for each task order respectively. Malaria products had higher rates of overstocking, while MNCH products (ammoxicillin 250 mg, zinc, and ORS) were stocked out at the central level. Deliveries for TO2 and TO3 over the next few months are expected to sustain stocks through FY2018.
Nepal's storage data refer back to stock status observed in October, in order to align with data reported for indicator B1. This quarter, Nepal has changed its approach to calculating sites that are stocked according to plan. The change is in how average monthly consumption (AMC) is calculated, which impacts appropriate minimum and maximum stock levels. Now, issue data for up to four quarters (as available) is divided by the corresponding number of months, to generate a more even AMC value. This quarter, 6 percent of facilities were stocked appropriately between minimum and maximum levels. Additionally, major warehouse reorganizations occurred this quarter, which improved storage conditions, organization of commodities, and use of storage space. These improvements should improve the performance of this indicator in the coming quarters.
Nigeria once again reported no stockouts at the central level for any products and had an increase in the percentage of commodities stocked according to plan, from 24 percent in Q1 2018 to 35 percent in Q2 2018. Nigeria did see several products that were understocked, including RDTs. RDTs were understocked due to a delay in the PMI procurement of RDTs which previously accounted for the availability of RDTs from other donors. Shipments of RDTs for FY18 are currently planned for April 2018 and August 2018.
GHSC-PSM Quarter 1 Report, Fiscal Year 2018 | Annex A. M&E Indicators | 44

Country Analysis
Pakistan
Rwanda
South Sudan
Uganda
Vietnam
Zambia
Zimbabwe
▶
Overall, sites stocked according to plan have increased to 25 percent in the supported provinces of KP, Punjab, Balochistan, and Sindh. The system that generates SMS/email alerts generated by the LMIS to rapidly alert supply chain actors of actions needs to optimize distribution is helping but additional support is needed. GHSC-PSM is working with provincial governments to expedite procurements and streamline distribution. This should help improve performance on this indicator next quarter.
Overall, Rwanda saw a slight increase in products that were stocked out (2 percent in Q1 FY18 to 5 percent in Q2 FY18), and a decrease in products that were stocked according to plan (36 percent in Q1 FY18 to 17 percent in Q2 FY18), while those that were overstocked increased (30 percent in Q1 FY18 to 38 percent in Q2 FY18). For TO2 specifically, malaria commodities were understocked at the central level during Q2 2018, with only a few days of stockouts for malaria RDTs and Artemether-Lumefantrine (AL) 6x3. January 2018 had more malaria cases in comparison to recent years, which contributed to the increase the stockout rates in TO2.
Malaria products were generally understocked this quarter, with HIV products performing better. Delays from other partners may prevent some orders of ACTs and mRDTs from arriving in advance of the malaria season. To mitigate ACT shortages, PMI approved the use of savings to place emergency orders through GHSC-PSM, with some already received and some still pending.
Data Notes
Stocked according to plan rates in Zambia increased from 32 to 38 percent since last quarter; however, stockouts have increased from 11 to 34 percent. Understocking was high among both malaria and family planning products. SP was centrally stocked out due to lack of a funding commitment. Furthermore, all maternal and child health tracer products were stocked out, due to a lack of funding commitment by the GRZ and other funders. It is also worth noting that the project has no funding committed for this task order. Regarding malaria products, several shipments are expected in May. For family planning products, GHSC-PSM is supporting the government to conduct redistributions to avoid facility stockouts.
Vietnam continues to have excellent performance in this indicator. This quarter they reported 100 percent of sites to be stocked according to plan.
Stocked according to plan observations in Uganda decreased from 28 in Q1 2018 to 25 percent in Q2 2018, with a significant increase in commodities that are overstocked (36 percent in Q1 FY18 to 43 percent in Q2 FY18). For TO1 specifically, 44 percent of TO1 commodities were stocked according to plan compared to 36 percent in Q1 FY18, while both TO2 and TO3 decreased.The reduction in TO2 and TO3 stock status observations of stocked according to plan is explained by an increase of overstocked status and understocked status observations compared to last quarter. The increase in overstocked observations for TO2 can be attributed to lower than expected consumption of malaria tracer products.
South Sudan, which is reporting for the first time, reported on three tracer products - male condoms, most used 1st line ARV, and first RTK - all of which had no stockout observations for the quarter. The stocked according to plan rate was 11 percent, which, though not reported, is a large decrease in the stocked according to plan rate from the previous quarter of 66 percent. The sharp decline in the stocked according to plan rate - and the fact that the overstock rate is 56 percent for Q2 - can be attributed to the fact that male condoms had an overstocked rate of 100 percent this quarter and the most used 1st line ARV had an overstocked rate of 67 percent, when both had a stocked according to plan rate of 100 percent last quarter.
GHSC-PSM Quarter 1 Report, Fiscal Year 2018 | Annex A. M&E Indicators | 45
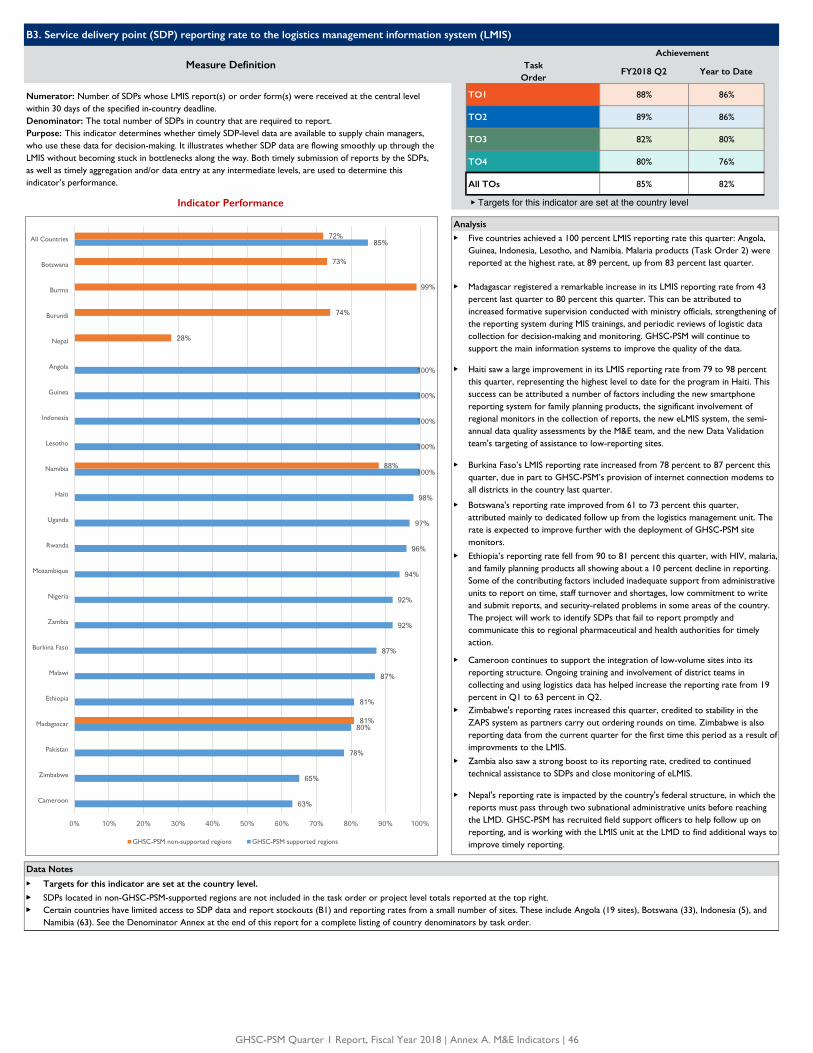
Task Order
FY2018 Q2 Year to Date
TO1 88% 86%
TO2 89% 86%
TO3 82% 80%
TO4 80% 76%
All TOs 85% 82%
▶ Targets for this indicator are set at the country level
▶
▶
▶
▶
▶
▶
▶
▶
▶
▶
▶ Targets for this indicator are set at the country level.
▶▶ ▶▶
Data Notes
Certain countries have limited access to SDP data and report stockouts (B1) and reporting rates from a small number of sites. These include Angola (19 sites), Botswana (33), Indonesia (5), and Namibia (63). See the Denominator Annex at the end of this report for a complete listing of country denominators by task order.
SDPs located in non-GHSC-PSM-supported regions are not included in the task order or project level totals reported at the top right.
Analysis
Five countries achieved a 100 percent LMIS reporting rate this quarter: Angola, Guinea, Indonesia, Lesotho, and Namibia. Malaria products (Task Order 2) were reported at the highest rate, at 89 percent, up from 83 percent last quarter.
Haiti saw a large improvement in its LMIS reporting rate from 79 to 98 percent this quarter, representing the highest level to date for the program in Haiti. This success can be attributed a number of factors including the new smartphone reporting system for family planning products, the significant involvement of regional monitors in the collection of reports, the new eLMIS system, the semi-annual data quality assessments by the M&E team, and the new Data Validation team's targeting of assistance to low-reporting sites.
Cameroon continues to support the integration of low-volume sites into its reporting structure. Ongoing training and involvement of district teams in collecting and using logistics data has helped increase the reporting rate from 19 percent in Q1 to 63 percent in Q2.
Nepal's reporting rate is impacted by the country's federal structure, in which the reports must pass through two subnational administrative units before reaching the LMD. GHSC-PSM has recruited field support officers to help follow up on reporting, and is working with the LMIS unit at the LMD to find additional ways to improve timely reporting.
Zimbabwe's reporting rates increased this quarter, credited to stability in the ZAPS system as partners carry out ordering rounds on time. Zimbabwe is also reporting data from the current quarter for the first time this period as a result of improvments to the LMIS.
Burkina Faso’s LMIS reporting rate increased from 78 percent to 87 percent this quarter, due in part to GHSC-PSM’s provision of internet connection modems to all districts in the country last quarter.
Ethiopia’s reporting rate fell from 90 to 81 percent this quarter, with HIV, malaria, and family planning products all showing about a 10 percent decline in reporting. Some of the contributing factors included inadequate support from administrative units to report on time, staff turnover and shortages, low commitment to write and submit reports, and security-related problems in some areas of the country. The project will work to identify SDPs that fail to report promptly and communicate this to regional pharmaceutical and health authorities for timely action.
Botswana's reporting rate improved from 61 to 73 percent this quarter, attributed mainly to dedicated follow up from the logistics management unit. The rate is expected to improve further with the deployment of GHSC-PSM site monitors.
Zambia also saw a strong boost to its reporting rate, credited to continued technical assistance to SDPs and close monitoring of eLMIS.
Madagascar registered a remarkable increase in its LMIS reporting rate from 43 percent last quarter to 80 percent this quarter. This can be attributed to increased formative supervision conducted with ministry officials, strengthening of the reporting system during MIS trainings, and periodic reviews of logistic data collection for decision-making and monitoring. GHSC-PSM will continue to support the main information systems to improve the quality of the data.
B3. Service delivery point (SDP) reporting rate to the logistics management information system (LMIS)
Measure DefinitionAchievement
Numerator: Number of SDPs whose LMIS report(s) or order form(s) were received at the central level within 30 days of the specified in-country deadline.Denominator: The total number of SDPs in country that are required to report.Purpose: This indicator determines whether timely SDP-level data are available to supply chain managers, who use these data for decision-making. It illustrates whether SDP data are flowing smoothly up through the LMIS without becoming stuck in bottlenecks along the way. Both timely submission of reports by the SDPs, as well as timely aggregation and/or data entry at any intermediate levels, are used to determine this indicator’s performance.
Indicator Performance
63%
65%
78%
80%
81%
87%
87%
92%
92%
94%
96%
97%
98%
100%
100%
100%
100%
100%
85%
81%
88%
28%
74%
99%
73%
72%
0% 10% 20% 30% 40% 50% 60% 70% 80% 90% 100%
Cameroon
Zimbabwe
Pakistan
Madagascar
Ethiopia
Malawi
Burkina Faso
Zambia
Nigeria
Mozambique
Rwanda
Uganda
Haiti
Namibia
Lesotho
Indonesia
Guinea
Angola
Nepal
Burundi
Burma
Botswana
All Countries
GHSC-PSM non-supported regions GHSC-PSM supported regions
GHSC-PSM Quarter 1 Report, Fiscal Year 2018 | Annex A. M&E Indicators | 46
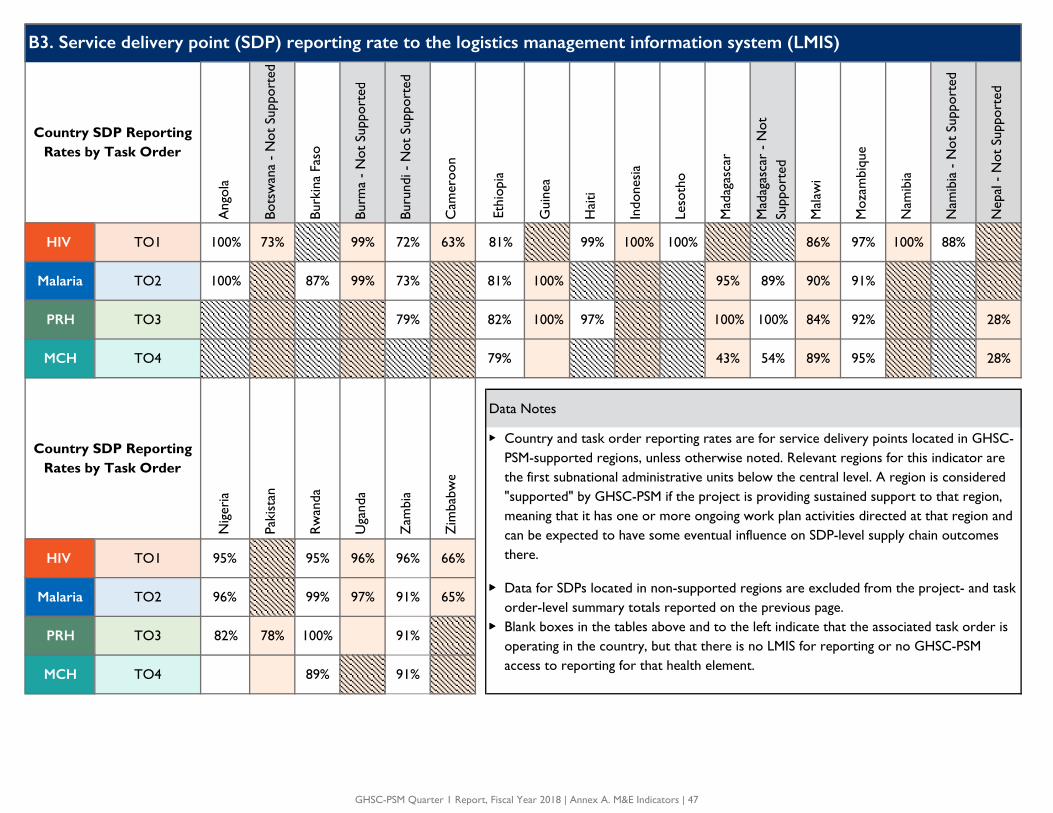
Ang
ola
Bots
wan
a -
Not
Sup
port
ed
Burk
ina
Faso
Burm
a -
Not
Sup
port
ed
Buru
ndi -
Not
Sup
port
ed
Cam
eroo
n
Gui
nea
Hai
ti
Indo
nesi
a
Leso
tho
Mad
agas
car
Mad
agas
car
- N
ot
Supp
orte
d
Mal
awi
Moz
ambi
que
Nam
ibia
Nam
ibia
- N
ot S
uppo
rted
Nep
al -
Not
Sup
port
ed
HIV TO1 100% 73% 99% 72% 63% 99% 100% 100% 86% 97% 100% 88%
Malaria TO2 100% 87% 99% 73% 100% 95% 89% 90% 91%
PRH TO3 79% 100% 97% 100% 100% 84% 92% 28%
MCH TO4 43% 54% 89% 95% 28%
▶
HIV TO1 95% 95% 96% 96% 66%
Malaria TO2 96% 99% 97% 91% 65%▶▶
PRH TO3 82% 78% 100% 91%▶▶
MCH TO4 89% 91%
B3. Service delivery point (SDP) reporting rate to the logistics management information system (LMIS)
Country SDP Reporting Rates by Task Order
Zam
bia
Zim
babw
e
Ethi
opia
81%
81%
82%
79%
Data Notes
Country and task order reporting rates are for service delivery points located in GHSC-PSM-supported regions, unless otherwise noted. Relevant regions for this indicator are the first subnational administrative units below the central level. A region is considered "supported" by GHSC-PSM if the project is providing sustained support to that region, meaning that it has one or more ongoing work plan activities directed at that region and can be expected to have some eventual influence on SDP-level supply chain outcomes there.
Data for SDPs located in non-supported regions are excluded from the project- and task order-level summary totals reported on the previous page.
Country SDP Reporting Rates by Task Order
Nig
eria
Paki
stan
Rw
anda
Uga
nda
Blank boxes in the tables above and to the left indicate that the associated task order is operating in the country, but that there is no LMIS for reporting or no GHSC-PSM access to reporting for that health element.
GHSC-PSM Quarter 1 Report, Fiscal Year 2018 | Annex A. M&E Indicators | 47

FY18Target
FY2018 Q2 Year to Date
87% 87% 90%
85% 92% 96%
88% 75% 77%
60% 75% 67%
86% 86% 89%
86% 73% 73%
67% 50% 50%
88% 63% 61%
N/A 77% 78%
▶▶
▶▶
▶▶
▶▶
▶▶
▶▶
The required supply plans by commodity group and country are shown on the following page.
Targets reflect anticipated project performance by end of FY18 (September 30, 2018).
MNCH Commodities
Condoms
Total
Analysis
Data Notes
During Q1, the Forecasting and Supply Planning (FASP) technical working group completed the supply plan expectation exercise, establishing the universe of country/commodity supply plans that are required quarterly. The outcome of this exercise is a verified reference point in determining supply plan expectations and a critical tool for the identification of countries on which to focus technical assistance to improve performance.
Across all commodity groups, 72 quarterly supply plans were submitted, representing 72% of the Q2 expectation. This ranged from 87% of required supply plans submitted for ARVs, 86% for malaria commodities, and 77% for lab (HIV diagnostics), to 50% (3 of 6) for MNCH commodities.
Tanzania did not submit supply plans this quarter as the country is currently going through their quantification exercise. The country expects to be able to submit the required plans for missing commodities in the next quarter.
While the supply plan submission rates are down across all task orders, the raw number of supply plans submitted this quarter and the expected number of supply plans submitted has increased since the previous quarter.
Indicator Performance FY2018 Q2
PRH Commodities
B6. Percentage of required supply plans submitted to GHSC-PSM during the quarter
Achievement
Commodity Group
ARVs
Lab (HIV diagnostic)
RTKs
VMMC
Malaria Commodities
Measure Definition
Numerator: Number of required supply plans that were submitted to GHSC-PSM in the quarter.Denominator: Total number of required supply plans.Purpose: Regular visibility into country supply plans is integral to accurate forecasting, which is at the root of commodity security.
87%
92%
75% 75%
86%
73%
50%
63%
77%
0%
10%
20%
30%
40%
50%
60%
70%
80%
90%
100%
ARVs Lab (HIV diagnostic) RTKs VMMC Malaria Commodities
PRH Commodities MNCH Commodities
Condoms Total
87%FY18
Target
85%FY18
Target
88%FY18
Target
60%FY18
Target
86%FY18
Target
86%FY18
Target
67%FY18
Target
88%FY18
Target
GHSC-PSM Quarter 1 Report, Fiscal Year 2018 | Annex A. M&E Indicators | 48

Commodity CountrySubmitted TO
GHSC-PSMCommodity Country
Submitted TO GHSC-PSM
Botswana Yes Angola Yes
Burundi Yes Burkina Faso Yes
Cameroon No Burundi Yes
Côte Ivoire Yes Ghana Yes
Democratic Republic of Congo Yes Kenya No
Ghana Yes Madagascar No
Haiti Yes Malawi Yes
Mozambique Yes Mozambique Yes
Nigeria Yes Nigeria Yes
Rwanda Yes Rwanda Yes
Tanzania No Tanzania Yes
Uganda Yes Uganda Yes
Vietnam Yes Zambia Yes
Zambia Yes Zimbabwe Yes
Zimbabwe Yes
Burundi Yes
Burundi Yes Democratic Republic of Congo No
Cameroon Yes Ethiopia Yes
Côte Ivoire Yes Ghana Yes
Democratic Republic of Congo Yes Haiti Yes
Ethiopia Yes Kenya No
Haiti Yes Madagascar No
Mozambique Yes Malawi Yes
Nigeria Yes Mozambique Yes
Rwanda Yes Nepal Yes
Tanzania No Nigeria No
Uganda Yes Rwanda Yes
Zambia Yes Tanzania Yes
Zimbabwe Yes Uganda Yes
Zambia Yes
Botswana Yes
Burundi Yes Ghana No
Cameroon No Haiti No
Côte Ivoire Yes Madagascar No
Democratic Republic of Congo No Mozambique Yes
Ethiopia Yes Rwanda Yes
Ghana Yes Zambia Yes
Haiti Yes
Malawi No Côte Ivoire No
Mozambique Yes Democratic Republic of Congo No
Nigeria Yes Ethiopia No
Rwanda Yes Ghana Yes
Tanzania No Haiti Yes
Uganda Yes Malawi Yes
Zambia Yes Mozambique Yes
Zimbabwe Yes Nepal No
Nigeria No
Malawi No Rwanda Yes
Mozambique Yes Senegal Yes
Uganda Yes Swaziland No
Zimbabwe Yes Tanzania Yes
Uganda Yes
Zambia Yes
Zimbabwe Yes
VMMC
RTK
B6. Percentage of required supply plans submitted to GHSC-PSM during the quarter
ARV
Lab
Malaria
PRH
Condoms
MNCH
GHSC-PSM Quarter 1 Report, Fiscal Year 2018 | Annex A. M&E Indicators | 49

Task Order
FY2018 Q2 Year to Date
TO1 1 4
TO2 1 2
TO3 3 5
TO4 1 1
Cross-Cutting 4 7
All TOs 10 19
▶ Target not required for this indicator.
Global/Country Type of Innovation
Cameroon New Approach
South Sudan New Technology
Pakistan New Technology The main objective of Quarter 2 was to simplify the functionalities and make LMIS more user-friendly and provide strategic support. To do this, GHSC-PSM Pakistan obtained a license for Microsoft Power Business Intelligence tool to allow users to extract intelligence by manipulating large data sets. Gartner (the leading research company) positioned Microsoft Power BI as leader in BI tools. It runs under Microsoft 365 License. The challenge of implementing MS Power BI was the need to have a license for each single user. Sustainability was the challenge. The MIS team took the challenge and used MS Power BI in LMIS using the technology iFRAME. With this initiative, only one license is consumed and it allows all LMIS users to use MS Power BI without any licensing.
TO3
Brief Description
C1. Number of innovations (including operations research studies) that were developed, implemented, or introduced and are related to health commodity market or supply chain best practices
Measure DefinitionAchievement
Description of Innovation
TO1
GHSC-PSM South Sudan developed a database to capture and monitor the distribution of LLINs based on a robust documentation system that ensured an error-proof delivery of these LLINs to eight of the ten former states of South Sudan seamlessly.
The GHSC-PSM team in Cameroon has implemented a new strategy to improve reporting and stock availability. WhatsApp groups have been created at the district level to send reminders on reporting and refill order deadlines and to share information on supply chain management.Through this forum, products are redeployed to sites with risk of stockout.
TO2
Number of innovations: An innovation refers to new technologies, new products, new approaches, and/or operational research studies developed, implemented, or introduced during the period of reporting.
GHSC-PSM Quarter 1 Report, Fiscal Year 2018 | Annex A. M&E Indicators | 50
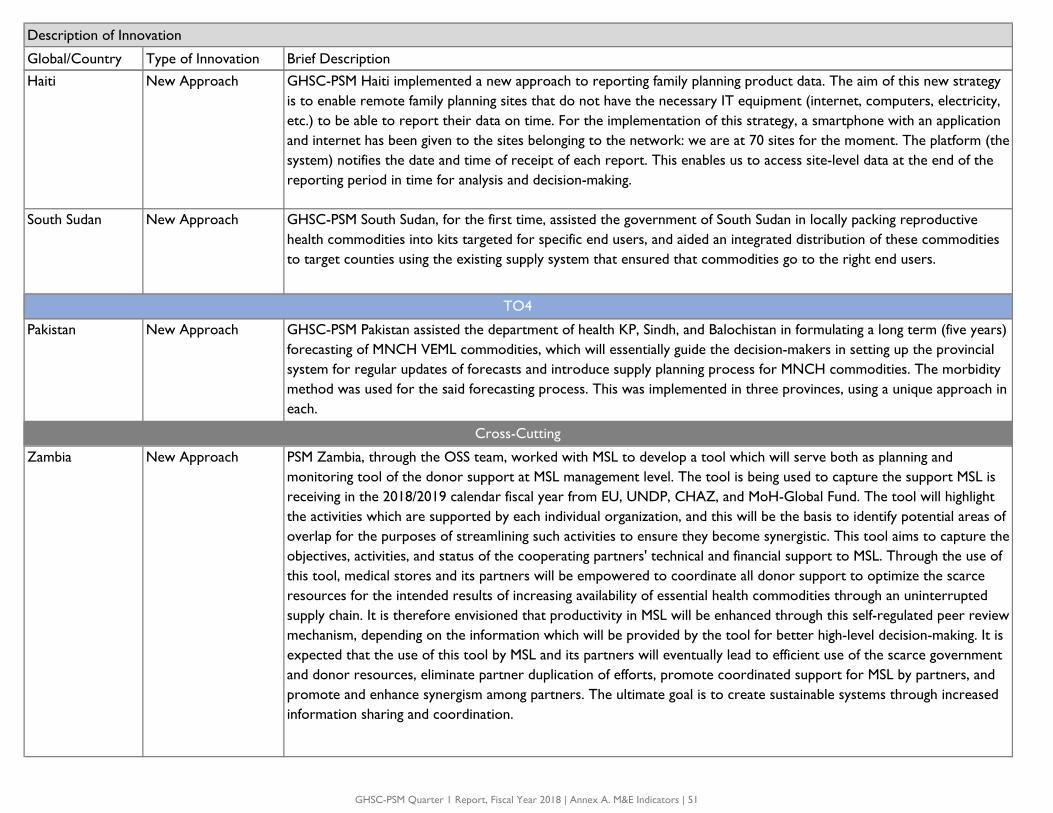
Global/Country Type of Innovation Brief Description
Description of Innovation
Haiti New Approach
South Sudan New Approach
Pakistan New Approach
Zambia New Approach PSM Zambia, through the OSS team, worked with MSL to develop a tool which will serve both as planning and monitoring tool of the donor support at MSL management level. The tool is being used to capture the support MSL is receiving in the 2018/2019 calendar fiscal year from EU, UNDP, CHAZ, and MoH-Global Fund. The tool will highlight the activities which are supported by each individual organization, and this will be the basis to identify potential areas of overlap for the purposes of streamlining such activities to ensure they become synergistic. This tool aims to capture the objectives, activities, and status of the cooperating partners' technical and financial support to MSL. Through the use of this tool, medical stores and its partners will be empowered to coordinate all donor support to optimize the scarce resources for the intended results of increasing availability of essential health commodities through an uninterrupted supply chain. It is therefore envisioned that productivity in MSL will be enhanced through this self-regulated peer review mechanism, depending on the information which will be provided by the tool for better high-level decision-making. It is expected that the use of this tool by MSL and its partners will eventually lead to efficient use of the scarce government and donor resources, eliminate partner duplication of efforts, promote coordinated support for MSL by partners, and promote and enhance synergism among partners. The ultimate goal is to create sustainable systems through increased information sharing and coordination.
GHSC-PSM South Sudan, for the first time, assisted the government of South Sudan in locally packing reproductive health commodities into kits targeted for specific end users, and aided an integrated distribution of these commodities to target counties using the existing supply system that ensured that commodities go to the right end users.
TO4
GHSC-PSM Haiti implemented a new approach to reporting family planning product data. The aim of this new strategy is to enable remote family planning sites that do not have the necessary IT equipment (internet, computers, electricity, etc.) to be able to report their data on time. For the implementation of this strategy, a smartphone with an application and internet has been given to the sites belonging to the network: we are at 70 sites for the moment. The platform (the system) notifies the date and time of receipt of each report. This enables us to access site-level data at the end of the reporting period in time for analysis and decision-making.
Cross-Cutting
GHSC-PSM Pakistan assisted the department of health KP, Sindh, and Balochistan in formulating a long term (five years) forecasting of MNCH VEML commodities, which will essentially guide the decision-makers in setting up the provincial system for regular updates of forecasts and introduce supply planning process for MNCH commodities. The morbidity method was used for the said forecasting process. This was implemented in three provinces, using a unique approach in each.
GHSC-PSM Quarter 1 Report, Fiscal Year 2018 | Annex A. M&E Indicators | 51

Global/Country Type of Innovation Brief Description
Description of Innovation
Rwanda New Approach
Mozambique New Technology
Ghana New Approach GHSC-PSM Ghana has leveraged the Global Fund to support various supply chain interventions in Ghana, including initially the design, acquisition, implementation, and rollout of a nationwide LMIS. This contract has now been extended to include support for last-mile distribution in four non-USAID supported regions, and data management. This approach eliminates duplication of efforts and ensures cross-efficiencies in resource utilization.
GHSC-PSM Mozambique helped develop a temperature and humidity monitoring survey for the warehousing and transport of medical commodities:1. Temperature monitoring activities will take place for at least two months and will give a better understanding of temperature excursions affecting medicines from production sites down to beneficiaries. 2. During phase 1 of the pilot, the regional warehouses of Zimpeto, Matola, and Nampula were equipped with temperature and humidity devices. The data are available on a website (https://www.saclient.com). 3. Three 3PL transporters subcontracted by GHSC-PSM for transportation service between regional warehouses and provincial warehouse were equipped with devices. The 40-foot containers have five sensors (one outside, three inside on walls in the front, middle and back of containers, and two sensors within boxes).
This quarter GHSC-PSM Rwanda introduced a more efficient, integrated approach to streamline quantification across multiple public health programs (HIV/AIDS, Malaria, MCCH, TB and Essential medicine). Prior to implementing the new integrated approach, health programs were conducting their own quantification exercises at various time periods, resulting in inefficiencies in planning and funding mobilization. Now GHSC-PSM Rwanda is supporting the implementation of harmonized quantification processes which look at health commodities that are cross-cutting among different health programs, instead of siloed quantification exercises.
GHSC-PSM Quarter 1 Report, Fiscal Year 2018 | Annex A. M&E Indicators | 52

Task Order
FY2018 Q2Year to
Date
TO1 505 1,867
TO2 2,146 2,183
TO3 1,936 2,035
TO4 0 225
Cross-TO 3,015 4,894
All TOs 7,602 11,204
CentralSubnational
Level 1 Subnational
Level 2SDP Central
Subnational Level 1
Subnational Level 2
SDP
Forecasting and Supply Planning 45 Forecasting and Supply Planning
Procurement Procurement
Quality Assurance Quality Assurance
Warehousing and Inventory Management
26 17 104Warehousing and Inventory Management
Transportation and Distribution Transportation and Distribution
MIS 267 MIS
Governance and Financing Governance and Financing
Human Resources and Capacity Development
21Human Resources and Capacity Development
Monitoring and Evaluation Monitoring and Evaluation
Strategy and Planning 25 Strategy and Planning
Forecasting and Supply Planning 16 Forecasting and Supply Planning 56
Procurement Procurement
Quality Assurance Quality Assurance 27 77
Warehousing and Inventory Management
1887Warehousing and Inventory Management
48 524 29 707
Transportation and Distribution Transportation and Distribution 512
MIS 228 MIS 50 23 59 182
Governance and Financing Governance and Financing 167 346
Human Resources and Capacity Development
12 3Human Resources and Capacity Development
36 43 125
Monitoring and Evaluation Monitoring and Evaluation 4
Strategy and Planning Strategy and Planning
Forecasting and Supply Planning 10
Procurement
Quality Assurance
Warehousing and Inventory Management
1880
Transportation and Distribution
MIS 23
Governance and Financing
Human Resources and Capacity Development
23
Monitoring and Evaluation ▶
Strategy and Planning
C2. Number of people trained C2. Number of People Trained
C2. Number of people trained by supply chain functional area
Measure DefinitionAchievement
Number of people trained. “People trained” refers to any type of participant, student, or learner in a training event, regardless of its duration. People trained may refer to different categories of participants (e.g., physicians, nurses, social workers).Purpose: This indicator measures supply chain training activity. It provides insight into whether the project is making progress toward its capacity-building objectives and can help track progress from one year to the next.
Indicator Performance
HIV
Task Order 1
MC
H
Task Order 4
Mal
aria
Task Order 2
Cro
ss-T
Os
Cross-TO
Target not required for this indicator.
PRH
Task Order 3
Data Notes
▶ The number of participants in trainings that were TO-specific are presented in the TO boxes, while trainings that covered multiple TOs are presented as such.
▶ To demonstrate the number of people trained by funding source, participants in trainings that covered multiple TOs were divided according to the TO funding split in each country. Those participants were added to the TO-specific participants to determine the number of people trained by funding source. These data are presented on the following page.
GHSC-PSM Quarter 1 Report, Fiscal Year 2018 | Annex A. M&E Indicators | 53
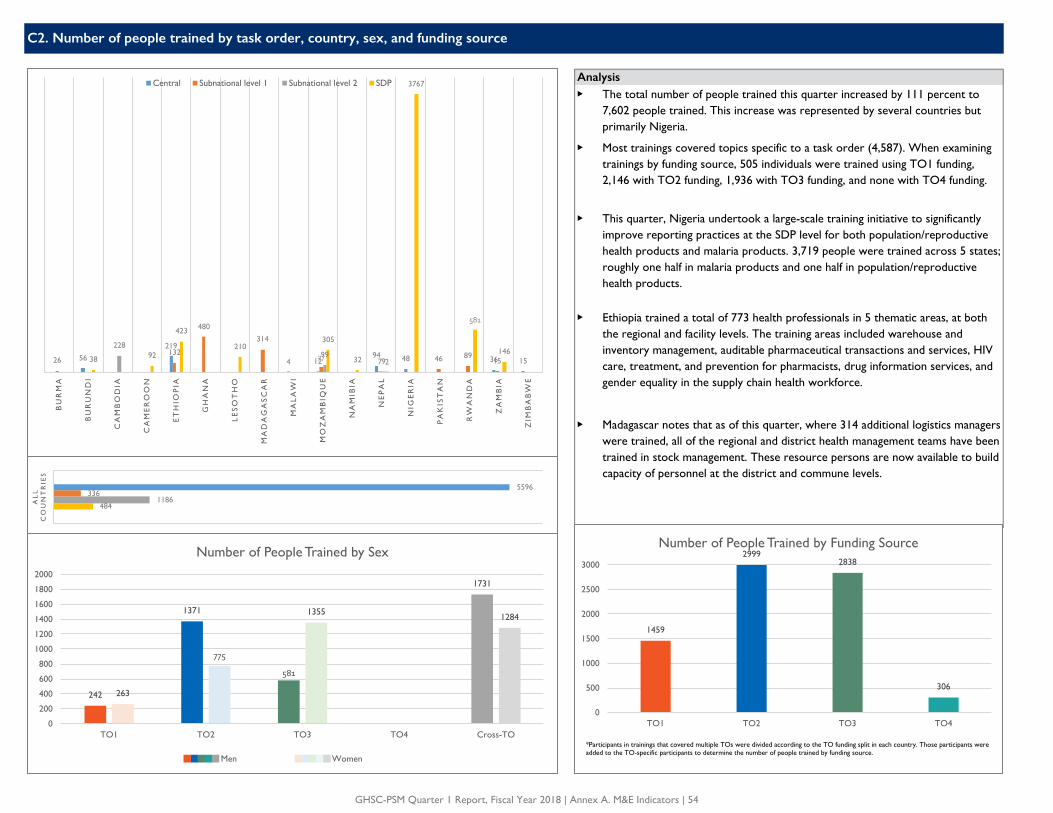
C2. Number of people trained by task order, country, sex, and funding source
Analysis▶ The total number of people trained this quarter increased by 111 percent to
7,602 people trained. This increase was represented by several countries but primarily Nigeria.
▶ Most trainings covered topics specific to a task order (4,587). When examining trainings by funding source, 505 individuals were trained using TO1 funding, 2,146 with TO2 funding, 1,936 with TO3 funding, and none with TO4 funding.
▶ This quarter, Nigeria undertook a large-scale training initiative to significantly improve reporting practices at the SDP level for both population/reproductive health products and malaria products. 3,719 people were trained across 5 states; roughly one half in malaria products and one half in population/reproductive health products.
▶ Ethiopia trained a total of 773 health professionals in 5 thematic areas, at both the regional and facility levels. The training areas included warehouse and inventory management, auditable pharmaceutical transactions and services, HIV care, treatment, and prevention for pharmacists, drug information services, and gender equality in the supply chain health workforce.
▶ Madagascar notes that as of this quarter, where 314 additional logistics managers were trained, all of the regional and district health management teams have been trained in stock management. These resource persons are now available to build capacity of personnel at the district and commune levels.
56219
4 1294 48 36 1526
132
480
314
77 7 46 8915
22899
938 92
423
210305
32 2
3767
581
146
BU
RM
A
BU
RU
ND
I
CA
MB
OD
IA
CA
ME
RO
ON
ET
HIO
PIA
GH
AN
A
LE
SO
TH
O
MA
DA
GA
SC
AR
MA
LA
WI
MO
ZA
MB
IQU
E
NA
MIB
IA
NE
PA
L
NIG
ER
IA
PA
KIS
TA
N
RW
AN
DA
ZA
MB
IA
ZIM
BA
BW
E
Central Subnational level 1 Subnational level 2 SDP
4841186
3365596
AL
L
CO
UN
TR
IES
242
1371
581
1731
263
775
1355 1284
0
200
400
600
800
1000
1200
1400
1600
1800
2000
TO1 TO2 TO3 TO4 Cross-TO
Number of People Trained by Sex
Men Women
1459
29992838
306
0
500
1000
1500
2000
2500
3000
TO1 TO2 TO3 TO4
Number of People Trained by Funding Source
*Participants in trainings that covered multiple TOs were divided according to the TO funding split in each country. Those participants were added to the TO-specific participants to determine the number of people trained by funding source.
GHSC-PSM Quarter 1 Report, Fiscal Year 2018 | Annex A. M&E Indicators | 54

FY18Target
FY2018 Q2 Year to Date
All Task Orders
TBD 88% 82%
▶
▶
▶▶
▶▶
▶
Analysis
GHSC-PSM increased its data submission rate to BI&A this quarter. This includes new daily file submissions in the Price Quote, Purchase Order, and Sales Order content types. The QA team also began submitting data on TO2 out-of-specification findings for the first time.GHSC-PSM continues to work with GHSC-BI&A on defining submission formats and data element mapping for two content types: forecast and supply planning (FASP) and monitoring and evaluation (M&E). These files have been excluded from the indicator result while this work is ongoing. In the meantime, data in these areas are shared with USAID via other platforms. FASP files are submitted to BI&A on a quarterly basis and are accessible to USAID, which requirements are still being defined. M&E data are shared in quarterly performance reports, such as this one.
Data Notes
The USAID Global Health Supply Chain Program-Business Intelligence and Analytics (GHSC-BI&A) mechanism is a data warehouse and analysis platform that integrates data across USAID's family of GHSC projects.
Data requirements, including file types, data elements, submission formats, and frequency, are governed by the BI&A Information Specification for Implementing Partners (the "Infospec"). Exceptions may be specified by USAID.
Four out of eight trade Item files named in the Infospec have been excluded from the indicator as "not applicable" to GHSC-PSM's current business processes.
C4. Percentage of required files submitted to BI&A in the reporting period
Measure DefinitionAchievement
Numerator: Number of required files submitted to BI&A during the quarter.Denominator: Total number of files required for submission to BI&A during the quarter.Purpose: This indicator measures the completeness of GHSC-PSM’s data submissions GHSC-BI&A. Required files and data elements fall into a wide range of categories, from purchase orders and fulfillment requests to forecasting and supply planning.
Indicator Performance
75%
100% 100%
89% 89%93%
40%
100% 100% 100%
0%
100% 100%
0%
10%
20%
30%
40%
50%
60%
70%
80%
90%
100%
Perc
ent
of r
equi
red
files
sub
mit
ted
GHSC-PSM Quarter 1 Report, Fiscal Year 2018 | Annex A. M&E Indicators | 55
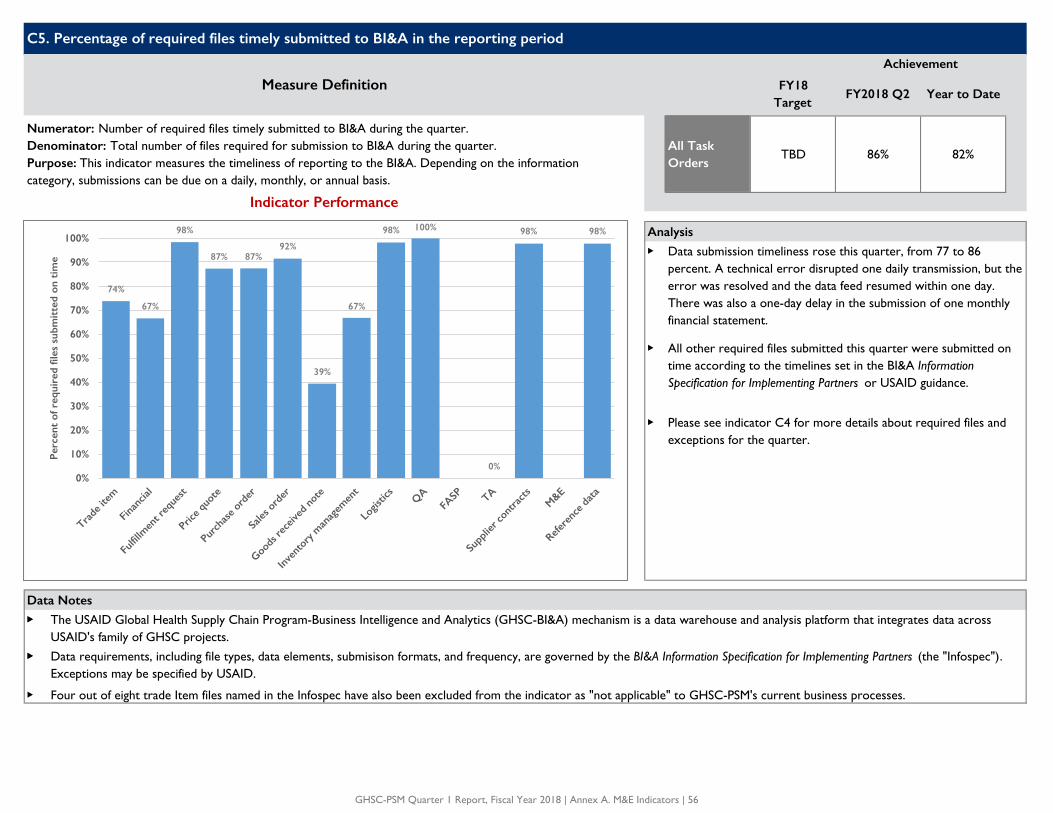
FY18Target
FY2018 Q2 Year to Date
All Task Orders
TBD 86% 82%
▶
▶
▶
▶▶
▶▶
▶
Analysis
Data submission timeliness rose this quarter, from 77 to 86 percent. A technical error disrupted one daily transmission, but the error was resolved and the data feed resumed within one day. There was also a one-day delay in the submission of one monthly financial statement.
All other required files submitted this quarter were submitted on time according to the timelines set in the BI&A Information Specification for Implementing Partners or USAID guidance.
Please see indicator C4 for more details about required files and exceptions for the quarter.
Four out of eight trade Item files named in the Infospec have also been excluded from the indicator as "not applicable" to GHSC-PSM's current business processes.
Data Notes
The USAID Global Health Supply Chain Program-Business Intelligence and Analytics (GHSC-BI&A) mechanism is a data warehouse and analysis platform that integrates data across USAID's family of GHSC projects.
Data requirements, including file types, data elements, submisison formats, and frequency, are governed by the BI&A Information Specification for Implementing Partners (the "Infospec"). Exceptions may be specified by USAID.
C5. Percentage of required files timely submitted to BI&A in the reporting period
Measure DefinitionAchievement
Numerator: Number of required files timely submitted to BI&A during the quarter.Denominator: Total number of files required for submission to BI&A during the quarter.Purpose: This indicator measures the timeliness of reporting to the BI&A. Depending on the information category, submissions can be due on a daily, monthly, or annual basis.
Indicator Performance
74%
67%
98%
87% 87%92%
39%
67%
98% 100%
0%
98% 98%
0%
10%
20%
30%
40%
50%
60%
70%
80%
90%
100%
Perc
ent
of r
equi
red
files
sub
mit
ted
on t
ime
GHSC-PSM Quarter 1 Report, Fiscal Year 2018 | Annex A. M&E Indicators | 56

TO1 - HIV/AIDS RDC Global Storage Adult ARV, Pediatric ARV,
Other Pharma 7,046 13,196,674 0.05%
TO1 - HIV/AIDS Haiti Central Storage Adult ARV 943,580 14,835,008 6.4%
TO1 - HIV/AIDS Nigeria Central Storage Lab products, ARVs 709,382 20,288,616 3.5%TO1 - HIV/AIDS Vietnam Central Storage ARVs 1,235 3,997,369 0.03%
Measure Definition
C7a. Percentage of product lost due to expiry while under GHSC-PSM control (product loss percentage)
Numerator: Total value of product lost due to expiry during the quarter.Denominator: Average inventory balance (in USD) during the quarter.Purpose: This indicator tracks products lost due to expiry while in a warehouse controlled by GHSC-PSM, including global regional distribution centers and in-country medical stores. It is key for monitoring good warehouse and distribution practices, such as “first expired first out” (FEFO).
Indicator Performance
Data Notes
Tracer CategoryCountryTask OrderSupply Chain
Level
▶▶ Losses are reported during the quarter that the loss value was determined, which may be later than the period when the loss occurred. ▶▶ Target not required for this indicator.
Site of LossTotal Value of Loss
(USD)Loss Denominator
(USD)Loss Percentage
Analysis▶▶ Expiries at the RDC were mainly ARVs transferred from the previous project for which there was little demand. Overall shelf life remaining for products at the RDCs remains in line with targets (see indicator A8).▶▶ Haiti reported expiry of a large quantity of ARV stocks inherited from the previous project, which PEPFAR sites could not consume. Haiti continues its strategy of analyzing product close to expiry and identifying health sites that can accept the donated products.▶▶ Nigeria reported expiries of CD4 reagents, viral load reagents, and ARVs. The team will review supply plans and consumption patterns of CD4 reagents to avoid further expiries. ▶▶ Vietnam reported minimal expiries of ARVs at the central warehouse.
GHSC-PSM Quarter 1 Report, Fiscal Year 2018 | Annex A. M&E Indicators | 57

TO1 - HIV/AIDS Tanzania Global Transit Other (Missing product) Laboratory 16,208 1,278,357 1.3%
TO1 - HIV/AIDS Rwanda Global Transit Damage ARVs 1,169 5,724,721 0.02%
TO1 - HIV/AIDS Nigeria Global Transit Damage ARVs 6,320 35,600,509 0.02%
TO1 - HIV/AIDS Ethiopia Global Transit Damage Laboratory 65,184 17,664,385 0.4%
TO2 - Malaria Zambia Global Transit Damage ACTs 3,124 1,889,628 0.2%
TO2 - Malaria Rwanda Global Transit Damage ACTs, mRDTs, and
Severe Malaria Medicines 2,325 2,034,934 0.1%
Loss Denominator (USD) Loss Percentage
Analysis▶▶ Loss incidents are generally small damages and losses in the course of delivery to the countries.
Data Notes▶▶ Losses are reported during the quarter that the loss value was determined, which may be later than the period when the loss occurred. ▶▶ Target not required for this indicator.
C7b. Percentage of product lost due to theft, damage, or other causes while under GHSC-PSM control (product loss percentage)
Measure Definition
Task Order Country Supply Chain Level Site of Loss Type of Loss Total Value of Loss (USD)
Indicator Performance
Numerator: Total value of product lost due to theft, damage, and other causes during the quarter.Denominator for losses in storage: Average inventory balance (in USD) during the quarter.Denominator for losses in transit: Total value (in USD) of product delivered during the quarter.Purpose: This indicator tracks products lost in a warehouse controlled by GHSC-PSM, in transit to such a facility, or in transit to the customer, within a specified time. Damage can occur due to human error such as lack of adherence to cold chain requirements, or unavoidable causes such as natural disasters.
Tracer Category
GHSC-PSM Quarter 1 Report, Fiscal Year 2018 | Annex A. M&E Indicators | 58

Task Order
AnnualTarget
FY2018 Q1-Q2
Year to Date
TO1 N/A 4 4
TO2 N/A 3 3
TO3 N/A 10 10
TO4 N/A 0 0
Cross-cutting N/A 5 5
All TOs N/A 22 22
Brief Description
Description of Advocacy Engagement
C8. Number of global advocacy engagements in support of improved availability of essential health commodities
Measure DefinitionAchievement
Number of global advocacy engagements. This measures the number of engagements of any kind at the global level that involve improved availability of essential health commodities.
Name of Engagement
Task Order 1 - HIV
The CQUIN Learning Network: Partnering to Advance Differentiated Service Delivery (Maputo, Mozambique, February 12-15, 2018)
The Director of Forecasting, Supply, & Distribution Planning for GHSC-PSM in Mozambique, presented on the Differentiated Service Delivery challenges and supply chain solutions.
Medicines for All Steering Committee The Market Dynamics Manager participates in the steering committee for M4All, providing key market insights for ARVs to help the chemistry lab at VCU develop their approach and advocate for the critical products to work on. She also spoke at their conference in Nov 2017 (see quarterly report narrative), advocating for improved chemistry manufacturing to support market health.
ICASA December 2017 The Market Dynamics Manager (see quarterly report) advocated the rational use of pediatric ARVs during a period of market turmoil driven by unexpected demand for improved formulations. Clement Ndongmo advocated for countries to adopt and apply the concept of rational lab networks and the use of the reagent rental model for viral load testing.
USAID Global Health Supply Chain Summit
CHAI LLIN Data Sharing GHSC-PSM shared LLIN procurement data with CHAI (at the request of PMI), supporting BMGF in a LLIN market analysis to help inform their market strategy for PBO and next generation nets.
GHSC-PSM's GS1 Global Standards Team Lead co-presented with MIS advisors from USAID and GHSC-BI&A on USAID's vision and strategy for global standards implementation.
Task Order 2 - Malaria
RDT Global Task Force Meeting GHSC-PSM supported PMI by providing analysis, presentation materials, and talking points to support discussions around RDT supply chain challenges, market health risks, and sourcing strategies. GHSC-PSM collaborated with CHAI to produce the analysis and presentation materials.
Global Fund Artemisinin Meeting GHSC-PSM supported PMI by providing data, presentation materials, and talking points to support discussions about the global artemisinin market and global collaboration around procurement strategies.
GHSC-PSM Quarter 1 Report, Fiscal Year 2018 | Annex A. M&E Indicators | 59
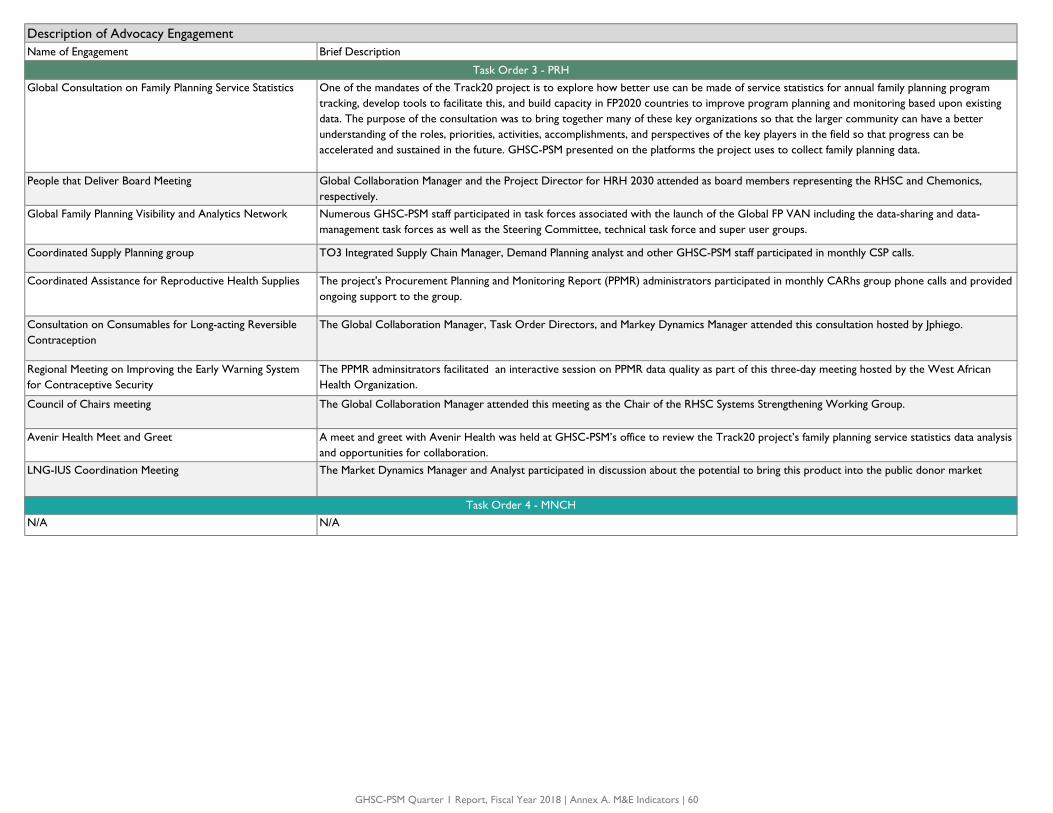
Brief Description
People that Deliver Board Meeting
Global Family Planning Visibility and Analytics Network
Coordinated Assistance for Reproductive Health Supplies
Consultation on Consumables for Long-acting Reversible Contraception
Global Collaboration Manager and the Project Director for HRH 2030 attended as board members representing the RHSC and Chemonics, respectively.
Coordinated Supply Planning group TO3 Integrated Supply Chain Manager, Demand Planning analyst and other GHSC-PSM staff participated in monthly CSP calls.
Numerous GHSC-PSM staff participated in task forces associated with the launch of the Global FP VAN including the data-sharing and data-management task forces as well as the Steering Committee, technical task force and super user groups.
The project's Procurement Planning and Monitoring Report (PPMR) administrators participated in monthly CARhs group phone calls and provided ongoing support to the group.
The Global Collaboration Manager, Task Order Directors, and Markey Dynamics Manager attended this consultation hosted by Jphiego.
Description of Advocacy EngagementName of Engagement
Task Order 3 - PRH
Global Consultation on Family Planning Service Statistics One of the mandates of the Track20 project is to explore how better use can be made of service statistics for annual family planning program tracking, develop tools to facilitate this, and build capacity in FP2020 countries to improve program planning and monitoring based upon existing data. The purpose of the consultation was to bring together many of these key organizations so that the larger community can have a better understanding of the roles, priorities, activities, accomplishments, and perspectives of the key players in the field so that progress can be accelerated and sustained in the future. GHSC-PSM presented on the platforms the project uses to collect family planning data.
Task Order 4 - MNCH
N/A N/A
Regional Meeting on Improving the Early Warning System for Contraceptive Security
The PPMR adminsitrators facilitated an interactive session on PPMR data quality as part of this three-day meeting hosted by the West African Health Organization.
Council of Chairs meeting The Global Collaboration Manager attended this meeting as the Chair of the RHSC Systems Strengthening Working Group.
LNG-IUS Coordination Meeting The Market Dynamics Manager and Analyst participated in discussion about the potential to bring this product into the public donor market
Avenir Health Meet and Greet A meet and greet with Avenir Health was held at GHSC-PSM’s office to review the Track20 project’s family planning service statistics data analysis and opportunities for collaboration.
GHSC-PSM Quarter 1 Report, Fiscal Year 2018 | Annex A. M&E Indicators | 60
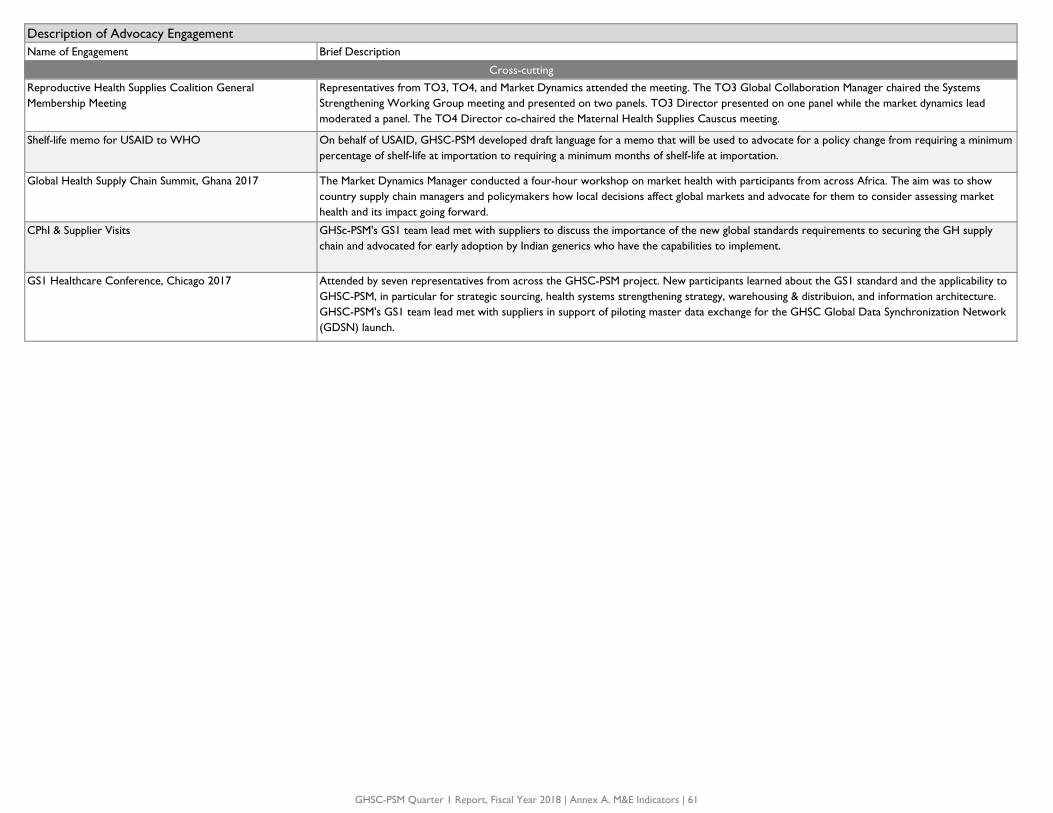
Brief Description
Shelf-life memo for USAID to WHO On behalf of USAID, GHSC-PSM developed draft language for a memo that will be used to advocate for a policy change from requiring a minimum percentage of shelf-life at importation to requiring a minimum months of shelf-life at importation.
Description of Advocacy EngagementName of Engagement
Cross-cutting
Reproductive Health Supplies Coalition General Membership Meeting
Representatives from TO3, TO4, and Market Dynamics attended the meeting. The TO3 Global Collaboration Manager chaired the Systems Strengthening Working Group meeting and presented on two panels. TO3 Director presented on one panel while the market dynamics lead moderated a panel. The TO4 Director co-chaired the Maternal Health Supplies Causcus meeting.
Global Health Supply Chain Summit, Ghana 2017 The Market Dynamics Manager conducted a four-hour workshop on market health with participants from across Africa. The aim was to show country supply chain managers and policymakers how local decisions affect global markets and advocate for them to consider assessing market health and its impact going forward.
CPhI & Supplier Visits GHSc-PSM's GS1 team lead met with suppliers to discuss the importance of the new global standards requirements to securing the GH supply chain and advocated for early adoption by Indian generics who have the capabilities to implement.
GS1 Healthcare Conference, Chicago 2017 Attended by seven representatives from across the GHSC-PSM project. New participants learned about the GS1 standard and the applicability to GHSC-PSM, in particular for strategic sourcing, health systems strengthening strategy, warehousing & distribuion, and information architecture. GHSC-PSM's GS1 team lead met with suppliers in support of piloting master data exchange for the GHSC Global Data Synchronization Network (GDSN) launch.
GHSC-PSM Quarter 1 Report, Fiscal Year 2018 | Annex A. M&E Indicators | 61
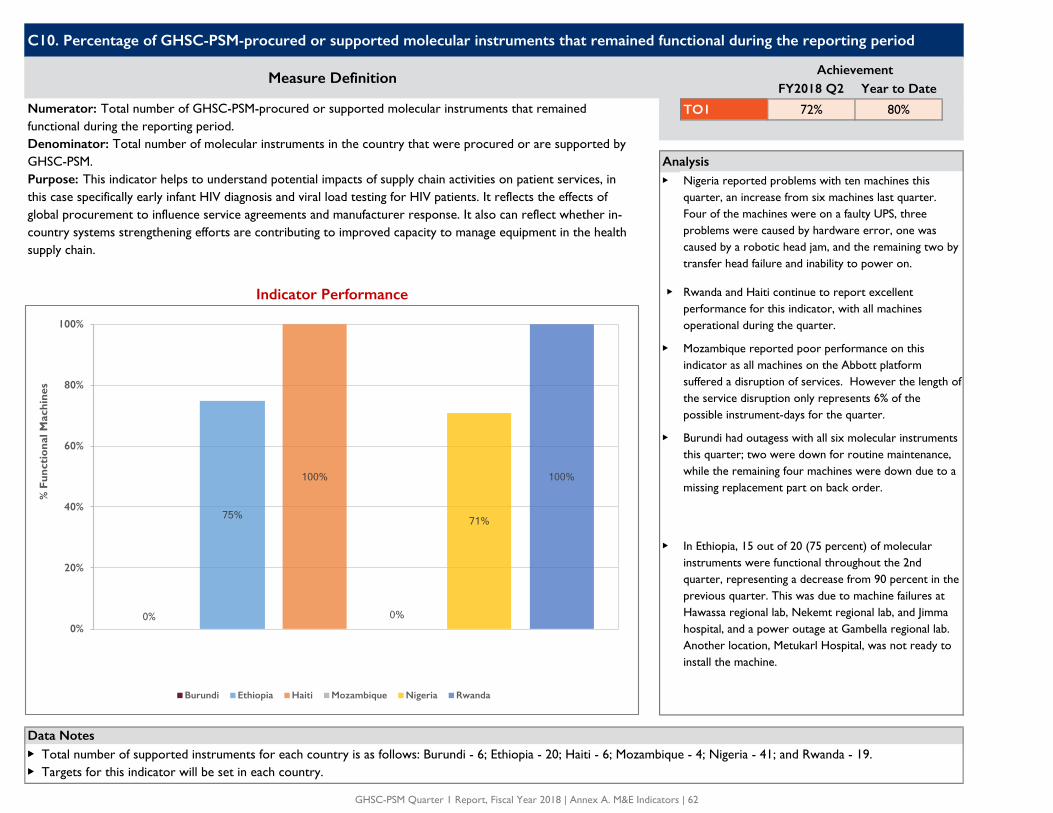
FY2018 Q2 Year to Date
TO1 72% 80%
▶
▶
▶
▶
▶
Mozambique reported poor performance on this indicator as all machines on the Abbott platform suffered a disruption of services. However the length of the service disruption only represents 6% of the possible instrument-days for the quarter.
▶▶ Total number of supported instruments for each country is as follows: Burundi - 6; Ethiopia - 20; Haiti - 6; Mozambique - 4; Nigeria - 41; and Rwanda - 19.▶▶ Targets for this indicator will be set in each country.
C10. Percentage of GHSC-PSM-procured or supported molecular instruments that remained functional during the reporting period
Measure Definition Achievement
Analysis
Data Notes
Indicator Performance
Numerator: Total number of GHSC-PSM-procured or supported molecular instruments that remained functional during the reporting period.Denominator: Total number of molecular instruments in the country that were procured or are supported by GHSC-PSM.Purpose: This indicator helps to understand potential impacts of supply chain activities on patient services, in this case specifically early infant HIV diagnosis and viral load testing for HIV patients. It reflects the effects of global procurement to influence service agreements and manufacturer response. It also can reflect whether in-country systems strengthening efforts are contributing to improved capacity to manage equipment in the health supply chain.
In Ethiopia, 15 out of 20 (75 percent) of molecular instruments were functional throughout the 2nd quarter, representing a decrease from 90 percent in the previous quarter. This was due to machine failures at Hawassa regional lab, Nekemt regional lab, and Jimma hospital, and a power outage at Gambella regional lab. Another location, Metukarl Hospital, was not ready to install the machine.
Nigeria reported problems with ten machines this quarter, an increase from six machines last quarter. Four of the machines were on a faulty UPS, three problems were caused by hardware error, one was caused by a robotic head jam, and the remaining two by transfer head failure and inability to power on.
Burundi had outagess with all six molecular instruments this quarter; two were down for routine maintenance, while the remaining four machines were down due to a missing replacement part on back order.
Rwanda and Haiti continue to report excellent performance for this indicator, with all machines operational during the quarter.
0%
75%
100%
0%
71%
100%
0%
20%
40%
60%
80%
100%
% F
unct
iona
l Mac
hine
s
Burundi Ethiopia Haiti Mozambique Nigeria Rwanda
GHSC-PSM Quarter 1 Report, Fiscal Year 2018 | Annex A. M&E Indicators | 62
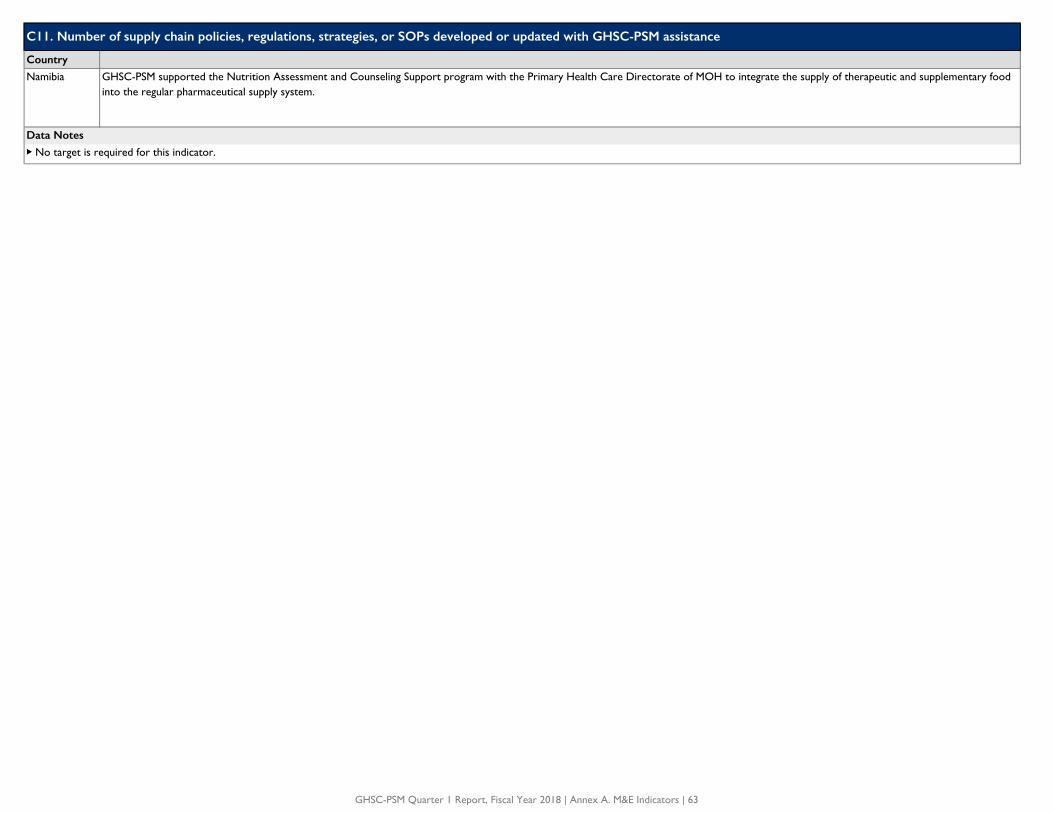
Country
Namibia
Data Notes
▶▶ No target is required for this indicator.
C11. Number of supply chain policies, regulations, strategies, or SOPs developed or updated with GHSC-PSM assistance
GHSC-PSM supported the Nutrition Assessment and Counseling Support program with the Primary Health Care Directorate of MOH to integrate the supply of therapeutic and supplementary food into the regular pharmaceutical supply system.
GHSC-PSM Quarter 1 Report, Fiscal Year 2018 | Annex A. M&E Indicators | 63

Cou
ntri
es
Ang
ola
Bots
wan
a
Burk
ina
Faso
Burm
a
Buru
ndi
Non
-GH
SC-P
SM-s
uppo
rted
Cam
eroo
n
Ethi
opia
Gha
na
Gui
nea
Hai
ti
Indo
nesi
a
Leso
tho
Mad
agas
car
Mad
agas
car
Non
-GH
SC-P
SM-s
uppo
rted
Mal
awi
Moz
ambi
que
Nam
ibia
Nam
ibia
Non
-GH
SC-P
SM-s
uppo
rted
Nig
eria
Rw
anda
Uga
nda
Zam
bia
Zim
babw
e
First-line Adult ARVs 8 32 3 688 71 1074 34 136 5 145 572 1306 15 42 2415 562 219 456 1131
Second-line Adult ARVs 8 32 3 108 23 156 33 136 2 137 442 15 42 522 562 404 1114
First-line Pediatric ARVs 5 32 1 324 43 818 136 1 129 561 1087 15 42 875 562 195 341 1090
First RTKs 9 23 806 80 292 40 136 135 595 165 15 42 2971 562 221 1905 1350
Second RTKs 9 23 695 78 213 31 136 128 586 139 15 42 2411 562 211 1872 1350
Tie-breaker RTKs 101 118 15 42 983 202 1350
Male Condoms 9 29 757 686 37 195 76 580 105 3 17 1420 590 1713 1390
Female Condoms 9 491 70 347 33 3 17 951 590 513 1365
Ready-to-use Therapeutic Food (RUTF) 511 125 144
EID Reagents 6 19 1 5 22 6 1 11 3
EID Consumables 19 321 22 6
Viral Load Reagents 13 1 19 3 19 23 9 1 12 8
Viral Load Consumables 1 23 9
First-line ACTs (AL 6X1) 7 1943 610 503 622 164 2041 585 1737 1322
First-line ACTs (AL 6X2) 6 1943 620 503 617 156 2258 585 1731 1306
First-line ACTs (AL 6X3) 8 492 503 613 156 2004 585 1729 1309
First-line ACTs (AL 6X4) 9 753 37 503 619 162 2242 585 1739 1326
AL Inability to Treat 5 1943 825 503 2307 585 76 2034 1326
First-line ACTs (AS/AQ 25/67.5 mg) 723 36 861 774 1383
First-line ACTs (AS/AQ 50/135 mg) 733 35 773 647 1211
First-line ACTs (AS/AQ 100/270 mg x 3) 1943 732 726 651 1390
First-line ACTs (AS/AQ 100/270 mg x 6) 1943 737 797 668 1412
Rapid Diagnostic Tests for Malaria 10 1943 816 275 38 503 657 714 621 164 2265 585 84 1820 1173
Sulphadoxine-pyrimethamine (SP) 1 1943 709 38 503 530 416 586 134 1281 88 1654 661
LLINs 1943 744 503 452 375 422 1462
*Out of cycle
D. Denominator Annex
B1. Stockout Rate at SDPs
Tracer Products
Note: Gray-shaded cells represent one or both of the following situations: a) the task order is not funded in the country; or b) the indicator has been exempted from the country's monitoring and evaluation plan. Task orders left blank but with no shading represent non-reporting for other reasons, for example a temporary lack of data for the health element(s) or indicator.
GHSC-PSM Quarter 1 Report, Fiscal Year 2018 | Annex A. M&E Indicators | 64
Cou
ntri
es
Buru
ndi
Non
-GH
SC-P
SM-s
uppo
rted
Ethi
opia
Gha
na
Gui
nea
Hai
ti
Mad
agas
car
Mad
agas
car
Non
-GH
SC-P
SM-s
uppo
rted
Mal
awi
Moz
ambi
que
Nig
eria
Paki
stan
Rw
anda
Uga
nda
Zam
bia
Nep
al*
Non
-GH
SC-P
SM-s
uppo
rted
Injectable Contraceptives 736 1047 37 453 195 684 671 557 145 1551 10739 590 179 3097
Depot Medroxyprogesterone Acetate 104 mg/0.65 mL, Subcutaneous 1047 28
Depot Medroxyprogesterone Acetate 150 mg Vial, Intramuscular 736 37 453 195 684 671 557 145 1528 10739 590 179 1664 3097
Norethisterone Enanthate 1488 603
Implantable Contraceptives 701 1017 37 453 195 337 404 43 570 590
Etonogestrel 68 mg/Rod, 1 Rod Implant 936 337 404 505 542 590 233
Levonorgestrel 75mg/Rod, 2 Rod Implant 701 725 37 453 195 456 43 415 590 823
Combined Oral Contraceptives 733 903 38 453 195 634 610 526 51 1419 10743 590 1619 3097
Levonorgestrel/Ethinyl Estradiol 150/30 mcg + Fe 75 mg, 28 Tablets/Cycle 733 903 38 453 195 634 610 10743 590 1619 3097
Levonorgestrel/Ethinyl Estradiol 150/30 mcg, 28 Tablets/Cycle 526 51 1419
Emergency Oral Contraceptives 680 802 198 32
Levonorgestrel 0.75 mg, 2 Tablets 680 802 198 32
Levonorgestrel 1.5 mg, 1 Tablet
Progestin-only Pills 683 727 453 331 413 414 44 1310 590 455
Levonorgestrel 30 mcg, 35 Tablets/Cycle 683 727 453 331 413 414 44 1310 590 455
Copper-bearing Intrauterine Devices 625 857 453 195 219 276 134 40 213 9110 590 194
Calendar-based Awareness Methods 195 203 234 590
Male Condoms 757 686 37 453 195 428 390 580 105 1420 10745 590 1713 3097
Female Condoms 491 227 261 347 33 951 590 513
* Out of cycle
D. Denominator Annex
B1. Stockout Rate at SDPs
Tracer Products
Note: Gray-shaded cells represent one or both of the following situations: a) the task order is not funded in the country; or b) the indicator has been exempted from the country's monitoring and evaluation plan. Task orders left blank but with no shading represent non-reporting for other reasons, for example a temporary lack of data for the health element(s) or indicator.
GHSC-PSM Quarter 1 Report, Fiscal Year 2018 | Annex A. M&E Indicators | 65
D. Denominator Annex
Cou
ntri
es
Ang
ola
Bots
wan
a (N
on-G
HSC
-PSM
-su
ppor
ted)
Burk
ina
Faso
Burm
a (N
on-G
HSC
-PSM
-su
ppor
ted)
Buru
ndi
(Non
-GH
SC-P
SM-
supp
orte
d)
Cam
eroo
n
Ethi
opia
Gha
na
Gui
nea
Hai
ti
Indo
nesi
a
Leso
tho
Libe
ria
Mad
agas
car
Mad
agas
car
(N
on-G
HSC
-PS
M-s
uppo
rted
)
Mal
awi
Moz
ambi
que
Nam
ibia
Nam
ibia
(N
on-G
HSC
-PSM
-su
ppor
ted)
Nep
al
Nep
al (
Non
-GH
SC-P
SM-
supp
orte
d)
Nig
eria
Paki
stan
Rw
anda
Sier
ra L
eone
Uga
nda
Vie
tnam
Zam
bia
Zim
babw
e
Cot
e D
'Ivoi
re
Dem
ocra
tic R
epub
lic o
f C
ongo
Ken
ya
Sene
gal
Swaz
iland
Tan
zani
a
Task Order 1 144 30 27 254 60 190 154 12 9 33 12 252 43 10 247 36 6 9 10
Task Order 2 570 7 901 115 220 7 415 14 252 10 155 18 6 6
Task Order 3 459 7 161 176 5 8 424 16 288 19 12 217 27 8
Task Order 4 138 195 12 252 35 155 6
Task Order 1 9 33 3,458 1,121 862 1,494 149 5 148 690 1,400 15 48 3,304 590 291 2,074 1,434
Task Order 2 10 2,224 3,755 1,121 1,467 503 1,117 1,050 690 164 2,414 590 646 2,236 1,434
Task Order 3 963 1,458 453 220 796 750 690 145 4,105 1,940 13,839 590 2,236
Task Order 4 1,448 908 810 690 157 4,105 555 2,236
ARVs 1 1 1 1 1 1 1 1 1 1 1 1 1 1
Lab (HIV diagnostics) 1 1 1 1 1 1 1 1 1 1 1 1 1
RTKs 1 1 1 1 1 1 1 1 1 1 1 1 1 1 1 1
VMMC 1 1 1 1 1
Malaria commodities 1 1 1 1 1 1 1 1 1 1 1 1 1 1
PRH commodities 1 1 1 1 1 1 1 1 1 1 1 1 1 1
MNCH commodities 1 1 1 1 1 1
Condoms 1 1 1 1 1 1 1 1 1 1 1 1 1 1 1
Note: Gray-shaded cells represent one or both of the following situations: a) the task order is not funded in the country; or b) the indicator has been exempted from the country's monitoring and evaluation plan. Task orders left blank but with no shading represent non-reporting for other reasons, for example a temporary lack of data for the health element(s) or indicator. For Indicator B6, shaded cells represent non-Priority 1 expected supply plans by country.
B6. Supply Plan Updates
B6 Only
B2. Stocked According to Plan
B3. LMIS Reporting Rate
GHSC-PSM Quarter 1 Report, Fiscal Year 2018 | Annex A. M&E Indicators | 66
GHSC-PSM Quarter 2 Report, Fiscal Year 2018 | 58
USAID GLOBAL HEALTH SUPPLY CHAIN PROGRAM
Procurement and Supply Management
251 18th Street South, Suite 1200
Arlington, VA 22202
United States
ghsupplychain.org


