0 Fiscal Year Ended March 2015 Fiscal Year Ended March 2015 Briefing on Financial Results Briefing on Financial Results April 30, 2015 April 30, 2015 Ricoh Leasing Company, Ltd. Ricoh Leasing Company, Ltd.
Transcript
0
Fiscal Year Ended March 2015Fiscal Year Ended March 2015
Briefing on Financial Results Briefing on Financial Results
Number of monthly transaction cases of collection agency services(Unit: 10,000)
63
92106
128
0
50
100
150
12/3 13/3 14/3 15/3
54
11/3
(100 millions of yen)
90
198
326
230
100
200
300
400
12/3 13/3 14/3 15/311/3
3
Factoring services for nursing-care benefits - transaction volume
9
Balance of Operating Assets and Changes in Default RateBalance of Operating Assets and Changes in Default RateBalance of Operating Assets and Changes in Default Rate
Default rate = Default loss amount / Average balance of operating assets
Record high
84 93 97
123158
(100 millions of yen)
10
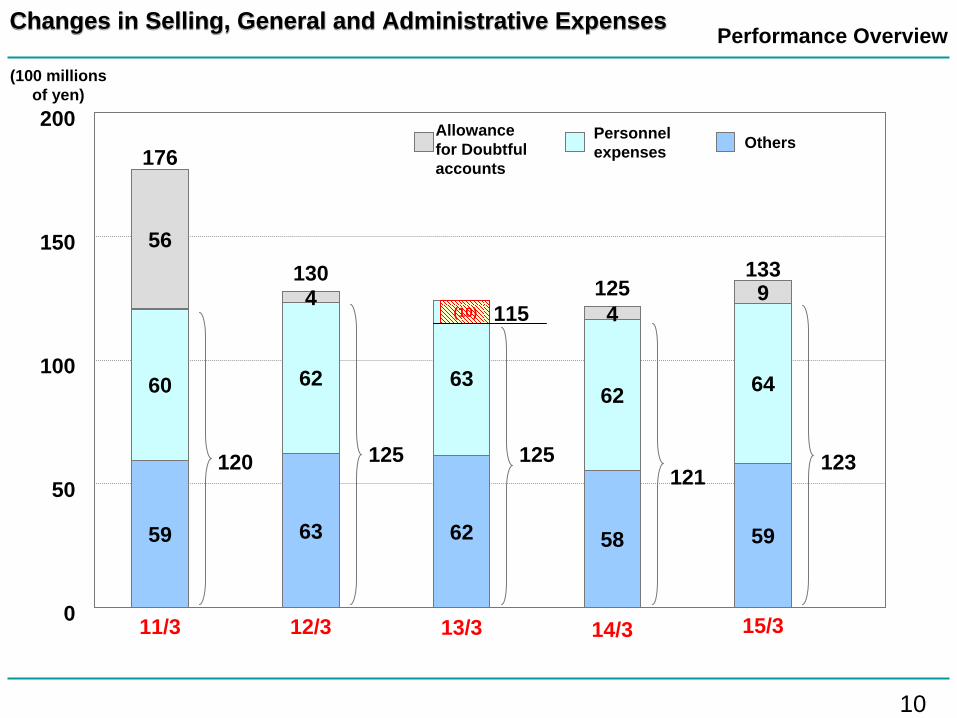
Changes in Selling, General and Administrative ExpensesChanges in Selling, General and Administrative ExpensesChanges in Selling, General and Administrative Expenses
58 5959 63
62 6460 62
49
56
4 125133
176
130
0
50
100
150
200
14/3 15/311/3 12/3
(100 millions of yen)
62
63
Performance Overview
13/3
(10) 115
120 125 125121
123
OthersPersonnel expenses
Allowance for Doubtful accounts
11
Total Procurement Amount and Capital CostTotal Procurement Amount and Capital CostTotal Procurement Amount and Capital Cost
[External ratings]S&P AR&I A+JCR AA-
Fixed charge coverage ratio (%)
Capital cost
Total amount procured
*Total amounts procured: Balances include debts paid through securitization. Capital costs shown are expenses included in the calculation of gross profit.
Performance Overview
Long- term
Short- term
50.6
61.156.957.9
55.6
0
1,000
2,000
3,000
4,000
5,000
6,000
7,000
11/3 12/3 13/3 14/3 15/3
5,988
4,912 5,1035,425
6,337
31
25
192015
(100 millions of yen)
12
2. Financial Forecast(Fiscal Year Ending March 2016)
13
Current Business EnvironmentCurrent Business EnvironmentCurrent Business Environment Financial Forecast
• Fewer occurrence of corporate bankruptcies and lower interest rate because oil prices, yen, and interest rate levels are lower
• Increases in capital investment since manufacturers are returning to Japan
• Replacement of Windows Server 2003; demand driven by My Number System
• Reactionary economic recovery after consumption tax hike
Market
• Spread of trickle-down effects to small- and medium-sized companies due to Abenomics in the future
• New demand in medical and nursing care industries due to revision of laws
(Pharmaceutical and Medical Device Act; Long-Term Care Insurance Act)
Customer
Company
• Decreases in lease renewals due to decreasing transactions for new leases after Lehman collapse
• Solar power generation business has peaked• Number of default-related cancellations changes depending on trends in the
industry (Increases in defaults of nursing agencies, etc.)
14
Consolidated Income ForecastConsolidated Income ForecastConsolidated Income Forecast(100 millions of yen, %)
15/3 16/3Actual Forecast Growth Rate
Net sales 2,587 2,660 2.8Gross profit 298 306 2.6
SGA expenses 133 136 2.2Operating income 165 170 3.0
(Operating income ratio) 6.4 6.4 -
Ordinary income 164 168 2.1Net income 101 108 6.5
(Net income ratio) 3.9 4.1 -Year-on-year change in yen
ROA 1.26% 1.27% 0.02%ROE 7.7% 7.7% 0.0%
Net income per share 324.71 345.97 21.26Dividend per share 50.00 55.00 5.00
Financial Forecast
15
Transaction Volume Forecast by BusinessTransaction Volume Forecast by BusinessTransaction Volume Forecast by Business
(100 millions of yen, %)
15/3 16/3
Actual Forecast Growth Rate
Finance lease 2,621 2,705 3.2
Operating lease 124 125 0.1
Installment sales 485 525 8.2
Leasing/Installment sales business 3,231 3,355 3.8
Financial services business 259 265 2.1
Total transaction volume 3,491 3,620 3.7
Financial Forecast
プレゼンター
プレゼンテーションのノート
16
Transaction Volume Forecast by Product: Leasing/Installment sales business Transaction Volume Forecast by Product: Leasing/Installment saleTransaction Volume Forecast by Product: Leasing/Installment sales s businessbusiness
(100 millions of yen, %)
15/3 16/3
Actual Forecast Growth Rate
Office and IT-related equipment 1,855 1,910 2.9
Medical equipment 398 420 5.3
Industrial machinery 285 320 12.2Commercial and service
industry equipment 300 305 1.5Vehicles and transportation
To be the industry’s No. 1 in office and IT-related equipment, medical equipment, and nursing care businesses•Strengthen collaboration with Ricoh Japan
Expand Ricoh Channel and SIer•Provide omni-directional service
Propose differentiation (new scheme) Solution marketingEstablish third pillar• Business expansion (solar power generation, construction machinery, and industrial machinery (key positions))
•Discover and acquire post-solar power or other new businesses
Continue to implement cross-company business process reforms• Establish structural reform promotion office• Improve transparency, standardization and efficiency of internal processes
Create challenging corporate culture• Implementation of new personnel system “Be kind to people but strict in terms of work.”
• Assessment of challenges, young employees, pay raises (promotion), pay cuts (demotion), and specialists
• Diversity and work-life balance
19
Final SummaryFinal SummaryFinal Summary Financial Forecast
ChallengeSpeed
Communication
Business Process
Human Resources
Based on Consciousness Reform (CSC)Based on Consciousness Reform (CSC)
Three ReformsThree Reforms
20
<Reference> Breakdown of Sales for Fiscal Year Ended March 2015<Reference> Breakdown of Sales for Fiscal Year Ended March 2015<Reference> Breakdown of Sales for Fiscal Year Ended March 2015
(100 millions of yen, %)
14/3 15/3
Actual Forecast Actual Difference Ratio Growth Rate
<Reference> Breakdown of Sales Forecast for Fiscal Year Ending March 2016<Reference> Breakdown of Sales Forecast for Fiscal Year Ending M<Reference> Breakdown of Sales Forecast for Fiscal Year Ending March 2016arch 2016
(100 millions of yen, %)
15/3 16/3
Actual Forecast Growth Rate
Leasing revenue 2,012 2,078 3.2
Installment sales revenue 299 309 3.3
Financing revenue 24 26 4.9
Commission revenue 40 42 4.7
Others 210 205 (2.7)
Total net sales 2,587 2,660 2.8
22
Reference: Anticipated Factors Affecting Operating Income for FYReference: Anticipated Factors Affecting Operating Income for FYE March 2016E March 2016
(100 millions of yen)
17,000million yen
16/3 Forecast
16,500million yen
500 million yen
Gross profit calculation SGA expenses
Increase in allowance for
doubtful accounts
15/3 Actual
(1)
+2Increase infinancing
income
Increase in gross margin
for the lease/installment
business
Increase in financing cost
Increase in expenses
(2)
+7
(1)
23
Reliability for
the FutureRicoh Leasing Company, Ltd.Ricoh Leasing Company, Ltd.
Ricoh Leasing Company, Ltd.Forward-looking statements including earnings forecasts contained in this document are based on certain assumptions deemed to be rational in light of the information available to the Company at the time of preparing the document, and are not intended to be guarantees of future performance. Actual results may differ significantly from plans and forecasts due to a variety of factors.