1 January 31, 2013 Fiscal Year ending March 31, 2013 Third Quarter Consolidated Financial Results Nine months: April 1, 2012 – December 31, 2012 Konica Minolta Holdings, Inc. Stock exchange listings: Tokyo, Osaka (First Sections) Local securities code number: 4902 URL: http://konicaminolta.com Listed company name: Konica Minolta Holdings, Inc. Representative: Masatoshi Matsuzaki, President and CEO Inquiries: Yuki Kobayashi, General Manager, CSR, Corporate Communications & Branding Div. Telephone number: (81) 3-6250-2100 Scheduled date for submission of securities report: February 13, 2013 Scheduled date for dividends payment: - Availability of supplementary information: Yes Organization of financial result briefing: Yes (for institutional investors) (Units of less than 1 million yen have been omitted.) 1. Overview of the 3Q performance (From April 1, 2012 to December 31, 2012) (1) Business performance Percentage figures represent the change from the same period of the previous year. [Millions of yen] Net sales Operating income Ordinary income Net income 3Q Mar/2013 577,727 3.1% 27,090 16.3% 26,117 38.2% 10,317 91.1% 3Q Mar/2012 560,372 -2.6% 23,285 -17.6% 18,898 -15.2% 5,399 -50.0% Note: Comprehensive income 3Q Mar/2013: ¥ 17,520 million ( ― %) 3Q Mar/2012: ¥ -7,576 million ( ― %) Net income per share Net income per share (after full dilution) 3Q Mar/2013 19.46 yen 18.87 yen 3Q Mar/2012 10.18 yen 9.86 yen
Transcript
1
January 31, 2013
Fiscal Year ending March 31, 2013 Third Quarter Consolidated Financial Results
Nine months: April 1, 2012 – December 31, 2012
Konica Minolta Holdings, Inc. Stock exchange listings: Tokyo, Osaka (First Sections) Local securities code number: 4902 URL: http://konicaminolta.com Listed company name: Konica Minolta Holdings, Inc. Representative: Masatoshi Matsuzaki, President and CEO Inquiries: Yuki Kobayashi, General Manager, CSR, Corporate Communications & Branding Div. Telephone number: (81) 3-6250-2100 Scheduled date for submission of securities report: February 13, 2013 Scheduled date for dividends payment: - Availability of supplementary information: Yes Organization of financial result briefing: Yes (for institutional investors) (Units of less than 1 million yen have been omitted.) 1. Overview of the 3Q performance (From April 1, 2012 to December 31, 2012) (1) Business performance Percentage figures represent the change from the same period of the previous year.
[Millions of yen]
Net sales Operating income Ordinary income Net income
3Q Mar/2013: ¥ 17,520 million ( ― %) 3Q Mar/2012: ¥ -7,576 million ( ― %)
Net income per share
Net income per share (after full dilution)
3Q Mar/2013 19.46 yen 18.87 yen
3Q Mar/2012 10.18 yen 9.86 yen
2
(2) Financial position [Millions of yen]
Total assets Net assets Equity ratio (%)
December 31, 2012 898,697 444,651 49.3%
March 31, 2012 902,052 434,987 48.1%
Notes: Shareholders’ equity As of December 31, 2012: ¥ 443,290 million As of March 31, 2012: ¥ 433,669 million
2. Dividends per share [yen]
1Q 2Q 3Q Year-end Total annual
FY Mar/2012 - 7.50 - 7.50 15.00
FY Mar/2013 - 7.50 -
FY Mar/2013 (forecast) 7.50 15.00 Note: Change to the latest dividend forecast announced: None
3. Consolidated results forecast for fiscal year ending March 31, 2013
(From April 1, 2012 to March 31, 2013) Percentage figures for the full year represent the change from the previous fiscal year.
[Millions of yen]
Net sales Operating income Ordinary income Net income % % % %
Net income per share
Full-year 800,000 4.2 48,000 19.0 44,000 26.6 22,000 7.7 41.49 yen Note: Change to the latest consolidated results forecast announced: None
Notes (1) Changes in status of material subsidiaries during the quarter under review (Changes to specified
subsidiaries accompanying the additional consolidation or removal from consolidation of companies): None
(2) Adoption of special accounting treatment used in preparation of the quarterly consolidated financial
statements: Yes Note: For more detailed information, please see the “(1) Adoption of Special Accounting Treatment Used in
Preparation of the Consolidated Quarterly Financial Statements” in the section 2. SUMMARY INFORMATION (NOTES) on page 13.
3
(3) Changes in accounting policy, changes in accounting estimates, or restatement due to correction a. Changes in accounting policy accompanying amendment of accounting principles: Yes b. Changes in accounting policy other than “a.”: None c. Changes in accounting estimates: Yes d. Restatement due to correction: None
Note: These are subject to Article 10-5 of the Ordinance on Terminology, Forms and Preparation Methods of Quarterly Financial Statements. For more detailed information, please see the “(2) Changes in Accounting Policy, Changes in Accounting Estimates, or Restatement Due to Correction” in the section 2. SUMMARY INFORMATION (NOTES) on page 13.
(4) Number of outstanding shares(common stock) a. Outstanding shares at period-end(including treasury stock)
Third quarter of fiscal year ending March 31, 2013: 531,664,337 shares Fiscal year ended March 31, 2012: 531,664,337 shares
b. Treasury stock at period-end
Third quarter of fiscal year ending March 31, 2013: 1,365,553 shares Fiscal year ended March 31, 2012: 1,381,591 shares
c. Average number of outstanding shares
Third quarter of fiscal year ending March 31, 2013: 530,287,023 shares Third quarter of fiscal year ended March 31, 2012: 530,246,363 shares
Presentation of Present Status of Quarterly Review Procedures This “Third Quarter Consolidated Financial Results” is not subject to quarterly review procedures in accordance with the Financial Instruments and Exchange Law and, as of the date of publication of these quarterly consolidated financial results, the quarterly review procedures for the consolidated quarterly financial statements are currently in progress.
Explanation of Appropriate Use of Performance Projections and Other Special Items (Note on forward-looking statements) This document contains projections of performance and other projections that were made based on information currently available and certain assumptions judged to be reasonable. The Group makes no warranty as to the achievability of the projections. There is a possibility that diverse factors may cause actual performance, etc., to differ materially from the projections. Please see the “(3) Outlook for the Fiscal Year Ending March 31, 2013” in the section 1. CONSOLIDATED OPERATING RESULTS on page 13 for more information on points to be remembered in connection with assumptions for projections and the use of projections. (How to obtain supplementary information and information on a financial results briefing) The Group will hold a financial results briefing for institutional investors on Thursday, January 31, 2013. Descriptions at the briefing and presentation slides to be used at the briefing will be posted on the website of the Group immediately after the briefing.
1. CONSOLIDATED OPERATING RESULTS 5
(1) Qualitative Information of Consolidated Performance 5
(2) Financial Position 11
(3) 13
2. SUMMARY INFORMATION (NOTES) 13(1) 13
(2) Changes in Accounting Policy, Changes in Accounting Estimates, or Restatement Due to Correction 13
3. CONSOLIDATED QUARTERLY FINANCIAL STATEMENTS 14
(1) 14
(2) 16
Consolidated Quarterly Statements of Income -Nine months 16
Consolidated Quarterly Statements of Comprehensive Income -Nine months 17
Consolidated Quarterly Statements of Income -Three months 18
Consolidated Quarterly Statements of Comprehensive Income -Three months 19
(3) Consolidated Quarterly Statements of Cash Flow 20
(4) Notes regarding Going Concern Assumptions 22
(5) Notes regarding Significant Change in Shareholders’ Equity 22
(6) Segment Information 22
Supplementary Information
>>> INDEX <<<
Consolidated Quarterly Balance Sheets
Consolidated Quarterly Statements of Income and Consolidated Quarterly Statements ofComprehensive Income
Outlook for the Fiscal Year Ending March 31, 2013
Adoption of Special Accounting Treatment Used in Preparation of the Consolidated QuarterlyFinancial Statements
4
Supplementary Information - 3Q FY March 2013
5
1. CONSOLIDATED OPERATING RESULTS (1) Qualitative Information of Consolidated Performance 1. Overview of Performance
Nine months ended December 31, 2012 (From April 1, 2012 to December 31, 2012) Nine months Year-on-Year [Billions of yen]
Apr-Dec / Mar 2013
Apr-Dec / Mar 2012
Increase (Decrease)
Net sales Gross profit Operating income Ordinary income Income before income taxes and
minority interests Net income
577.7 269.7 27.0 26.1 22.9
10.3
560.3 260.0 23.2 18.8 14.0
5.3
17.3 9.7 3.8 7.2 8.8
4.9
3.1%3.7%
16.3%38.2%63.0%
91.1%
Net income per share [yen] 19.46 10.18 9.27 91.1%Capital expenditure Depreciation R & D expenses
-7.6% Looking at the main businesses of the Konica Minolta Group during the first three quarters of the
consolidated fiscal year under review (April 1, 2012 to December 31, 2012), in the Business Technologies Business, despite the lack of significant growth overall in market demand in the office field, sales volumes were up slightly year on year thanks to the introduction of new products in the A3 color MFPs “bizhub” Series and successful efforts to strengthen IT service capabilities. The production print field faced a challenging market environment that was typified by increased concerns over a business downturn and intensified competition in the market since the middle of last year. Nonetheless, sales volumes grew year on year due to the introduction of new products and initiatives to strengthen sales capabilities.
In the Industrial Business, while sales were soft for glass substrates for HDDs and optical pickup lenses due to a deterioration in market conditions and the impact of inventory adjustments, sales for thin plain TAC films for LCD polarizers (“TAC films for LCD polarizers” hereinafter referred to as “TAC films”) and VA-TAC films for increasing the viewing angles (hereinafter referred to as “VA-TAC films”) remained strong throughout the period under review, and sales volumes were up year on year for projector lenses for digital cinemas and replacement lenses for DSLR cameras. In addition, sales were strong for light meters throughout the period, thanks to initiatives that were launched to strengthen competitiveness.
In the Healthcare Business, sales were strong for digital X-ray diagnostic imaging systems such as the “AeroDR” the cassette digital X-ray detector.
As a result, the Konica Minolta Group recorded net sales of ¥577.7 billion, an increase of 3.1% year on year, on a consolidated basis for the first three quarters of the fiscal year under review. Despite some adjustments in the high yen, the yen rose nearly ¥8 against the euro, and the impact of foreign exchange rates acted to reduce earnings by ¥7.4 billion. In spite of this, sales were up year on year due to sales strengthening initiatives focused on main products that were implemented in each business.
Supplementary Information - 3Q FY March 2013
6
Operating income was ¥27.0 billion, an increase of 16.3% from the same period of the previous fiscal year.
Profits were down year on year in the Business Technologies Business due to the impact of the high yen, failure to achieve cost reduction plans for some products, and an increase in advanced investments relating to sales reinforcement measures. On the other hand, in the Industrial Business and the Healthcare Business, profits increased due to increased sales and initiatives to improve profitability. Ordinary income was ¥26.1 billion, an increase of 38.2% year on year, due to a ¥3.4 billion year-on-year increase in non-operating income as a result of factors including a significant improvement in foreign exchange losses. Income before income taxes and minority interests was ¥22.9 billion, an increase of 63.0% year on year, primarily attributable to a loss on sales and retirement of noncurrent assets and impairment of ¥2.9 billion associated with a portion of production equipment. Net income of ¥10.3 billion was recorded, an increase of 91.1% year on year.
Supplementary Information - 3Q FY March 2013
7
2. Overview by Segment
Nine months ended December 31, 2012 (From April 1, 2012 to December 31, 2012)
Nine months Year-on-Year [Billions of yen]
Apr-Dec / Mar 2013
Apr-Dec / Mar 2012
Increase (Decrease)
Business Technologies Net sales - external Operating income
405.1 18.4
400.8 24.6
4.2 (6.2)
1.1% -25.3%
Industrial Business Net sales - external Operating income
114.4 21.5
91.1 9.6
- -
-% -%
Healthcare Net sales - external Operating income (loss)
50.0 1.1
51.9 (0.5)
(1.8) 1.7
-3.6% -%
Note: Figures in Industrial Business for Apr-Dec/Mar 2012 are the figures of former Optics Business.
Business Technologies Business Office field:
Sales were strong throughout the period under review for the A3 color MFPs “bizhub” Series, as five new models were gradually launched during the first half of the year. Sales volumes of A3 color MFPs were up year on year in regions worldwide, including Japan, the US, and Europe, and Other regions. Although sales were down year on year for A3 monochrome MFPs amidst concerns of an economic slowdown in Europe and China, sales volumes were up slightly overall for A3 MFPs. In sales towards major clients on a global level that are being strengthened as growth fields for this segment, the number of customers was expanded during the period under review as global contracts were acquired with a major European printer and pharmaceutical manufacturer.
Production print field:
Meanwhile, in the production print field, the challenging market environment typified by deterioration in business conditions and intensified competition was mitigated for color units by the contribution from increased sales in the US and Japan, while performance was solid for monochrome units thanks to the introduction of new digital printing systems from the first half of the year, such as the “bizhub PRO 951” and “bizhub PRESS 1250.” As a result, sales volumes grew year on year for both color units and monochrome units.
In the Business Technologies Business, the Company has been actively promoting M&As for the purpose of
expanding sales of digital equipment and solution services and preparing for the transformation of our business portfolio. In the office field, the Company acquired IT service providers Serians S.A.S. (headquartered in France) in June and Raber+Märcker GmbH (headquartered in Germany) in December of last year (coming into effect on January 1, 2013), to develop OPS (Optimized Print Services) globally and to bolster IT services to serve as the focal point in preparations for emerging changes in the nature of our business. Furthermore, three companies were similarly acquired in the US through M&As. Meanwhile, in the production print field, the Company acquired FedEx Kinko’s Japan Co., Ltd. (headquartered in Tokyo), one of Japan’s largest on-demand printing providers, in May of last year and Charterhouse PM Limited (headquartered in the UK), a leading European marketing service production company, in December of last year to enhance sales and solution proposal capabilities in the in-house printing market.
Supplementary Information - 3Q FY March 2013
8
As a result, net sales of the Business Technologies Business to outside customers and operating income
stood at ¥405.1 billion and ¥18.4 billion, respectively. Net sales were up year on year as an increase in sales volumes for new office color MFPs and production print units and the effect of M&As offset the impact of yen appreciation against the euro. Operating income fell year on year due to the impact of the high yen, failure to achieve cost reduction plans for some products, and an increase in advanced investments relating to sales reinforcement measures. Industrial Business Display materials field:
Sales of our core thin film products such as TAC film with a thickness of 60μm and VA-TAC film with a thickness of 40μm were strong throughout the year, as sales volumes of these products grew year on year. Furthermore, the Company made the industry-pioneering move of commencing mass production of ultra-thin TAC film with a thickness of 25μm for the mobile market in November of last year. Memory devices field:
In glass substrates for HDDs, despite the launch of full-scale production of products for 500 GB HDDs, sales were down significantly year on year as orders took a considerable dive as a result of production adjustments in response to the deterioration in market conditions from last summer onward. Sales of pickup lenses for optical disks were stagnant as a recovery in market conditions was not seen for products for either Blu-ray Discs or DVDs. Image input/output components field:
The application of the Company's projector lenses for digital cinemas, replacement lenses for DSLR cameras, and zoom lens units for compact digital cameras has increased and shipping of lens units for smartphones commenced from the beginning of last year. As a result of these developments, sales volumes were up year on year for each of these products.
Sensing field:
Large orders were acquired for light meters, including the “CL-200A Chroma Meter” and the “CA-310 Color Analyzer,” which are used for quality control in the manufacturing process for displays, such as those for smartphones, and LED lighting, and as a result sales volumes were up year on year. With the aim of strengthening competitiveness in this light measurement segment, Instrument Systems GmbH (headquartered in Germany), which has a particularly high market share of top segment products, was acquired in November of last year.
As a result, net sales of the Industrial Business to outside customers and operating income stood at ¥114.4
billion and ¥21.5 billion, respectively. Both sales and profits grew year on year due to an increase in overall sales volumes for major products, excluding some products such as those in the memory field.
Note that the reportable segments have changed as of the first quarter accounting period. For details, refer to “3. CONSOLIDATED QUARTERLY FINANCIAL STATEMENTS, (6) Segment Information, [2] Nine months ended December 31, 2012 (From April 1, 2012 to December 31, 2012), 3. Matters Associated with Changes in Reportable Segments.”
Supplementary Information - 3Q FY March 2013
9
Healthcare Business
In the Healthcare Business, the Company focused on increasing sales of digital X-ray diagnostic imaging systems to medical facilities in Japan and overseas. Sales of “AeroDR,” the cassette digital X-ray detector equipped with a high resolution scintillator developed and manufactured in-house, were strong for both general X-ray systems and nursing carts, while sales volumes of medical digital input devices increased year on year. Sales of film products continued to decline, particularly in developed countries.
As a result of the factors described above, net external sales stood at ¥50.0 billion. As a result of improved
profitability triggered by increased sales of DR products and thorough cost management, operating income stood at ¥1.1 billion, up from an operating loss of ¥0.5 billion that was posted during the same period of the previous fiscal year.
Supplementary Information - 3Q FY March 2013
10
<Reference>
Overview of Performance Three months ended December 31, 2012 (From October 1, 2012 to December 31, 2012)
Year-on-Year [Billions of yen]
3Q / Mar 2013
3Q / Mar 2012
Increase (Decrease)
Net sales Gross profit Operating income Ordinary income Income before income taxes and
minority interests Net income
193.9 89.7 6.8 7.8 7.8
2.7
182.0 86.3 7.6 7.3 5.6
1.6
11.8 3.3
(0.8) 0.5 2.1
1.0
6.5%3.9%
-11.3%7.8%
39.0%
64.4%
Net income per share [yen] 5.11 3.11 2.00 64.4%Capital expenditure Depreciation R & D expenses
Business Technologies Net sales - external Operating income
140.2 5.3
131.9 9.3
8.3 (3.9)
6.3% -42.7%
Industrial Business Net sales - external Operating income
35.0 5.9
27.7 2.4
- -
-% -%
Healthcare Net sales - external Operating income (loss)
16.1 0.0
17.2 (0.2)
(1.0) 0.2
-6.2% -%
Note: Figures in Industrial Business for 3Q/Mar 2012 are the figures of former Optics Business.
Supplementary Information - 3Q FY March 2013
11
(2) Financial Position 1. Analysis of Financial Position
As of
December 31, 2012As of
March 31, 2012 Increase
(Decrease)
Total assets [Billions of yen] 898.6 902.0 (3.3)
Total liabilities [Billions of yen] 454.0 467.0 (13.0)
Net assets [Billions of yen] 444.6 434.9 9.6
Equity ratio [%] 49.3 48.1 1.2
Total assets at the end of the third quarter of the consolidated fiscal year under review were down ¥3.3
billion (0.4%) from the previous fiscal year-end, to ¥898.6 billion. Current assets fell ¥20.6 billion (3.6%) to ¥545.2 billion (60.7% to total assets), while noncurrent assets rose ¥17.2 billion (5.1%) to ¥353.4 billion (39.3% to total assets).
With respect to current assets, cash and deposits increased ¥3.8 billion from the end of the previous fiscal year, to ¥94.4 billion, but securities decreased ¥44.2 billion. As a result of advanced redemption of bonds, cash and cash equivalents decreased ¥40.4 billion, to ¥191.4 billion. Meanwhile, notes and accounts receivable-trade increased ¥2.1 billion from the previous fiscal year-end, to ¥176.3 billion, while inventories increased ¥16.5 billion to ¥121.6 billion.
With respect to noncurrent assets, property, plant and equipment decreased ¥3.4 billion from the previous fiscal year-end, to ¥175.5 billion, as a result of progress in depreciation. Intangible assets increased ¥17.1 billion to ¥104.5 billion as a result of an increase in goodwill accompanying the M&As in the Business Technologies Business and Industrial Business. Investments and other assets also increased, by ¥3.5 billion to ¥73.3 billion.
Total liabilities decreased ¥13.0 billion (2.8%) from the previous fiscal year-end, to ¥454.0 billion. Notes and accounts payable-trade declined ¥7.3 billion, to ¥80.7 billion, while interest-bearing debt (a sum of short-term loans payable, long-term loans payable and bonds payable) decreased ¥10.2 billion to ¥217.7 billion.
Net assets increased ¥9.6 billion (2.2%) from the previous fiscal year-end, to ¥444.6 billion. In accumulated other comprehensive income, valuation difference on available-for-sale securities decreased ¥0.6 billion from the previous fiscal year-end due to the influence of the weak stock market. Meanwhile, the foreign currency translation adjustment rose by ¥8.3 billion due to fluctuations in foreign currency translation adjustments brought about by yen depreciation, mainly against the US dollar and the euro.
As a result, the shareholders’ equity ratio increased 1.2 percentage points, to 49.3%.
Supplementary Information - 3Q FY March 2013
12
2. Cash Flows
[Billions of yen]
Apr-Dec
/ Mar 2013 Apr-Dec
/ Mar 2012 Increase (Decrease)
Cash flows from operating activities 35.5 49.0 (13.4)
Cash flows from investing activities (49.3) (31.2) (18.0)
Total (Free cash flow) (13.7) 17.7 (31.4)
Cash flows from financing activities (27.8) 22.5 (50.4)
During the first three quarters of the consolidated fiscal year under review, net cash provided by operating activities was ¥35.5 billion, while net cash used in investing activities, mainly associated with capital investment and acquisitions, totaled ¥49.3 billion. As a result, free cash flow (the sum of operating and investing activities) was an outflow of ¥13.7 billion.
Net cash used in financing activities was ¥27.8 billion. In addition, cash and cash equivalents at the end of the third quarter of the consolidated fiscal year under
review stood at ¥191.4 billion, down ¥40.4 billion from the previous fiscal year-end, reflecting the effect of changes in exchange rates on cash and cash equivalents.
The details of cash flows associated with each activity during the first three quarters of the consolidated
fiscal year under review are as follows. Cash flows from operating activities Net cash provided by operating activities stood at ¥35.5 billion (compared with net cash provided of ¥49.0
billion in the same period of the previous fiscal year). Although the Group reported a decrease in working capital of ¥17.0 billion and a payment of ¥10.2 billion for income taxes, these amounts were more than offset by income before income taxes and minority interests of ¥22.9 billion, depreciation of ¥33.2 billion, and amortization of goodwill of ¥7.0 billion.
Cash flows from investing activities Net cash used in investing activities was ¥49.3 billion (compared with an outflow of ¥31.2 billion in the
same period in the previous consolidated fiscal year). Cash of ¥21.1 billion was used for investments in molding for new products in the Business Technologies Business and in the acquisition of property, plant and equipment relating to the reinforcement of production capacities in the Industrial Business. Other cash outflow of ¥17.7 billion includes the acquisition of shares in subsidiaries for the acquisition of companies in Japan, Europe, and the US to strengthen the production print business and IT services capabilities in the Business Technologies Business as well as investments in subsidiaries in the Industrial Business.
As a result, free cash flow (the sum of operating and investing activities) was an outflow of ¥13.7 billion
(compared with an inflow of ¥17.7 billion in the same period of the previous fiscal year). Cash flows from financing activities Net cash used in financing activities was ¥27.8 billion (compared with ¥22.5 billion provided in the same
period of the previous fiscal year), mainly reflecting an expenditure of ¥39.9 billion for the redemption of bonds, a payment of ¥7.8 billion in dividends, and a net increase of ¥21.0 billion in short and long-term loans.
Supplementary Information - 3Q FY March 2013
13
(3) Outlook for the Fiscal Year Ending March 31, 2013
The Konica Minolta Group understands that the outlook of the business environment that surrounds the Group will remain uncertain due to factors including the global economic slowdown triggered by the European debt crisis. However, in light of the performance during the first three quarters of the consolidated fiscal year, the Group maintains its results forecast unchanged from their initial announcement.
Note that the assumed exchange rates for the fourth quarter have been revised to 85 yen for the US dollar and 115 yen for the euro. Note: The above operating performance forecasts are based on future-related assumptions, outlooks, and plans at the time this report was released, and they involve risks and uncertainties. It should be noted that actual results may differ significantly from these forecasts due to various important factors, such as changes in economic conditions, market trends, and currency exchange rates. * Figures in qualitative information sections given as billions of yen have been rounded off to the nearest hundred
million. 2. SUMMARY INFORMATION (NOTES) (1) Adoption of Special Accounting Treatment Used in Preparation of the Consolidated
Quarterly Financial Statements
Calculation of tax expenses The effective tax rate on income before income tax for the consolidated fiscal year after the application of
tax effect accounting is reasonably estimated, and that estimated rate is applied to net income for the quarterly period to calculate estimated tax expenses. (2) Changes in Accounting Policy, Changes in Accounting Estimates, or Restatement Due
to Correction
Change in depreciation method Starting the first quarter under review, with the revision of the Corporation Tax Law, the Company and its
domestic consolidated subsidiaries are depreciating property, plant and equipment acquired on or after April 1, 2012 under the revised Corporation Tax Law.
Because of the change, operating income, ordinary income, and income before income taxes and minority interests for the first three quarters under review each increased ¥380 million compared to the amount calculated by previous method.
Supplementary Information - 3Q FY March 2013
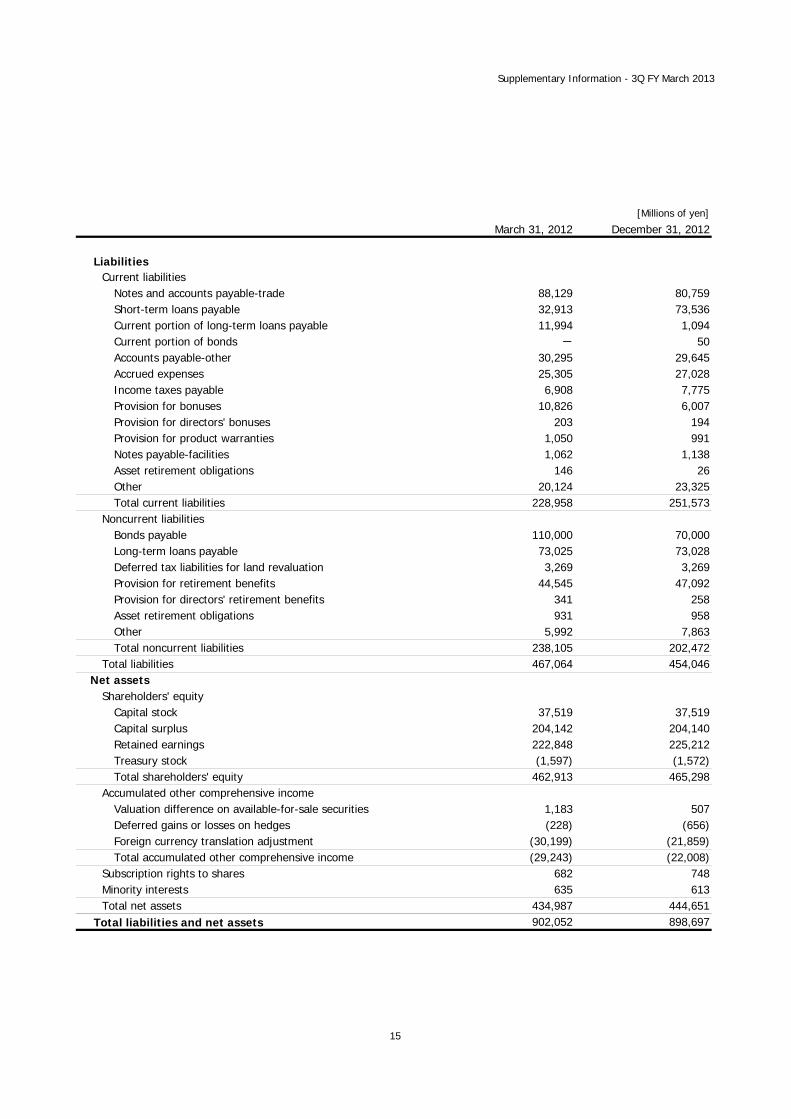
(1) Consolidated Quarterly Balance SheetsDecember 31, 2012 and March 31, 2012
[Millions of yen]
March 31, 2012 December 31, 2012
AssetsCurrent assets
Cash and deposits 90,640 94,452Notes and accounts receivable-trade 174,193 176,309Lease receivables and investment assets 13,775 14,960Short-term investment securities 141,293 97,003Inventories 105,080 121,638Deferred tax assets 20,100 22,026Accounts receivable-other 13,467 9,210Other 11,759 14,118Allowance for doubtful accounts (4,385) (4,437)Total current assets 565,923 545,281
Noncurrent assetsProperty, plant and equipment
Buildings and structures, net 66,874 67,080Machinery, equipment and vehicles, net 39,773 35,719Tools, furniture and fixtures, net 22,407 23,152Land 33,609 33,759Lease assets, net 415 512Construction in progress 7,817 5,887Assets for rent, net 8,101 9,423Total property, plant and equipment 178,999 175,536
Accumulated other comprehensive incomeValuation difference on available-for-sale securities 1,183 507Deferred gains or losses on hedges (228) (656)Foreign currency translation adjustment (30,199) (21,859)Total accumulated other comprehensive income (29,243) (22,008)
Subscription rights to shares 682 748Minority interests 635 613Total net assets 434,987 444,651
Total liabilities and net assets 902,052 898,697
15
Supplementary Information - 3Q FY March 2013
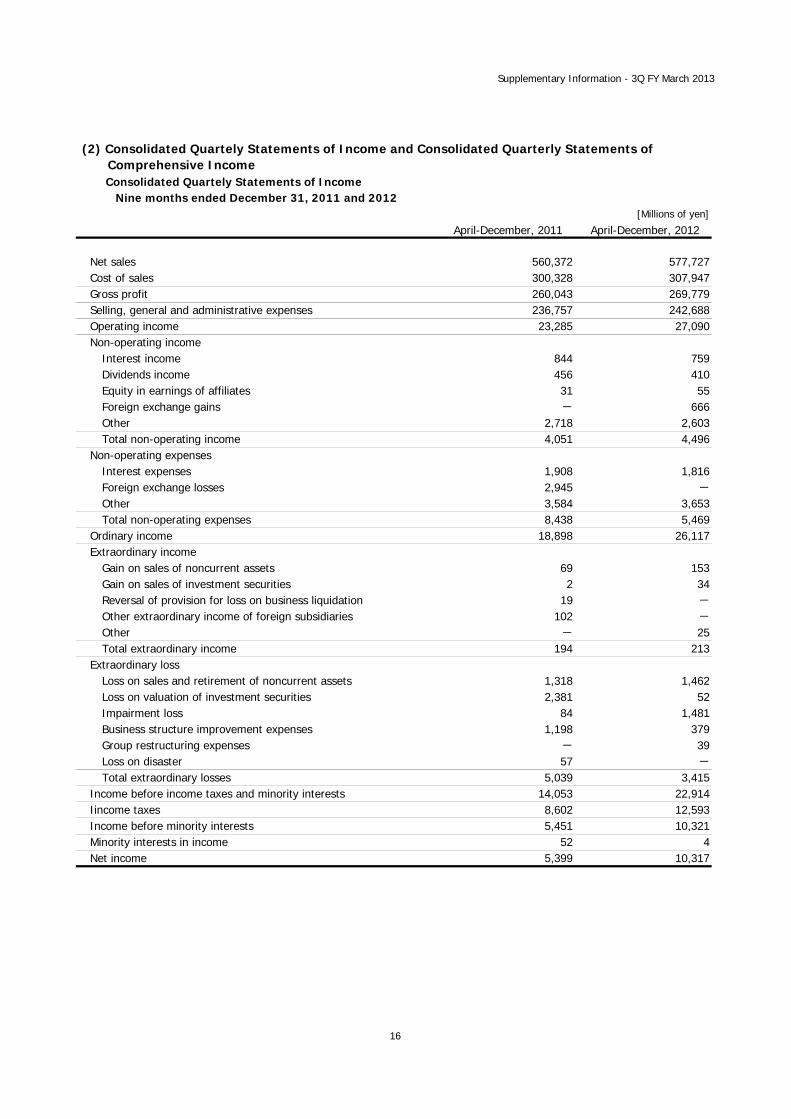
Consolidated Quartely Statements of Income Nine months ended December 31, 2011 and 2012
[Millions of yen]
April-December, 2011 April-December, 2012
Net sales 560,372 577,727Cost of sales 300,328 307,947Gross profit 260,043 269,779Selling, general and administrative expenses 236,757 242,688Operating income 23,285 27,090Non-operating income
Interest income 844 759Dividends income 456 410Equity in earnings of affiliates 31 55Foreign exchange gains - 666Other 2,718 2,603Total non-operating income 4,051 4,496
Other 3,584 3,653Total non-operating expenses 8,438 5,469
Ordinary income 18,898 26,117Extraordinary income
Gain on sales of noncurrent assets 69 153Gain on sales of investment securities 2 34Reversal of provision for loss on business liquidation 19 -
Other extraordinary income of foreign subsidiaries 102 -
Other - 25Total extraordinary income 194 213
Extraordinary lossLoss on sales and retirement of noncurrent assets 1,318 1,462Loss on valuation of investment securities 2,381 52Impairment loss 84 1,481Business structure improvement expenses 1,198 379Group restructuring expenses - 39Loss on disaster 57 -
Total extraordinary losses 5,039 3,415Income before income taxes and minority interests 14,053 22,914Iincome taxes 8,602 12,593Income before minority interests 5,451 10,321Minority interests in income 52 4Net income 5,399 10,317
(2) Consolidated Quartely Statements of Income and Consolidated Quarterly Statements of Comprehensive Income
16
Supplementary Information - 3Q FY March 2013
Consolidated Quartely Statements of Comprehensive Income Nine months ended December 31, 2011 and 2012
[Millions of yen]
April-December, 2011 April-December, 2012
Income before minority interests 5,451 10,321Other comprehensive income
Valuation difference on available-for-sale securities (608) (675)Deferred gains or losses on hedges 332 (428)Foreign currency translation adjustment (12,748) 8,297Share of other comprehensive income of associates accounted forusing equity method
(3) 5
Total other comprehensive income (13,027) 7,198Comprehensive income (7,576) 17,520Comprehensive income attributable to
Comprehensive income attributable to owners of the parent (7,515) 17,553Comprehensive income attributable to minority interests (60) (32)
17
Supplementary Information - 3Q FY March 2013
Consolidated Quartely Statements of Income Three months ended December 31, 2011 and 2012
[Millions of yen]
October-December, 2011 October-December, 2012
Net sales 182,049 193,909Cost of sales 95,651 104,140Gross profit 86,397 89,768Selling, general and administrative expenses 78,716 82,957Operating income 7,680 6,810Non-operating income
Interest income 312 234Dividends income 164 173Equity in earnings of affiliates 12 32Foreign exchange gains 530 1,661Other 931 721Total non-operating income 1,951 2,823
Other 1,224 1,139Total non-operating expenses 2,331 1,767
Ordinary income 7,301 7,867Extraordinary income
Gain on sales of noncurrent assets 20 43Gain on sales of investment securities 0 -
Gain on reversal of loss on valuation of investment securities 18 258Other extraordinary income of foreign subsidiaries 102 -
Total extraordinary income 142 301Extraordinary loss
Loss on sales and retirement of noncurrent assets 542 297Loss on valuation of investment securities 28 -
Impairment loss 53 19Business structure improvement expenses 1,198 -
Group restructuring expenses - 39Total extraordinary losses 1,822 356
Income before income taxes and minority interests 5,620 7,812Income taxes 3,954 5,106Income before minority interests 1,666 2,705Minority interests in income (loss) 18 (2)Net income 1,647 2,707
18
Supplementary Information - 3Q FY March 2013
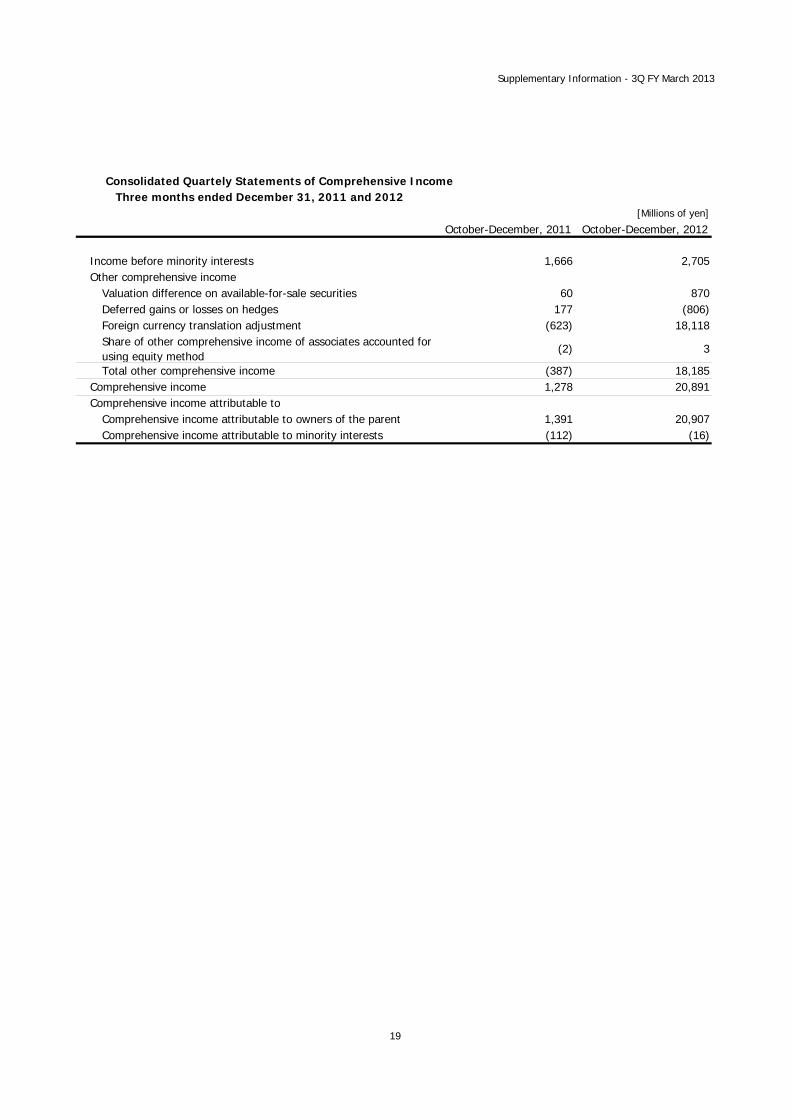
Consolidated Quartely Statements of Comprehensive Income Three months ended December 31, 2011 and 2012
[Millions of yen]
October-December, 2011 October-December, 2012
Income before minority interests 1,666 2,705Other comprehensive income
Valuation difference on available-for-sale securities 60 870Deferred gains or losses on hedges 177 (806)Foreign currency translation adjustment (623) 18,118Share of other comprehensive income of associates accounted forusing equity method
(2) 3
Total other comprehensive income (387) 18,185Comprehensive income 1,278 20,891Comprehensive income attributable to
Comprehensive income attributable to owners of the parent 1,391 20,907Comprehensive income attributable to minority interests (112) (16)
19
Supplementary Information - 3Q FY March 2013
(3) Consolidated Quartely Statements of Cash FlowNine months ended December 31, 2011 and 2012
[Millions of yen]
April-December, 2011 April-December, 2012
Net cash provided by (used in) operating activitiesIncome before income taxes and minority interests 14,053 22,914Depreciation and amortization 36,034 33,276Impairment loss 84 1,481Amortization of goodwill 6,596 7,071Interest and dividends income (1,301) (1,169)Interest expenses 1,908 1,816Loss (gain) on sales and retirement of noncurrent assets 1,248 1,309Loss (gain) on sales and valuation of investment securities 2,377 17Increase (decrease) in provision for bonuses (5,228) (4,902)Increase (decrease) in provision for retirement benefits 3,446 2,589Increase (decrease) in provision for loss on business liquidation (26) -
Decrease (increase) in notes and accounts receivable-trade (1,457) 10,705Decrease (increase) in inventories (10,106) (10,583)Increase (decrease) in notes and accounts payable-trade 11,048 (17,205)Transfer of assets for rent (2,820) (4,044)Decrease (increase) in accounts receivable-other (1,996) 2,485Increase (decrease) in accounts payable-other and accrued 2,847 (912)Increase (decrease) in deposits received 1,511 1,457Decrease/increase in consumption taxes receivable/payable 937 (605)Other, net (5,201) 917Subtotal 53,954 46,620Interest and dividends income received 1,228 1,198Interest expenses paid (1,890) (1,949)Income taxes (paid) refund (4,284) (10,277)Net cash provided by (used in) operating activities 49,006 35,591
Net cash provided by (used in) operating activitiesPurchase of property, plant and equipment (19,889) (21,182)Proceeds from sales of property, plant and equipment 325 419Purchase of intangible assets (4,023) (4,757)Payments for transfer of business (1,479) (1,838)Purchase of investments in subsidiaries resulting in change inscope of consolidation
(5,506) (9,321)
Purchase of investments in subsidiaries' equity resulting in changein scope of consolidation
- (7,109)
Payments of loans receivable (207) (289)Collection of loans receivable 68 60Purchase of investment securities (5) (340)Proceeds from sales of investment securities 2 176Purchase of investments in subsidiaries - (1,296)Payments of valuation of other investments (663) (4,492)Other, net 115 644
Net cash provided by (used in) investing activities (31,262) (49,325)
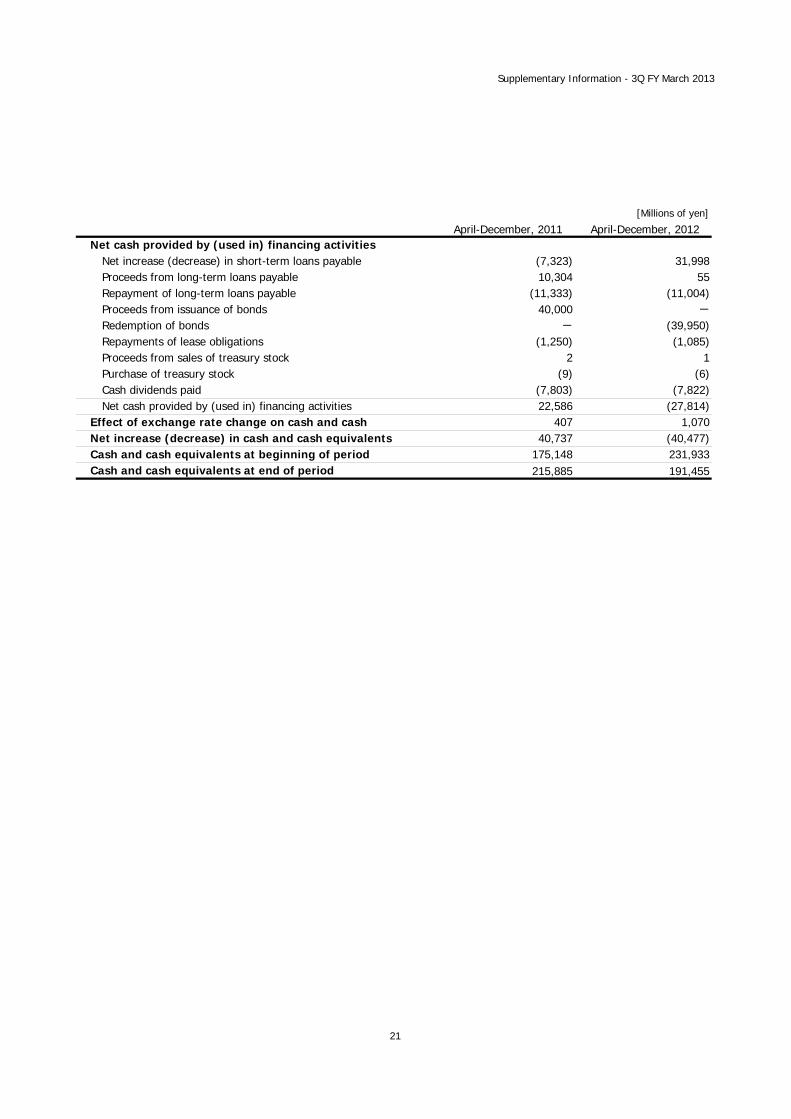
Net increase (decrease) in short-term loans payable (7,323) 31,998Proceeds from long-term loans payable 10,304 55Repayment of long-term loans payable (11,333) (11,004)Proceeds from issuance of bonds 40,000 -
Redemption of bonds - (39,950)Repayments of lease obligations (1,250) (1,085)Proceeds from sales of treasury stock 2 1Purchase of treasury stock (9) (6)Cash dividends paid (7,803) (7,822)Net cash provided by (used in) financing activities 22,586 (27,814)
Effect of exchange rate change on cash and cash 407 1,070Net increase (decrease) in cash and cash equivalents 40,737 (40,477)Cash and cash equivalents at beginning of period 175,148 231,933Cash and cash equivalents at end of period 215,885 191,455
21
Supplementary Information - 3Q FY March 2013
22
(4) Notes regarding Going Concern Assumptions
None (5) Notes regarding Significant Change in Shareholders’ Equity None (6) Segment Information [1] Nine months ended December 31, 2011 (From April 1, 2011 to December 31, 2011) 1. Information about Segment Sales and Income (Loss)
Notes: 1. “Other” consists of business segments such as Sensing Business and Industrial Inkjet Business. 2. This information is based on the amount reported to management, and the figures were calculated based on the reportable
segments, before they were changed in the first quarter of the consolidated fiscal year under review. The related information is presented in “3.Matters associated with changes in reportable segments in the section [2] Nine months ended December 31, 2012 (From April 1, 2012 to December 31, 2012).”
2. Difference between the Total of the Reportable Segments’ Measures of Profit or Loss and
Income According to Consolidated Quarterly Statements of Income, and the Main Components of the Difference (Matters Related to Adjustment of Difference)
[Millions of yen]
Item Amount
Total operating income of reportable segments 33,738 Operating income categorized in “Other” 3,566 Intersegment – eliminations (4,190) Corporate expenses (9,829) Operating income reported on quarterly statements of income 23,285 Notes: Corporate expenses are mainly general administration expenses and basic research expenses that do not belong to any reporting segment.
Supplementary Information - 3Q FY March 2013
23
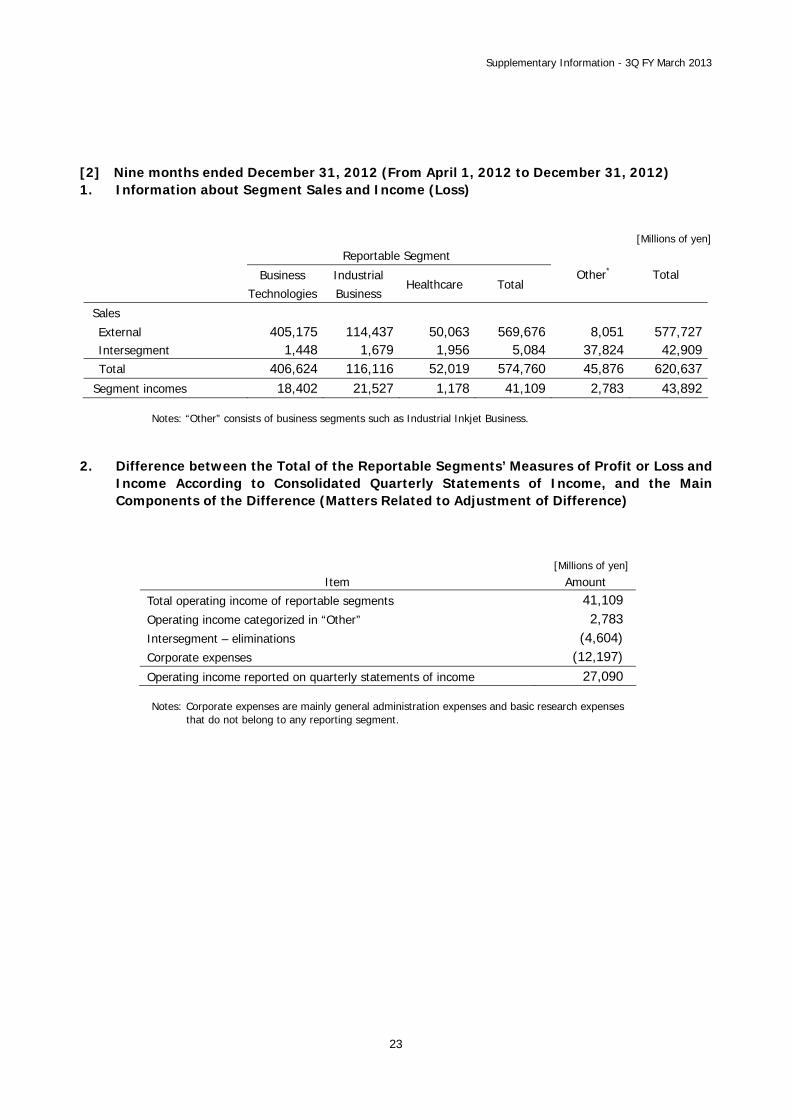
[2] Nine months ended December 31, 2012 (From April 1, 2012 to December 31, 2012) 1. Information about Segment Sales and Income (Loss)
Notes: “Other” consists of business segments such as Industrial Inkjet Business.
2. Difference between the Total of the Reportable Segments’ Measures of Profit or Loss and
Income According to Consolidated Quarterly Statements of Income, and the Main Components of the Difference (Matters Related to Adjustment of Difference)
[Millions of yen]
Item Amount
Total operating income of reportable segments 41,109 Operating income categorized in “Other” 2,783 Intersegment – eliminations (4,604) Corporate expenses (12,197) Operating income reported on quarterly statements of income 27,090 Notes: Corporate expenses are mainly general administration expenses and basic research expenses that do not belong to any reporting segment.
Supplementary Information - 3Q FY March 2013
24
3. Matters Associated with Changes in Reportable Segments
With the reorganization of the Group, the reportable segments are the Business Technologies Business, Industrial Business, and Healthcare Business from the first quarter of the consolidated fiscal year under review, instead of the Business Technologies Business, Optics Business, and Healthcare Business, which were reportable segments until the previous fiscal year.
Main products and type of services were also changed. Manufacturing and sale of optical products (pickup lenses, etc.) and electronic materials (TAC films, etc.) as in the Optics Business were changed to manufacturing and sale of electronic materials (TAC films, etc.), performance materials, optical products (pickup lenses, etc.), and measuring instruments for industrial and healthcare applications as in the Industrial Business. Meanwhile main products and type of services both in Business Technologies Business and Healthcare Business were not changed.
Segment information for the first three quarters of the previous fiscal year in accordance with the new reportable segments is not disclosed except for external sales, because of the practical difficulty in accurately calculating cost of sales and selling, general, and administrative expenses retroactively for the previous fiscal year. Segment information for the first three quarters under review in accordance with the reportable segments before the change is also not disclosed, because of the practical difficulty in obtaining the necessary information, and is not reported to management in consideration of the usefulness of the information.
When segment information for the first three quarters of the previous fiscal year is created in accordance with the reportable segments for the first three quarters under review, external sales in the Industrial Business are ¥99,019 million, and external sales in “Other” business are ¥8,563 million. 4. Information Relating to Impairment Loss of Noncurrent Assets and Goodwill by
Reportable Segment
Significant impairments loss on noncurrent assets An impairment loss was posted because the recoverable amount for business assets in the Industrial
Business segment and Healthcare Business segment fell below the book value. The impairment loss posted during the first three quarters of the consolidated fiscal year under review was ¥365 million for the Industrial Business segment and ¥1,048 million for the Healthcare Business segment. Material change in the goodwill amount
In the Business Technologies Business, the shares of Charterhouse PM Limited were acquired and the company was made into a subsidiary. Although it is a provisional amount as the allocation of expenditures to acquisition cost has not been completed, the increase in goodwill as a result of events during the first three quarters of the fiscal year under review was ¥7,415 million.
In addition, in the Industrial Business, the equity interest of Instrument Systems GmbH was acquired and the company was made into a subsidiary. Although it is a provisional amount as the allocation of expenditures to acquisition cost has not been completed, the increase in goodwill as a result of events during the first three quarters of the fiscal year under review was ¥3,819 million.
Supplementary Information - 3Q FY March 2013
25
[3] Three months ended December 31, 2011 (From October 1, 2011 to December 31, 2011) 1. Information about Segment Sales and Income (Loss)
Notes: 1. “Other” consists of business segments such as Sensing Business and Industrial Inkjet Business. 2. This information is based on the amount reported to management, and the figures were calculated based on the reportable
segments, before they were changed in the first quarter of the consolidated fiscal year under review. The related information is presented in “3. Matters associated with changes in reportable segments in the section [2] Nine months ended December 31, 2012 (From April 1, 2012 to December 31, 2012).”
2. Difference between the Total of the Reportable Segments’ Measures of Profit or Loss and
Income According to Consolidated Quarterly Statements of Income, and the Main Components of the Difference (Matters Related to Adjustment of Difference)
[Millions of yen]
Item Amount
Total operating income of reportable segments 11,631 Operating income categorized in “Other” 937 Intersegment – eliminations (1,235) Corporate expenses (3,652) Operating income reported on quarterly statements of income 7,680 Notes: Corporate expenses are mainly general administration expenses and basic research expenses that do not belong to any reporting segment.
Supplementary Information - 3Q FY March 2013
26
[4] Three months ended December 31, 2012 (From October 1, 2012 to December 31, 2012) 1. Information about Segment Sales and Income (Loss)
Notes: “Other” consists of business segments such as Industrial Inkjet Business.
2. Difference between the Total of the Reportable Segments’ Measures of Profit or Loss and
Income According to Consolidated Quarterly Statements of Income, and the Main Components of the Difference (Matters Related to Adjustment of Difference)
[Millions of yen]
Item Amount
Total operating income of reportable segments 11,300 Operating income categorized in “Other” 843 Intersegment – eliminations (1,070) Corporate expenses (4,262) Operating income reported on quarterly statements of income 6,810 Notes: Corporate expenses are mainly general administration expenses and basic research expenses that do not belong to any reporting segment.
Supplementary Information - 3Q FY March 2013
27
3. Matters Associated with Changes in Reportable Segments
Since the first quarter of the consolidated fiscal year under review, the Group has changed the method by witch it categorizes its reportable segments. For more detailed information, please see the “3. Matters associated with changes in reportable segments” in the section [2] Nine months ended December 31, 2012 (from April 1, 2012 to December 31, 2012).
Segment information for the third quarter of the previous fiscal year in accordance with the new reportable segments is not disclosed except for external sales, because of the practical difficulty in accurately calculating cost of sales and selling, general, and administrative expenses retroactively for the previous fiscal year. Segment information for the third quarter under review in accordance with the reportable segments before the change is also not disclosed, because of the practical difficulty in obtaining the necessary information, and is not reported to management in consideration of the usefulness of the information.
When segment information for the third quarter of the previous fiscal year is created in accordance with the reportable segments for the third quarter under review, external sales in the Industrial Business are ¥30,408 million, and external sales in “Other” business are ¥2,477 million. 4. Information Relating to Impairment Loss of Noncurrent Assets and Goodwill by
Reportable Segment
Material change in the goodwill amount In the Business Technologies Business, the shares of Charterhouse PM Limited were acquired and the
company was made into a subsidiary. Although it is a provisional amount as the allocation of expenditures to acquisition cost has not been completed, the increase in goodwill as a result of events during the first three quarters of the fiscal year under review was ¥7,415 million.
In addition, in the Industrial Business, the equity interest of Instrument Systems GmbH was acquired and the company was made into a subsidiary. Although it is a provisional amount as the allocation of expenditures to acquisition cost has not been completed, the increase in goodwill as a result of events during the first three quarters of the fiscal year under review was ¥3,819 million.