u . s . DEPARTMENT OF ENERGY DIVISION OF ENERGY STORAGE SYSTEMS
Grant No. EC-77-G-05-5570
By
C. J. HUANG
NOllC~ I I
j spemoccd 5y .h; Oldt~ Szaln C.~miwnt ~|ther she | United Ststn nor t~e United ~.atcs Dcl~ub-t~n¢ of | | EqeillY . nnc any Or ~ cmpb)~-es, a~ ~ or tSeLr |
I l?gldlltl' °s ~nlzY f~r me ~s~Y. ~mPl~'~n~s I I car Inel'ulllCU or llly lllloflmSllOll, IF'#IIIIlI~I~ FIQIIUCl Ol | | i~ocr~ dbclo~'~, m ~pr~enu ~ Is we woukl not |
WORKSHOP DIRECTOR
UNIVERSITY OF HOUSTON ENERGY INSTITUTE and
DEPARTMENT OF CHEMICAL ENGINEERING
p P
CONTENTS
Workshop Objectives
Workshop Overview
Workshop Summary and Recommendations
Future Supply and Demand of Energy and Hydrogen
Demand and Supply of Hydrogen for Oil Refining, Ammonia and Methanol Synthesis
Demand and Supply of Hydrogen for Small Consumers and Future Technology
Production of Hydrogen from Sources Other Than Oil and Natural Gas
Scenarios and Other Comments for Supplying Hydrogen as a Chemical Feed Stock
Appendix
I
I I
I I I
Steering Committee Membership
List of Workshop Participants
Paper by Dr. ]%hn J. McKetta: What is the Energy Picture . . Tomorrow?
• Today,
IV Paper by Dr. lames H. Swisher: Current At~dtudes Toward Hydrogen Energy Systems and Highlights of Recent Work in the United States and Abroad
V
VI
Paper by Dr. Calvin B. Cobb: Energy and Hydrogen in the United States Refinin9 industry
Tables and Figures by Mr. Hampton G. Corneil: Production Economics for Hydrogen Ammonia and Methanol During the 1980- 2000 Period
1
2
9
13
18
29
41
48
52
54
57
75
86
95
0 [3
VII
VIH
IX
X
XI
XII
XIII
XIV
XV
XVI
XVII
XVIII
Paper by Dr. Paul A. C. Cook: Comments on Methanol
Viewgraph Used by Mr. David Netzer: Production of Ammonia from Coal
Presentation of Mr. R. S. Watson: Use of Hydrogenation in the Edible Oil Industry
Viewgraphs Presented by Mr. David Owens: Hydrogen for Isocyanate Processes
Viewgraphs and Narrative Comments Presented by Mr. A. H. Levy: Hydrogen for Fuel Cells
Table Presented by Mr. R. Pa.rthasarathy: Hydrogen for Coal Liquefaction
Paper by Jim Michaels: Hydrogen Production via Kopper-Totzek Process
Paper by M. C. Goodman: Hydrogen and Carbon Monoxide from Coal by Winkler Press
Viewgraphs Used by Mr. L. J. Nuttalh Hydrogen by Water Electrolysis
Paper by Drs. K. E. Cox and M. G. Bowman: Thermochemical Production of Hydrogen from Water
Graphs Prepared by Mr. W. H. Stanton: Alternate Scenarios of Supplying Hydrogen
Memorandum by Dr. H. W. Prengle, Jr., Mr. W. H. Stanton, and Mr. J. E. Stevens: Projected Prices of Energy/Hydrogen Feedstocks
96
100
I01
107
I08
114
116
125
131
132
153
154
P P
ACKNOWLEDGMENT
With funding from ~he U.S. Department of Energy, Division of
Energy Storage System, and technical management by the NASA ~et
Propulsion Laboratory, the Workshop was conducted by the Energy
Institute and the Department of Chemical Engineering, both of the
University of Houston.
We wish to thank the following individuals who monitored and
assisted the director in conducting this workshop.
Dr. J. H. Swisher, DOE
Dr. Beverly Berger0 DOE
Mr. J. H. Kelley, JPL
Mr. Kenneth Tang, [[PL
The advice and suggestions from the Workshop Steering Commit-
tee and the Participants are gratefully acknowledged. The names of
the Steering Committee members and the participants listed in Appen-
dices I and If.
Workshop Director
0 P
WORKSHOP OBJECTIVES
As a chemical raw material, hydrogen is important to many
manufacturing processes in oil refining, petrochemical, agricultural
and other industries. In the past, the hydrogen needed for these
processes has been supplied mainly by cracking petroleum fractions or
natural gas. However, if the hydrogen for these processes could be
supplied from sources other than petroleum or natural gas, that much
of the latter could be "conserved".
With this objective in mind, a workshop was organized, assem-
bling those who are competent and interested in this subject, in order
to:
(i) Assess and predict the present and future demand and supply of hydrogen used as a chemical feed stock,
(2) Discuss and evaluate the available technology and economic feasibility of manufacturing hydrogen from sources other than oil or natural gas,
(3) Develop implementation scenarios and to formulate policy recommendations for obtaining chemical raw material hydro- gen from sources other than oil or natural gas.
-i-
p P
WORKSHOP OVER~,qEW
With a grant (Grant No. EC-77-G-05-5570) from the Department
of Energy, Division of Energy Storage Systems, the Workshop ori
"Supply and Demand of Hydrogen as Chemical Feed Stock" was con-
ducted by Energy Institute and College of Engineering of the Univer-
sity of Houston. It was held on the University's Central Campus,
December 12-14, 1977.
Mr. Ken Tang of NASA's yet Propulsion Laboratory, operated by
the California Institute of Technology, was the technical monitor of
the program.
The Steering Committee and other interested persons were in-
vited to the preliminary meetings of ~uly 7 and September 21-22,
1977, at which important topics for the workshop were screened and
the final technical program adopted. Names of persons who attended
these two preliminary meetings ae given in Appendix I. They also
acted as advisors to the workshop Director, recommending speakers
and participants for the Workshop.
The Technical Program consisting of the six following sessions,
was presented at the Workshop:
1. Future Supply and Demand of Energy and Hydrogen.
2. Demand and Supply of Hydrogen for Oil Refining, Ammonia and Methanol Synthesis.
3. Demand and Supply of Hydrogen for Small Consumers and Future Technology.
-2 -
P
4. Production of Hydrogen from Sou~'ces Other than Oil and Natural Gas.
5. Scenarios of Supplying Hydrogen Chemical Feed Stock.
6. Recommendation on Future Supply of Hydrogen as Chemical Peed Stock.
The presentations and discussions within each session are sum-
marized later in this report. The program brochure showing t/ties of
the presentations and speakers, and session chairpersons, is repro-
duced on pages 4-8 of this report.
Approximately 150 executives, energy policy and economic plan-
ners, feed stock manager, process and project engineers, and tech-
nical journal editors were invited to attend the Workshop. Fifty-six
specialists who attended the Workshop are representatives of the
following "Hydrogen-related" organizations:
Petroleum Refining 9
Chemical & Petrochemical 9
Small Hydrogen Consumers and Future Hydrogen Consumers 6
Hydrogen Technology 14
Government & Non-Profit Research Laboratories 7
Universities 9
Technical Journal Editors 2
Appendix II is a list of names and affiliations of the Workshop
participants.
-3-
p P
WORKSHOP OVERVIEW
With a grant (Grant No. EC-77-G-05-5570) from the Depar~nent
of Energy, Division of Energy Storage Systems, the Workshop off
"Supply and Demand of Hydrogen as Chemical Feed Stock" was con-
ducted by Energy Institute and College of Engineering of the Univer-
sity of Houston. It was held on the University's Central Campus,
December 12-14, 1977.
Mr. Ken Tang of NASA's Jet Propulsion Laboratory, operated by
the California Instit~tte of Tech~aology, was the technic~l monitor of
the program.
The Steering Committee and other interested persons were in-
vited to the preliminary meetings of Iuly 7 and September 21-22,
1977, at which important topics for the workshop were screened and
the final technical program adopted. Names of persons who attended
these two preliminary meetings ae given in Appendix I. They also
acted as advisors to the World, hop Director, recommending speakers
and participents for the ~orkshop.
The Technical Program consisting of the six following sessions,
was presented at the Workshop:
1. Future Supply and Demand of Energy and Hydrogen.
2. Demand and Supply of Hydrogen for Oil Refinhlg, Ammonia and Methanol Synthesis.
3. Demand and Supply of Hydrogen for Small Consumers and Future Technology.
- 2 -
D P
4. Production of Hydrogen from Sources Other than Oil and Natural Gas.
5. Scenarios of Supplying Hydrogen Chemical Feed Stock.
6. Recommendation on Future Supply of Hydrogen as Chemical Feed Stock.
The presentations and discussions within each session are sum-
marized later in this report. The program brochure showing titles of
the presentations and speakers, and session chairpersons, is repro-
duced on pages 4-8 of this report.
Approximately 150 executives, energy policy and economic plan-
ners, feed stock manager, process and project engineers, and tech-
nical journal editors were invited to attend the Workshop. Fifty-six
specialists who attended the Workshop are representatives of the
following "Hydrogen-related" organizations:
P~troleum Refining 9
Chemical & Petrochemical 9
Small Hydrogen Consumers and Future Hydrogen Consumers 6
Hydrogen Technology 14
Government & Non-Proflt Research Laboratories 7
Universities 9
Technical Journal F~ditors 2
Appendix II is a list of names and affiliations of the Workshop
participants.
-3-
p P
f.,,,i it,,,. I I L ; , i I ~ . 1 I f- , , | I~;., I I
H2H2H2H2H2H2 2H2H2H2H2H2H H i " l l I,f't_a !~'~a !,o'La
2H21 SUPPLY AND [JEHAND i!H2 H 2 H:I HYD::GEN il2 H 2H211 ,, l:H2 2 H H2 H~,,-.-.. ,,,.. 12 H
~IH2H2H2 H2H2H 2H H2 H2 2,ii..ol. , o , , o , SPOhtSORED BY:
H 2 L}. S. DEPARTPtE~I1 OF E::ERC'f
H 2H; I ooo ,: IIhlIVEI~SITY OF HDUqT~I~ ~:OLLEGE OF ENGII'~EERING
2H H2
F21H 2 2 . ~ `') a:~,~_H2H2H2H2H H2H2H2H2H2H2
OP.,ENING SESS,ION MONDAY MORNING
9:00 am Registration
9:30 Welcoming Remarks
C. J. Huang Workshop Director University of Houston
9=45 General Announcements
s~ssIo. 1 .~emz~Y MO~Z~,G
"~me ~pZy~Da,.cz~of E.er~ a.~Sydroge."
Session Chairman: John R. Howell Director, Energy Institute University of Houston
I0:00 Keynote Speaker:
10:45
John J. Mc/~etta E. P. Schoch Professor of Chemical Engineering University of Texas
General Discussion on Objectives and Key Issues of the Workshop
ii:30 Luncheon Speaker:
Calvin Cobb Pace Company Consultant & Engineers
,s~sszoa,,Z S0.~AY~TS~OON
"Dern~ ~ ~p~y of gg~,,ogen for GZ Refini~, Ammonia a~ Me#~a~noZ ~nt~Lesi8"
Session Chairman= J. H. Kelley Jet Prolsulsion Laboratory
1:30 pm Informal Presentation
~oduo~ionEaonomlos foP.B~dmoge.j Avvnonia~Me#bo~nol D ~ the 2980-2000Pe~od
Hampton G. Corneil Exxon Research and Engineering Co.
De,.a~ and ~VpZy of ~y~oge. for ~tha.o ~ 6~jnthesis
Paul A. Cook Celanese Chemical Company
p P
~'amonia~om Coal David Netzer Fluor Engineers and constructors
2:15
3:30
3:50
Group Discussion
Discussion of the past, present and future demands of Hydrogen in refining, a~noniaand methanol syntheses. Analysis of processes, the quantities of hydrogen demand and supply, and economic values of hydrogen for major processes.
Coffee Break
Group Disuussion (continued)
6 : 3 0
DINNER
Dinner Speaker
James H. Swisher U . S . Department of Energy
SESSION 3 TUESDAY MORNING
"De~e',~d and ~ p ~ y o f Syd_.-.oge. f o r ~ la l l Conatenea~s and Fu%uz, e TechnoZ.og'g"
Session Chaiman- James Graybill Air Produ¢ts, inc.
9 : O0 am informal Presentation
HHdrog~n for Edible Oil l~oeBsinH
R. S. Watson Anderson Clayton, Inc.
Bydz,ogen ~or Isoeyanate Pz, ooeesee
David Owens Mobay Chemical Corp°
C ~ z , en~; l~ethods o:f sydz, ogen Z~od~m~n for 5'raaZZ Coneun~re L° C. Bassett HoWe-Baker, Inc°
S~cL,,og~ 8oz' Zauel Ce~ls
A. H. Levy United Technology, Inc.
SHd~ogen for Coal r.iquefao~ion
R. Parthasarathy Hydrocarbon Reseazoh, Inc°
-6-
p P
1o=15
10=3o
Coffee Break
Group Disc~.ssion Discussion on supply and demand of hydrogen in food processitlg, steel, coal liquefaction, fuel cell, and future technologies.
12:00
=uN oa Luncheon
sEsszc~ 4 TU~SDAY~ERNOON
'~a~ocZ~tion o~ayd.t, o g ~ f z , om So.sees O~wThc.~ 0~ ur~ZNa-~.raZ Gas"
Session Chain~nan= H. William Prengle, Jr. University of Houston
1=30 9m
2:20 pm
Informal Presentation | w , ,
H~drogen by ~eotrolysi8 of Water
L. J. Nuttall General Electric Company
Httd.~gen Fz, om CoaZ C-asi f i ~ f ~ . o n
Jim Miohaels Koppers Co., I~.
~oehe.~ea~ i~oduntlo~ of Hydrogen Fz, om Water
Kenneth E. Cox LOS Alamos Scientific Laboratory
Hyc~ogen a ~ Carbon l~o~oxlde F~om Coal. 1~ Win~i~ez, Pz~ocess Mike Gooclman Da~n~ Power Gas Co.
Grou~ Discussion
Process analysis, economical evaluation of the processes. Primary energy sources for hy- drogen production include nuclear power, solar energy, coal, and hio-mass° Major processes to be discussed are coal gasification, and electrolysis, thermochemical decomposition of water.
0 P
3:30 p~ Coffee Break
3:50 Group Discussion (Continued)
6:30
DINNER
Dinner
SESSION 5 WEDNESDAY MORNING
"8oena~ios of SuppZyi.qBydrogen Ch~oaZ Feed Stoek"
Session Chairman: James E. Funk University of Kentucky
9:00 am Informal Presentation
9:30
10:45
llz00
Gene~u~ Basis for Est~ieh~ng a Beenario
Wally Stanton
Monsanto Chemical
Group Discussion
Establishment of alternative scenarios and their respective assumptions and limitations. Technical and economic feasibility of the proposed scenarios.
Coffee Break
Group Discussion (Continued)
12:15
LUNCHEON
Luncheon
SESSION 6 WEDNESDAY AFTEP/~00N
"Reeovvverala%ion on ~tu~e ~PPEH of //y~og~ as Chem~eaZ Feed Stock"
Session Chairman: James E. Funk University of Kentucky
2:00 pm General Discussion
Comparison and evaluation of alternative scenarios. Imple- mentation mechanism and time schedule. Legal and social bene- fit considerations. Recommendations.
-8 -
o P
SUMMARY AND RECOMMENDATION
The discussions during the three-day workshop culminated in the
adoption of the following summary statements during the last session:
.
.
T h e r e a r e no compeJling economic r e a s o n s fo r chemica l i n d u s t r y u s e r s o f h y d r o g e n t o u s e o t h e r t h a n n a t u r a l g a s and oil as s o u r c e s o f hydroflfen a t t h e p r e s e n t t ime.
Financial incentives would have to be provided by the Government for industry to consider installing plants which produce hydrogen from coal or water electrolysis in the next several years.
. Natural gas curtailments are worrisome, but the impact to dat___ee has been of critical importance only in certain regiona-I areas. The prospect of future curtailment is of great concern to the industry.
. At t h e p r e s e n t , t h e r e is more i n t e r e s t in ob t a in ing h y d r o - gen b y coal g a s i f i c a t i o n when n e w s o u r c e s o f h y d r o g e n m u s t be f o u n d t h a n b y e l e c t r o l y s i s o f w a t e r , e x c e p t f o r small u s e r a p p l i c a t i o n s .
. It is likely that the development of high-pressure (~450 psi) coal gasification processes for hydrogen will be technically successful. Development requires continued Governmental support.
. The chemical industry feels that the Government should continue to fund research and development of new tech- nology for electrolytic and thermochemical hydrogen produc- tion from water to meet long-term needs, short of prototype demonstration plants.
. Production and distribution of syngas (CO+H2) by coal gasification is an option worth being considered for indus- trial users of hydrogen and gaseous fuel.
. New pipelines may be needed to distribute coal gasification products (H2 or syngas). Technology is available to dis- tribute these products at moderate pressures. It is recom- mended that the distribution at high pressures (greater than 2000 psi) should be studied to determine the extent of problems and their respective solutions. (It is expected
-9-
0 0
that American Petroleum Institute will publish design proce- dures for hydrogen pipelines in the Spring of 1978.)
The discusson during Sessions 5 and 6 was directed to determine
the industry's views, as represented by the workshop participants,
on what research and development should be supported by the Gov-
ernment and where and what kind of financial incentives would be
required for commercial demonstration.
The responses may be surnnmrized in Table I. Neither R&D nor
financial incentives are required for reforming refinery gases or
methane since these are well-known technologies. Heavy petroleum
(residuum) partial oxidation is also well-known, although it is prac-
ticed more extensively outside than ~thin the U.S.
Both R&D and financial incentives for commercialization are
required for processes to produce hydrogen from coal or bio-mass.
The next step in coal gasification is the development of high-pressure
(300-500 psi) gasifiers. A few companies are involved in such a
development and Exxon projects that high-pressure gasifiers will be
available by 1982. The most strongly and emphatically preferred
financial incentive for commercialization of new energy conversion
processes was decontrol of prices by the Government. This was a
general position, not limited to hydrogen production processes. The
next best financial incentive involved either investment credits or
accelerated write-off. The other techniques were generally held not
to be very attractive.
-10-
Research and development on water electrolysis and thermocheml-
cal processes should continue to be funded by the Government, but
the time has not yet come to consider the commercialization of ~ermo-
chemical processes.
A strong feeling was expressed that the results of this workshop
s h o u l d b e made avaiLable to t h e p r o p e r pa r t i e s so t h a t t h e chemical
i n d u s t r y will h a v e a s t r o n g i n p u t to f u t u r e dec i s ions on t h e s e mat-
t e r s .
-_I.1.=
P p
T a b l e 1
Chemical Industry view of R&D and Financial Incentives Required to Bring Various Hydrogen
Production Processes into the Marketplace
Refinery Gases
Methane Reforming
Heavy Petroleum Liquids
Coal Gasification
Bio-~lass (Including Water)
Water Electrolysis
Thermochemical Processes
0
(I) Choices are in the following order:
R & D Funding Financial Incentives from the Government from the Government
Required Required
No No
No No
No No
Yes (Slmgas) Yes (1)
Yes Yes
Yes Yes(l) (3)
y C2.)
1. Decontrol (by far the most preferable and strongly recom- mended).
2. Investment Tax Credit or Accelerated Write-Off.
3. Loan Guarantees.
4. Government-Owned and Contractor-Operated.
5. Take-or-Pay Contract.
6. Cost Sharing.
(2) Not yet ready for. commercial demonstration.
(3) For small-.user applications.
-12-
p 0
FUTURE SUPPLY AND DEMAND OF
ENERGY AND HYDROGEN
- Session i and Banquet~,
The product ion and s u p p l y of h y d r o g e n is d i r e c t l y re la ted to the
s u p p l y and demand of e n e r g y . In p rac t i ce , all t h e c u r r e n t h y d r o g e n
demand is met b y e x t r a c t i n g It from nat~ra l gas o r pet roleum f r a c -
t ions . Furthermore, a hydrogen manufacturing process requires a
significant amount of energy. Therefore, it is only natural that the
discussion of hydrogen supply and demand be undertaken with the
full knowledge of its interrelationship with the total energy picture.
In view of the above, at the outset of the workshop, Dr. John 3.
McKet~ca, E.P. Schoch Professor of Chemical Engineering at the
University of Texas, was asked to discuss the overall energy picture.
Provessor McKetta is a world-renowned authority on the subject and
was chairman of the National Energy Policy Committee. In his key-
note speech, Professor McKetta covered a wide range of the following
important subjects and brought the partlclpanm up to date on the
major vectors of the energy supply and demand.
Imported Energy
Increased Use of Coal
Nuclear Energy
Environmental Requirements
Present and Future Energy Pictures
* Sess ion Chairman: John R. Howell Un ive r s i t y of Rouston
i -_13-
p P
Problems and Means to Achieve Energy Self-Sufficiency
Professor McKettats original paper is included as Appendix Ill in this
report. A few significant points are summarized here. Professor
McKetta stressed the fact that while the domestic production of crude
oil and natural-gas-liquid (NGL) has declined in recent years, its
consumption has increased substantially. In order to show this
trend, he cited the data on the same day for two different years.
On February 1, 1973 the domestic production of crude oil and NGL
was about 11 million barrels a day, but 4 years later, on February 1,
1977, its production was decreased by 7.94 to about 9.6 million bar-
rels. ~'his is not an average. It is a comparison between the same
day, four years apart. On an average, it was about 14~ less in 1977
than in 1973. On that same day, the import of crude and products in
1973 was about 5.9 million barrels a day but in 1977 it jtu~ped by
75.6~ to the tune of 10.3 million barrels a day. On February I, 1977
cur import was equivalent to 514 of the total liquid hydrocarbon con-
sumed, but the average over the years was about 46-474. The cost
of import for 1973 was approximately 6.0 billion dollars, at an average
price of $2.80/barrel, but it was increased in 1977 to approximately
50.7 billion dollars at an average price of $13.0/barrel.
In the future, this average price of $13.01barrel will be in-
creased substantially because the product percentage of the total
import will undoubtedly be raised. Everyone can appreciate the great
-I~I-
P 0
strain on our economy to pay 50 or more billion dollars every year for
the imported crude and products. Obviously, we cannot continue
producing-less -but-consuming-more.
Another point emphasized by Professor McKetta is that energy
conservation along will not solve our energy problem. More produc-
tion of all the important vectors of energy should be encouraged by
government policy, legislations, and public support. Of course,
appropriate safeguards should be provided to protect the public
safety and welfare and to maintain the environmental qualYcy. The
audience was reminded that i t usually takes several years to develop
and construct an energy production facility, whether it be a nuclear
power plant or a new coal mine. Therefore, a lack of a national
energy policy prolongs the difficult period of unsolved energy prob-
lems.
On the evening of December 12, 1977, the workshop banquet was
held and the speaker, Dr. lames H. Swisher, discussed the status of
the current work related to hydrogen energy. Dr. Swisher is Assis-
tant Director of the Division of Energy Storage Systems, Department
of Energy, and also Chairman of the DOE Hydrogen Energy Coordinat-
ing Committee which coordinates the hydrogen-related programs within
the Department of Energy. Dr. Swisher gave an excellent and con-
cise presentation of changing attitudes and research efforts on hydro-
gen energy systems in the United States and in other countries. His
paper is included in this report as Appendix IV. In his talk, Dr.
-15-
0 P
Swisher traced the recent history of hydrogen-related programs back
to early 1970 when hydrogen was proposed as a lmiversal fuel. He
observed that there are currently two types of research and develop-
ment activities. In one, hardware is being developed for near term
applications of rather specific nature. In the other, bench-scale
research and exploratory work are undertaken to find significantly
better processes, devices, and materials for hydrogen energy sys-
tems. I t makes good sense to have these two types of research and
development work progress concurrently.
Dr. Swisher cited different approaches and emphases which have
been taken by the United States and other countries, depending on
the availability of energy resources. There is an International Ener-
gy Agency agreement on exchange of R & D results of hydrogen
production from water. In the Unit~. States, thirteen divisions of
the Department of Energy sponsor R & D related to hydro~.n energy
systems. The total fund of 24.3 million dollars in Fiscal year i977
was spent by the Energy Research and Development Ad~n'nistration
for sponsoring R & D in hydrogen production, storage, materials and
basic research, and others. The strategy is to place emphasis on
projects which may lead to commercialization in the 1980's, even if the
~otal impact in reducing oil and natural gas consumption is modest.
From now until the year 2000, the use of hydrogen, produced
from water or coal, as chemical feed stock has the greatest and most
attractive potential for reducing oil and natural gas consumption.
-16-
P P
Therefore, Dr. Swisher urged the participants to include the follow-
Ing subjects for discussion during the workshop:
(I) For what specific apptications, use rates, and geographical locations does it make more sense to produce hydrogen from water r a the r than from coal?
(2) What are the research and development needs for hydrogen storage, compression0 and distribution technology?
(3) How do these research and development needs change with outlet pressure of the hydrogen production process?
Dr. Swisher concluded that with recognition of the potential
hydrogen has as a clean-burning fuel and w i ~ financial incentives to
accelerate development and commercialization, the hydrogen program
in the Department of Energy could take a quanL~un jump in priority
and emphasis.
--17-
n P
0 P
DEMAND AND SUPPLY OF HYDROGEN FOR
OIL REFINING, AMMONIA AND METI~_ ,NOL SYNTHES!,S
- Session 2 and Luncheon*
As the luncheon speaker, Dr. Calvin B. Cobb, Vice-President,
Engineering Serv/ces of The Pace Company Consultants & Engineers,
Inc. , discussed "Energy and Hydrogen in the U.S. Refining Indus-
t ry. , ' His presentation covered the following subjects and the paper
is included in this report as Al~pendix V.
Energy to 2000:
The Pace Forecasting System
Outlook for the Economy
Energy Demand/Supply
World Crude Oil Supply
The "Energy Crisis"
Hydrogen in the United States Refining Industry:
Industry Supply/Demand
Effects on Individual Refineries
The Pace Forecasting System is a computer system consisting of seven
oils, and certain animal-derived oils are hydrogenated for preserva-
tion and to provide desirable attributes of stability, consistency, and
uniformity. Hydrogenation is the largest single chemical reaction in
the edible oil industry. The reaction is extremely complex but for
our purpose here, may be considered as a very simple addition of
hydrogen to the ethylenic linkage. It is accomplished in the presence
of a catalyst, normally nickel, at minimal pressure and a temperature
of 325 to 400°F.
For the approximately 9 billion lb /yr of oils that are hydroge-
nated, the estimated hydrogen requirement is 5.85 billion CF/yr.
Practically all this demand is met by on-site natural gas reformers
(propane backup). A typical hydrogen generating plant produces
10,000 to 40,000 CF/hr and as a replacement value of $1.2 million.
Most were installed between 1940 and 1970.
* Session Chairman: Jame.~ Orayb£11 A i r P r o d u c ~ s . I n c .
-~.q-
P P
Hydrogen production accounts for about 15% of the typical
plant 's energy requirements. No carbon oxides or sulfur can be left
in the processing hydrogen, as this would poison the hydrogenation
catalysts. I t requires a pur i ty of 99.9% plus. The newer molecular
sieve systems are favored over the MEA process for removal of the
contaminant gases.
Interestingly, even in view of the high purity requirement and a
relatively low sensitivity to hydrogen cost of the hydrogenation pro-
cess, to Mr. Watson~s knowledge, no U.S. manufacturers employ
electrolyzers. He noted thr" _~lectrolysis is used in Brazil and other
South American countries and, in the long run, may be a replacement
to the hydrocarbon reforming processes.
Mr. Watson stated that hydrogen demand will be rather stable in
the oil hydrogenation industry, despite normal production growth.
The difference is accounted for by a reduced specific usage (CF/Ib)
because of the increasing stress on less-saturated products, the
polyunsaturates.
In response to a question on the impact of natural gas cur',nil-
ments on the industry during the last winter, Mr. Watson said that
the Midwest locations had been significantly affected, with Illinois
sites experiencing as much as a 40~ cutback. Although the industry
has not been seriously affected, the scarcity of natural gas in the
years ahead is of considerable concern.
-30-
D P
• °
As an example of hydrogen ' s role in ,.he general area of the
chemicals and plastics industr ies , 1~. David Owens of Mobay Chemical
C~rporation addressed the workshop on the subject of isocyanate
manufacture. The viewgraphs used in the presentation are repro-
duced as Appendix X in this report.
Isocyanates, in combination with polyethers, are the primary raw
materials for the manufacture of polyurethane products. The isocya-
nate field is dominated by two compounds:
A. Toluene Diisocyanate (TDI) is the first isocyanate to be commercialized and is still the leader in volume. Its pri- mary application is in the manufacture of flexible foams for end uses such as furniture, bedding and carpet underlay.
B. Diphenylmethane Diisocyanate (MDI) is the other major isocyanate compound and is used to produce rigid foams. With the current emphasis on energy conservation, the demand, for rigid foam insulation in buildings, process plants, and appllances is contributing to a high gro~th rate in demand.
The basic chemical reactions for production of TDI (Figure I of
Appendix X) illustrate the role of H2 and CO in this field. Toluene
is nl~crated to DNT, which in turn is reacted with H~ to form toluene
diamine (TDA). TDA is then reacted with phosgene, produced from
CO and chlor/ne, to form TDI. The basic chemistry for MDI, which
uses benzene as a starting material, is similar. In both cases, the
molar ratio of Hs to CO required to produce the end product is 3 to
l--the same H21CO ratio obtained by steam reforming of natural gas.
Figure II (in Appendix X) is a block diagram which illustrates a
typical integrated plant complex for the production of TDI. It can be
k ̧ - 3 ! -
0 P
seen from inspection of the diagram that a reliable, continuous supply
of CO and Hs, therefore natural gas is critical to the success of the
operation.
An estimate of the H2 and CO required to produce the total
isocyanate quantity manufactured in the U.S. in 1976 is shown in
Figure III. A rough projection for 1980 is indicated below the 1976
figures. If all CO and H2 is produced from natural gas, the 1980
requirements equate to about 27 MM SCFD of natural gas. This does
not include the hydrogen needed to produce ammonia feedstock, which
would add another 60% to the overall hydrogen requirement. Because
of their central position in the production scheme, reliability of CO
and H2 supply have largely overshadowed cost implication until recent
years. As a major products approac.h maturity with the attendant
pressure on profit margins, the cost of H 2 and CO is becoming an
equally important factor. Rapidly increasing natural gas prices,
coupled with declining availability, make the situation more serious.
Combined Ms and CO costs now fall in the range of 7-11°6 of TDI
manufacturing cost and 5-8% of MDI manufacturing cost, making CO
and H2 one of the major cost contributors.
Some of the possibilities for reducing or eliminating the depen-
dence on natural gas for H2 and CO supply are listed below:
A. Alternate reformer feed stock/fuels
B. Producton of synthesis gas by coal gasification
C. CO generation from coke
D. H~ recovery from electrolysis of by-product HCI
New processes for both TDI and ~.~I, which eliminate the hy-
drogenation step (but not the need for CO), have been announced
but could be several years away from possible commercialization.
Therefore, the effect of H~ requirements cannot be accurately gauged
at this time. In any case, the large existing capacity based on
hydrogenationlphosgenation technology will mandate a steadily in-
creasing requirement for H2 and CO for the foreseeable future.
Regarding the impact of gas curtailments, Owens said plants in
certain areas were severely affected last 3anuary and February. In
West Virginia, for example, steam generators were converted from gas
to oil. Some companies began drilling, with limited success, for their
own gas. Also, coal-gasification-produced synthesis gas is now being
given serious "attention.
Mr.' L.. Carl Bassett of Howe-Baker, Inc., discussed current
technology of producing hydrogen for small consumers of about
1,000,000 SCFD. The most common method is steam-hydrocarbon
reforming follow~d by shift conversion and hydrogen purification.
Technology in reforming and hydrogen purification has advanced to
the state that hydrogen purity of 99.999+4 is possible with fixed bed
adsorption. I t can meet the requi~rements of liquid hydrogen users .
The minimum size reforming plant from a capital investment standpoint
is approximately 120,000 SCFD.
-33-
P P
Other processes available for hydrogen production are electro-
lytic and partial oxidation. Liquid hydrogen production is an exten-
sion of the above processes.
Hydrogen is also available to small consumers as an off gases
from several chemical and refinery sources either to be taken as pure
hydrogen or recovered from high hydrogen content streams.
Mr. Bassett presented the following comparison of the energy
requirements of the various methods of hydrogen production:
Method for Energy Req't H2 Production BTU/SCF H 2 Basis
Steam-Hydrocarbon Reforming
Electrolytic
500 Feed & Fuel (NG, LPG, Naphtha)
1,593 140 KWHII000 SCF-30% efficiency
636 Feed - Fuel (#6 oil)
788 Reforming plus power req't.
274 Compression co 200 psig
274 Compression to 200 psig
Partial Oxidation
Liquid Hydrogen
Chlorine Cell Off Gas
Ethylene Plant Off Gas
The technological advance in the future may affect in a dramat~.c
way the picture of hydrogen supply demand. For example, using a
and producing 100,000 BPSD of all distillate synthet ic crude will re-
quire up to 635 MM scfd of hydrogen feedstock. An additional 100
MM scfd is estimated to be required in re f inery type processing to
produce marketable No. 2 fuel oil and high octane materials.
A two-year observation program has been scheduled for the
H-CoalO Pilot Plant, beginning the last quarter of 1978. Extensive
economic studies for commercial plants are under way. Design of
commercial coal liquefaction facilities can be commenced now and the
analyses of the prototype plant operation and the economic studies are
expected to confirm the optimization of these designs. The first
commercial plant could be expected to go on stream around 1985.
-38-
p o
• : : . . . . . . . . . . :.,.....
Given the current activity in development of coal liquefaction pro-
cesses, a number of processes will reach commercialization potential in
the eighties. Assuming current predictions of world energy pres-
sures and in the right socio-political atmosphere, a number of coal
liquefaction plants will probably be operating on a commercial scale by
the turn of the century.
A number of energy forecasts have been made (see: R . E .
Balshizer, "Energy Options to the Year 2000", Chem. Engineering,
~anuary 3, 1977), projecting energy consumption by the year 2000,
ranging from 100 Quads (1 Quad=10 is BTU) annually for zero energy
growth to 170 Quads annually for a growth rate of about 3%. (Over
the last 30 years energy consumption in the U.S. has been increasing
at 2.9% annually and at 4.1% for the years 1960-1973).
Assuming an ordered growth and allowing for conservation and
environmental needs, the demand in 2000 will probably he around 150
quads. Assuming domestic oil and gas reserves will provide 50
Quads, 100 Quads will have to be provided by imported energy and
coal and nuclear fuels. Allowing for 11 Quads of imported oil (5 I~4
B/D) and all the power generation recp~irements of 75 Q to be pro-
vided by nuclear sources and direct coal firing, leaves a deficit of
14 Q. If 7 Quads are provided by direct coal firing in the industrial
section, synthetic fuels will have to provide 7 Quads. Assuming
equal markets for gases and liquids derived from coal, coal liquids
will provide 3.5 Quads representing 1.6 MM barrels of oil daily. This
w{ll translate to a hydrogen demand of 11.8 x 10 9 SCFD, to provide
gasoline and home heating oil by coal liquefaction.
These projections were predicated on no special measures being
taken for the development of synthet}c fuels. Alternate scenarios are
possible. A government poUcy decision to actively encourage syn-
thetic fuels and eliminate oil imports could ra~ult in a crash program
of building synthet ic oil plants. I t is anticipated that up to 1 MM
B/D coal liquefaction capacity can be added annually start ing in 1985,
the base assumed above for the f i rs t plant to be in operation. This
would mean an incremental hydrogen demand of 7.35 x 10⁹ SCFD
annually, commencing in 1985.
- 4 0 -
P 0
PRODUCTION OF HYDROGEN FROM SOURCES
OTHER THAN OIL AND NATURAL GA~
- Session 4"-
Among the several industrially deployed "first generation" sys-
tems that gasify coal to produce hydrogen and H2/CO synthesis gas
are the Koppers-Totzek and Winkler processes. These two processes
were reviewed and discussed by Mr. yim Michaels of Koppers Com-
pany, Inc. and Mr. M. C. Goodman of Davy Powergas, Inc., respec-
tively.
As pointed out by Mr. Michaels, the production of hydrogen
from indigenous coal supplies via coal gasification technology offers
many advantages, particularly regarding the reliability of supply and
the predictability of cost. He described the Koppers-Totzek process
as a mature technology and has been used commercially since 1952.
Thirteen plants containing a total of 39 gasifiers have been con-
structed primarily in areas of the world that are deficient in oil and
gas supplies but have ample coal supplies.
The outline and process flow diagram of the Koppers-Tot.zek
process were presented by Mr. M/chaels and included in Appendix
XIII of this report. Only the important production economic data are
summarized here. Mr. Michaels' study showed flint the estimated
capital cost for a Koppers-Totzek based hydrogen plant producing 150
million standard cubic feet per day (SFD) of 96~ puri ty hydrogen at a
* Session Chair.-mn: H. Nilllam Prengle, J r . U n i v e r s i t y o£ Houston
0 P
pressure of 500 psig is $200 million (fourth q u a r t e r - 1977). The
plant is comprised of four four-headed K-T gasifiers which produce a
synthesis gas rich in carbon monoxide and hydrogen which is then
further processed to yield a gas containing 96% (volume) hydrogen.
The feedstock of the plant (mid-continent location) is an Illinois
bituminous coal containing 3.44 sulfur at the feed rate of 3000 tons
per day. The plant is not completely self-sus~ining in the present
design since electrical power must be brought to the battery limits.
The plant consumes approximately 2400 gallons/minute of raw water,
but no operating costs are charged for water since power facilities
are included for supplying and treating raw water.
When coal is available at $201ton ($0.901milUon Btu), the annual
operating costs are estimated to be $2.751million Btu, or $0.901thou-
sand cubic feet (MSCF) of hydrogen produced. A discounted cash
flow rate of return method was used to compute constant (level)
product costs over the twenty-year life of the project such that
sufficient revenues were generated to cover operating costs, debt
service (interest plus principal), income taxes, and the return of
equity capital to satisfy a given discounted cash flow rate of return.
Assum'mg that financing consisting of 604 debt and 404 equity
can be arranged, the cost of hydrogen is $4.50/million Btu or $1.45/
MSCF. These costs assume a 124 discounted cash flow rate of return
(DCFRR) on equity. Of the $4.50 about $3.50 is allocated to synthe-
sis gas production, and the remaining $1.00 to CO shift, purification
and compression.
-42 -
O P
P D
blichaels said that although this cost is not currently competitive
with hydrogen manufactured by the stream reforming of regulated
natural gas, it may become competiti~a in the near future due to a
variety of possible political and economic circumstances.
According to Mr. M. C. Goodman, the earliest commercial-scale
plant adopting the Winkler process was built in 1928 in Germany. It
operated successfully until 1970 at the rate of 3.730 million SCFH for
each of 5 generators. Since then, 21 more plants were built and
have been in operation in Germany, Japan, U.S.S.R., India, Turkey
and other European countries. Lignite, sub-bituminous, or other
coking coals may also be used as a feed. Basically, it is a fluidized
bed gasification process operating at low pressure with oxygen or air
to produce a medium Btu or low Btu ir~dustrial gas. The typical raw
gas from the Winkler process contains 35.2~46.0 volume percent of Hs
and 30.8- 48.1 percent CO. A process including CO shift, CO2
removal and methanation will yield a gas mixture containing 94.8~ of
hydrogen. It is possible to get an even higher purity. Mr. Goodman
stated that the cost of medium Btu gas via the Winkler process is
within the range of $2.76 to $3.351million Btu. In terms of CO + H2
this represents $1.00 to $1.22/MSCF (CO + H2). Mr. Goodman
stressed that for chemical feed stock purposes, CO + Hs synthesis
gas should be directly produced from coal rather than going through
the route of CH4 (SNG). He advocated the embracing of the devel-
oped processes to create an industry and expertise which world act
-43-
p 0
0 0
as a springboard for research and development based upon the knowl-
edge gained by the successful operation of these processes, rather
than expanding funds for new research and development in completely
novel coal gasification processes which, by their very nature, will
have a poor record of operability. The presentation of Mr. Goodman
is included in this report as Appendix XIV.
Water electrolysis is an alternate process of manufacturing hy-
drogen from non=hydrocarbon sources. Mr. L. N. Nuttall of General
Electric Company reported on its program to develop an efficient,
economic, large-scale water electrolysis system using the solid polymer
electrolyte cell technology. His process description consists of the
following subjects:
Historical Background
Development Program
Current Status
Cost Reduction Program
Improved Efficiency
Cell Scale-Up
Developmental Schedule
Mr. Nu~all also showed how water electrolysis would compare
with stream reforming of natural gas as a source of hydrogen for
chemical and industrial applications. Three d~erent size plants were
considered, which covers a range of possible applications. A large
plant of 100 million SCF/day capacity (387 MW) which might be appro-
priate for ammonia or methanol production, an intermediate size plant
-44-
P P
of 480 KSCF/day (1.9 MW) which might represent a food processing
or metal processing application and a small plant of 96 KSCF/day (370
KW) which might be suitable for some of the glass or lamp manufac-
turing operations.
The capital cost used for the electrolysis plants was based on an
estimated curve shown in Figure 1. The figures used in Mr. NuttaIPs
presentation were reproduced as Appendix XV. The capital costs
used for the steam reformer were taken from the table on page 59 of
the Exxon Research and Engineering Co. Report No. BNL-50663
(Reference: Mr. CornsiPs presentation in Session 2). Two different
projections for the future cost of electrical power and natural gas
were considered, as ~ in Figure 2. The solid lines represent a
projection made by some components of the General Electric Company
and the dashed llne the projection reported in the above Exxon re-
port.
The resulting hydrogen cost comparison for the large plant is
shown in Figure 3. It does not appear, from these data, that elec-
trolysis will be competitive with reforming of natural gas as a source
of hydrogen, at least before the year 2000, except in instances where
lower cost electrical power is available. However, if there is a real
concern about the future availability of natural gas, a study made by
T. D. Donakowski and W. 7. D. Escher of the Institute of Gas Tech-
nology showed that considerable economies could be made by using a
dedicated nuclear power plant to provide electric power for a large
145-
p D
P P
water electrolysis plant. This could make electrolytic hydrogen
competitive with steam reforming of natural gas, even for these larger
users of hydrogen.
For the intermediate size p.~ant0 the cost of hydrogen from water
electrolysis would be almost competitive with the steam reforming, as
shown in Figure 4, and would become more economical starting around
1990. For the small plant, as shown in Figure 5, electrolytic hydro-
gen will be the most economical from the outset. It will also be more
economical than purchased liquid or high pressure gaseous hydrogen,
as shown in Figure 6.
Mr. NuttaU also presented the estimated data of annual hydrogen
usage within the component departments of General Electric Company.
These various GE departments my be typical of the smaller industrial
users of hydrogen.
As fossil energy becomes inadequate, large-scale hydrogen
production must utilize other energy sources such as nuclear fission,
fusion and/or solar energy for decomposition of water by electrolysis;
or by thermochemical cycles, and perhaps, by hybrid combinations of
these methods. Dr. K. E. Cox reviewed the research and develop-
ment status of therL~ochemical production of hydrogen from water. As
pointed out by Dr. Cox, it has been widely recognized that the
thermochemical methods are potentially more efficient and less expen-
sive than the overall electrolysis processes. Although a large number
-46-
D 0
P .,. . :..;.~.j ~.;:.
of thermochemical cycles have been conceived, many have published
without experimental verification of the reactions in the cycle. As a
result of this, most evaluations and/or comparisons of thermochemical
processes for process efficiency or cost have been based on assumed
data or on reaction conditions that have not actuolly been achieved.
Nevertheless, several cycles have now been published where all of the
reactions have been demonstrated experimentally. As a consequence,
the development of methods for engineering and cost analyses for this
new technology can be based on the actual chemisU'y involved in
demonstrated cycles.
As examples, Dr. Cox described two thermochemical methods, the
sulfuric acid-hybrid cycle and the sulfuric acid-hydrogen iodide
cycle. Energy sources for thermochemical processes such as nuclear
energy and solar energy were also discussed.
The cost estimates for a thermochemical process is usually ob-
tained and often made on a set of assumptions and uncertain condi-
tions. Therefore, it is difficult to determine whether a particular
cost estimate is opl~is t ic or pessimistic. Dr. Cox summarized the
cost estimates made for the sulfurk: acid-hybrid and thermochemical
sulfuric acid-hydrogen iodide cycle. They are in the range of $5.27-
$7.18 per GJ in the 1975-76 dollars. The data are included in Ap-
pendix XVI of this report which is the paper prepared for this work-
shop by Drs. K. E. Cox and M. G. Bowman.
A4"y
o p
SCENARIOS AND OTHER COMMENTS
ON SUPPLYING HYDROGEN CHEMICAL FEED STOCK
- Session 5*-
At the present time, almost all hydrogen in Petroleum refining is
by-product from catalytic reforming and almost all hydrogen used in
chemical production is from reforming natural gas.
Between now and the year 2000, the uses of hydrogen will
increase in petroleum refining and as a chemical feedstock. A s tudy
has been made of what might happen during this period and the
results are presented in the Exxon-Brookhaven Report (Reference:
Mr. Corneil's presentation in Session 2). Mr. W. H. Stanton of the
Monsanto Co. summarized the results in the following four figures and
one table.
Figure 1 - - Raw lvlaterial Costs vs Time
Figure 2 m Total U.S. Energy Demand vs Time
Table 1 - - Hydrogen Demand vs Time
Figure 3 - - Processes for Hydrogen Production
Figure 4 - - Economics of Hydrogen Production
Raw materials are presented in 1980 and in the year 2000. For
the year 2000 the costs are reported in equivalent "1980" dollars and
also in "2000" dollars (based on a 5% annual il~*lation rate) .
Total U.S. energy demand is reported £u quads/yr . For 1974
actual demand was 76.8 quads-- i t is predicted that this will grow to
X* Session Chairman: James E. Funk Univers i ty o f Kentucky
- 4 R -
0 0
P 0
• . . . . . . . . ° . . - .
140.7 quads irt 2000. The expected growth is dependent on a large
increase in imported oil and in nuclear energy.
The energy required to produce hydrogen is 1.7~ of the total
U.S. demand in 1974 growing to 2.84 in 2000. The hydrogen pro-
duced as used in petroleum ref ining, ammonia production, methanol
production and others as summarized in Table 1.
Processes for hydrogen production include: Steam reforming of
methane, partial oxidation of res id , KT coal gasification, new coal
gasification and SPE Electrolysis. The most economical process in
1980 is steam reforming of methane. The most economical process in
2000 is still steam reforming o~ methane. The new coal gasification
economics are a close second both years . New coal gasification is
being developed but still unproven. Perhaps it will be demonstrated
on a large-scale in the early 1980ts.
In order to calculate certain process economics, principally
operating costs on the various processe.~ for manufacturing hydrogen,
it was desirable for the part ic ipants to have some projections on
prices of energy/hydrogen feed stocks. Dr. H. W. Prengle, J r . of
the Univers i ty of Houston, ..~r. W. H. Stanton of Monsanto Company,
and Mr. 7. E. Stevens of Air Products prepared the information on
shor t notice, which was dis t r ibuted to the participants as guidelines
for the workshop discussion. The information is included in this
report as Appendix XVII.
p P
Many other scenarios can be imagined for the future energy/
hydrogen supply and demana. To provide the starting points for the
workshop discussion, the following three were suggested, but there
was no time available for the participants to discuss them in depth.
1. Gradual Decline
.
We continue as we have since 1974, each year we import more and more oil with prices rapidly rising as they have since the embargo. Our standard of living starts dropping--we cut back --the more we cut back the worse business becomes. We settle into a prolonged depression--after many years we get some leadership and start to rebuild with what we have--coal, nu- clear, solar, etc. By the year 2000 we work our way back to the standard of living of the 1960ts.
Gradual Rise to New Heights
We continue as we have since 1974; each year we import more and more oil. The oil is made available and at reasonable prices as there is a split in the OPEC groups and competition keeps prices down. Large world discoveries of oil and gas are found --we continue on our energy binge thru 2000--no problems. In the meantime, technical advances make fission the source of unlimited future energy.
. Sudden Abrupt Upheaval
We continue as we have since 1974, each year we import more and more oil with prices rapidly rising. It gets so only the very rich can afford heat, gasoline, air conditioning. The poor turn more and more to get t ing what they want by violent acts - -before it 's over we have civil uprising and a dictator form of government results. From then on, it 's close to the s tandard of l i~ng of Communist countries.
As par t of many inputs to the planning of future R & D pro-
grams, the workshop participants were asked to consider, among
others , the following questions:
D P
D p
1) What technological developments could have a significant impact in reducing hydrogen manufacturing costs?
2) What technological developments could have a significant impact in reducing hydrogen demand?
A lively discussion, to the extent it spilled over to Session 6,
yielded many interesting comments and useful recommendations:
Governmental work creased emphasis. SNG R & D).
on Hz production from coal needs in- (However, this was not the feeling for
Investment Tax Credits or accelerated depreciation are desirable incentives; loan guarantees often draw the gov- ernment into poor projects. Matching funds are similar to tax credits.
Decontrol of energy prices would be the fastest incentive. This point was unanimously agreed to and expressed throughout the workshop. It was further recommended that it "should be a national objective to get the government out of the energy business" except for energy R & D.
It was suggested that a disincentive (tax) be placed on the use of natural gas for heat rather 1_han as a chemical feed- stock. And it was also noted that decontrol would accom- plish these objectives without a special program.
Uncertainty of government policies is a deterrent to indus- try actions toward developing new technologies.
It was generally indicated that the workshop was helpful to the part icipants for information flow. Some suggested tha t it be repeated next year and/or annually.
D 0
0 0
APPENDIX I
Lis t of Par t ic ipan ts in Steering Commttee and Preliminary Meetings
~uly 7, and September 21-22, 1977
J e f f r e y Anderson Koppers Company, Inc . P i t t s b u r g h , Pennsylvania
Bever ly Berger~ Department o f Energy Washington, D.C.
J. W. Bowles Howe and Baker T y l e r , Texas
A. E. Cover Pullman-Kellogg Company Houston, Texas
Jim Graybi l l Air Products and Chemicals , Inc . Allentown, Pennsulvania
Harold Hoffman Hydrocarbon Process ing Houston, Texas
John R. Howell U n i v e r s i t y o f Houston Houston, Texas
C. J . Huang ~ University of Houston Houston, Texas
James H. Kel ley ~ Jet Propu l s ion Laborato~3 Pasadena, Ca l i fo rn i a
Joe l Landis Anderson Clayton Houston, Texas
John J . McKetta~ Un ive r s i t y o f Texas Aust in , Texas
Jim Michaels Koppers Company, Inc . P i t t s b u r g h , Pennsylvania
Jim Newmann Armco S t e e l Company Middletown, Ohio
L. J . N u t t a l l General E l e c t r i c Wilmington, Massachuset t s
Mark Pascoo Fluor Engineers & Cons t ruc tors Los Angeles , C a l i f o r n i a
Richard Per ry ~, Union Ca r~ .~.~. Corpora t ion l~ew York, ~ . . York
H. W. Prengle Un ive r s i t y o f Houston Houston, Texas
Frank Salzano ~ Brookhaven Na t iona l Labora tor ies Upton~ New York
J. E. Stevens~ Air Products and Chemicals, Inc. Allentown, Pennsylvania
Ken Tang~ J e t Propulsion Laboratory Pasadena~ Cal i fornia
B i l l Turk Brown & Root H o u s t o n , T e x a s
Steering Comm4ttee
D P
p D
, . . ° . . . . . . . . . . . . . . .
APPENDIX II
WORKSHOP PARTICIPANTS
December 12-14, 1977
3effreyAnderson Koppers Company Pittsburgh, Pennsylvania
L. C. Bassett Howe-Baker, Inc. Tyler, Texas
Henry Bernstein IIl Cities Service Company Tulsa, Oklahoma
C. Bonifaz E. I. DuPont Company Wilmington, Delaware
Lloyd Busch Ashland Oil Co. Ashland, Ohio
Roger Chen Hudson Engineering Corp. Houston, Texas
George Clark Union Carbide Corporation New Yozk, New York
Calvin Cobb Pace Engineering Houston, Texas
Paul A. Cook Celanese Chemical Co. New York, New York
Hampton Cornei l Exxon En te rg r i s e , Inc . New York, New York
Kenneth E. Cox Los Alamos Scientific Lab. Los Alamos, New Mexico
Tom A. Czuppon Pullman-Kellogg Houston, Texas
George H. Daniel Union Carbide Co~poration S. Charleston, West Virginia
T. C. Dauphine Badger P l an t s , Inc. Cambridge, Maryland
F. J. Edeskuty Los Alamos Scientific Lab. Los Alamos, New Mexico
William J. D. Escher Institute of Gas Technology Chicago, Illinois
Ray Feldwick Teledyne Energy Systems Timonium, Maryland
Marshall Frank Chem Systems, Inc. New York, New York
James E. Funk Univer6ity of Kentucky Lexington, Kentucky
J. A. Gearhart Kerr-McGee Refining Corp. Oklahoma City, Oklahoma
P
p P
J . W. Gearinger E. I. DuPont & Co. Beaumont, Texas
Michael Goodman Davey Power Gas Houston, Texas
James Grayb i l l Air P roduc t s and Chemicals , Inc . Al lentown, Pennsylvania
Hiroshi Hara Murorau Institute of Tech. Japan
Harold Hoffman Gulf Publishing Co. Houston, Texas
John R. Howell University of Houston Houston, Texas
C. J . Huang U n i v e r s i t y of Houston Houston, Texas
J. T. Hul l F l u o r Engineers & Cons t ruc to r s Houston, Texas
John E. Johnson Union Carbide Corpora t ion New York, New York
J. H. Kelley Jet Propulsion Laboratory Pasadena, California
A. H. Levy Uni ted Technologies Corp. S . Windsor, Connect icut
Owen Livingston Tennessee Valley Authorit~ Muscle Shoals , Alabama
Bobby G. Loe Tenneco Oil Co. Houston, Texas
John J. McKetta University of Texas Austin, Texas
Warden Nayes American Petrofin~u Co. of Texas Big Spr ing , Texas
Jim Michaels Koppers Company Pittsburgh, Pennsy lvan ia
David Netzer Fluor EnEineers & Constructors Houston, Texas
Ken E. Notary Air Products and Chemicals, Inc. Allentown, Pennsylvania
I. J. Nuttall General Electric Company Wilmington, Delaware
David Owens MobayChemical Corporation Pittsburgh, Pennsylvania
R. Parthasarathy Hydrocarbon Research, Inc. Miami, Florida
H. W. Prensle , Jr. University of Houston Houston, Texas
J . H. Prescott McGraw-Hill Houston, Texas
J. T. Richardson University of Houston Houston, Texas
-55-
P 0
P P
Richard R. Roney V i s t ron Business Development Cleve land , Ohio
Richard C. Russell Exxon U.S.A. Houston, Texas
Frank J. Salzano Brookhaven National Lab. Upton, New York
C. C. S i l v e r s t e i n Westinghouse Advanced Energy
Systems Div i s ion P i t t s b u r g h , Pennsylvania
A. Max Souby University o f North Dakota Grand Forks, North Dakota
Wally S tan ton Monsanto Company Texas Ci ty , Texas
J . H. Swisher U.S. Department of Energy Washington, D. C.
Ken Tang J e t P ropu l s ion Labora tory Pasadena, C a l i f o r n i a
Frank Tsai K ine t i c s Technology I n t e r n a t i o n a l Pasadena, C a l i f o r n i a
William J . Turk Brown & Root Houston, Texas
Charles Vadovic Exxon Research and EnEineer ing Baytown, Texas
R. S. Watson Anderson Clayton Dal las , Texas
-56-
P D
p P
APPENDIX III
SUBJECT:
What is the Energy Picture . . . Today, Tomorrow?
AUTHOR(S):
~ohn ~. McKetm University of Texas
Austin, Texas
CONTENT:
Technical Paper
-57-
p 0
p
What is the Energy Picture . . Today, Tomorrow?
Dr. yohn y. McKetta E. P. Schoch Professor of Chemical Engineering
The University of Texas at Austin Austin, Texas
The biggest joke traveling around the U.S.A. this year is that "The U.S. Congress will solve the energy problems of the country."
The energy problem is not a joke! The energy story is a very complex one and cannot be told in its entirety in one lecture. It is well known that we are in a terrible energy mess but only a few people realize that there is no solution during our lifetime. By this I mean that we will not have the luxurious use of energy during the next 35-40 years that we will have today. Contrary to the accusa- tions coming from Washington there is no conspiracy unless there is a secret conspiracy between Congress and the Middle East. This coun- try is in trouble. In the vernacular of a boxer we have been hit hard on the chin, we are fiat on our back, the count is up to 9, and the referee has both feet in our chest. We are just not going to make it.
I am disappointed, confused, and appalled with the mysteriously seemingly anti-U.S, voting record of the U.S. Congress in energy ~olicies. Current policies of energy pricing and over-regulation of industry will spell disaster for the United States in less than ten years.
Many of you wishful thinkers have been led to believe we will have energy self-sufficiency by 1985. I predict that at the current rate of energy demand growth, the U.S. will have a severe recession brought about by the lack of domestic energy by 1985. In fact, there will be an energy shortage in the United States by 1985 that will make your hair curl. Most of this is because of the shortsighted- ness and lethargy of our Congress in energy matters.
Our energy supply is in trouble. We just cannot meet the fan- tastic energy demands through the year 2000 without yearly increas- ihg the energy imported from outside our border. Today over 45 percent of oil used in the USA is imported.
Almost everyone in this count ry , with the exception of one group, finally became aware of the energy crisis in October 1973 when the oil embargo was imposed by the OPEC countries. That one group was your U.S. Congress. Do you know that your Congress
-58-
D
has not put an extra drop of energy into your supply tanks since that data? By this I mean that none of the legislation that they have passed helped to improve our domestic energy situation. In fact many of the new governmental regulations have decreased the supply of domestic energy.
Sometimes it seems tha t th is country 's politicians and environmen- talists are linked together in a plot to br ing America to eventual disas ter by making domestic energy expansion impossible. I believe that the problems of h igher taxes, price controls, t h rea t of excess profit penalties, embargoes on leasing or operating in favorable coas- tai areas , and rigid excessive environmental requirements serve only as roadblocks in efforts to explore for new reserves or to build new facilities.
At a recent meed:ing in Washington, Senator Muskie told us, "We live in a mixed economy.where private enterprise and market forces are supposed to do the ]oh, but if they fumble the ball the Federal govexnment will intervene." He reminded us that the auto exhaust catalyst technology was greatly accelerated by the Federal law. Gosh, wouldn't it be wonderful if there were some reciprocal arrange- merit that if the Federal government fumbled the ball, private indus- try could intervene.
IMPORTED ENERGY
In 1976 we paid other countries about 37 billion dollars for oil and natural gas. So far this year we are importing oil and gas at a 20% higher rate. You might think that at least that's progress. We haven't doubled the amount of imports. But in the larger sense, these figures don't spell progress at all--they spell failure---failure and potential disaster for a nation which simply should not spend that much money for imported energies.
Although we continue to he less dependent on imported oil thm~ are Western Europe or :/apan, that dependence is growing. Within a few years the amount of imports of Middle -Eastern oil will take a huge jump. As you have been reading, our largest oil and gas supplier, Canada, wisely plans to eliminate all exporm of petroleum to the U.S. in order to conserve supplies for her own domestic use.
This sickening increasing dependence on imported oil will mean only grea ter r isks of another embargo,and nure i n ~ . i m i d a ~ n in the conduct of foreign policy, which jeopardizes our entire nation.
..qq.
0 P
Many wishful thinkers believe that the OPEC price of oil will decrease by 1980. My own prediction is that the OPEC price will go as high as $25/bbi oil by 1980 if we do not develop an effective energy program here in the USA.
How in the world could the wealthiest and most powerful nation in earth allow itself to be boxed into a corner like this? The reasons include the senseless inflexible governmental regulations and the extreme demands of the environmentalism. We now have so many roadblcks to expanded production that the energy industry is prac- tically inert because of goverr~-nental laws and red tape. Despite the continued warning from experts, the Federal Power Commission has been required for more than 20 years to keep the wellhead price of natural gas at extremely low levels in order to hold down the prices of consumers. These controls decrease the incentives for the devel- opment of new domestic supplies so that, just as we predicted in the early fifties, there is much less natural gas than we need today. Instead of repeating our mistakes in the oil industry where we again have imposed price controls. Again, we can predict the results: By keeping the prices of natural gas and domestic oil at ridiculously low levels, we are forcing consumers to buy more expensive foreign products from foreign oil and gas sources because we are producing so much less of our own oil and gas.
No wonder many o2 my senior students think ~.hey can run the country better than the Congress!
INCREASED USE OF COAL
The companies trying to use more coal are having troubles. While one branch of government is starting to order more plants to use coal, other branches take action that will eliminate a million tons from the market. Expanded production is being held up by rules limiting strip mining and a moratorium on leasing Federal coal !.~nds. While the domestic use of coal is limited by too strict clean air rules, at the same time the export of coal to Germany and Japan is being promoted by our government with the result that the eastern U.S. reserves are being used for foreign consumers who bid up the price making the fuel more expensive to AJnericans. In the midst of this tremendous energy crisis it's difficult to believe that the coal produc- tion in the United States today is lower than it was 30 years ago. Most of this is because of FPC, EPA and MESA. Since EPA and MESA have come into existence in the early 70's, over 20~ of our coal mines have been shut down.
It's necessary for us to triple the amount of coal that we use by 1990. We must find a way to produce this much coal and we must be allowed to consume this much coal if we wish to free ourselves of the increasing import. The recent attempt by Congress to pass strip mining legislation that would create dis-incentive to production, tulnecessarily, add to costs, and adversely affect jobs illustrates again the wrong directlon Congress takes for the energy policy. Even my own congressman voted this way. Thank God the President's veto prevailed.
Here is just one of the many senseless predicaments in which we find ourselves:
Thirty-six coal burning electrical plants were instructed by EPA to use certain scrubbers to remove sulfur dioxide form the stack gas. The EPA claims these scrubbers have been proven to be effective by the Japanese. If the electrical power companies put these scrubbers on these 36 coal burning electrical plants, they will produce a toothpaste-like sludge from the scrubbers that will cover 13 square miles of surface, one foot deep, each ~ ej~ea~. You see, many times the EPA controls are worse than the or~nal problems. None of us can forget the tail gas catalytic converters fau.._._xx pas on the '75 and later cars.
NUCLEAR ENERGY
In the field of nuclear energy, the story is again a sad one. This country was the pioneer in the development of nuclear power. Yet today we require up to 11 years to build a nuclear power plant in the United States while it takes only 4½ years in Europe or Japan. Why? Again, because of excessive governmental regulations!
Many of you will recall the story that way back in 1889 some- thing was bothering Thomas Edison. He wrote an article for the Scientific American warning the public about what he perceived as a major public danger.
"My personal desire would be to prohibit entirely the use of alternating currents," Edison wrote. "They are unnecessary as they are dangerous. I can therefore see no justificatlo1~ for the introduc- tion of a system which has no element of permanency and every element of danger to life and property."
Now from the vantage point of our alternating current world 88 years later, it is apparent that this great person either was unex- plainably wrong in principle, or he failed to anticipate the technology
0 P
tha t put alternating current electricity into nearly universsd use across the United States.
We solved the alternating current hazard--we can solve the new hazards.
Nowadays people are worried about nuclear radiation risks and hazards just as Mr. Edison was worried 86 years ago about AC elec- tricity. Everyone admits that radiation can be dangerous just as gasoline can be dangerous, automobile driving can be dangerous, and electricity can be dangerous. But reasonable people will take moder- ate risks for great benefits, small risks for moderate benefits, and no risks if there are no benefits. Our policy makers must learn that the world is risky, and that the problem isn't whether something is safe, but what the risks are, and whethez the benefits are worth those risks. If we could get governmental regulation founded on such a rational basis, we really would be a step ahead on the road to further progress through the benefits of modern science and technology.
Our nation and its laws should aim at devising the best possible means to manage the risks involved--rather than deceiving ourselves and the public into believing that all risks can be banned by human force.
Rather than simply banning the material that m y be dangerous, we need to answer more basic questions. What is the nature of the hazard? How serious is it? Can it be managed properly? In short , we must weigh the r isks and our ability to manage them with the benefits. If the human need is great, such as radioactive materials use for medical t reatment, then a safe way for manufacture and use must be found. Risks are to be found everywhere in life.
CAN~EHAVE ZERO RISK?
EPA uses statistics to prove that "even negative experiments do not guarantee absolute safety."
Since when has it been a government function to "guarantee safety" to a 100% level? There is no activity of man, including the normal basic psychological functions, without r isk. As some witty Irishman once said, "The path from the cradle to the grave is so beset with perils, 'tis a wonder that any of us live to reach the la t ter ." All that any of us have the r ight to expect, and all that the vast majority of us ask, is that government regulations help keep the r isks within the reasonable bounds, not that they "guarantee absolute safety" --there is no such animal!
P
P p
During the past 20 years we again have dire warnings from many highly educated people. They tell us of the imminent doom from hazards (which are, by any reasonable assessment, re~lly quite small). They have helped convince the average U.S. citizen that all chemicals are dangerous and should be avoided..They proclaim L~ terrible danger that a few people m_~-----~ fall victim to "~m~er originated by me chlorination of public water ~upplies and they cause wide- spread concern abut the safety of the water the public drinks. But they totally ignore ~he millions of people who died of typhoid, and other waterborne diseases, before the general adoption of chlorina- tion. They shudder over the possibility that a few people may be adversely affected by food preservatives. They neglect to point out that there would be a greater incidence of disease, and loss of food- staffs (in a world already concerned about adequate food supply) if the preservatives are not used. Here are other examples of their misguided crusading:
You know the plain fact is that there is no substance, including water and oxygen, which is not harmful to, or which will not produce toxic reaction in, laboratory animals or in human beings when admin- istered in massive overdose. Similarly, there is no substance which, even in small amounts, will not cause problems t~-a few unfortunate individuals who happen to b-e--sensitive or allergic to--~at particular material. We simply cannot guarantee complete safetzv by government fiat or any other means. Of course, we need to curb pollution, but we need to do it rationally, balancing general benefits against general risks.
Shouldn't we rataer get a better perspective on relative hazards and devote more of our energies to stopping some of the more genuine menaces to the average citizen, such as our annual highway death toll, the rise of violent crime, increasing rates of rape, murder, etc. If I should be injured in a collision with a drunken or reckless driv- er, or while helpless people should be robbed and perhaps murdered, it would be a small consolation to know that EPA has "protected" us from the very slight chance that we might develop cancer from an additive which has been in general and beneficial use for many years wlth no discernible Ill effect on the general public health! Let's get off cloud nine and down to earth about th~ real risks and chances involved in living in this imperfect ~rZd.
When we consider zero risks let's remember that in the 18-year history of commercial nuclear plant operations (1958-1976), no acci- dents have occurred involving public injury nor over-radiation. Yet, in the sar~_e period in the United States alone 848,544 people have been killed ~-y motor vehicles and more than 75 million have been injured by this highly popular invention. To my knowl^dge there is no popular, movement to "ban the auto."
D 0
In 1976 alone there were over 31,000 truck accidents which included 3,000 deaths and over 20 million dollars worth of damage. Should we eliminate trucks from our highways?
In 1976 over 154 miners were killed in the United States and over 1,000 people were electrocuted from electric power Rues and appliances. Should we cut out electricity and shut down the coal mines?
In 1976 .over 70,000 teachers were assaulted in the classroom by their students, ranging from slaps by the student to killings with knives or ice picks. Should we eliminate classrooms? Over 24,000 people were mtu-dered in the U.S. in 1976.
WHAT IS THE U.S. ENERGY PICTURE TODAY AND TOMORROW?
It's very difficult for the public to believe that there is an energy crisis because they have no trouble in getting all the gasoline they want at the gas pump. Unfortunately, no one tells the public that approximately half of the liquid products we use in the United States comes from outside our shores. Little do they know that the actual liquid production in the U.S.A. is about 4~ less this year than it was in 1976. In fact the production of oil in the United States has been decreasing year after year since 1970. The imported liquid, however, has increased approximately 49~ over 1973 as shown in Table 1. Table I also shows that the cost of imported liquid will be $50.7 billion dollars in 1977 compared to $6.0 billion in 1973. This is the sort of information that should be made available to the general public so tha t they know that even though the supply of gasoline is high "the country will have great difficulty in paying for this imported liquid.
The real energy story can bes t be presented in the form of charts depicting the individual situatons. Letts turn to Figure 1. Figure 1 shows the total energy used by the United States from 1956 though 1976. On the same chart is shown the total energy produced during these years. The area between these two lines shows the amount of energy we imported from 1956 through 1976. We imported over 20~ of the total energy used in the United States in 1976.
In Figure 2 is shown the total gas used by the United States from 1956 through 1976. The dashed line shows the gas used and the dotted line shows the gas produced in the United States over the same period of time. The solid line indicates the total amotmt of gas found during this same period of time. You can see that beginning in 1967 we consistently have discovered less gas than we have pro- duced or used. In 1976 we imported or used from proven reserves about 12% of the total gas that we used. Notice that the gas produc- tion declined in 1971 for the first time. In 1970 30 Q's of gas were discovered in Northern Alaska but no gas pipe line construction has been started yet. z
Figure 3 represents the same information for oil. We imported over 47% of the liquid hydrocarbon used in this country in 1976. It is most undesirable to import these large quantities for many reasons. Among these are: (a) the imports add to a negative b~ance of payments, (b) dependence on imports constitutes a threat to our national security. The solid line indicates the amount of new oil found from 1956 through 1976. Yust as in the case of gas, we are
i Q=I Quadrillion British Thermal units. This is the energy in 1 trillion cu. ft. gas or 46 million tons coal or 180 millions bbls. oil or 293 mill. megawatt hrs.
0 0
0 p
now finding less oil each year than we produce or use. Notice that the production of oil continues to decline (since 1970).
The picture of coal is a reverse of oil and gas as shown in Figure 4. We have consistently produced more coal than we use. We have exported coal to Germany and Japan since 1946 as part of our reparations agreement. We also export large volumes of coal to Can- ada. The total income from the coal was 1 billion dollars compared to the 29 billion dollars wetve spent for hydrocarbon liquid last year. In 1970 the effect of the Mine Safety Act an~l EPA regulations is noticed on the production and usage of coal: 22~ of the coal mines were closed during !970-71. During the same time the restriction on the use of high sulfur coal decreased the usage. The coal supply should be tripled by 1985 ff we are to approach self sufficiency. This goal, however, is physically impossible. The goals recommended in 1970 are also shown on Figure 4.
Figure 5 shows the gas reserves in the U.S.A. The left bar of this figure shows the proved recoverable gas reserves as of Decem- ber 31, 1976. At 1976 year end we had 214 trillion ft s. We had approximately 8.8 years of proven recoverable gas reserves at that time. We used 24.1 trillion cu. ft. in 1976. On the right bar we see the undiscovered potential of gas in the United S~ates. Most of the discovered potential is expected to be in the Outer Continental Shelf. Even the most optimistic figure of 750 trillion cu. ft. will last us less than 35 years. I believe it is extremely significant that even though 70~ of the proven recoverable reserves of gas are found in the south- western states, including Texas and Louisiana, these states are planning to depend heavily on coal, lignite and nuclear reactors for their electrical energy.
Figure 6 shows the proven recoverable reserves for oil to be 34.3 bUlion barrels as of December 31, 1976. At the rate of oil usage of 6.4 billion barrels in 1976 this gives us 5.4 year reserve. The bar on the right hand side indicates the undiscovered recoverable oll potential which may be as high as a hundred billion barrels, or slightly over 17 years ~ supply as of this date.
Figure 7 shows the dramatic decrease in the total wells drilled in the United States from 1956 through 1973. The decrease was from 58,000 wells in 1956 to 26,400 in 1973. Mr. Mike Halbouty points out the number of independent drillers decreased from more than 39,000 in 1956 to less than 3,800 in 1973. The reason these men have left the industry is that the return on their investment was not as high as in other fields. The lower line shows the wildcat well record from 1956 through 1976. Of the wildcat wells drilled 1976 only 16.1~ showed any significant amount of hydrocarbon while less than 9~ were
0 0
p P
commercial wells. Note that the majority of ~ e wells are dril led by the independents (79.~,) who found 74~ of the oil and gas . The independents drilled most of the wildcat wells also 894 and discovered 764 of the wildcat hydrocarbons.
The top line of Figure 8 shows the predicted total demand of all types of energy in the United States from 1970 to 2000. The second curve from t~he top indicates the maximum total energy the U.S . could have supplied during this period if proper recommended s teps were taken beginning in 1970. The individual amounts of ene rgy are shown as nuclear and hydro, coal, oil from coal and shale, crude oil and natural gas liquid, gas from coal and shale, and na tura l gas.
The area shown between the two upper curves r ep resen t s the increasing amounts of imports each yea r . By the year 2000 we would need to /raport over 35~ of our total energy ff we can ge t enough tankers on the ocean to deliver this much energy and ff we sti l l have a source of tha t energy at tha t time. The total energy produced by the U.S. dur ing this period was predic ted using several assumptions.
a . The maximum population will not exceed 271 miMon by the year 2000.
b. Inflexible governmental regulations will be decreased be- tween now and 2000.
C. Less resistance will be offered by the extreme environmental demands.
d. No new major energy usage, such as general weather con- trol and defogging of the cities will take place between now and 2000.
Figure 8 indicates that 8 billion barrels of oil will be imported during the year 2000. This means we would need over 1,000 tankers of i million barre ls net capacity (we have none ye t of th is size) continuously ,on the high seas to make this delivery. Incidental ly , the 8 billion bar re l s /year of imports would cost over 200 million dol- lars per year by the year 2000. This is the equivalent of 20 million new jobs at $10,000 per person/year .
The only thing wrong with Figure 8 is that it was p repared in Ianuary 1970 us ing the data through 1969. Now look a t Figure 9 which shows the top two lines of Figure 8 showing the demand and supply for the total U.S. energies between 1970 and 1985. Now with the his tory of 1970 to 1976 behind us , i t is easy enough to show the demand and supply curves (dashed) lines in Figure 9 which will show
ow-)
P P
that the U.S. energy picture is much more critical then we all thought several years ago. These data are shown in Table 2 where the prediction of domestic production of total energy for 1985 based on 1964 data is compared with the prediction based on 1976 data. You can see that the predicted supply data for 1985 are now 2/3 of that predicted in 1970. The predicted energy sources are shown in Table 3. We were all optimistic early in 1970 that we would have a great supply of nuclear sources as well as a huge conversion of solids, (coal, l ignite, shale, e tc . ) into oil and gas. If all of the nuclear plants which are now in the planning or cons~'uction state are completed by 1985 (many of these are now being held up in the ,~ourts for environmental, siting, and other reasons) only about half of that predicted in 1970 could now be expected to be available in 1985. All of the predictors were overly optimistic on conversion of solids into oil and gas but now only about 1/Tth of this source is expected to be available by 1985 as compared to that predicted in 1970. To make ma t t e~ even worse we will not be able to produce even the lowest supply line of Figure 9. You can see from Figure 10 that the U.S. will not be able to produce domestically over 60 Q's by 1985. Table 4 shows the U.S. usage of energy in 1976. These data are helpful when one predicts amounts of energy to be conserved.
-68-
p D
• , • . . . •
PREDICTED U.S. ENER~ODOCTI~ IN 1985 (Q'S) TABLE2
Actual 1985 P r e d i c t i o n Based on 197___22 197__~4 1969 Data 1975 Data
Demand
U.S. Production
Impor t s , q
Imports
74 76.5 115 115
63 62 95 62.4
11 14.5 20 52.6
14.9 19.0 17.5 45.7
U.S. ENERGY SOURCES, 1985 TABLE 3
U.S. Sources i n 1985
q's P r e d i c t e d P red i c t ed
i n 1970 in 1975
Oil & Liq.
Gas
Coal
Nuc. & Hydro
Oil from Solids
Gas from "Solids
Geothermal
Sola r
Fus ion
Hydrogen
Winds, T ides , e t c .
18.7 17.0
16.6 15.1
20.5 18.0
18.5 8.94
8.4 1.5
12.3 1.8
0.15 O. 09
0.10 0.02
0 . 0 0 0 . 0 0
0.005 0.005
0.0005 0.0001
95.25 62.4151
I f a l l planned n u c l e a r p l a n t s a re a c t u a l l y b u i l t .
O o
0 0
TABLE 4 U.S. ENERGY USE IN 1956
Industz~ Commercial Residential Total
Transportation 9.9 I. 0 15.0 25.1 Steam 16.7 . . . . 16.7 Heating I0.7 6.9 ii. 0 29.4 gle~. Dri.es 6.0 0.5 1.4 7.9 Raw MaEls. (Chem.) 5.5 . . . . 5 • 5 Water HeaLing 0.9 1.1 2.0 4.0 Air Cond. Refrig. 0.i 2.9 2.3 5.3 Lighting 0.1 0.2 i. 2 I. 5 Electrolytic Proc. 1.2 . . . . 1.2 Cooking -- 0.2 I.I 1.3 Other 0.1 0.2 1.8 2.1
51.2 13.0 35.8 100.0
WHY CAN WE NOT ACHIEVE ENERGY SELF-SUFFICIENCY BY THE YEAR 2000?
In order to meet the tremendous energy demand from a self-s,~- ficient energy base by the year 2000 we would have to do the follow- ing and much more:
a. Find I0 more Prudhoe Bays or four more states of Texas and produce them to capacity.
b. Ban all new cars larger than 40 horsepower so that by 1985 half the cars on the road would be that size.
c. Force a 20% improvement in building heating systems.
d. Force a 15% improvement in enery efficiency by industry.
e. Force a 15% improvement in the efficiency of converting electrical power.
f. Totally develop all offshore oil and gas reserves on the Outer Continental sheves of both the east and west coasts.
g l
h.
Increase coal production by a factor of 3.
Convert all of California, Montana, and Idaho to geothermal steam electric power (which would be like building 110 Hoover Dams at a cost of approximaterly 40 billion dollars).
-70-
O O
p 0 .."." : . : "'°
i. Double the prese~it rate of hydroelec~ic power generation. (80% of potential sites are located m parks , wilderness areas and scerdc areas . )
J. Produce 2 ..~tillion barrels p~ day of shale oll by the year 2000.
k. Add one conventional atomic power plant every 2 weeks from now to the year 2000.
So you see, you can expect to be living with an energy problem the rest of your life. I see no way to get out of this horrible mess before the year 2000. We can alleviate this shortage slightly, but only if we establish an effective National Energy Policy now. This policy will bring about great personal sacrifices of people on every level. It will require billions of dollars (but much of this can be spent ~rom the sav~mgs of money resulting from decreased imports because of the new energy policy). Tbds will require the use of our own vast resources.
We need an energy policy with teeth ~ it. We need an energy czar who is really a czar, unbound with numerous senseless regula- tions and free of the accusations and bickering of the vote conscious congress members.
Our National Energy Policy should include many items. We must make these changes immediately or else we will face irreversible hardships and sacrifices by 1985:
. We must become reasonable about the environmental de- mands.
2. We must cut out unnecessary governmental regulations.
. We must return to the free enterprise system and let the marketplace determine the price of energy.
. We must have a voluntary moratorium on catalytic con- verters on tail pipes and all exhaust gas recirculation in automobiles (except in Los Angeles and the few cities that have the chimney effect L-t the downtown areas).
. We need to put lead back into the gasoline. Th/s will save us approximately 12 or more percent of the crude oil tha t we now use to make non-lead gasoline.
6. We must retain and enforce 55 mph speed laws.
o P
P P
7. We must increase car pools and mass transportation fivefold.
8. We must be sensible about:
a° Encouraging U.S. businessmen to f i nd new energies (especially more oil and more gas).
b. Tripling the use of coal by 1990.
c. Using nuclear energy widely and wisely.
d. ~couracjincj research and development on all fronts to help find additional energies.
e. Develop~-~g the use of all alternate energies. (I be- lieve however that it is-l~athetic to give the public the false hope that solar and geothermal energies will be the cure for our energy problem by 1985.)
f. Conserving energies of all kinds.
g. Doing without tmnecessery luxuries.
Just these few items would decrease the demand by 2 million bblslday and increase the supply by 3.5 miUioR bbls/ day by 1985. This is the sort of action that could put the OPEC countries on their knees. They will discover that the largest consumer doesn't need them. But this will require a Congress and administration to set the policy with conviction and with the knowledge that they possibly may not remain in the office very long because of unhappy constituents. But, of course, the future of our country must come first!
If we do not adopt the foregoing suggestions we will have ax- treme hardships and sacrifices by 1985. We will be in such a finan- cial position that we will find it impossible to purchase the amotmt of energy that we need from outside our shores. This z.lll bring about the stricter governmental regulations, including strict fuel rationing for private and industrial purposes by 1985 or sooner. Then the governmental regulators will frantically be passing more regulations to save energy in many scatterbrained ways. In fact, I predict that by 1985 this country, the government will have on its payrolls tens of thousands of "regulators" who will appear unexpectedly at our door to insure that:
a . We maintain low temperatures in the winter and high temper- amres in the summers in our homes.
-~Y2-
P P
0 P
b. The clothes dryers are permanently disconnected.
c. The air conditioners are permanently disconnected in auto- mobiles and banned in all future automobiles.
d. We drive on Saturday and Sunday only for emergency purposes.
F u r t h e r :
a. Limit-meters will be used by residences limit the amount of energy used each month).
and industries to day (or week, or
b. Escalators will be banned.
c. Elevator use will be highly limited.
In add i t ion I p r e d i c t b y 1985:
1. Tha t GNP in U . S . wi]l be in a s t r o n g d e c l i n e .
2. Unemployment will be as h igh as 14%.
3. Prime i n t e r e s t r a t e s will be as h igh as 15%.
4. We will return m double dig i t inflation.
. We will have a recession worse than any during the past 40 years.
CAN THE U.S. ECONOMY ACTUALLY COLLAPSE?????
You bet it can--and it possibly might be as early as 1985. If you have any doubts you should read the article by Dr. H. A. Merk- lein in World Oil magazine, December 1975 (World Oi_!, Post Office Box 2608, Ho-~on, Texas 77001).
CONCLUSIONS
What are we fac ing t o d a y e re the i s sues t h a t will de te rmine wha t th i s c o u n t r y will be like fo r a genera t ion or more to come. We have a choice: we can either continue to compound the errors of the past, or we can renew the foundations of our democratic system to begin to build wisely and soundly for our future energy-wise, economic-wise, and all ways.
0 P
0 P
The inept inactivity of the U.S. Congress in handling the ener- gy proble~ is a tragic example of bad government. Many congress- men have played political football with this problem and in doing so have put our future--yours and mine--and this country's--and in fact the world's future--in jeopardy to serve their personal political ambi- tions. Such conduct borders on TREASON ! ! ! !
congress must give us a bet ter future, or as stockholders in this huge U.S. corporation, you and I should replace every senator and representat ive. Americans of s t rength and character, like those of you here today, must be willing to fight for their convictions. I urge you to stand up and be counted.
In closing, I should like to echo the words of my good friend Bob R. Dorsey. "I want to put in a word for patriotism. This term has been snickered at in this country in the recent past--maybe because we have become so burdened and national guilt that we find it difficult to profess national pr ide. All the same, I sugges t that a healthy dash of patriotism today in our national melting pot could help us solve, not only our energy and environmental problems, but many of our other problems. I am not referr ing to the blind nationalism of fanatics or even the ritual symbols broken out for the Bicentennial or the Fourth of July, laudable as the latter are. I am suggest ing a thoughtful reflection on, and rededication to, the tremendous oppor.- tunities that the United States of America has offered generations of men, women and children to lead healthier, happier, and more reward- ing lives than they would have anywhere else on ear th ."
Thank you.
0 0
9 0 { "'
::) 80
Z 70
6o
5o
O 40 -.- ' ;- i"::. ' .
TOTAL ENERGY Source: WORLr.'; OIL MAGAZINE
, , , , , m . .
,:--!...-: ...".T:.
. . o , " - I . . . . . ' I DO° *r
+,=o.+* 1 ** * * * . I
* = ' - ~ . . d
!1 John J. McKeI I I
Univ. ot Texas Aust in 7a712
! I 22 26 1980
. . - - , . .+;~
..7+o
30 1956 60 64 68
Rgure I
36 GAS I I 3¢ ) S o u r c a : W O R L D OIL~MA.GAZINE
I
i ::) 29 ' '
I
~=o '~.'% ! " ~ ~ _..:... • .,~ ! . . . . . .
, a o o o \ /Qoop..::,.'..:~ : ~.Ao
I Y .~ : ":''':~ .... l i ' ' I ~) _e,~ o°., .. . . 1 John J. McKettn
F U T U R E U.S. T O T A L E N F : R G Y I P R O D U C T I O N P R E D I C T I O N /
..... • ~ ~ - ~ I
Coal & Lignite
Gas Fn~rn,~l ids .
t I I ! t -Ira - t i t R I I 8 2 " B 4
~ 8 . 9
I 16.0 t 1.5 I. • 17.0 ' l e E~;.,
P P
APPENDIX IV
SUBJECT:
Current Attitudes Toward Hydrogen Energy Systems and Highlights of Recent Work in the
United States and Abroad
AUTHOR(S):
James H. Swisher U.S. Department of Energy
Washington, D.C.
CONTENT:
Technical Paper
0 0
CURRENT ATTITUDES TOWARD HYDROGEN ENERGY SYSTEMS AND HIGHLIGHTS OF RECENT WORK IN THE UNITED STATES
AND ABROM)
Z[ames H. Swisher Assistant Director, Division of Energy Storage Systems U.S. Department of Energy
What I intend to do in the next twenty minutes or so is give you
my personal views on changing atti tudes and changing research
efforts in the United States and other countries on hydrogen energy
systems. A more conservat ive and more realistic approach to advanc-
ing technology has evolved during the past several years . Present
effort,.' in several European countries are more intense than the U.S.
and elsewhere. Even so some s~snificant accomplishments can and will
be mentioned for a number of countries oround the globe. The
hydrogen program in the United States under ERDA sponsorship was
not a major thrus t of the enrgy program. Under the new Department
of Energy (DOE), we can expect some changes in emphasis, perhaps
major ones. As I speculate on some changes tha t could occur, I hope
i t will stimulate some ideas for you to pass on to us at this meeting.
In par t icular , we would like your thoughts on how our hydrogen pro-
gram could be modified in response to some changes in research
policy under DOE that I will discuss later.
Let 's tu rn back now to the early 1970's for a few minutes. The
likes of Derek Gregory in the United States and Cesare Marchetti in
I ta ly were en]oy~ng a large group of followers as they exclaimed the
-76-
P P
• • . • . •....',,
• da j
virtues of hydrogen as a universal fuel. Production from water,
transmission in existing natural gas pipelines, and widespread use in
vehicles, buildings, industrial processes, and even electrial power
generation were proposed on a massive scale. These ideas certainly
were exciting, and many scientists throughout the world found ways
to get involved in hydrogen energy research. For the most part,
this research movement was modest in overall level of effort and the
research was exploratory in nature. An exception was in the group
headed by Marchetti at the !SPRA Laboratory of the Commission of
European Communities. Financial support in millions of dollars per
year was provided to ISPRA, mostly for development of thermochemi-
cal hydrogen production processes and systems analysis.
It didn't take long to realize, both at ISPRA and elsewhere, that
there are some difficult technology and institutional problems to solve,
and that we must look far into the future to see a time when hydro-
gen energy systems on a large scale will be cost competitive with
other options. Consequently, R and D budgets for hydrogen tech-
nology have not grown as fast as in a number of other energy pro-
gram areas.
What we see now in most countries is research and development
of two types. In one, hardware is being developed for near term
applications of a rather specific nature. For ex~mple, improved
electrolyzers are being developed to produce hydrogen for a wider
range of needs in the chemicals industry. Also pilot ignition devices
p P
which make use of hydrides have been developed for natural gas
equipment, so that the continuously burning flames in older pilot
lights can be eliminated.
In the other category of activity, research and exploratory
development is being done on a bench scale to solve pacing tech-
nology problems and to find significantly better processes, devices,
and materials for hydrogen energy systems. Examples are bench-
scale, integrated facilities for evaluating thermochemical hydrogen
production processes, and projects to search for light weight hydride
materials for future use in vehicles.
This strategy of working toward a few near-term applications
and working in parallel on challenging longer term technology prob-
lems makes good sense. Progress is made at a steady pace, the more
straightforward development project are not initiated until more appli-
cations are evident, and financial resources aren't squandered on ill
conceived or premature crash projects.
It shouldn't be too surprising that some countries feel that
hydrogen will play a bigger role in meeting their future energy needs
then others. Several European countries and ~apan have very little
oil, natural gas, and coal, so their interest in alternative fuels is
higher than in the United States°and the United Kingdom, where a
smaller fraction of energy resources need be imported. Countries
with large sources of hydropower, like Brazil and Car~da, are well
aware that hydrogen production is an attractive option. In Germany
-78-
0 0 • ..' • :..
There is interest in the match between hydrogen and high temperature
nuclear reactors. In Japan, it is the interface with solar energy
systems that appears attractive.
Let me mention some of the special interests and accomplishments
made abroad on a country by country basis. In the Netherlands,
pioneering work was done on the hydrodes of rare earth compounds
such as LaNis. A sy..'tems study was done by A. ~. Rogers and
co-workers which showed that a combined electric and hydrogen
economy may eventually be feasible for their country. They have no
intensive R and D program on hydrogen.
The European Community, which obta/ns its R and D budget
from several European countries, supports hydrogen work at the
ISPRA laboratory as well as industrial firms. ISPRA has the largest
effort in the world on thermochemical hydrogen production.
The United Kingdom lost the minor interest it had on hydrogen
when oil and natural gas were found under the North Sea.
In West cenmny, there is a great interest in using process heat
from high temperature nuclear reactors to drive thermochemical hy-
drogen production reactions. The Lurgi Company is one of the
leading manufacturers of electrolyzers. Another important activ/ty is
work at Daimler Benz Company on hydrogan-fueled vehicles; they now
have a 30 manyear effort. Their most significant accomplishment is
the design and operation of vehicles operating on dual hydride beds
of iron-titanium and magnesium-nickel alloys.
D 0
The main activity in Italy and Switzerland is alkaline electrolyze
technology at the Donora Corporation and Brown Bavari Company,
respectively.
In Japan, the interest in hydrogen is intense and the program is
broad. Hydrogen research is part of their "Sunshine Project".
Pioneering work on solar-assisted hydrogen production was done in
Japan. A discovery was made by Hondo several years ago in which
certein semiconducting compounds were found m absorb photons from
the sun and, when made into electrodes, reduced or eliminated the
need for elect~'ical power in the electrolysis of water. This discovery
stimulated a great deal of R and D in the United States and other
countries.
In Canada, the Noranda Corporation has teamed with Electrolyzer
Corporation to develop improvements in alkaline electrolyzers. There
is also interest in Canada in converting diesel-fueled trains to hydro-
gen power.
In Brazil, the principal interest is in using new sources of
hydropower to electrolyze water for fertilizer production. The gas
company in Rio de Janeiro is also interested in adding electrolytic
hydrogen to their gas distribution system. They presently distribute
"town gas" made by reforming naphtha imported from the Middle East.
The budget for Brazil's work on hydrogen is currently a few million
dollars per year. Attempts to reach agreement on a cooperative
R and D program between Brazil and the United States have been
p P
...-.
stymied because of strained relations between our two governments
arising from issues on r~uclear power in Brazil.
Much of the work just mentioned on hydrogen production pro-
cesses will be covered under an International Energy Agency (IEA)
agreement. The IEA is an organization of oil importing countries.
One of its functions is to promote exchange of R & D results in the
energy field between member countries. The IEA agreement on hy-
drogen production from water was a:'.~roved in October 1977. There
are now five annexes covering specific project areas that are ei ther in
final form or under negotiation. One of the annexes is specific to
market potential for hydrogen produced from water and how the
market potential depends on compeUng alternatives, such as hydrogen
produced from coal. We have agreed to give the proceedings of this
workshop to the other signatories of the agreement, and will be
collecting and exchanging additional information through the IEA in
the next few years.
Closer to home, the R and D activities supported by the Depart-
ment of Energy are spread across 13 program divisions, with coordi-
nation provided by Hydrogen Energy Coordinating Committee. I am
presently chairman of the Committee, which meets several times each
year to exchange information, discuss issues of importance in the
energy program, and hear presentations from members and guest
speakers on topics of current and general interest. We have just
compiled a summary of all activities supported by ERDA /n Fiscal Year
P P
1977.
dollars.
A.
The total funding level for hydrogen R and D was $24.3 million
The breakdown is as follows:
Hydrogen Production (29~)--Divisions of Coal Conversion and Utilization, Energy Storage Systems, and Solar Energy.
B. Hydrogen Storage (19~)--Divisions of Energy Storage Systems, Military Application, and Transportation Energy Conservation.
C. Materials R and D (11~o)--Divisions of Energy Storage Systems and Milit.~y Application. (Includes containment materials and hydrldes.)
D. Basic Research (39~)--Divisions of Basic Energy Sciences, Military Application and Laser Fusion.
These four categories of activity make up 97~ of the total
effort. The remaining 2~ includes work on hydrogen distribution,
use, safety, and systems analysis. The Division of Energy Storage
Systems administers 18~o of the work funded by the Department of
Energy. You might ask, as many have previously, why all of DOE's
projects arenlt consolidated under one organizations with hydrogen
being its only program. One answer is that the policy makers in DOE
are not convinced that hydrogen energy systems rank with such
projects as high BTU coal gasification, solar heating and cooling,
fusion reactor development, and a number of others in setting priori-
ties. Another reason is that for many projects there are close ties
basic missions in coal conversion, national security, biomass, trans-
portation systems, and so forth. Scheduling regular meetings of the
coordination committee has proved effective in dovetailing research
activities and in preventing overlap between the sponsoring divisions.
-ft2-
D P
. . . . ' . . : . . ~ : ]
modest.
projects
both.
For the activities I manage in the Division of Energy Storage
Systems, the scope is broader than for any other sponsoring division.
While the focal point for all activities is on storage component devel-
opment, the production, distribution and use - f hydrogen are impor-
t an t parts of the program. Our s t ra tegy is to place emphasis on
projects which may lead to commercialization in the 1980's, and 1990's,
even if the total impact in reducing oil and nalural gas consumption is
Our longer term projects benefit from progress on near-term
becaue_ much of the same technology base is needed for
The application sectors for which hydrogen produced from water
or coal has the grea tes t potential for reducing oil and natural gas
consumption from now until the year 2000 are:
(1) Hydrogen use as chemical feedstock
(2) Addition of 10-15% hydrogen to natural gas pipelines
(3) Hydrogen as a storage medium for off-peak electrical power.
Of these three, the chemical feedstock application is the most a t t rac-
t ive because of economic and institutional considerations. I have
identified some issues on this subject which need to be discussed at
our workshop:
(1) For what specific applications, use r a t e s , and geographical locations does i t make more sense to produce hydrogen from water ra ther than from coal?
(2) What are the R and D needs for hydrogen storage, com- pression, and distribution technology?
. .
P P
(3) How do these R and D needs change with the outlet pres- sure of the hydrogen production process?
0
Please keep these issues in mind during the workshop and voice your
opinions.
Let me conclude by mentioning some differences in charters
between ERDA and the Department of Energy and the possible impact
on our program. ERDA's mission was limited to research, develop-
ment, and demonstration of energy technology. The Depar~nent of
Energy does not only that, but it also develops energy policy and
finds mechanisms for effective technology transfer to industry and for
commercialization of energy systems. It can draw on regulatory
actions, loan guarantees and tax incentives to accelerate commerciali-
zation. It is no longer necessary to wait for industry to be con-
vinced that profits are assured for commercialization of energy sys-
tems. Thus, while clearly uneconomical technology will not be forced
into the marketplace, technology transfer of systems that are pres-
ently marginal may be arranged if projections of costs and oil savings
indicate that there will be a payoff in the forseeable future. Also
higher priority will be given to project areas that are not plagued
with environmental problems.
Thus the hydrogen program could benefit from new guidelines
coming from DOE policymakers. With recognition of the potential
hydrogen has as a clean-burning fuel and with financial incentives to
accelerate development and commercialization, the hydrogen program
-B4-
in the Department of Energy could take a quantum jump upward in
priority and emphasis.
o85~
P
P
P
P
P
P
P
P
P P
APPENDIX V
SUBJECT:
Energy and Hydrogen in the United
States Refining Industry
AUTHOR(S):
Calvin B. Cobb The Pace Company Consultants & Engineers, Inc.
Houston, Texas
CONTENT:
Technical Paper
-86- !
P
ENERGY AND HYDROGEN IN THE
UNITED STATES REFINING INDUSTRY
Dr. Calvin B. Cobb Vice President, Engineering Services
THE PACE COMPANY CONSULTANTS & ENGINEERS, INC.
Presented at "WORKSHOP ON SUPPLY AND DEMAND OF HYDROGEN AS A CHEMICAL FEEDSTOCK," December 12-15, 1977, University of Houston, Houston, Texas.
INTRODUCTION
Hydrogen supply and demand in the United States refining industry is directly related to the overall energy situation. The importance of hydrogen as a raw material in refining increases as refinery operations shift to meet overall energy demands: increased unleaded gasoline, a leveling of gasoline demand and simultaneous increase in fuel oil demand, and the increased sulfur content of crude oil supplies. Pace has forecast the interrelationships of energy supply/demand and the role of hydrogen in the refining industry using the Pace Energy/Economy/Petrochemical Forecasting System. In this paper, we present projections of:
i. Energy to 2000
2. Hydrogen in the U.S. Refining Industry
ENERGY TO 2000
The Pace Forecasting System
Pace uses a system of seven basic computer modelling tools for our forecasts of energy, petrochemicals, and the economy. The models and their interactions are illustrated in Figure 1. The starting point for each forecast is the Econometric Model, a fully integrated model of the United States economy used to simulate economic activity and to develop alternate economic scenarios. Models of the energy-consumlng sectors--household/commerciat, indus~ial, transportation, and utility power--are then used to forecast dema'ad by fuel type and by regmn. The combined output from all the demand models is then input to the
-87-
I I I I I n
! i ! I J, I I I
Izl
~I ~,
I
!
i j''~ !.
|
A I I I I I J
i T I ! ! I
I m i l l I - I
P P
Energy Model, a linear programm~_ng model which optimizes the way in which the total energy system will meet this demand at the lowest cost, creating a complete supply/demand balance for every energy product--propane, gasoline, No. 2 fuel oil, coal biogrades, etc. The results are fed back through the various sector models and the prices and energy data are then recycled back through the econometric model. Once a consmtent solution has been obtained, we are assured that we have a complete material and BTU balance in the energy system and petrochemical industry, and that our forecast of the economy will support the costs, demands, and investments required for our forecast of energy and petrochemicals.
Outlook for the Economy
All of Pace's energy forecasts start with a projection of the economic outlook. Figure 2 shows our long-range forecast through the year 2000 for the economy, energy, ~=nd overall petrochemical industry. Energy will grow at a lower rate than the economy. The petrochemical industry, which is a major consumer of some of the premium products on the energy system, will grow considerably faster than the rates of the economy or energy, and will assume a larger role in the ~o~al energy situation. Energy demand will grow at about 60 to 80 percent of the rate of the economy and petrochemicals will grow about 50 percent faster than the economy.
From 1976 through 1980, the economic growth rate will be 4.3 percent, which represents a "catch-up" from the recession of 1975. From that point, we forecast the economy to slow down considerably, falZing to less than 3 percent after 1985. The actual growth rate for 1977 was 4.9 percent greater than that for 1976. We are forecasting a slowdown over the "growth that we had this past year to 1980. In fact, we believe that sometime within the next six quarters there wll be a period of negative growth rate defined as a recession.
Energy Demand/Supply
Given the preceding economic forecast , Figure 3 shows Pace's projec~on for energy demand through 2000. Energy growth in 1977 was 4.1 percent over tha t of 1976. As shown in Figure 2, we fore- cast tha t the total ene rgy demand from 1976 to 1980 will grow at an overall rate of about 3.7 percent per year , in reaction to the period of negative growth dur ing the last recession. After 1980, the demand growth rate levels out at about 2 percent per yea r through the yea r 2000, an even more dramatic slowdown.
-88-
i
E
n ,
!
J
~ , , t . i . T ~ , I i ~
0 0
If we examine energy demand by consuming sector, we find that the household/commercial sector will maintain the same percentage of the total demand although it will double its consumption. Transpor- tation is the area which has the greatest potential for savings, assum- ing major increases in efficiency for automobiles and transportation systems. Industrial use is projected to hold its common share of the energy demand to 2000. The-refining/petrochemical industries will take up more of the energy used (feedstock and fuel)--from 8 to 11 percent.
, Figure 4 shows the same total energy demand by supply source. Petroleum will increase to 1980 and then level off. Natural gas will decline as a substantial percentage of the total, due to a substantial cost increase, substantial in both percentage and absolute amount. Costs will increase in the same manner for hydropower, nuclear, and solar energy, but these energy sources will rapidly increase in use after 1980 (with nuclear power playing the greatest role). We fore- cast the synthetics will supply 4 percent of the total energy by the year 2000.
Table 1 outlines Pace's forecast for domestic energy supply. Coal will double between 1976 and 2000. Domestic oil from the Lower 48 states will decline slightly but North Slope oil will take up the slack. By 2000, a significant portion of energy will be supplied by synthetics and solar energy, up to 2.7 million crude oil barrels per day in crude oil equivalents. The greatest uncertainty is in the nuclear power forecast. If nuclear power does not grow as projected, there will be severe energy shortages in the U.S. which cannot be met by petroleum, coal, or synthetics.
Figure 5 shows the amount of imports which will be required to meet demand. There will be very strong growth through 1980. Be- yond 1980, imports will level off somewhat as some of the efficiency programs plus new energy sources (such as nuclear) begin to "pay off." By about 1990, we will have accomplished all the savings we can through these measures and demand will again requir~ imports to grow.
Today, the United States refining induetry is protected by the Entitlements Program. If the federal energy program goes forward as it appears now, that protection will be eliminated, and in~tead of importing crude we will import a growing amount of refined products.
Figure 6 illustrates the typical refiney product slate in the United States. Gasoline, which has been the prime product for years, will slDw!y diminish as a percentage of the total. The distil- late fraction, which includes jet fuel and diesel, will have the great- est growth. Diesel will become much more impor~nt as a t ranspor- tation fuel, and jet fuel will continue to grow for many ye~rs.
-'89-
p P
IqOURE 3
UNITED STATES ENERGY DEMAND
60
48
•0 36
i : i24
12
11%
33%
INDUSTRIAL
3 3 % 2 1 %
~ . r T R A N ~
_7
HOUSEHOLD/COMMERCIAL 35~;
1970 ' , | ,, ,I ' I . ._
1975 1980 1985 1990 1995 2000
P P
Residual fuel will bui ld .:Up t h r o u g h 1990, and t h a n - - b e c a u s e pet roleum is basical ly the swing fue l for the en t i r e e n e r g y s y s - t e m - t h e need to conse rve petroleum w/il cause res idua l fuel oil to become a lesser fac tor be tween 1990 and 2000.
World Crude Oil Supply
It is important to understand world crude oil supply and the resulting effects on the supply of refined products. Figure 7 shows the energy demand forecast for the non-communist free world, with growth rates in total energy of about 3 to 3½ percent. The portion
• of demand supplied by oil is steadily increasing.
Figure 8 illustrates total oil demand. In the Pace Reference Case (our projection of the most likely energy supply/demand scen- ario), demand will rise from 45 million barrels per day in 1975 to 80 million barrels per day in 2000. The high and low cases represent correspondingly high and low economic growth as projected by the Workshop on ~ternative Energy Strategies (Energy: Global Prospects 1985--2000, published 1977). The Pace Reference Case corresponds to a worldwide growth rate of 4 percent per year for 1977m1985 and 3 percent thereafter.
Can this oil be made available? Table 2 shows production and reserves for the major areas in the Free World. Saucli Arabia, Ku- wait, and the other Middle East countries have both sizable reserves and very large reserve-to-production (R/P) ratios. The RIP ratio is a means of illustrating the potential for increased oil production based on proved reserves. The total Middle East has an RIP ratio of 52, whereas the ratio for the United States is 10 and the Free World average is 36.
A 10:1 ratio represents about the maximum economic prodaction which can he maintained for an extended period of time. The United States is probably the only country with the natural and technological resources to sustain this level of production against reserve addi- tions; a ratio of 15:1 is a more realistic limit for the total Free World. As demand continues to increase, reserve additions cannot keep up and the R/P ratio will finally level off to the point where increased production is not possible.
Figure 9 shows the historical rate of reserve additions in the Free World, according to two bases. Perspective One credits new discoveries to the year of discovery of the oilfield. If the discoveries are in a new oilfleld, they are credited to the date of discovery. !~_,
_.Qft_
P P
FIGU]~ 4
UNITED STATES ENm6Y SUPPLY PACE REFERENCE CASE
60 - 4%
48 &
22%
& I l l
24
12
33%
44%
1970 II i i |
1975
COAL
NATURAL GAS
PETROLEUM
1980 !
1985 1990
14%
36~"
• , ! . , v ~ m m m
19o.,5 2000
TABLE 1
DOMESTIC HNERGY SUPPLY
CRUDE OIL (nd~on B/D)
Lower 48 Alaskan North Slope
NATURAL GAS (TCF/~ea~) Lower 48 States Alaskan North Slope ~
NUCLEAR POWER (tho~md MW)
HYDROPOWERIGEOTHERMAL (thousand MW)
COAL (mi]Hon tons/year)
SYI~m~TICS/SOLAR (minion B/D)
1976 1980 1985 1990 2000
8,1 7.6 7.6 7.9 7.3 0.0 1.6 2.0 2.5 2.5
20.5 18.0 16.9 15.5 14.0 0.0 0.0 0.Y 1.0 1.7
35 70 128 907 360
115 138 174 198 240
671 781 906 1057 1438
112 230 424 921 2720
MGU]~L ,9 , 5
UNITED STATES ENERGY IMPORTS
15
12
~ 9
, IMPORT COSTS= I$ BtLLIO,~I
3 27 63 92 125 237
LING, LPG, & OTHER
REFINED PRODUCTS
3
] E
! , ,, , ! I 1 ,, 1,,
1970 1 9 7 5 1 9 8 0 1 9 8 5 1 9 9 0 1 9 9 5 2000
N
m~
I q G U I U r ,
ENERGY SUPPLY/DEMAND N O N - C O M ~ ~ WORLD
PACE RB=EI~~
150
m 0 0
100
OIL 4.1 2.1 1.7 2.3 G A S ~.6 2.9 3.6 3A NUCLEAR 21.8 13.9 6.5 12.,; COAL 4.8 3.5 3.5 3.7
however, they prove to be extensions of reserve in an existing "dis- covered" ollfteldo they are backdated to the date of discovery of the old oilfield. Perspective Two credits new discoveries or extensions to the chronological date that they occur, i rrespective of their being in new or old oilfields. According to the more conservative Perspective One, we have maintained a fairly steady rate of reserve additions between 15 end 20 billion barrels a year for the past 30 years.
Figure 10 projects when we wlll run out of oil. If we assume a reserve addition rate of 15 billion barrels per year and use the Pace Reference Case Free World demand rate shown in Figure 8, the R/P ratio starts out at 36 in 1975 and reaches 15 in 1997 or 1998. At this point, reserves will limit production. Figure ii uses the same tech- nique but provides a broader look. The reserve addition rate of 10 billion barrels p~-r year may be pessimistic, but we must ask our- selves: How many Middle Easts and North Slopes are there still to find?
Another important limiting factor is how much oil Saudi Arabia and Kuwait will be willing to produce. Currently, Saudi Arabia and Kuwait cannot use all of the money they are generat ing from their oil sales; in effect, they are putting the money in the bank and as the dollar depreciates, their oil revenues are losing value. We have looked at three different limits that Saudi Arabia and Kuwait may place on their combined oil production, 10, 15 and 20 million barrels a day. (They are currently producing very close to 15 million barrels per day.) The scenario for i0 billion barrels of reserve additions per year and the limitation of Saudi and Kuwait production to 10 million barrels per day (excluding the rest of the world) would speed up the R/P ratio of 15 to about 1987. If Saudi Arabia and Kuwait combine to produce 20 million barrels per day, which is more than they are currently producing, that ratio would not be reached until about 1995.
The "Energy Crisis"
I t is going to be very difficult to maintain these high reserve additon rates. Severe shortages of liquid hydrocarbons will be highly probable on a worldwide basis in 10 to 15 years.
Figure 12 shows the lead time on various energy sources that could possibly be developed to hold back this shortage. For nuclear power, frontier area oil (where the greatest possibility exists for large reserve additions), synthetic fuels, etc.. the minimum lead time is 8 to 12 years. The shortages are going to hit us in 10 to 15 years. Thus, if we start tomorrow, we may be able to meet part of the problem.
AMPLE SUPPLIES OF OIL SWING FUEL IN MEETING DEMAND
STABLE REAL ENERGY PRICES
FINANCIAL PROBLEMS
ECONOMIC PROBLEMS
APATHY
PERIOD 2:
@
@
@
1985 - 1995
POTENTIAL OIL AND ENERGY SHORTAGES
RISING REAL ENERGY PRICES
ACCELERATED TRANSITION MUST BEGIN
DEPENDENT ON PROGRESS IN PERIOD 1
PERIOD 3: 1995- 2800
¢ ALTERNATE ENERGY SUPPLIES OR ECONOMIC COLLAPSE
0 P
In summary, we see the ener~i crisis breaking down into the three periods shown in Table 3. .We are in the f i rs t period at this moment, and it will last to 1985 without any significant ener.ay short- ages. There is plenty of oil in the world which can be produced to meet energy demand. Oil will be, in effect, the swing fuel. If there is no nuclear program in this period, we will bring in more oil; if coal doesn't come forth, we will again bring in more oil. We-would e x p e c t d u r i n g m o s t o f th i s p e r i o d to h a v e f a i r l y s t a b l e e n e r g y p r i c e s , wh ich will go u p wi th in f l a t ion , b u t p r o b a b l y n o t m u c h f a s t e r t h a n in f la t ion . H o w e v e r , d u r i n g t h i s p e r i o d economic u n c e r t a i n t i e s will b e b r o u g h t a b o u t b y t h e ba l ance o f t r a d e d e f i c i t s a n d t h e a d j u s t m e n t in our economy (and others) from what was $2 oil less than five years ago $12-$15 oil today. The largest problem we are facing at this time period, however, is apathy. We see the "energy crisis" but we are not doing anything to meet it and we are ignoring, to a great extent, the 'economic and technological problems.
The second period will be from 1985 to 1995. During that pe- riod, the potential exists for actual oil and energy shortages. The price of energy will rise in real terms, faster thm~ the rate of infla- tlon. If we haven't made some real progress in Period One, there will be very tough times as far as energy is concerned. It will be a period in which we will get so close to the end of the rope, we will have to accelerate the transition. This transition away from oil may start in Period One, but if not it must start on a massive scale in Period Two.
In the third period (1995-2005), we will have either started major progress away from petroleum or we will have an economic collapse. There will not be any petroleum and it will take some massive effort to have sufficient conversion to other energy sources by that ~ne to make economies operate.
HYDROGEN IN THE UNITED STATES REFINING INDUSTRY
Our overall energy forecast focuses the analysis of hydrogen supply/demand in future refinery operations. The changing energy situation will create corresponding alterations in the refining indus= try, and thes~ will have signiflc~-~t impact on the hydrogen market- place:
I. Gasoline demand is projected to level off in about 1980 and then decline as a percentage of production. This will cause a general decrease in the hydrogen producea by catalytic reformers.
-92-
I "...:.. .... ..... ~... : ..'.....?.:.~,.-.:~
D 9
.
.
.
Distillates demand will increase substantially, particularly in the residual fuels area, leading to increased demand for hydrotreating and a greater hydrogen requirement.
The crude mix to refineries is tending toward more sour crude, which requires increased hydrotreating to remove the sulfur from thc products.
Environmental regulations on sulfur oxide emissions will continue to tighten; as sulfur percentages in the various fuels decrease, the demand for hydrogen in hydrotreating will increase.
Industry Supply/Demand
These trends in refining indicate an increasing demand for hydrogen and the overall importance of hydrogen in the refinery operation, Figure 13 shows refinery hydrogen demand compared to the hydrogen demand in the ammonia and methanol industries (the largest single users of hydrogen). Hydrotreating and hydrocracking demand in refineries is about one-half that in the ammonia manufactur- ing and nearly twice that for methar ~'.
Overall hydrogen supply in refineries (from catalytic reformers and hydrogen generators) is almost twice refinery demand. There is a surplus of about 1.2 billion standard cubic feet per day of hydro- gen for the industry as a whole. However, this overcapacity does not exist in every refinery; some are in extremely short supply, and must generate their own hydrogen (as shown in Table 4).
Figures 14 and 15 present projected hydrogen supply and de- mand. Supply comes mainly from ~so l i ne refozming byproducts and is supplemented by hydrogen plant hydrogen. The hydrocracking and hydrotreating demand components show substantial increases at the expense of surplus byproduct, which is normally used for fuel. I t is important to analyze the hydrorreating demand for hydrogen since it shows the greatest increase. Figure 16 shows the dramatic increases in demand for distillate gas oil and atmospheric resid. Gas oil de- mand will double within a five-year time frame.
Effects on Individual Refineries
The rapid increases in hydrogen demand for the hydrotreating processes can cause severe hydrogen shortages in individual U.S. refineries. To analyze t~.is effect fully, we must look at refinery
-93 -
p P
I I ' I I i i !
l I B oO i .,, I t ] . . . . . . . . . l ~ )
ia=los HOml810NVWaa ~H
::', : . , . ~ ,
U
p 0
filial
, ~
i i i
p P
HGURE 14
4000
3500
w ~ m 3000
~2500
~- 2 0 0 0 ft.
E 1500
lOOO
500
0
T O T A L U . S . R R F | N I N G i N D U S T R Y
F R ~ I E t ~ r F . ~ HYIDI~DOGEN ~ L I I P P L Y I l l I I I I1 I ' i l l ' - -
T O T A l - U . S . R E F I N I N G I N D U S T R Y P I ~ O J F ~ E D H Y D R O G E N I I : ) E ~
I '1 I
TOTAL DEMAND
CONSUMER OFF GAS AND SURPLUS BYPRODUCT
f ~
~"-,-..,...,~. HYDROCRACKING ~ ~ . ~ - - ---...........__....~.,..~,~.p'.'~-- • ar,,mF.4ur, sp-,amw:a~.a~F, J r , m r , gw',.mr, Jr.L ~ r ~ . a m ' ~ l j
HYDROTREATING
| il ! _
"i977 1980 1985 !
199o
I
lrlGU]~g 16
TOTAL U.S. REFINING; INDUSTRY
'IROJECTED HYDROGEN
4OO
~-'300
12
• I imlml m l I I i i
\
m mmm~mmm ~
DEMAND FOR HYDIROTIREATING
NAPTHA
1977 1980 1985 .... 1990
P p
location, type, and complexity and the existing hydrogen balances within each refinery. Our analysis of these factors shows that about 1.6 billion standard cubic feet per day of hydrogen will be required in 30 refineries representing 34 percent of total U.S. refining capac- ity. There are today and will be in the future severe localized hydrogen shortages.
We have analyzed the hydrogen situation by geographical area. Figure 17 shows the Petroleum Administration for Defense Districts (PADD) representing the breakdown used by the Pace Energy Model. Each district has a different hydrogen requirement and hydrogen supply/demand balance, as summarized in Table S. In PADD 3 (the Gulf Coast) and PADD 2B/4 (primarily the Midwest), there will be very great increases in hydrotreating throughput which will cause strong local demands for moderato-to-high pur i ty hydrogen. In the Midwest, the replacement of sweet crude by more sour crude will further increase the demand for hydrogen. The West Coast shows hydrogen demand rising because of increased hydrotreating.
SUMMARY
Our analysis shows the energy balance in the refining industry to have great impact on hydrogen supply/demand. On the average, there is an oversupply for the entire industry, yet large hydrogen shortages exist in certain U.B. refineries. Most refiners have placed top priority on ensuring present and future hydrogen supply/demand balances. The refining industry presents an excellent market oppor- tunity for hydrogen purificat/on/recovery technology and hydrogen generation processes.
-94-
P P
m i l l | j l i
1
i |
C~
|
IN
P
PADD 1
@
o
~'ABLE 5
PROJECTED U.S. HYDROGEN BALANCES, BY REGION
ADEQUATE I-I 2 GENERATION CAPACITY
MINOR GROWTH IN HYDROTREATING AND HYDROCRACKING
PADD 2A
• H 2 GENERATION AT OR NEAR FULL CAPACITY
• MINOR GROWTH IN HYDROTREATING AND HYDROCRACKING
e SURPLUS BYPRODUCT H 2 GENERALLY AVAILABLE
PADD 3
• HYDROTREATING THROUGHPUT TO DOUBLE BY 1990
• INSTALLED GENERATION CAPACITY ADEQUATE iN MOST REFINERIES
• STRONG LOCAL DEMANDS FOR MODERATE-TO-HIGH PURITY H 2
PADD 2]3/4-
• HYDROTREATING THROUGHPUT WILL MORE THAN DOUBLE BY 1990
• SOUR CRUDE BEGINNING TO DISPLACE SWEET CRUDE
• STRONG LOCAL DEMANDS FOR MODERATE-TO-HIGH PURITY H 2
PADD 5
• 84 PERCENT INCREASE IN HYDROTEATING BY 1990
• 15 REFINERIES WITH H 2 GENERATORS (57 PERCENT OF U.S. REFINERY H 2 CAPACITY)
P P
APPENDIX Vl
SUBIECT:
Production Economics for Hydogen, Ammonia and Methanol During the 1980-2000 Period
AUTHOR(S):
Hampton G. CorneJl Exxon Research and Engineering Co.
Linden, N. ~.
CONTENT:
Tables and Figures
-95..-
D n
P ,-4 P
Q
o i =~ ~ ~ ~ o~ ~.
"~ . o o o o o o o o ~
0
C~
Z
z 8
Z
Z 0
13 Z Z m Z ~ m Z ~ 0 0 ~ 0 >-,
n 13
Z u2
Z
0
>,
Q
0,1 • C~
°1 , - M
CX) °
N
8 8
P
P . • • " ' " " ' ~ n
~;~:" :~ 7
• '.:, •
L' ~'... ~ . . ~::.
.. ~. .. :::. ::.,~..,.~.'~.'::- . . . q ,
I o
~1 o'
C~ ~J
z
0
0 0 O
• -~ ,,D ~ R II ,ee'~
IP • •
I
o o
• • Q a
0 L . "4O
O 0
, , , , 4
(,,.,,
o
0 I-,,
p P LF~
J
Z N
0
I~1 "
~-, l,.-.~ I
('Xl
I"%
O0 x,O
oO X.D (~I
I'%
O~
xD
..,.-I-
(Xl
o o0
('Xl
0 0
0 (xl
o o o ,,,,=,,I
,.,--I
0 0
0 ,,--,,I
..l-I
0 o..
oml
0
II
:::)
.l,a 0 F=,
I.
~.:..
, . ' ;
i i '
' . . - .
I I '
LU
oF. C~
°tl* e r e
® E l - e UJ E a W
m
0 E
n_t ° co 8~ -~-~
w z :
=0~ X ~lAIrllBn l ~ H v n NBOOUGAH UHSI177VW8 |
|
.. m
ILl
<
Z 0 i- <
~o
!o i
z~ 8~ 8 .=
II
b L ,
0 O C)
!
o
O~
@
!
(J
o
!
~n ~ o ~ ~ ~
to P
z o ~.~.~ m o . ~ 0 C 3
g_o e : ~ 8 ~ .,.~<..<<<<<<,,~<<<<~<~<........,,....,~.,.~o>.~>.~>,<~<,=:o>>:<<..,...,~,..1....,,.~, ~,.
Dr. Paul A. C. Cook Manager, Feedstock & Energy. Technolgy
Celanese Chemical Co.
Presented to: ~Vorkshop on Hydrogen as Chemical Feedstock, University of Houston,
December 12-14, 1977
-97-
P p
P P
Figure 1: Chemistry
Figure 1 shows the simple reactions for making methanol from carbon monoxide and hydrogen. Two tools of hydrogen react with one tool of CO to form a tool of methanol. The reaction takes place over a catalyst at elevated temperature and pressure. In practice, you need excess hydrogen to maintain catalyst activity. The reaction generates heat which is usually used to generate process ~eam.
The second reaction shows how a suitable synthesis gas can be made from methane (nararal gas) by steam reforming. This reaction also takes place over a catalyst at elevated temperature and pressure. Heat must be added to this reaction by burning fuel gas or oil.
The theore~cal minimum amount of methane requlred is 65 stan- dard cubic feet per gallon (SCF/gal) of methanol. The old high pressure methanol units had actual methane requirements of 130-160 SCF/gal. Modern low pressure technology with heat recovery allows usage rates as low as 100 SCFlgal. Hence, if natural gas costs $2.00/1000 SCF, as it does here in Texas, raw material costs alone are 204 per gallon of methanol.
Figure 2: Producers
Existing methanol producers and published capacities are shown in Figure 2. The reference for most of this information is the ~uly I, 1977 issue of Chemical Profiles. Compared to current capacity of 1312 million gallons per year the demand in 1976 was 946 million gallons. Estimated demand in 1977 is 1015 million gallons and in 1981, 1360 million gallons. This is an annual growth rate of about 7% per year and assumes no major new uses for methanol, such as fuel. Dupont and USI hav-~ announced a joint venture for about 200 million gallons of methanol to be made from synthesis gas produced by partial oxidation heavy fuel oil starting in 1979. IMC and Air Products have also announced plans for a joint venture methanol plant of about 140 million gallons to come on-stream in 1980.
Figure 3: End Uses
Current uses for methanol are shovnx in Figure 3. By far the largest single use is in production of formaldehyde which is, in turn, used for making various resins. The ultimate end use in in pll~., od and pertical board used m the building industry and in plastics, coating and fertilizers. General process solvents are next with 10% DMT or ddmethy.! terephthalate is used in polyester for fibers and
-98-
P o
P P
plastics. Acetic acid is a relatively new use for methanol. Economics favor most future growth in acetic acid to be made using methanol carbonylation tectmology.
Potential new uses for methanol are in fuel, protein synthesis, peak power generation and sewage treatment. Many of these will require significant breakthroughs in technology to become commercial.
Fiqure 4: Demand for Hydrogen
Existing methanol capacity is equivalent to about 375 million standard cubic feet per day (SCFD) of synthesis gas containing 2.5:1 ratio of hydrogen to carbon monoxide. This cap=city will eventually be required, if and when natural gas becomes unavailable as a chemi- cal feedstock. Future growth in chemical end uses. will equire about 60 million SCFD of synthesis gas at about two year intervals. Source of the synthesis gas will depend on future price and availability of natural gas, petroleum and coal. Availability of low cost natural gas in the Mideast may have an impact on world methanol markets. Sev- eral companies are sntdying *=he feasibility of producing methanol in the Mideast.
-99-
o D
P P
2H 2
Figure I
METH,ANOL, SYNTHESI~
CATALYST
+ CO ,,, ~ CH30 H TEMPERATURE
PRESSURE
STEAM REFORMING
CATALYST
CH 4 + H20 ~ 3H 2 +
TEMPERATURE
THEORETICAL MINIMUM 65 SCF/GAL
CO
o P
p P
Figure 2
METHANOL Pi~ODUCERS
EXISTING PLANTS
AIR PRODUCTS
BORDEN
CELANESE
DUPONT
GEORGIA PACI FIC
HERCULES
MONSANTO
ROHM & HAAS
TENNECO
CAPACITY IN MILLIONS OF ANNUAL GALLONS
60
180
380
3OO
120
100
100
22
80 m
TOTAL 1312
P P
D P
Figure 3
METHANOL END USES
AREA
FORMALDEHYDE
SOLVENTS
DI-METHYLTEREPHTHALATE
METHYL HALIDES
METHYL AMINES
METHYL METHACRYLATE
ACETIC ACID
EXPORTS
MISCELLANEOUS
TOTAL
PERCENT
43
10
7
4
4
4
5
10
13
100
I:) I:)
P P
Figure 4
DEMAND FOR HYDROGEN
MILLION SCFD . OF ~ N GAS
FOR EXISTING CAPACITY 375
TO MAINTAIN 7% GROWTH E0 (AT 2 YEAR iNTERVALS)
0 0
APPENDIX VIII
SUB~CT.:
Production of Ammonia from Coal
AUTHOR(S):
Da~-id Netzer Fluor Engineers & Constructors, Inc.
Houston, Texas
CONTENT:
Viewgraph
-100-
P D
Z 0
<
0 I-- . J
.0 i
l , i . I L
0 Z 0
re llm > Z 0 CJ
0 0 ~ m
o ..,,~__ m X 0 : 0
,mmm
+
l l l l
Z 3: ~ 0 z N
<
?
~ ..~{_._. E Z <
-t-
w O i " "
O < ~:. N ~ m
:1: " { ' - " > 3: z m O
LL ,,,i <.
+ u l
E -J (:3 < , -
Z Z O O
< <
Z Q E E F - < <
, j
c~
O P
0 m
i11 > Z 0 (J . . ! < 0 m
(J <
~L
Z Z
O 0
< <
, . i . J
Z
, . I - J
Q Z <
< . J
i11 > 0 ® o EL!
m
0
. 1
I-- Z I
. .1
a ~ z ~ < u .
. t
< w , . I u l
re U,I I- <
Z I
_1 0 0 0 ~u
.J
0 Z
®
APPENDIX IX
SUBJECT:
Use of Hydrogenation in The Edible Oil Industry
AUTMOR(S):
R. S. Watson Anderson, Clayton & Co.
Dallas, Texas
CONTENT:
Technical Paper
-101-
p p
USE OF HYDROGENATION IN THE EDIBLE OIL INDUSTRY PRESENTATION FOR UNIVERSITY OF HOUSTON WORKSHOP
The edible oil indus t ry is a food industry; however, in process-
ing the basic raw material (a fat or a tr iglyceride) i t has some simi-
larity to the chemical or petroleum indus t ry- - normally on a much
smaller scale.
There are four basic uni t processes in convert ing a crude fat
into an edible product in the form of a shortening, margarine or a
salad oil. These are:
1. Caustic Refining:
2. Bleaching:
3. Hydrogenation:
4. Deordorization:
Remove impurities and color.
Remove color.
Chem/caily treating the fat with Hydro- gen to extend shelf life and control consistency.
Steam distillation to remove odor and flavor-bearing compounds.
Other processing, such as emulsifier production, intersterifica-
tion and winterization are performed on speciality products. How-
ever , the largest chemical reaction in the edible oil industry is hy-
drogenation. The hydrogen genrated and used for this reaction is of
in te res t to this workshop.
Digressing for a minute, I would like to discuss the triglyceride
or fat . I t contains a glycerol radical that has th ree fatty acid radi-
cals at tached. These fatty acids can be all identical; however, that
is ra re in nature and usually there are two to t h r ee different fatty
acids attached. The fatty acids are predominately a chain containing
16 to 18 carbons.
-102-
p D
P I:)
In special fats, the fatty acid chain does contain as few as four
carbons in the case of butter fat, and as high as 24 carbons in the
case of some fish oils.
Another characteristic of the fatty acid is that in most of the
domestic vegetable oils, the carbon chain is unsaturated or contains 1
to 3 ethylenic linkage in the radical. Oils predominantly used in the
U.S. contain a high degree of unsaturation, such as soybean oil,
corn oil, and to a lesser degree cottonseed oil. These oils are liquid
at normal temperatures and have a tendency to oxidize or polyminize
in the unsaturated state. By chemically reacting these materials with
hydrogen the keeping qualities can be extended and the consistency
of the product can be controlled. The melting point of the fatty acid
is increased as hydrogen is added to the radical.
Hydrogenation may he considered for the purpose of this meeting
to consist of a very simple addition of hydrogen to the ethylenic
linkage. (Actually, the reaction is extremely complex.) The hydro-
genation is accomplished in the presence of a catalyst, normally
nickel, at minimal pressure and a temperature range of 325°F to
400OF.
The hydrogenation of the unsat-tlrated fatty acid, shown in
Figure 1, is a simplified version of reaction. The reaction sequence
of the hydrogenation of a molecule of linolenic acid, the three double
acid, as the first double bond is hydrogenated, tinoleic and isolinoleic
are produce.d, etc.
-103-
0 0
0
As stated earlier, the purpose of hydrogenation is:
1. To improve the keeping qualities of the finished prod- uct.
2. To produce a more serviceable product by controliing consistency. Shortening could not produce the best baking qualities for a cake unless it was a plastic material.
Except for a very few cases, the hydrogen used is produced on
site as an integral part of the operation. Therefore, there are sev-
eral relatively small hydrogen generating plants located throughout
the country.
The number of hydrogen plants, the amount of hydrogen pro-
duced, and the energy used to do this is difficult to obtain. The
estimates I am using are strictly mine and should be used with that
qualification.
Table I is my estimate of the hydrogenation profile in the edible
oil industry in the U.S.
Table II is an attempt to show the energy consumed in generat-
ing hydrogen in the edible oil industry. There have to be many
assumptions made in such a projection, but it should give this work-
shop a range to consider.
When I started in the industry we were using the steam/iron
method of producing hydrogen through the use of "blue gas" made
from coke--we m y ,go back to that--Now almost all the generating
units are hydrocarbon reforming and most were instslled during the
late 1940's through 1970.
--104-
0 D
0 0
As shovm in Table II , the newer generat ing uni t s are much more
efficient than those tha t are in predominate use. A quick and rough
calculation shows tha t the potential energy savings on the newer uni t
is substantial , but hard ly enough to just ify the expenditure of re-
placement unless the uni t needs replacing because of other reasons.
Electrolysis is used in other countries which do not have meth-
ane or other hydrocarbons readi ly available. Some of us feel that i t
will be a replacement in th is country in the long run . The price of
power is such that most people cannot consider electrolysis in the
near future unless co-generation can be instal led. Co-generation
would allow the use of cheaper fuels such as coal, and also could
generate power more efficiently than is being done b y the utilities.
On the "average, i t takes 10,500 Btu's input to obtain one kilowatt
tha t has 3,412 Btu's of work or heat available--off-peak utilization
may also make electrolysis aL'~ractive in some pa r t s of the country.
All of us are facing the possibility tha t natural gas will not be
available. If this happens , the immediate backup is propane for the
feedstocks and for the fuels. However. I dare say that many of the
furnaces will probably be modified to burn distillate. The other
backup would be naphtha which would take modification in some of the
older units.
It might be mentioned here that the older generating units use
MEA scrubber systems to remove COs and CO from the generated
hydrogen. Whenevar the feedstock is changed to propane, the capac-
ity of the scrubber system can reduce the output of hydrogen. If a
- 1 0 5 -
p 0
0 p
plant is operating at capacity, this can create a problem. For hydro-
genation in the edible oil industry we require a purity of 99.9~o plus
inerts in some cases where nitrogen content is reletively high in
natural gas.
The cost of hydrogen produced will, of course, vary consider-
ably, but a good round figure to use for Mcf of hydrogen produced
---currently including period cost--would be $2.70 to $3.00 Mcf, or
$8.31 to $9.23 MM Btu using 325 Btulcf of hydrogen. However, the
edible oil industry does not use hydrogen for its Btu content.
Savings that can be made in using alternate methods of generat-
ing hydrogen do not look very promising in the short-term to offset
capital expenclimre. So in the next 5 to 10 year period we do not
expect to see the more "exotic" methods replacing present facilities.
The changes will be more likely the changing of the feedstocks to
LNG, LPG or naphtha, and the changing of the fuel to distillate from
natural gas. We see in the long-run eliminating the use of fossil
fuels in hydrogen generation. The processes that look most promis-
ing are:
1.
2.
3.
Electrolysismuse of off-peak power or co-generation
Thermo-Chemical cycles
Solar.
RSW: cw 12/8/77
R. S. Watson
-106-
P 0
P P
HP
c~ i-i
r j i-i
1,4 ,-1
p p
TABLE I
EDIBLE OIL INDUSTRY IN U.S. -,. ii i i
HYDROGENATION PROFILE
TOTAL OIL HYDROGENATED YEARLY
TOTAL HYDROGEN PRODUCED YEARLY
NUMBER OF HYDROGENATION GENERATING UNITS
SIZE OF GENERATING PLANT
AVERAGE SiZE PLANT
REPLACEMENT COST (1977 DOLLARS)
TYPE OF GENERATOR
PRIM~,RY FUEL
PRL~ARY FEEDSTOCK
SECONDARY FUEL OR BACKUP FUEL
9,000,000,000 L B S .
5,850~000 MCF
65 + 1
i0 MCF TO 40 MCF/EOUR
20 MCF/HOUR
$i,200,000/PLANT
HYDROCARBON REFORMING
NATURAL GAS
NATURAL GAS
PROPANE
p 13
,,,.a,
m
m
o
o
J !
~Nseee~
il 0
0 ~0 0
m
t n
41
r~
Z
0
0 O
APPENDIX X
SUBJECT:
Hydrogen for lsocyanate Processes
AUTHOR(S):
David C. Owens Mobay Chemical Corp.
Pittsburgh, Pennsylvania
CONTENT:
Viewgraphs
-107-
p P
FIGURE I
ISOCYANATE CHEMISTRY
CH 3 CH3
Q +2HNO3 -- -~0 N°2 ÷ 2H20 NO 2
TOLUENE DNT
CH 3 CH 3
..•NH2 No2 "1" 6H2 "!" 4H20
NO 2 NHp. DNT TDA
CH 3 CH 3
NH2 -!- 2 C 0 C L 2 " ~ NcO -I- 4HCL
NH2 I NCO TDA TDI
2C0 -I- 2CL 2 ----
OGN O - C H 2 " G NCO
MDI H2/CO = 3/~
F~GURE II
ISOCYANATE MANUFACTURING - BLOCK DIAGRAM
TOLUENE
AMMONIA AIR
P p
METHANE STEAM "
J --~ REFORMER
i
HYDROGEN
DNT
i,li L HYDROGENATIO N
CO TDA
TDi
i i III ~ i i iii
0 0
1976
TDI
MDI
OTHER
FIGUR~ III
H2/CO CONSUMPTION FOR ISOCYANATES
~ LB
564
H 2 C0 ~,i LB ~L~I LB
45 225
17 83
2 i0
64 318
32,000 159,000
20 MM SCFD (fuel & feed)
313
Total, MM LB.
Tons
Equivalent Natural Gas:
1980
TD7
MDI
OTHER
NOTE:
712 57 284
510 28 135
3 15
Total, MM LB. 88 434
Tons 44,000 217,000
Equivalent Natural Gas: 27 MM SCFD
Hydrogen r..gures increase by about 60% if H 2 for ammonia is included.
D D
APPENDIX XI
SUBJECT:
Hydrogen for Fuel Cells
AUTHOR(S):
A. H. Levy United Techno}ogies Corp. South Windsor, Connecticut
CONTENT:
Viewgraphs and Narrative Comme...t~
-108-
O n
The following are notes which supplement the accompanying slides. %
Slide 1 - Fuel Cell Concept
- The fuel cell is a direct energy conversion device which electro- chemically reacts a hydrogen rich fuel with oxygen from the air to produce d,c, electricity.
• The products of the reaction are water and heat.
• The water is removed as a vapor with the exhaust air,
• The heat is usually removed by a circulating liquid coolant--but is eventually rejected m air or water.
• Single cells are operated so that they produce about .6 volts and power densities in the range of 200 watts per square foot of electrode area.
• Single cells are assembled into stacks of varying sizes to pro- duce a wide range of output power levels and voltages.
Slide 2 - Apoll o Fuel.Cell Powerplant
• United Technologies (UTC) entry into the fuel cell market oc- curred in the early 1960% with the manufacture of the Apollo powerplant,
• This device provided all of the electrical power requirements for the command and service module.
• It was designed to operate on pure hydrogen and oxygen react- ants and to provide 1.5 KW for about 400 hours.
• UTC is present ly supplying the fuel cell powerplants for the Space Shuttle Vehicle. Each of these units will deliver 12 KW.
Slide 3 - The Fuel Cell.Powerplant
• Commercial fuel cell powerplants operating on fossil fuel and air are composed of three main sections.
• The reformer section converts natural gas , propane and l ight distillate fuels into a gaseous mixture of mostly hydrogen and carbon dioxide.
-109-
P P
• The fuel cell power sec t ion cons is t s of a n u m b e r of individual cells which promote t h e electrochemical combinat ion of the h y d r o - gen in the p r o c e s s e d fuel and oxygen from t h e a i r to p roduce d i r e c t c u r r e n t e l e c t r i c i t y .
• In the fuel cell stack a number of cells are connected in series electrically to permit generation at a wide range of voltage levels.
• Connecting a number of cell stack assemblies in series and/or parallel permits generation of any power level from kilowaUs to megawatts.
• The solid state inverter converts d.c. electricity to a.c. of the proper quality for commercial application.
Slide 4 - Fuel Cell P owerplant Characteristics
- Fuel cells are efficient energy conversion devices at all size levels. They also are able to maintain this high efficiency characteristic at part power.
• The powerplant elements can be built in modul~r fashion at the factory and pretested. The modular concept also provides for wide size flexibility.
• Powerplants may be located close to load centers:
-Noise and vibration are at low levels due to the minimum use of rotating equipment.
- Emission levels are extremely low for gaseous products such as SOs and NO x as well as particulates.
-Water recovery within the powerplant, permits operation without the need for an external water supply.
• The fuel cell also has the potential for use in a co-generation mode since waste 'heat may be recovered in the form of low pressure steam or hot water.
Slide 5 - Commercial Fuel Cell Programs
• (Data on cha r t is s e l f - e x p l a n a t o r y . )
-liO-
P p
Slide 6 -Field Testing of. on-site Powerp!ants
• During the period between 1971-73 a field test program was carried out under the TARGET (Team to Advance Research in Gas Energy Transformation) program.
• 65 powerplants were built, each with a rating of 12.5 KW, and were installed in 35 installations in the U.S., Japan and Canada.
• Tests were conducted in such locations as private homes, apart- ments, offices and substations.
• A total of 205,000 operating hours of experience was obtained which was beneficial in defining "real" operating and maintenance requirements. These tests provided valuable data which was used in the design of the follow-on 40 KW powerplant.
Slide 7 - Fuel Cells Open New Possibilities
• The characteristics of fuel celt powerplants permit them to be considered as dispersed generators and placed in areas close to load centers. This reduces transmission requirements in terms of cost, electrical loss and right of way land acquisition prob- lems.
• Also the modular construction enhances transportability making available sites which are accessible by conventional transport methods.
• Small scale powerplants may be located within existing buildings or on rooftops.
Slide 8 - Typical PCG-1 Installation
• This slide depicts an art ists ' rendit ion of a 26 ~ uti l i ty power- plant . The fuel proces'smg modules are located on the left and the fuel cell modules on the r igh t , Between these two sections are the inver ters and t ransformers . Dry cooling towers ere located above both the fuel cell and fuel processing modules.
• The design specification cells for a heat rate of £ 300 BTU/KW- I-IR; fuels to be light liquid distil lates; transient response from minimum to maximum power in 15 seconds and gaseous emissions to meet EPA an NYC regulations,
• Equipment footprint will be approximately 1500 square fee t with a maximum height of 20 feet.
-111-
0 0
Slide 9 - 1 MW Pilot Powerplant Experience
• UTC is presently operating a 1-MW pilot plant at its South Windsor facili~. This plant has demonstrated a number of operating functions, including start, stop, rapid transients, low emission levels, and verification of utility quality power.
• A 4.8 MW demonstrator powerplant is being built which will be installed in N.Y.C. and operated, by ConsoLidated Edison in the latter par t of this year.
Slide I0 - Near Term Electric Utility Applications
• This chart describes four possible application modes for the 26 MW FCG-1 powerplant.
• In the first case, since the fuel cell has a relatively fiat heat rate characteristic, it can be used as the spinning reserve capacity for a utility system. This then allows the cycling steam plants to operate at their most efficient point, and results in reduce system oper~"ing costs.
• It is an attractive option for rural and municipal utilities since about 80% of these companies require plants with less than 45 IVfW capacity.
• The fuel cell provides an alternative method for meeting in- creased loads in congested urban areas having restrictive "sollu- tion standards and limited potential for new transmission rfghts- of-way.
• Finally, the fuel cell may be used in industrial complexes to provide both electrical and thermal needs , with excess electricity funnelled back into the utility network.
Slide 11 - Fuel Cell Application Concept
• In association With i~dustry the £uel cell may be used to provide electric and thermal energy from by-product fuels. Some poten- tial applications are listed on the slide.
Slide 12 - Dual Mode Fuel Cell Powerplant
• An energy storage concept that has been proposed would utilize large base load generators to electrolyze water during off peak per iods , - - s tore the hydrogen product in hydride beds, and then use the hydrogen in fuel cells dur ing peak load periods.
-I12-
p
• The fuel ce)Is may also be prov/~ed with reformer units so that they can operate independently with the use of a hydrocarbon fuel.
Slide 13 - 40 K w .Pilot Plant Testinq
• UTC is presently testing the smaller 40 KW powerplant at South Windsor and have over 10,000 hours of operating time. This powerplant has achieved a 40% electrical efficiency.
• The powerplant has also been used to demonstrate an integrated energy system, and has operated with a heat pump, an absorp- tion air conditioner and an air m water waste heat recovery unit.
Slide 14 - Fuel Cell Market Potential
• Market estimates have been made for the fuel cell in thr~ gen- eral application areas; Private Utilities; Municipal & Rural Utili- ties and On-Site Integrated Energ'i Systems.
• As m any market study projections, a number of assumptions must be made, ranging from utility growth rate; degree of product penetration and capacity factor to cost and characteris- tics of competing equipment. All of the assumptions made for this study are delineated in the reference given on the slide.
• A high and low market estimate was made for anticipated 1990 additions. These were made based on the use of hydrocarbon fuels such as natural gas, oils and products from coal. The low range market estimate represents a 14% share of the anticipated total new generating capacity.
• While hydrocarbons are the basic fuel input each fuel cell power- plant incorporates a reformer subsystem for converting the hydrocarbons to a hydrogen rich stream. The hydrogen being the reactant necessary for the electrochemical process . Convert- ing the projected megawatt additions to equivalent hydrogen consumption per year resul ts in a range of from 3.3 - 6.7 × 10¹² SCF/YR for 1990. This represents more than the total U.S. industrial requirement for hydrogen in 1975.
~113-
P p
I,,-,' 0,,,
Z 0
.__.J
.__J
iL,a,,,,,
0 ]. ,--
_...a
ILaLd
e.qL a
,,,,,D
z a t e
a
i,,,,, u a l . I
O"
...._a I,a,a
m
I n
3E
U . r,,,
ILl a mamD
...I Or)
O
~ P
Z m
m ~
Z ~
o
W
I I I I Y I1|1
~ ~ .
N •
P
I - -
OR
w
R i O
0 I ~ I l l l i l l l l ~ l ~ i ~ D R B l l i I I R
nl
z ! = ~ I ! n | ~ I i
~ I:D U,I
I k m |
m !
® ~ W i i ~ m ~ 8 ~ m ~ m ~ i l i i m W ~ ~ I D l i ~ i ~ i i l i S ~ Q ~ l l l D O ~ t
" ~ ~ m
• - = " - ~ :"
®
Iji. t'~
1,0,,I a i
/
c~
J 0
l u l l
P D
G3 m
ll---
l
I - -
i - - Z
._A A_
Z N I ¢p~ O
a_
O e n Z
. . I
O
Z i - - m o ~
. . I
O G3
q.
I - - W m . . I - - ---- ...I m
... ~ W
.J
Lm.
I~ 0
1,1.1 t.Ln 0 ---- f ~ I ' - -
MimEm
___n ~ . . ___n n J
- J g ~ l - -
G O CI~ - "
n,n.u , ~
.__n m _ n , ~ ~ . . I
LI. I~.
Z
A ~
W , ~ . _ j O .
Z
0 n _
!-1 0
Z i
I , , - ,
_ _ !
i
m
Z
0
o
0 m
• •
t r
t-- [
Q
" ~ - D ' . ~ , , . :~b _._a ._._a
I - -
. Ii o
B__
O
E o Z
• •
era,,
z
• o o
h - Z L ~
E e ~
L
o
R I - - z
0
o o LM O
j! O
P 0
U'J ILl m
I-.. I m m
I
m , J c ~
; K
..z. Q..
, , , J . - , J
i=
r.D
"T
LL _._!
I J J
Ls, .
r ~
O r . . u . r r
0 I m m B
i . -
a ~ b J
L , J
o I , I J
I.kl a . . U~ m J m
r-.
LLI 0 9emm
..J ct)
@
U~ ||
P P
Y..d
l
ql
i!
LL..
.___I
/
/
I
i
f.
t •
. i,,.J-
'.... \
kl i '\ \
i
,..°.
i .-. .--.~
~ w
f--~ k
• ~ = . _ / Z - - - - '
.s
.... mmllllm~ i..
Ii-I~
GO
hl r'l m
i
J O
P P
L , J
Z w m m , m .
L , J O.. X L , J
C3 L U I.-.-
p . .
Z 0 =S M J
Q . 0 I n r.n
>.. ~n o
¢n
i . -
i - - u'J
0
F-.
Z Z 0 - . -
Z
p. .
d~
n~_ >. .
a . . ~ - C )
. :~ z c= ,-.- 0 0
0 • ® O @
Q=: r ' J
Z
m m m l
:).. = : k~, (=r u'J
B _ . J m . . . j - - J l ~
,,C
I . u . - . I,--. JJJ - - ' , ~ U ' ~ ~ - ~ , ~ O.. w J r , ~ = ~ Q,.
CONVERSION OF ILLINOIS NO. 6 COAL TO SYNTHETIC CRUDE
Reactor Yields
Component Wt.% Dr~ Basis °API
H2S 4.01
NH3 0.82
H20 9.51
CO2 0.42
CH4 3.05
C2 2.91
C3 2.30
C4 2.40
C5-400°F 15.88 41.8
400-500°F 7.92 22.2
500-975°F 23.95 11.5
975OF+ 16.95 1.3017 S.G.
Solids 14.34
104.46
H2 Consumption 4.46
-115-
P P
APPENDIX XIII
SUBIECT:
Hydrogen Poduction via Koppers-Totzek Process
AUTHOR(S):
Jim Michaels ' Koppers Company, Inc.
Pittsburgh, Pennsylvania
CONTENT:
Technical Paper
-iZ6-
p p
INTRODUCTION
The present information containing current costs end technical information about hydrogen production via the Koppers-Totzek coal gasification process was developed as a contribution to a Department of Energy spo:asored workshop concerning hydrogen and its role as a chemical feedstock. The economics of hydrogen production from traditional feedstocks such as natural gas and oil der'matives have changed considerably in the past few years and promise to continue this pattern in the future as the prices and supplies of liquid and gaseous hydrocarbons become more uncer ta in .
The production of hydrogen from indigenous coal supplies via coal gasification technology offers many advantages, particularly regarding the reliability of supply and the predicatbility of cost. The Xoppers-Totzek process is a mature technology and has been used commercially since 1952 for the production of synthesis gas which is then used for the subsequent manufacture of hydrogen and ammonia. Since 1952, thir teen plants containing a total of 39 gasif iers have been constructed primarily in areas of the world tha t are deficient in oil and gas supplies but have ample coal supplies.
The present paper contains information about a Koppers-Totzek based hydrogen plant producing 150 million s~dard cubic feet of 96~ purity hydrogen at plant pressure of 500 psig. The current estimate of hydrogen from a plant of this size is $4.501million Btu or $1.45/ thousand cubic feet. Although this cost is not currently competitive with hydrogen manufactured by the steam reforming of regulated natural gas, it may become competitive in the near future due to a variety of possible political and economic circumstances.
The next two sections of the paper deal with the capital, oper- a.ling, and product costs of hydrogen manufacture via K-T. The final section contains a process description and a material flow dia- gram.
-117-
0 0
CAPITAL AND OPERATING COSTS
The estimated capital cost for a Koppers-Totzek based hydrogen plant producing 150 million standard cubic feet per day (SCFD) of 96~ purity hydrogen at a pressure of 500 psig is $200 mitlion (fourth quarter-1977). The plant is comprised of four four-headed K-T gasi- fiers which produce a synthesis gas rich in carbon monoxide and hy- drogen which is then further processed to yield a gas containing 96~ (volume) hydrogen. The feedstock to the plant (mid-continent loca- tion) is an Jllinois bituminous coal containing 3.4% sulfur.
The plant is a "grass roots" design in that "offsite facilities" such as buildings, roadways, water treatment facilit/es, f/re protec- tion facilities, and communication systems are included. The plant is not completely self-sustaining in the present design since electrical power must be brought to the battery limits. How:~ver, a substation is provided by Koppers to distribute power from the main (13.8 KV) line to the plant. The only other raw material as such that is re- quired is the coal feedstock to the plant. The plant consumes ap- proximately 2400 gallons/minute of raw water, but no operating costs are charged for water since plant facilities are included for supplying and treating raw water.
The estimated annual operating costs based on a 330 day per calendar year operation are shown in Table I. Costs are given in terms of thousands of dollars per year, dollars per thousand cubic feet of hydrogen, and dollars per million Btu of hydrogen. The bases for the computation of most of the cost items are given in Table I. The annual operating costs when coal is available at $20/ton ($0.90/Million Btu) are $2.75/million Btu, or $0.90/thousand cubic feet (MSCF).
-118-
TABLE I Annual Operating Costs
150 Million SCFD Hydrogen Plant
ITEM m
Coal (3,007 tons/day at $20/ton) E lec t r i c i t y (110,000 KWH/hr at
15 mils/KWH) Total Labor (124 persons) Labor Overhead plus Fringes
(40% of t o t a l labor) Maintenance (22 of investment) Catalysts, Chemicals, Supplies Insurance and Local Taxes
(22 of investment) Sleg and Ash Disposal
(600 tons/day at $1/ton) Sulfur Credit (90.7 long
tons/day at $40/LT)
9H/yr~ $/MSCF~ 19,846 0.401
13,068 0.264 1,990 0.040
796 0.016 4,000 0.081 1,203 0.024
4,000 0.081
198 0.004
(0.024)
~/million Btu 1.245
0.820 O.125
0.050 0.251 0.075
0.251
0.012
(0,075)
Net Operating Costs 943,905 90.887 92.754
NOTE: SM/yr means thousands of dol la rs per year. $/HSCF means dol lars per thousand standard cubic fee t .
The total capital requirements based on fourth quar ter , 1977 costs are tabulated in Table II. The total capital requirement of about $244 million assumes that the project would begin today and would require about three years for its completion. The plant in- vestment of $200 million was not escalated, but interest during the construction period of nearly $34 million was included to account for monies that are borrowed for plant and equipment purchases dur ing the three year period before cash flows are available from the sale of hydrogen. Other necessary items included in the total capital re- quirement are s tar t -up costs and working capital. The bases for their estimation are given in Table II.
-119-
TABLE II Total Capital Requirements
150 Million SCFD Hydrogen Plant
$ Million
Plant Investment (1977-4th Quarter) Interest During Construction
(9~/yr x $200.0 x 1.875 yrs . ) Start-Up Costs
(Two month operating period) Working Capital
(40 day cash supply)
200.00
33.75
4.90
5.30
Total Capital Requirement $243.95
-120-
PRODUCT COSTS
The costs of hydrogen from the K-T based, 150 million SCFD hydrogen plant described herein are shown on Figures I and 2. A discounted cash flow rate of return method was used to compute con- stant (level) product costs over the twenty year life of the project such that sufficient revenues were generated to cover operating costs, debt service (interest plus principal), income taxes, and the return of equity capital to satisfy a given discounted cash flow rate of return.
Assuming that coal is available at $20/ton and that financing consisting of 60% debt and 40% equity can be arranged, the cost of hydrogen is $4.501million Btu or $1.45/MSCF. These costs assume a 12% discounted cash flow rate of return (DCFRR) on equity. The sensitivities of the hydrogen product cost to coal cost and to the return on equity are shown on Figures 1 and 2, respectively. From these graphs it can be seen that a $11ton change in the coal cost changes the hydrogen cost by about $0.061millicn Btu ($0.02/MSCF) and that a one point change in the DCFRR changes the hydrogen cost by $0.081w-illion Btu ($0.025/MSCF).
Other accounting and financial assumptions that were made to compute the above costs are as follows:
Projecz Life Debt/Equity Investment Tax Credit Interest Rate on Debt Depreciation
Income Tax Rate Method of Debt Re t i rement
= 20 y e a r s = 60%/40% = 10% = 9%/yr = Sum of y e a r s Digits over Project
Life = 50% = Constant Annual Payment Consist-
ing of Principal and Interest
-121-
P
FIGURE I
Effect of Coal Cost on Hydrogen Cost
' - 5
-2 0
= 4 OJ 01 0 L
" 0
3 15
SCFD Hydrogen Plant
60% debt/40% equit~y 12% DCFRR
W
2O
~0 " 90
i i i |1
2~ 3b 3~
Coal Cost, S/ten
110 130 I 0
Coal Cost, Cents/Million Btu
FIGURE I I
Effect of Return on Equil~y on Hydrogen Cost
6
g , - 5
¢e) 0
4
0 L " 0
~ n SCFD Hydrogen Plant
60% debtl40% equity Coal = $20/ton
. . . , ,, - ( ,,~, ,
Return on Eqult,y, % (DCFRR}
PROCESS DESCRIPTION
The plant facilities start with the receipt of coal by unit train containing approximately I0,000 tons in about I00 cars equipped with swivel couplings. The raw coal will be delivered sized I~" by down and unloaded into a track hopper by a rotary car dumper. From the track hopper, the coal will be transferred to covered storage consist- ing of 4 silos each of 3,000 ton capacity. A yard storage pile is also provided but is normally inactive and is coated with an organic type polymer crusting agent to exclude air.
Raw coal from the storage silos will be transferred by vibrating feeders into a common belt conveyor for. .transfer to two surge bins. The surge bins precede the two combination coal pulverizing, drying and classifying units. The pulverizers are roller mills that simul- taneously dry and crush the coal. The coal is then transferred to product bins which store the dried (2~ moisture), pulverized coal. The pulverized coal storage bins have a capacity of about 4 hours and the coal from these two product storage bins is transferred pneumatically using nitrogen as the conveying medium to the service bins associated with each of four 4-headed K-T gasifiers. The coal is separated from the conveying nitrogen by a cyclone at each service bin. The conveying nitrogen is recycled back to the storage bin and vented to atmosphere through a bag filter. Coal from each of the service bins in turn is transferred by a rotating serrated plate feeder into the respective feed bin at each of the four burner heads at each of the four gasif iers .
The 4-headed gasifier is a jacketed steel vessel lined with high temperature refractory and resembles two horizontal ellipsoids inter- secting each other at right angles. Low pressure steam, used mainly for the gasification reaction, is produced in the water jacket that surrounds the gasifier.
Specially designed screw feeders t r ans fe r the pulverized coal from the feed bin to a mixing chamber wherein a mixture of oxygen and steam entrain the coal and deliver it via twin transport lines into the burner. The flame temperature in front of the burner is about 3,450°F. Endothermic reactions taking place within the gasffier, plus radiation to the refractory lining and jacket reduce the temperature to about 2,730°F at the gasifier outlet. The ash fuses into fine molten slag droplets in the hot zone in front of the burners. About half of these droplets reach the inner wall where they coalesce to form a thin protective coating over the refractory surface. Ultimately, the molten slag flows down the walls to exit through the bottom opening into the slag quench tank located beneath the gasifier. The remainder of
-122-
p P
these slag d rop l e t s a re entra ined in the gas tha t leaves t he gas i f i e r and the waste heat boiler. As a consequence, the gas is cooled to a temperature slightly below the ash fusion point prior to entry into the waste heat boiler. Most of the unreacted carbon is entrained in the gas and is bound to the entrained slag droplets. There is essentially no free carbon in the gas. The slag quench tank located beneath each gasifier is provided with a drag scraper that moves the gran- ulated solids through a water seal leg and deposits them on a common conveyor belt leading to a slag dewatering and storage pit.
Sensible heat is recovered from the quenched raw product gas as it passes through a waste heat boiler located above the gasffier. Saturated steam at a pressure of 1,400 psig is produced in the drum. The cooling and cleaning facility for each gasifier consists of a multi- stage, spray type washer cooler, followed by two disintegrators in series. These units consmt of a water sprayed rotor that revolves in a fan-like housing. The rotor breaks up the water spray into fine droplets to provide extended surface area for good contact between the water and the dust particles. A moisture separator is located after the second disintegrator. The washer cooler removes about 90 percent of the dust and cools the gas to within 15°F of the cooling water temperature. The two disintegrators operating in series and the moisture separator reduce the dust loading to about i0 mg/Nm s or 0.005 {T,'/SCF of dry gas leaving the separator.
A quick seal valve is located immediately after the moisture separator, and this valve can direct the gas produced in its respec- tive gasification ~ain through a fan into the common gas main for tl~.e four gasiflers or ~t can direct the gas to a flare stack. This valve m used at start-up and when taking a gasifier out of service for either an emergency or planned shutdown. A f,m follows each quick seal valve and delivers the raw gas from essentially atmospheric pressure into a common gas main that operates at a gauge pressure of 15 inches of water column. The common gas main leads to the gas compressor by way of the precipitators or alternately to the gas holder which exerts the 15 inches of water column back pressure on the raw gas system between the inlet valve to the gas compressor and the discharge damper of each fan of the four gasification trains. The raw gas compressor consists of three compressor bodies each contain- ing 6 or 7 stages. The compressor operates with an intake pressure of 15 psia and discharge pressure of 620 psia. Intercooling of the gas is provided between compressor bodies and the gas from the last stage of the compressor at a temperature of about 360°F is directed into a humidifier in the CO=shift facility.
In the humidifier, the gas is directly contacted by hot water at a temperature of about 415°F in a packed bed in order to saturate the
-123-
0 p
gas with water vapor. Additional steam is then added to achieve the proper ratio of steam to dry gas in the synthesis gas. Two catalytic reactors each containing 3 beds of sulflded cobalt molybdenum catalyst are operated in parallel to effect the conversion of the carbon monox- ide in the raw gas to hydrogen and carbon dioxide by reaction with steam. After heat exchange, the saturated shifted gas at a tempera- ture of 105°F enters the acid gas removal plant wherein it is con- tacted with ch!lled methanol in an acid gas removal absorber. The single tower for absorption is divided into three sections. In the top section the fine purification of the gas takes place at low tempera- ture . In the middle section the bulk of the COs is absorbed by methanol from the upper t rays of the absorber plus additional meth- anol from the top section of the enrichment column. In the bottom section, the sulfur compounds are prhnarlly absorbed. The product gas from the top of the absorber after the heat exchange with the "ncoming feed gas is at a p ressure of about 500 psig and for the p resen t s tudy is delivered to the plant boundary limits at this pres- sure . If the hydrogen is requi red at a higher p ressure (for exam- ple, ammonia synthesis) additional compression can be provided.
The sulfur recovery plant is of the Claus type with one thermal and three catalytic stages to achieve an initial sulfur recovery of 94%. However, a SCOT type tail gas recovery unit is included which in- creases the overall sulfur recovery to 99.5%.
The air separation plant has a capacity of 2,300 tpd of gaseous oxygen at 99.5% purity. Also, about 40% of the ni t rogen is recovered as pure nitrogen with less than 10 ppm of oxygen. The pure nitro- gen is used primarily for s t r ipping in the Rectisol plant. The waste ni t rogen can be used for general purging. Liquid oxygen and liquid ni t rogen are also available from the air separation plant.
-124-
~ o
,.7 ~ ' " -
8~,g~g ~I~
~ S SV9 71V.I.-- I ~
~H 3"~AO3U
,,z, (,9 O 11,"
h t.1 m
9 - I
2
"2 W
i ._1
8
o
.,,i
~I~LVM ONIBBflaOS AJ,EIIO
~ U ~ l W oNleenu=s NV:a'~:) N, tt,,I
ONI~I31.I.Vh~TO O,.L 9~r'15
i °
£
c £
~ t a
w ~
z ~
• 8
_z z ~ _o~
. J
~!~ ¸ i
1
r - iO ra in -- ~ C
=,
, - J
0 0
APPENDIX XIV
SUBIZCT:
Hydroge'~ and carbon Monoxide from Coal by Winlder Process
AUTHOR(S):
M. C. Goodman Davy Powergas, Inc.
Houston, Texas
CONTENT:
Technical Paper
-125-
HYDROGEN FROM COAL USING THE WINKLER PROCESS
There is nothing new about making hydrgen from coal.
During the war Davy Powergas supplied a very large number of small hydrogen plants to produce pure hydrogen from coke. The hy- drogen was u s e d to fill b a r r a g e bal loons; t h e p r o c e s s employed was Blue Water Gas /S team I r o n .
During the same period much of Britain's gasoline was derived from the hydrogenation of coal. Here again Blue Water Gas was used as the source of hydrogen.
Meanwhile in Germany, hydrogen for their coal hydrogenation processes was being produced from licmlte using the Winlder Process. The company that built those plants is now Davy Powergas GmbH.
• . The Winkler Process is one of the two proven processes for the large-scale production of hydrogen from coal. Comparing the two processes: one cannot generalize as to which is the better process, but Winkler will be the preferred process in most cases where the feedstock is either lignite, subbituminous, or other non-caking coals. I t also has t h e g r e a t a d v a n t a g e of s implici ty a n d f lexibi l i ty .
Typical raw gas analyses from the Winkler Process are:
If h igher puri ty hydrgoen is required this is possible.
What Is The Cost?
Taking the same reference (1) it will be seen that using DOE guidelines for comparison of processes the cost of Medium Btu Gas via the Winkler Process is within the range of $2.76 to $3.35/10 s Btu. In terms of CO + H2 this represents $I.00 to $1.22/i,000 SCF (CO +
Hz).
Why Should. We Produce C.0..÷ Hz Rather Than CH4 (SNG)?
It 's a matter of simple chemistry and heat values. If we have a 50:50 mlxture of CO + Hz its useful heat (above 300°F) per I00 SCF is:
SC__FF B tu Above 300°]~/8C£ Useful _Heat~ Btu
H 2 50 261 13 ,050 C0 50 307
zoo
The f i rs t sl"age in making SNG is to shift the gas to give a 3:1 H~: CO mixture as follows:
50 1{2 + 50 CO + 25 H20 75 H2 ÷ 25 CO + 25 CO 2
To do this we need a CO shift plant and catalyst. There are no proble_ms even when the gas is derived from coal.
Next it is necessary to remove the COt.' T h i s requires a plant and will use steam and power. After this treatment the gas will yield the following useful heat:
- 1 2 7 -
p o
SC___FF B t u A b o v e 3 0 0 ° F / S C F U s e f u l H e a t 1 B t u
H2 75 261 19,575 CO 2_~5 307 7,675
27,2S0
So having expended capital, steam and power we have a gas with only 96% of the heat it originally had. If this looks like bad business it is nothing compared with the next step Wich is to follow: the methanation t o SNG,
75 H 2 + 25 CO ~ 2 5 CH4 + 25 H20
This process is carried out in a reactor using a very sensitive catalyst with a limited llfe. The unit: must be preceded by an expen- sive sulfur removal unit solely to protect the sulfur sensitive cata- lyst. The reaction is highly exothermic and the low grade heat must be removed. This very expansive process has not been commer- ciaUzed but a large scale pilot plant was successful.
What do we get from our original 28,400 Btu after these consid- erable expenditures of power, steam, cooling water and capital? This.
SCF Btu Above 300°F/SCF Useful Heat I Btu
CH 4 25 861 21,525
So we get a useful heat yield of only 75%.
This, unfortunately, is not the end of the story. Industrially, CH4 is not the preferred chemical feedstock that is needed for any product other than HCN. The bulk use of CH4 is for the production of CO + Hs which is then used for ammonia, methanol, hydrogen and other end products. To get CO + Hs from CH4 we catalytically reform CH4 in a steam/methane reformer and use about 1.142 Btu of CH4 to yield 1.0 Btu of CO + H2 thus we finish up with a useful 18,850 Btu of CO + H2 from the original 28,400 Btu of CO + H9 we started with. How many of us would advise companies to install extremely expensive plants to yield an end product with the same composition as the feedstock and with an overall efficiency of 66%?
CO + H2 (or Blue Water Gas) is the aristocrat of industrial fuels (Ref 3). It can be made from coal and the Winkler Process is most economical and proven method of making it. The gas can be utilized on existing equipment and the paper "Medium Btu Gas, Its Meaning
-128-
o 0
a n d I m p o r t a n c e " ( R e f 2) will r emove some o f t h e m i s c o n c e p t i o n s a b o u t i t s v a l u e .
The plant list of Winkler generators shows that a total of 64 have been built. Bearing in mind the locations of the majority of these plants there has been a remarkable degree of longevity and reliability in regions which are not noted for technical skills. This is due to the simplicity in concept of the Davy Winkler Process.
Campaign periods with individual gasifiers is as long as 9 months. Availability is 90%, or better. No spare gasifiers are in- stalled.
On one plant in. nearly 20 years of operation an ammonia plant supplied by a Winlder has never been shut down for reasons of failure in the Winkler unit.
It is the only process that can use run-of-mine coal without employing either expensive screening and briquetting or, alternative- ly, expensive drying and pulverizing. It is, for example, unlikely that with the fines generated in modern mining techniques that any mov~mg bed gasifier will have a ratio of gasification:steam raising that matches the usable coal:fines ratio in the run-of-mine coal.
The environmental impact of the Winkler is small compared with other processes. It produces no tar and phenol and does not pro- duce other "byproduct" of dubious economic value. An untreated effluent taken recently from an operating Winkler plant showed that after simple filtration it could be discharged, without any further treatment, into a clean river. The BOD (untreated) was 10 mg Os/l.
Here is a process that is fully developed and can be guaranteed for operation up to 42 psig with most suitable U.S. coals without requiring a full scale tes t of that coal. If a client requires a full scale tes t the process is so adaptable tha t this can be accomplished within a small time frame provided that the necessary commercial arrangements can be made. This is demonstrated by a recent ex- ample:
On one site that has been both a Winkler and another, more recently built, coal gasification plant we were required to carry out a full scale test on the coal intended for a proposed new plant. Our competi'mr s tar ted his test in mid-September and had to in te r rup t the tes t after two days to clean out the plant . He finally completed the test between October 10-14th. We s tar ted our tes t on October 14 and completed it, on schedule, without any problems on October 21. Such is the state of the art!
Thank you.
• ~ - 1 2 9 -
p 0
R e f e r e n c e s
1. Goodman and Bailey: Process"
"Synthetic Medium Btu Gas Via Winlder
2. Goodman: "Medium Btu Gas, Its Meaning and Importance"
. Carnell, D .W. , E. I. DuPont de Nemours & Company, paper presented in October 1977 at conference "Low-Btu Gas: Its Futl.Lre"
-130-
P P
°ii ~/~ ~~ ~ ~ ~ ~
~ ~ o o
- 4. i
. ~ =o ~ ~.~
I-4 s,-I ~ 1
~ r.~ ~.-~1
!
| I
I ~ ~ ~.o ~1 ~1 ~ 1
I I I
CrJ O~ G~ O~ e-I I -4 t--i
t ~ m
m r_~ r~
• e l ,~1
i i ,-1 ~ -
t',l .r'l ~i~ ~~ ~ [.~ O ~
v,4 ~ f-4 w-q P,4 F-I I,,-I ~ 1
O
p P
"0 O)
! ! 01 U~
N t~
tr~
*H
.~ ~ '~.~
4.J
ul ,PC X
q~ o
u
P-I *rt
N
U
o
,r,t
0
4.a
o
0wl N
ID
0
Z
D P
p D
APPENDIX XV
SUB~[ECT:
Hydrogen by Water Electrolysis
AUTH.OR(S):
L. I . Nuttall General Electric Co.
Wilmington, Massachusetts
CONTENT:
Viewgraphs
-131-
0
I ' 1 ' i" I " I
~ l 1 ! . ! ( : 0 ~ Q 0
.61~I1~;.- ;soo ;m3[cI
4 Q
i
0
ua
w-i
0
p P
25
20
1 5
m
m ~ mine m
GE Projection /
EAr, ON Projection /
# /
Electrical // m
POWOZ .'
~ 3--" • /
• 10 .~ '"~ ~" ~a~t ra l / Namrs/I ~"
0 , I . . . . . . . . . | ! 8 0 - 8 S 9 0 9 S 1 0 0
Year
PRO]]~CTED COST FOR ELECTRICAL POWER _ AND NATURAL GAS
(C~%EENT YEAR DOLLARS)
p . . . . P
GE ~ O N
l a m a m ~ m D , m e n m o
Projection
Wate~ Electrolysis Steam Reforming of Natural Gas
• Dedicated Nuclear/W.ate~ Eleotrolyeis
• 35
30
35
!,° o
10
0
0
an,.~.. /
- ~ ee . I • . .
_ . . . . o o .* '~ ~,,. ~'Jf. ' ' ~ -
., I , r t I J
' 8 0 ' 85 ' 9 0 ' 9 5 ,,?-~00 Y e a r
P R O J E C T E D H Y D R O G E N C O S T
( C U R R E N T Y E A R D O L L A R S )
_LARGE PLANT (387 I~IW) (lfl0 MSCF/D)
p P
80
45
40
85
3O
' 25
~ 29
r3 15
10
5
0
i I - I GE EXXON projection
. --- . . . . . Water Electrolysis /.
- - - - Steam Reforming of i / Natural C-as / "
" /I II J - . , , / / ' / ~
- . / , , , ' - j " _
. . . . I ,I I '80 °8,5 "90 • 9,5 ~l.O.O 0
Y e a r
PROIECTED H&q)ROGEN COST
(CURRENT YEAR DOLLARS)
INTERMEDIATE PLA~'~F (1.9 5~W) (48 0 KSCF/D)
P P
APPENDIX XV!
SUBJECT:
Thermochemical Production of Hydrogen from Water
AUTHOR (S):
K. E. Cox and M. G. Bowman Los Alamos Scientific Laboratory
Currently there is widespread interest in the development of a
"hydrogen economy" as an eventual solution to many of the problems
' M~ny papers, have been associated with the increasing energy cr,sm.
published that discuss the advantages and problems associated with
the Widespread use of hydrogen as a medium for energy storage,
energy transmission and indeed for large-scale use as a non-polluting
fuel. However, in addition to the potential for a hydrogen economy,
it is important to emphasize that hydrogen is a very valuable chemical
that is used in large volume for the production of ammonia and in
chemical processing. Requirements for such applications are increas-
ing rabidly and it is clear that an expanded production of hydrogen
be required in the future even if the "hydrogen economy" is only
partially realized. It is equally clear that fossil energy sources Gill
become /nadequate and that eventually large scale hydrogen produc-
tion must utilize nuclear fission, fusion and/or solar energy for the
decomposition of water by electrolysis, or by thermochemical cycles,
and perhaps, by hybrid combinations of these methods.
The potential higher efficiency and lower cost for thermochemical
method, o , versus the overall electrolysis path has been rather widely
recognized. As a consequence, several laboratories throughout the
world are conducting programs to develop thermochemicai processes
Work completed under the auspices of the Department of Energy.
--133-
D D
for water decomposition. A large number of thermochemical cycles
have been conceived. Unfortunately, many have been published
without experimental verification of the reactions in the cycle. As a
result of this, most evaluations and/or comparisions of thermochemical
processes for process efficiency or cost have been based on assumed
data or on reaction conditions that have not actually been achieved.
Nevertheless, several cycles have now been published where all of the
reactions have been demonstrated experimentally. As a consequence,
the development of methods for engineering and cost analyses for this
new technology can be based on the actual chemistry involved in
demonstrated cycles. It is probable that such engineering assessment
will reveal serious problems in most cycles, but in many cases
changes in p rocess flow shee t s wili be possible t ha t minimize the
problem identified. I t is anticipated that this iterative process will
not only yield to improvements in existing cycles, but also to the
development of criteria to guide the search for and evaluation of new
and possibly better cycles.
THERMOCHEMICAL WATER DECOMPOSITION
In its most general sense, thernml water decomposition implies
the spUtldng of water into its elements, hydrogen and oxygen, by the
use of heat. Water has an extremely high,, enthalpy and free energy
of formation (-286 and -237 k~/mol) that decrease slowly as the tem-
perature increases. For this reason, direct or one-s~.p processes to
-134-
p P
split water are impractical. Temperatures in excess of 3000 K are
required to obtain a reasonable yield of hydrogen and one is faced
additionally with separating this hydrogen from oxygen and the unre-
acted water before the products recombine. The reaction is also
favored by low pressure which is detrimental if the final product is
hydrogen at pipeline pressure. (I)
To improve on direct water-splitting, researchers have tried
methods that decompose water in a number of steps. These pro-
cesses, by which water is dr--.nposed by a set of chemical reactions
at various temperatures with complete recycling of the intermediate
reactants, are known as thermochemical cycles.
Thermochemical cycles appear promising due to the following
reasons:
Overall heat-to-hydrogen efficiencies of the order of 50-60 percent may be obtained as compared to 25-30 percent by conventional electrolysis.
The only raw material is water.
Little or no net work may be required in a cycle if exothermic (reject) heat is used to generate work.
No major technological breakthroughs are required to develop cycles from the conceptual stage to the labora- tory and later to a plant. Modern chemical engineer- ing practice has developed a high degree of sophistica- tion in separation technology as exemplified by the petrochemical industry.
Thermochemical Efficiency
Processes for the production of hydrogen utilize liquid water as
the raw material. The definition of efficiency, q, adopted by the
-135-
p D
International Energy Agency, (2) is the ratio of the theoretical ener-
gy required, AH °, (286 kJ) to the total heat input required, Qt'-for
the decomposition process. Thus,
AI'I ° 286 q = -- = -- 1) Qt Qt
The upper limit on thermocl~emicai cycle thermal efficiency, q,
was defined by Funk and Reinstrom (3) as:
Aiio T h - T c q = ~ • 2 )
AG ° T h
where, T h and T c represen t the upper and lower operating tempera-
tures in the cycle.
This efficiency has an upper limit of 1.2 times the Carnot effi-
ciency of an engine operating between the same higher and lower
temperatures in the" cycle. For the temperatures 1000 K and 400 K, a
cycle efficiency of 729 is theoretically possible.
The Step-Wise Decomposition of Water
The basic thermochemistry involved in the step-wise decomposi-
tion of water was published in 1966 by Funk and Reinstrom. (3)
They pointed out ~at a large AS value would be required for the TAS
term to equal the AH term in the high temperatue reaction of a two-
step cycle and concluded that simple two-step cycles would not be
possible for temperatures available from practical heat sources. In
-136-
D P
more r e c e n t y e a r s , severa l au thor s have cons idered the thermochemis-
t r y of water decomposition cycles and essential ly confirmed the con-
c lus ions of Funk and Reinstrom. Bowman has repeated the analysis
(4) in order to point out that specific values for the sum of the ~S °
terms and the sum of the AH ° are required for the endothermic reac-
tions ff maximum heat efficiencles are to be reqlized. This specific
and related values depend on the maximum temperature at which heat
is available and the AG ° of H20 at the low temperature. Thus, for a
general two-step decomposition cycle
I. R+AB~RA+B atT I
2. RA ~R+ A at T2
"ideal" ~S ° and ~I- I ° values are g iven by
i d e a l ~S ° = - ~ ° ( A B ) (T2-T I)
ideal ~S ° = &S ° × T2
:D
4)
For decomposition of water with T, = 400 K and T2 = ii00 K, i.e.,
3. R+H20÷R0+ H2 at 400 X
4 . R0 -~ R ÷ 1 / 2 02 a t 1100 K
For reac t ion 4, AS ° ~ 320 Y/K, and AH o ~ 350 k l .
The s t r ik ing feaUzre of the above ana lys is is the large ~S °
va lue s r e q u i r e d for the decomposit ion reac t ions . Typica l ly , react ions
s u c h as 4, exhibits ~S ° changes of about 100 y /K. Thus , i t is qui~e
-137-
clear that simple two-stsp cycles for H20 decomposition will not be
found unless h igher temperatures are used.
Examination of the ideal AS ° values emphasizes the value of
reactions with large entrol~y changes in water splitting cycles in
order to minimize the number of reactions required. This, of course
suggests gaseous reactants or reaction products to provide the large
entropy changes.
Practical considerations that have to be met before a conceptual
cycle becomes a matter of reality include the selection of the following
problems:
Process:
Engineering:
• Availability of Accurate Thermodynamic and Equilibrium Data
• Kine~c Data
• Effect of Losses of Intermediates
• Effect of Competing Reactions and Side Products
• Development of Separation Methods to Allow For Reactant Recycle and Product Separ~'don
• Minimization of Heat Exchange Area
• Materials to Withstand High Temperature and Hostile Environments
These reasons are the primary ones that explain why cycles have not
yet been developed at the pilot plant stage. Mention has already
been ~ d e of the large amount of scientific activity in this field; most
of it is devoted to laboratory testing of the key reactions in the
cycles.
- 1 3 8 -
0 P
T.hermochemical. Hydrogen Cycles under Research and Process Development
Thermochemical cycles are being studied in this country and in
other laboratories abroad. Some of the more promising cycles under
investigation are described below:
The Sulfuric Acid Hybrid Cycle
Hybrid cycles are those in which some of the reactions proceed
thermally and others are effected by electrolysis at a lower voltage
than that for water electrolysis. This is one of the hybrid cycles
studied early in the LASL Program. (5) The '"~wo-step" cycle may be
written as:
5. 300 K SO 2 + 2 H20 elect H2S04 + H2
E ° = -O.17V for I M H2SO 4 and I armS02
H2SO 4 H20 + SOs + 1/2 02 6. 1144 K
The cycle is shown schematically in Figure 1. Hydrogen is generated
electrolytically in an electrolysis cell which anodically oxidizes sul fur-
ous acid to sulfuric acid while simultaneously generating hydrogen at
the cathode. Sulfuric acid formed in the electrolyzer is then vapor-
ized, using thermal energy from a h igh temperature heat source.
The vaporized sulfuric acid (sulfur tr ioxide-steam mixture) flows
an indirectly heated reduction reactor where sulfur dioxide and oxy-
gen are formed. Wet sulfur dioxide and oxygen flow to the separa-
tion system, where oxygen is produced as a process coproduct and
the sulfur dioxide is recycled to the electrolyzer. Workers at the
- 1 3 9 -
P P
p P
Westinghouse Electric Corporation are concentrating on developing the
cycle. They have made excellent progress in experimental programs
to improve the electrolysis reaction and have achieved higher current
densities at higher sulfuric acid concentrations than those reported
earlier by LASL. They have also conducted extensive studies on the
catalytic thermal decomposition of sulfuric acid. In addit/on, eugi-
neering evaluations of the process, its performance as a function of
operating parameters, and its economics have been performed.
In a recent Progress Report (6) Farbman reported that for 50
wt~ sulfuric acid produced at 50°C and current densities of 2000
A/m 2, total cell voltages of 500 mV for the electrolysis step were
attained. Eventual!y, the Westinghouse workers hope to achieve their
"target" conditions of "/5 wt~o sulfuric acid at a current density of
2000 A/m ~ and a cell voltage of 480 inV.
Under these conditions, a process evaluation, in which a very
high temperature nuclear reactor (VHTR) was used as the heat
source, indicated an overall thermal efficiency of 54~o for the sulfuric
acid hybrid cycle.
The Westinghouse workers have also estimated the cost of hydro-
gen produced by the hybrid cycle; assuming their "target" conditions
and assuming what may be described as an advanced method of power
production, they derived a very optimistic cost of $5.27/Gy (see cost
section below). This may be the reason why the cycle has achieved
popularity. At any rate, the Julich Nuclear Research Center in West
-140-
p 0
Germany has initiated a large developmental effort on the cycle. (7)
Workers at the Euratom Joint Research Center in Ispra, Italy are also
maintaining an active interest in the cycle. (8)
The Sulfuric Acid-Hydr0gen Iodide Cycle
At the First World Hydrogen Energy Conference (March 1976),
the General Atomic Co. presented their Sulfuric Acid-Hydrogen Iodide
cycle. (9) The cycle may be written simply as:
7. 2 /leO ÷ S02 + x Is ÷ H2S04 + 2 HI x Aqueous 300 K
8. 2 F I x ÷ x I~ + H2 573 K
9. H2S04 ÷ H~O + SO 2 + ~ 02 1144 K
where the HI x represents the mixture of several polyiodides formed in
the initial solution. Separation of the HsSO4 and HI x takes place
under gravity, as the two acids are almost immiscible. The upper
phase contains most of the H2SO4, and the lower phase contains most
of the HI x.
After physical separation, the sulfuric acid must be dried (con-
cenU'ated) before it is decomposed at high temperature. Rather
extensive drying, distillation and recycle operations are the principal
disadvantages of the process. The availability of iodine and a system
for adequate iodine recovery may also prove disadvantageous. How-
ever, overbalancing these disadvantages, perhaps, is the potential for
a continuous process involving essentially only liquids and gases.
-141-
P P
A process flowsheet i l lustrating the major oprations and material
t ransfers is presented in simplified form in Fig. 2. Process engineer-
ing, involving the coupling of this cycle to a high temperature gas-
cooled reactor (HTGR), indicates an efficiency in the 40-50% range.
Prior to the G.A. disclosure, workers at the Euratom ~oint
Research Center (Ispra) had discovered essentially the same method
for separation of t" .~ H z S O 4 and HI. Vigot~ous development of the
cycle is continuing at both laboratories. The work involves corrosion
studies and the evaluation of process equipment and containers as
well as attempts to improve yields via changes in process conditions.
Thermechemical Cycles from Los Alamo s Scientific Laboratory
The Los Alamos program may be described as a combined theo-
retical and experimental effort to develop criteria required for an
ideal process and to search for thermochemicel cycles that approximate
the criteria in practice (10), conceptual cycles are subjected to ex-
perimentation in order to verify the concept (usually, of course, it is
found that at least one of the reactions w/ll not occur). If the reac-
tions can be demonstrated, additional data are obtained in order to
permit initial evaluation and also comparison with other cyc!es.
Process development and engineering analysis activities have
been directed primarily to experimental studies of reactions relevant
to cycles employing sulfuric acid as an intermediate substance. These
cycles include the sulfuric acid-hydrogen bromide cycle, the hybrid
sulfuric acid cycle (Westinghouse) and the sulfuric acid-iodine cycle
-142-
P P
(General Atomic). The rationale for this work is to avoid the large
heat penalties incurred on drying sulfuric acid solutions. The ap-
proach taken in the case of sulfuric acid-hydrogen bromide cycle has
been to devise means of decomposing anhydrous hydrogen bromide
which is produced with essentially pure sulfuric acid in one of the
cycle steps making water evaporation unnecessary. In the work
supporting the development of the hybrid cycle and the iodine cycle,
the approach is slightly different. The use of an insoluble, non-
hydrated, metal surface precipitated from sulfuric acid solutions as a
means of recovering sulfur trioxide (and hence sulfur dioxide) with-
out having to dry the acid is being continued. EfforLs have been
devoted to the engineering design and analysis of these modifictions
which produce smaller heat penalties as compared to the existing
forms of the cycles. Results are an expected increase in cycle effi-
ciency.
A preliminary view of cycles having maximum reaction tempera-
tures in the 1500-1700 K range is being undertaken. These tempera-
tares may he attained in magnetic fusion energy schemes. Magnetic
fusion energy may thus incorporate thermochemical cycles in the
production of synthetic fuels.
Use of Metal Sulfates in the H2SO4 Cycles
In the HsSO4 hybrid cycle (reactions 5-6) large amounts of heat
are needed to dehydrate the sulfuric acid. A significant saving in
-&43-
p P
energy might be achieved by forming a suitable metal sulfate from the
H2SO4. The alternative hybrid cycle may be represented by:
10. SO 2 + 2 H2 0 = H2SO 4 ( a q . ) • H2, e l e c t r o c h e m i c a l
11. H2SO 4 ÷ MO = MSO 4 + H2 0
12. MSO 4 = MO + SOs
13. SOs = S0Z ÷ I/2 02
The same is true for the H2SO4 - HI cycle (reactions 7-9) which
sulfuric acid is dehydrated prior to thermal composition.
The metal sulfate used in reactions 11-12 should have low solu-
bility and form an anhydrous sulfate. A survey and assessment of
the literature were made for antimony and bismuth sulfates, both of
which satisfy these criteria.
14. Bi~O8 • 3 S03 = Bi202 • 2 SO s + SO 3
15. Bi20 s • 2 SO s = Bi20 s • SO s + SOs
BisOs • 3 SOs decomposes with increasing temperature to SOs and a
series of oxide sulfates terminating in Bi2Os itself. The equilibrium
SOa pressure for reaction 14 is i arm at 860 K, and Bi2Os • 25 Os in
reaction 15 is reported to decompose at 1050 K. Final decomposition
to form BisO a occurs at higher temperatures. The options for gener-
ating SO3 over a temperature range that includes intermediate tem-
peratures, in addition to high temperatures for SOs decomposition,
should be useful in achieving efficient extraction of heat from the
circulating helium coolant of a high-temperature gas-cooled nuclear
reactor.
-144-
D 0
A preliminary evaluation of the energy efficiency of the bismuth
sulfate alternate to the hybrid sulfuric acid cycle has been completed.
Reduction in the heat requirements for the acid concentration step as
well as for the acid decomposition step show a potential gain of 12% in
efficiency on adopting the metal sulfate method of solution concentra-
• tion.
The Sulfuric Acid-Hydrogen Bromide Cycle
A hybrid cycle involving hydrogen bromide was idenRfied at
LASL. I t is now under study at the Euratom-Jolt Research Center,
Ispra, Italy (11) and at the Institute of Gas Technology in the
U.S.A. (12)
Labelled Mark-13 at the Ispra Laboratory, the c~,cle may be
For the electrolytic reaction, AG ° = 112 kJ or E ° = -0.58V. The
cycle should prove attractive as it involves reactions in which data
have already been obtained. The electrolytic decomposition of HBr is
the key step. Electrode reactions on graphite are currently being
investigated in this regard.
Heat Sources for Thermochemical Processes
Most discussions of thermochemical hydrogen production tacitly
assume that heat will be supplied by dedicated high-temperature,
-145-
0 P
process-heat reactors. For a process to be efficient, then, i t s heat
requirements must meet the heat delivery characteristics of the reac-
tor. Engineering analyses under this assumption very quickly reveal
that isothermal endotherndc reactions near the temperature maximum
are very undesirable steps. Further, solution drying steps are very
disadvantageous if the necessary heat must be derived from the
primary high-temperaturo source. Therefore, at this time i t is impor-
tant to emphasize the fact tha t af ter 3-5 years of development in
several countries, essentially all of the cycles have been demonstrated
experimentally contain solution drying or solution concentration s teps .
Therefore, it seems reasonable to sugges t tha t thermochemical hydro-
gen plants be located where they can be combined with systems tha t
yield low-temperature heat as a by-product .
Solar energy heat sources are sometimes mentioned for use with
thermochemical cycles. Usually i t is assumed, at least taci t ly , tha t
they wiU be too expensive. This may be t rue , but solar towers,
mirrors and t rough concentrators are get t ing cheaper. Therefore, i t
is relevant to note that for a solar heated process, low temperature
heat can probably be delivered at significantly lower cost per uni t of
heat than heat at the maximum temperature. Thus, solution chemistry
may be more useful. In addition, an isothermal step near *..he maxi-
mum temperature may be a very useful way of absorbing h igh tem-
perature from a solar tower. Certainly, i t seems prudent to ser iously
-146-
p P
consider the possible adaptation of solar heat sources m thermochemi-
cal processes.
In the long term, magnetic fusion reactors or laser fusion reac-
tors may become available for synthetic fuel production. Such reac-
tors, in particular laser fusion reactors, may be advantageous for
coupling with thermochemical processes since rather large quantities
of "recycle power" must be used and, hence, significant quantities of
low temperature waste heat can be made available.
Estimates of Costs of Thermochemical Hydrogen
In discussions of thermochemical processes, the question of costs t
usually is asked quite early. In one sense, the questions are prema-
ture since this new technology is only in the initial definition stage.
Nevertheless, cost is an important question and early attempts at cost
,~stimates are valuable not only as a means to develop the methodology
for eventual realistic cost estimates, but also to guide experimental
development programs. Up to the present time, most cost estimates
have been made for conceptual cycles that have not been validated
experimentally. The cost estimates given below were made for cycles
that have been proved by experimentation even though conditions
assumed for ti,s different reactions are for the most part projected
conditions that have not actually been adequately demonstrated in an
experimental program. Thus, it is difficult to determine whether a
particular cost estimate is optimistic or pessimistic since knowledge
-147-
O D
0 P
Mat conditions are uncertain can lead to conservatism in equipment
estimates.
Table I contains a few estimates of the cost of hydrogen pro-
duced by elec~olysis. No attempt has been made to select estimates
where uniform assumptions have been made. In each case, the author
used assumptions that they deemed a~,propriate. Table II contains
estimates of the cost of hydrogen produced by thermochemical cycles
whose reactions are known to occur in Me laboratory. Cycle A is The
hybrid sulfuric acid process, and cycle B is the thermochem/cal
sulfuric acid-hydrogen iodide cycle being developed by The General
Atomic Co. and by Eura~m-Ispra.
--1 J t ~ _
p P
p P
Table I
Cost Es t ima tes f o r E l e c t r o l y t i c Hydrosen
Current Advanced Author Reference Technology Technology
Escher Donakowski 17 $9.36/GJ $4.81/G3
Steeman 13 5.55 - -
Brogg£ 16 9 .76 7.48
Fa~bman 14 6.65 - -
N u t t a l l 18 - - 5.08
D o l l a r pe__
Hid-1975
1975
1975
~id-1974
1976
-149-
p P
0 0
Table I I
Cost E s t ~ n a t e s f o r Thermochemical HydroEen
Dollar Author Reference ~ Cost Type Not__.ee
Steeman 13 A $7.18/GJ 1975 1 ~a~bman 6 A 5.27 1976 1 Knoehe & Funk 15 k 7.15 1976 1,2 Brosgi 16 B 5.95 1975 3
Note 1. /ill of the cost estimates of the hybr id sulfuric acid cycle were based on the Westinghouse "target" conditions ra ther than the much less favorable conditions tha t have been achieved in the labora- tory up "~o ~he present time.
Note 2. The methodology for the cycle evaluation developed by ~ s o r Kuoche and Professor Funk ~ be ve ry useful for evaluat- ing cycles° part icularly initial and comparative evaluations. The authors themselves s t ress the value of the method for indicating directions for improving flow-sheets and processes . Thus, they s t r e s s tha t the sulfuric acid decomposition step in cycles a and b can be improved and costs lowered.
Note 3. The cost estimates made by Broggi assume the production of 60 ~ sulfuric acid in the process. I t seems questionable as to whether this concentration can be achieved. Broggi also estimates a cost of $5.40/GI for a cycle in which an insoluble sulfate is formed (and decomposed) ra ther than sulfuric acid. The potential insoluble sulfate was not identified.
p D
0 P
References
. Chao, R. E. and Cox, K. E., in: Hydrogen Energy, Vol. A, pp. 317-330, Plenum Press, New York, 1975.
. Vanderryn, J., Salzano, F., and Bowman, M. G., "International Cooperation on the Development of Hydrogen Technologies." International Journal of Hydrogen Energy, Vol. 1, No. 4, 357, 1977.
. Funk, J. E. and Reinstrom, R. M., "Energy Requirements in the Production of Hydrogen from Water." I & EC Process Design and Development, Vol 5, No. 3, luly 1966.
. Bowman, M. G., "Fundamental Aspects of Systems for the Ther- mochemical Production of Hydrogen from Water," First National Topical Meeting on Nuclear Process Heat Applications. October 1-3, 1974, Los Alamos, New Mexico.
.
.
Onstott, E. I. and Bowman, M. G., "Hydrogen Production by Low Voltage Electrolysis in Combined Thermochemlcal and Electro- chemical Cycles," Presented at the 146th Meeting of the Electro- chemical Society, New York City, October 13-17, 1974.
Farbman, G. H., Report No. FE-2262-15, "Hydrogen Generation Process--Final Report," Westinghouse Electric Corporation, June 1977.
.
.
.
10.
Barnert, Julich Nuclear Research Center, Ju]J.ch, West Germany; private communication.
De Beni, G., "Design and Evaluation of Thermochemical Cycles: The Work Performed at J.R.C. Ispra Establishment." Presenta- tion at the A.I.M. International Congress on Hydrogen and Its Prospects, November 15-180 1976, Liege, Belgium.
Russell, J. L., et al., "Water Splitting--A Progress Report," Proc. First World Hydrogen Energy Conference, Vol. I. IA-105, March 1-3, 1976, Miami Beach, Florida.
Cox, K. E., "Thermochemical Processes for Hydrogen Produc- tion," Report LA-6970-PR, Los Alamos Scientific Laboratory, Los Alamos, New Mexico, October 1977.
11. Schutz, G. H. and Lalonde, D., "A New Electrolytic Cell Type for Hydrogen Production in Hybrid Cycles." Proceedings of the Alternative Energy Sources National Symposium, December 5-7. 1977, Miami Beach, Florida•
-151-
P 0
12. Dafter, J. R., Fob, S. E., and Schreiber, J. D., "Assessment of Therrnochemical Hydrogen Production," Proceedings of the Department of Ener~ Chemical Energy Storage and Hydrogen Energy System Contracts Review, Mtg. November 16-17, 1977, Hunt Valley, Maryland.
13. Steeman, J., "An Evaluat/on of the Westinghouse Cycle for Thermochemical Hydrogen Production." Informal presentation to Second Meeting of IEA Coordinating Committee on Thermochemical Cycles, March 9-11, 1976, Los Alamos, New Mexico.
14. Westinghouse Electric Corporation, "The Conceptual Design of an Integrated Nuclear-Hydrogen Production Plant Using the Sulfur Cycle Water Decomposition System" NASA Report CR-134976, April 1976.
15. Knoche, K. F. and Funk, I . E. , "Entropy Production, Efficiency and Economics in the Thermochemical Production of Synthetic Fuels: I. The Hybrid Sulfuric Acid Process." To be published in Int. Journal of Hydrogen Energy.
16. Broggi, A. , "Elements for a Discussion on Hydrogen Producton Cost." Informal presentation to Second Meeting of IEA Coordi- nating Committee of Thermochemical Cycles, March 9-11, 1976, Los Alamos, New Mexico.
17. Escher, W. J. D. and Donakowski, T. D., "Competitively Priced Hydrogen Via High Efficiency Nuclear Electrolysis," Int. 7. of Hydrogen Energy, Vol. 1, No. 4, pp. 389-399, Janu-'~-ry ]977~.
18. Nuttall, L. ~. , "Solid Polymer Electrolyte Water Electrolysis Development Status for Bulk Hydrogen Generation." Proceedings of the ERDA Contractors' Review Meeting on Chemical Energy Storage and Hydrogen Energy Systems, Airlie House, Airlie, Virginia, November 8-9, 1976.
-152-
p P
_1 - J
E IE ~IL ~ E E Id Id I ,,.~1" ~ b l l d : l : : Z i ~ If Z Z
I,° ÷ o
5 o ~"
_0
_a
Z
b.I OC
m
U..
p P
° T J -
N I 0 I . . . ] - 2 : : I a ~ i 2 ; I
U ~
I ~ / ) o° = ~ , ~.. ~ ~
I ~:1~ ~ ,,-
/ ~ ~ ! 4 - - - - -
/ = : ~ o ~ _ -o_
0 0
APPENDIX XVII
SUBJECT:
Alternate Scenarios of Supplying Hydrogen
AUTHOR(S):
W. H. Stanton Monsanto Company Texas City, Texas
CONTENT:
Table and Graphs
- - 1 5 3 -
0 0
P 13
I.l.I
"'8
n,,"
i ~ I I "1 I I I I I I I I I I I I I I I I = 1 I I
Naphtha Hydrn~reating D i s t i l l a t e Hydrotrea~ing Hv, 0£1 Hydrotreating Resuduum Hydrotreattng Cata lyt ic Hydrocraeking Cataly~ic Reforming (Production)
HYDROGENUSE Std . c~. Ft /BS~
10-50 50-250
300-750 650-1600
1500~3000 (800-2200)
p D
p P
~ . _ ~ = ml , -9 "I +~ +t - - .++ !P.,=
+__t: ,+.+I + t~ ,+.+ -'++,t I ,L
'+ 5 + + 0 ,~g..~ r.., =" i ~ r,J , o i ~ I - l o i ~ +. .~ o
m ~ m t |
,,- < ~ ~--I," ~§.+ i " ~ o i ~ o z w = +
i ~ ~ ~. ~ ~ ~ 0 1 ~
r'--~,~ I ~_~I~+ ~-" ~ 'I~
m o, .+.,
01 ,a Id=~ .~ e,, < , - - - \ ; .= + +.P,~ ;', i . , o : , .~ ~ f,: - - - - ~ : b J ~ ~ b J ~ j IJ~
. . ' - t+ . o T ~ . ~ # -
~ "<; o o c~IZ~]- ~ m, ~ 1 ~ . u:., , , - - ,
I - - 0
"m , o . '01
I
I ~ - - " :+ I
}° ' o oo ~o ,,,
i i
~ o °
f,~ r.l.
+<I+,.,. o ° t ~ l ~ o I ,n, ,"~I I''. ...+
~ ~ U A
~ = o ~ - r u u ~ (,,}
L
, - , z ~
ur_ .l,,. 0 ,, m++.
c ~ l O ,
__.~', +o÷~, '
g'~ 0 ,
~ ' ~
P ~ m l
n~" Z
m~ W X n - o
m 3~
o
41" 0 o Z 0 W
o ~ <+.~< or,.) u E
I,I.I "I:~ 7 ( , , ~
: P
?
I
i 12. I . ' ~ ' . . J i r.O I,I.I uv+ U.I
p p
P P
o q
8 o
_1
. .1oo1 ;o8o°_o o_o oo. N o o ~ .
g ±
~ 8
.~ ~_~" o ° ~o_~_~ , ~ o " ~ ; ~
~.o ° {M tOl~-
Z ~ O 0 ~_o~. ,~.I-oI- oo_o os 00~0 O0 00 {D
~I~°-I ~ o o o~o.. o o. ~ -
z
ooo -- ~ 0 0 0 O 0 0 -- ~) co
~0~%. ....
_~ oooo oo o ~o
o oo o~. o o~ ~ ~: I~_ 0 0 0 I01~ 0 " " 0110
g
,,, _ z = -J - - , , , ~ _ _ o .
l-~n*~UJ~ . J ~ O ~{MOn. uJUJ{M 0 ~ . , ~ - ~ o
P P
APPENDIX XVIII
SUS E.CT:
Projected Prices of Energy/Hydrogen Feedstocks
AUTHOR.(S):
H. W. Prengle0 Jr., University of Houston W. H. Stm~ton, Monsanto Company 7. E. Stevens, Air Products, Inc.
CONTENT:
Technical Memorandum
-154-
0 P
OF,
UnivBrs|tg of Houston Csntm! Campus ~ Houston, Texs~ 77004
Department o! Chem|cal Engineering Cullen College o! Engineering 713/749.4407 September 29, 1977
M E M O R A N D U M
TO: Dr. C. J. Huango Professor of Chemical Engineering Director, December Hydrogen Conference
FROM: H.W. Prengle, J r . , Professor of Chemical Engineering
SUBJECT: Projected Prices of Energy/Hydrogen Feedstocks
As requested, Wally Stanton, Emmett Stevens and I have dis-
cussed this matter. It is our understanding that in order to calculate
certain process economics, principally operating costs, on the various
processes for manufacturing hydrogen, it is desirable for the steering
committee and others who may be presenting material at the December
Hydrogen Conference, to have some projections on prices of energy/
hydrogen feedstocks.
The material which follows summarizes what we have available on
short notice, and can be used as guidelines, but generally does not
completely cover the subject by any means.
CALCULATING PROCESS ECONOMICS
In evaluating present and future technology for the manufacture
of hydrogen, capital and operating cost are key to making a process
-1~5-
p P
selection decision. In the operating cost buildup the price of feed-
stock and fuel to users , among other items which will be peculiar to
the particular operating company, will be very important. In the
past, e.g., for natural gas reforming to produce H2, both feedstock
and fuel were the same material, but in the future this will not be
the case--shifts to less espensive fuels are already underway by Gulf
Coast industry.
In general for simple comparisons, those presenting operating
costs can use two bases for feedstock and ~.uel costs:
I) assume discrete values (X-$MBTU) which corresponds to what might occur during the next 10-20 years; or
2) assume time function projections which can be integrated with the production time function to obtain total feedstock and fuel costs, ~or an arbitrary time period or for the estimated life of the project.
Personally, I th ink either basis will be satisfactory, provided the
basis used is clearly stated.
Concerning the matter of time function projections a few words
are in order and may be helpful; for this purpose some symbols and
nomenclature are necessary:
a escala t iou rate of inczease for fuel/feedstock (too)
P' Po un i t pr ice of fuel / feedstock, uni t pr ice at time zero Cex. tax) (S/EBb)
t t i m e , m e a s u r e d f rom t i m e z e r o ( Y e a r s )
Cfs to ta l cost of feedstock over ~ years (Constant $)
-156-
p P
Cf total cost of fuel over ~ years (Constant $)
F(t) fuel used as function of time) (tonslyr)
rate of inflation (100)
M(t) feedstock required as function of time (tons/yr)
~BTU Hi l l i on BTUs
energy convers ion f a c t o r Or
arbitrary time period or life of project (years)
For purposes of rough calculations, unit cost time projection
functions can be used, which are characterized by three parameters:
Po' time zero or present unit costs; a, price escalation rate as deter-
mined by msrket and regulation factors; and I the general economy
inflation rate. If desirable, Po' a, and I can be changed at various
points in time to make the functions approximate reality more closely.
Since so many real factors are involved, three-parameter functions
appear to be satisfactory. Specifically, the unit price of feedstock
fuel, and energy--natural gas, fuel oils. coal, and electricity--can be
represented by the compound interest time function,
P(~----~) = Po (l+a)t (!a)
or if constant dollars are desired,
-157-
P P
(z+a) t P (const.~IBTU $) = Po 1+-~ (lb)
and ~nPo ÷ t £n fl+a~ (lc) " l÷I "
which obviously is a straight line on semi-10g paper, no_~t a straight
line or linear coordinate paper. Some engineers like to think o~ the
difference between alternate feedstocks, in making calculations; then,
. l+a. t ¢ 1_~_~ t (PI"P2) = Pozt1--~yJ - P0S , 1+1" (Id)
which will only remain the same ff both, po I = poz and az = as.
If one desires to use the discrete basis of calculation, the above
functions are satisfactory for obtaining paint values at particular
times. On the other hand, if one desires to use the integrated time
function basis; then,
i) the total cost of feedstock over the time period z will be,
Cfs (constant $) ap ° / l+a t = M(t) (1--~) dt Cle) 0
2) the mml cost of fuel will be,
t ¢l+a~ Cfs (constant $) = apo S FCt)"1-~I" o
dt (If)
Now, let's examine some projections which have been made.
-158-
P
EXXON PROJECTIONS (1)
For purposes of calculations, one might use the EXXON projec-
tions given in pp. 46=55, of the referenced re~. It will be noted
the assumed rates of escalation for large industrial customers tha t
a r e :
1) n a t u r a l gas and r e f ined p r o d u c t s , lO0a = 6~o/yr . a n d
2) general inflation, 100I = 5%/yr.
Their "most likely prices" present graphically on Figure 2.02 (p. 53),
are exactly given by the functions:
1) for natural gas,
(19805) = 3.15 f1+0"065~ t t 9NG (FIBlq,I) "1+0.-"050" = 3.15(1.0143) (2a)
2) :" for resid.
(198o$) ='2 .35 (1.0143) t (2b) Ps ( zu)
s) for electricity,
(1+0.05 1; PE = 0 . 0 2 7 "1+-'+-~-05.05"
= 0.027 (2c)
4)
5)
for coal delivered to Gulf Coast,
• = ( 1 + 0 . 0 5 ~ t Pc O980~) 1.s4 .z-~.-~j (~BZU)
= 1.54 (2d)
for other refined fuels, e .g. , #2 fuel oil,
t (19805) P#2 (~B~J) = P°#2(1"0143) (2e)
P P
Since in the future natural gas, as well as resid, and #2 fuel
oU will be used as feedstock for H2-manufacture, the unit cost dif-
ference functions ar~ of interest,
1) natural gas cf. resid,
(PI~G.PR), (1980~) = 0.80 (I.0143)t (2f) C ~ )
the difference is not constant but increases with time.
(1) Corneil, H. G., Heinzelmann, F. J . , Nicholson, E. W. S., "Pro- duction Economics for Hydrogen, Ammonia, and Methanol During the 1980-2000 Period;" Report BNL-50664, ERDA Contract No. 358,150-S; Exxon Research and Engineering Company, Linden, N.J. , April 1977.
(2) Prengle, H. W., I t . , and Crump, J. R.; Private Communication, Energy Conservation in Industrial Operation Project; University of Houston, Chemical Engineering Department, September 1977.
-162-
P P
t
~ , ~ ° = o
' ,,~ ° ,,-01 I~-
. I | w •
II %
\
H a la ~ m m . a i
o t., o
,,.,J o
a
O
i %,
O
,'-I
- °
,a,
. j 8 ~
Z . ~ ~
C (.I
13.. m C
t,l,.,I 0:: o
t n f.,,.
,.,,,4 O
c;
O
t~ o u
. 0,P G~
LU
14J 3 : U
2::
I',,. I',,- !
O N
I
m
P P
o 0 0 0 ~ 0
0
D
~ E ~ ~o
W
m al~
_= e
0 0 O 0 0 0 0
d ~ d g d d g
r . o
o
M m o
m c w
z
~r
! 0 N |
m
- - I
!1 II II II II I! II II II II II II II II II II II
I,
II I I~
- ' 7 " - - - I " - I - - I - ' - -1 - - - - - - I O {D


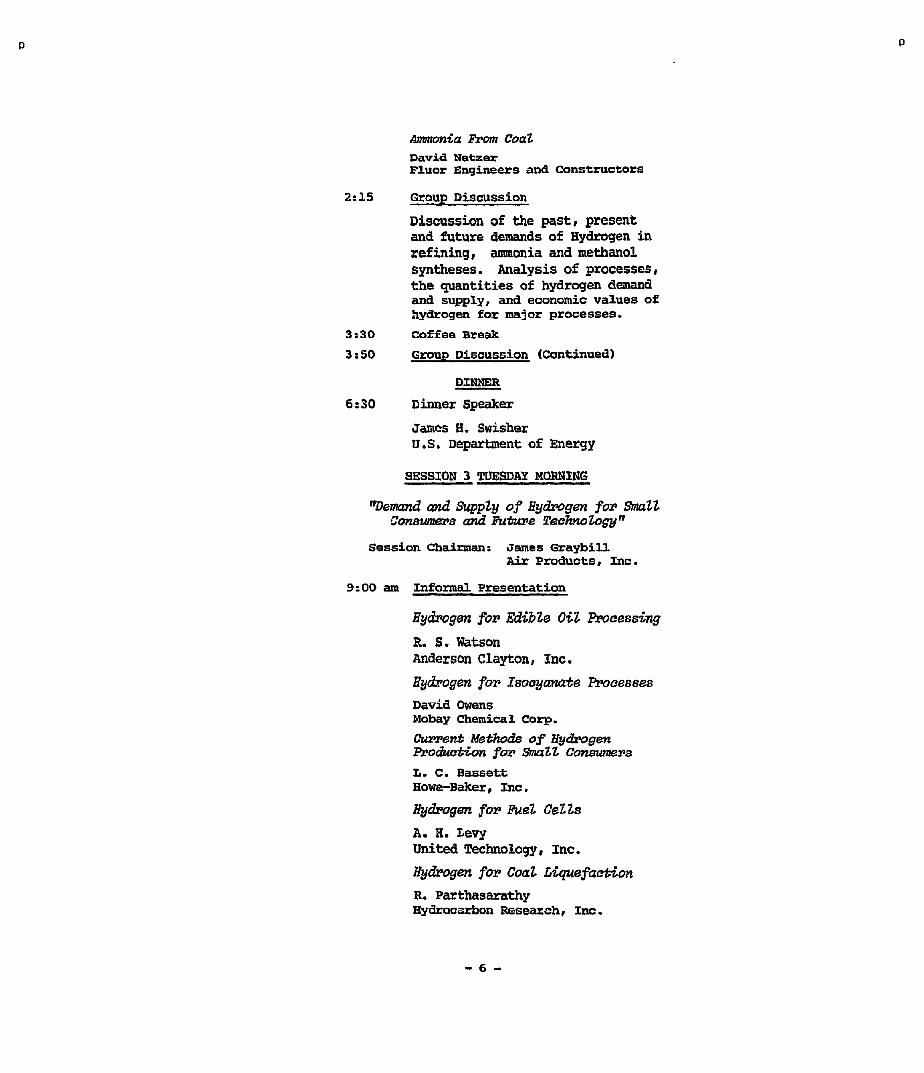


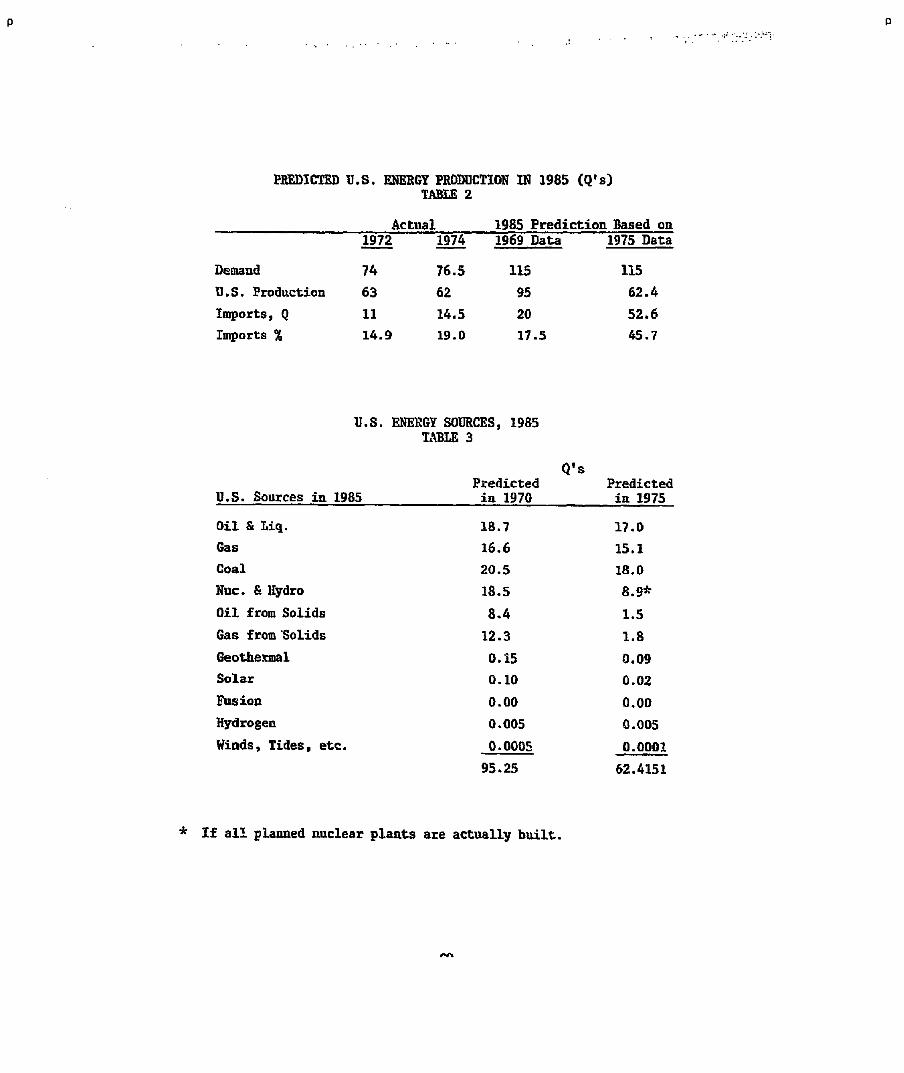


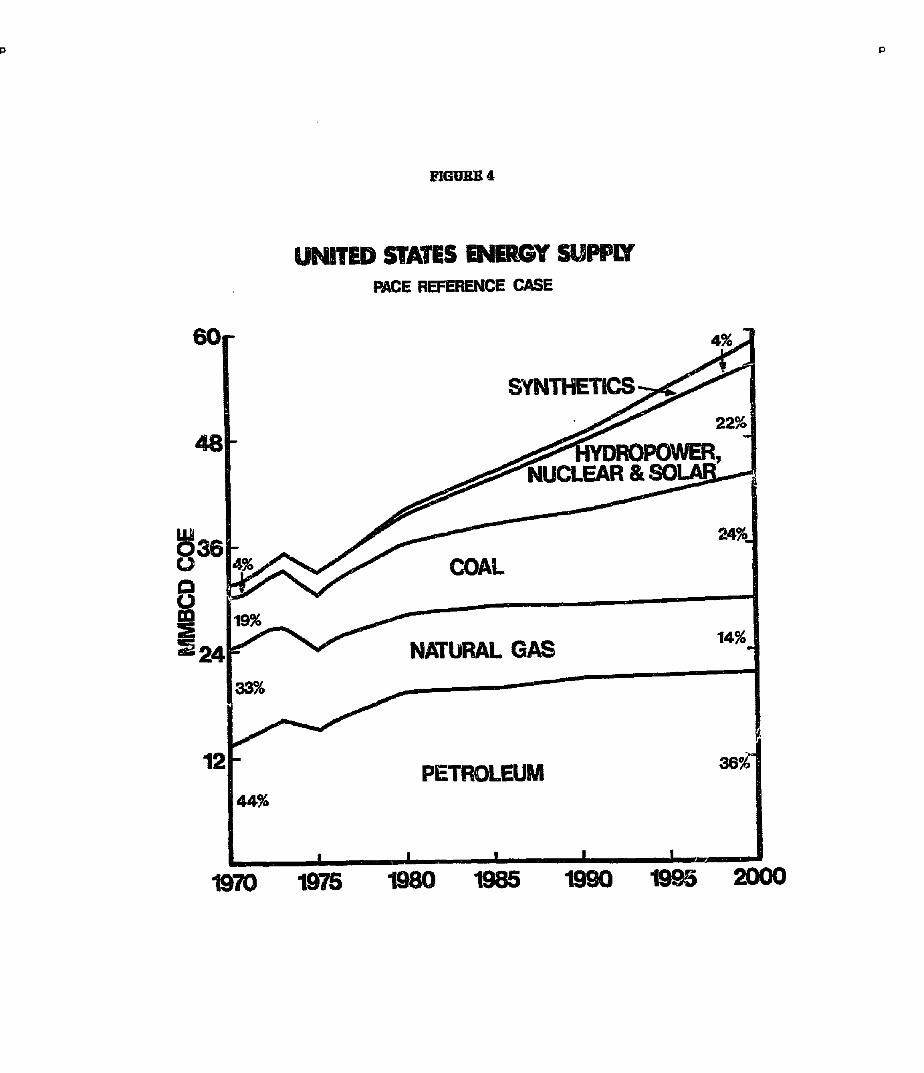


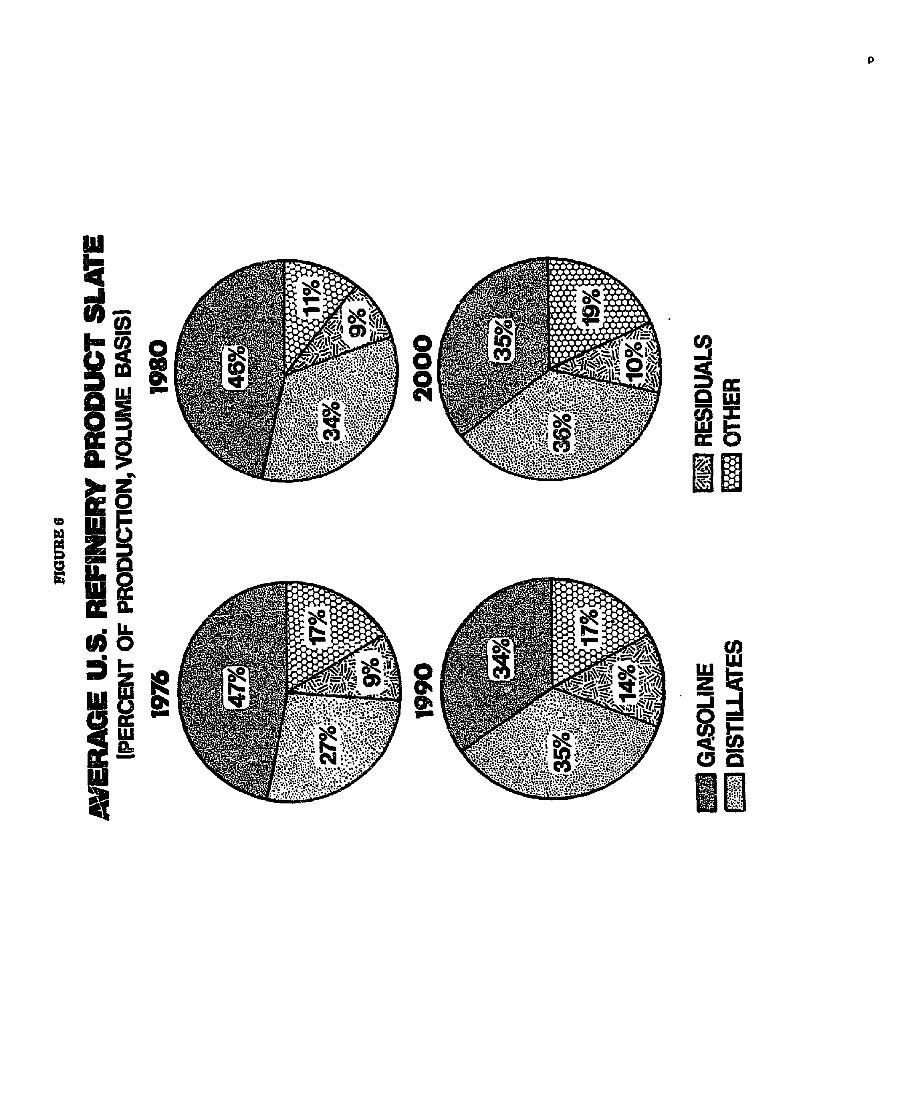
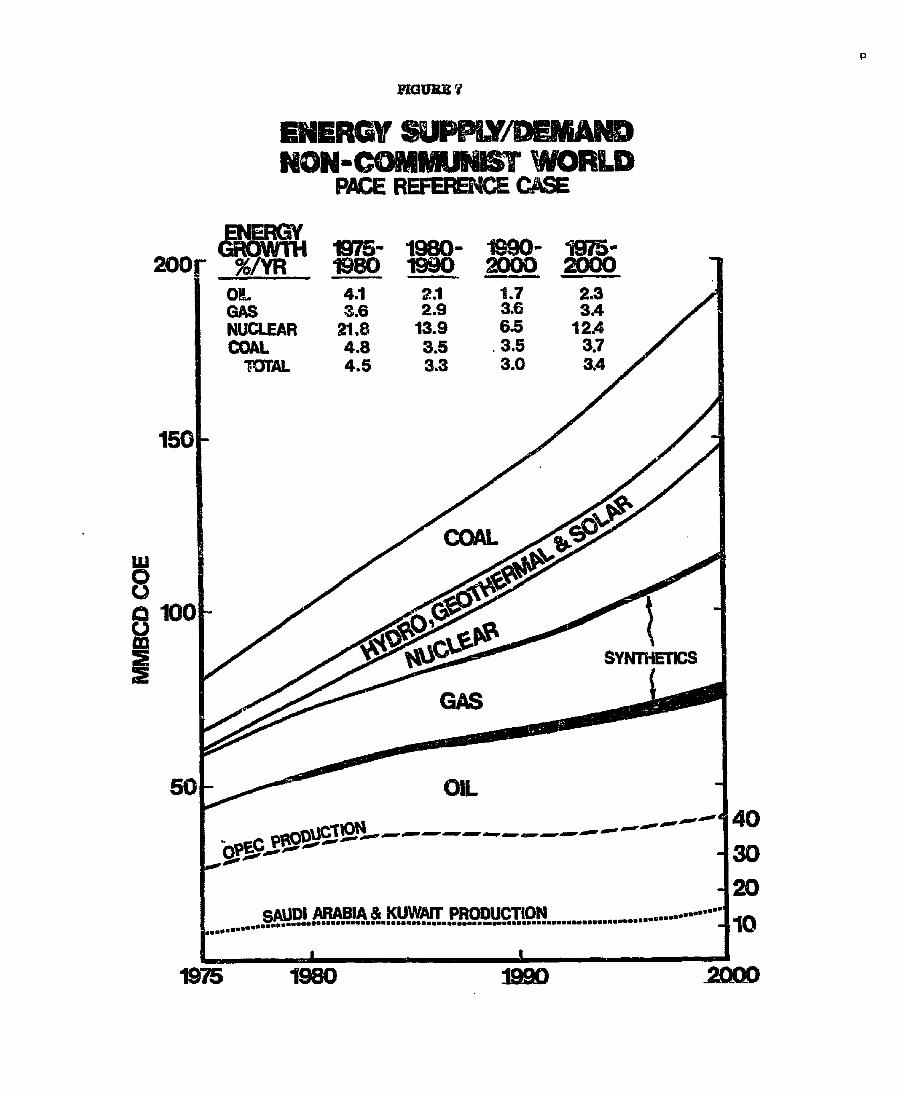


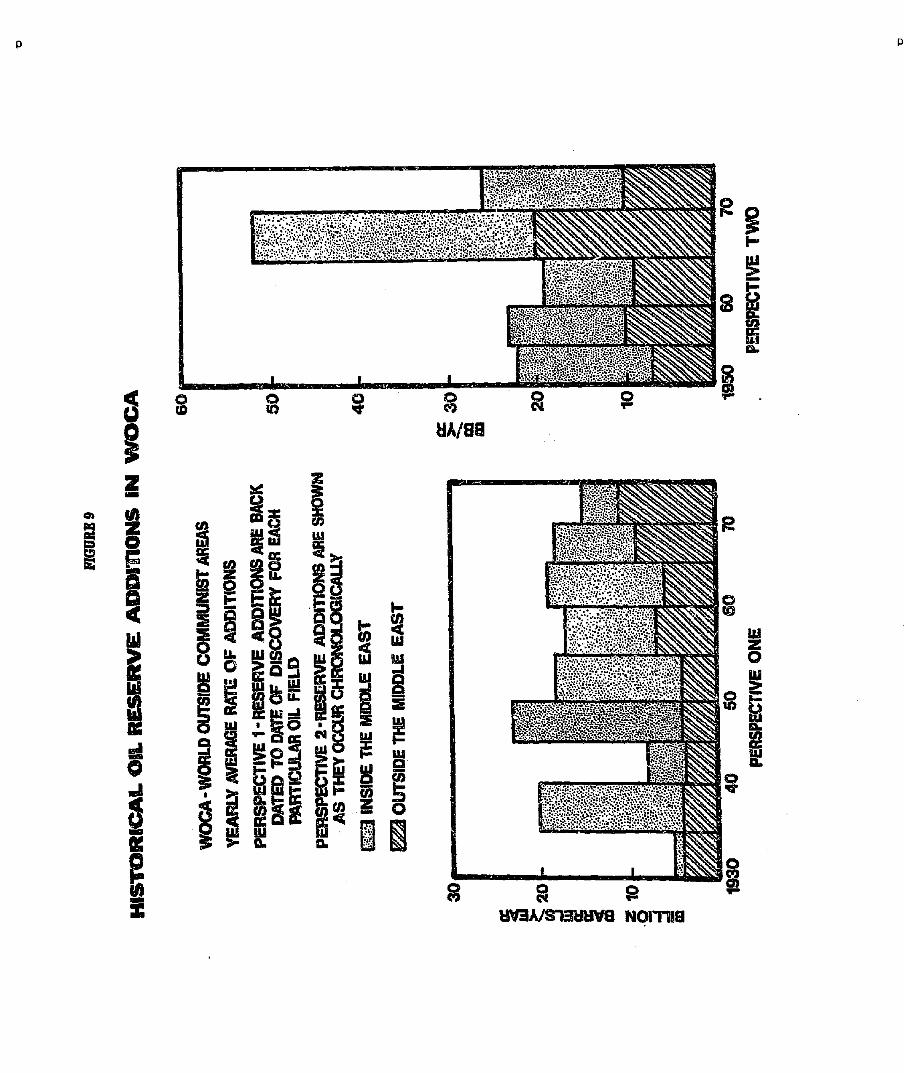


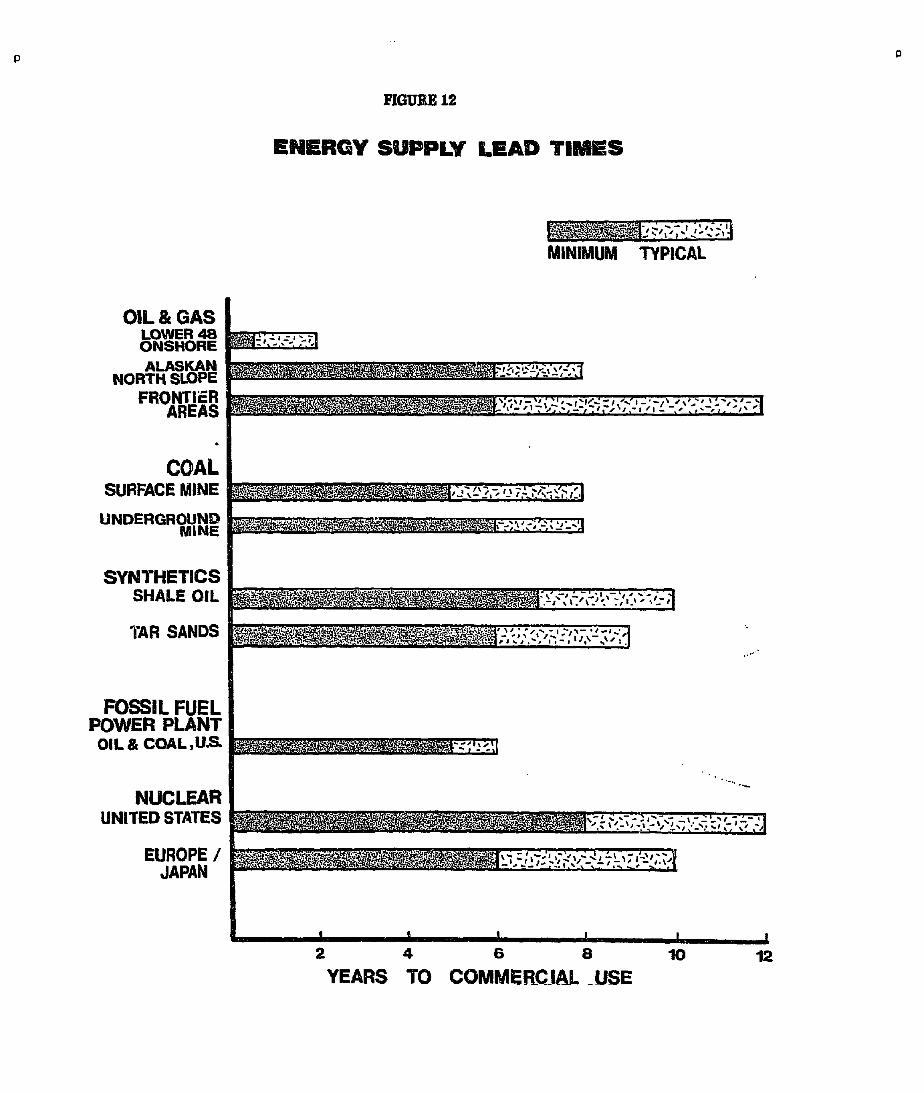


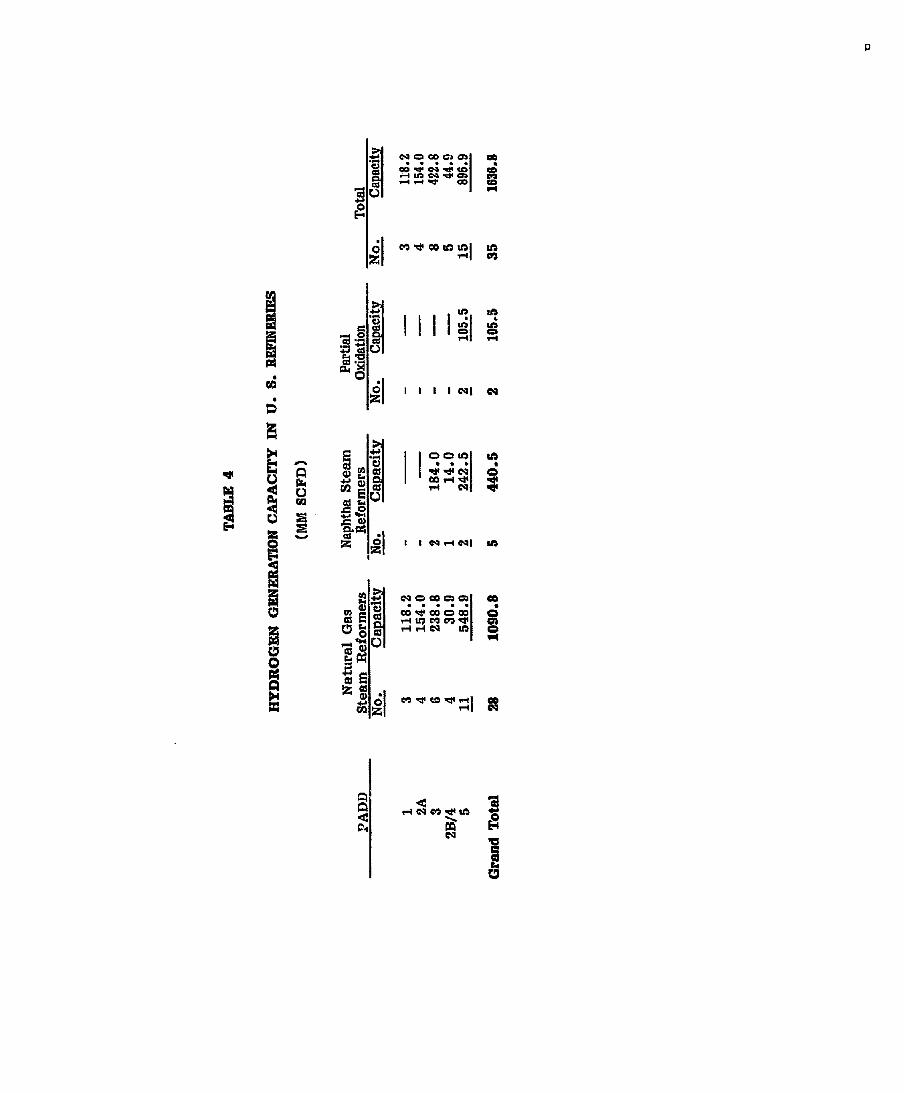


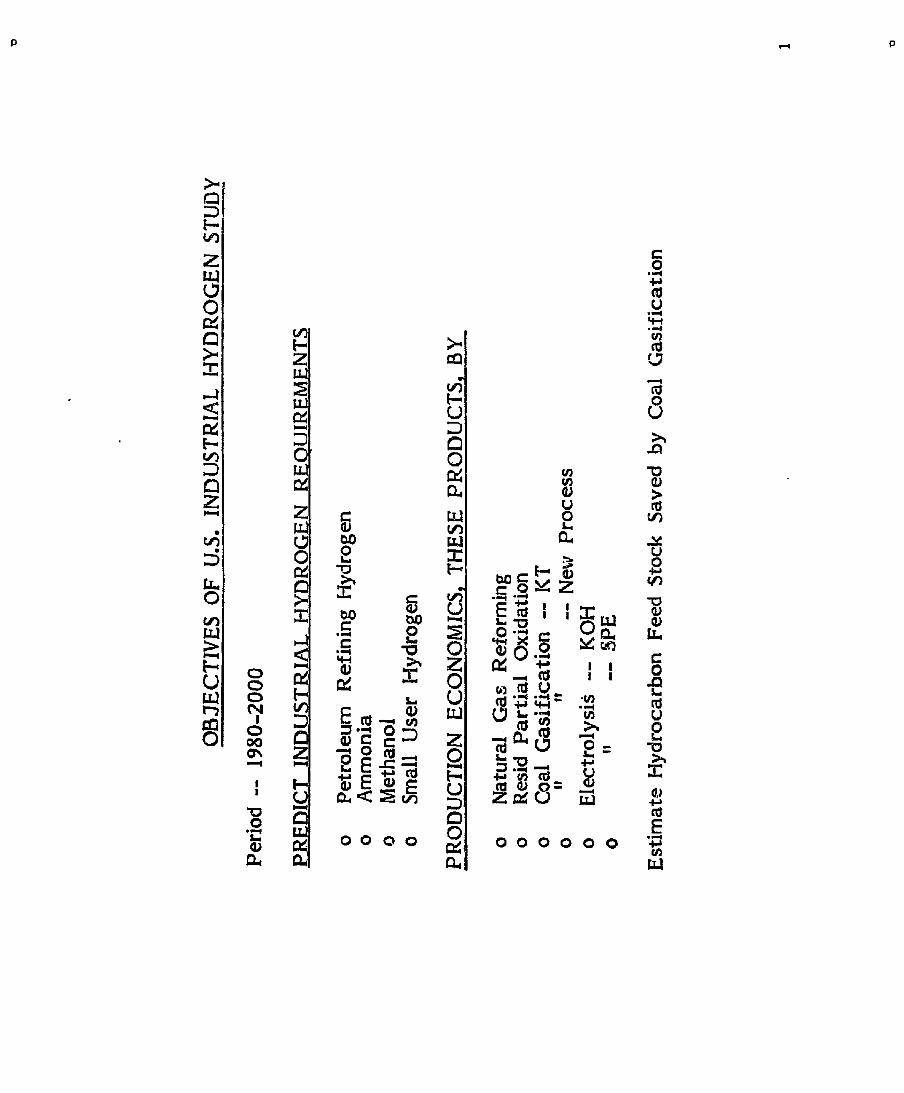


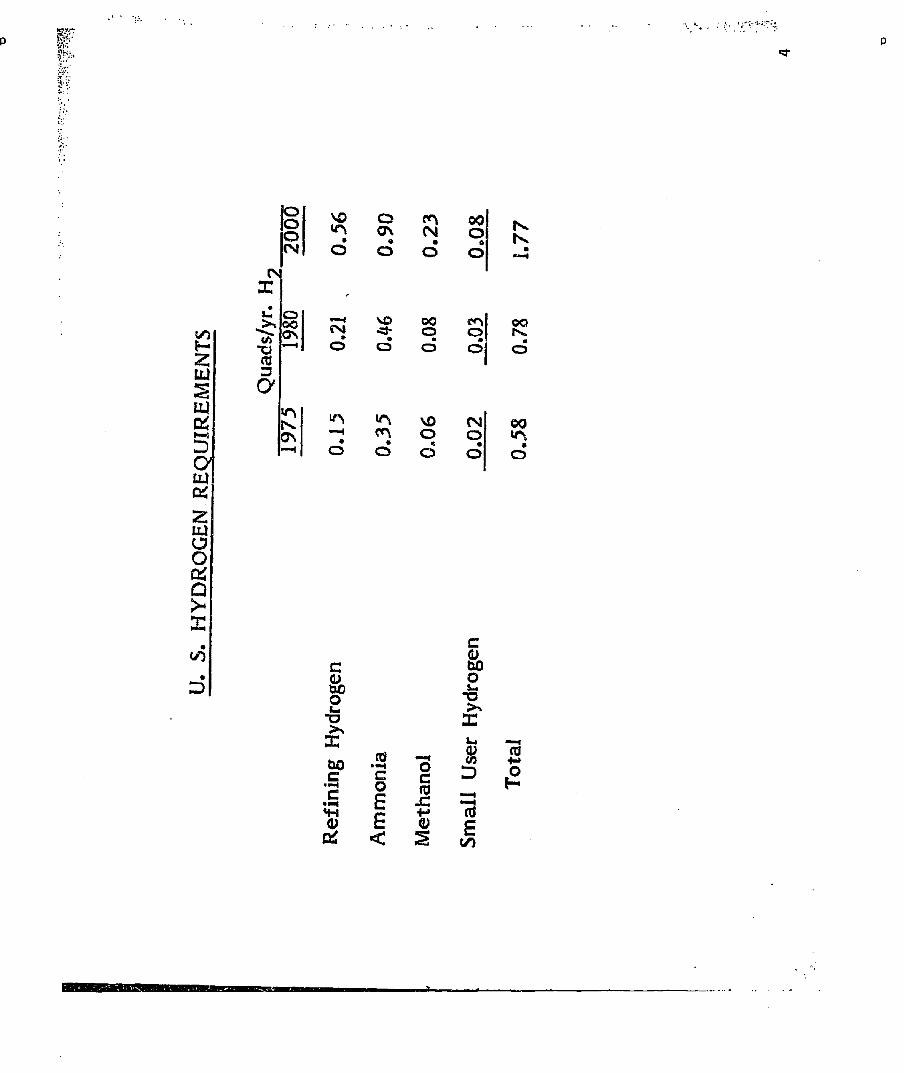


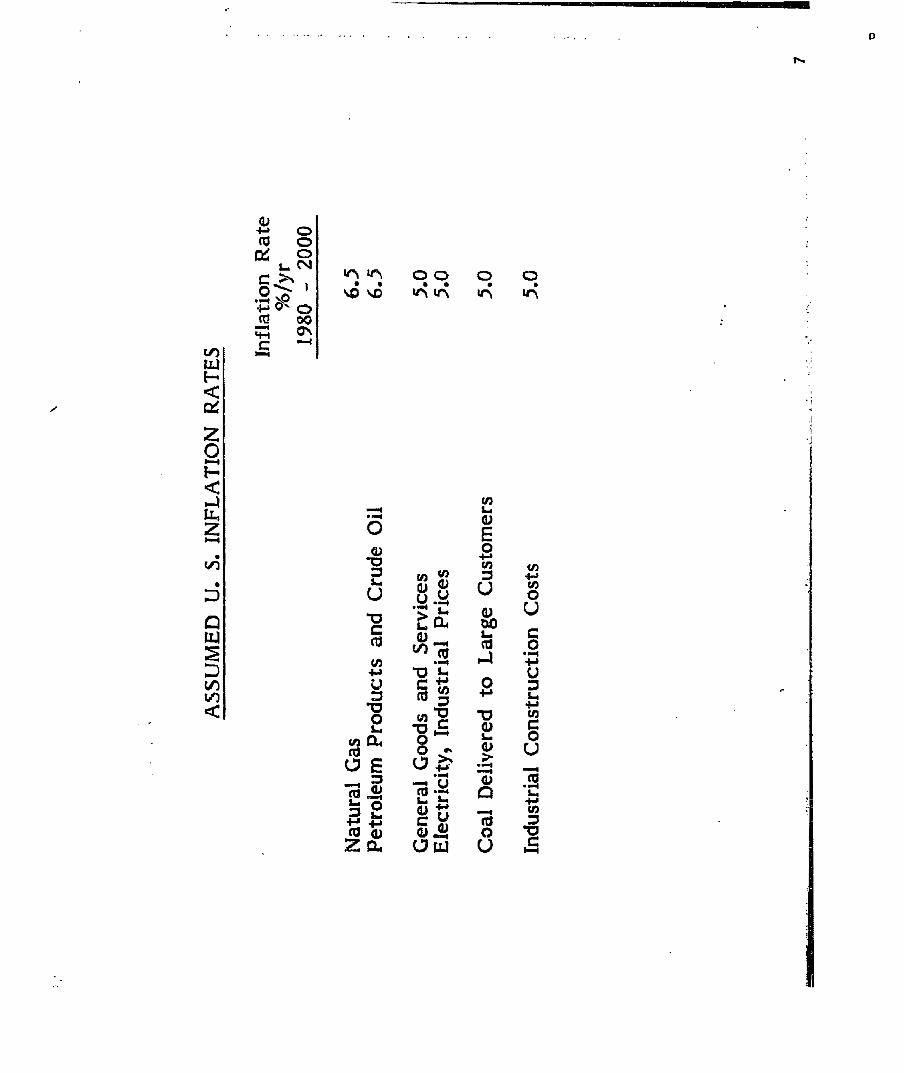

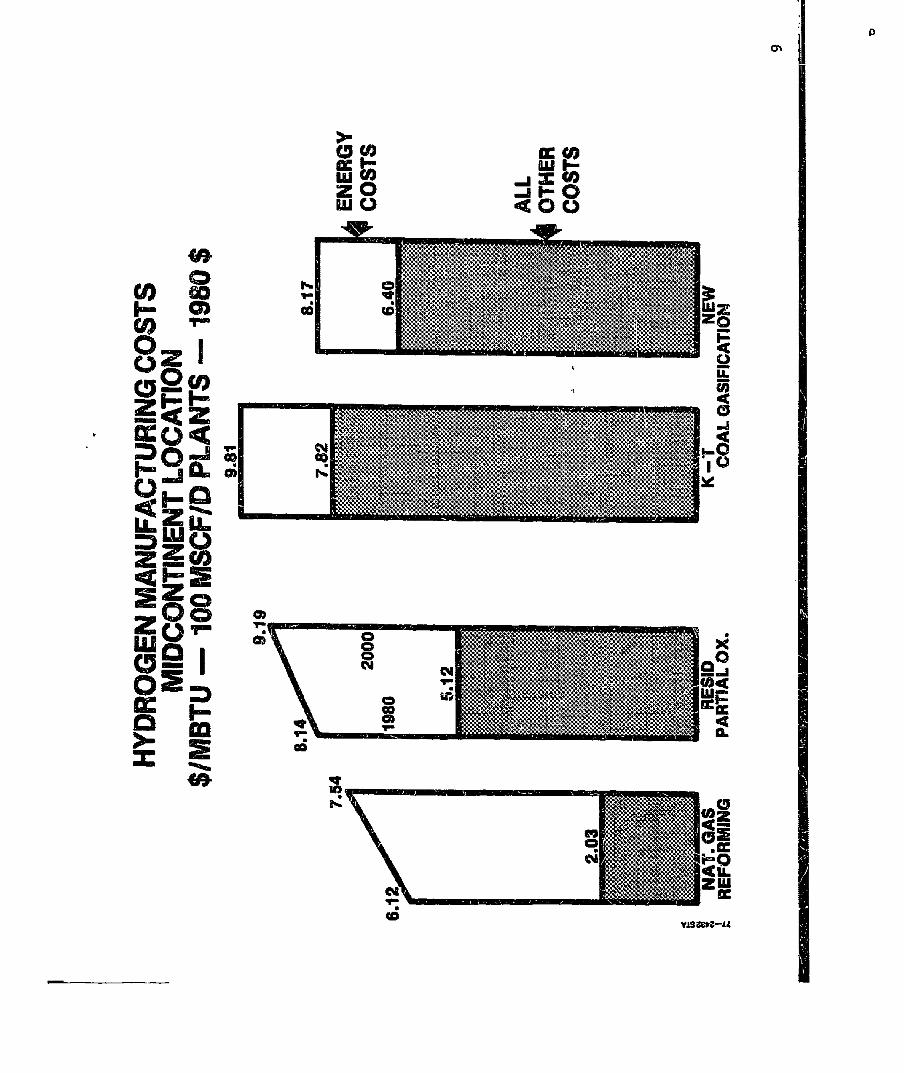


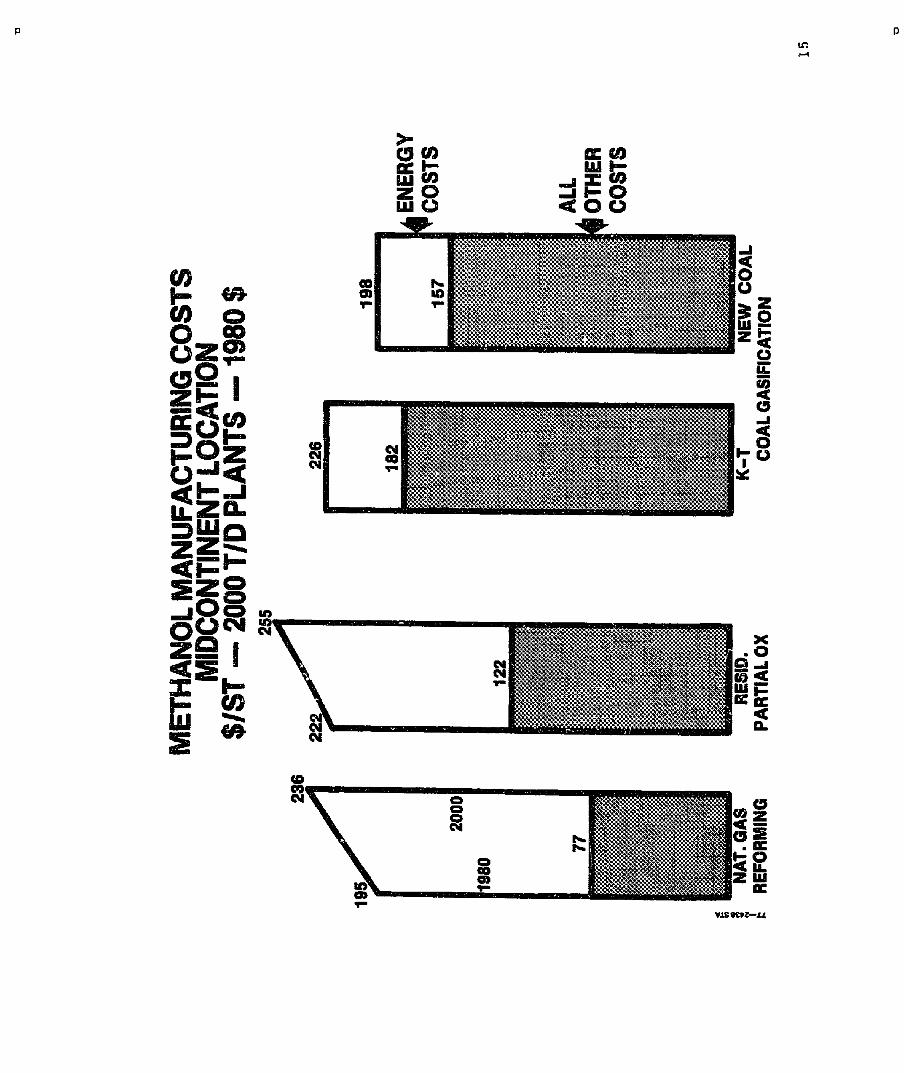

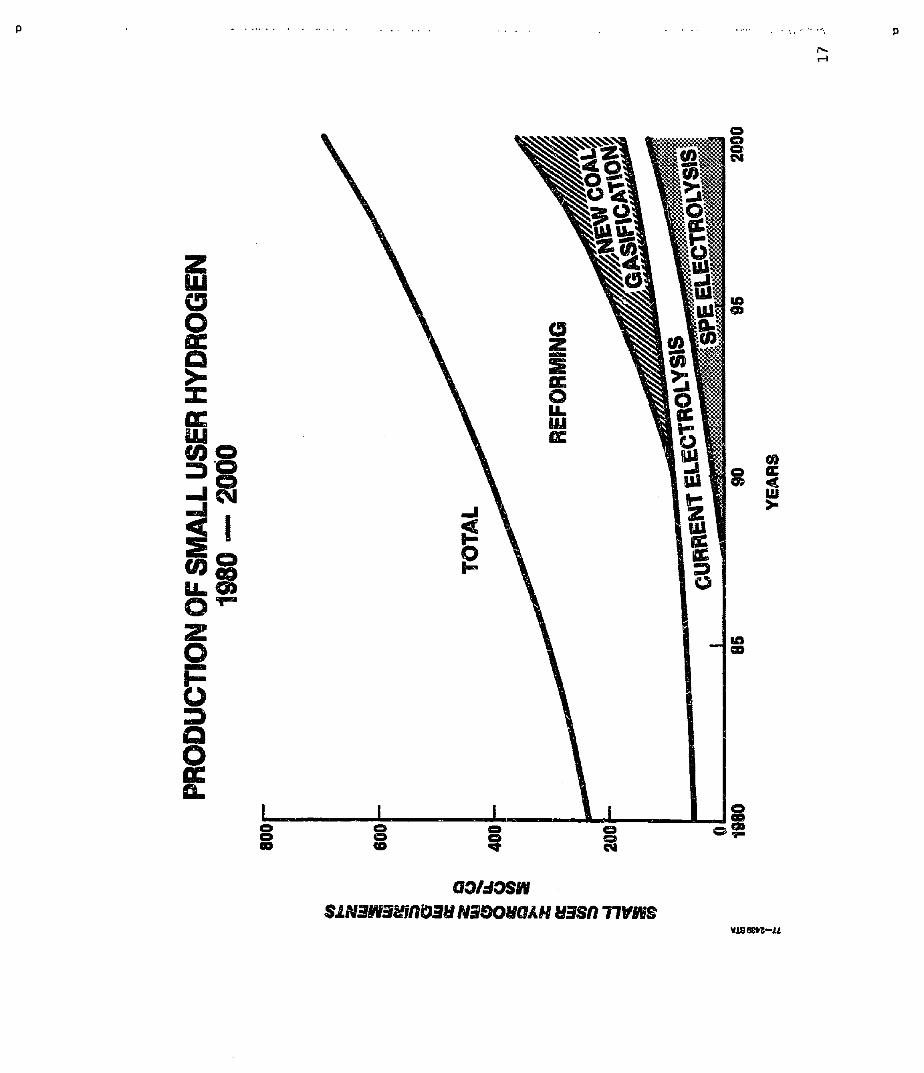

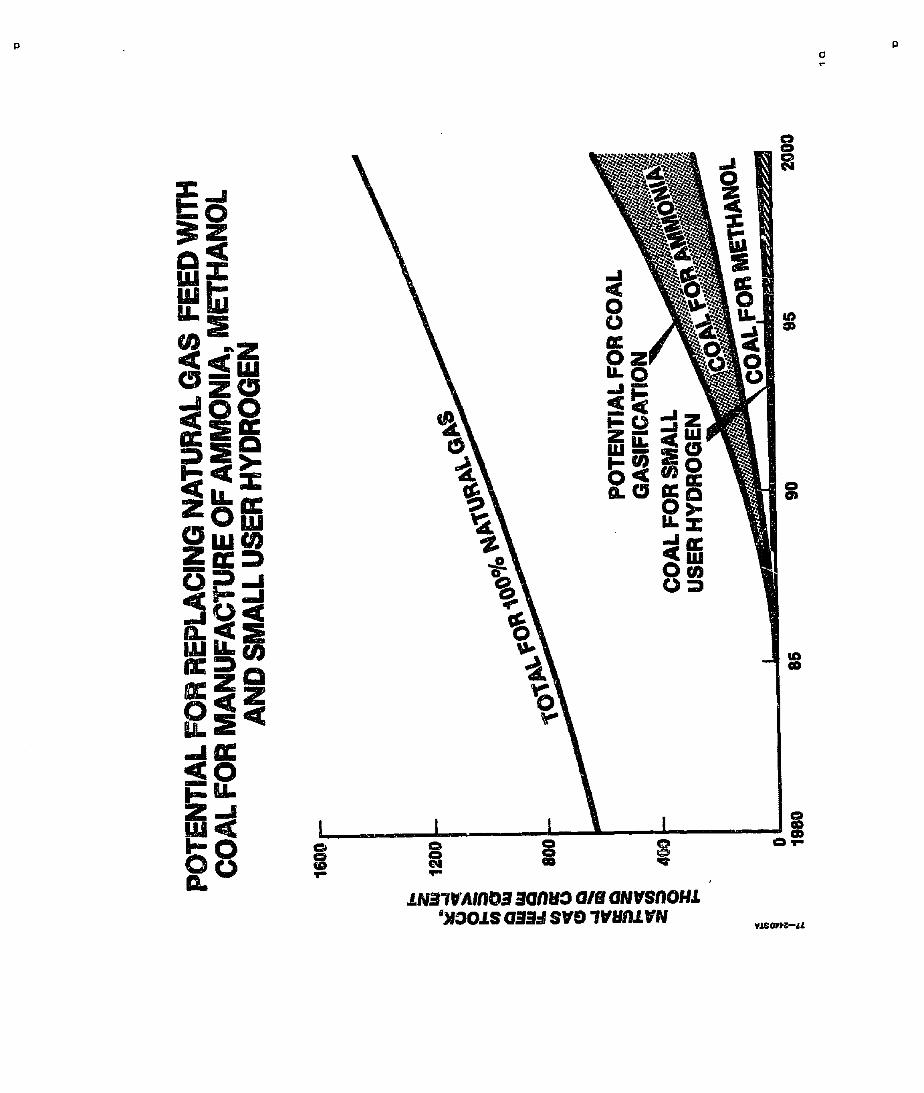

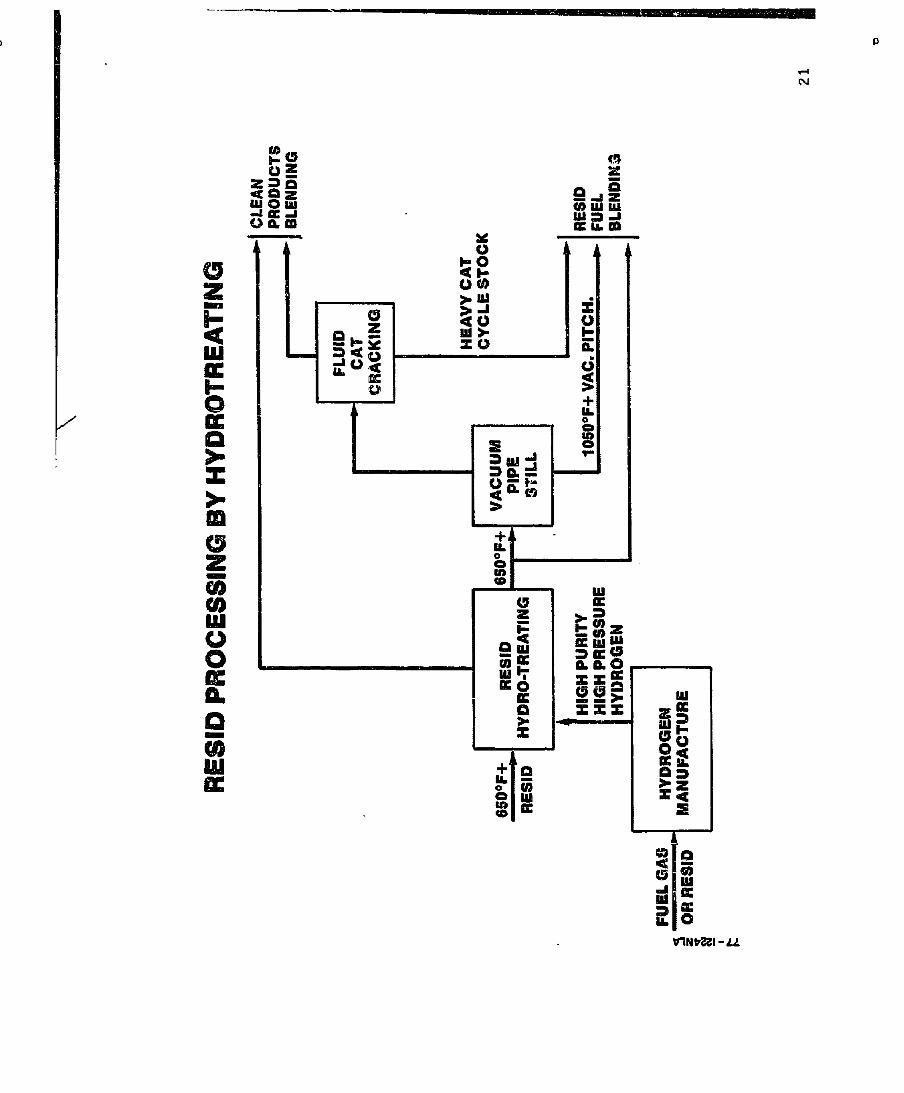
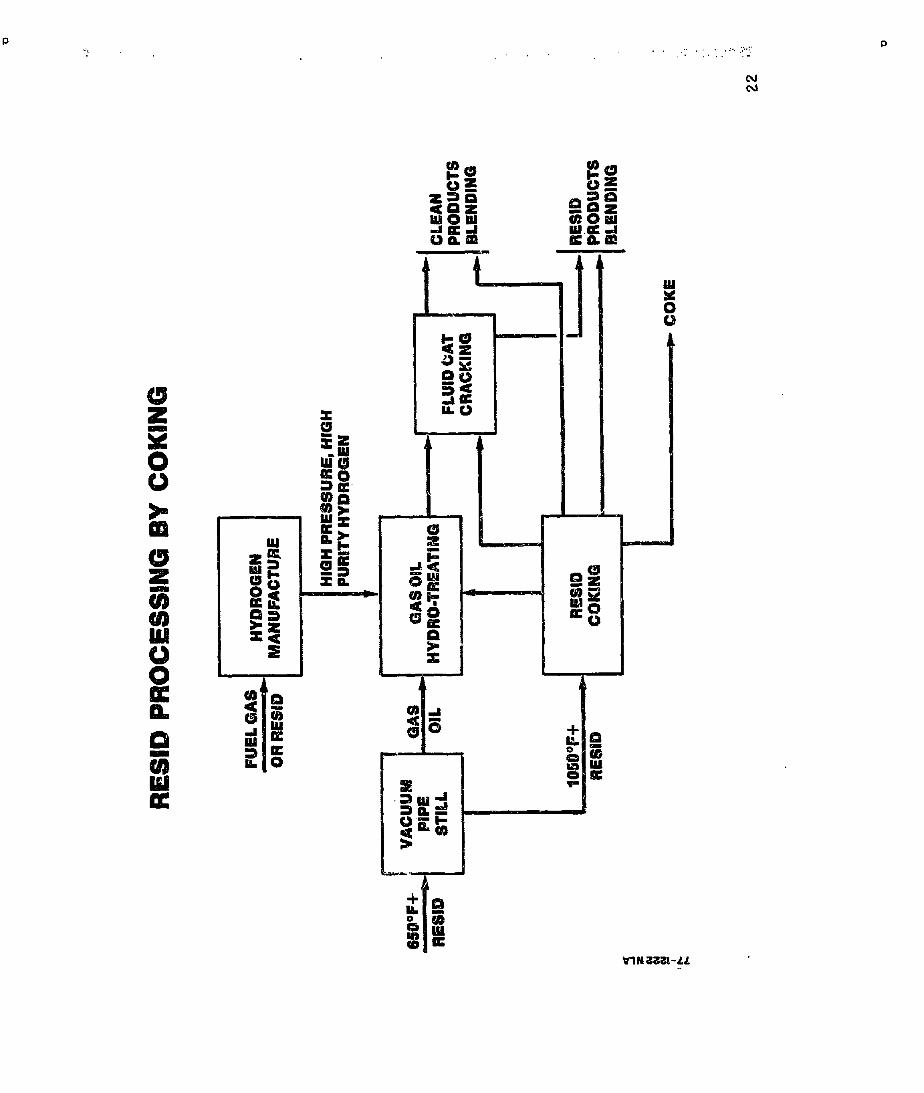
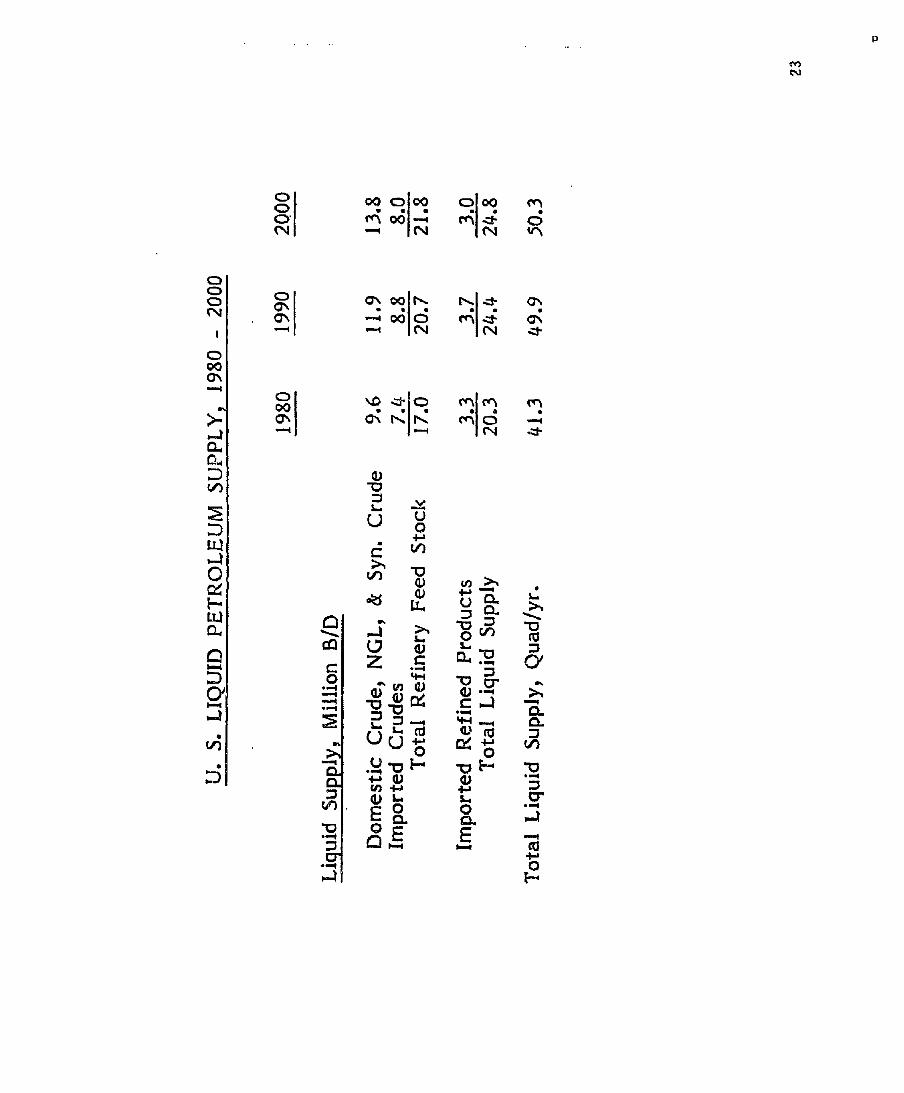
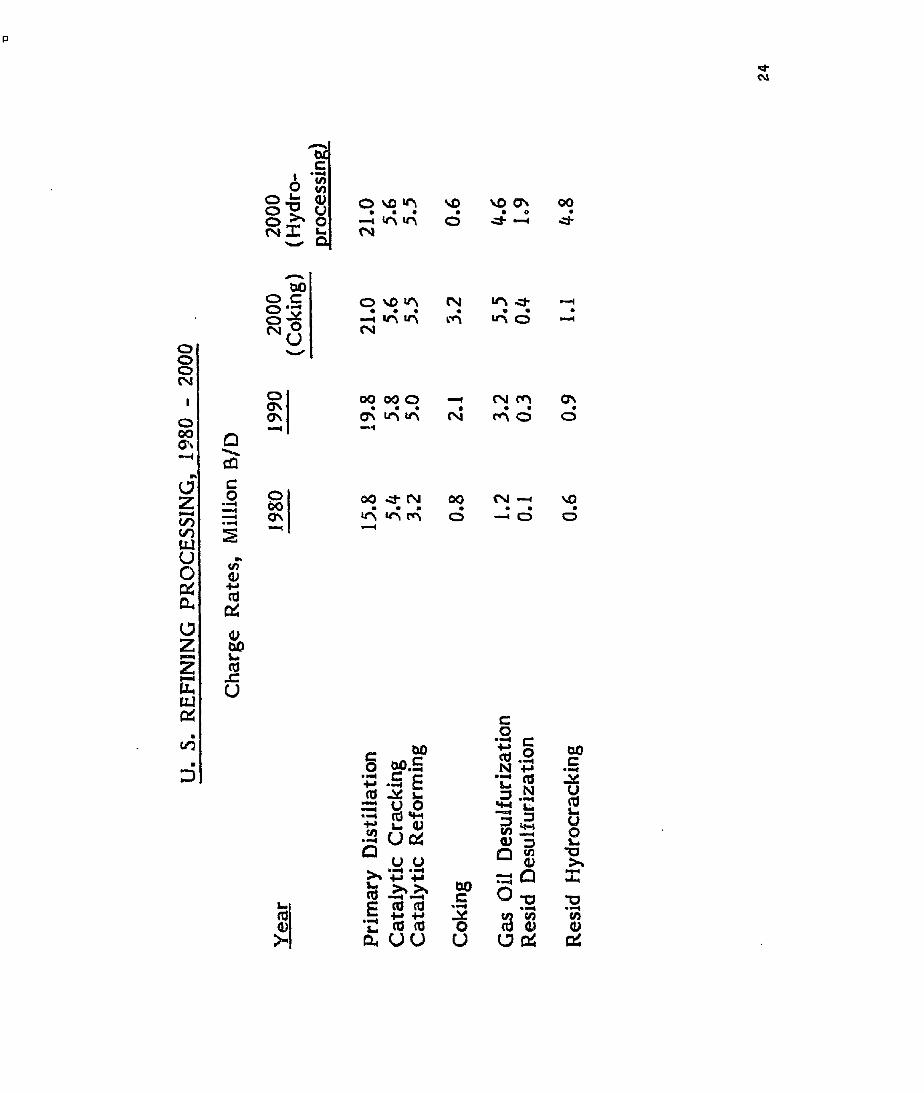
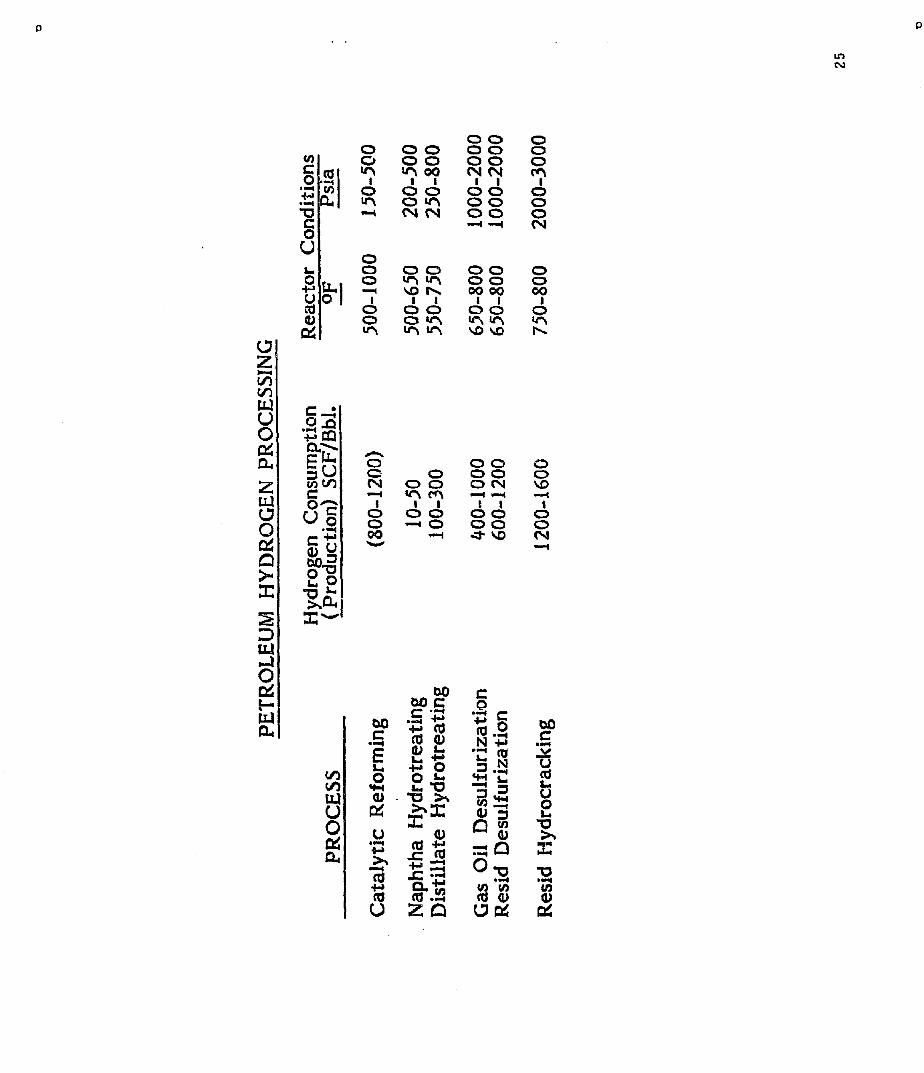

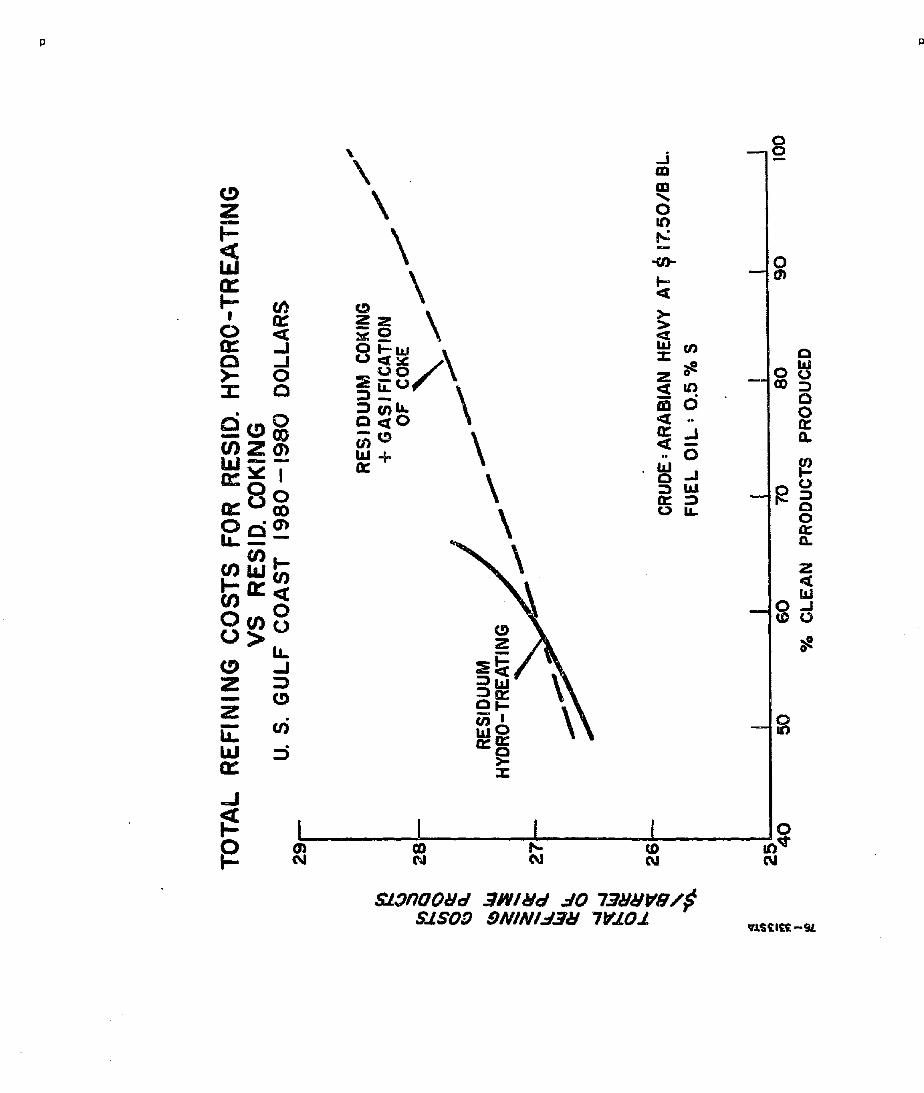


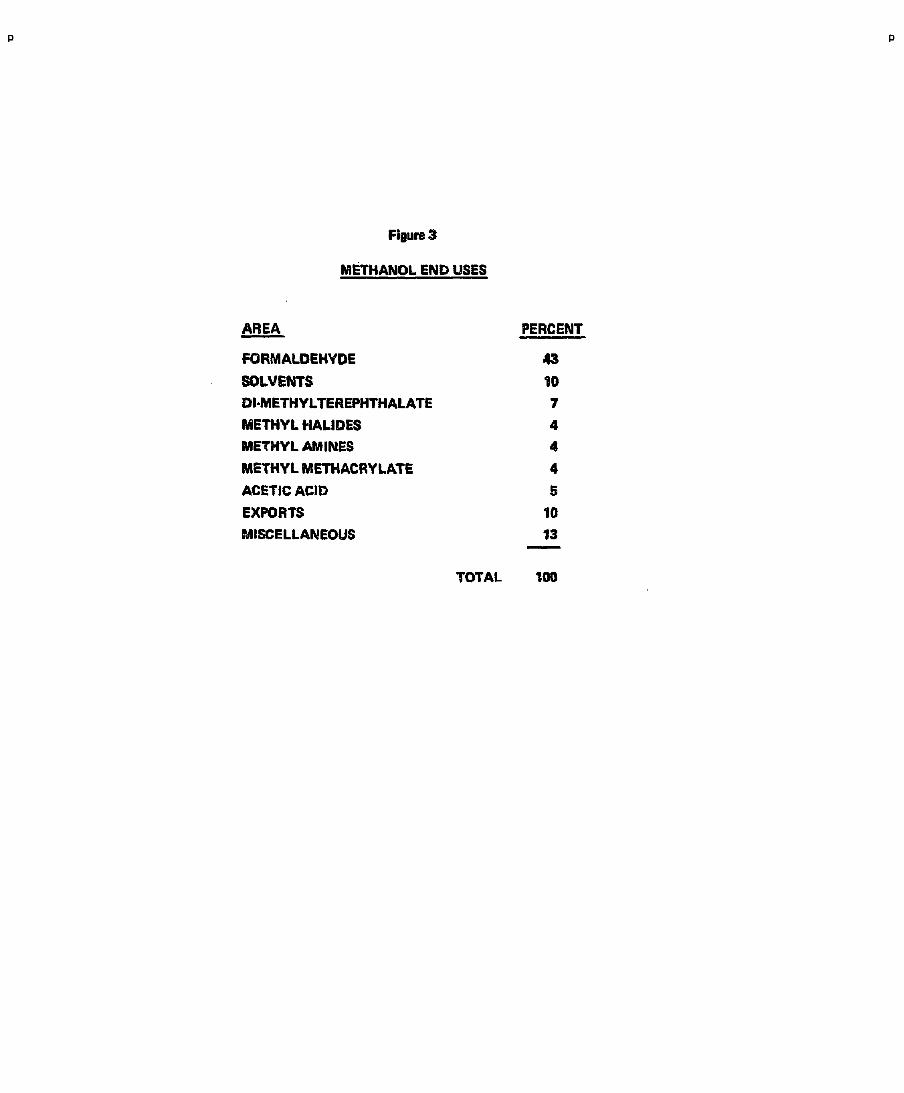


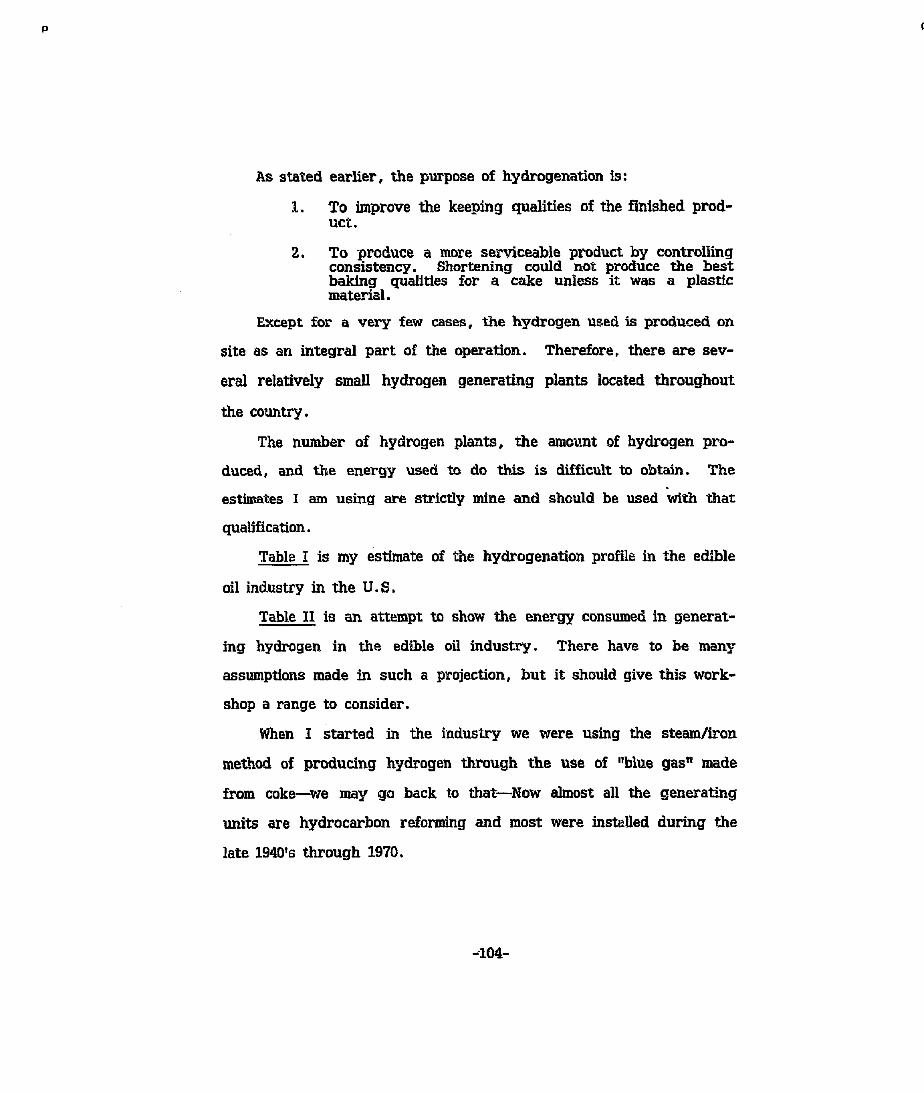


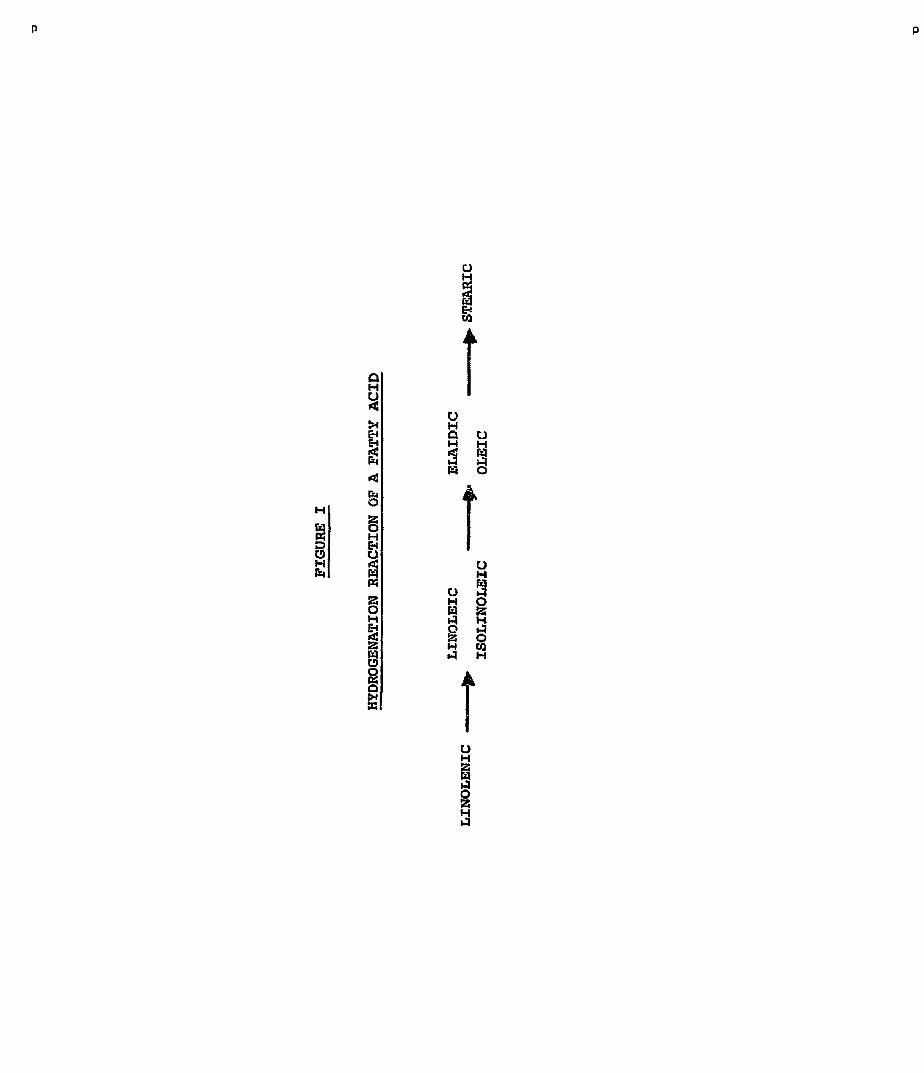


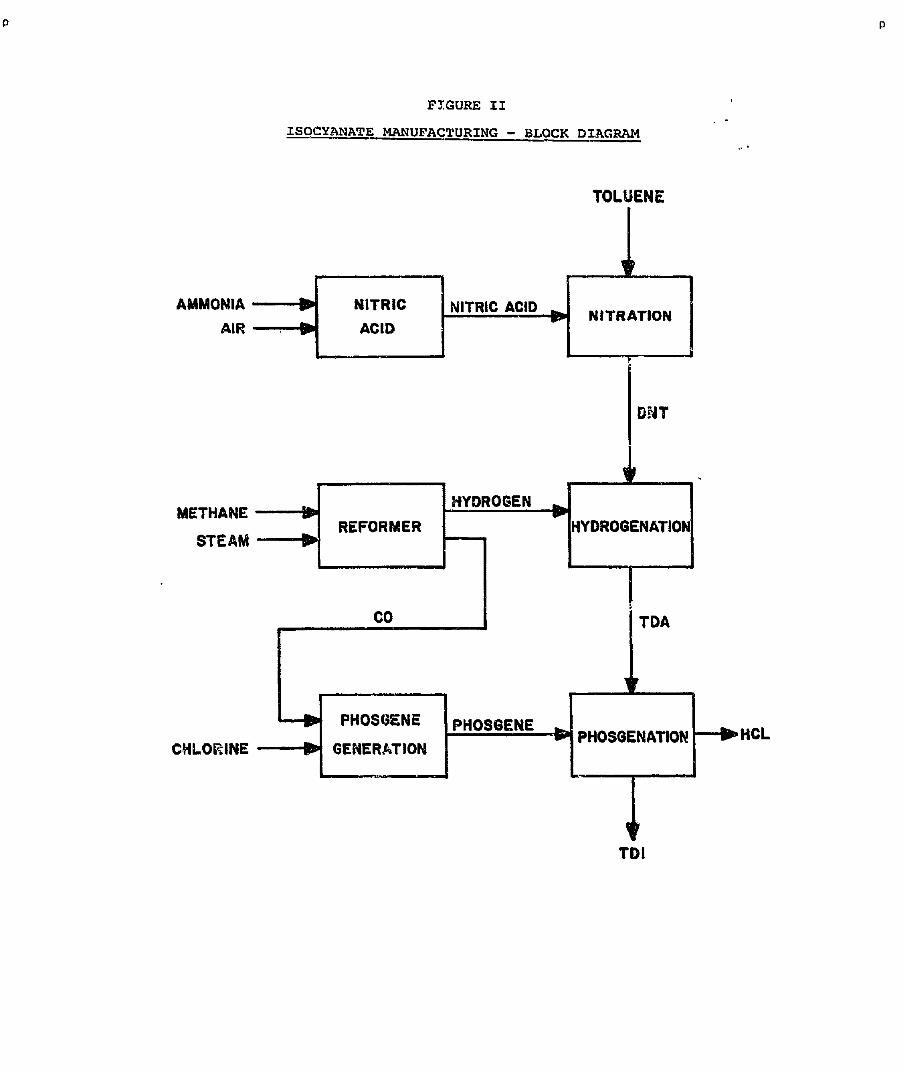
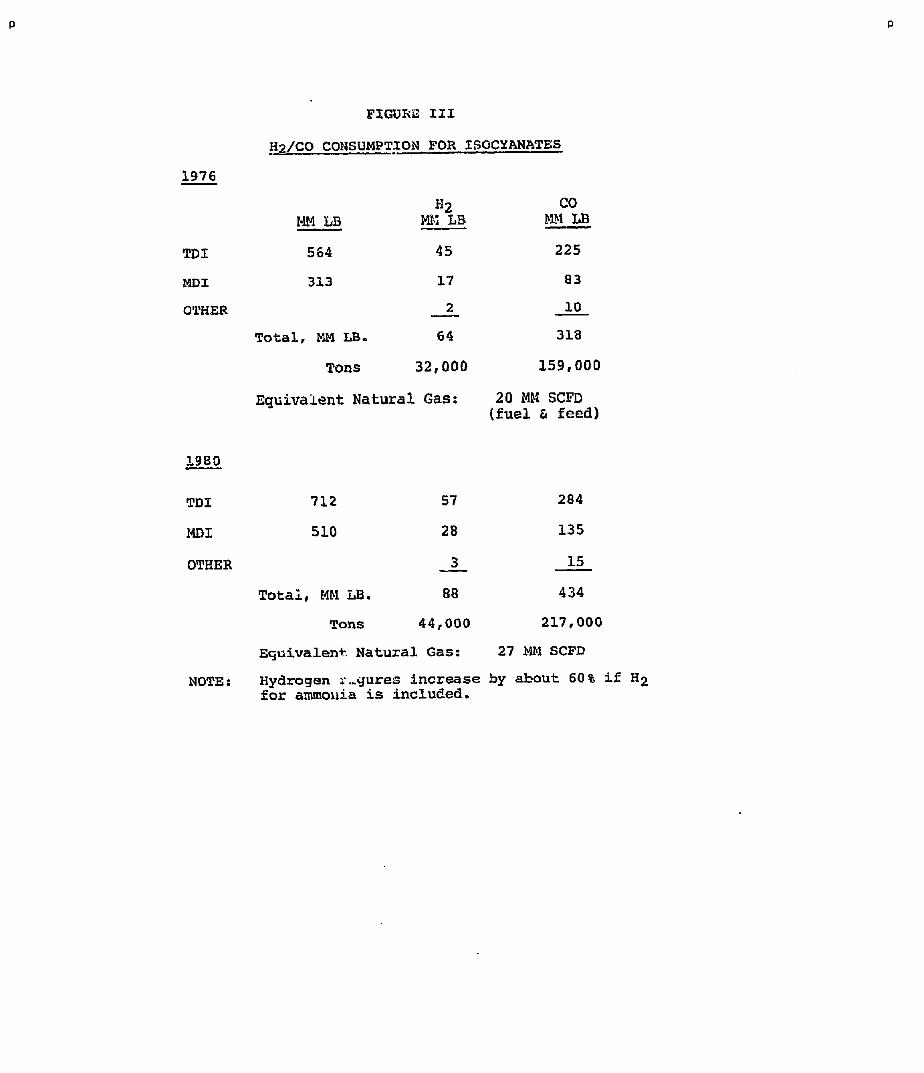


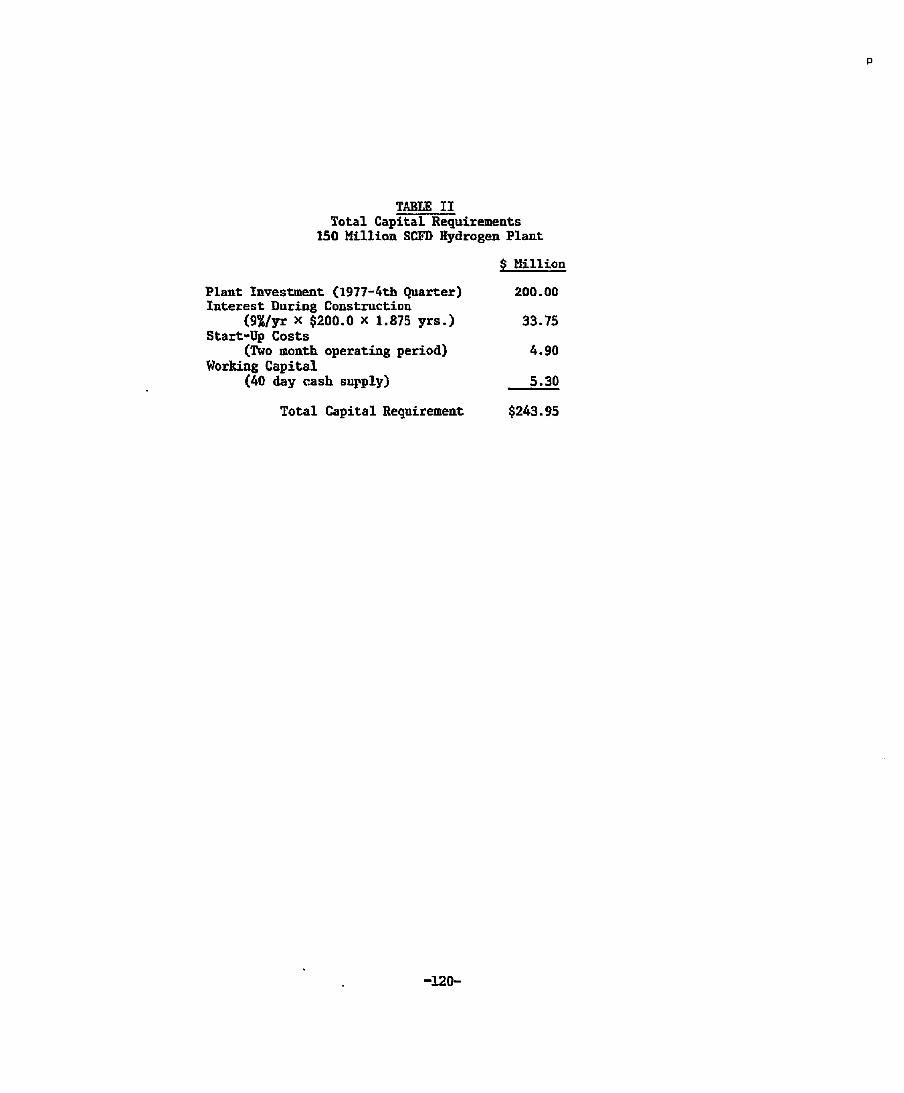

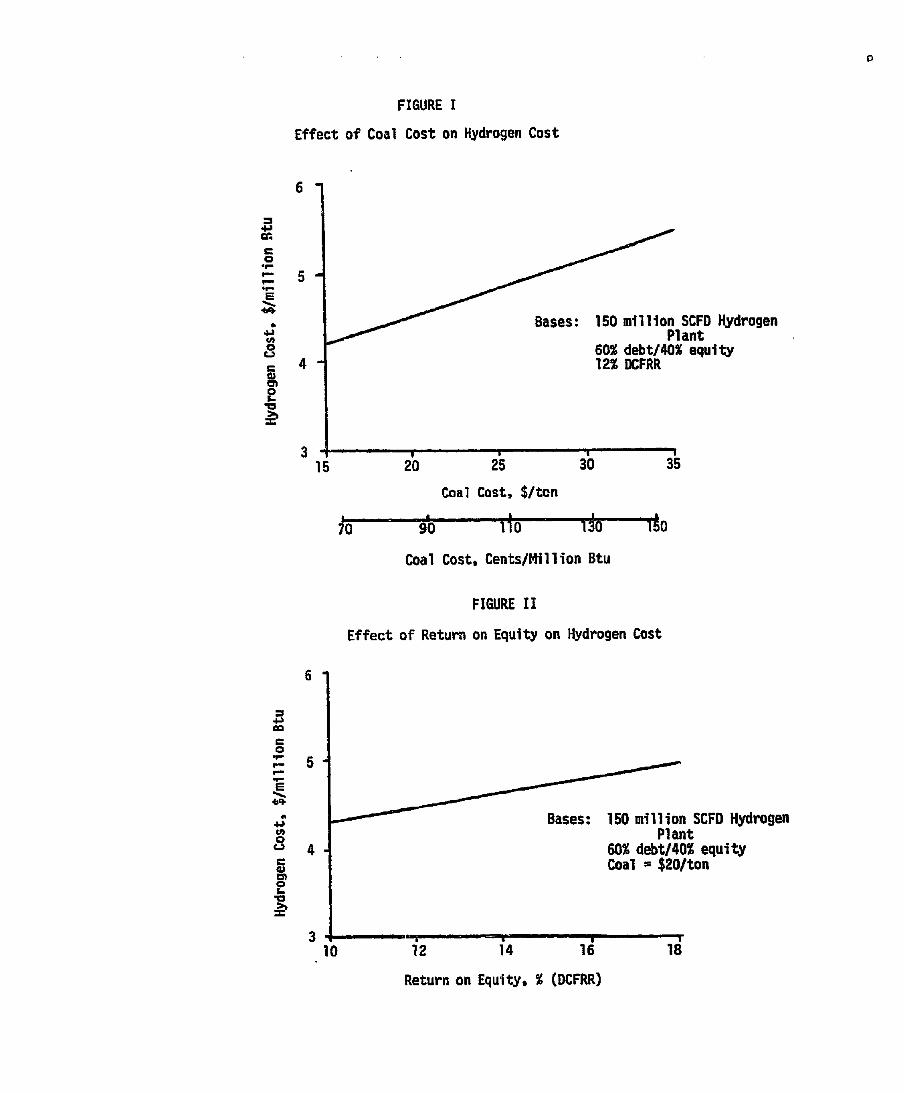
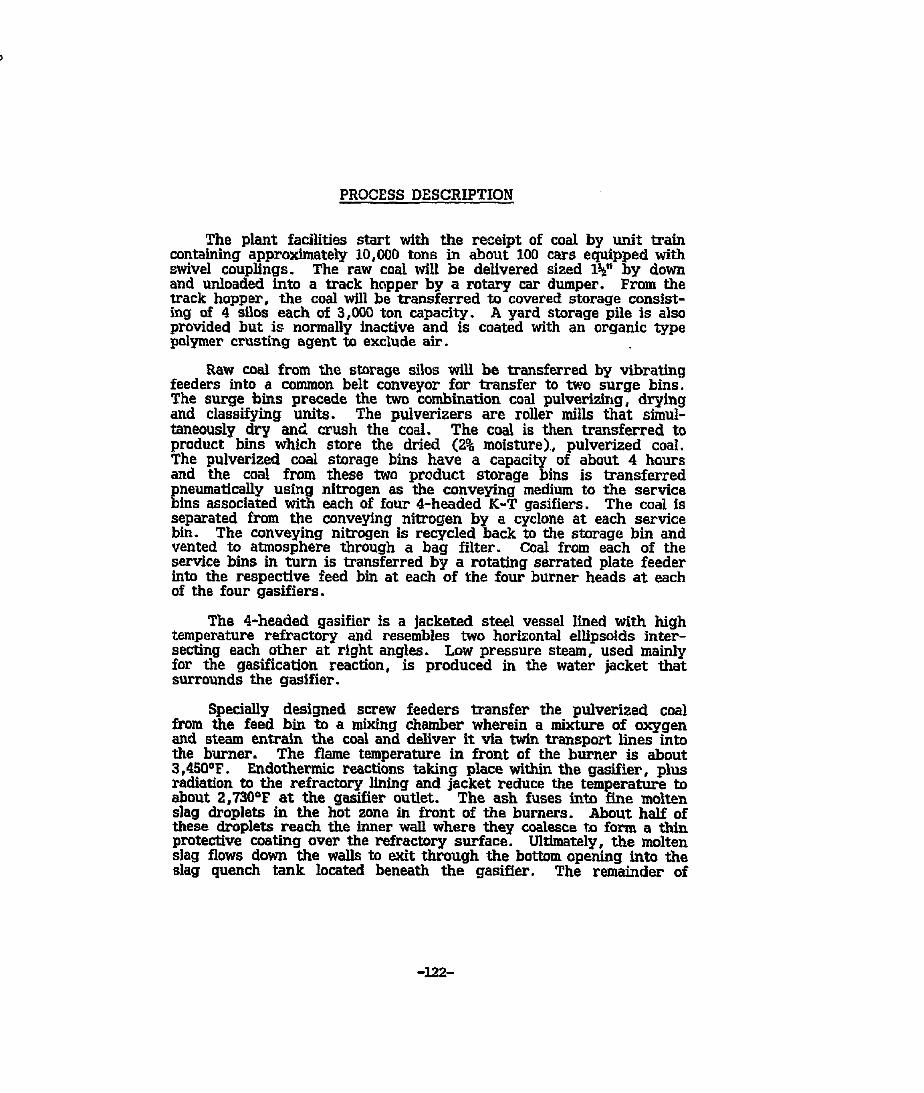


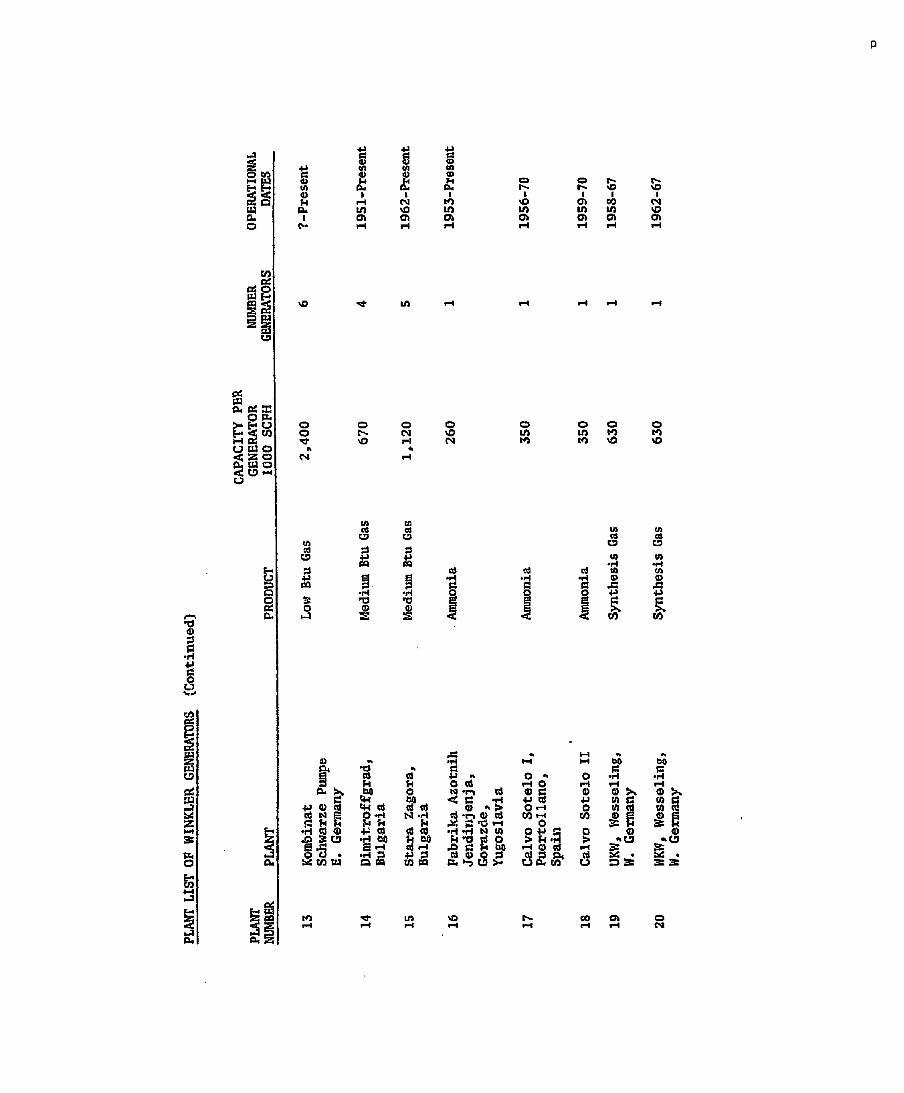
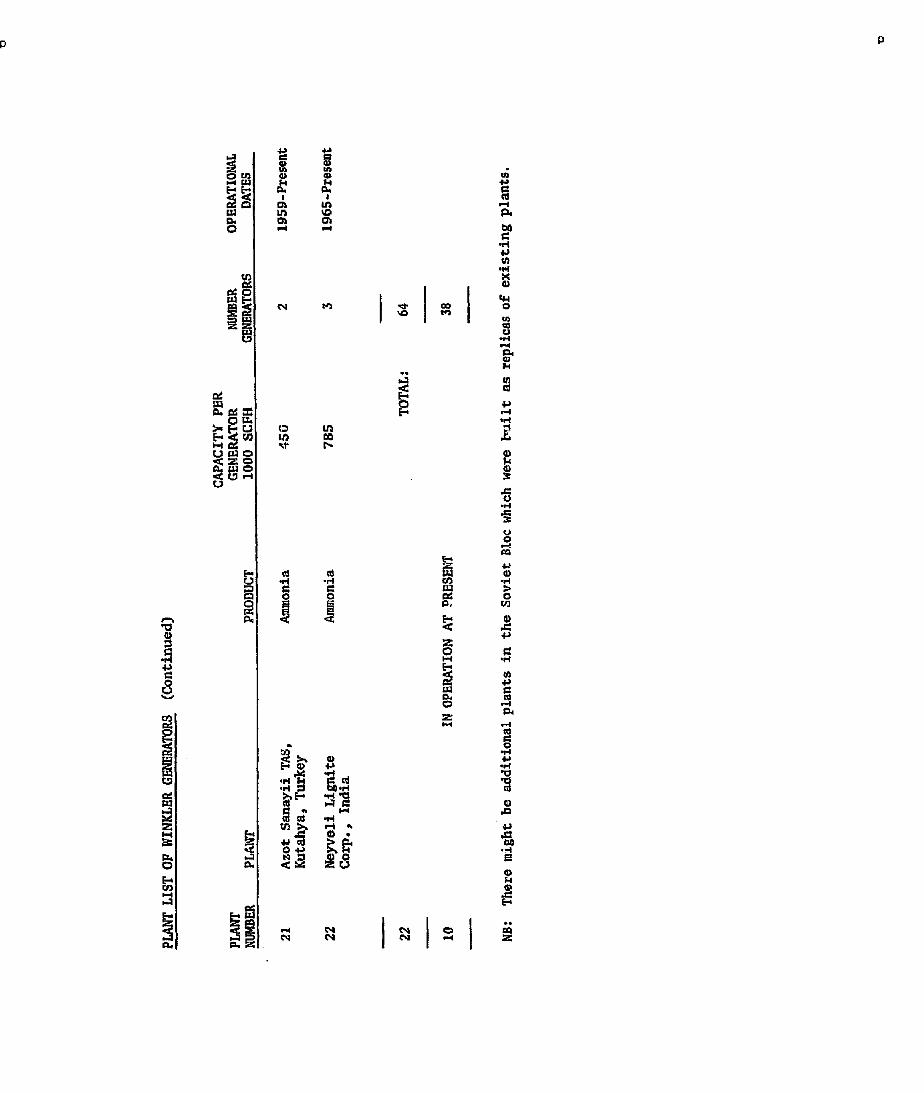

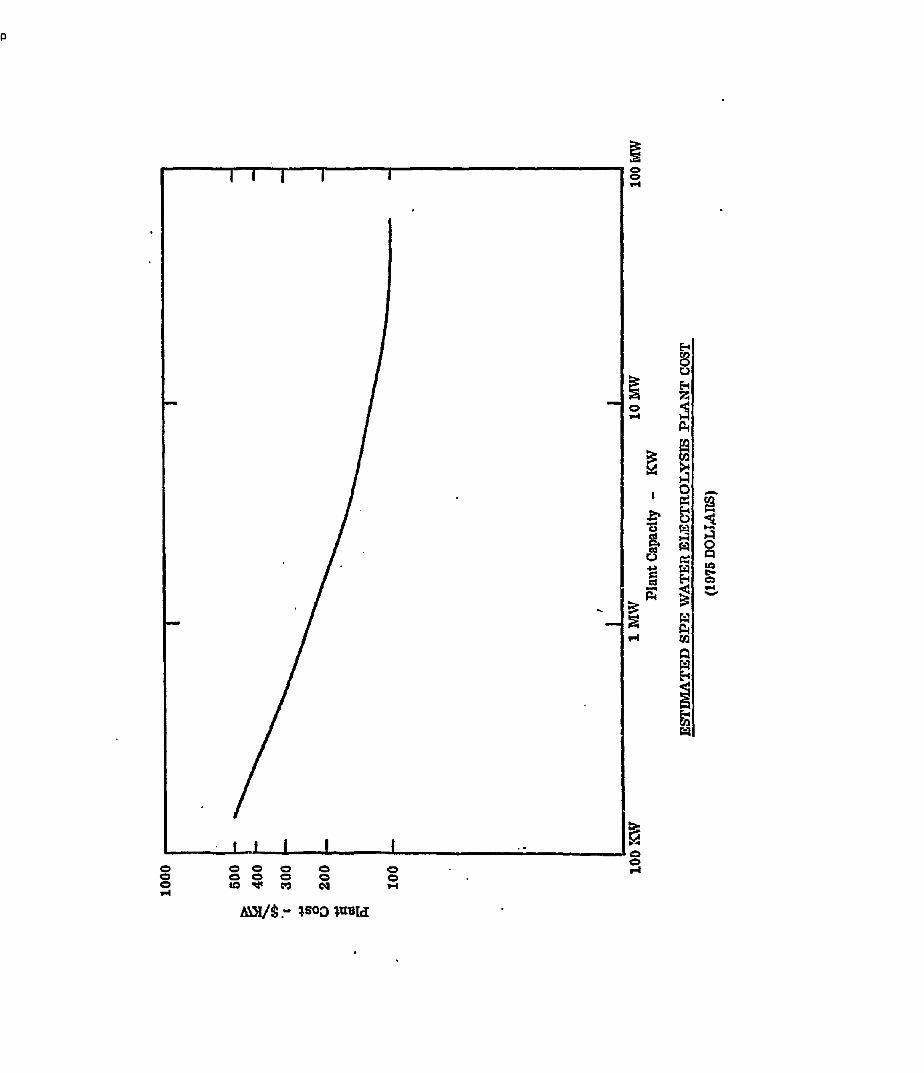


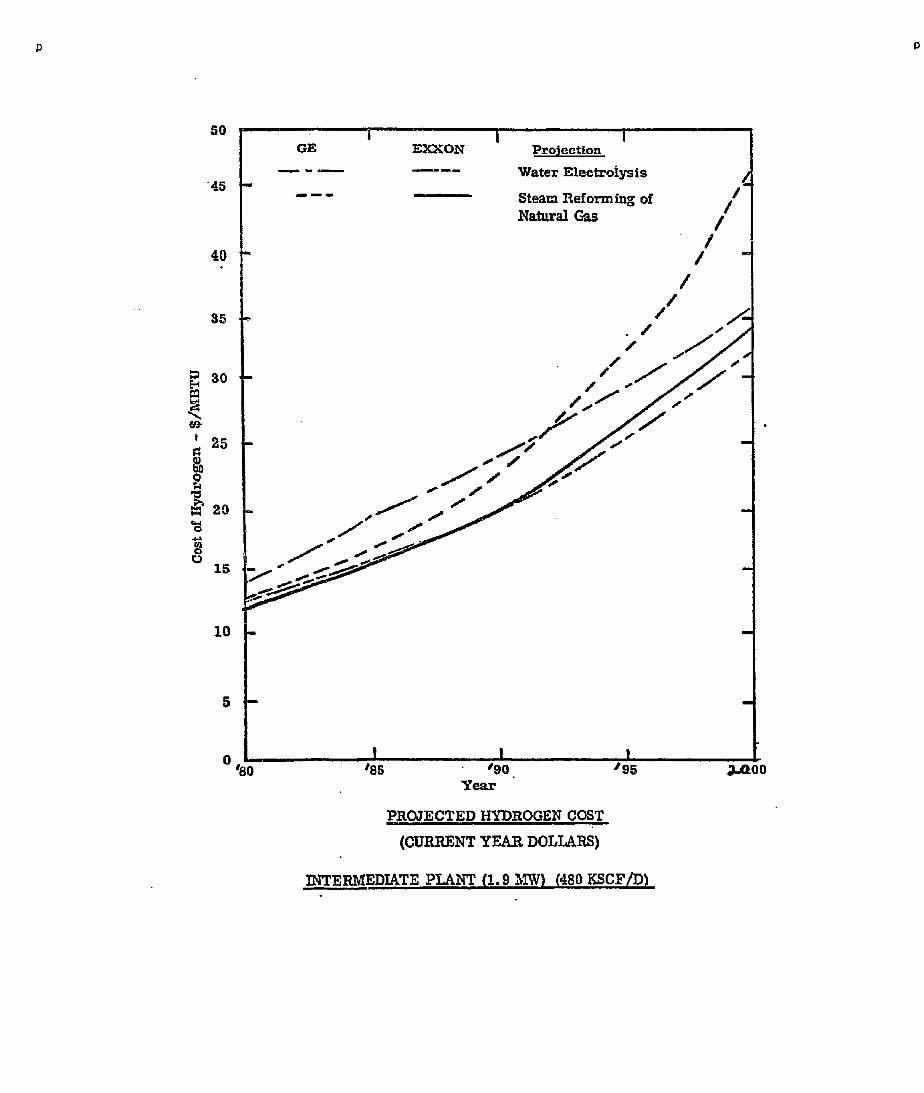


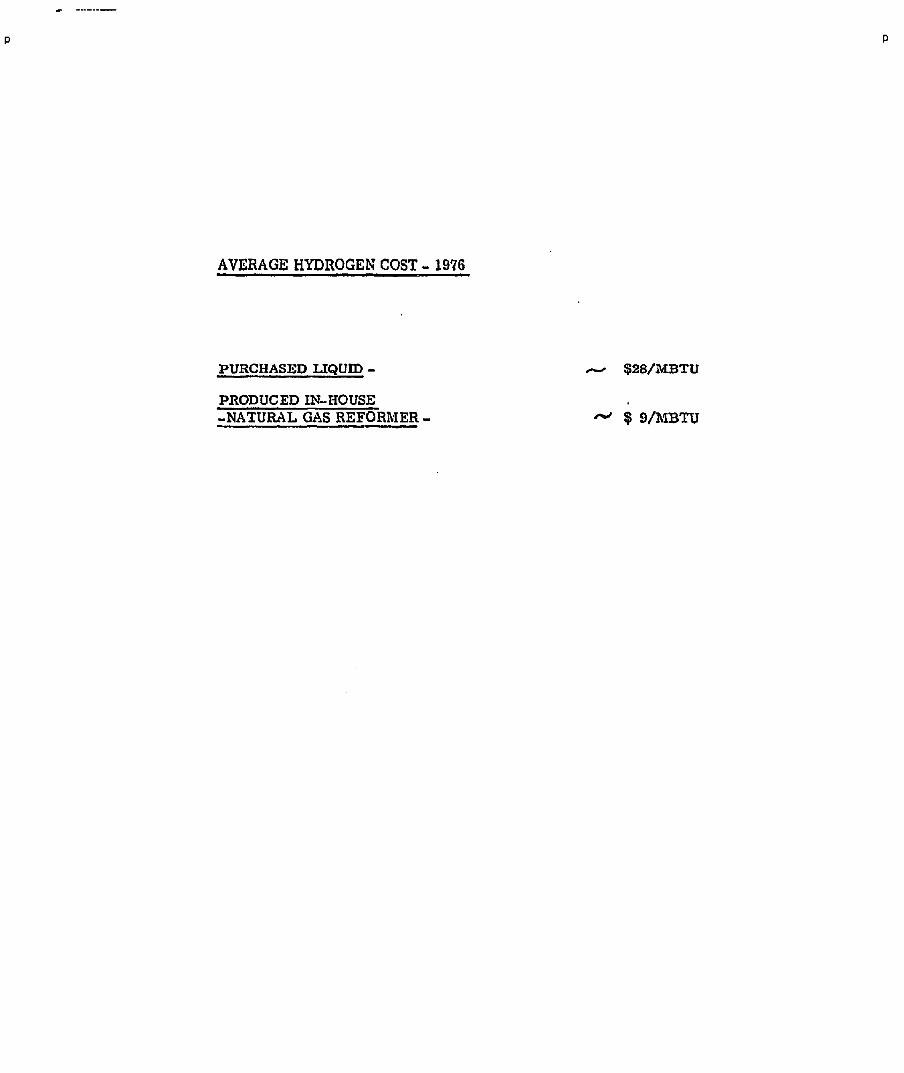


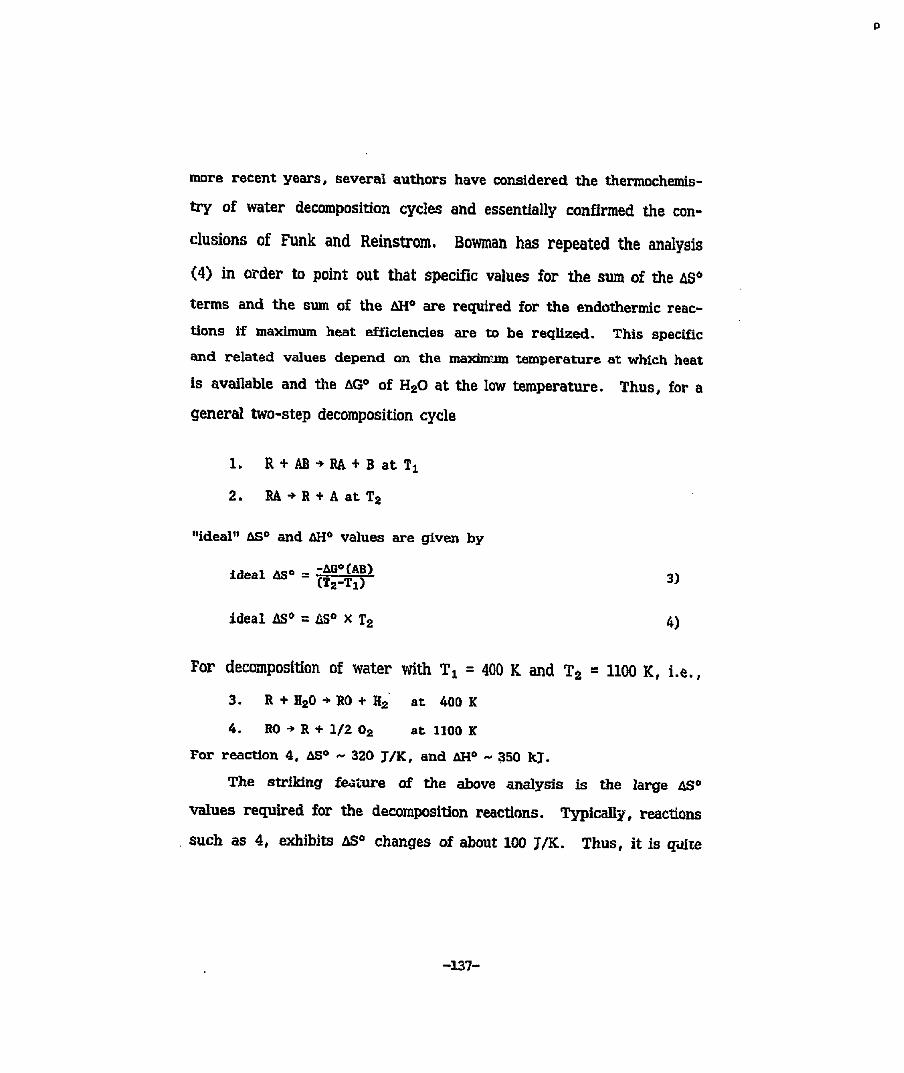
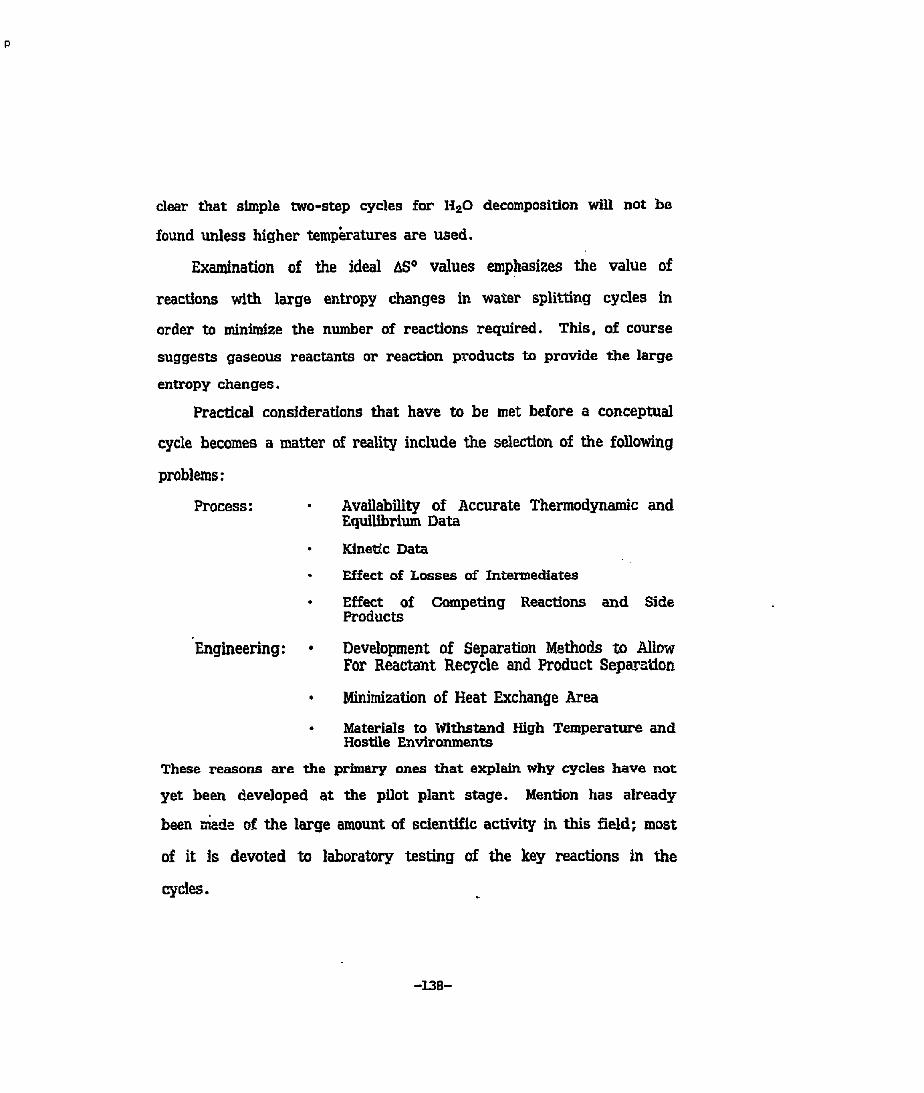
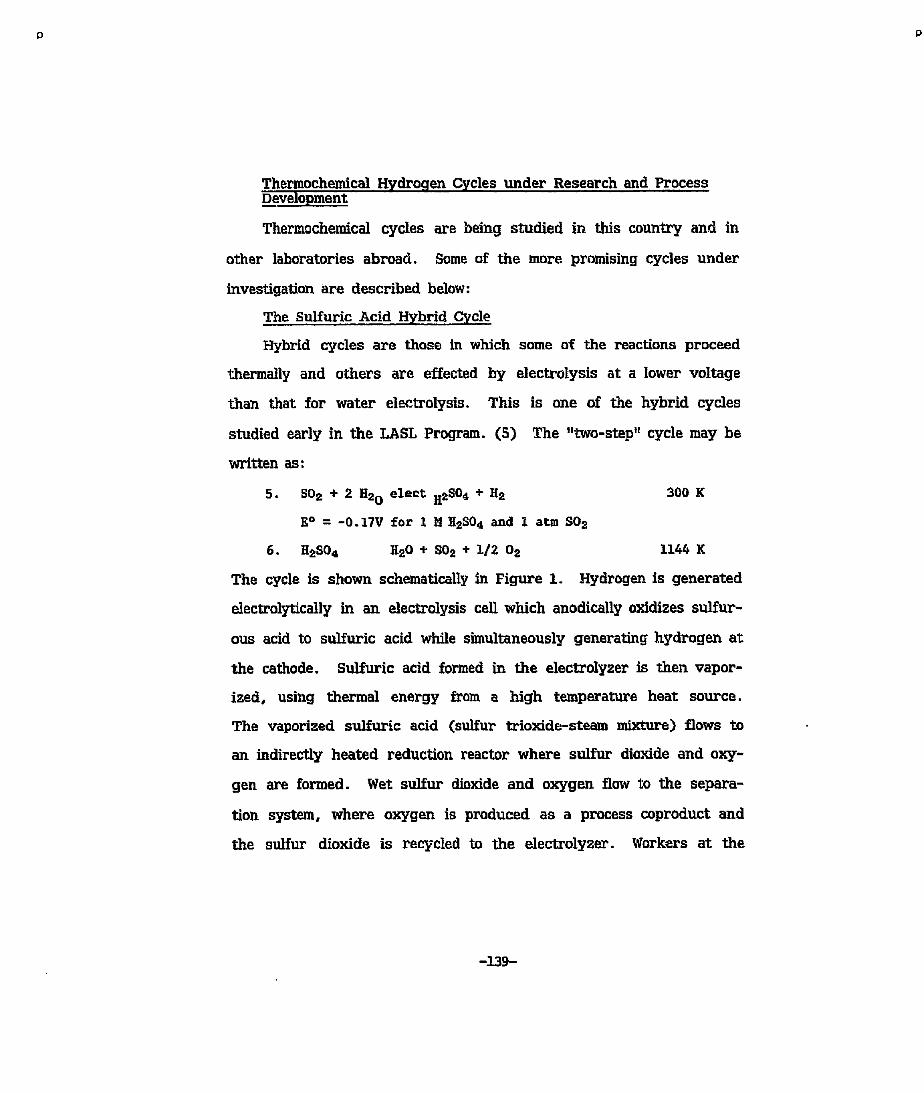


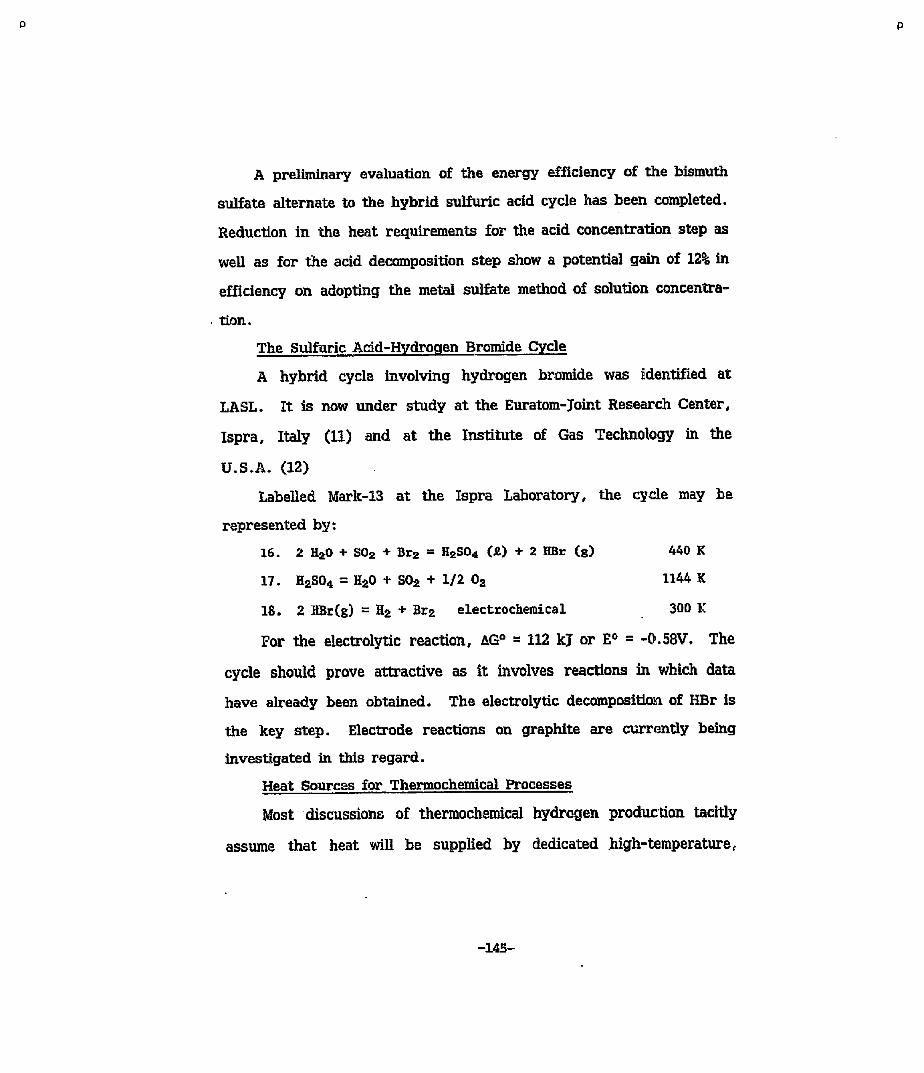


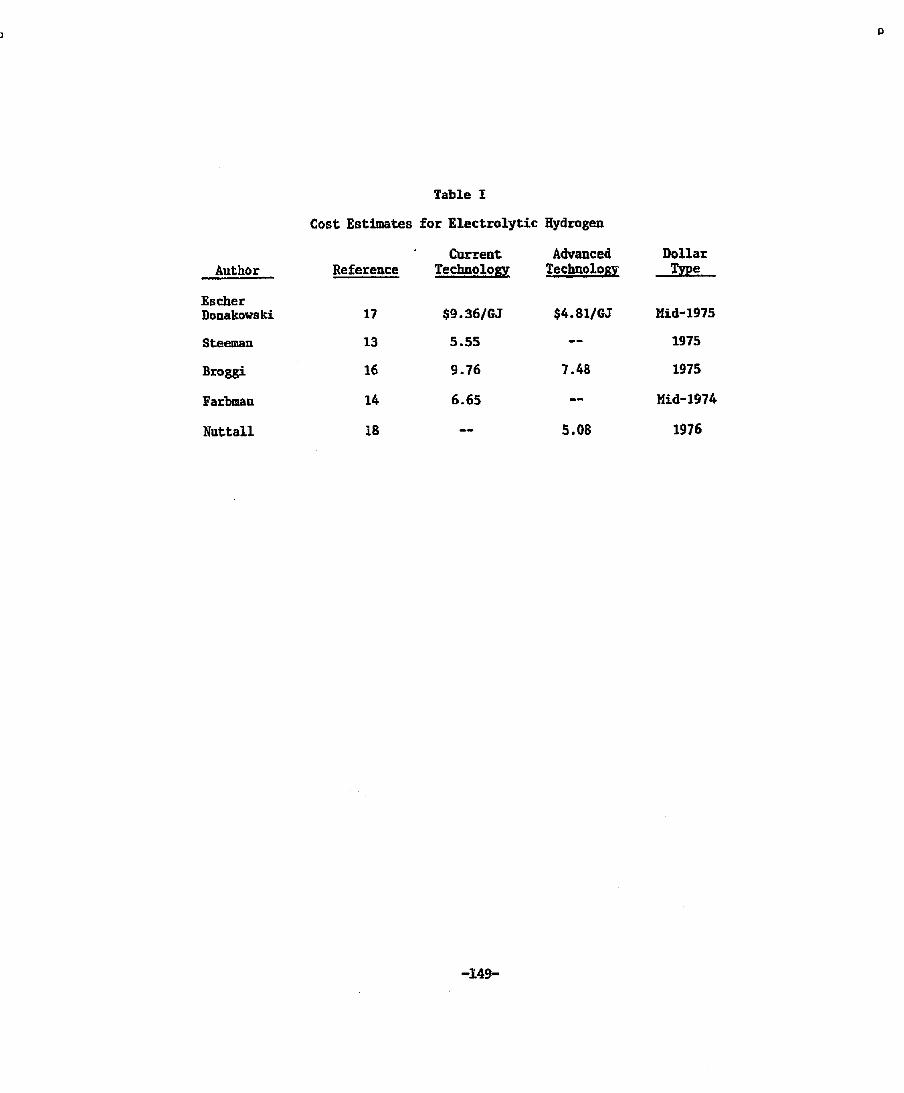
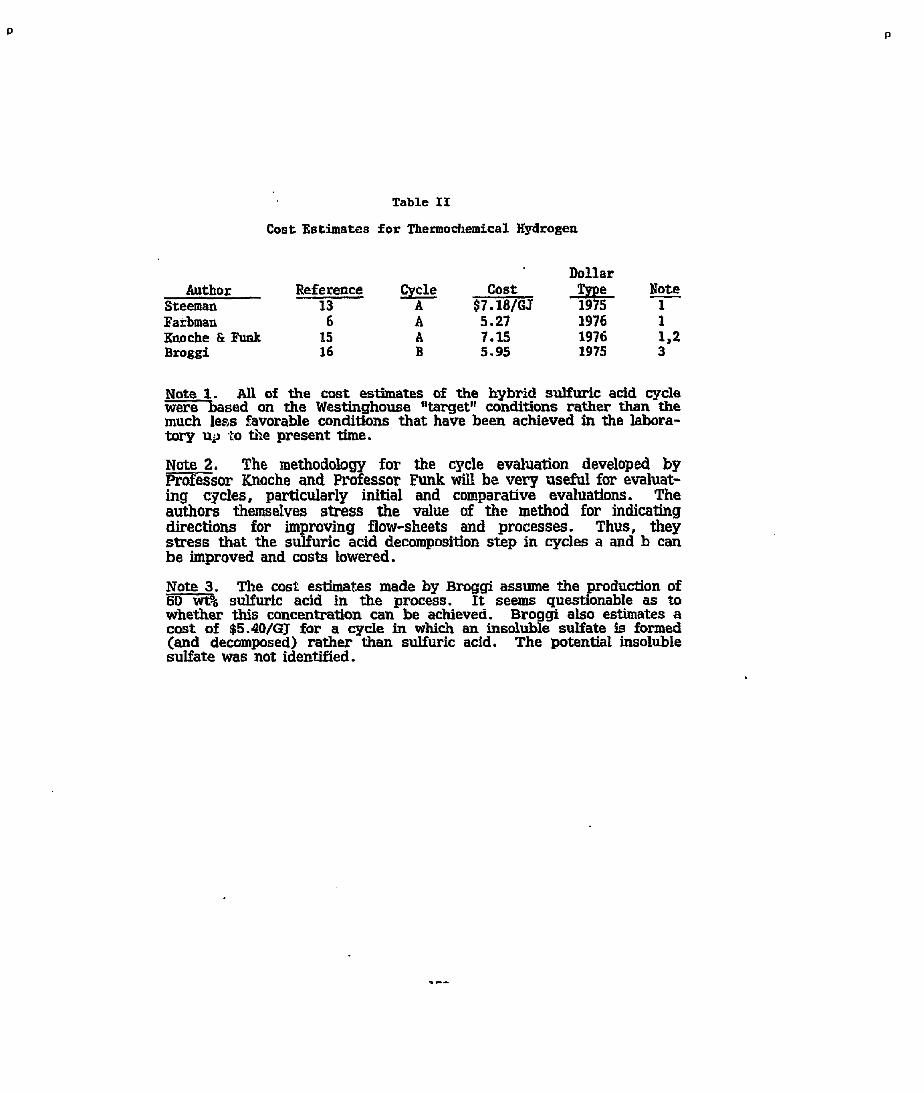

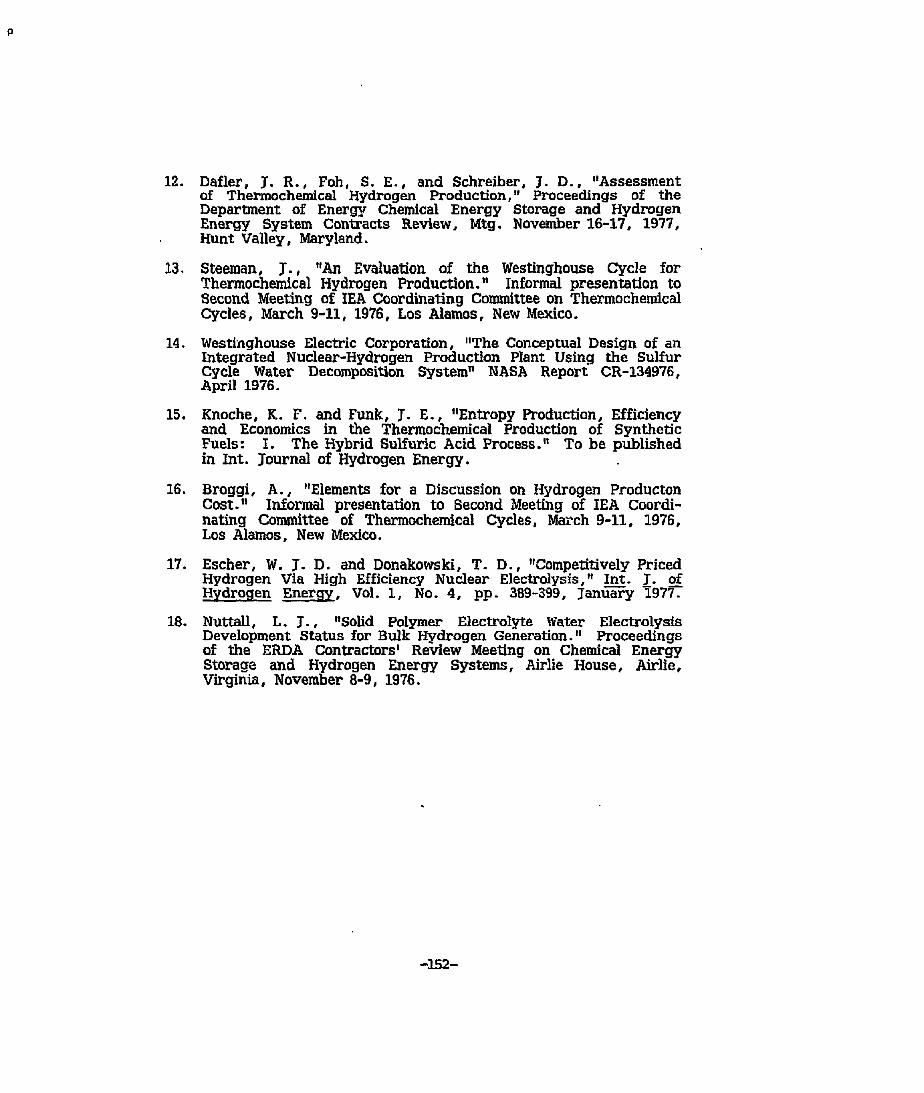

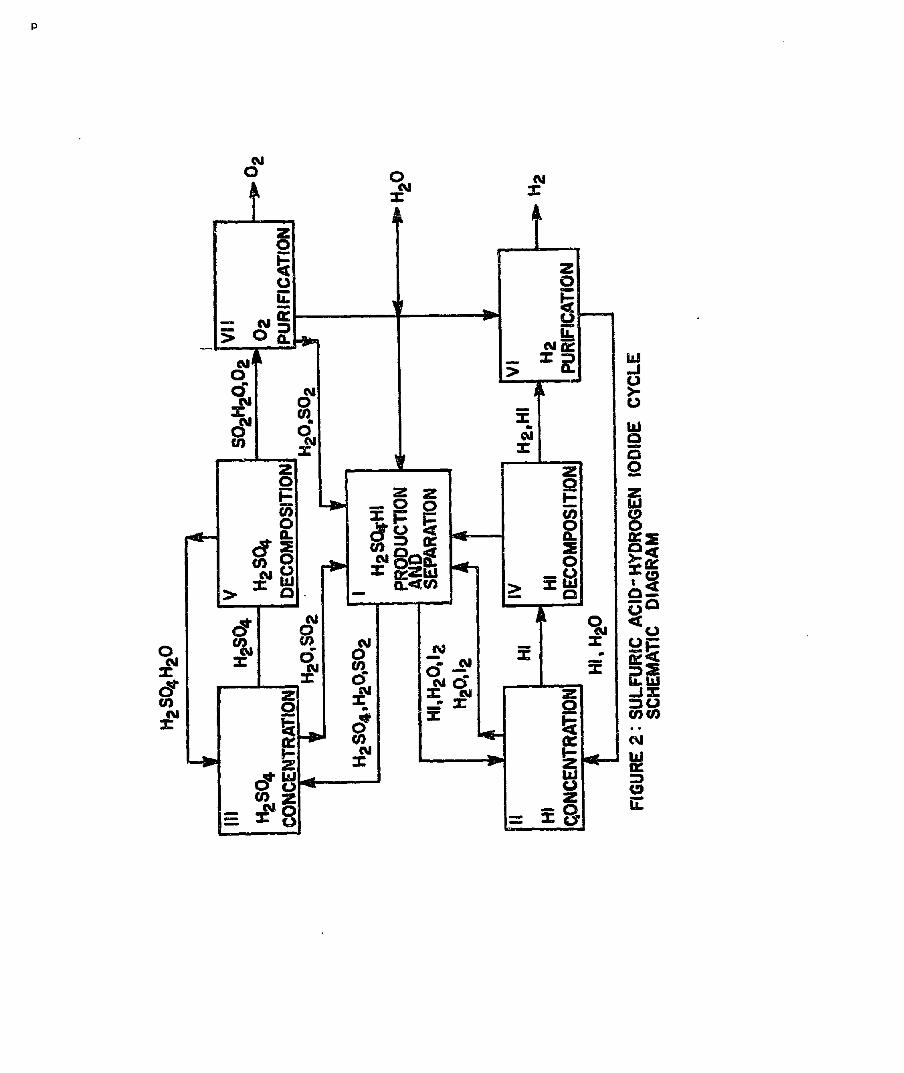


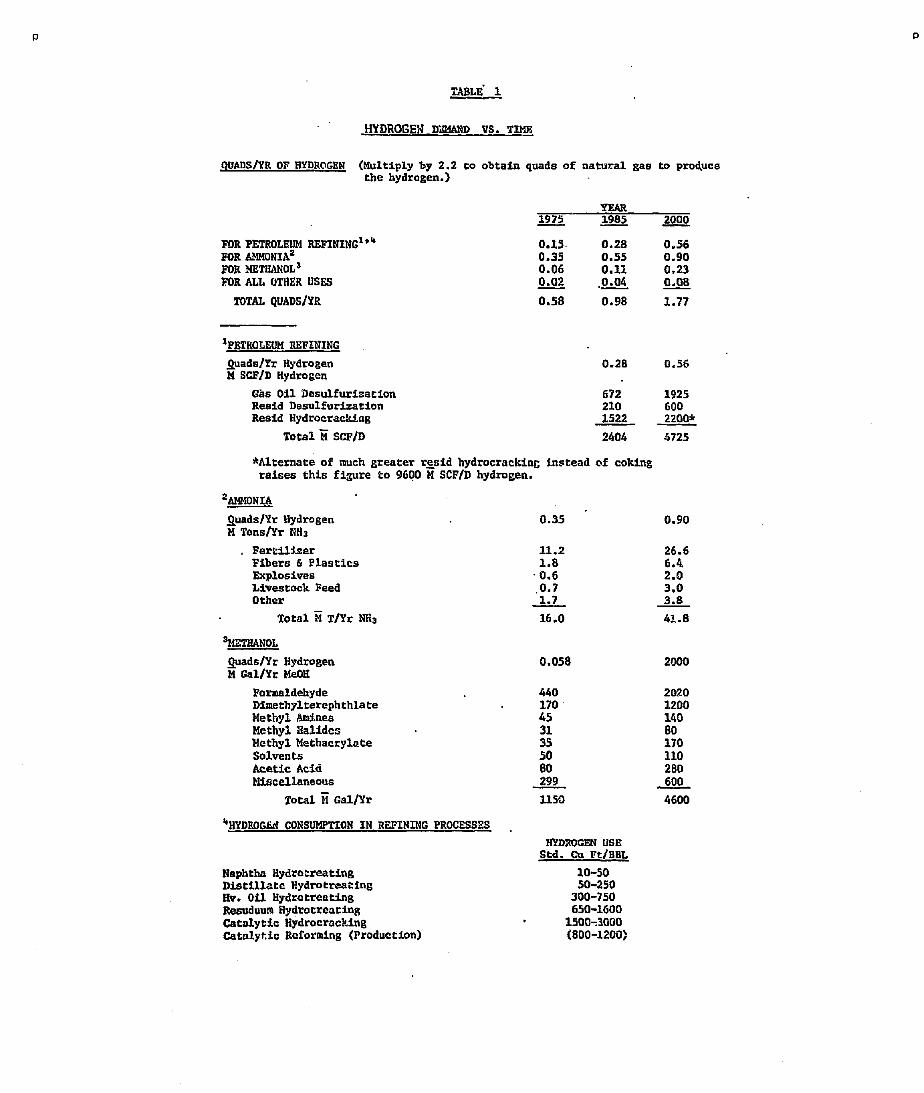

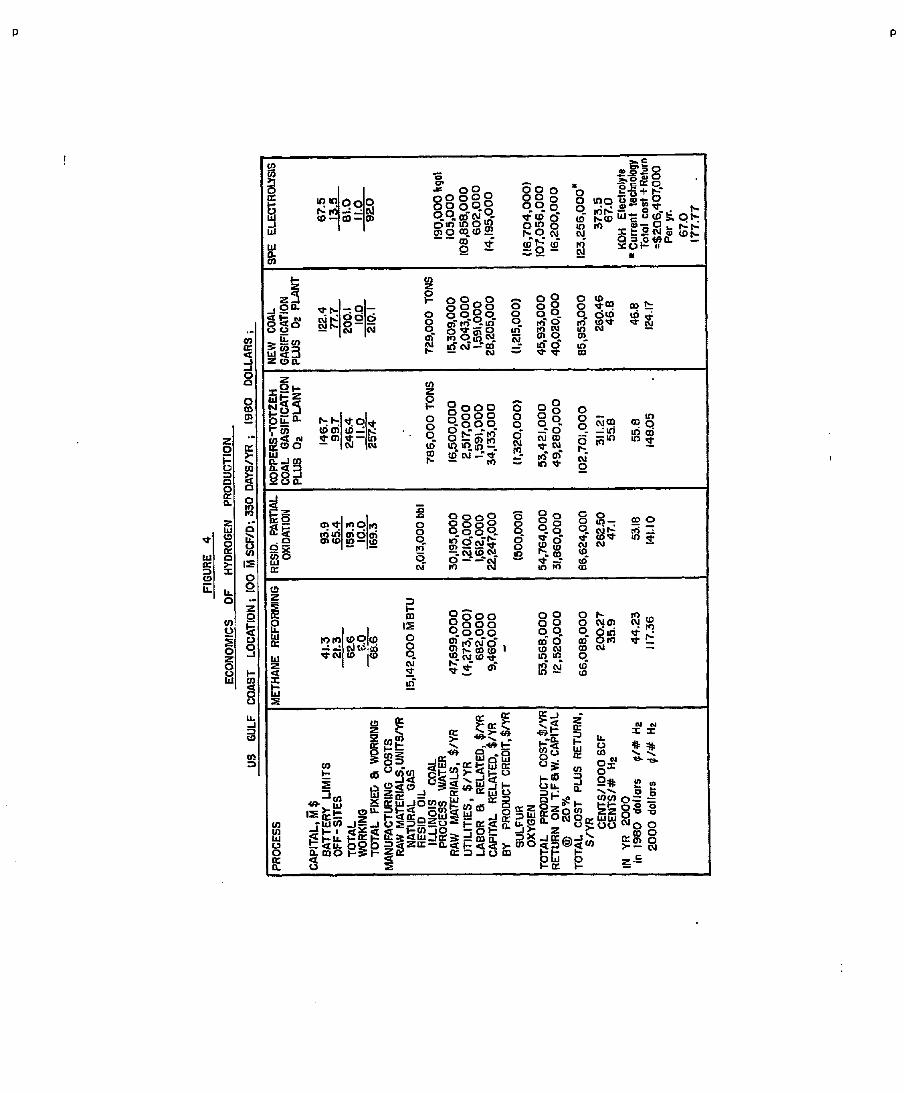


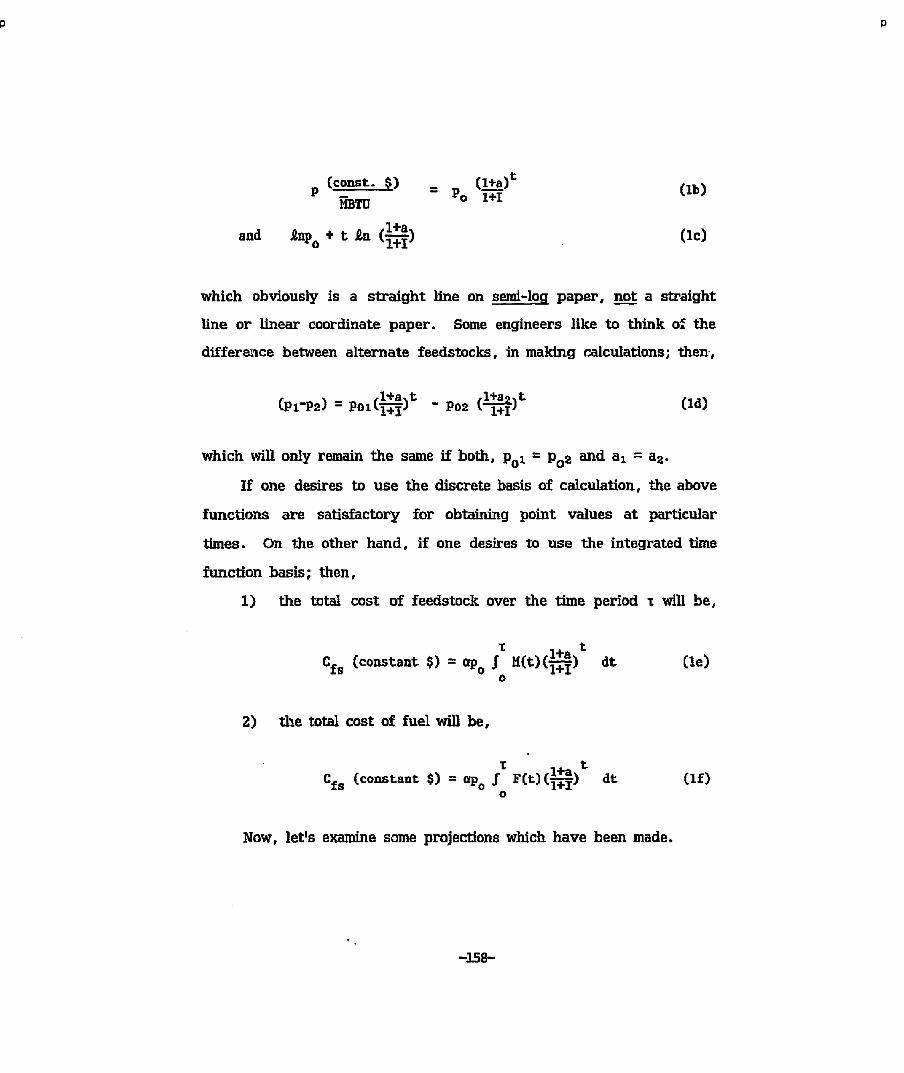


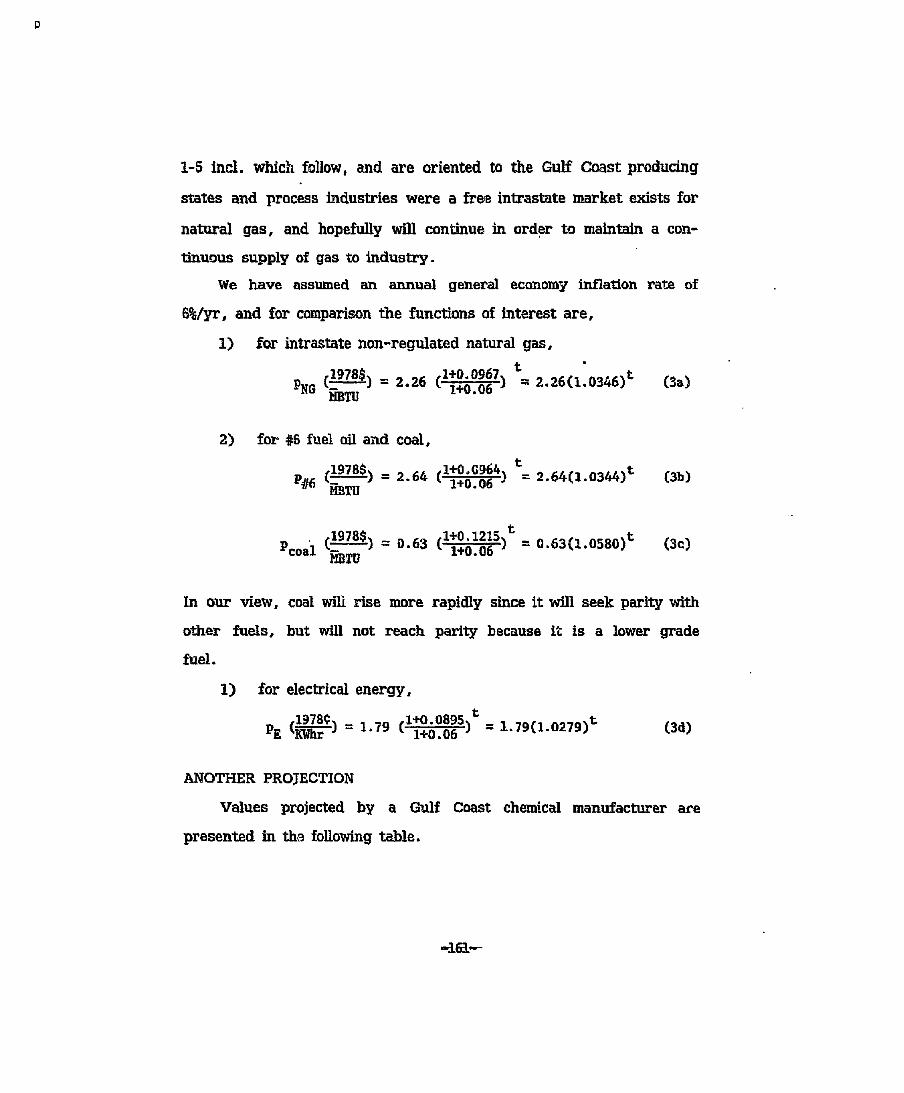


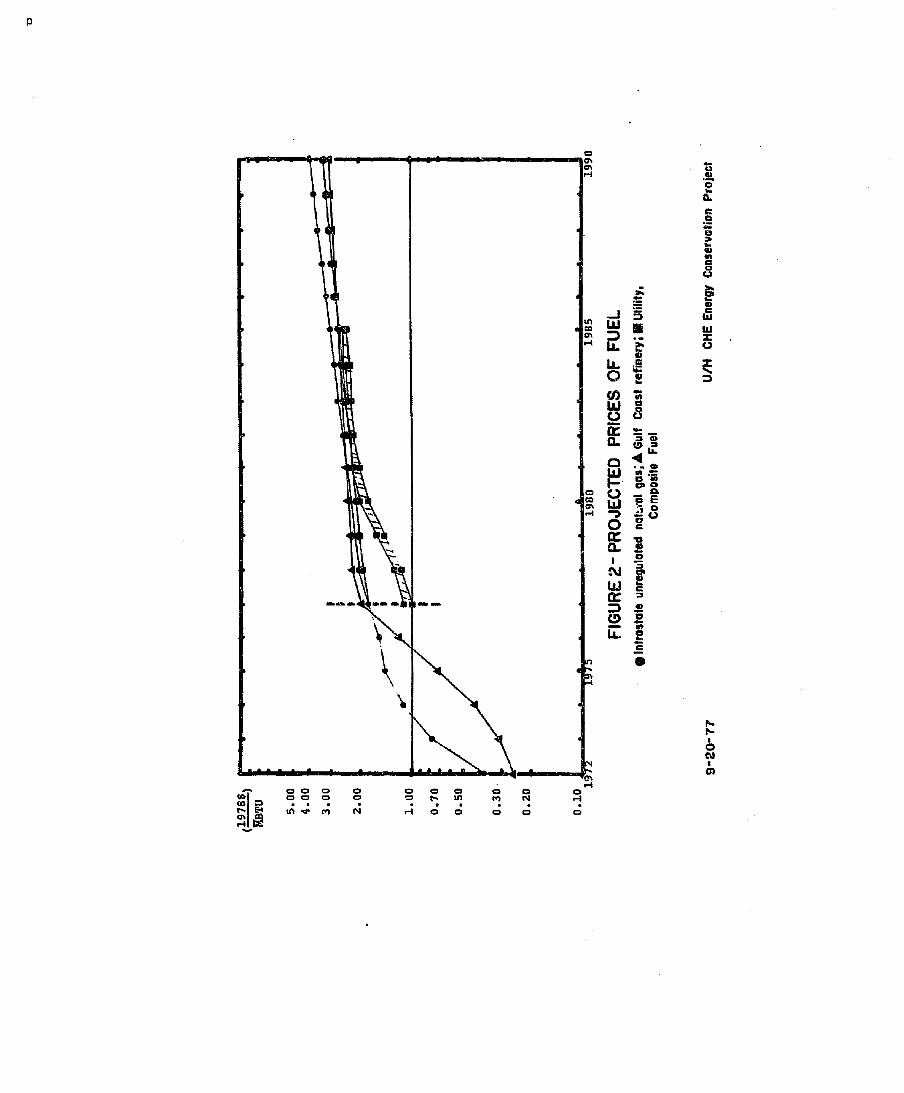

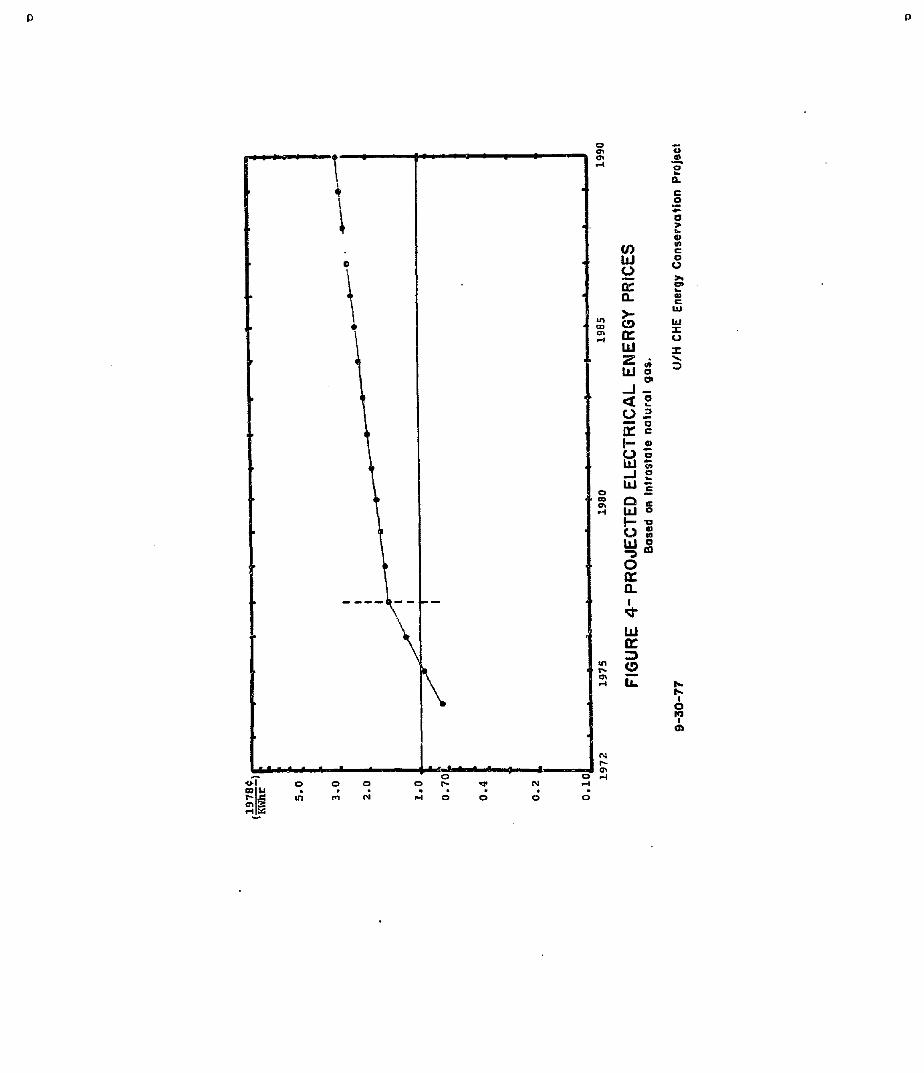
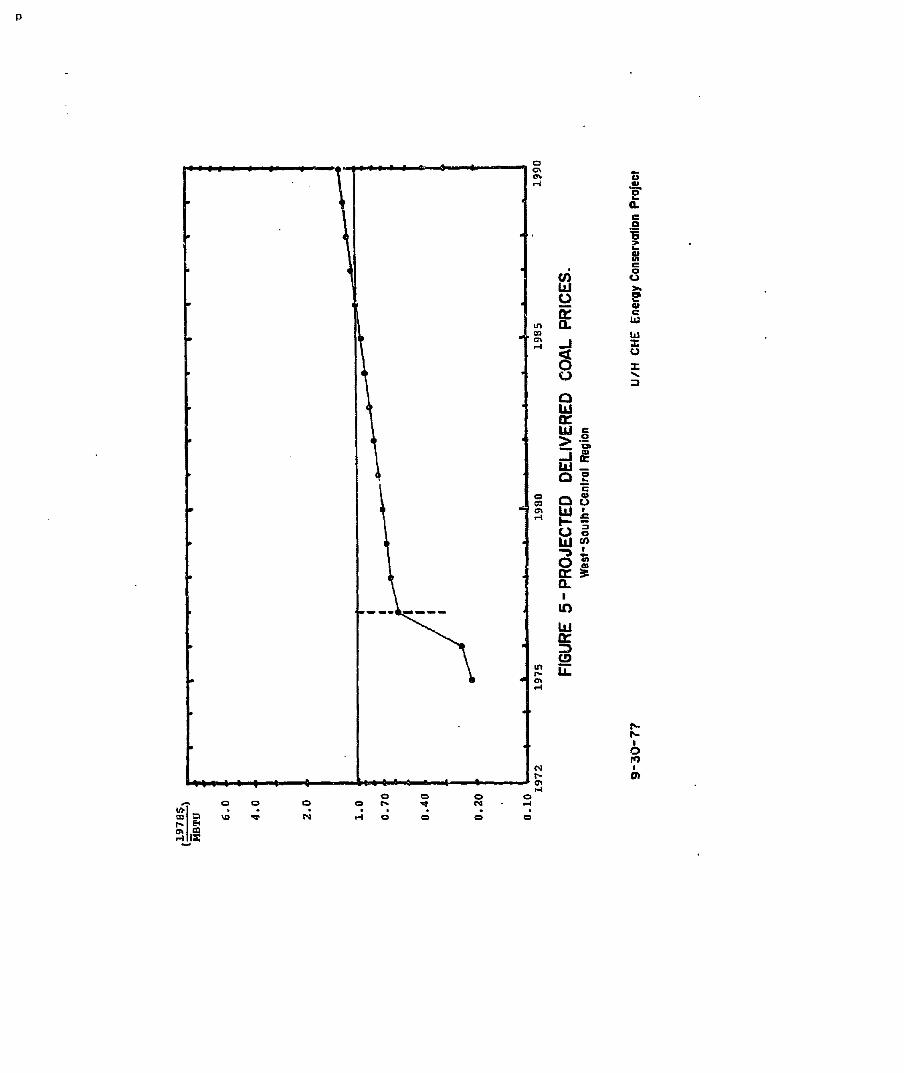


![COIV~POS]TiON AN~[3 B]IDD~GRA!~A!B]]-I I'F'Ir OF: …fischer-tropsch.org/DOE/_conf_proc/MISC/Conf-600-7-78-063/epa-600_7-78-063-29.pdfCOIV~POS]TiON AN~[3 B]IDD~GRA!~A!B]]-I I'F'Ir"](https://static.documents.pub/doc/80x56/5e580be44a75d55b4c563543/coivpostion-an3-biddgraab-i-ifir-of-fischer-coivpostion-an3-biddgraab-i.jpg)


![INTRODUCTION [1] [2] [3] [4]fischer-tropsch.org/primary_documents/presentations/AIChE 2003 Spring... · formed by chain branching (7). Many catalysis scientists therefore recognize](https://static.documents.pub/doc/80x56/5e1f93806e7ed67ff620f811/introduction-1-2-3-4fischer-2003-spring-formed-by-chain-branching.jpg)