185
Fishandcrayfishcommunitiesof theBlackwoodRiver:migrations, ecology,andinfluenceofsurface andgroundwater Prepared for Prepared by

Fish and crayfish communities of the Blackwood River: migrations, ecology, and influence of surface and groundwater
Prepared for
Prepared by

2
Fish and crayfish communities of the Blackwood River: migrations, ecology, and influence of surface and groundwater
Prepared for
South West Catchments Council & Department of Water December, 2006
Prepared by
Section 1 Migration patterns of the fish and crayfish fauna of the Blackwood River SJ Beatty, FJ McAleer & DL Morgan Centre for Fish & Fisheries Research Murdoch University South St Murdoch Western Australia Email: [email protected]
Section 2 Crayfish burrowing activity in the region of the Yarragadee Discharge Zone, Blackwood River A Koenders & PHJ Horwitz Centre for Ecosystem Management Edith Cowan University 100 Joondalup Drive, Joondalup Western Australia Acknowledgements
The authors would like to thank the South West Catchments Council and the Department of Water for funding this study. We would particularly like to thank Rob Donohue, Natasha Hyde and Adrian Goodreid for their significant contributions throughout the project. Many thanks to Ash Ramsey, Richard Pickett, and Peter Muirden from the Department of Water for providing discharge and water quality data. Thanks also to Joanna Hugues‐Dit‐Ciles from SWCC. We would also like to thank the landholders that allowed us access to their properties, including Shad Nixon and Robin Mellema, and to Simon Visser, Mark Allen, Trine Hansen, Josh Johnston, Drew Rowland, Damon Brearley and DoW staff for help in the field. Thanks particularly to David John for providing accommodation and technical support throughout the project. Most photographs by the authors except Western Hardyhead and Freshwater Cobbler by Mark Allen. Frontispiece: Balston’s Pygmy Perch, Photo D. Morgan

3
Summary
Section 1 – Migration patterns of the fish and crayfish fauna of the Blackwood River
South‐western Australia has a highly endemic freshwater aquatic fauna, with 80% of the fishes and 100% of the crayfishes found nowhere else. Each of the endemic fishes is found within the Blackwood River catchment, with two being restricted to the floodplains of the Scott River; a major tributary of the Blackwood. Salinisation of the catchment has compromised the natural ranges of many of the fishes, with many of the non‐halotolerant species now restricted to forested tributaries within the lower catchment and in the section of the main channel where salinity is reduced as a consequence of discharge from the Yarragadee and Leederville aquifers. Prior to this study, only snap‐shot fish surveys around the major regions of Leederville and Yarragadee groundwater discharge into the Blackwood River existed allowing only a limited understanding of the ecology of the fish communities and their relationship with key environmental variables; particularly surface and groundwater hydrology. This knowledge is important in the light of potential future increased groundwater extraction and climate change. To further the understanding of the fish communities of this region, Section 1 of this study examined the temporal migration patterns of fish and freshwater crayfish in this zone of the Blackwood catchment. Specifically, upstream and downstream migration patterns of fishes in the Blackwood River and its tributaries were examined and related to a number of key environmental variables, such as surface and groundwater discharge. Predictions of the effects on fauna by projected changes in environmental variables, for example, due to aquifer draw‐down (e.g. reduced discharge and increased salinity) were examined. In order to determine fish migrations within and outside of the major area of groundwater discharge, four main channel sites (one receiving the entire Yarragadee discharge, one at the upstream point of the discharge, and two upstream of the discharge) were monitored. Furthermore, sites within four tributaries were also monitored for patterns of fish migration and community structure in relation to environmental variables; namely surface water reliant seasonal systems, i.e. Rosa Brook, Layman Brook and McAtee Brook, and a perennial groundwater fed system, i.e. Milyeannup Brook. Migration and population demographics were examined on eight occasions between October 2005 and September 2006. A variety of sampling methods were utilised including fyke netting, seine netting, trapping and electrofishing.
4
Substantial differences in fish densities and migration patterns existed between and within the main channel and major tributaries. The main channel was dominated by estuarine and salt‐tolerant species at all sites. However, main channel sites receiving most groundwater discharge (i.e. receiving both Leederville and Yarragadee Aquifer discharge) had much greater abundances of non‐salt tolerant freshwater native species than those sites upstream of the Yarragadee discharge. This suggests that although the fish community in the main channel may have changed to primarily salt tolerant species in response to increasing salt levels, fresh groundwater input in summer (when many tributaries cease to flow or dry completely), may be enabling those species to continue to survive in the main channel. The study also recorded a considerable upstream migration of the Freshwater Cobbler at all main channel sites in spring and summer; a period that coincided with their spawning. It was found that upstream Freshwater Cobbler migrations in main channel sites were highly correlated to summer discharge. This species is considered to be ideal for long‐term monitoring of river connectivity. The Marron population was assessed in the main channel and a slightly higher relative abundance (although not statistically significant) was recorded within sites receiving most groundwater discharge (i.e. both Leederville and Yarragadee Aquifer discharge) than those upstream. Marron catches have recently been found to be positively correlated with river flow and this has implications for the recreational fishery within the Blackwood River under reduced flow scenarios. Considerable differences in the timing and strengths of fish migrations were recorded between tributaries for the Western Minnow, Nightfish and Western Pygmy Perch, that utilised all four tributaries to varying degrees. It was found that the tributaries act as the major spawning habitats for these species and the section of the main channel that receives the most groundwater discharge acts as a refuge to the summer contraction or drying of most of these systems. Significant differences in strength of migrations between tributaries for some native freshwater species were explained by environmental variables during the peak flow period. For example, downstream and upstream migration strengths of the Western Minnow in the four tributaries were highly correlated with stream discharge whereas upstream migrations of Western Pygmy Perch and Nightfish were correlated with dissolved oxygen levels and earlier breeding and recruitment of Western Minnows occurs in the perennial Milyeannup Brook.

5
Milyeannup Brook is one of only two (along with Poison gully) perennially flowing tributaries in this region of the Blackwood and are directly reliant on Yarragadee Aquifer discharge. It was apparent that this system is of critical conservation importance as it houses the only population of the Balston’s Pygmy Perch in the Blackwood River catchment (listed as Vulnerable under the EPBC Act 1999). This study found a clear upstream and downstream spawning migration of Balston’s Pygmy Perch in this system and found only limited upstream movement from the main channel suggesting it is a crucial refuge to Balston’s Pygmy Perch in the Blackwood River catchment. By mapping fish distributions along its length in summer, the study also found that Balston’s Pygmy Perch only utilised the lower ~1300m of the ~2500m base flow stream length suggesting that only ~52% contained suitable habitat (e.g. adequate depth) for occupation. The minimum population of this species in this system was found to be ~380 ±42 fish based on their density. This low population minimum makes this species particularly vulnerable to potential habitat decline; particularly if main channel summer water quality decline exceeds this species environmental tolerance. A number of key knowledge gaps pertaining to the ecology of the fish communities are identified. Major knowledge gaps include determining the degree of interannual variation in groundwater reliance of these communities, salinity tolerances of these species, and identifying critical riffle zones in the Blackwood River that are important in maintaining river connectivity.
6
Section 2 – Crayfish burrowing activity in the region of the Yarragadee Discharge Zone, Blackwood River
A study of the burrowing activity of freshwater crayfish in the region of the Yarragadee Discharge Zone was conducted over the period of one year, starting September 2005. The aims of the study were to determine seasonal effects on burrowing activity for freshwater crayfish species in response to groundwater and surface water changes, and to relate these to emergent crayfish. In addition, a pilot study of the chemical characteristics of surface and groundwater in the area was undertaken to determine if discharge from the Yarragadee was detectable and if it was a migratory cue for freshwater crayfish. Transects were set up in creeks receiving input from the Yarragadee (Layman Brook, Poison Gully and Milyeannup Brook), as well as in control sites upstream (McAtee Brook) and downstream (Rosa Brook). Burrowing density and activity were monitored from October 2005 to September 2006, as well as basic surface water and groundwater physicochemistry. In addition, observations were made of emergent crayfish during the day and at night. The study area appears to be typical burrowing habitat for south‐western Australian freshwater crayfish. Four species of freshwater crayfish were been identified: Marron (Cherax cainii), Gilgie (C. quinquecarinatus), Restricted Gilgie (C. crassimanus) and Koonac (C. preissii). Burrows and burrowing activity were highly seasonal and provide baseline data on freshwater crayfish responses to declines in surface and groundwater. The very dry autumn and early winter experienced in 2006 resulted in a slower than usual recovery of water levels (i.e. water levels experienced in September 2005 were much higher than those found in the corresponding month in 2006). While some methodological problems were encountered (i.e. species specific burrowing behaviour could not be discerned), some generalisations are possible, including:
- burrowing activity increases in response to receding water levels/tables;
- the depth to which crayfish burrow can be gauged, at least in, part by the nature of the soil extruded from the burrow;
- ephemeral tributaries may be important for breeding (i.e. for Gilgies); and Gilgies may have an upstream (out of main channel) migration for breeding and releasing juveniles;
- smaller Marron individuals use permanent flows out of the main Blackwood River channel;

7
- Koonacs are more likely to occur in habitats with a deeper reach to the water table;
- the Restricted Gilgie may have resident populations in the two permanent streams receiving Yarragadee discharge throughout the year.
Future monitoring of transects or other sites can test the following hypotheses: A. If groundwater decline in Milyeannup Brook and Poison Gully is extending beyond historical ranges then the burrowing activity of freshwater crayfish will produce soil from a lower stratigraphic soil layer than previously observed. B. If groundwater decline is extending beyond historical ranges, then periods of burrowing activity will occur earlier in spring, and burrows will open later in the autumn or winter. Water samples were also collected in November/December 2005 before surface waters had receded, where the influence of groundwater discharge was relatively minimal, and in March 2006 when groundwater discharge was a more significant contributor to surface waters. The elemental suites of samples from transect surface waters, and other selected sites were determined. The pilot study of elemental water chemistry demonstrated the potential for characterising the Yarragadee discharge. In addition, high S:(Ca+Mg) ratios in Poison Gully and Milyeannup Brook indicate poor buffering and, if confirmed, may show potential for acidification should sediments become exposed due to drought and/or groundwater decline.

8
Contents
Summary............................................................................................................... 3
Contents................................................................................................................ 8
Section 1 – Migration patterns of fish and crayfish fauna of the Blackwood River ………………………..…………………………. 10
Background............................................................................................................. 11 Fish and freshwater crayfishes of the Blackwood River…………………………………………...… 11 Importance of groundwater to aquatic fauna……………………………………………………….. 12 Groundwater contributions to Blackwood River flow…..………………………………………….. 13 Milyeannup Brook and Poison Gully………...…………………………………………………….. 14 Aims of the study…………………………………………………………..………………………. 14
Methodology........................................................................................................... 15 Study site selection………………………………………………………………………….…….. 15 Water quality monitoring………………………………………………………………….…….. 17 Fish and crayfish monitoring protocols……...……………………………………………….... 20
Results and discussion......................................................................................... 25 Water quality in the main channel and tributaries.…………………………………….…….. 25 Species capture summary………………….……….……………………………………….…….. 34 Freshwater Cobbler………………………………………………………………..………….…….. 36 Western Minnow……………………………..……………………………………………….…….. 45 Mud Minnow………….……………………..……………………………………………….…….. 56 Balston’s Pygmy Perch……………………….……………………………………………….…….. 59 Western Pygmy Perch………………………..……………………………………………….…….. 63 Nightfish………….…………………………..……………………………………………….…….. 71 South‐western Goby…………………………..……………………………………………….…….. 79 Swan River Goby……………………………..……………………………………………….…….. 84 Western Hardyhead…………………………..……………………………………………….…….. 88 Pouched Lamprey……………………………..……………………………………………….…….. 94 Eastern Mosquitofish………………………..……………………………………………….…….. 97 Goldfish…………………………..…………..……………………………………………….…….. 100 Rainbow Trout……………………………..………………………………………………….…….. 101 Marron………………………………………..……………………………………………….…….. 103 Gilgie………………..………………………..……………………………………………….…….. 111 Restricted Gilgie………………………..…………………………….……………………….…….. 114 Koonac…………………………..…………..………………………………….…………….…….. 116 Milyeannup Brook – Case study………..………………………………………………….…….. 118
Conclusions and recommendations................................................................... 127
References............................................................................................................... 129
Appendices............................................................................................................. 132

9
Section 2 – Crayfish burrowing activity in the region of Yarragadee Discharge Zone, Blackwood River………..……………. 140
Aims and objectives........................................................................................ 141
Crayfish burrowing........................................................................................... 142 Methods.................................................................................................................... 142 Transect establishment and design…………..………………………………………………….. 142 Water characteristics………………………………………….………………………………...… 142 Crayfish burrow monitoring………….………………………………………………………….. 144 Results.......................................................................................................................146 Transect data……………….………….………………………………………………………….. 146 Blackwood River – St Patrick’s Elbow.……..……………………………………………………….. 146 Layman Brook – Layman Road………...…...……………………………………………………….. 147 Layman Brook tributary – Layman Road………..………………………………………………….. 148 Layman Brook – Crouch Rd…………...…...……………………………………………………….. 149 Milyeannup Brook –Helyar Rd………...…...……………………………………………………….. 151 Milyeannup Brook –Milyeannup Rd……………………………………………………………….. 152 McAtee Brook – Crouch Rd…………....…...……………………………………………………….. 153 McAtee Brook tributary – Crouch Rd……………………………………………………………….. 154 Poison Gully – Blackwood Rd……………………………………………………………………….. 156 Rosa Brook – Crouch Rd…………………………………………………………………………….. 157 Rosa Brook tributary – Crouch Rd………………………………………………………….……….. 159 Rosa Brook headwater – Mowen Rd……………..………………………………………………….. 160 Rosa Brook gully – Mowen Rd……………..……………………………………………………….. 161 Transect comparisons…….…..……….………………………………………………………….. 162 Burrowing activity and migratory behaviour of species……………….…………………….. 164 Discussion and recommendations……………………………..………………………... 166
Water chemistry................................................................................................. 168 Introduction…..……………….……………………..…………………..………………..…..… 168 Methods……..……………………………………………..……………...……………...........… 168 Results……..……………………….…………….…….………………...………….………..….. 169 Discussion and recommendations……..………….……………………..…………….… 171 Appendices……..………….……………………..…………….………………………………...174

10
Section 1
Migration patterns of the fish and crayfish fauna of the Blackwood River
SJ Beatty, FJ McAleer & DL Morgan
11
BACKGROUND
Fish and freshwater crayfishes of the Blackwood River
The fish fauna of the Blackwood River catchment was documented in Morgan et al. (1998, 2003) and there are additional records of the fishes in the Western Australian Museum collections and in the unpublished literature. These include a baseline study on fishes in the Yarragadee Aquifer Discharge Zone (hereafter named YADZ) by Morgan & Beatty (2005) and by CENRM (2005) and a study on Rosa Brook (Morgan et al. 2004). Distributional information on freshwater crayfish in the region is detailed in Morrissy (1978), Austin & Knott (1996), Horwitz & Adams (2000), Nickoll & Horwitz (2000), Morgan et al. (2004a) and Morgan & Beatty (2005). Of note is the fact that all eight species of freshwater teleost that are endemic to south‐western Western Australia are found within the Blackwood River catchment (Morgan et al. 1998, 2003). Salinisation throughout both most of the upper catchment and the main channel has led to a decline in the range of many of the salt‐intolerant fishes and much of the upper catchment and main channel is dominated by salt‐tolerant species (Morgan et al. 2003). Thus, salinisation of the catchment has seen many of the species that are not tolerant to higher salinity levels become restricted to the forested sections of the river that receive discharge from sources such as the Leederville Aquifer and Yarragadee Aquifer (Morgan et al. 2003, Morgan & Beatty 2005). There is little historical information on the fish and freshwater crayfish fauna of the receiving environment surrounding the Yarragadee discharge area, however, CENRM (2005) recorded a maximum of four native and one introduced fish species from 19 main channel sites and a maximum of three native fish species from 13 tributary sites from sampling during July 2004. In contrast, Morgan & Beatty (2005) found nine native and two introduced fish species from six main channel sites sampled and nine native and two introduced fish species from 21 tributary sites in this area of the catchment. Differences in the diversity expressed in the above studies is likely to be a consequence in the former study conducting sampling during winter when water levels were higher and thus species densities reduced, while the latter study (i.e. Morgan & Beatty 2005) sampled during autumn when water levels were at a minima and thus densities of fishes were relatively high. Morgan & Beatty (2005) found a significant difference between the fish fauna associated with main channel sites when compared to tributaries and there were substantial differences in the main channel fauna upstream and downstream of the YADZ. For example, sites downstream of the YADZ had a much higher diversity of fish and freshwater crayfish than main channel sites upstream of the discharge area. Thus, within the main channel sites that
12
receive summer input from the Yarragadee, 11 species of fish and four species crayfish were captured compared to four species of fish and two species of crayfish upstream of the discharge zone. Furthermore, the four species of fish in the main channel in the upper riverine part of the study area were all halotolerant, whereas most of the additional species present in the sites in the lower section of the river are thought to tolerate only relatively low salinities. A number of species found in the main channel are generally absent from the tributary sites sampled and vice versa. For example, Freshwater Cobbler (Tandanus bostocki), Western Hardyhead (Leptatherina wallacei), Swan River Goby (Pseudogobius olorum) and South‐western Goby (Afurcogobius suppositus) were all predominantly captured in the main channel, while Mud Minnows (Galaxiella munda) and Balston’s Pygmy Perch (Nannatherina balstoni) were restricted to tributaries and, in the case of the latter species, to essentially a single tributary. Of the fish species known from the Blackwood River catchment: four are listed on the Australian Society for Fish Biology’s List of Threatened Fishes, while one, Balston’s Pygmy Perch has recently (2006) been listed as Vulnerable under the EPBC Act 1999, and, along with the Mud Minnow is also listed as Schedule 1 by CALM under the Wildlife Conservation Act 1950. These endemic fishes have undergone massive reductions in their overall range over the last 100 years (Morgan et al. 1998), largely as a result of modification of habitats, with salinisation of the major catchments a key threatening process (see Morgan et al. 2003). The 11 species of freshwater crayfishes of Western Australia are all endemic to the south‐west region. Six of these belong to the genus Cherax, and although this is the most widely distributed freshwater crayfish genus in Australia, the native Western Australian Cherax species have been shown to be monophyletic probably due to the long period of separation of south‐western Australia to the rest of the continent (Crandall et al. 1999). The remaining five native species of freshwater crayfish in Western Australia belong to the endemic genus Engaewa, with Horwitz & Adams (2000) proposing that Engaewa reducta, E. pseudoreducta and E. walpolea fulfil the IUCN criteria to be listed as Endangered, Critically Endangered and Vulnerable, respectively. Importance of groundwater to aquatic fauna
Groundwater has been estimated to account for between 30 and 70% of the world’s total freshwater, with surface waters such as rivers containing <0.01% (Freeze & Cherry 1979, Petts et al. 1999). Many rivers are classified as groundwater‐dependent ecosystems, and are further characterised by the

13
degree of dependency on groundwater (Boulton & Hancock 2006). Groundwater‐dependent ecosystems are complex, often support a relatively diverse fauna and may provide refugia for relictual species, however they vary in their degree of dependency on groundwater to maintain their composition and function (Hattons & Evans 1998, Power et al. 1999, Murray et al. 2003, Humphreys 2006). Localised areas of groundwater water discharge into streams creates a unique environment known as the hyporheic zone. Characteristics of this region are important in maintaining populations of aquatic species, including fish. For example, the hyporheic zone often provides a thermal refuge for aquatic species by buffering against extreme upper and lower lethal temperatures (Power et al. 1999, Hayashi & Rosenberry 2002). The hyporheic zone influences water quality by maintaining flows independent of surface runoff, supplying dissolved oxygen, maintaining stream productivity, and providing habitat and maintaining migratory routes. There are a number of specific examples that document the importance of groundwater to particular species in particular systems, however, Sear et al. (1999) considered that the nature of the importance of groundwater is difficult to determine at a regional scale, but should be assessed at a local or catchment level. A major aim of the study was to determine the relationship between fish and freshwater crayfish communities and environmental variables within the Blackwood River; including degree of groundwater dependency. Groundwater contributions to Blackwood River flow
The Yarragadee Aquifer groundwater currently discharges into the Blackwood River in the reach just downstream of Layman’s Brook to just upstream of Milyeannup Brook (Figure 1). Although the Yarragadee groundwater discharge contributes only ~1% of the 940GLyr‐1 of the annual Blackwood River discharge during the dry months, groundwater from the Yarragadee and Leederville Aquifers contribute to between 30‐100% of the discharge depending on the amount of summer rainfall (Strategen 2006). This groundwater discharge effectively dilutes the salinity of the river during dry months. However, when the winter peak discharge moves through the main channel, the elevated salinities are experienced as the water flushes down salt from the upper catchment (see Results). At this time, the freshwater tributaries of the lower, forested Blackwood River are flowing and thus act as refuges for freshwater native fish species (Morgan et al. 2003, Morgan & Beatty 2005). However, in summer, many of these tributaries (aside from Milyeannup Brook and Poison Gully which are perennial due to Yarragadee Aquifer discharge) cease to flow or either dry completely or become pools, resulting in

14
the freshwater native fish moving into the main channel in the Yarragadee Aquifer discharge zone. A previous study by Morgan & Beatty (2005) revealed that most of these species were able to exist in this diluted discharge zone in the main channel during summer yet were not found in significant numbers upstream of that zone. Milyeannup Brook and Poison Gully
As mentioned, Milyeannup Brook and Poison Gully are the only permanently flowing streams in this region of the Blackwood River. Their base flows (dry period) are maintained by direct discharge from the Yarragadee Aquifer to a distance of ~2500 and 3500 m from their confluence with the main channel of the Blackwood River during 2006. Milyeannup Brook has a relatively distinct channel form whereas Poison Gully is more diffuse with a lower gradient creating almost a wetland appearance in some sections. Due to the reliance on groundwater for permanency, water table reduction in the lower sections of both Milyeannup Brook and Poison Gully would reduce base‐flow discharge and also stream length (Strategen 2006). Aims of the study: The overall aim of the study was to relate patterns of fish and crayfish migrations to prevailing environmental variables in the Blackwood River. Specific aims were to:
• Compare the population demographics and migrations of the fish and freshwater crayfish fauna within areas of the Blackwood River main channel that receive major groundwater discharge to those upstream sites that do not.
• Describe the population demographics and migrations of the fish and freshwater crayfish fauna associated within the tributaries of the Blackwood River within the Yarragadee Aquifer discharge zone (i.e. Milyeannup Brook, Poison Gully and Layman Brook) and compare these to adjacent tributaries that are not fed by this aquifer (i.e. Rosa Brook and McAtee Brook).
• Determine seasonal changes in key environmental variables within the above tributaries and in the Blackwood River.
• Identify relationships between migration patterns, population demographics and the key environmental variables.
• Gather a comprehensive seasonal baseline dataset of the patterns of fish and crayfish movements in the Blackwood River to allow ongoing monitoring of potential biotic changes that may result from predicted alterations to the current hydrological regimes.

15
METHODOLOGY Study site selection
Blackwood River main channel Site selection for determining the temporal changes in population demographics and migrations of the fish and crayfish fauna in the Blackwood River main channel was based on their differing proximities to the major zone of groundwater discharge. For example, the fish fauna found within two sites in the Blackwood River main channel that is subjected to the major discharge of ground water (from the Yarragadee Aquifer) was compared to two sites upstream of this discharge. The two sites within the main channel that receive groundwater input were immediately downstream of the mouth of Milyeannup Brook (34.0909oS 115.5661oE) and just upstream of the mouth Rosa Brook (34.1081oS, 115.4505oE). The two upstream sites include Jalbarragup Road crossing (34.0421oS, 115.6025oE) and Quigup (33.9736 oS, 115.7008 oE) (see Figure 1). Sampling was conducted in October, November and December 2005 and February, March, June, August and September 2006. See page 20 for the biological sampling regime. Blackwood River tributaries Milyeannup Brook and Poison Gully are directly maintained in dry months by groundwater discharge. Layman Brook receives groundwater discharge during winter and spring but not summer; when it ceases to flow. The temporal changes in the population demographics and migrations of the fish and crayfish fauna within these tributaries were compared with two adjacent tributaries that flow seasonally, i.e. Rosa Brook and McAtee Brook; within the Leederville Aquifer discharge zone.

16
Rosa Brook Layman Bk
Milyeannup PoolDenny Rd
Poison GullyMilyeannup Brook
Jalbarragup
McAtee Bk
Quigup
Main channel sites
Tributary fyke net sites
Seine/electrofishing tributary sites
Figure 1 Sampling sites in the main channel and tributaries of the Blackwood River.

17
Water quality monitoring
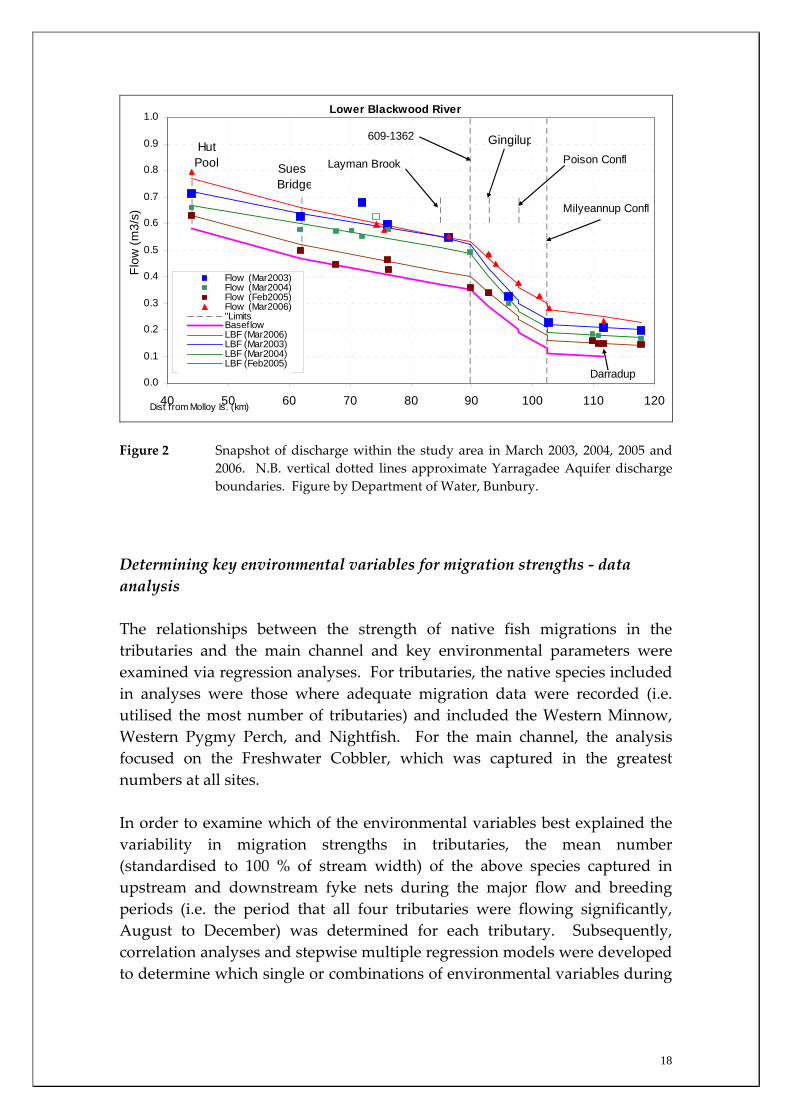
In order to characterise the climatic regime during the sampling period, relative to the historical climate of the region, rainfall and temperature data were obtained for the Australian Bureau of Meteorology for Bridgetown; a location for which long‐term data were available. This is important as it has implications in terms of the appropriateness of the biological data as a baseline and for understanding inter‐annual variations in future monitoring programs. In order to gain a more precise understanding of temperature regimes of the various tributaries sampled in this study, temperature data loggers (TinytagTM) were placed in situ into migration sampling sites in the tributaries (Figure 1) and programmed to log temperature every three hours. Temperature loggers were also put in situ at the Blackwood River main channel sites. Data from the loggers were downloaded and temperature regimes of the various aquatic systems were graphically compared. On each sampling occasion at each site, the temperature (in addition to the temperature data loggers), conductivity, pH, and dissolved oxygen were obtained from the middle of the water column at three locations at each sites and a mean (± 1 SE) determined. Monthly discharge estimates in each tributary site were taken by Department of Water (Bunbury branch) staff at the approximate times that sampling took place for fish migrations. Main channel discharges were obtained from the Department of Water gauging stations at Nannup (approximating the Quigup sampling site), Darradup (upstream of the Yarragadee discharge, approximating Jalbarragup sampling site), Gingilup (receiving the majority of the Yarragadee discharge in the main channel, approximating the Denny Rd sampling site). The monthly discharge for the Milyeannup Pool sampling site (at the uppermost point of the Yarragadee discharge) was estimated as the average of the monthly Darradup and Gingilup discharges (see Figure 2).
18
Lower Blackwood River
HutPool Sues
Bridge
Gingilup
0.0
0.1
0.2
0.3
0.4
0.5
0.6
0.7
0.8
0.9
1.0
40 50 60 70 80 90 100 110 120Dist from Molloy Is. (km)
Flow
(m3/
s)
Flow (Mar2003)Flow (Mar2004)Flow (Feb2005)Flow (Mar2006)"LimitsBaseflowLBF (Mar2006)LBF (Mar2003)LBF (Mar2004)LBF (Feb2005)
Layman Brook
Darradup
Poison Confl
Milyeannup Confl
609-1362
Figure 2 Snapshot of discharge within the study area in March 2003, 2004, 2005 and 2006. N.B. vertical dotted lines approximate Yarragadee Aquifer discharge boundaries. Figure by Department of Water, Bunbury.
Determining key environmental variables for migration strengths ‐ data analysis The relationships between the strength of native fish migrations in the tributaries and the main channel and key environmental parameters were examined via regression analyses. For tributaries, the native species included in analyses were those where adequate migration data were recorded (i.e. utilised the most number of tributaries) and included the Western Minnow, Western Pygmy Perch, and Nightfish. For the main channel, the analysis focused on the Freshwater Cobbler, which was captured in the greatest numbers at all sites. In order to examine which of the environmental variables best explained the variability in migration strengths in tributaries, the mean number (standardised to 100 % of stream width) of the above species captured in upstream and downstream fyke nets during the major flow and breeding periods (i.e. the period that all four tributaries were flowing significantly, August to December) was determined for each tributary. Subsequently, correlation analyses and stepwise multiple regression models were developed to determine which single or combinations of environmental variables during

19
this major flow and/or breeding period explained the most variation in upstream and downstream migrations of those species. Within the main channel of the Blackwood River, the association between the strength of upstream and downstream Freshwater Cobbler movements and the above key environmental variables (with discharge data obtained from the Department of Water gauging stations at Nannup, Darradup and Gingilup) were similarly examined. Firstly, all sampling occasions at all sites were included in stepwise regression analysis to determine which of the environmental variables explained the variation in upstream or downstream Freshwater Cobbler movements in the Blackwood River. Secondly, overall mean upstream and downstream Freshwater Cobbler movements in each of the four main channel sites, pooled for the major migration period (i.e. between November and July), were correlated with the above environmental variables during that period to determine which, if any, accounted for the observed differences in migration strengths between those sites. For the above analyses, Shapiro‐Wilk statistical tests for normality were undertaken for each variable and all data were subsequently log‐10 transformed prior to analysis. Bi‐variate correlations between each environmental variable were calculated (Pearson’s correlation coefficient) prior to each stepwise regression analysis to initially examine relationships between environmental variables. Mean velocity was consistently highly correlated with discharge and was therefore excluded from the analyses to avoid problems with co‐linearity. In the subsequent stepwise regression analyses, levels of co‐linearity between independent variables were investigated via determining condition indexes and eigenvalues. The more conservative, adjusted co‐efficients of determination (r2) were examined in each model as the adjusted values closely reflect the goodness of fit of the model. The significance of the models are also presented (p‐values) (SPSS, 2005). It should be noted that only a limited number of tributaries and variables were examined in the regression analyses and therefore the models generated should be viewed as highlighting apparent trends in the relationships between the limited number of environmental variables and migrations of each species and not precise predictive tools as is often the case with larger data sets. Furthermore, there are many other habitat differences between sites that would also explain variation in fish movements between these sites and systems that were not examined. However, the environmental associations described here are nonetheless significant from a statistical perspective.

20
Fish and crayfish monitoring protocols A number of techniques were employed to examine the fish and crayfish fauna of the main channel and tributary sites in the Blackwood River (Figure 3). Each method is outlined below, i.e. the use of fyke nets (11.2 m in width, including two 5 m wings and a 1.2 m wide mouth fishing to a depth of 0.8 m, 5 m long pocket with two funnels all comprised of 2 mm woven mesh); seine nets (5, 10 and 15 m nets comprised of 2 mm woven mesh; and a 26 m seine net consisting of two 9 m wings of 6 mm woven mesh and an 8 m bunt of 3 mm mesh); 240 and 12 v electrofishers; and crayfish traps. Blackwood River main channel Species migrations At the four main channel sites (see Figures 1 and 3), fyke nets were used to determine temporal trends in species migrations. Fyke nets were set facing upstream, to determine downstream movements of fish, and facing downstream, to determine upstream movements of fish. Each fyke net was set for a period of 24 h with three replicates taken on each sampling occasion. Each fish and freshwater crayfish captured was identified, a sub‐sample measured (total length (TL) for fish and orbital carapace length (OCL) for crayfish) to the nearest 1 mm and where possible sexed and released. A subsample of most species was retained for analyses of biological indices such as gonadal development and aging, some of which are provided in this report, but most of which are to be investigated further. Due to the high volume of water and large width of the main channel it was rarely possible to completely block the main channel sites and therefore capture all fish moving upstream or downstream past a point at the site. Therefore, the mean number of each species captured on each occasion was adjusted to account for total number of each species migrating through a section of the river. For example, if our fyke nets blocked 90% of the main channel and we caught 90 fish, this would be adjusted by 100/90 to account for all fish moving past this point in the river and thus we would estimate that in fact 100 fish swam through this section of the river over the 24 h period. The total numbers referred to here on in are the actual numbers captured, while the graphs reflect the adjusted data to show the approximate numbers of fish actually migrating and to thus allow for comparisons between the various riverine reaches.

21
Figure 3 Fyke nets set in (A) the most upper Blackwood River main channel site, i.e.
Quigup, (B‐C) Jalbarragup, (D‐E) upstream of Rosa Brook (Denny Rd), and (F) Milyeannup Pool downstream of Milyeannup Brook mouth.
Species abundances Replicate sampling over a given area (m2) using seine netting and/or electrofishing was used to determine the relative abundances of the different species in the different main channel sites. All fish and freshwater crayfish captured were identified, a subsample measured and the majority released, although a sub‐sample was often retained for biological analyses (e.g. for maturity data and length at age). Relative crayfish abundances were determined using up to 13 crayfish traps set overnight at each main channel site on each sampling occasion. The mean number captured at each site was compared using ANOVA.
A
C
B
D
E
F

22
Blackwood River tributaries On each sampling occasion (if the system was flowing), fyke nets were set over three days and nights in Milyeannup Brook (2 sites), Layman Brook, Rosa Brook and McAtee Brook (Figure 4). At each site, one net was set facing upstream, to capture fish that were moving downstream, while another was set facing downstream (to capture fish moving upstream) and each was checked every 24 h (Figure 4). As with the main channel site captures, the percent coverage of each set was determined and the catches later adjusted to 100% of the stream width.
Figure 4 Fyke nets set in (A) upper Milyeannup Brook (Blackwood Rd), (B) lower
Milyeannup Brook, (C) Milyeannup Brook mouth, (D) Layman Brook (Denny Rd), (E) Rosa Brook (Denny Rd), and (F) McAtee Brook.
A
C
B
F
D
E

23
The shallow, diffuse nature of Poison Gully prohibited effective sampling for fish migration; therefore, a seasonal quantitative analysis of the fish and freshwater crayfish was undertaken using a back‐pack electrofisher. Three replicate density estimates were taken with up to 90 m2 sampled on each occasion. In addition, electrofishing was employed in October 2005 in McAtee, Rosa and Layman Brooks and again in December 2005 in McAtee Brook to examine species demographics. Regardless of capture method, fish species were identified, with a large sub‐sample measured for total length (mm TL) for fish and orbital carapace length (mm OCL) for freshwater crayfish and before being released. Those not measured were identified and counted to determine total numbers. A small sub‐sample of native species was retained for biological investigation into the gonadal development (up to ~30 per month) and for future genetic analysis. Freshwater crayfish were identified, measured to the nearest mm OCL, sexed and released. A small number were retained for determination of size at sexual maturity. Marron population analysis Sampling regime In order to compare the relative abundances of Marron at sites within the main channel of the Blackwood River, sampling for Marron occurred at a total of six sites in the Blackwood River on seven sampling occasions; corresponding with the fish migration sampling. In addition to the four sites sampled for fish migrations, an additional two were selected (near the confluence of Red Gully, upstream of the YADZ, and near the entrance of Layman’s Brook, at the most downstream point of the YADZ) in order to sample a greater range of representative habitats within and outside of the major zone of groundwater discharge to avoid potential bias resulting from accessibility by recreational fishers (Figure 2). On each sampling occasion, up to 13 box‐style crayfish traps were deployed overnight spaced approximately 15 m apart. Traps were baited with poultry pellets. Upon retrieval, all crayfish were identified, sexed and measured to the nearest 1 mm orbital carapace length (OCL). Male Marron were released at the site of capture and a sample of females were euthanased by immersion in an ice slurry and later examined for determination of reproductive stage. Female Marron were dissected in the laboratory and each individual assigned an ovarian developmental stage according to Beatty et al. (2003). Data analysis The catch per unit effort (CPUE) of Marron on each sampling occasion at each site was determined by calculating the mean number of Marron captured per

24
trap per night. The statistical significance of CPUE was tested using general linear models (ANOVA) with Levene’s test of homogeneity of variance first being conducted and data being log‐transformed when necessary. In order to compare population structures of Marron in the sites receiving YADZ (i.e. Milyeannup Pool; near the Layman’s Brook confluence, and at Denny Road; near the Rosa Brook confluence) to those sites upstream of the zone (i.e. near the confluence of Red Gully, Jalbarragup Road crossing, and Quigup), length‐frequency distributions over the sampling months were produced for each of the two zones. The major spawning period of Marron was determined by examination of the temporal pattern in proportions of female ovarian stages (see Beatty et al. 2003, 2005). The OCL at which 50 (L50) and 95% (L95) of female Marron mature in the Blackwood River was determined by undertaking logistic regression analysis of the percentage contributions made to each length class by individuals that contained developing / mature gonads (stages III – VII). Data were randomly re‐sampled and reanalysed to create 500 sets of bootstrap estimates. The logistic equation is:
POCL = 1 / [1 + e ‐ln19 (OCL ‐ OCL50) / OCL95 ‐ OCL50)]
where POCL is the proportion of Marron with mature gonads (see below) at length interval OCL. Only those individuals captured in July and August (i.e. immediately prior to and throughout the breeding period, see Results) were used in the analysis (for full methodology see Beatty et al. 2004). Freshwater Cobbler population analysis In order to further examine patterns in migrations of Freshwater Cobbler, a total of 437 were tagged using individually numbered t‐bar tags at each main channel site over the study period (see Table 3). The total length of each fish tagged and recaptured was measured to aid in the future validation of growth and movements of this species. Furthermore, in each month of the main migration period (late spring – early autumn, see Figure 17), the gonadosomatic index (GSI) was calculated for both sexes. This index compares the proportion of the gonad to the overall body weight to determine spawning periods as a precipitous decline in the GSI is generally used to indicate the period of peak spawning.

25
RESULTS and DISCUSSION Water quality in the main channel and tributaries
Climate during the study period The analysis of the seasonal pattern in climate for the region revealed an atypical pattern in air temperature and rainfall for the sampling year(s) compared with historical data (Figures 5 and 6). Specifically, the first half of the sampling period (i.e. spring 2005 and summer 2005‐2006) was unusually cool compared with the long‐term average (Figure 5). Furthermore, there was an unusually late start to the wet season in 2006 (i.e. July compared with April/May historically) (Figure 6). Therefore, the seasonal patterns in fish movements described in this report may differ to that of a typical year and this interannual variation requires quantification by further seasonal sampling. For example, the relatively late onset of winter rains in 2006 probably resulted in delayed seasonal surface flows in Rosa Brook, Layman’s Brook and McAtee Brook that are not maintained by groundwater discharge compared to Milyeannup Brook and Poison Gully, which have perennial flow due to Yarragadee Aquifer discharge.
Month
Oct Nov Dec Jan Feb Mar Apr May Jun Jul Aug Sep
Tem
pera
ture
(°C
)
14
16
18
20
22
24
26
28
30
32 Study periodLong term (1887-2004)
2005 2006
Figure 5 Mean monthly maximum air temperature at Bridgetown during the study
period and the long term mean (1887‐2004, source: Australian Bureau of Meteorology). N.B. the considerably cooler spring 2005 and summer 2005‐2006 temperatures compared to the long‐term average.
26
Month
Oct Nov Dec Jan Feb Mar Apr May Jun Jul Aug Sep
Rai
nfal
l (m
m)
0
20
40
60
80
100
120
140
160
180
Monthly rainfall during studyLong term monthly rainfall (1887-2004)
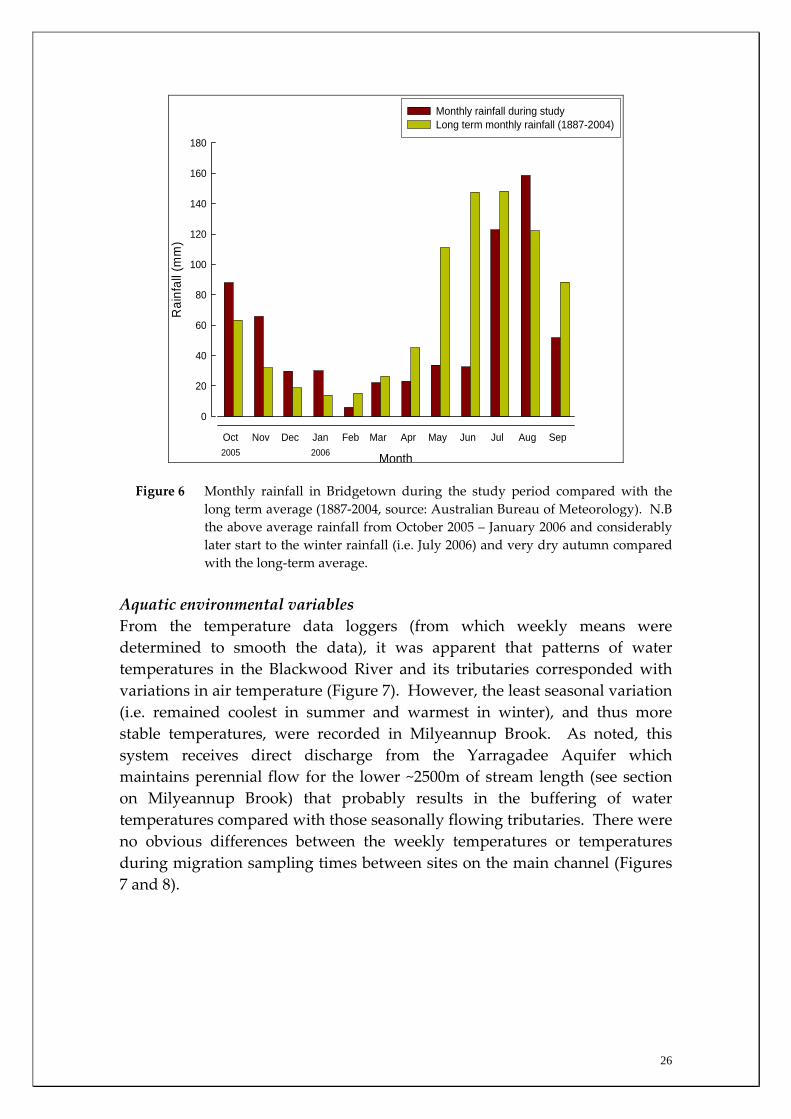
2005 2006 Figure 6 Monthly rainfall in Bridgetown during the study period compared with the
long term average (1887‐2004, source: Australian Bureau of Meteorology). N.B the above average rainfall from October 2005 – January 2006 and considerably later start to the winter rainfall (i.e. July 2006) and very dry autumn compared with the long‐term average.
Aquatic environmental variables From the temperature data loggers (from which weekly means were determined to smooth the data), it was apparent that patterns of water temperatures in the Blackwood River and its tributaries corresponded with variations in air temperature (Figure 7). However, the least seasonal variation (i.e. remained coolest in summer and warmest in winter), and thus more stable temperatures, were recorded in Milyeannup Brook. As noted, this system receives direct discharge from the Yarragadee Aquifer which maintains perennial flow for the lower ~2500m of stream length (see section on Milyeannup Brook) that probably results in the buffering of water temperatures compared with those seasonally flowing tributaries. There were no obvious differences between the weekly temperatures or temperatures during migration sampling times between sites on the main channel (Figures 7 and 8).

27
MonthNov Jan Mar May Jul Sep
Wat
er te
mpe
ratu
re (°
C)
5
10
15
20
25
30
35
Milyeannup Brook - Brockman HwyRosa Brook - Denny RdMcAtee Brook - Longbottom RdLaymans Brook - Denny RdBlackwood River- Milyeannup PoolMilyeannup Brook - Blackwood RdBridgetown mean maximum air temperature Blackwood River - Denny Rd
Figure 7 Mean weekly temperatures (±1 SE) at the sampling sites in the tributaries, two
main channel sites (Milyeannup Pool ‐ at the upstream point of Yarragadee discharge and Denny Rd ‐ receiving all of the Yarragadee discharge), and the maximum air temperature at Bridgetown. N.B. the lower seasonal fluctuation of the mean temperature in lower Milyeannup Brook (maintained by groundwater discharge) compared with those reliant on surface flows, and the marked influence of air temperature on water temperature at these sites.

28
Month
Oct Nov Dec Feb Mar Jun Aug Sep
Tem
pera
ture
(°C
)
10
12
14
16
18
20
22
24
26 Denny RdMilyeannup PoolJalbarragupQuigup
2005 2006
Figure 8 Mean temperatures (±1 S.E.) at the sampling sites in the main channel of the
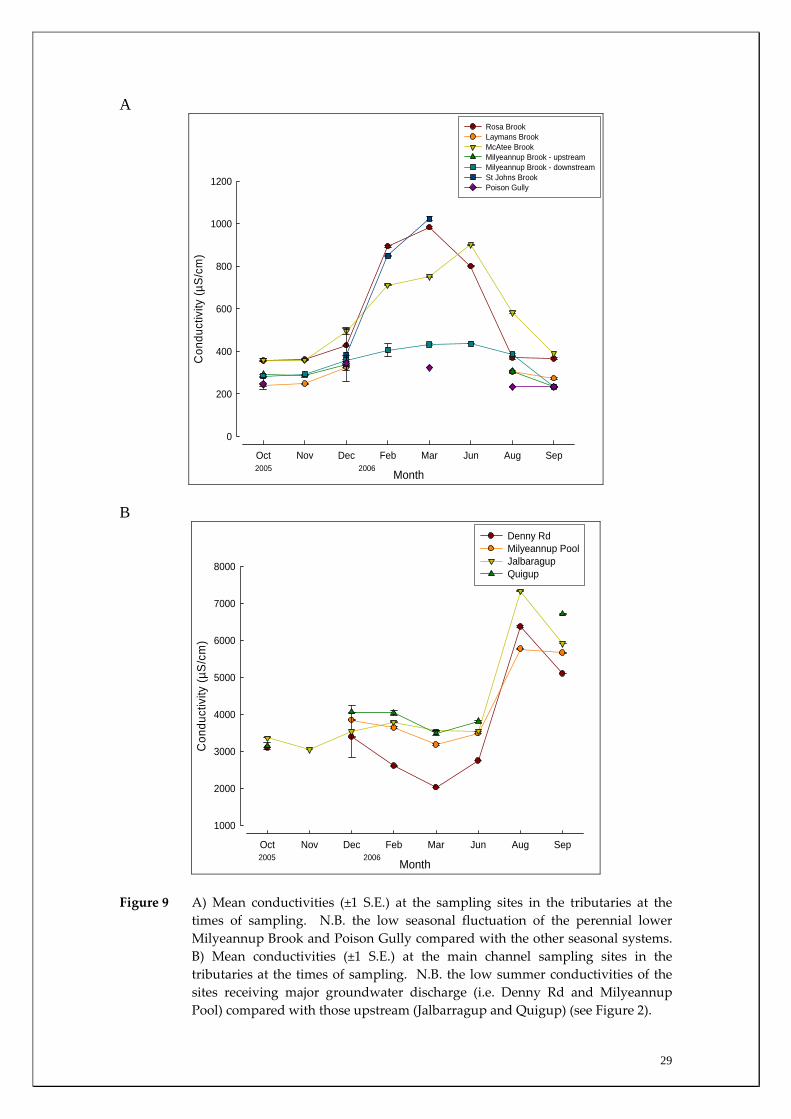
Blackwood River on each sampling occasion. This consistency of water quality in the two perennial tributaries was highlighted by the relatively consistent conductivities recorded in these systems compared with systems that cease flowing. Those latter systems increase in conductivity during summer as a result of evapoconcentration (Figure 9a). The increased cumulative discharge of groundwater into the main channel during summer at the Milyeannup Pool and Denny Rd results in those sites having reduced conductivities (e.g. ~2030 μS/cm at Denny Rd in March) compared with sites upstream of the major zone of groundwater intrusion (e.g. ~3550 μS/cm at Jalbarragup in March) (Figures 2 and 9b). The maintenance of relatively stable water quality variables (e.g. pH and oxygen, Figures 10‐13) is known to create stability in faunal associations and may be factors responsible in the provision of refuge habitat for rare species (Hattons & Evans 1998, Power et al. 1999, Murray et al. 2003, Humphreys 2006).
29
A
Month
Oct Nov Dec Feb Mar Jun Aug Sep
Con
duct
ivity
(µS/
cm)
0
200
400
600
800
1000
1200
Rosa BrookLaymans BrookMcAtee BrookMilyeannup Brook - upstreamMilyeannup Brook - downstreamSt Johns Brook Poison Gully
2005 2006
B
Month
Oct Nov Dec Feb Mar Jun Aug Sep
Con
duct
ivity
(µS
/cm
)
1000
2000
3000
4000
5000
6000
7000
8000
Denny RdMilyeannup PoolJalbaragupQuigup
2005 2006
Figure 9 A) Mean conductivities (±1 S.E.) at the sampling sites in the tributaries at the times of sampling. N.B. the low seasonal fluctuation of the perennial lower Milyeannup Brook and Poison Gully compared with the other seasonal systems. B) Mean conductivities (±1 S.E.) at the main channel sampling sites in the tributaries at the times of sampling. N.B. the low summer conductivities of the sites receiving major groundwater discharge (i.e. Denny Rd and Milyeannup Pool) compared with those upstream (Jalbarragup and Quigup) (see Figure 2).

30
Month
Oct Nov Dec Feb Mar Jun Aug Sep
pH
3.5
4.0
4.5
5.0
5.5
6.0
6.5
7.0
7.5
Rosa BrookLaymans BrookMcAtee BrookMilyeannup Brook - upstreamMilyeannup Brook - downstreamSt John Poison Gully
2005 2006
Figure 10 Mean pH (±1 S.E.) at the sampling sites in the tributaries. N.B. the increased acidity in Rosa Brook during the dry period in March and June 2006.
Month
Oct Nov Dec Feb Mar Jun Aug Sep
pH
5.5
6.0
6.5
7.0
7.5
8.0
8.5
Denny RdMilyeannup PoolJalbaragup RdQuigup
2005 2006
Figure 11 Mean pH (± 1 S.E.) at the sampling sites in the main channel of the Blackwood River.
31
Month
Oct Nov Dec Feb Mar Jun Aug Sep
Dis
solv
ed o
xyge
n (p
pm)
2
4
6
8
10
12
14
16
18
Rosa BrookLaymans Brook McAtee BrookMilyeannup Brook - upstreamMilyeannup Brook - downstreamSt Johns BrookPoison Gully
2005 2006
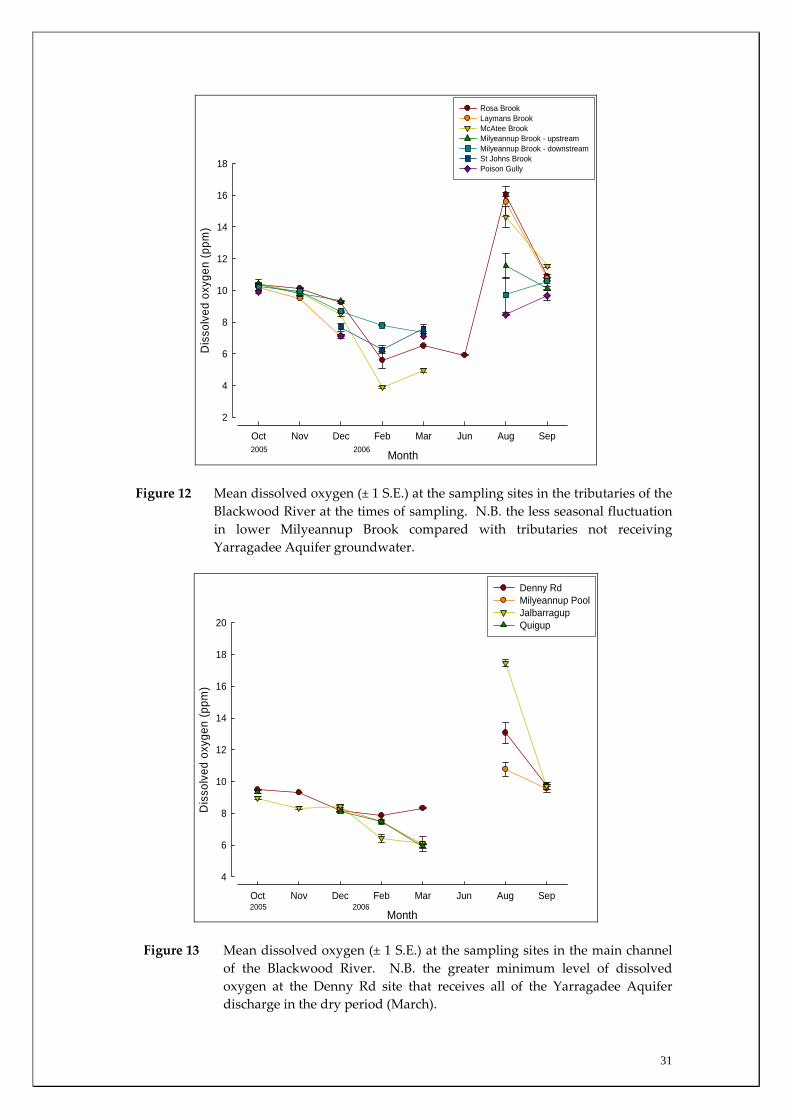
Figure 12 Mean dissolved oxygen (± 1 S.E.) at the sampling sites in the tributaries of the
Blackwood River at the times of sampling. N.B. the less seasonal fluctuation in lower Milyeannup Brook compared with tributaries not receiving Yarragadee Aquifer groundwater.
Month
Oct Nov Dec Feb Mar Jun Aug Sep
Dis
solv
ed o
xyge
n (p
pm)
4
6
8
10
12
14
16
18
20
Denny RdMilyeannup PoolJalbarragupQuigup
2005 2006
Figure 13 Mean dissolved oxygen (± 1 S.E.) at the sampling sites in the main channel
of the Blackwood River. N.B. the greater minimum level of dissolved oxygen at the Denny Rd site that receives all of the Yarragadee Aquifer discharge in the dry period (March).

32
Rosa Brook had the greatest discharge of any tributary; peaking in October 2005, at the start of the study (Figure 14). Milyeannup Brook and Poison Gully (although not gauged) continued to flow throughout the dry months due to groundwater discharge (Figure 14). There was a general increase in the discharge rates moving downstream in the main channel sites (Figures 2 and 15). As mentioned, climatically this was an atypical year as reflected by relatively low discharge up until August 2006 (Figure 15). Of particular note is the greater discharge at Gingilup compared with Darradup during the dry months (February–July, Figure 2). This is due to Gingilup receiving the majority of the Yarragadee Aquifer discharge into the main channel whereas Darradup is upstream from the discharge zone (Figure 15). This highlights the fact that groundwater contributes to between 30 and 100% of the summer discharge of the Blackwood River (Strategen 2006).
Month
Oct Nov Dec Feb Mar Jun Aug Sep
Mea
n di
scha
rge
(m3 /s
ec)
0
1
2
3
4Rosa BrookLaymans BrookMcAtee BrookMilyeannup Brook - upstreamMilyeannup Brook - downstreamPoison Gully
2005 2006
Figure 14 Mean discharge (± 1 SE) at the sampling sites in the tributaries of the
Blackwood River at the times of sampling. N.B. the continuancy of discharge in lower Milyeannup Brook compared to the seasonal tributaries.

33
Month
Oct 05
Nov 05
Dec 05
Jan 0
6
Feb 06
Mar 06
Apr 06
May 06
Jun 0
6Ju
l 06
Aug 06
Sep 06
Oct 06
Nov 06
Dec 06
Dis
char
ge (m
3 /sec
0
5
10
15
20
25
30
35Nannup Darradup Gingilup Hut pool
Figure 15 Monthly mean discharges (±1 SE) in main channel sites of the Blackwood River
at the times of sampling. N.B. the greater discharge in Gingilup (receiving downstream of groundwater discharge zones) compared with Darradup (upstream of the Yarragadee discharge zone) from February – June 2006 (see also Figure 2).
The maintenance of relatively low main channel salinities as a consequence of groundwater intrusions has considerable ecological implications as during summer, when the majority of tributaries cease flowing, many fish must retreat into the main channel. During winter, when the highest conductivities are experienced (Figure 9), those individuals can utilise the then flowing fresh tributaries to escape the elevated main channel salinities that may exceed their tolerance levels. Therefore, salt‐intolerant species, particularly Balston’s Pygmy Perch, Western Pygmy Perch and Nightfish, that are currently able to utilise this diluted section of the Blackwood River, may not be able to do so should a reduction in freshwater input in summer occur to a degree that salinity increases to a level that exceeds their salinity tolerances.

34
Species capture summary
During this study, six endemic freshwater fish species, three estuarine fish species and three introduced fish species were captured. The anadromous (i.e. migrates into rivers from the ocean to breed) Pouched Lamprey, a southern hemisphere agnathan (i.e. jawless fish) was also captured, but was found in only two tributaries. The six fish species captured that are endemic to south‐western Australia were the Freshwater Cobbler, Western Minnow, Mud Minnow, Balston’s Pygmy Perch, Western Pygmy Perch, and the Nightfish. The estuarine species captured were the Western Hardyhead, South‐western Goby and the Swan River Goby. The three introduced fishes captured were the Eastern Mosquitofish, Goldfish and Rainbow Trout. Four species of endemic freshwater crayfish were captured, including the Marron, Gilgie, Restricted Gilgie and Koonac. Below is an account of the distribution, population demographics and migration patterns of each species. See also Section 2 for information regarding crayfish burrowing activity.
Freshwater Cobbler: The largest native freshwater fish in the south‐west of W.A.

35
Table 1 The total (and adjusted) number of each species of fish and freshwater crayfish captured in fyke nets in the Blackwood River main channel sites.
Total number (adjusted for stream width) of individuals caught in
the Blackwood main channel using Fyke nets. MOVEMENT
SPECIES
Downstream Upstream Total # Captured
Endemic freshwater fishes
Freshwater Cobbler 526 (1539.3) 1280 (5729.5) 1806 (7268.8)
Western Minnow 22 (175) 463 (3193.3) 485 (3368.3)
Mud Minnow 0 0 0
Balston’s Pygmy Perch 0 2 (40) 2 (40)
Western Pygmy Perch 14 (54) 0 14 (54)
Nightfish 11 (73) 4 (28.3) 15 (101.3)
Estuarine fishes South-west Goby 94 (563) 26 (158.3) 120 (721.3)
Swan River Goby 6 (34.7) 4 (10) 10 (44.7)
Western Hardyhead 13 (59.7) 12 (69.7) 25 (129.3)
Introduced fishes
Eastern Mosquitofish 14 (75) 13 (45) 27 (120)
Goldfish 0 0 0
Rainbow Trout 0 0 0
Endemic crayfishes
Smooth Marron 18 (100) 11 (70.5) 29 (170.5)
Gilgie 4 (22.3) 3 (31.7) 7 (54)
Restricted Gilgie 0 0 0
Koonac 0 0 0
Total number 1624 (6591)
1908 (9808)
3532 (16399)

36
Freshwater Cobbler
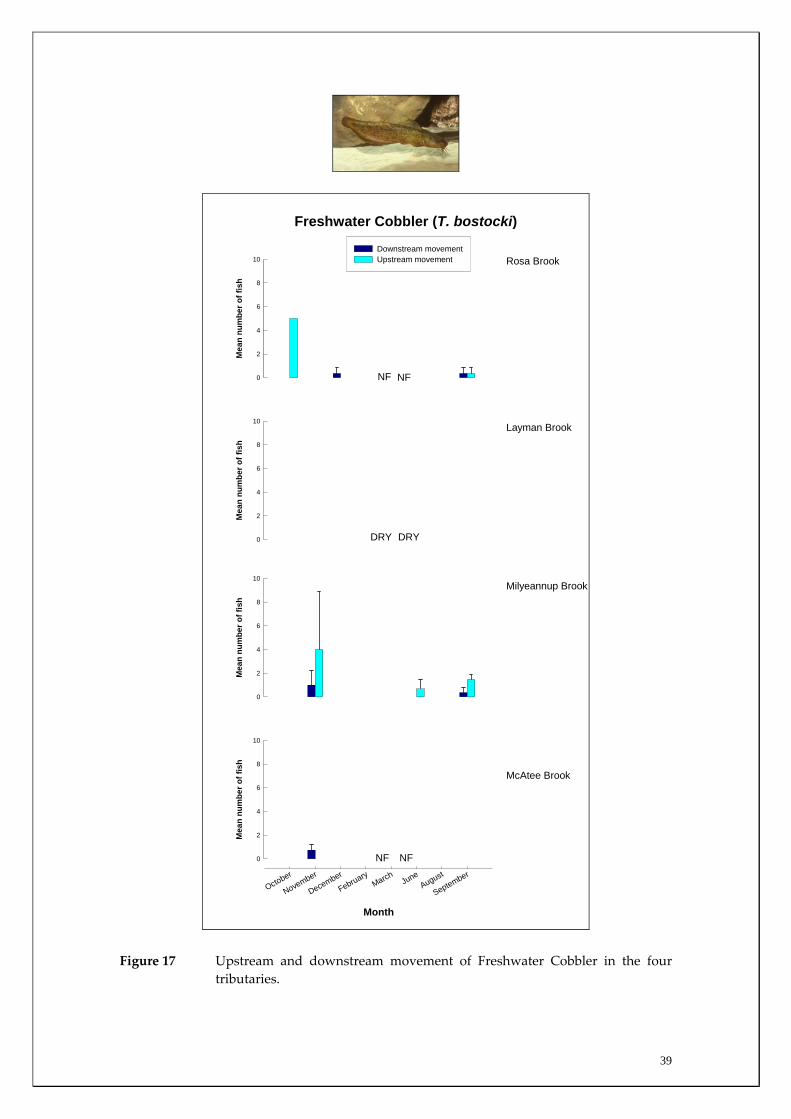
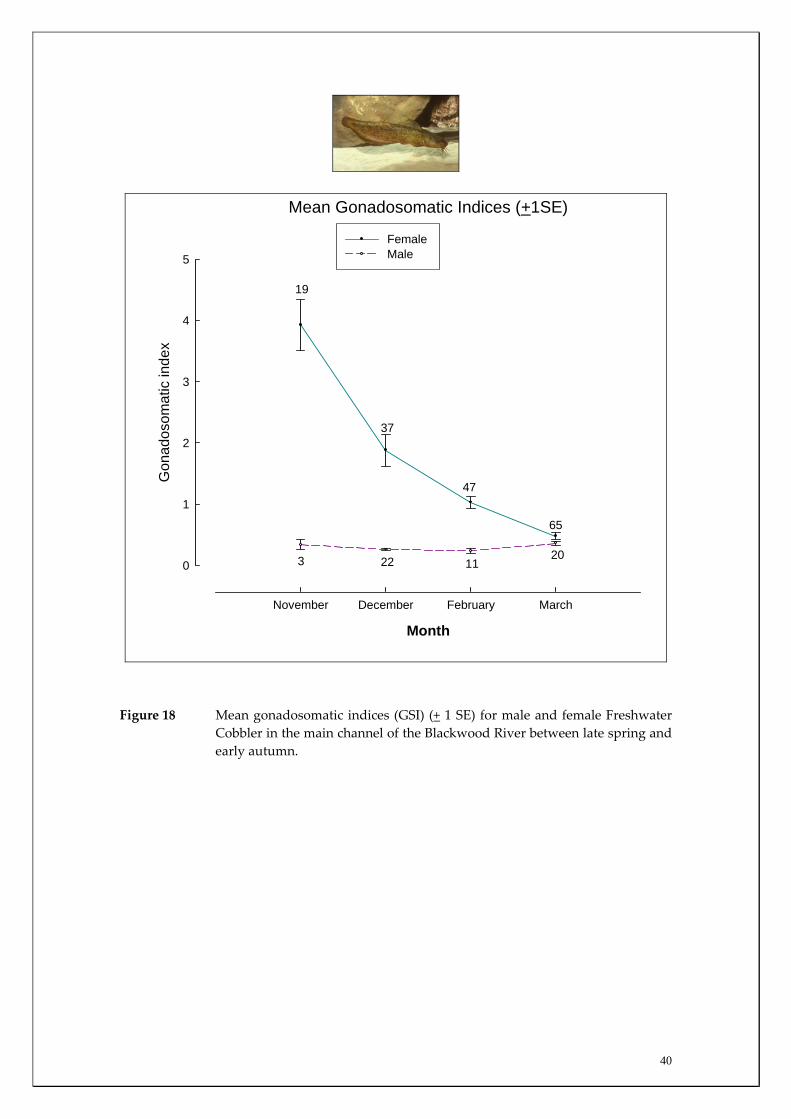
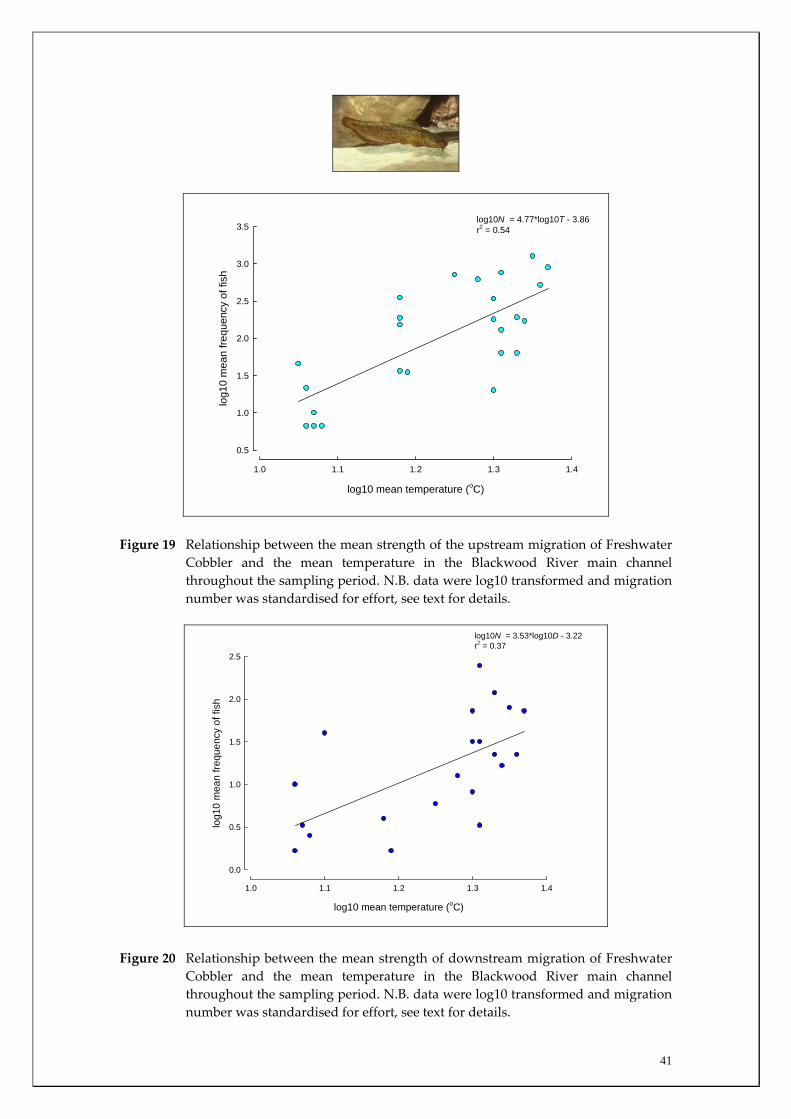
Habitat associations The Freshwater Cobbler is essentially restricted to the main channel of the Blackwood River (Figure 16, Appendices 1 and 2). The few individuals captured in the tributaries were generally smaller fish with only five, two and 17 captured in Rosa Brook, McAtee Brook and Milyeannup Brook, respectively (Figure 17). This was expected given this relatively large (compared to other native species of the region) fish is more commonly found in the larger rivers and reservoirs in this region. Migration patterns On almost all sampling occasions, the strength of the upstream migration of Freshwater Cobbler was greater than the downstream migration (Figure 16). The migration strength peaked in late spring and summer, with greatest migration strength being recorded in the more downstream sites that received greater groundwater discharge (i.e. Denny Rd and Milyeannup Pool) compared to the upstream sites (i.e. Jalbarragup and Quigup). Spatial differences in migratory patterns existed within the main channel with the peak upstream migrations in the downstream sites occurring during February, compared to March and November in Quigup and Jalbarragup, respectively (Figure 16). Movement of Freshwater Cobbler was at a minimum during winter. Furthermore, the spawning period of female Freshwater Cobbler coincided with their major migration period between late spring and summer as indicated by a decline in their GSI during that time (indicating that eggs had been released from ovaries) (Figure 18). The strength of both the upstream and downstream migrations of Freshwater Cobbler in the main channel of the Blackwood River over the entire sampling period at all sites was positively correlated with water temperature (Table 2). Water temperature was found to account for ~53% (p=0.00) of upstream and ~34% (p=0.003) of downstream movement (Figures 19 and 20). This reflected

37
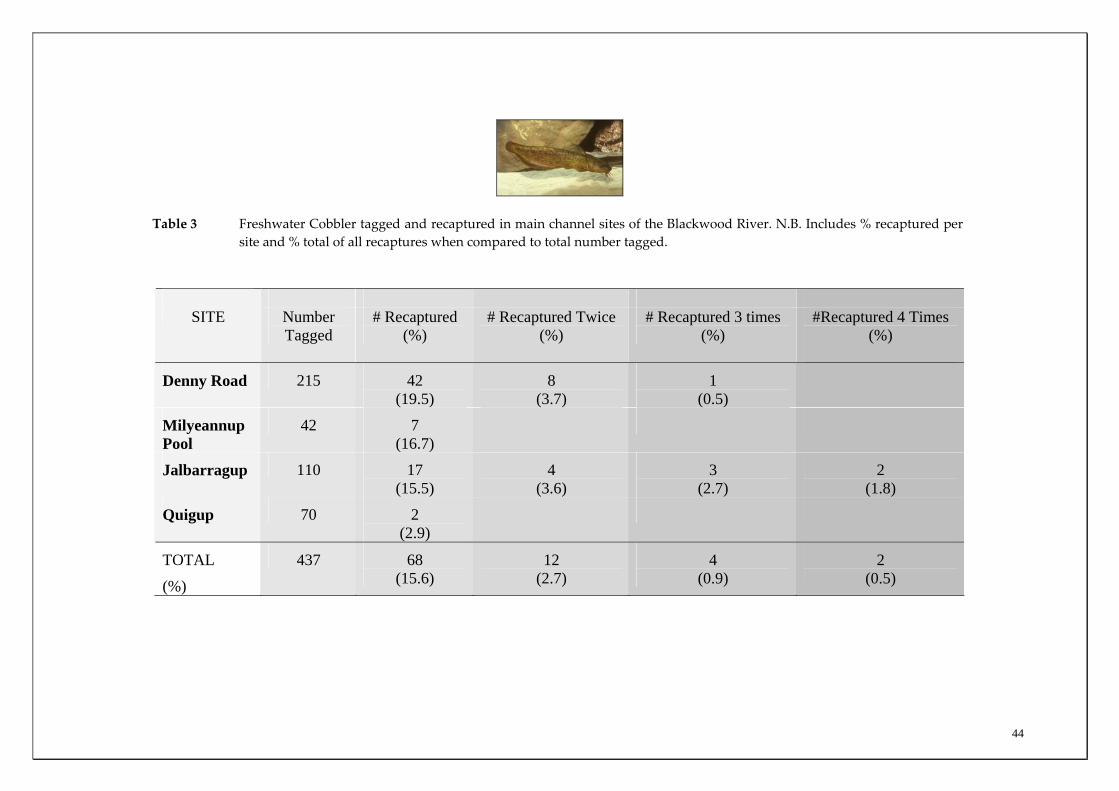
the fact that Freshwater Cobbler movements increased during periods of elevated water temperatures (i.e. summer). The mean strength of upstream movement of Freshwater Cobbler at the main channel sites during the peak movement period (i.e. late spring to autumn: November to July samples inclusive) was highly correlated with the mean discharge at those sites over that period (Figure 21). Regression analysis revealed that the overall mean monthly discharge between November and July at these sites explained ~96% (p=0.014) of the variation between main channel sites in Freshwater Cobbler movement in the Blackwood River. That is, the greater the summer discharge at these sites, the greater the strength of migration of this species. This movement is probably due to this species accessing habitats for spawning and feeding. Of the 437 tagged Freshwater Cobbler, a total of 86 (19.7%) were recaptured (Table 3). Of these, 68 were recaptured once, 12 twice, four three times and two were recaptured four times (Table 3). With the exception of one fish, all were caught at the initial tag‐capture site. This suggests that there is a relatively high degree of site fidelity by this species in the Blackwood River. Although a high degree of site fidelity occurs in this system, there are nonetheless large localised upstream migrations by this species during times of low flow as a precursor to spawning. As much of the dry period discharge in the Blackwood River is a direct result of groundwater discharge (30‐100% in the driest two months), this species appears reliant on this groundwater discharge to facilitate such spawning migrations. This groundwater discharge is therefore important in providing adequate passage through riffle zones that would otherwise be barriers to its migration; and would be particular important in years of low input of surface flows.

38
Mea
n nu
mbe
r of f
ish
0
200
400
600
800
1000
1200
1400
Downstream movementUpstream movement
Mea
n nu
mbe
r of f
ish
0
200
400
600
800
1000
1200
1400
Denny Road
Milyeannup Pool
Mea
n nu
mbe
r of f
ish
0
200
400
600
800
1000
1200
1400Jalbarragup
October
November
December
FebruaryMarch
JuneAugust
September
Mea
n nu
mbe
r of f
ish
0
200
400
600
800
1000
1200
1400
Quigup
Freshwater Cobbler (T. bostocki)
NS NS
NS NS
Figure 16 Upstream and downstream movement of Freshwater Cobbler at the four main channel sites. NS = not sampled.
39
Mea
n nu
mbe
r of f
ish
0
2
4
6
8
10Downstream movementUpstream movement
Mea
n nu
mbe
r of f
ish
0
2
4
6
8
10
Rosa Brook
Layman Brook
Mea
n nu
mbe
r of f
ish
0
2
4
6
8
10Milyeannup Brook
Month
October
November
December
FebruaryMarch
JuneAugust
September
Mea
n nu
mbe
r of f
ish
0
2
4
6
8
10
McAtee Brook
Freshwater Cobbler (T. bostocki)
DRY DRY
NF NF
NFNF
Figure 17 Upstream and downstream movement of Freshwater Cobbler in the four tributaries.
40
Mean Gonadosomatic Indices (+1SE)
Month
November December February March
Gon
ados
omat
ic in
dex
0
1
2
3
4
5
Female Male
19
37
47
65
3 22 1120
Figure 18 Mean gonadosomatic indices (GSI) (+ 1 SE) for male and female Freshwater
Cobbler in the main channel of the Blackwood River between late spring and early autumn.
41
log10 mean temperature (oC)
1.0 1.1 1.2 1.3 1.4
log1
0 m
ean
frequ
ency
of f
ish
0.5
1.0
1.5
2.0
2.5
3.0
3.5log10N = 4.77*log10T - 3.86r2 = 0.54
Figure 19 Relationship between the mean strength of the upstream migration of Freshwater Cobbler and the mean temperature in the Blackwood River main channel throughout the sampling period. N.B. data were log10 transformed and migration number was standardised for effort, see text for details.
log10 mean temperature (oC)
1.0 1.1 1.2 1.3 1.4
log1
0 m
ean
frequ
ency
of f
ish
0.0
0.5
1.0
1.5
2.0
2.5
log10N = 3.53*log10D - 3.22r2 = 0.37
Figure 20 Relationship between the mean strength of downstream migration of Freshwater
Cobbler and the mean temperature in the Blackwood River main channel throughout the sampling period. N.B. data were log10 transformed and migration number was standardised for effort, see text for details.

42
log10 mean discharge (M3/sec)
-0.05 0.00 0.05 0.10 0.15 0.20 0.25
log1
0 m
ean
frequ
ency
of f
ish
1.8
2.0
2.2
2.4
2.6
2.8log10N = 2.63*log10D +2.11r2 = 0.97
Figure 21 Relationship between the mean strength of the upstream migration of Freshwater Cobbler and the mean discharge in the Blackwood River main channel between November and July. N.B. Data were log10 transformed and migration number was standardised for effort, see text for details.

43
Table 2 Correlations between overall mean upstream and downstream movements of Freshwater Cobber in the main channel sites of the Blackwood River and prevailing environmental variables during the migration period (November to July). N.B. Data were log10 transformed, * denotes correlation is significant at the 0.05 level (2‐tailed).
Log
temperature Log
conductivity Log pH Log O2 Log
discharge Upstream movement
Log conductivity Pearson Correlation .358 Sig. (2-tailed) .642 Log pH Pearson Correlation .733 .414 Sig. (2-tailed) .267 .586 Log O2 Pearson Correlation -.498 -.983* -.444 Sig. (2-tailed) .502 .017 .556 Log discharge Pearson Correlation -.470 -.787 -.837 .752 Sig. (2-tailed) .530 .213 .163 .248 Upstream movement Pearson Correlation -.426 -.680 -.871 .634 .986* Sig. (2-tailed) .574 .320 .129 .366 .014 Downstream movement
Pearson Correlation .273 -.690 -.241 .550 .700 .687
Sig. (2-tailed) .727 .310 .759 .450 .300 .313
44
Table 3 Freshwater Cobbler tagged and recaptured in main channel sites of the Blackwood River. N.B. Includes % recaptured per
site and % total of all recaptures when compared to total number tagged.
SITE Number
Tagged # Recaptured
(%) # Recaptured Twice
(%) # Recaptured 3 times
(%) #Recaptured 4 Times
(%)
Denny Road 215 42 (19.5)
8 (3.7)
1 (0.5)
Milyeannup Pool
42 7 (16.7)
Jalbarragup 110 17 (15.5)
4 (3.6)
3 (2.7)
2 (1.8)
Quigup 70 2 (2.9)
TOTAL
(%)
437 68 (15.6)
12 (2.7)
4 (0.9)
2 (0.5)

45
Western Minnow
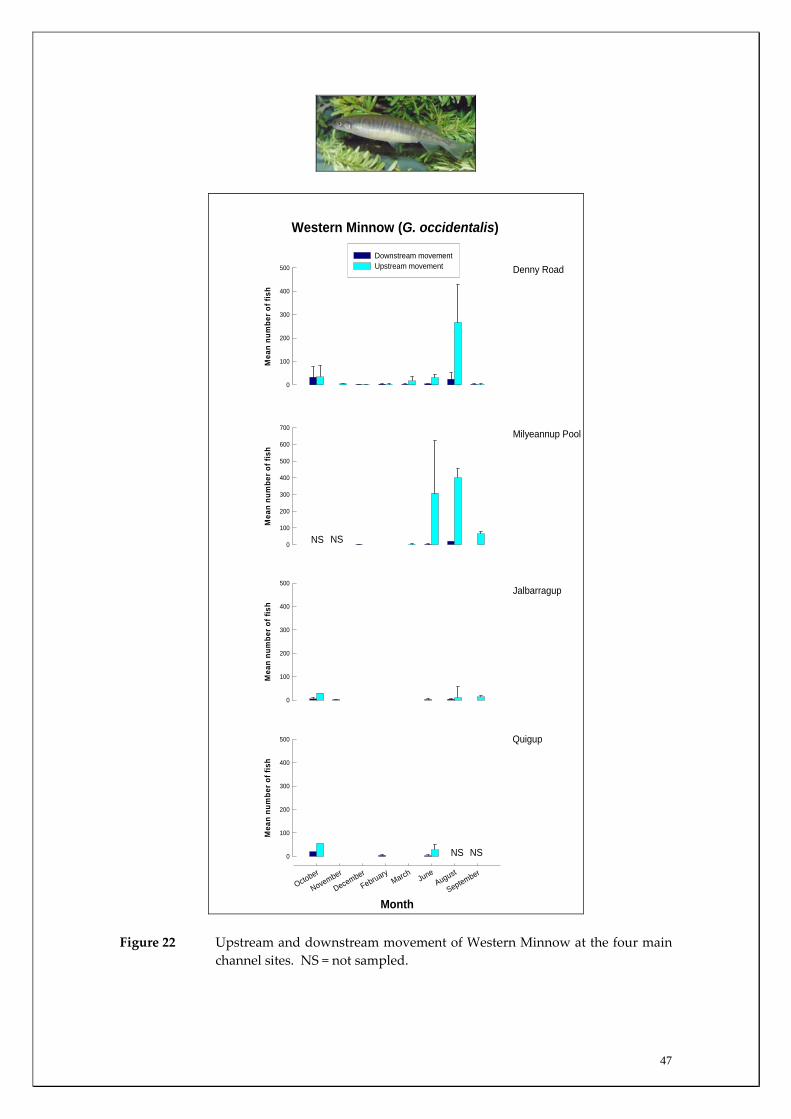
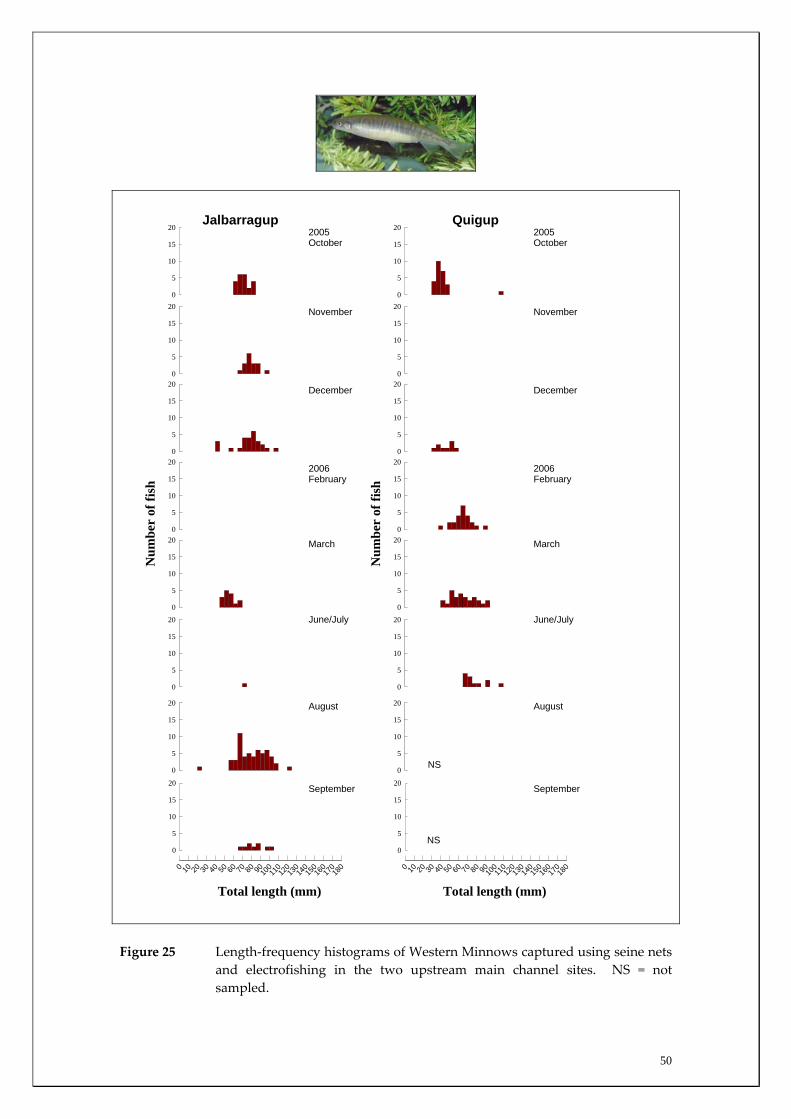
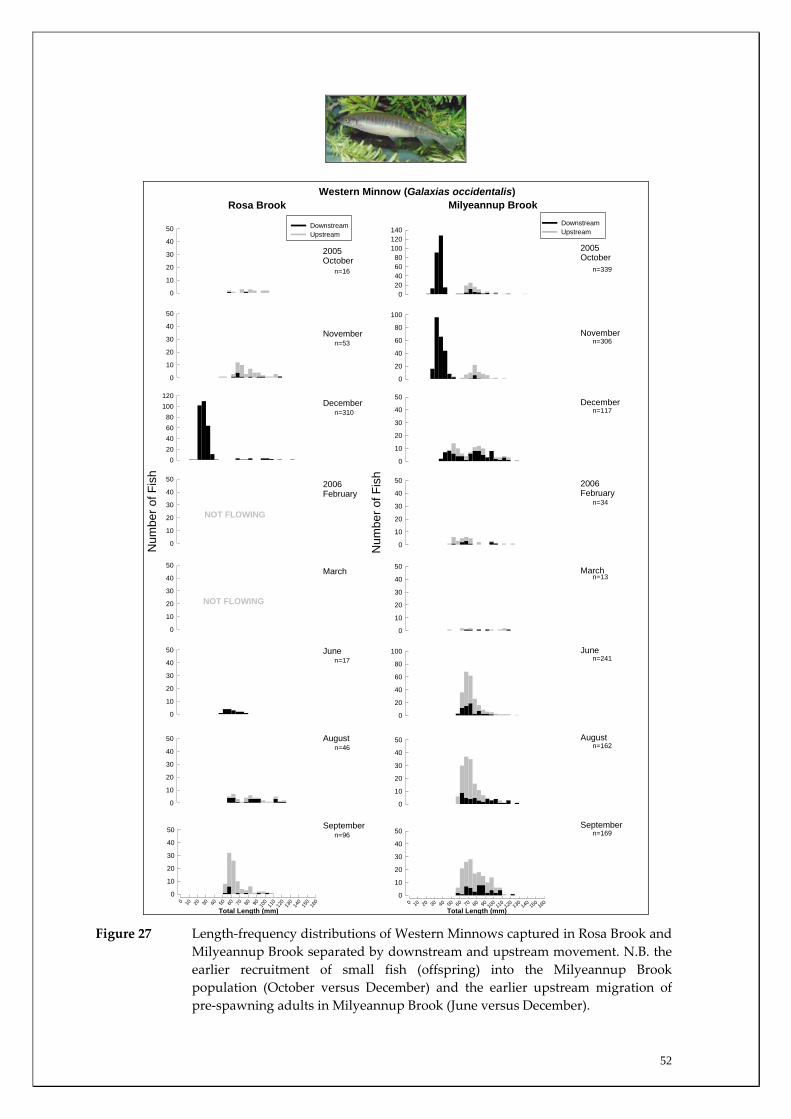
Habitat associations The Western Minnow was captured at the majority of sites sampled on most occasions, with large numbers recorded in both the main channel sites (Appendix 1) and in the tributaries (Appendix 2). This widespread distribution, being present in nearly all habitats sampled, reflects this species tolerance to a wide range of salinities; having previously been recorded in salinities up to ~24 ppt or ~two thirds the salinity of seawater (Morgan and Beatty 2004). Migration patterns There were limited movements of Western Minnow in the two most upstream main channel sites compared to the more downstream sites, i.e. Denny Rd and Milyeannup Pool (Figure 22). Within these latter sites, the upstream movement of Western Minnow was strongest during winter and peaked in August with, on average, over 300 individuals recorded moving upstream per day. These fish were large adults that were likely to be moving as a precursor to spawning (Figures 23‐25). Migration into Milyeannup Brook was high in August and there was limited movement of adults into the other tributaries at this time. Later migration of adults was recorded into the other tributaries from August to November. Upstream migrations of adult Western Minnow continued in Milyeannup Brook throughout the entire sampling period; presumably as a consequence of the perennial flows of the system resulting from Yarragadee Aquifer discharge (Figures 14 and 26). The marked contrast in population demographics of Western Minnow in Milyeannup Brook compared to the other tributaries is further highlighted by the considerable number of new recruits (i.e. offspring) recorded in Milyeannup Brook two months earlier than other systems; strongly suggesting that spawning activity was earlier in this system (Figures 27 and 28). For example, many of these new recruits migrated downstream into the main channel during October to December in Milyeannup Brook, compared
46
to December for Rosa Brook and McAtee Brook. Only limited recruitment occurred in Layman Brook. The earlier recruitment of fish from Milyeannup Brook is further highlighted by the larger size of this cohort compared to those in Rosa Brook in December (i.e. modal length 50‐55 mm TL compared to 25‐30 mm TL) (Figure 27). This earlier spawning in Milyeannup Brook, presumably as a consequence of perennial flows allowing earlier access to the tributary, is further highlighted when considering that the new recruits in this stream had a modal length of 35‐40 mm TL during October, which is 10 mm greater than the new recruits in Rosa Brook two months later (Figure 27). Examination of length‐frequency histograms of fish caught in main channel sites compared to tributary sites reveals that the vast majority of Western Minnows that we captured that were less than 40 mm TL were only found within the tributaries. This strongly suggests that breeding takes place within tributaries and that these habitats are therefore vital spawning areas for this species. There are substantial differences in the population demographics of Western Minnows in the main channel sites. Specifically, fish captured in the two most downstream sites grew to a substantially larger size implying that the species had greater longevity at the downstream sites compared to the two upstream sites. For example, of the fish that were greater than 100 mm TL, almost all were found at the Denny Rd and Milyeannup Pool sites (that both receive Yarragadee Aquifer discharge). The upstream and downstream migration of the Western Minnow in the various tributaries were both found to be positively correlated with the mean discharge from the tributaries during the major flow period (August to December) (Table 4). From the regression analysis, mean discharge explained ~92% (p=0.027) and 87% (p=0.044) of the variation in the mean downstream and upstream migration of Western Minnow between the tributaries during this period (Figures 29 and 30). This suggests that the larger the discharge from tributaries during peak flow periods, the greater the usage of those streams by the Western Minnow, presumably for spawning. However, the perennial flows of Milyeannup Brook would provide earlier access to spawning sites regardless of surface runoff (i.e. rainfall).
47
Mea
n nu
mbe
r of f
ish
0
100
200
300
400
500
Downstream movementUpstream movement
Mea
n nu
mbe
r of f
ish
0
100
200
300
400
500
600
700
Denny Road
Milyeannup Pool
Mea
n nu
mbe
r of f
ish
0
100
200
300
400
500Jalbarragup
Month
October
November
December
FebruaryMarch
JuneAugust
September
Mea
n nu
mbe
r of f
ish
0
100
200
300
400
500 Quigup
Western Minnow (G. occidentalis)
NS NS
NS NS
Figure 22 Upstream and downstream movement of Western Minnow at the four main channel sites. NS = not sampled.

48
0
5
10
15
20Downstream MigrationUpstream Migration
0
5
10
15
20
0
5
10
15
20
Num
ber o
f Fis
h
0
5
10
15
20
0
5
10
15
20
0102030405060
0
10
20
30
40
Total Length(mm)0 10 20 30 40 50 60 70 80 90
100
110
120 130 140 150 1600
5
10
15
20r
2005October
November
December
2006February
March
June
August
September
n=37
n=2
n=4
n=163
n= 177
n=37
n=6
n=17
Western Minnow (Galaxias occidentalis)
Figure 23 Combined length‐frequency histograms of Western Minnows captured using fyke nets in the four main channel sites.

49
0
5
10
15
20
Num
ber
of fi
sh
Total length (mm)
0
5
10
15
20
0
5
10
15
20
0
5
10
15
20
0
5
10
15
20
0
5
10
15
20
0
5
10
15
20
0 10 20 30 40 50 60 70 80 90 100
110
120
130
140
150
160
170
180
0
5
10
15
20
2005October
November
December
2006February
March
June/July
August
September
Denny Rd
0102030405060
Num
ber
of fi
sh
Total length (mm)
0102030405060
0102030405060
0102030405060
0102030405060
0102030405060
0102030405060
0 10 20 30 40 50 60 70 80 90 10011
012
013
014
015
016
017
018
0
0102030405060
2005October
November
December
2006February
March
June/July
August
September
Milyeannup Pool
NS
NS
Figure 24 Length‐frequency histograms of Western Minnows captured using seine nets and electrofishing in the two downstream main channel sites. NS = not sampled.
50
0
5
10
15
20
Num
ber
of fi
sh
Total length (mm)
0
5
10
15
20
0
5
10
15
20
0
5
10
15
20
0
5
10
15
20
0
5
10
15
20
0
5
10
15
20
0 10 20 30 40 50 60 70 80 9010011
012
013
014
015
016
017
018
0
0
5
10
15
20
2005October
November
December
2006February
March
June/July
August
September
Jalbarragup
0
5
10
15
20
Num
ber
of fi
sh
Total length (mm)
0
5
10
15
20
0
5
10
15
20
0
5
10
15
20
0
5
10
15
20
0
5
10
15
20
0
5
10
15
20
0 10 20 30 40 50 60 70 80 9010011
012
013
014
015
016
017
018
0
0
5
10
15
20
2005October
November
December
2006February
March
June/July
August
September
Quigup
NS
NS
Figure 25 Length‐frequency histograms of Western Minnows captured using seine nets
and electrofishing in the two upstream main channel sites. NS = not sampled.

51
Mea
n nu
mbe
r of f
ish
0
50
100
150
200
250
Downstream movementUpstream movement
Mea
n nu
mbe
r of f
ish
0
50
100
150
200
250
Rosa Brook
Layman Brook
Mea
n nu
mbe
r of f
ish
0
50
100
150
200
250Milyeannup Brook
Month
October
November
December
FebruaryMarch
JuneAugust
September
Mea
n nu
mbe
r of f
ish
0
50
100
150
200
250
McAtee Brook
Western Minnow (G. occidentalis)
DRY DRY
NF NF
NFNF
Figure 26 Upstream and downstream movement of Western Minnows in the four tributaries sampled. NF = not flowing and thus limited connectivity between pools.
52
0
10
20
30
40
50 DownstreamUpstream
0
10
20
30
40
50
020406080
100120
Rosa Brook
Num
ber o
f Fis
h
0
10
20
30
40
50
0
10
20
30
40
50
0
10
20
30
40
50
0
10
20
30
40
50
Total Length (mm)
0 10 20 30 40 50 60 70 80 90 100
110
120
130
140
150
160
0
10
20
30
40
50
020406080
100120140
DownstreamUpstream
0
20
40
60
80
100
0
10
20
30
40
50
Milyeannup Brook
Num
ber o
f Fis
h
0
10
20
30
40
50
0
10
20
30
40
50
0
20
40
60
80
100
0
10
20
30
40
50
Total Length (mm)0 10 20 30 40 50 60 70 80 90
100110
120130
140150
1600
10
20
30
40
50
2005October
November
December
2006February
March
June
August
September
2005October
November
December
2006February
March
June
August
September
Western Minnow (Galaxias occidentalis)
NOT FLOWING
NOT FLOWING
n=16
n=53
n=310
n=17
n=46
n=96
n=339
n=306
n=117
n=241
n=162
n=169
n=34
n=13
Figure 27 Length‐frequency distributions of Western Minnows captured in Rosa Brook and
Milyeannup Brook separated by downstream and upstream movement. N.B. the earlier recruitment of small fish (offspring) into the Milyeannup Brook population (October versus December) and the earlier upstream migration of pre‐spawning adults in Milyeannup Brook (June versus December).

53
0
10
20
30
40 DownstreamUpstream
0
10
20
30
40
0
10
20
30
40
Layman Brook
Num
ber o
f Fis
h
0
10
20
30
40
0
10
20
30
40
0
10
20
30
40
0
10
20
30
40
Total Length (mm)
0 10 20 30 40 50 60 70 80 90 100
110
120
130
140
150
160
0
10
20
30
40
0
10
20
30
40
0
10
20
30
40
0
10
20
30
40
McAtee Brook
Num
ber o
f Fis
h
0
10
20
30
40
0
10
20
30
40
0
10
20
30
40
0
10
20
30
40
Total Length (mm)
0 10 20 30 40 50 60 70 80 90 100
110
120
130
140
150
160
0
10
20
30
40
DownstreamUpstream
Western Minnow (Galaxias occidentalis)
2005October
November
December
2006February
March
June
August
September
2005October
November
December
2006February
March
June
August
September
DRY
DRY
DRY
NOT FLOWING
NOT FLOWING
n=58
n=68
n=37
n=10
n=113
n=149
n=60
n=25
n=0
n=22
n=49
Figure 28 Length‐frequency distributions of the Western Minnow captured in Layman Brook and McAtee Brook separated by downstream and upstream movement.

54
log10 mean discharge (M3/sec)
-1.4 -1.2 -1.0 -0.8 -0.6 -0.4 -0.2 0.0
log1
0 m
ean
frequ
ency
of f
ish
0.6
0.7
0.8
0.9
1.0
1.1
1.2
1.3log10N = 0.39*log10D + 1.19r2 = 0.91
Figure 29 Relationship between the mean strength of upstream migration of Western
Minnows within the major flow period (August and December) and the mean discharge in the four tributaries during that period. N.B. Data were log10 transformed and migration was standardised for effort, see text for details.
log10 mean discharge (M3/sec)
-1.4 -1.2 -1.0 -0.8 -0.6 -0.4 -0.2 0.0
log1
0 m
ean
frequ
ency
of f
ish
0.6
0.8
1.0
1.2
1.4
1.6
1.8
2.0log10N = 0.74*log10D + 1.89r2 = 0.95
Figure 30 Relationship between the mean strength of downstream migration of Western Minnows within the major flow period (August to December) and the mean discharge in the four tributaries during that period. N.B. Data were log10 transformed and migration was standardised for effort, see text for details.
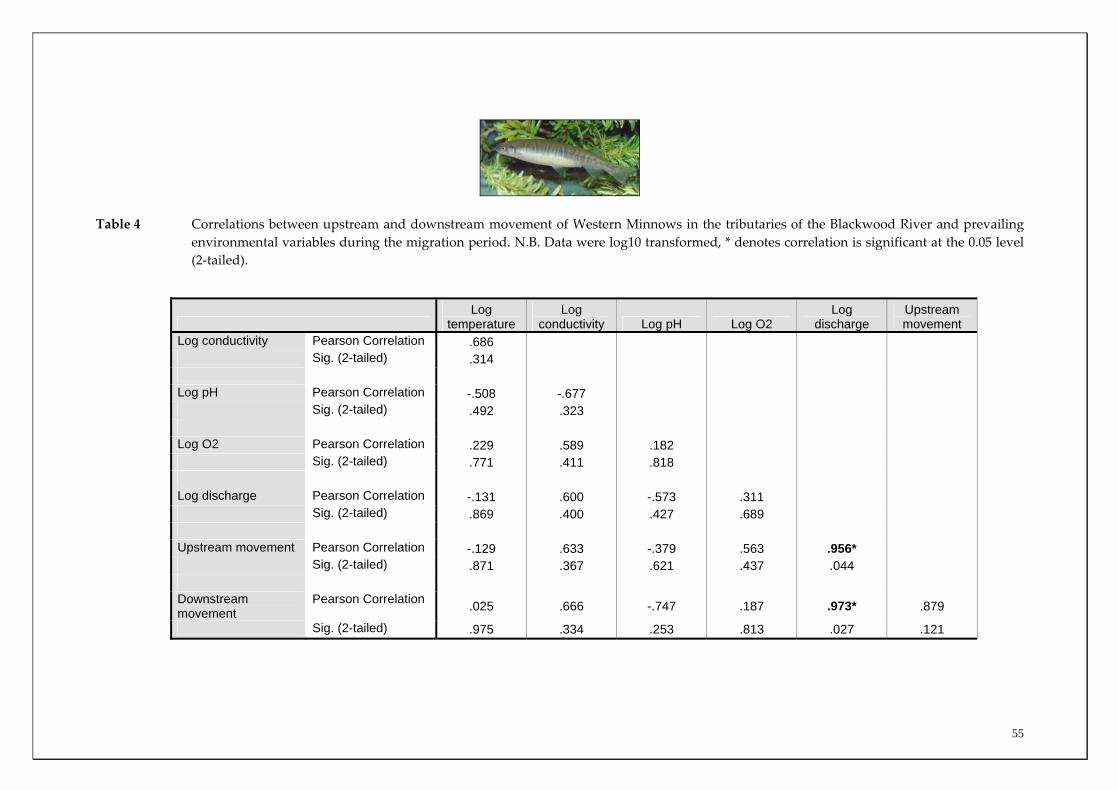
55
Table 4 Correlations between upstream and downstream movement of Western Minnows in the tributaries of the Blackwood River and prevailing environmental variables during the migration period. N.B. Data were log10 transformed, * denotes correlation is significant at the 0.05 level (2‐tailed).
Log
temperature Log
conductivity Log pH Log O2 Log
discharge Upstream movement
Log conductivity Pearson Correlation .686 Sig. (2-tailed) .314 Log pH Pearson Correlation -.508 -.677 Sig. (2-tailed) .492 .323 Log O2 Pearson Correlation .229 .589 .182 Sig. (2-tailed) .771 .411 .818 Log discharge Pearson Correlation -.131 .600 -.573 .311 Sig. (2-tailed) .869 .400 .427 .689 Upstream movement Pearson Correlation -.129 .633 -.379 .563 .956* Sig. (2-tailed) .871 .367 .621 .437 .044 Downstream movement
Pearson Correlation .025 .666 -.747 .187 .973* .879
Sig. (2-tailed) .975 .334 .253 .813 .027 .121

56
Mud Minnow
Habitat associations The Mud Minnow was only captured in the tributaries of the Blackwood River (Appendix 2) and therefore isolation of the populations in these systems may be occurring with the main channel effectively acting as a salt barrier to population mixing; however, this requires further investigation. It was recorded in Poison Gully, Milyeannup Brook, Rosa Brook and McAtee Brook; however, not in Layman’s Brook (Appendix 2). This suggests that this species prefers tributaries with either permanent (Milyeannup Brook and Psoin Gully) or extended (Rosa Brook and McAtee Brook; that both have substantial remnant pools when they cease to flow) flow periods. Mud Minnows naturally exist in low abundances compared to other native species (such as the Western Minnow) as was the case in this study with the species being recorded in lower numbers than any other native freshwater fish; and only 90 individuals being captured. Morgan & Beatty (2005) also reported this species in St John Brook and Red Gully. The upper reaches of Rosa Brook, which receive Leederville Aquifer discharge, are a known refuge for the species in that system (Morgan et al. 2004a). Migration patterns Due to the relatively low numbers of Mud Minnows, there were few clear obvious trends in the movement patterns of this species in these systems (Figure 31). The largest numbers recorded in fyke nets were in Milyeannup Brook where, on average, ~12 and six fish were recorded moving downstream per day in October and November, respectively (Figure 32). These fish were small fish that had recently metamorphosed suggesting that upstream habitats of Milyeannup Brook was utilised for spawning and that a downstream migration of recruits was occurring. This species is known to have a one year lifecycle (Pen et al. 1991) and in the case of Rosa Brook, the breeding period is between August and October (Morgan et al. 2004).
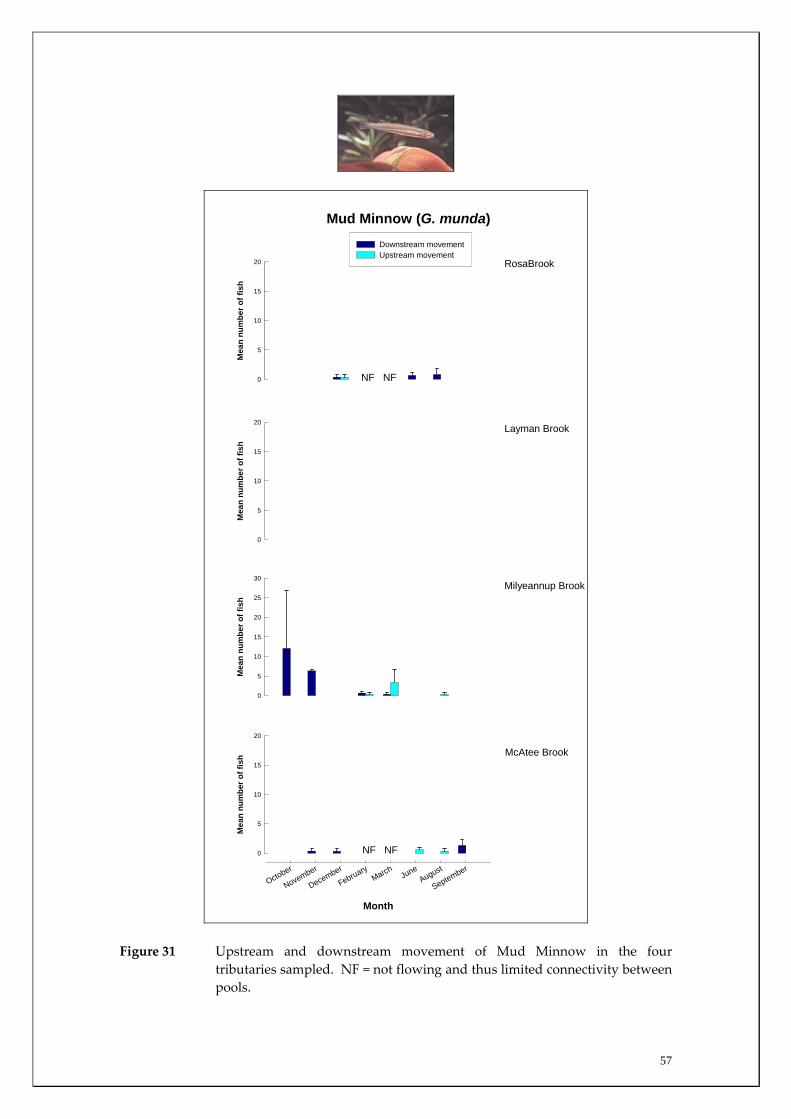
57
Mea
n nu
mbe
r of f
ish
0
5
10
15
20
Downstream movementUpstream movement
Mea
n nu
mbe
r of f
ish
0
5
10
15
20
RosaBrook
Layman Brook
Mea
n nu
mbe
r of f
ish
0
5
10
15
20
25
30Milyeannup Brook
Month
October
November
December
FebruaryMarch
JuneAugust
September
Mea
n nu
mbe
r of f
ish
0
5
10
15
20
McAtee Brook
Mud Minnow (G. munda)
NF NF
NF NF
Figure 31 Upstream and downstream movement of Mud Minnow in the four tributaries sampled. NF = not flowing and thus limited connectivity between pools.

58
0
2
4
6
8
10DownstreamUpstream
0
2
4
6
8
10
0
2
4
6
8
10
Rosa Brook
Num
ber o
f Fis
h
0
2
4
6
8
10
0
2
4
6
8
10
0
2
4
6
8
10
0
2
4
6
8
10
Total Length (mm)
0 10 20 30 40 50 60 70 80 90 100
110
120
130
140
150
160
0
2
4
6
8
10
0
2
4
6
8
10DownstreamUpstream
0
2
4
6
8
10
0
2
4
6
8
10
Milyeannup Brook
Num
ber o
f Fis
h
0
2
4
6
8
10
0
2
4
6
8
10
0
2
4
6
8
10
0
2
4
6
8
10
Total Length (mm)0 10 20 30 40 50 60 70 80 90
100110
120130
140150
1600
2
4
6
8
10
2005October
November
December
2006February
March
June
August
September
2005October
November
December
2006February
March
June
August
September
Mud minnow (Galaxiella munda)
NOT FLOWING
NOT FLOWING
n=0
n=0
n=2
n=2
n=2
n=0
n=15
n=18
n=0
n=0
n=1
n=0
n=3
n=10
Figure 32 Length‐frequency distributions of Mud Minnow captured in Rosa Brook and Milyeannup Brook separated on downstream and upstream movement.

59
Balston’s Pygmy Perch
Habitat associations Balston’s Pygmy Perch is the most restricted fish species found within the Blackwood River catchment and has recently (2006) been listed as Vulnerable under the EPBC Act and listed by CALM as Schedule 1 (Wildlife Conservation Act, 1950). Balston’s Pygmy Perch was effectively only captured within Milyeannup Brook with 3160 of the 3177 fish (or 99.46%) being recorded in this stream; many of these juveniles with the base population found to be much less much less (see section Milyeannup Brook Case Study) (Figure 33, Appendix 2). Thus, Milyeannup Brook is the crucial refuge habitat for this species in the Blackwood River catchment; probably due to the consistency of suitable available habitat facilitated by the permanency of flow due to groundwater discharge in this system. Four individuals were captured in McAtee Brook during August 2006; while a further 13 fish were captured in Milyeannup Pool near the mouth of Milyeannup Brook. The lengths recorded for this species in Milyeannup Brook were considerably greater than has previously been reported for the species (see Morgan et al. 1995). The length‐frequency distribution of this species suggest that the modal length of the fish captured in August (50‐70 mm TL) are likely to be 1 year old; while those fish greater than 70 mm TL are most likely at the end of their second or third year of life (Figure 34). The relatively high longevity of the Milyeannup Brook population contrasts with those elsewhere that have only been found to live for just over one year (see Morgan et al. 1995). Migration patterns The major upstream migration of adult Balston’s Pygmy Perch in Milyeannup Brook occurred during winter (i.e. August) with considerable downstream movement of presumably spent (recently spawned) adults in August and September and downstream migration of juveniles occurring in November and December (Figure 33). The upstream migration period in Milyeannup Brook coincided with the known spawning period of the species (Morgan et al. 1995) with the lengths recorded here being ~50‐95 mm TL; i.e. adults fish.
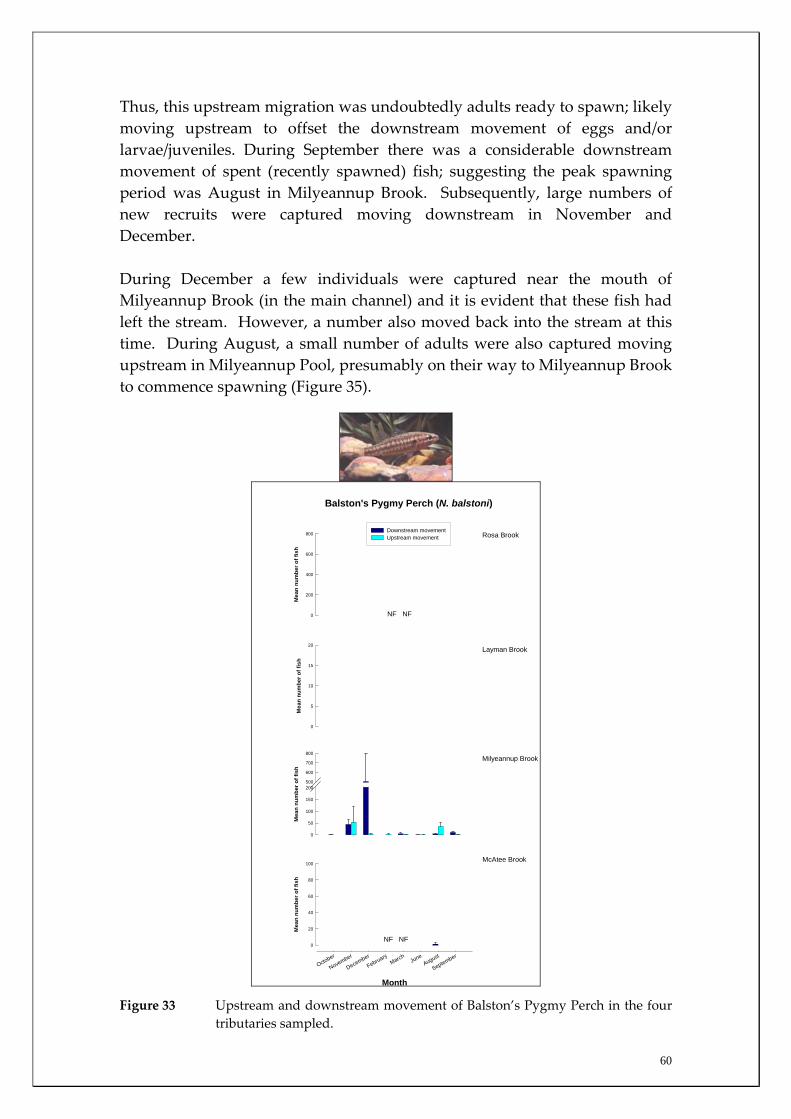
60
Thus, this upstream migration was undoubtedly adults ready to spawn; likely moving upstream to offset the downstream movement of eggs and/or larvae/juveniles. During September there was a considerable downstream movement of spent (recently spawned) fish; suggesting the peak spawning period was August in Milyeannup Brook. Subsequently, large numbers of new recruits were captured moving downstream in November and December. During December a few individuals were captured near the mouth of Milyeannup Brook (in the main channel) and it is evident that these fish had left the stream. However, a number also moved back into the stream at this time. During August, a small number of adults were also captured moving upstream in Milyeannup Pool, presumably on their way to Milyeannup Brook to commence spawning (Figure 35).
Mea
n nu
mbe
r of f
ish
0
200
400
600
800Downstream movementUpstream movement
Mea
n nu
mbe
r of f
ish
0
5
10
15
20
Rosa Brook
Layman Brook
Mea
n nu
mbe
r of f
ish
0
50
100
150
200500
600
700
800Milyeannup Brook
Month
October
November
December
FebruaryMarch
JuneAugust
September
Mea
n nu
mbe
r of f
ish
0
20
40
60
80
100McAtee Brook
Balston's Pygmy Perch (N. balstoni)
NF NF
NF NF
Figure 33 Upstream and downstream movement of Balston’s Pygmy Perch in the four
tributaries sampled.
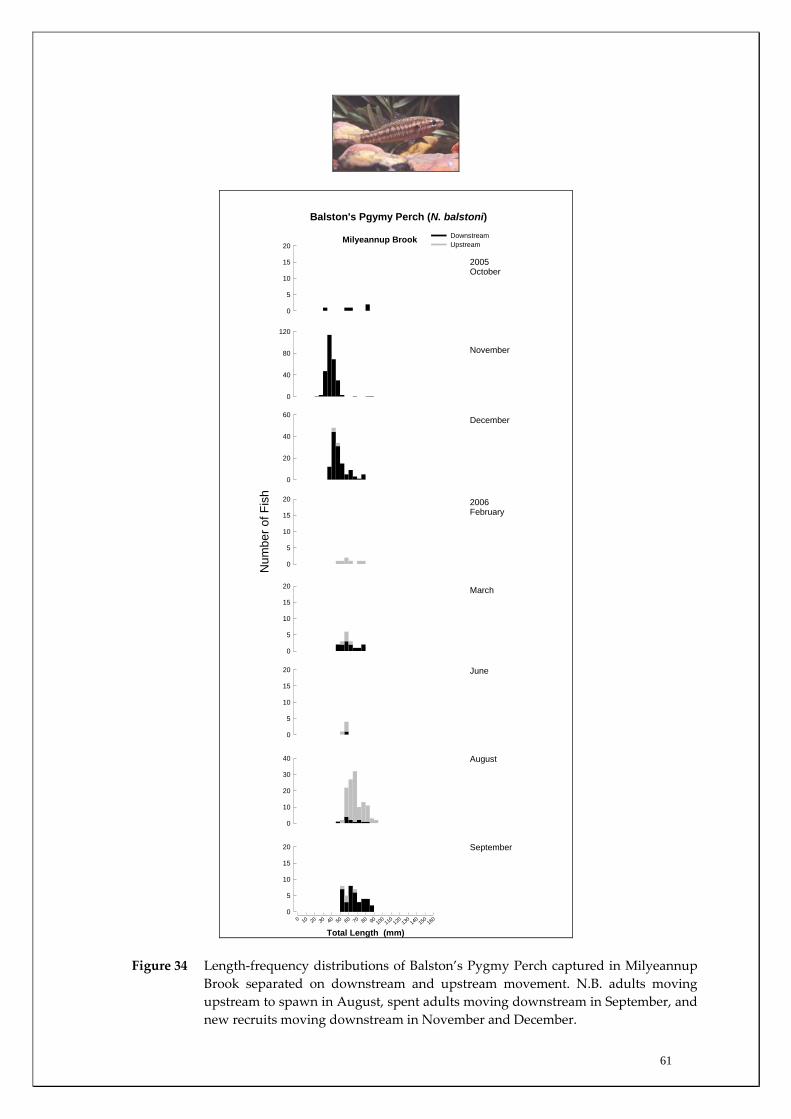
61
0
5
10
15
20DownstreamUpstream
0
40
80
120
0
20
40
60
Milyeannup Brook
Num
ber o
f Fis
h
0
5
10
15
20
0
5
10
15
20
0
5
10
15
20
0
10
20
30
40
Total Length (mm)0 10 20 30 40 50 60 70 80 90
100110
120130
140150
1600
5
10
15
20
2005October
November
December
2006February
March
June
August
September
Balston's Pgymy Perch (N. balstoni)
Figure 34 Length‐frequency distributions of Balston’s Pygmy Perch captured in Milyeannup
Brook separated on downstream and upstream movement. N.B. adults moving upstream to spawn in August, spent adults moving downstream in September, and new recruits moving downstream in November and December.

62
Mea
n nu
mbe
r of f
ish
0
20
40
60
80
100Downstream movementUpstream movement
Mea
n nu
mbe
r of f
ish
0
20
40
60
80
100
Denny Road
Milyeannup Pool
Mea
n nu
mbe
r of f
ish
0
20
40
60
80
100Jalbarragup
Month
October
November
December
FebruaryMarch
JuneAugust
September
Mea
n nu
mbe
r of f
ish
0
20
40
60
80
100 Quigup
Baltston's Pgymy Perch (N. balstoni)
NS NS
NS NS
Figure 35 Upstream and downstream movement of Balston’s Pygmy Perch in the four main channel sites sampled.
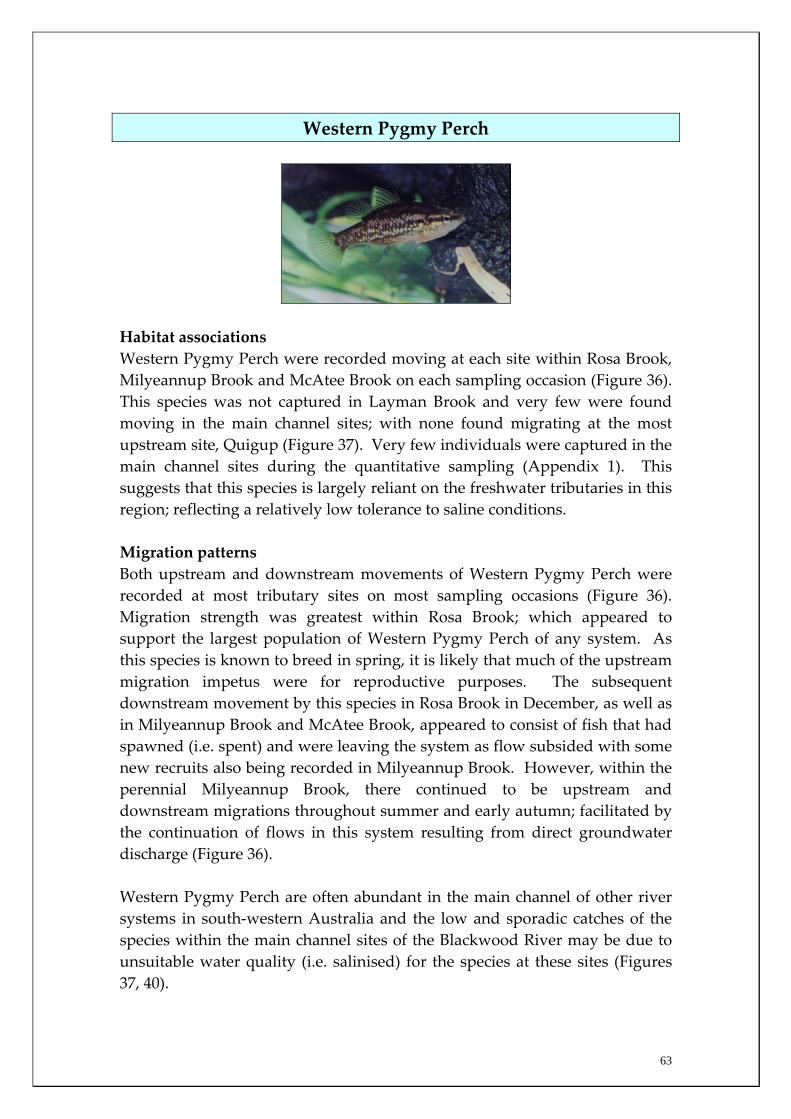
63
Western Pygmy Perch
Habitat associations Western Pygmy Perch were recorded moving at each site within Rosa Brook, Milyeannup Brook and McAtee Brook on each sampling occasion (Figure 36). This species was not captured in Layman Brook and very few were found moving in the main channel sites; with none found migrating at the most upstream site, Quigup (Figure 37). Very few individuals were captured in the main channel sites during the quantitative sampling (Appendix 1). This suggests that this species is largely reliant on the freshwater tributaries in this region; reflecting a relatively low tolerance to saline conditions. Migration patterns Both upstream and downstream movements of Western Pygmy Perch were recorded at most tributary sites on most sampling occasions (Figure 36). Migration strength was greatest within Rosa Brook; which appeared to support the largest population of Western Pygmy Perch of any system. As this species is known to breed in spring, it is likely that much of the upstream migration impetus were for reproductive purposes. The subsequent downstream movement by this species in Rosa Brook in December, as well as in Milyeannup Brook and McAtee Brook, appeared to consist of fish that had spawned (i.e. spent) and were leaving the system as flow subsided with some new recruits also being recorded in Milyeannup Brook. However, within the perennial Milyeannup Brook, there continued to be upstream and downstream migrations throughout summer and early autumn; facilitated by the continuation of flows in this system resulting from direct groundwater discharge (Figure 36). Western Pygmy Perch are often abundant in the main channel of other river systems in south‐western Australia and the low and sporadic catches of the species within the main channel sites of the Blackwood River may be due to unsuitable water quality (i.e. salinised) for the species at these sites (Figures 37, 40).
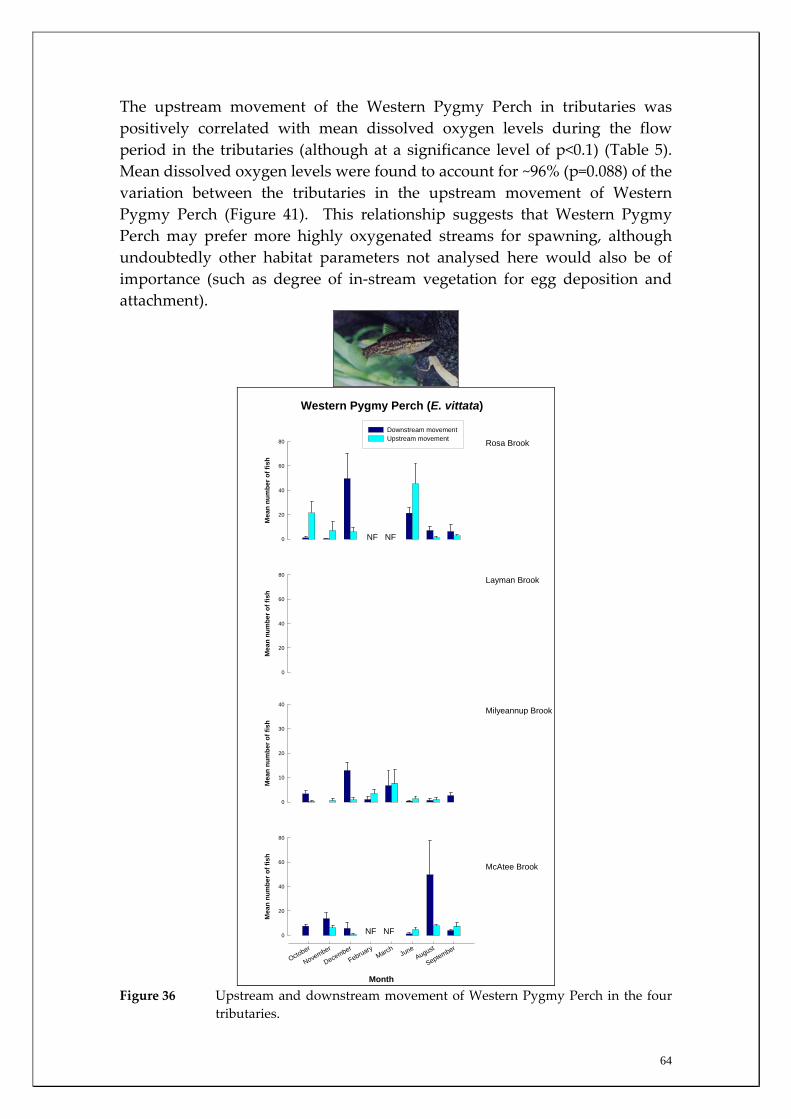
64
The upstream movement of the Western Pygmy Perch in tributaries was positively correlated with mean dissolved oxygen levels during the flow period in the tributaries (although at a significance level of p<0.1) (Table 5). Mean dissolved oxygen levels were found to account for ~96% (p=0.088) of the variation between the tributaries in the upstream movement of Western Pygmy Perch (Figure 41). This relationship suggests that Western Pygmy Perch may prefer more highly oxygenated streams for spawning, although undoubtedly other habitat parameters not analysed here would also be of importance (such as degree of in‐stream vegetation for egg deposition and attachment).
Mea
n nu
mbe
r of f
ish
0
20
40
60
80
Downstream movementUpstream movement
Mea
n nu
mbe
r of f
ish
0
20
40
60
80
Rosa Brook
Layman Brook
Mea
n nu
mbe
r of f
ish
0
10
20
30
40Milyeannup Brook
Month
October
November
December
FebruaryMarch
JuneAugust
September
Mea
n nu
mbe
r of f
ish
0
20
40
60
80
McAtee Brook
Western Pygmy Perch (E. vittata)
NF NF
NF NF
Figure 36 Upstream and downstream movement of Western Pygmy Perch in the four
tributaries.
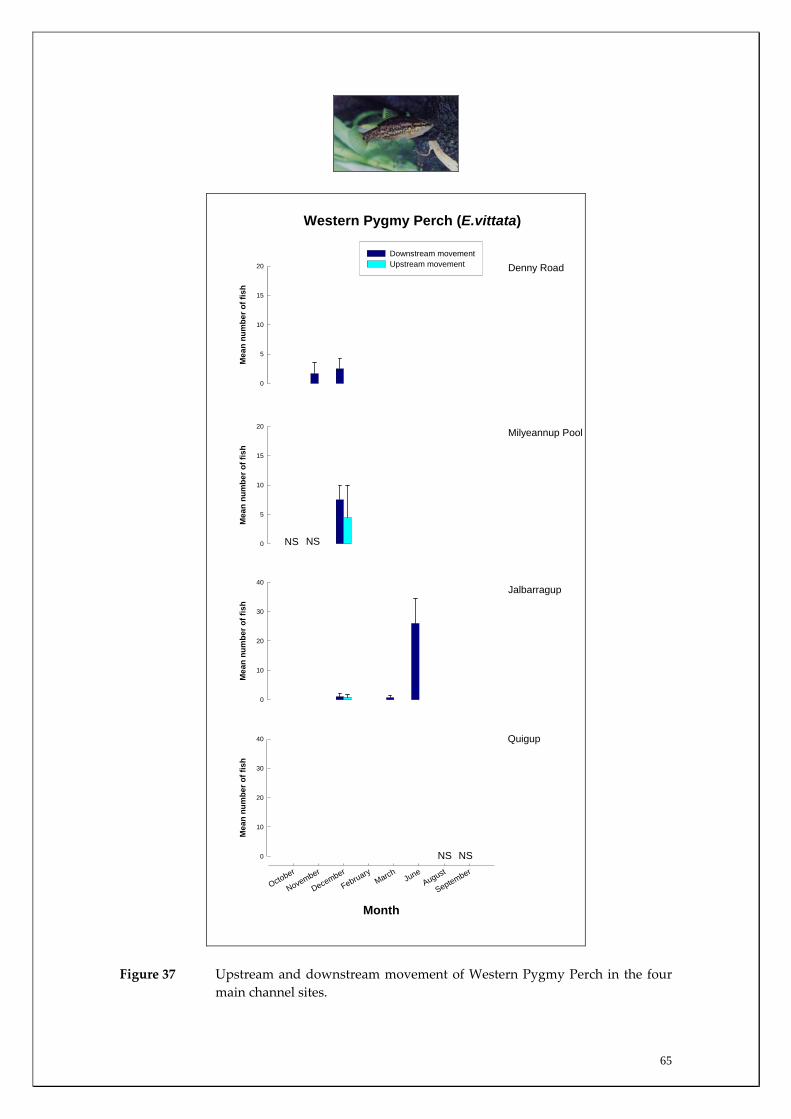
65
Mea
n nu
mbe
r of f
ish
0
5
10
15
20
Downstream movementUpstream movement
Mea
n nu
mbe
r of f
ish
0
5
10
15
20
Denny Road
Milyeannup Pool
Mea
n nu
mbe
r of f
ish
0
10
20
30
40Jalbarragup
Month
October
November
December
FebruaryMarch
JuneAugust
September
Mea
n nu
mbe
r of f
ish
0
10
20
30
40 Quigup
Western Pygmy Perch (E.vittata)
NS NS
NS NS
Figure 37 Upstream and downstream movement of Western Pygmy Perch in the four main channel sites.
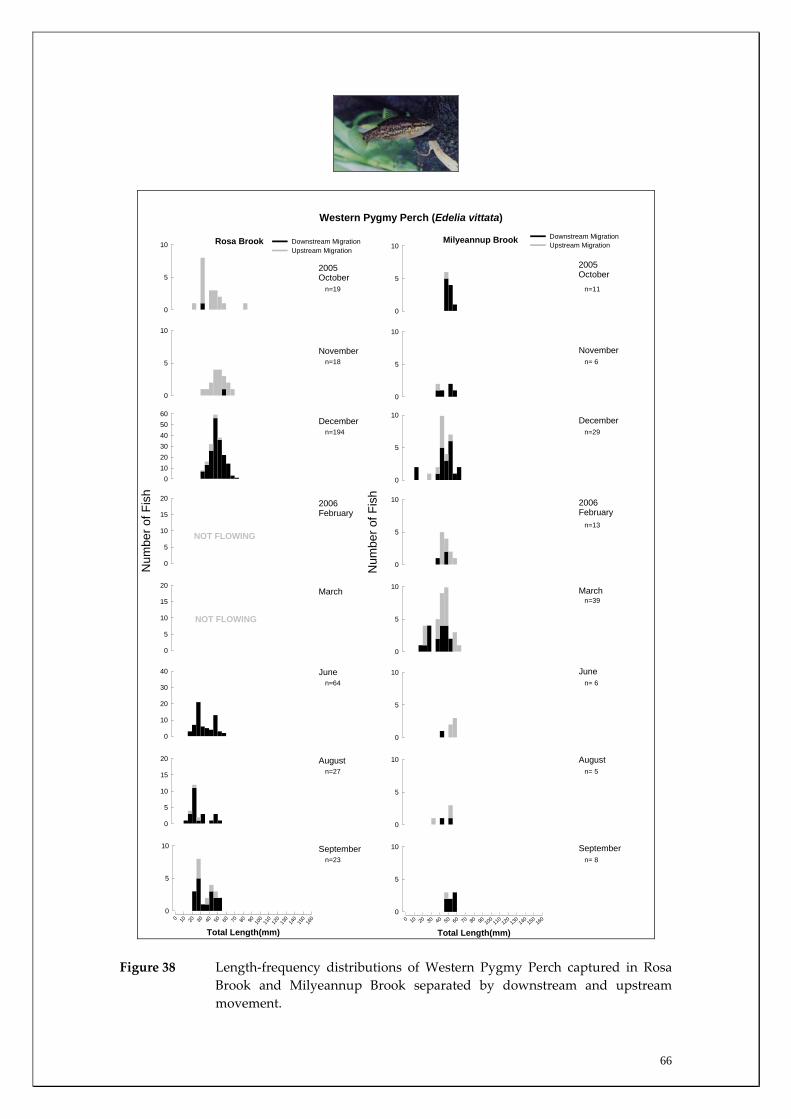
66
0
5
10 Downstream MigrationUpstream Migration
0
5
10
0102030405060
Rosa Brook
Num
ber o
f Fis
h
0
5
10
15
20
0
5
10
15
20
0
10
20
30
40
0
5
10
15
20
Total Length(mm)
0 10 20 30 40 50 60 70 80 90 100
110
120
130
140
150
160
0
5
10
0
5
10Downstream MigrationUpstream Migration
0
5
10
0
5
10
Milyeannup Brook
Num
ber o
f Fis
h
0
5
10
0
5
10
0
5
10
0
5
10
Total Length(mm)0 10 20 30 40 50 60 70 80 90 10
0110
120 130 140 150
160
0
5
10
2005October
November
December
2006February
March
June
August
September
2005October
November
December
2006February
March
June
August
September
Western Pygmy Perch (Edelia vittata)
NOT FLOWING
NOT FLOWING
n=19
n=18
n=194
n=64
n=27
n=23
n=11
n= 6
n=29
n= 6
n= 5
n= 8
n=13
n=39
Figure 38 Length‐frequency distributions of Western Pygmy Perch captured in Rosa
Brook and Milyeannup Brook separated by downstream and upstream movement.

67
0
5
10
0
5
10
15
20
0
5
10
McAtee Brook
Num
ber o
f Fis
h
0
5
10
15
20
0
5
10
15
20
0
5
10
0
10
20
30
40
50
Total Length (mm)
0 10 20 30 40 50 60 70 80 90 100
110
120
130
140
150
160
0
5
10
15
20
Western Pygmy Perch (Edelia vittata)
2005October
November
December
2006February
March
June
August
September
n=12
n=54
n=19
n=18
n=155
n=34
NOT FLOWING
NOT FLOWING
DownstreamUpstream
Figure 39 Length‐frequency distributions of Western Pygmy Perch captured in McAtee Brook separated by downstream and upstream movement.
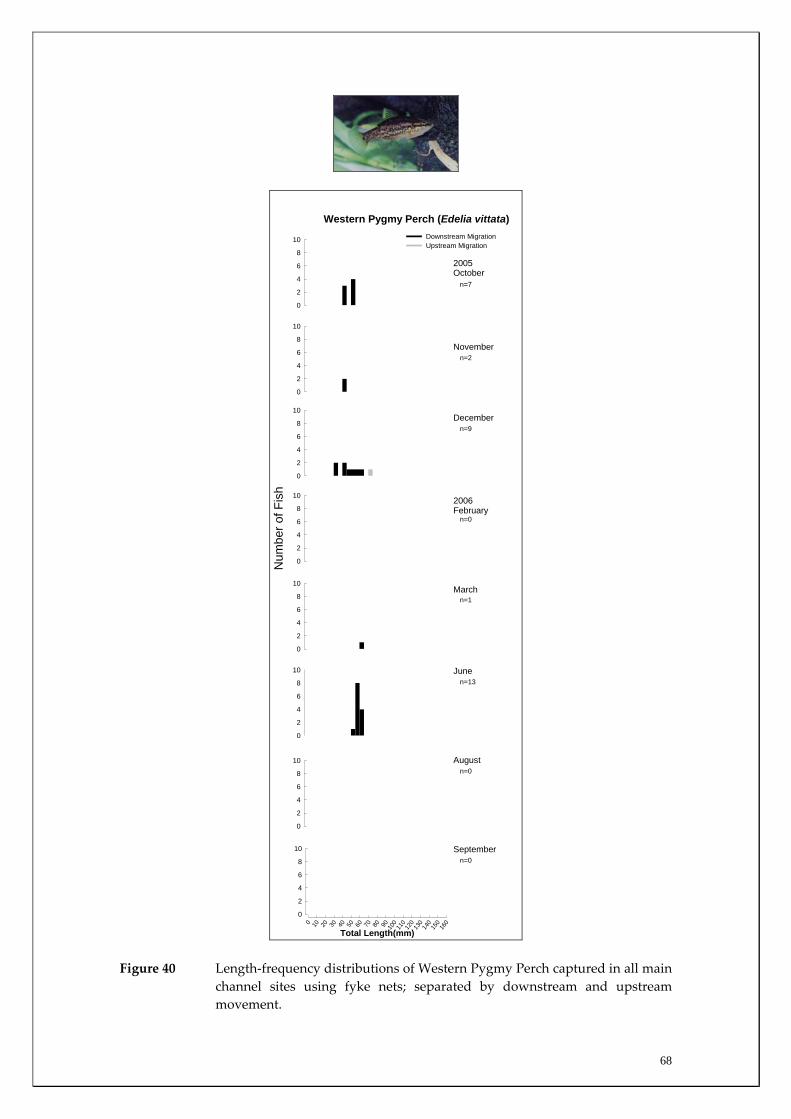
68
0
2
4
6
8
10 Downstream MigrationUpstream Migration
0
2
4
6
8
10
0
2
4
6
8
10
Num
ber o
f Fis
h
0
2
4
6
8
10
0
2
4
6
8
10
0
2
4
6
8
10
0
2
4
6
8
10
Total Length(mm)
0 10 20 30 40 50 60 70 80 90 100
110
120
130
140
150
160
0
2
4
6
8
10
2005October
November
December
2006February
March
June
August
September
Western Pygmy Perch (Edelia vittata)
n=7
n=2
n=9
n=13
n=0
n=0
n=0
n=1
Figure 40 Length‐frequency distributions of Western Pygmy Perch captured in all main channel sites using fyke nets; separated by downstream and upstream movement.
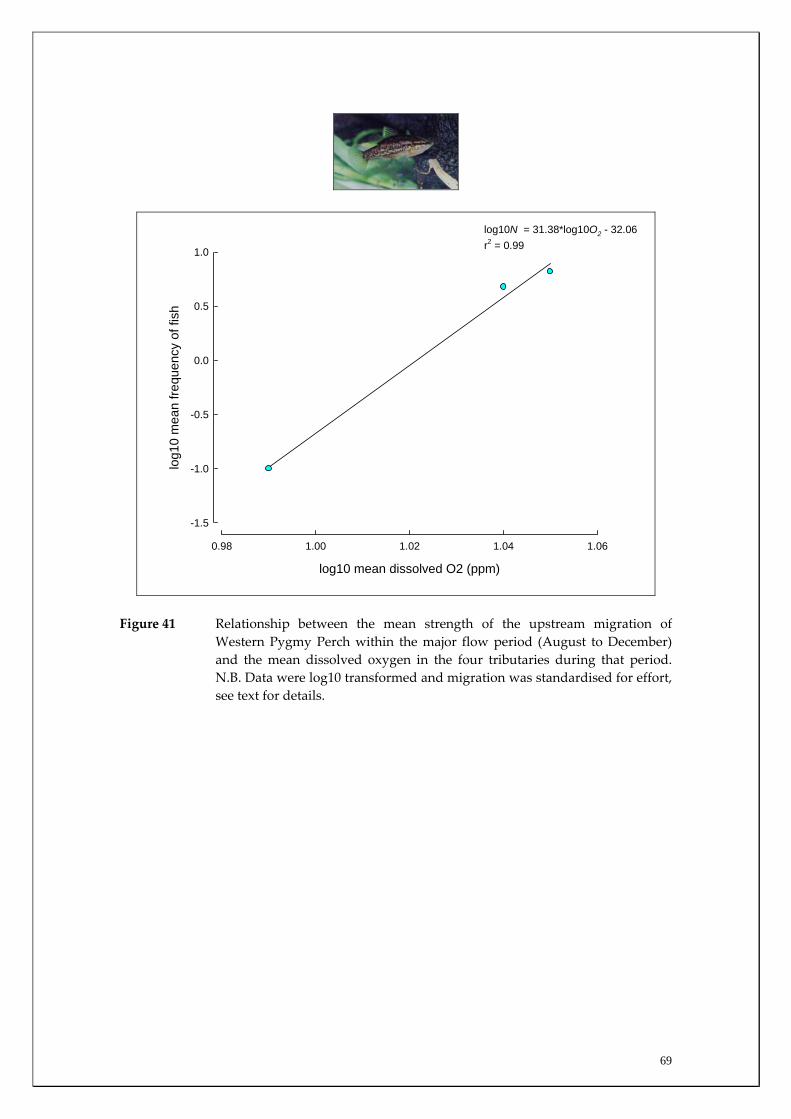
69
log10 mean dissolved O2 (ppm)
0.98 1.00 1.02 1.04 1.06
log1
0 m
ean
frequ
ency
of f
ish
-1.5
-1.0
-0.5
0.0
0.5
1.0
log10N = 31.38*log10O2 - 32.06r2 = 0.99
Figure 41 Relationship between the mean strength of the upstream migration of Western Pygmy Perch within the major flow period (August to December) and the mean dissolved oxygen in the four tributaries during that period. N.B. Data were log10 transformed and migration was standardised for effort, see text for details.

70
Table 5 Correlations between upstream and downstream movement of Western Pygmy Perch in the tributaries of the Blackwood River and prevailing environmental variables during the migration period. N.B. Data were log10 transformed.
Log
temperature Log
conductivity Log pH Log O2 Log
discharge Upstream movement
Log conductivity Pearson Correlation .686 Sig. (2-tailed) .314 Log pH Pearson Correlation -.508 -.677 Sig. (2-tailed) .492 .323 Log O2 Pearson Correlation .229 .589 .182 Sig. (2-tailed) .771 .411 .818 Log discharge Pearson Correlation -.131 .600 -.573 .311 Sig. (2-tailed) .869 .400 .427 .689 Upstream movement Pearson Correlation .354 .868 .406 .991 .422 Sig. (2-tailed) .769 .330 .734 .088 .722 Downstream movement
Pearson Correlation .493 .934 .262 .958 .279 .988
Sig. (2-tailed) .672 .233 .831 .185 .820 .098

71
Nightfish
Habitat associations The Nightfish was almost exclusively captured within the tributaries of the Blackwood River, which accounted for 99% of captures of this species (Figure 42, Appendix 2). As with the Western Pygmy Perch, the species therefore appears to be largely intolerant of conditions in the main channel of the Blackwood River and is reliant on tributary habitats; particularly with regards to spawning and recruitment. Migration patterns The highest numbers of Nightfish captured in fyke nets were from Layman Brook (629), largely as a consequence of a mass exodus of juveniles (10‐20 mm TL) from this system during December (Figure 42). Similar movements were also recorded within Milyeannup Brook and Rosa Brook. The downstream migration is presumably a response to a reduction in discharge at that time with associated water level and habitat decline. Upstream migrations were more ambiguous, however in most systems there were relatively weak upstream migrations in winter and early spring. There is evidence for an earlier and more protracted spawning (and recruitment) period of Nightfish in Milyeannup Brook as larger sizes of the migrating juveniles were recorded in this tributary in December. For example, within Milyeannup Brook these new recruits ranged in length from 10‐39 mm TL in this month, compared with 10‐24 mm TL in Rosa Brook and Layman Brook (Figures 43, 44). Migration patterns within the main channel were sporadic, however the majority of fish captured in fyke nets were moving downstream in most months (Figure 45). The only upstream movements of fish were from those few individuals captured in March, June and August; the latter months being prior to its breeding period (Figures 45, 46).
Nightfish upstream movement was positively correlated with mean dissolved oxygen levels during the flow period in the tributaries (Figure 47, Table 6). Mean dissolved oxygen levels in the tributaries were found to account for ~99% (p=0.001) of the variation between the tributaries in the upstream
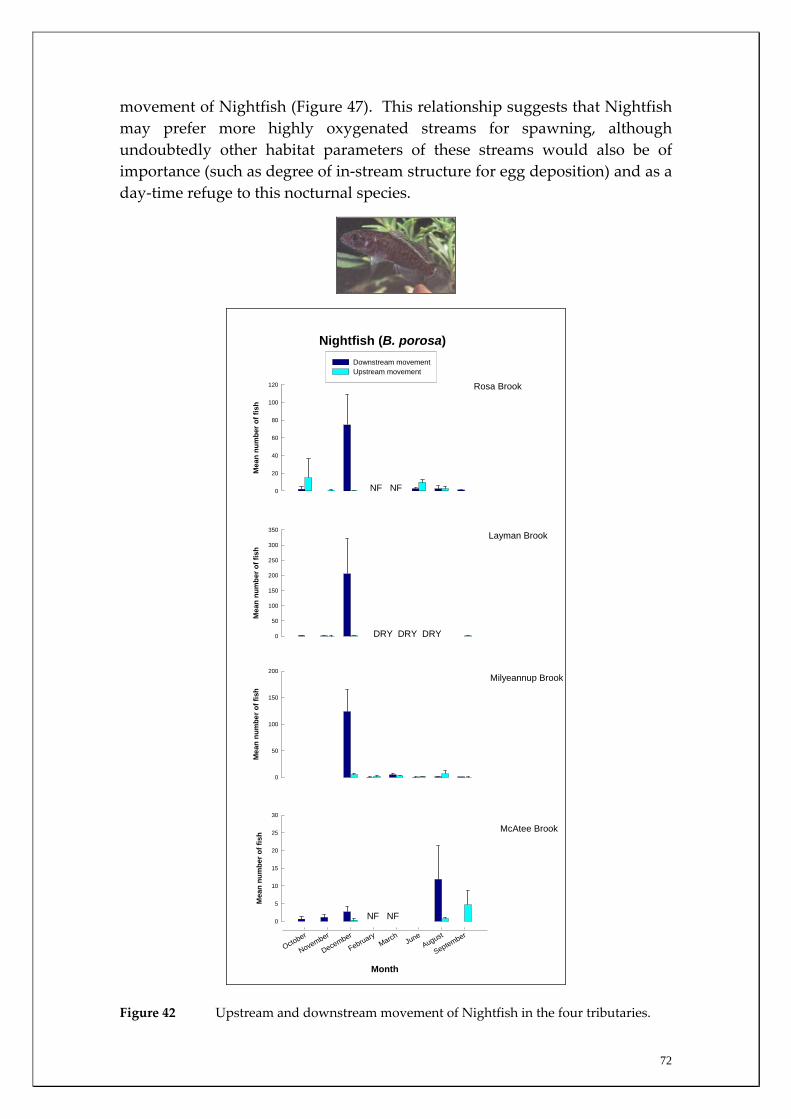
72
movement of Nightfish (Figure 47). This relationship suggests that Nightfish may prefer more highly oxygenated streams for spawning, although undoubtedly other habitat parameters of these streams would also be of importance (such as degree of in‐stream structure for egg deposition) and as a day‐time refuge to this nocturnal species.
Mea
n nu
mbe
r of f
ish
0
20
40
60
80
100
120
Downstream movementUpstream movement
Mea
n nu
mbe
r of f
ish
0
50
100
150
200
250
300
350
Rosa Brook
Layman Brook
Mea
n nu
mbe
r of f
ish
0
50
100
150
200Milyeannup Brook
Month
October
November
December
FebruaryMarch
JuneAugust
September
Mea
n nu
mbe
r of f
ish
0
5
10
15
20
25
30
McAtee Brook
Nightfish (B. porosa)
DRY DRY DRY
NF NF
NF NF
Figure 42 Upstream and downstream movement of Nightfish in the four tributaries.
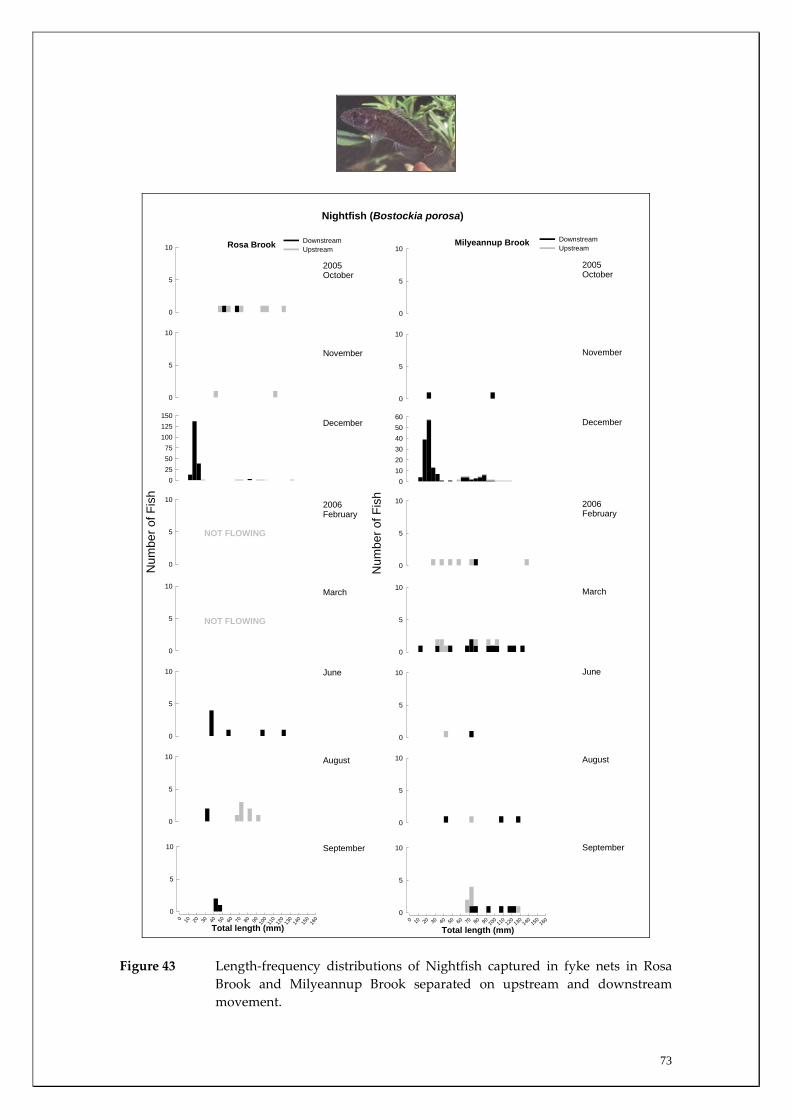
73
0
5
10DownstreamUpstream
0
5
10
0255075
100125150
Rosa Brook
Num
ber o
f Fis
h
0
5
10
0
5
10
0
5
10
0
5
10
Total length (mm)
0 10 20 30 40 50 60 70 80 90 100
110
120
130
140
150
160
0
5
10
0
5
10DownstreamUpstream
0
5
10
0102030405060
Milyeannup Brook
Num
ber o
f Fis
h
0
5
10
0
5
10
0
5
10
0
5
10
Total length (mm)0 10 20 30 40 50 60 70 80 90
100110
120130
140150
1600
5
10
2005October
November
December
2006February
March
June
August
September
2005October
November
December
2006February
March
June
August
September
Nightfish (Bostockia porosa)
NOT FLOWING
NOT FLOWING
Figure 43 Length‐frequency distributions of Nightfish captured in fyke nets in Rosa Brook and Milyeannup Brook separated on upstream and downstream movement.

74
0
5
10 DownstreamUpstream
0
5
10
0
50
100
150
200
Layman Brook
Num
ber o
f Fis
h
0
5
10
0
5
10
0
5
10
0
5
10
Total length (mm)
0 10 20 30 40 50 60 70 80 90 100
110
120
130
140
150
160
0
5
10
0
5
10
0
5
10
0
5
10
McAtee Brook
Num
ber o
f Fis
h
0
5
10
0
5
10
0
5
10
0
5
10
Total length (mm)
0 10 20 30 40 50 60 70 80 90 100
110
120
130
140
150
160
0
5
10
DownstreamUpstream
Nightfish (Bostockia porosa)
2005October
November
December
2006February
March
June
August
September
2005October
November
December
2006February
March
June
August
September
DRY
DRY
DRY
NOT FLOWING
NOT FLOWING
Figure 44 Length‐frequency distributions of Nightfish captured in fyke nets in Layman Brook and McAtee Brook separated by upstream and downstream movement.

75
Mea
n nu
mbe
r of f
ish
0
10
20
30
Downstream movementUpstream movement
Mea
n nu
mbe
r of f
ish
0
10
20
30
Denny Road
Milyeannup Pool
Mea
n nu
mbe
r of f
ish
0
10
20
30Jalbarragup
Month
October
November
December
FebruaryMarch
JuneAugust
September
Mea
n nu
mbe
r of f
ish
0
10
20
30 Quigup
Nightfish (B. porosa)
NS NS
NS NS
Figure 45 Upstream and downstream movement of Nightfish in the four main channel sites sampled.
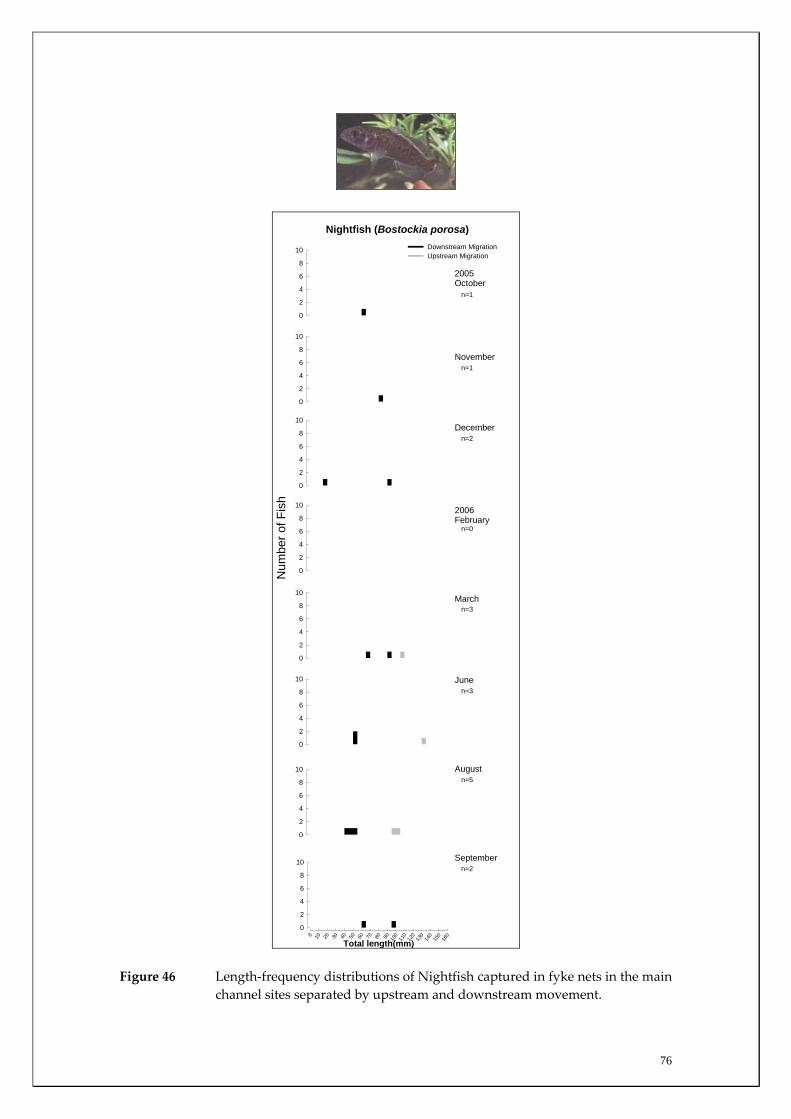
76
0
2
4
6
8
10 Downstream MigrationUpstream Migration
0
2
4
6
8
10
0
2
4
6
8
10
Num
ber o
f Fis
h
0
2
4
6
8
10
0
2
4
6
8
10
0
2
4
6
8
10
0
2
4
6
8
10
Total length(mm)
0 10 20 30 40 50 60 70 80 90 100
110
120
130
140
150
160
0
2
4
6
8
10
2005October
November
December
2006February
March
June
August
September
Nightfish (Bostockia porosa)
n=1
n=1
n=2
n=3
n=5
n=2
n=0
n=3
Figure 46 Length‐frequency distributions of Nightfish captured in fyke nets in the main channel sites separated by upstream and downstream movement.

77
log10 mean dissolved O2 (ppm)
0.98 1.00 1.02 1.04 1.06
log1
0 m
ean
frequ
ency
of f
ish
-1.2
-1.0
-0.8
-0.6
-0.4
-0.2
0.0
0.2
0.4
0.6
log10N = 23.49*log10O2 - 24.30r2 = 0.98
Figure 47 Relationship between the mean strength of upstream migration of Nightfish within the major flow period (August and December) and the mean dissolved oxygen in the four tributaries during that period. N.B. Data were log10 transformed and migration number was standardised for effort, see text for details.
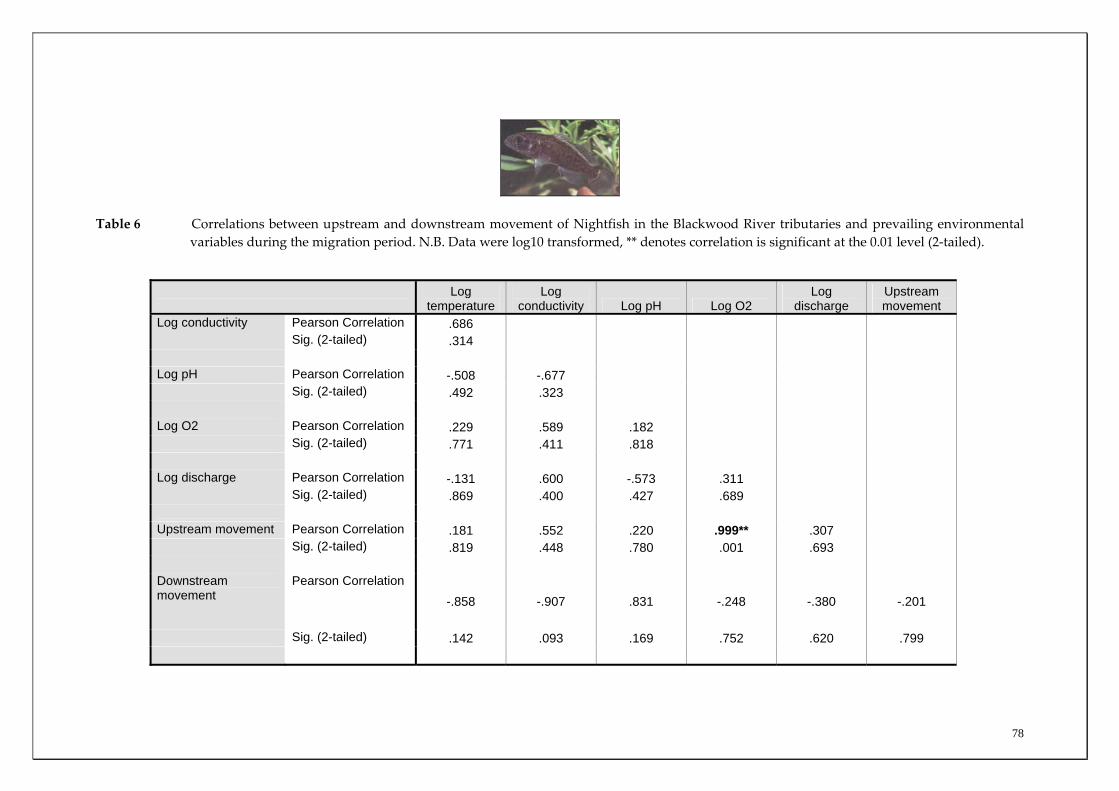
78
Table 6 Correlations between upstream and downstream movement of Nightfish in the Blackwood River tributaries and prevailing environmental variables during the migration period. N.B. Data were log10 transformed, ** denotes correlation is significant at the 0.01 level (2‐tailed).
Log
temperature Log
conductivity Log pH Log O2 Log
discharge Upstream movement
Log conductivity Pearson Correlation .686 Sig. (2-tailed) .314 Log pH Pearson Correlation -.508 -.677 Sig. (2-tailed) .492 .323 Log O2 Pearson Correlation .229 .589 .182 Sig. (2-tailed) .771 .411 .818 Log discharge Pearson Correlation -.131 .600 -.573 .311 Sig. (2-tailed) .869 .400 .427 .689 Upstream movement Pearson Correlation .181 .552 .220 .999** .307 Sig. (2-tailed) .819 .448 .780 .001 .693 Downstream movement
Pearson Correlation -.858 -.907 .831 -.248 -.380 -.201
Sig. (2-tailed) .142 .093 .169 .752 .620 .799

79
South‐western Goby
Habitat associations Although South‐western Goby is typically encountered within estuaries, during this study, it was most commonly recorded within most main channel sites; accounting for ~92% of captures of this species (Figure 48, Appendix 1). A small number of individuals of were also captured in the lower reaches of Milyeannup Brook (eight) and Rosa Brook (14) (Figure 51). This species is therefore largely reliant on the main channel habitats; an expected finding given it is a known estuarine species and the main channel has become salinised. Migration patterns In most months at the downstream main channel sites (receiving most groundwater discharge), the majority of South‐western Gobies were moving downstream (Figure 48). Downstream movement was greatest at the Denny Road site during February, when >100 fish/day were captured. These were largely small fish that were probably new recruits (10‐39 mm TL) (Figures 49, 50). The downstream movement of this cohort continued through to September, with a small proportion of these new recruits moving upstream in most months. An additional cohort of small fish entered the population in September; suggesting that a second spawning event may have occurred during 2006. The low catches within tributary sites compared to the main channel suggest that the tributaries have unfavourable conditions for this species. The downstream movement of fish within tributaries only occurred during late spring and early summer, and it is likely that these individuals were moving back to the main channel for breeding purposes. The general downstream trend in migration may be explained by the fact that the species is not reputed to have a strong swimming ability. This point is highlighted when, during summer and early autumn, there were greater movements upstream at the sites that had negligible discharge, i.e. the two sites that are upstream of the Yarragadee discharge (i.e. Jalbarragup and Quigup).
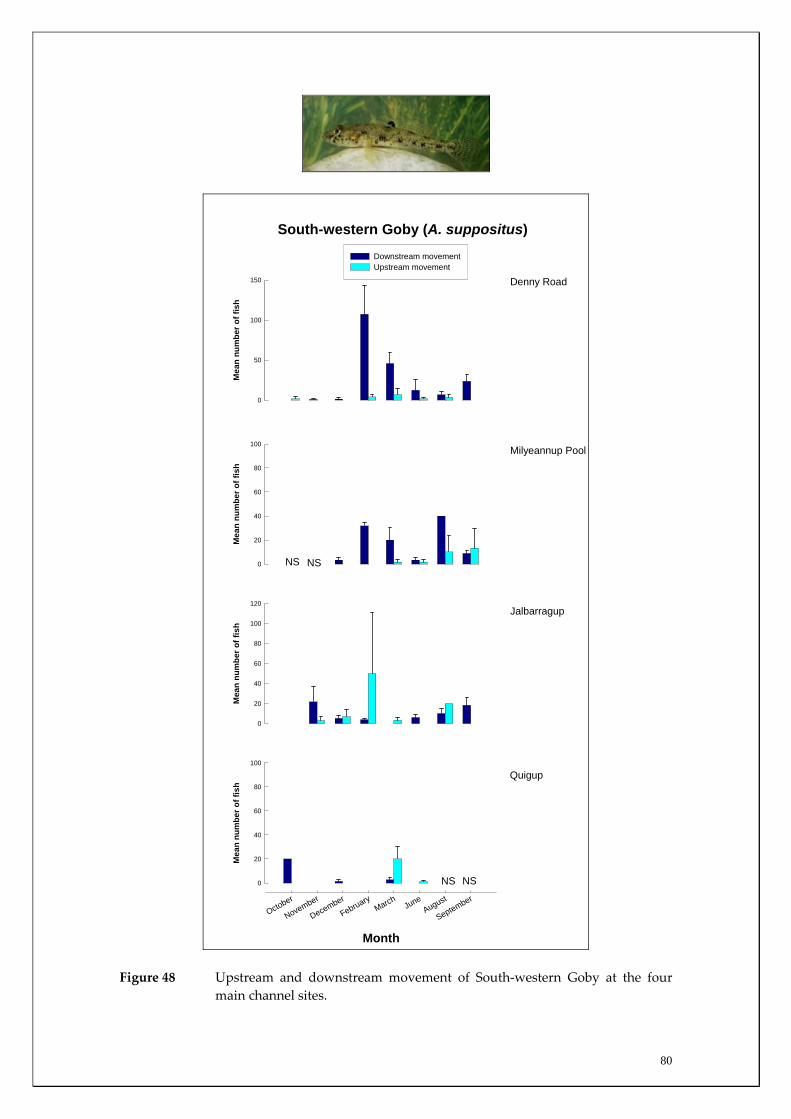
80
Mea
n nu
mbe
r of f
ish
0
50
100
150
Downstream movementUpstream movement
Mea
n nu
mbe
r of f
ish
0
20
40
60
80
100
Denny Road
Milyeannup Pool
Mea
n nu
mbe
r of f
ish
0
20
40
60
80
100
120Jalbarragup
Month
October
November
December
FebruaryMarch
JuneAugust
September
Mea
n nu
mbe
r of f
ish
0
20
40
60
80
100
Quigup
South-western Goby (A. suppositus)
NS NS
NS NS
Figure 48 Upstream and downstream movement of South‐western Goby at the four
main channel sites.

81
0
5
10 Downstream MigrationUpstream Migration
0
5
10
0
5
10
Num
ber o
f Fis
h
0
5
10
15
20
25
0
5
10
0
5
10
0
5
10
Total length (mm)
0 10 20 30 40 50 60 70 80 90 100
110
120
130
140
150
160
0
5
10
2005October
November
December
2006February
March
June
August
September
South-west Goby (A. suppositus)
n=6
n=12
n=13
n=13
n=19
n=38
n=96
n=44
Figure 49 Length‐frequency distributions of South‐western Goby captured in fyke nets in the main channel sites separated on upstream or downstream movement.

82
05
1015202530
Num
ber
of fi
sh
Total length (mm)
05
1015202530
05
1015202530
05
1015202530
05
1015202530
05
1015202530
05
1015202530
0 10 20 30 40 50 60 70 80 90 100
110
120
130
140
150
160
170
180
05
1015202530
2005October
November
December
2006February
March
June/July
August
September
Rosa Camp Site
0.0
2.5
5.0
7.5
10.0
Num
ber
of fi
sh
Total length (mm)
0.0
2.5
5.0
7.5
10.0
0.0
2.5
5.0
7.5
10.0
0.0
2.5
5.0
7.5
10.0
0.0
2.5
5.0
7.5
10.0
0.0
2.5
5.0
7.5
10.0
0.0
2.5
5.0
7.5
10.0
0 10 20 30 40 50 60 70 80 90 100
110
120
130
140
150
160
170
180
0.0
2.5
5.0
7.5
10.0
2005October
November
December
2006February
March
June/July
August
September
Milyeannup Pool
NS
NS
0
5
10
15
20
Num
ber
of fi
sh
Total length (mm)
0
5
10
15
20
0
5
10
15
20
0
5
10
15
20
0
5
10
15
20
0
5
10
15
20
0
5
10
15
20
0 10 20 30 40 50 60 70 80 90 100
110
120
130
140
150
160
170
180
0
5
10
15
20
2005October
November
December
2006February
March
June/July
August
September
Jalbarragup
Figure 50 Length‐frequency histograms of South‐western Goby captured using seine
nets and electrofishing at Jalbarragup, Milyeannup Pool and Denny Rd. NS = not sampled.
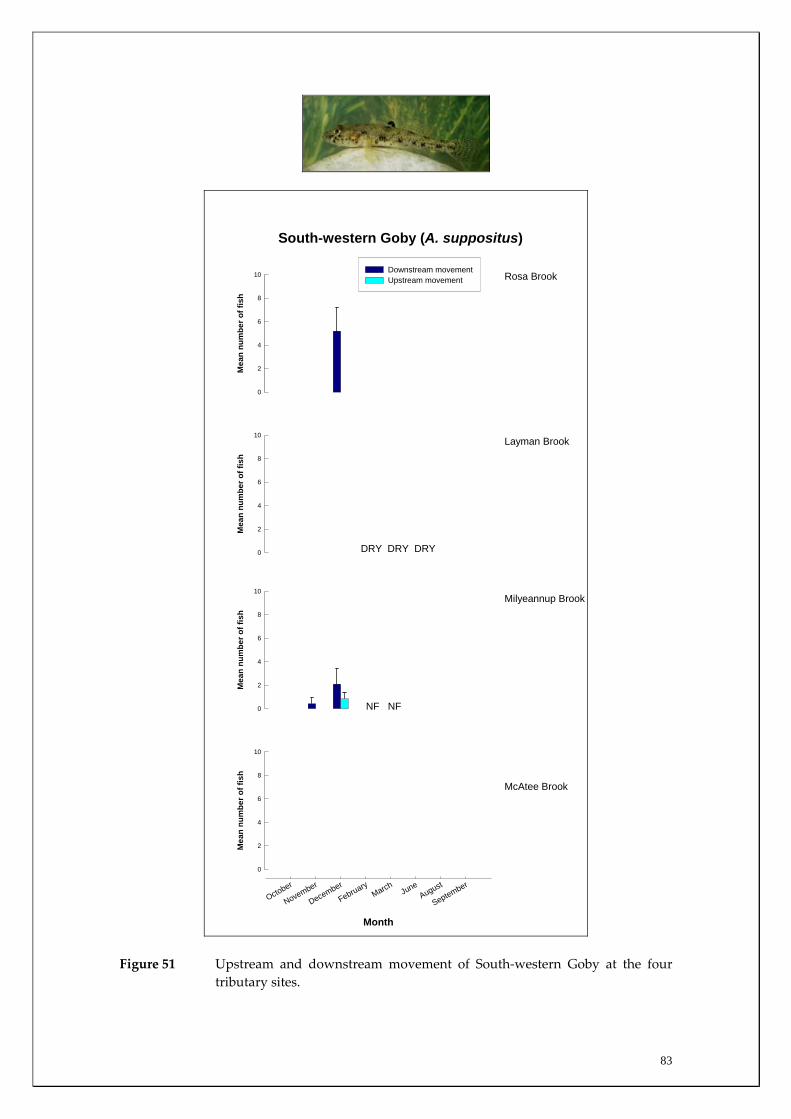
83
Mea
n nu
mbe
r of f
ish
0
2
4
6
8
10Downstream movementUpstream movement
Mea
n nu
mbe
r of f
ish
0
2
4
6
8
10
Rosa Brook
Layman Brook
Mea
n nu
mbe
r of f
ish
0
2
4
6
8
10Milyeannup Brook
Month
October
November
December
FebruaryMarch
JuneAugust
September
Mea
n nu
mbe
r of f
ish
0
2
4
6
8
10
McAtee Brook
South-western Goby (A. suppositus)
DRY DRY DRY
NF NF
Figure 51 Upstream and downstream movement of South‐western Goby at the four
tributary sites.

84
Swan River Goby
Habitat associations As with the South‐western Goby, the vast majority of captures occurred in the main channel (Figure 52, 54, Appendices 1 and 2); again reflecting the fact that it is regarded as an estuarine species that has had its inland range increased due to the salinisation of the Blackwood River main channel. Migration patterns Catches of the Swan River Goby in fyke nets were sporadic, but the large majority captured were moving downstream in the main channel sites (Figure 52). However, no clear migratory patterns were evident with the exception that on all but two months across the four main channel sites, the downstream migration strength was greater than the upstream movement (Figure 52). This is to be expected in such a slow moving benthic species, and the two occasions where upstream movement was greater than downstream movement was during December at Quigup and in March at Jalbarragup, a period when discharge was reduced and during their known spawning period (Gill et al. 1996). This is supported by the presence of new recruits in March at Quigup (Figure 53). No notable migrations occurred within tributary sites (Figure 54).

85
Mea
n nu
mbe
r of f
ish
0
10
20
30
40
Downstream movementUpstream movement
Mea
n nu
mbe
r of f
ish
0
10
20
30
40
Denny Road
Milyeannup Pool
Mea
n nu
mbe
r of f
ish
0
10
20
30
40Jalbarragup
Month
October
November
December
FebruaryMarch
JuneAugust
September
Mea
n nu
mbe
r of f
ish
0
10
20
30
40 Quigup
Swan River Goby (P. olorum)
NS NS
NS NS
Figure 52 Upstream and downstream movement of Swan River Goby at the four main channel sites.
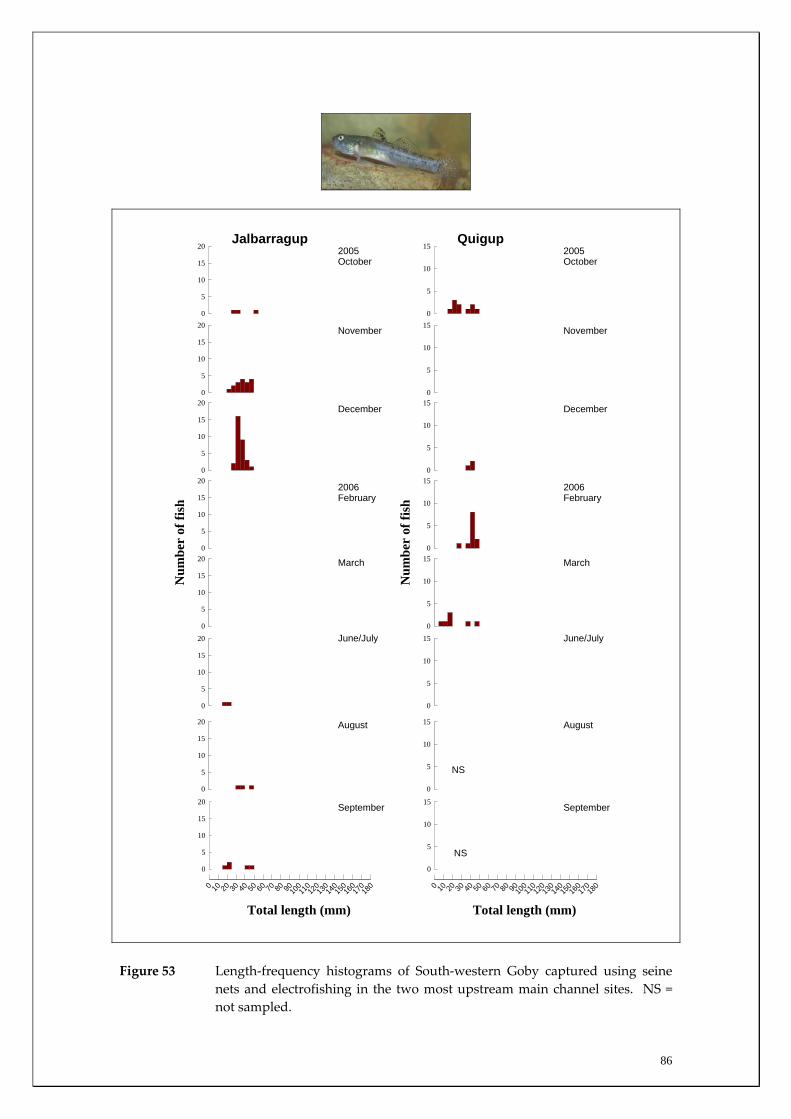
86
0
5
10
15
20
Num
ber
of fi
sh
Total length (mm)
0
5
10
15
20
0
5
10
15
20
0
5
10
15
20
0
5
10
15
20
0
5
10
15
20
0
5
10
15
20
0 10 20 30 40 50 60 70 80 9010011
012
013
014
015
016
017
018
0
0
5
10
15
20
2005October
November
December
2006February
March
June/July
August
September
Jalbarragup
0
5
10
15
Num
ber
of fi
sh
Total length (mm)
0
5
10
15
0
5
10
15
0
5
10
15
0
5
10
15
0
5
10
15
0
5
10
15
0 10 20 30 40 50 60 70 80 9010011
012
013
014
015
016
017
018
0
0
5
10
15
2005October
November
December
2006February
March
June/July
August
September
Quigup
NS
NS
Figure 53 Length‐frequency histograms of South‐western Goby captured using seine nets and electrofishing in the two most upstream main channel sites. NS = not sampled.
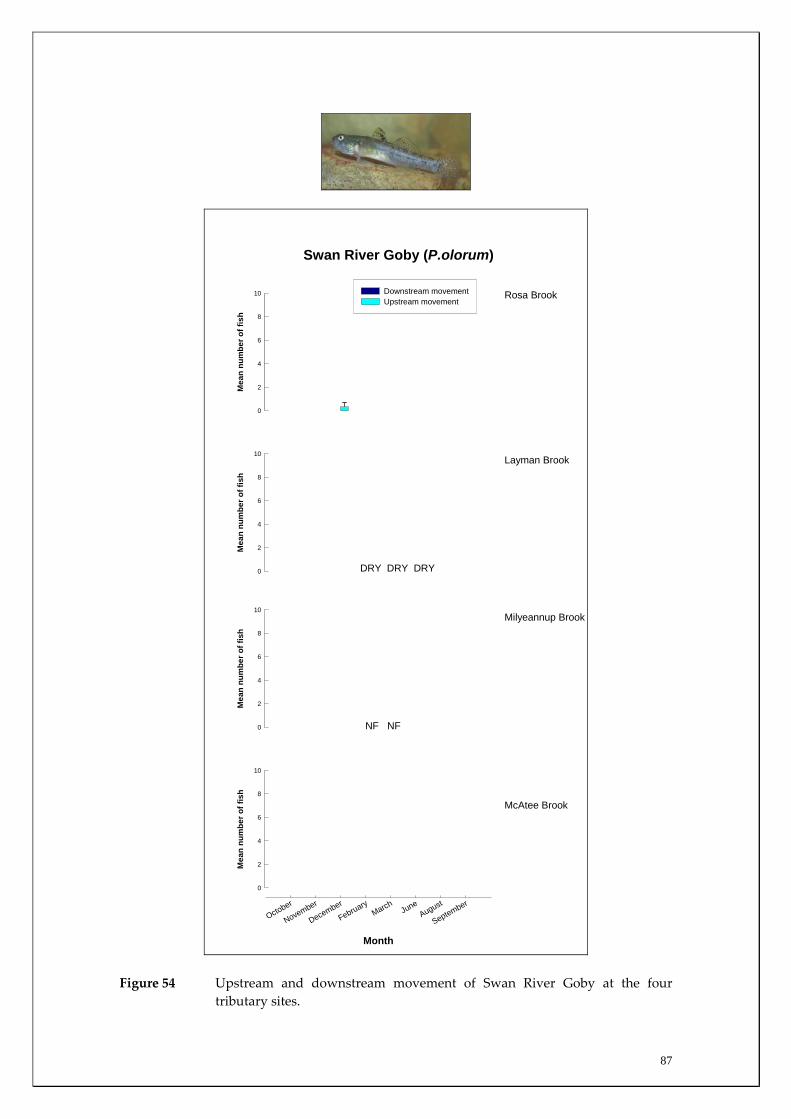
87
Mea
n nu
mbe
r of f
ish
0
2
4
6
8
10 Downstream movementUpstream movement
Mea
n nu
mbe
r of f
ish
0
2
4
6
8
10
Rosa Brook
Layman Brook
Mea
n nu
mbe
r of f
ish
0
2
4
6
8
10Milyeannup Brook
Month
October
November
December
FebruaryMarch
JuneAugust
September
Mea
n nu
mbe
r of f
ish
0
2
4
6
8
10
McAtee Brook
Swan River Goby (P.olorum)
DRY DRY DRY
NF NF
Figure 54 Upstream and downstream movement of Swan River Goby at the four tributary sites.

88
Western Hardyhead
Habitat associations As with the other estuarine species that are now found throughout the main channel of the Blackwood River as a consequence of increased salinisation, the Western Hardyhead is almost completely absent from the tributaries (Figures 55, 59; Appendices 1 and 2). Of the 4864 captured, only four individuals were captured from downstream sites in the tributaries; three in Rosa Brook and one in Milyeannup Brook.
Migration patterns While the species was common at all main channel sites sampled, relatively few were captured in fyke nets at Milyeannup Pool and at Quigup and this method may not be conducive to their capture. Furthermore, individuals were often sighted near the mouth of nets with few subsequently being captured (Figure 55). However, at the Denny Rd site, there were considerable downstream movements of fish in mid‐late spring, with both upstream and downstream migrations recorded during summer. Minimal movements were recorded at most sites during autumn and winter (Figure 55). Similarly, at Jalbarragup, while there was no movement of the species recorded during autumn and winter, there were considerable downstream migrations of fish during late spring and early summer. Little recruitment of juvenile fish was recorded at the Denny Rd site whereas considerable numbers of new recruits were captured in late summer and/or early autumn at the other sites as illustrated by clear cohorts in the length‐frequency histograms (Figures 56‐58). During the likely breeding/recruitment period, i.e. late summer/early autumn, the proportion of new recruits in our catches increased from only a few individuals at Milyeannup Pool to being >50% of the population at the two upstream sites. It is likely that the salinised environment offered by these upstream sites provides this typically estuarine species with more favourable conditions for successful recruitment.
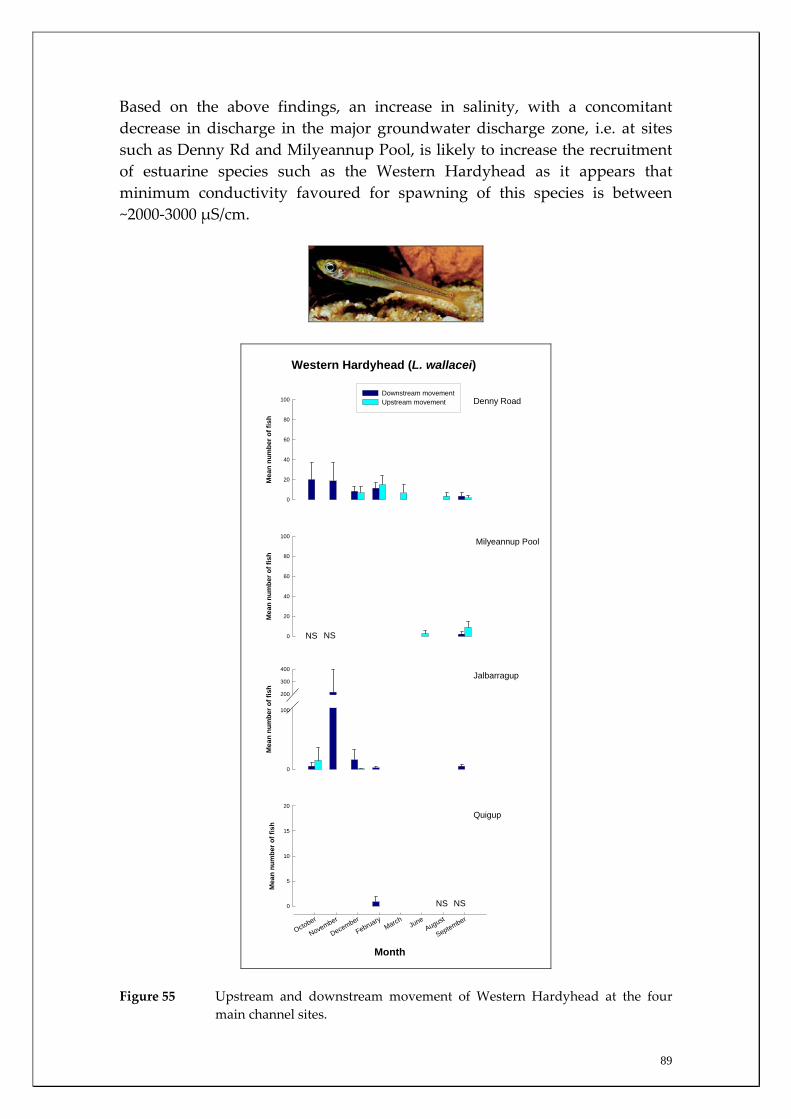
89
Based on the above findings, an increase in salinity, with a concomitant decrease in discharge in the major groundwater discharge zone, i.e. at sites such as Denny Rd and Milyeannup Pool, is likely to increase the recruitment of estuarine species such as the Western Hardyhead as it appears that minimum conductivity favoured for spawning of this species is between ~2000‐3000 μS/cm.
Mea
n nu
mbe
r of f
ish
0
20
40
60
80
100Downstream movementUpstream movement
Mea
n nu
mbe
r of f
ish
0
20
40
60
80
100
Denny Road
Milyeannup Pool
Mea
n nu
mbe
r of f
ish
0
100
200
300
400Jalbarragup
Month
October
November
December
FebruaryMarch
JuneAugust
September
Mea
n nu
mbe
r of f
ish
0
5
10
15
20
Quigup
Western Hardyhead (L. wallacei)
NS NS
NS NS
Figure 55 Upstream and downstream movement of Western Hardyhead at the four
main channel sites.

90
0
5
10Downstream MigrationUpstream Migration
0
20
40
60
80
0
5
10
Num
ber o
f fis
h
0
5
10
0
5
10
0
5
10
0
5
10
Total length (mm)0 10 20 30 40 50 60 70 80 90
100 110 120
130
140
150
160
0
5
10
2005October
November
December
2006February
March
June
August
September
n=18
n=171
n=26
n=1
n= 1
n=10
n=16
n=11
Western Hardyhead (L. wallacei)
Figure 56 Length‐frequency distributions of the Western Hardyhead captured in fyke nets in the main channel sites separated on upstream and downstream movement.

91
0
10
20
30
40
50
Num
ber
of fi
sh
Total length (mm)
0
10
20
30
40
50
0
10
20
30
40
50
0
10
20
30
40
50
0
10
20
30
40
50
0
10
20
30
40
50
0
10
20
30
40
50
0 10 20 30 40 50 60 70 80 90 10011
012
013
014
015
016
017
018
0
0
10
20
30
40
50
2005October
November
December
2006February
March
June/July
August
September
Denny Rd
0
20
40
60
80
100
Num
ber
of fi
sh
Total length (mm)
0
20
40
60
80
100
0
20
40
60
80
100
0
20
40
60
80
100
0
50
100
150
0
20
40
60
80
100
0
10
20
30
40
50
0 10 20 30 40 50 60 70 80 90 10011
012
013
014
015
016
017
018
0
0
20
40
60
80
100
2005October
November
December
2006February
March
June/July
August
September
Milyeannup Pool
NS
NS
Figure 57 Length‐frequency histograms of Western Hardyheads captured using seine nets and electrofishing in the two most downstream main channel sites. NS = not sampled.
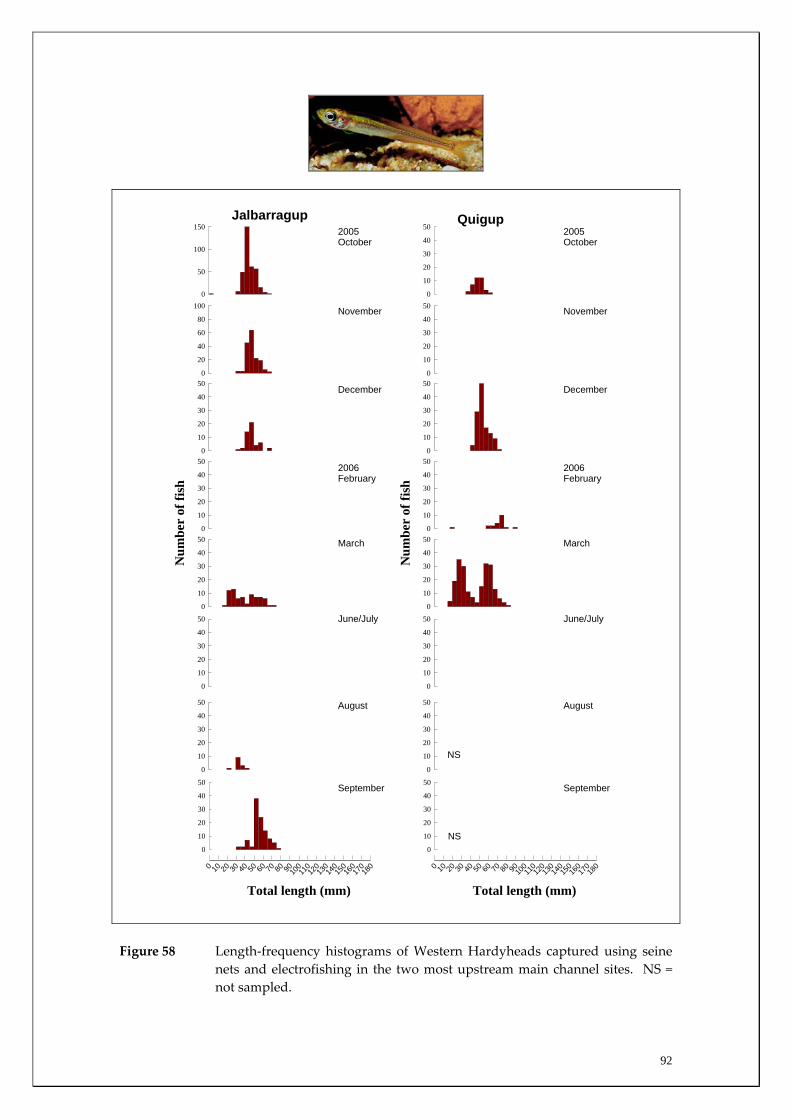
92
0
50
100
150
Num
ber
of fi
sh
Total length (mm)
0
20
40
60
80
100
0
10
20
30
40
50
0
10
20
30
40
50
0
10
20
30
40
50
0
10
20
30
40
50
0
10
20
30
40
50
0 10 20 30 40 50 60 70 80 9010011
012
013
014
015
016
017
018
0
0
10
20
30
40
50
2005October
November
December
2006February
March
June/July
August
September
Jalbarragup
0
10
20
30
40
50
Num
ber
of fi
sh
Total length (mm)
0
10
20
30
40
50
0
10
20
30
40
50
0
10
20
30
40
50
0
10
20
30
40
50
0
10
20
30
40
50
0
10
20
30
40
50
0 10 20 30 40 50 60 70 80 9010011
012
013
014
015
016
017
018
0
0
10
20
30
40
50
2005October
November
December
2006February
March
June/July
August
September
Quigup
NS
NS
Figure 58 Length‐frequency histograms of Western Hardyheads captured using seine
nets and electrofishing in the two most upstream main channel sites. NS = not sampled.

93
Mea
n nu
mbe
r of f
ish
0
2
4
6
8
10
Downstream movementUpstream movement
Mea
n nu
mbe
r of f
ish
0
2
4
6
8
10
Rosa Brook
Layman Brook
Mea
n nu
mbe
r of f
ish
0
2
4
6
8
10Milyeannup Brook
Month
October
November
December
FebruaryMarch
JuneAugust
September
Mea
n nu
mbe
r of f
ish
0
2
4
6
8
10
McAtee Brook
Western Hardyhead (L. wallacei)
DRY DRY DRY
NF NF
Figure 59 Upstream and downstream movement of Western Hardyhead at the four tributary sites.

94
Pouched Lamprey
Habitat associations Prior to this study there had been no previous reports of larval Pouched Lampreys (Geotria australis) in the Blackwood River. During this study, they were only captured in Milyeannup Brook and Rosa Brook (Figure 60). Adults were also captured in fyke nets in Rosa Brook (June) and Milyeannup Brook (September), a period that coincides with their upstream migration (see below) (Figure 60). This species belongs to the Petromyzontiformes, which are one of the only two surviving groups of the jawless (agnathan) stage in vertebrate evolution. The absence of jaws and paired fins separates the agnathans from the cartilaginous (sharks and rays) and bony (teleosts) fishes. While there are 38 species of extant lampreys, the Pouched Lamprey is the sole member of the Geotriidae and one of only four species of Southern Hemisphere lampreys (Potter 1980). The species is known from south‐western and south‐eastern Australia, Tasmania, New Zealand and south‐western and south‐eastern South America (Potter et al. 1986) and in WA it is found in most of the river systems from the Murray River south to approximately the Waychinnicup River east of Albany (Morgan et al. 1998). After approximately four years, the microphagous larva (ammocoete) undergoes a radical metamorphosis into an adult, which possesses eyes, one or two prominent dorsal fins and a tooth‐bearing suctorial disc (Potter et al. 1980, Potter & Hilliard 1987). The adult of the species is parasitic and is thought to feed on the flesh of teleost fishes (Gill et al. 2003). Ammocoetes require a high degree of shade and a high abundance of organic material on the substrate, factors that are known to influence larval densities (Potter et al. 1986). The metamorphosed juveniles (downstream migrants) however are most often associated with (buried in) sandy substrates that occur in well‐oxygenated waters (e.g. below riffles). The larvae are particularly vulnerable to habitat modification and rely on well oxygenated non‐saline waters that are characterised by shade and organic

95
matter. There is substantial evidence that lampreys are declining in numbers, particularly as a result of the loss off suitable habitat for the larvae, and this is evident within south‐western Australian rivers such as the Blackwood where salinisation and land clearing have resulted in loss of larval beds. While adults and larvae are relatively common in the main channel of a number of river systems in south‐western Australia, e.g. Margaret River, it is likely that the higher salinities within the Blackwood River have reduced habitat availability.
Migration patterns The life‐cycle is complex, with the worm–like larval stage (ammocoete) living in ‘burrows’ below the substrate where they feed on diatoms, detritus and micro‐organisms. In south‐western Australia at approximately four years of age (and at approximately 90 mm TL) the ammocoete undergoes metamorphosis with the resultant downstream migrant leaving the river during winter. It is thought that there is a one to two year marine trophic phase, where it presumably feeds on fish and their length increases to approximately 500‐700 mm TL. The adult then ceases feeding, re‐enters rivers and embarks on an upstream migration (moving predominantly at night) during winter and spring. After spending approximately 15‐16 months in the river, when they survive off accumulated fat reserves, the adults spawn and die. During this 15‐16 month period in the river the adults mature and the males develop a large gular pouch (hence the name pouched lamprey). An enlargement of the oral disc also occurs during this maturation period. The strength of the upstream migration is variable from year to year, and due to their nocturnal migration being in winter they are seldom seen.
From top left (clockwise): A burrowing ammocoete, adults migrating upstream, an adult
(upstream migrant) utilising the oral disc to move upstream through a riffle.

96
Mea
n nu
mbe
r of c
rayf
ish
0
5
10
Downstream movementUpstream movement
Mea
n nu
mbe
r of c
rayf
ish
0
5
10
Milyeannup Brook
Layman Brook
Mea
n nu
mbe
r of c
rayf
ish
0
5
10McAtee Brook
Month
October
November
December
FebruaryMarch
JuneAugust
September
Mea
n nu
mbe
r of c
rayf
ish
0
5
10
Rosa Brook
Pouched Lamprey (G. australis)
DRY DRY DRY
NF NF
NF NF
Figure 60 Upstream and downstream movement of Pouched Lampreys in the four tributaries. N.B. This figure represents ammocoete and adult captures.
Milyeannup Brook Oct = larvae Feb = larvae Aug = larvae Sept = larvae + 1 adult
Rosa Brook Dec = adult June = larvae

97
Eastern Mosquitofish
Habitat associations The introduced Eastern Mosquitofish was far more abundant within main channel sites than tributaries, where they were essentially confined to shallow, littoral habitats (Figures 61, 62, Appendices 1 and 2). The species is now widespread throughout the Blackwood catchment where it dominated catches in two previous studies of the fishes in this system (Morgan & Gill 2000, Morgan & Beatty 2005). Approximately 82% of all individuals captured during the latter study were from main channel sites. The species is originally from Eastern North America and is now one of the most widely distributed introduced freshwater fish species in the world. Although relatively small, the species is aggressive and fin‐nips native species (Gill et al. 1999). It generally prefers degraded systems, particularly those with low flows such as artificial wetlands and irrigation drains.
Migration patterns With the exception of a few Eastern Mosquitofish moving downstream in June, this species was only ever captured in fyke nets in the main channel sites during late summer and early autumn, a period that coincides with both low flows and their breeding period in south‐western Australia (Pen & Potter 1991). While this suggests that movement may be restricted to these months, the low catches in fyke nets may imply that the species is not readily captured using this technique. Within the tributaries, they were only ever captured during December in McAtee Brook (Figure 62).
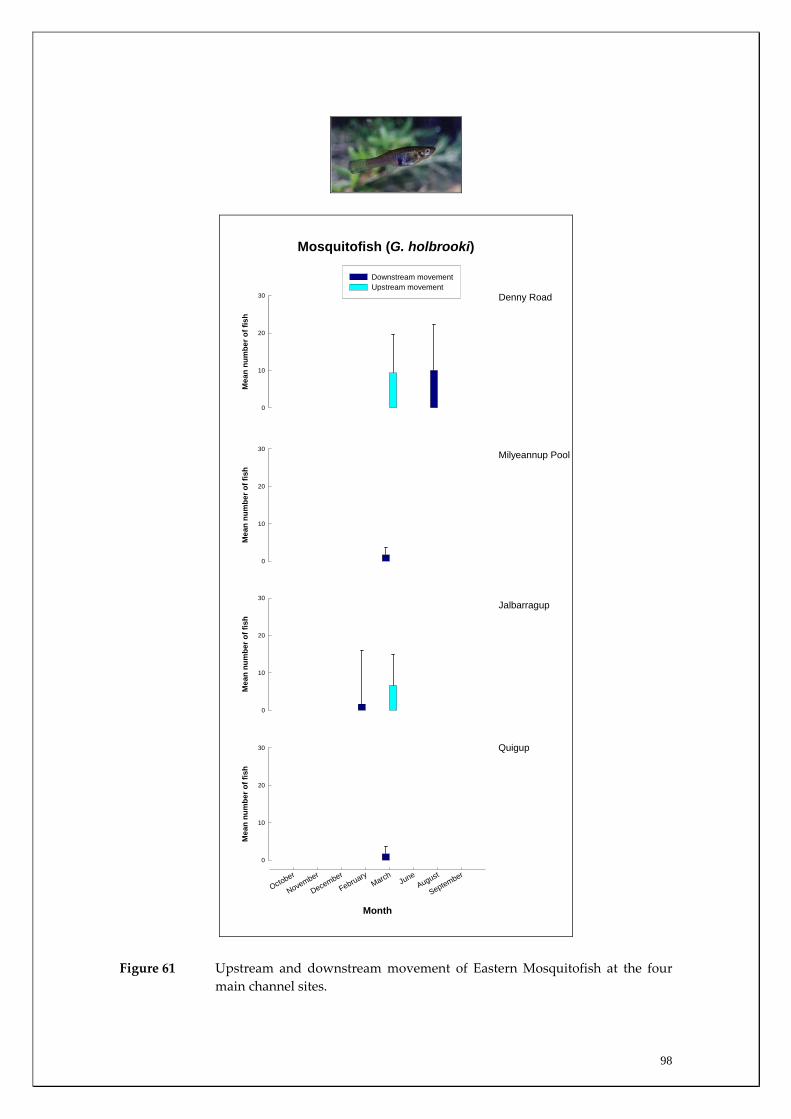
98
Mea
n nu
mbe
r of f
ish
0
10
20
30
Downstream movementUpstream movement
Mea
n nu
mbe
r of f
ish
0
10
20
30
Denny Road
Milyeannup Pool
Mea
n nu
mbe
r of f
ish
0
10
20
30Jalbarragup
Month
October
November
December
FebruaryMarch
JuneAugust
September
Mea
n nu
mbe
r of f
ish
0
10
20
30 Quigup
Mosquitofish (G. holbrooki)
Figure 61 Upstream and downstream movement of Eastern Mosquitofish at the four
main channel sites.
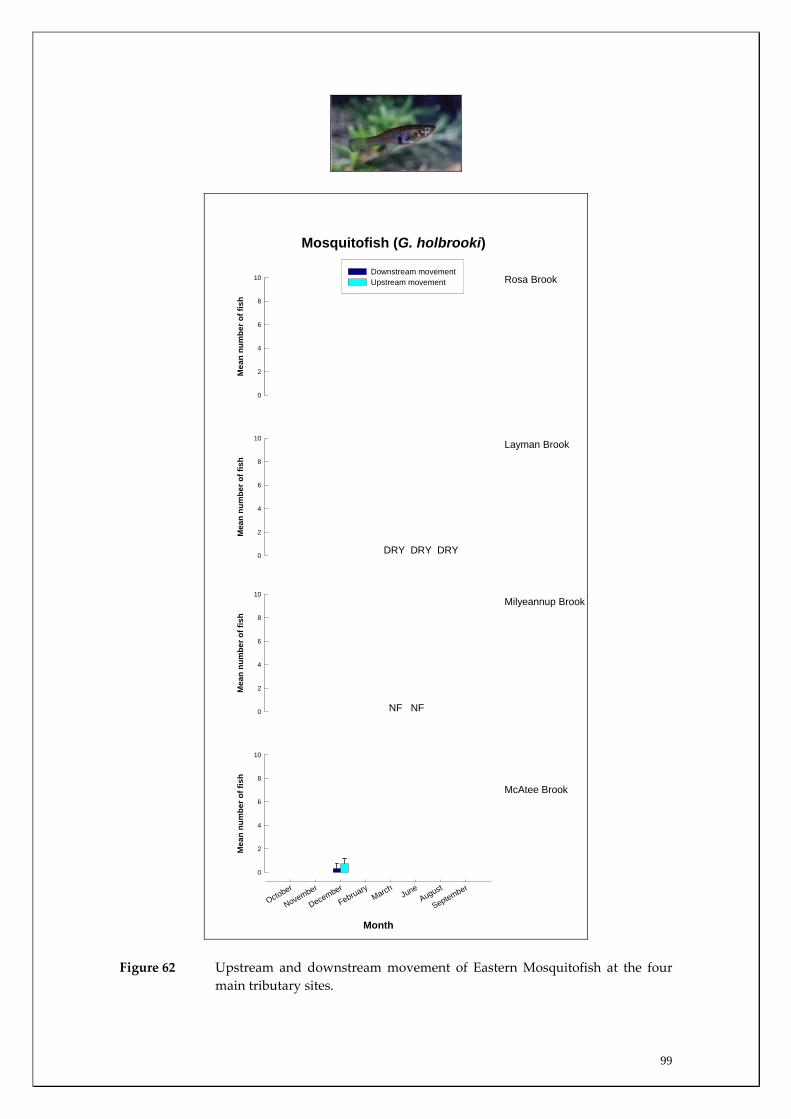
99
Mea
n nu
mbe
r of f
ish
0
2
4
6
8
10Downstream movementUpstream movement
Mea
n nu
mbe
r of f
ish
0
2
4
6
8
10
Rosa Brook
Layman Brook
Mea
n nu
mbe
r of f
ish
0
2
4
6
8
10Milyeannup Brook
Month
October
November
December
FebruaryMarch
JuneAugust
September
Mea
n nu
mbe
r of f
ish
0
2
4
6
8
10
McAtee Brook
Mosquitofish (G. holbrooki)
DRY DRY DRY
NF NF
Figure 62 Upstream and downstream movement of Eastern Mosquitofish at the four
main tributary sites.
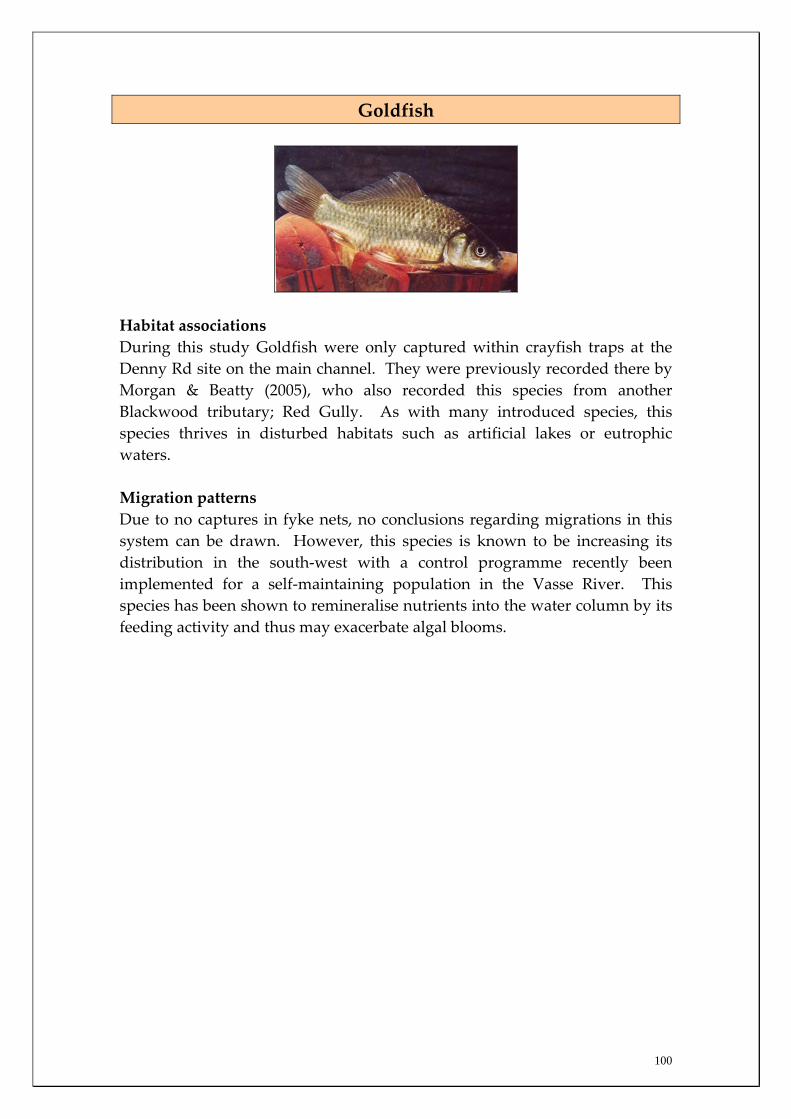
100
Goldfish
Habitat associations During this study Goldfish were only captured within crayfish traps at the Denny Rd site on the main channel. They were previously recorded there by Morgan & Beatty (2005), who also recorded this species from another Blackwood tributary; Red Gully. As with many introduced species, this species thrives in disturbed habitats such as artificial lakes or eutrophic waters. Migration patterns Due to no captures in fyke nets, no conclusions regarding migrations in this system can be drawn. However, this species is known to be increasing its distribution in the south‐west with a control programme recently been implemented for a self‐maintaining population in the Vasse River. This species has been shown to remineralise nutrients into the water column by its feeding activity and thus may exacerbate algal blooms.

101
Rainbow Trout
Habitat associations This species was recorded in Milyeannup Brook in spring 2005 (see Table 7) and in summer 2006 in McAtee Brook (Appendix 2). Rainbow Trout are stocked by the Department of Fisheries into the Blackwood River and its tributaries, and thus its occurrence throughout the catchment is largely a result of this stocking regime. Between 2000 and 2005, over 500 000 Rainbow Trout fry were stocked into the Blackwood River catchment. Tributaries that have been stocked include Milyeannup Brook, Carlotta Brook, Hesters Brook, Nannup Brook, St John Brook, Red Gully, Geegellup Brook, Ellis Creek, Rosa Brook and Adelaide Brook. The Recreational Freshwater Fisheries Stakeholder Sub‐committee terminated the stocking of Rosa Brook and Adelaide Brook in 2005, and Milyeannup Brook stocking ceased following the stocking of 10000 fish in 2005, largely at the advice of this study. Only limited natural recruitment of this species occurs within south‐western Australian streams, and the low catches of this species during this study suggests that survivorship of stocked fry is minimal (Figure 63). However a small number of larger fish were observed in Milyeannup Pool. Although survivorship may appear to be low, the threat posed by this introduced species is substantial, particularly when dealing with rare species that are restricted in distribution and have very short life‐cycles; such as the Mud Minnow and Balston’s Pygmy Perch. Migration patterns Following the stocking of Rainbow Trout into Milyeannup Brook in September 2005, a large number were caught using an electrofisher. In subsequent months, these fish were caught in fyke nets where most were captured moving downstream where they presumably move into the main channel. The species was captured with other native fishes, including juvenile Balston’s Pygmy Perch and Mud Minnows and posed a serious threat to these species, in terms of competition for habitat and predation. As the stocking of streams that are adjacent to Milyeannup Brook, such as McAtee Brook, Red Gully and St John Brook, is likely to continue, the movement

102
patterns, survivorship and diet of stocked Rainbow Trout needs to be examined so as to determine their impact on the rare species in these systems. Furthermore, the level of recreational fishing in this area should be quantified to determine if stocking these systems is warranted from a cost‐benefit point of view.
Mea
n nu
mbe
r of f
ish
0
2
4
6
8
10Downstream movementUpstream movement
Mea
n nu
mbe
r of f
ish
0
2
4
6
8
10
Rosa Brook
Layman Brook
Mea
n nu
mbe
r of f
ish
0
2
4
6
8
10Milyeannup Brook
Month
October
November
December
FebruaryMarch
JuneAugust
September
Mea
n nu
mbe
r of f
ish
0
2
4
6
8
10
McAtee Brook
Rainbow Trout (O. mykiss)
DRY DRY DRY
NF NF
Figure 63 Upstream and downstream movement of Rainbow Trout in the four
tributaries.

103
Marron
Habitat associations Although the Marron are found in considerably greater numbers within the main channel of the Blackwood River, they were also captured in all tributaries with the exception of Layman Brook (Figures 64‐66, Appendices 1 and 2). This is a species generally regarded to favour larger, permanent aquatic systems (Austin & Knott 1996) thus explaining its greater abundance in the main channel sites compared to tributaries. Migration patterns Both upstream and downstream migrations of Marron were observed during fyke netting in the main channel sites and within the tributaries (Figures 64 and 65). Marron population analysis Using catches in crayfish trap data, there was an overall greater CPUE in those main channel sites receiving Yarragadee Aquifer discharge (1.64 trap‐1 ±0.22 S.E.) compared to those upstream of the discharge (1.43 trap‐1 ±0.21 S.E.) although this was not statistically significant (p = 0.496). Catches per unit effort per month are shown in Figure 66 with the greatest catches occurring in July and August. Sites within the Yarragadee Aquifer discharge zone had greater catches of Marron in October (significant: p = 0.019), December, February and July than those upstream of the zone with this trend being reversed in August and September. This suggested that there may have been more activity (i.e. foraging) during the low rainfall months at sites receiving more groundwater discharge in summer than those upstream. Although the sampling regime employed could not specifically quantify breeding and recruitment success of the Marron population, the wide range of age cohorts (including similar 0+ recruits between 10‐20 mm OCL in both zones) observed in the length‐frequency distributions suggested that the Marron populations in the main channel sites were similar in structure (Figure 67). However, more intensive examination of the Marron populations within the two zones would be required to specifically compare population

104
health (e.g. productivity based on growth rates, densities, breeding and recruitment rates). The spawning period of Marron in the Blackwood River appeared to be between July and September as suggested by the decline in the proportion of females with mature/ripe ovaries (Figure 68). This timing is consistent with previous studies of this species elsewhere (Beatty et al. 2003, 2005a). Insufficient numbers of female Marron were retained to compare the length of first maturity of Marron in the two zones (in order to reduce the impact of removing large numbers of the breeding population from the river) so females from all sites were pooled in the analysis. The length at which 50% (L50) of female Marron matured in the Blackwood River was 55.6 mm OCL which approximates the previous (i.e. prior to 2007 recreational season) minimum legal size for capture of 76 mm carapace length (CL) (Figure 69). This size at maturity of females is larger than that recorded for this species in Waroona Dam (32.1 mm OCL, Beatty et al. 2003) but smaller than in the Hutt River (69.3 mm OCL, Beatty et al. 2004), at the northernmost extent of its range; again reflecting the plasticity in its biology (see Beatty et al. 2004). However, due to the relatively low numbers of females retained and used in the analysis, this size at maturity requires further validation. Although not statistically significant (probably due to sample size, i.e. number of traps deployed), the slightly higher CPUE of Marron within the major groundwater discharge zone compared with sites upstream is understandable given that recreational catch rates of Marron have recently been positively associated with water levels (Molony et al. unpublished data) and seasonal predictions of recreational catches are based on modelling with future rainfall (i.e. a prediction of river flow). This positive relationship between Marron and water amount is probably due to increased recruitment success (and probably overall productivity) that increased water levels allow due to increased habitat availability (increasing juvenile survival by reducing competition for space) and food resources (e.g. allochthonous organic matter input due to increased bank inundation). Increased summer river flow in particular could result in increased productivity as this season occurs after the peak spawning period (Figure 68) and coincides with peak juvenile release (early summer in the Blackwood River allowing for a 10‐15 week attachment period to females). Marron growth is most rapid in this early period of life (Beatty et al. 2004) and they are also most vulnerable to interspecific (e.g. Rainbow Trout, Freshwater Cobbler) and intraspecific (i.e. adult Marron) predation. Therefore, given that considerable contribution of summer flow of the Blackwood River is derived

105
from Yarragadee groundwater (at times up to 100% of the total summer flow in dry summers is derived from combined groundwater discharge, Strategen (2006), substantial reduction in the minimum summer flow in the main channel of the Blackwood River may result in reduced productivity of the Marron population occupying this stretch of the Blackwood River (due to reduced juvenile survivorship and resource availability). This may therefore lead to reduced recreational Marron captures in this zone. An ongoing monitoring program of the Marron population examining relative abundances and productivity should be implemented if such reductions in discharge occur.
Mea
n nu
mbe
r of c
rayf
ish
0
20
40
60
80
100
200Downstream movementUpstream movement
Mea
n nu
mbe
r of c
rayf
ish
0
10
20
30
40
Denny Road
Milyeannup Pool
Mea
n nu
mbe
r of c
rayf
ish
0
10
20
30
40Jalbarragup
Month
October
November
December
FebruaryMarch
JuneAugust
September
Mea
n nu
mbe
r of c
rayf
ish
0
20
40
60
80 Quigup
Marron (C. cainii)
NS NS
NS NS
Figure 64 Upstream and downstream movement of Marron at the four main channel
sites. NS = not sampled.

106
Mea
n nu
mbe
r of c
rayf
ish
0
5
10
Downstream movementUpstream movement
Mea
n nu
mbe
r of c
rayf
ish
0
5
10
Milyeannup Brook
Layman Brook
Mea
n nu
mbe
r of c
rayf
ish
0
5
10McAtee Brook
Month
October
November
December
FebruaryMarch
JuneAugust
September
Mea
n nu
mbe
r of c
rayf
ish
0
5
10
Rosa Brook
Marron (C. cainii)
DRY DRY DRY
NF NF
NF NF
Figure 65 Upstream and downstream movement of Marron in the four tributaries. NF = not flowing.

107
Month
Octobe
r
Decem
ber
Februa
ryMarc
hJu
ly
Augus
t
Septem
ber
Cat
ch p
er u
nit e
ffort
(mar
ron/
trap)
0
1
2
3
4
5
6
Sites receiving Yarragadee dischargeSites upstream of Yarragadee discharge
*
Figure 66 Catch per unit effort (CPUE, Marron.trap‐1) of Marron in the Blackwood
River. N.B. * denotes a significant difference between the CPUE zones in that month at p < 0.05.
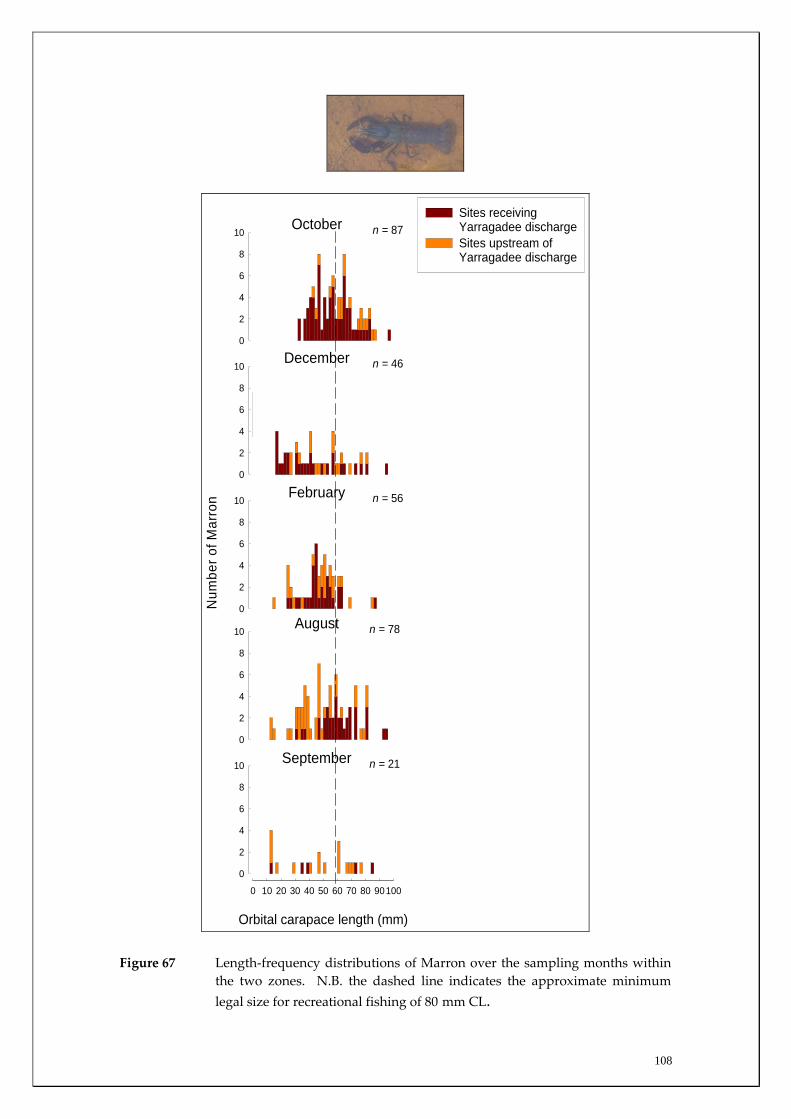
108
October
0
2
4
6
8
10
October
oct up
December
0
2
4
6
8
10
February
0
2
4
6
8
10
August
0
2
4
6
8
10
September
Orbital carapace length (mm)
0 10 20 30 40 50 60 70 80 90100
0
2
4
6
8
10
Sites receiving Yarragadee dischargeSites upstream of Yarragadee discharge
n = 87
n = 46
n = 56
n = 78
n = 21
Num
ber o
f Mar
ron
Figure 67 Length‐frequency distributions of Marron over the sampling months within
the two zones. N.B. the dashed line indicates the approximate minimum legal size for recreational fishing of 80 mm CL.

109
0
20
40
60
80
100 July n = 3
0
20
40
60
80
100
0
20
40
60
80
100
0
20
40
60
80
100
Gonad Stage
1 2 3 4 5 6 7
Perc
enta
ge c
ontri
butio
n (%
)
0
20
40
60
80
100
August n = 39
September n = 14
December n = 17
October n = 36
Figure 68 Percentages of ovarian stages of female Marron over the different sampling
months in the Blackwood River. N.B. stages I‐II are immature, stages III‐VII are mature (VII = berried female).

110
Orbital carapace length (mm)
10 20 30 40 50 60 70 80
Perc
enta
ge m
atur
e (%
)
0
25
50
75
100
Mature ovaries (stage III-VII)Immature ovaries (stage I-II) Median maturity lineLower 5% confidence intervalUpper 95% confidence interval
2 1 2 3 7 1 4 6 4 5 4 2 1 1
Figure 69 Percentage contributions of stages I/II (i.e. immature) and III‐VII (i.e.
maturing / mature) in gonadal development in sequential 5 mm OCL intervals of female Marron in the Blackwood River in July and August 2006. The logistic curve was fitted to the percentage of Marron with gonads at stages III‐VII. N.B. L50 is shown by the junction of the dashed vertical and horizontal lines (55.6 mm OCL).

111
Gilgie
Habitat associations Although found in both main channel and tributaries sites, Gilgies were found in higher numbers in the latter habitats (Figures 70, 71, Appendices 1 and 2). Although this species occupies almost the full range of freshwater systems in south‐western W.A., it is often associated with such small streams (Austin & Knott 1996). It is also a species able to live in both permanent and temporary systems due to its ability to burrow into the water table to escape drought. It also matures at a small size and is believed to have the ability to breed multiple times over spring and summer (Beatty et al. 2005) allowing it to proliferate in seasonally inundated systems (see also section 2). Migration patterns Most of the movement in the main channel was recorded during winter (Figure 71); possibly as a pre‐cursor to breeding within the tributaries. These movements can be traced into the tributaries with substantial upstream migrations occurring in winter and spring (Figure 70). Analysis in temporal trends in gonadal development will aid in elucidating whether these migrations were indeed for breeding. Migrations into the tributaries would provide small juveniles with relatively safe habitats away from large predators such as Freshwater Cobbler and Marron.

112
Mea
n nu
mbe
r of c
rayf
ish
0
5
10
Downstream movementUpstream movement
Mea
n nu
mbe
r of c
rayf
ish
0
5
10
Milyeannup Brook
Layman Brook
Mea
n nu
mbe
r of c
rayf
ish
0
5
10
15
20
25
30McAtee Brook
Month
October
November
December
FebruaryMarch
JuneAugust
September
Mea
n nu
mbe
r of c
rayf
ish
0
5
10
15
20
25
30
Rosa Brook
Gilgie (C. quinquecarinatus)
DRY DRY DRY
NF NF
NF NF
Figure 70 Upstream and downstream movement of Gilgies in the four tributaries. NF =
not flowing.
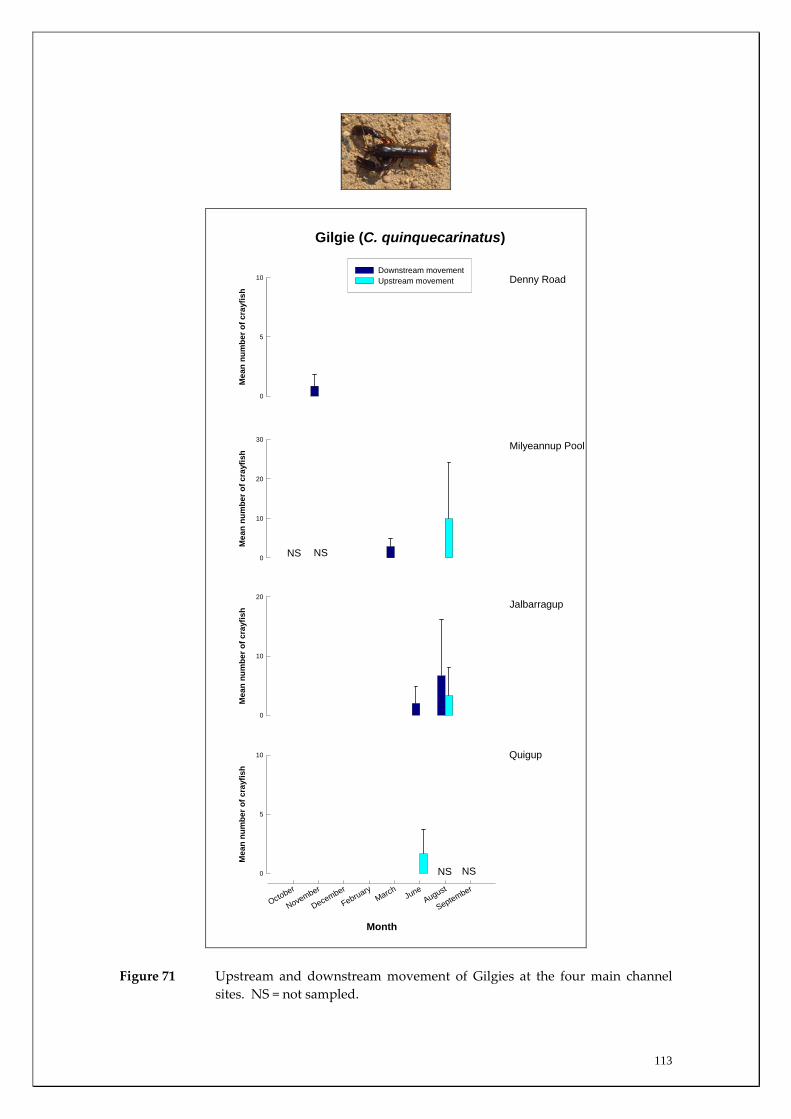
113
Mea
n nu
mbe
r of c
rayf
ish
0
5
10Downstream movementUpstream movement
Mea
n nu
mbe
r of c
rayf
ish
0
10
20
30
Denny Road
Milyeannup Pool
Mea
n nu
mbe
r of c
rayf
ish
0
10
20Jalbarragup
Month
October
November
December
FebruaryMarch
JuneAugust
September
Mea
n nu
mbe
r of c
rayf
ish
0
5
10 Quigup
Gilgie (C. quinquecarinatus)
NS NS
NS NS
Figure 71 Upstream and downstream movement of Gilgies at the four main channel sites. NS = not sampled.

114
Restricted Gilgie
Habitat associations The Restricted Gilgie was not captured in fyke nets in the main channel sites sampled during this study; however Morgan & Beatty (2005) recorded two individuals of the species in the main channel at the Great North Rd crossing. In this study, we recorded the species during electrofishing and/or seine netting in low numbers at Milyeannup Pool, Jalbarragup and Quigup (Appendix 1). They were also recorded during electrofishing in McAtee Brook, Poison Gully and Milyeannup Brook and Morgan & Beatty (2005) (see also Section 2) captured the species in Rosa Brook (Appendix 2). This species is generally associated with small stream systems and is also able to survive in seasonally inundated systems due to its ability to burrow into the water table (Austin & Knott, 1996). Migration patterns Due to the limited movements of the species recorded during the fyke netting (Figure 72) it is not possible to make inferences on migration patterns of the species. Furthermore, apart from genetic studies (Austin & Knott 1996), there has been limited research into the biology and ecology of this restricted species (see Section 2).

115
Mea
n nu
mbe
r of c
rayf
ish
0
5
10
Downstream movementUpstream movement
Mea
n nu
mbe
r of c
rayf
ish
0
5
10
Milyeannup Brook
Layman Brook
Mea
n nu
mbe
r of c
rayf
ish
0
5
10McAtee Brook
Month
October
November
December
FebruaryMarch
JuneAugust
September
Mea
n nu
mbe
r of c
rayf
ish
0
5
10
Rosa Brook
Restricted Gilgie (C. crassimanus)
DRY DRY DRY
NF NF
NF NF
Figure 72 Upstream and downstream movement of Restricted Gilgies in the four tributaries sampled. NF = not flowing.

116
Koonac
Habitat associations The Koonac was not recorded in fyke nets in the main channel sites sampled during this study; however they were captured using seines/electrofishing at Jalbarragup (Appendix 1). Morgan & Beatty (2005) recorded numerous individuals of the species in a number of main channel sites within the Yarragadee Discharge Zone. Koonacs were occasionally captured in fyke nets in the lower section (Figure 73) and by electrofishing in the upper section (Appendix 2) of Milyeannup Brook. It was also recorded on one occasion in fyke nets in Rosa Brook and on one occasion during electrofishing in McAtee Brook (Figure 73, Appendix 2). As with the Gilgie, it is found in a similarly wide range of permanent and temporary aquatic systems throughout the south‐west of W.A. as the Gilgie but is most commonly associated with lentic wetlands (Austin & Knott 1996) (see also Section 2). Migration patterns Due to low numbers recording using fyke nets there were no discernable trends evident in migration patterns. There is also no published work on the ecology or reproductive biology for this species; however, it may be similar to that of the Gilgie (Beatty et al. 2005) given that it occupies a similarly wide range of permanent and temporary aquatic systems throughout its range.
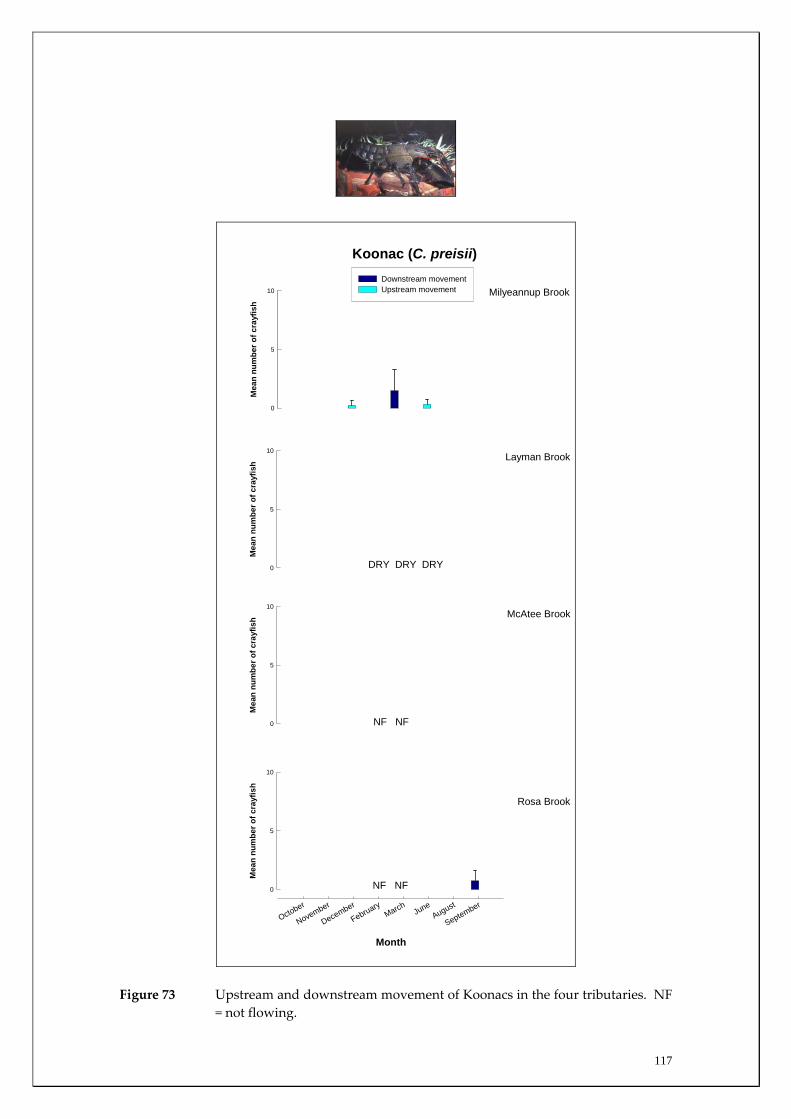
117
Mea
n nu
mbe
r of c
rayf
ish
0
5
10
Downstream movementUpstream movement
Mea
n nu
mbe
r of c
rayf
ish
0
5
10
Milyeannup Brook
Layman Brook
Mea
n nu
mbe
r of c
rayf
ish
0
5
10McAtee Brook
Month
October
November
December
FebruaryMarch
JuneAugust
September
Mea
n nu
mbe
r of c
rayf
ish
0
5
10
Rosa Brook
Koonac (C. preisii)
DRY DRY DRY
NF NF
NF NF
Figure 73 Upstream and downstream movement of Koonacs in the four tributaries. NF
= not flowing.
118
MILYEANNUP BROOK – CASE STUDY Sampling regime (Milyeannup Brook) During this study, it became apparent that Milyeannup Brook is a significant system from a conservation perspective and warranted further investigation. This section details these investigations. Milyeannup Brook was sampled for fish migrations at a total of three sites: at the confluence of the Blackwood River in winter and spring 2006 at Brockman Hwy (permanent flow, ~300 m from the confluence with the Blackwood River) on each sampling occasion throughout the study, and at Blackwood Rd (ephemeral site, ~3700 m from the Blackwood River) during spring and summer 2005 (Table 7, Figure 74). In addition to understanding the patterns of fish movement in Milyeannup Brook, this system was intensively sampled during the dry period in summer/autumn 2006 to determine the extent of its permanent flow due to Yarragadee Aquifer discharge and the distribution patterns of fish during the time of reduced flow. A total of eight additional sites were sampled for fish and crayfish densities in the summer (February) and autumn (March) of 2006 of which two were completely dry (i.e. no flow or remnant pool present) (Table 7, Figure 74 and 75). At each site, a GPS was used to record the coordinates and a map (Figure 1) of these and the migration sites subsequently produced using MapInfoTM and overlayed onto an aerial photo (Department of Land Administration) (note that the uppermost sites Mil 12 and Mil 13 on Milyeannup Rd are not shown due to loss of detail of the other sites due to scale) (see Figure 1 for details). At each of the dry‐season sites, three replicate areas totalling up to 650 m2 were sampled for fish and freshwater crayfish using a back‐pack electrofisher (set on a minimum power so as not to compromise the health of resident fish). At each replicate site, 5 m seine nets (mesh width 2 mm) were used to block upstream and downstream fish escape. All fish and crayfish species recorded within each replicate area were identified, counted and a sub‐sample measured to the nearest 1 mm TL before being promptly released. Densities (± 1 S.E.) were calculated for each species recorded at each site. Densities of Balston’s Pygmy Perch in Milyeannup Brook were previously determined via electrofishing at both Mil 2 and Mil 3 (representing two sites within species permanent range) during early April 2005 (Morgan & Beatty 2005). The same electrofishing technique was undertaken as described for the above summer 2006 distributional survey.

119
Examples of various habitats sampled in Milyeannup Brook; Balston’s Pygmy Perch (centre).

120
Figure 74 Sites sampled for fish and freshwater crayfish in Milyeannup Brook (Mil) and Poison Gully (PG) (aerial photo from Department of Land
Administration).
20 1
PG2
PG1
Mil3
Mil11
Mil2Mil1
Mil10Mil9
Mil8
Mil7Mil6Mil5Mil4
Seasonal migration
Summer quantitative
Winter/spring quantitative
0 2Km
~2000m limit of other species
~1300m summer limit of Balston’s Pygmy Perch
~2500m flow limit
121
RESULTS (Milyeannup Brook) The migration data for Milyeannup Brook (see migration section for a detailed account of individual species) showed that this system is the only tributary that houses a self‐sustaining population of the vulnerable Balston’s Pygmy Perch. The limit of the permanency of flow in Milyeannup Brook in February 2006 was approximately 2500 m from its confluence with the Blackwood River (Figure 74). The limit of upstream fish distribution was found to be approximately 2000 m from the confluence with the Blackwood River (Figure 74, Table 7). Fish were recorded at Mil 9 and Mil 10 (Figures 74 and 75), the majority of which were juvenile Western Pygmy Perch, Nightfish and Western Minnow, however, it was apparent that the pools were not permanent due to very shallow depth and thus the fish would not have survived the ensuing low rainfall months. Much of the section of permanent flow in summer is very shallow and the fishes occupying sites Mil 4 – Mil 6 included Western Minnow, Western Pygmy Perch, Nightfish, and Mud Minnow. Of particular note is that the Balston’s Pygmy Perch was not found upstream of Mil 3 (~1000 m from the Blackwood River confluence) and therefore its uppermost distribution in the driest months during 2006 lay between 1000‐1300 m from the Blackwood River confluence (Figure 75). The failure of the Balston’s Pygmy Perch to utilise a greater proportion of the permanent, groundwater fed stream length was probably the unsuitability of the shallow habitat in the upper ~40% of permanent stream‐length and requires an examination of inter‐annual variation. The density of Balston’s Pygmy Perch at Mil 2 and Mil 3 was found to be 0.09 m‐2 (±0.01). Based on an average channel width utilisation (2‐3 m) and an actual stream length (due to meanders, additional 30% of 1300 m) resulting in an estimated summer population in Milyeannup Brook of ~380 m‐2 (± 42). As noted, this was a relatively atypical climatic year for the region and the interannual variation in fish distribution in Milyeannup Brook needs to be elucidated by subsequent dry season distributional sampling. DISCUSSION (Milyeannup Brook) Biological Summary This study has confirmed that Milyeannup Brook stands out from a conservation perspective. It houses the only viable population of the Vulnerable (EPBC Act 1999) Balston’s Pygmy Perch in the Blackwood River and is also where the most prolific migrations of Mud Minnow were recorded. The Balston’s Pygmy Perch was found to undertake strong upstream
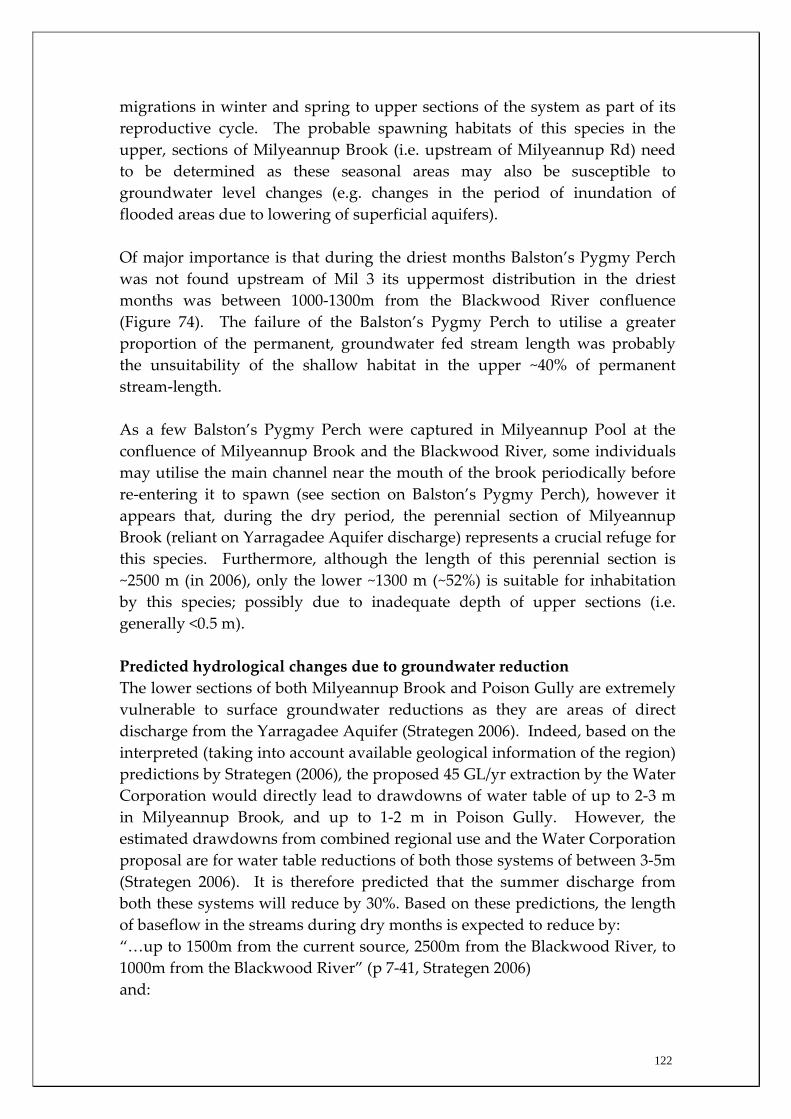
122
migrations in winter and spring to upper sections of the system as part of its reproductive cycle. The probable spawning habitats of this species in the upper, sections of Milyeannup Brook (i.e. upstream of Milyeannup Rd) need to be determined as these seasonal areas may also be susceptible to groundwater level changes (e.g. changes in the period of inundation of flooded areas due to lowering of superficial aquifers). Of major importance is that during the driest months Balston’s Pygmy Perch was not found upstream of Mil 3 its uppermost distribution in the driest months was between 1000‐1300m from the Blackwood River confluence (Figure 74). The failure of the Balston’s Pygmy Perch to utilise a greater proportion of the permanent, groundwater fed stream length was probably the unsuitability of the shallow habitat in the upper ~40% of permanent stream‐length. As a few Balston’s Pygmy Perch were captured in Milyeannup Pool at the confluence of Milyeannup Brook and the Blackwood River, some individuals may utilise the main channel near the mouth of the brook periodically before re‐entering it to spawn (see section on Balston’s Pygmy Perch), however it appears that, during the dry period, the perennial section of Milyeannup Brook (reliant on Yarragadee Aquifer discharge) represents a crucial refuge for this species. Furthermore, although the length of this perennial section is ~2500 m (in 2006), only the lower ~1300 m (~52%) is suitable for inhabitation by this species; possibly due to inadequate depth of upper sections (i.e. generally <0.5 m). Predicted hydrological changes due to groundwater reduction The lower sections of both Milyeannup Brook and Poison Gully are extremely vulnerable to surface groundwater reductions as they are areas of direct discharge from the Yarragadee Aquifer (Strategen 2006). Indeed, based on the interpreted (taking into account available geological information of the region) predictions by Strategen (2006), the proposed 45 GL/yr extraction by the Water Corporation would directly lead to drawdowns of water table of up to 2‐3 m in Milyeannup Brook, and up to 1‐2 m in Poison Gully. However, the estimated drawdowns from combined regional use and the Water Corporation proposal are for water table reductions of both those systems of between 3‐5m (Strategen 2006). It is therefore predicted that the summer discharge from both these systems will reduce by 30%. Based on these predictions, the length of baseflow in the streams during dry months is expected to reduce by: “…up to 1500m from the current source, 2500m from the Blackwood River, to 1000m from the Blackwood River” (p 7‐41, Strategen 2006) and:
123
“…several hundred metres in Poison Gully, from the current position 3500m upstream from the confluence of the Blackwood River” (p 7‐41, Strategen 2006). This 60% reduction in the base flow length in Milyeannup Brook has considerable implications for the prevailing aquatic fauna and particularly for Balston’s Pygmy Perch that, as mentioned, use this habitat as a crucial summer refuge. Of major concern is the combined, synergistic effect of habitat reduction in Milyeannup Brook through summer stream length reduction coupled with predicted main channel water quality changes. That is, the Balston’s Pygmy Perch currently appears to have only limited usage of the main channel (appearing to be restricted to reaches near the confluence of Milyeannup Brook, e.g. Milyeannup Pool) probably due to change in water quality, particular, elevated salinities. Due to the expected reduction in Yarragadee Discharge into the main channel due to future regional use and the Water Corporation’s proposal, the dry period salinity is expected to increase in the Blackwood River (~14%, Strategen, 2006). Therefore, should the current refuge in Milyeannup Brook become unsuitable as habitat reduces, the species would be forced to retreat into the main channel that may have water quality parameters (particularly salinity) that exceed this species’ tolerance thus eliminating it from the Blackwood River entirely. It is therefore of crucial importance to determine the salinity tolerances of the native freshwater species (including the Balston’s Pygmy Perch) in order to assess their viability under the predicted increased summer salinity in the Yarragadee Aquifer discharge zone.

124
Mil 4 Mil 5
Mil 6 Mil 7
Mil 9 Mil 10
Figure 75 Sites sampled in Milyeannup Brook in summer 2006 to determine fish and freshwater crayfish distributions.

125
Table 7 The sites sampled in Milyeannup Brook, sampling times, and densities and total numbers of fish and crayfish recorded. Continued next page
Mean Species Density m2 (total number captured) in Milyeannup Brook using Seine and/or Electrofishing. Season Site
Lat Long
Total area
sampled (m2)
Native Fishes Feral Fishes
Freshwater Crayfish
Nannatherina balstoni
Galaxias occidentalis
Edelia vittata
Bostockia porosa
Galaxiella munda
Afurcagobius suppositus
Oncorhynchus mykiss
Cherax cainii
Cherax quinquecarinatus
Cherax preisii
Cherax crassimanus
Mil 1 34.09089 115.5661
All seasons
SEE MIGRATION SECTION
Mil 2 34.0933 115.56557
All seasons
SEE MIGRATION SECTION
Mil 3 34.09882 115.5699
All seasons
SEE MIGRATION SECTION
Autumn 2006
Mil 4 34.10128 115.570
Summer 2006
20 1.25 (20)
0.200 (4)
0.100 (2)
0.100 (2)
0.700 (14)
0.150 (3)
Winter 2006
125 0.072 (9)
0.400 (50)
0.104 (13)
0.064 (8)
0.024 (3)
0.056 (7)
0.008 (1)
Mil 5 34.10403 115.57085
Summer 2006
30 0.833 (25)
0.033 (1)
0.033 (1)
0.033 (1)
0.033 (1)
0.300 (9)
Mil 6 34.10682 115.56996
Summer 2006
20 0.600 (12)
0.300 (6)
0.100 (2)

126
Mean Species Density m2 (total number captured) in Milyeannup Brook using Seine and/or Electrofishing. Season Site
Lat Long
Total area
sampled (m2)
Native Fishes Feral Fishes
Freshwater Crayfish
Nannatherina balstoni
Galaxias occidentalis
Edelia vittata
Bostockia porosa
Galaxiella munda
Afurcagobius suppositus
Oncorhynchus mykiss
Cherax cainii
Cherax quinquecarinatus
Cherax preisii
Cherax crassimanus
Mil 7 34.10897 115.57004
Autumn 2006
25
Mil 8 34.11852 115.5683
Summer 2006
DRY
Mil 9 34.12135 115.56952
Summer 2006
37.5 0.213 (8)
0.213 (8)
Mil 10 34.12165 115.56929
Summer 2006
7.5 0.133 (1)
0.533 (4)
Winter 2006
150
Mil 11 34.1234 115.5698
All seasons
SEE MIGRATION SECTION
Spring 2005
650 0.012 (8)
0.012 (8)
0.012 (8)
0.006 (4)
0.006 (4)
0.049 (32)
0.010 (7)
Mil 12 34.17118 115.56968
Spring 2005
45 0.044 (2)
0.089 (4)
Mil 13 34.17172 115.57614
Spring 2005
207.5 0.198 (41)
Summer 2006
DRY

CONCLUSIONS AND RECOMMENDATIONS
Salinisation of the Blackwood River has resulted in the habitat availability for the freshwater fishes becoming drastically reduced (Morgan et al. 2003). Many are now restricted to the forested tributaries within the lower catchment and in the section of the main channel where salinity is reduced as a consequence of groundwater discharge from the Yarragadee and Leederville aquifers. This study examined population demographics and migratory behaviour of fishes in and around this groundwater discharge zone on eight occasions between October 2005 and September 2006. A variety of sampling methods were utilised including fyke netting, seine netting, trapping and electrofishing. Substantial differences in fish densities and migration patterns existed between and within the main channel and major tributaries. Main channel sites receiving most groundwater discharge (i.e. from both the Leederville and Yarragadee aquifers) had much greater abundances of non‐salt tolerant freshwater native species than those sites upstream of major groundwater discharge. This suggests that fresh groundwater input in summer (when many tributaries cease to flow or dry completely), may be enabling those species to continue to survive in the salinised main channel. The considerable upstream migrations of Freshwater Cobbler in main channel sites, where the vast majority of captures occurred, were highly correlated to summer discharge. This species is considered to be ideal for long‐term monitoring of river connectivity such as assessing the adequacy of discharge over riffles to allow its migration. The timing and strengths of fish migrations differed substantially between tributaries for the Western Minnow, Nightfish and Western Pygmy Perch and tributaries were found to be the major spawning habitats for these species. The section of the main channel that receives the most groundwater discharge and perennial tributaries appear to act as a summer refuge when the contraction or drying of most of these tributaries occurs. Environmental variables during the peak flow period explained differences in the strength of migrations between tributaries for some native freshwater species. For example, downstream and upstream migration strengths of the Western Minnow in the four tributaries were highly correlated with stream discharge whereas upstream migrations of Western Pygmy Perch and Nightfish were correlated with dissolved oxygen levels.

128
A slightly higher relative abundance of Marron (although not statistically significant) was recorded within sites receiving most groundwater discharge (i.e. both Leederville and Yarragadee Aquifer discharge) than sites upstream. Marron recreational catches are positively correlated with river flow and this has implications for the recreational fishery within the Blackwood River should summer flows be reduced. Milyeannup Brook is of critical conservation importance as it houses the only population of the Balston’s Pygmy Perch in the Blackwood River catchment (listed as Vulnerable under the EPBC Act 1999). The perennial flows of this system, as a consequence of groundwater discharge, provide a crucial refuge to Balston’s Pygmy Perch with it being the only tributary of the Blackwood River in which this fish reproduces. While this species moves into the upper reaches of Milyeannup Brook to breed, it retreated back to within ~1300 m of the Blackwood River in the dry months; suggesting that only ~52% of the ~2500 m base flow stream length contained suitable habitat (e.g. adequate depth) for this species. This perennial tributary also provided important spawning habitat to other freshwater species and fostered earlier recruitment of some species. The low base flow population of the Balston’s Pygmy Perch results in it being particularly vulnerable to habitat decline; particularly if summer base flow to this tributary is reduced significantly and main channel summer water quality also declines. A number of key knowledge gaps and recommendations pertaining to the ecology of the fish communities have been identified in this study including:
• The degree of interannual variation in migration patterns and groundwater reliance of these communities should be determined by precise replication of the methods described here; this would represent a solid baseline dataset for an ongoing monitoring programme.
• Salinity tolerances of these species should be determined in light of predicted potential further increased main channel salinities due to summer flow reductions to determine critical thresholds for maintenance of summer populations.
• Critical riffle zones in the Blackwood River need to be identified and Freshwater Cobbler migration ability precise determined as a basis for ongoing monitoring of river connectivity.
• Poison Gully should be included in future determination of interannual variation in migration patterns to determine its ecological significance in terms of aquatic fauna.
• To determine whether the Blackwood River main channel is causing biological isolation due to elevated salinities, the degree of genetic isolation of specific species of fish and crayfish between tributaries should be determined.

129
REFERENCES Austin, C. M. and Knott, B. (1996). Systematics of the freshwater crayfish genus
Cherax Erichson (Decapoda: Parastacidae) in south‐western Australia: Electrophoretic, Morphological and Habitat Variation. Australian Journal of Zoology 44: 223‐58.
Beatty, S.J., Morgan, D.L. and Gill, H.S. (2003). Reproductive biology of the large freshwater crayfish Cherax cainii in south‐western Australia. Marine & Freshwater Research 54: 597‐608.
Beatty, S.J., Morgan, D.L. and Gill, H.S. (2004). Biology of a translocated population of the large freshwater crayfish, Cherax cainii (Austin & Ryan, 2002) in a Western Australian river. Crustaceana 77(11): 1329‐1351.
Beatty, S.J., Morgan, D.L. and Gill, H.S. (2005). Life history and reproductive biology of the gilgie Cherax quinquecarinatus, a freshwater crayfish endemic to south‐western Australia Journal of Crustacean Biology 25(2): 251‐262.
Boulton, A.J. and Hancock, P.J. (2006). Rivers as groundwater‐dependent ecosystems: a review of degrees of dependency, riverine processes and management implications. Australian Journal of Botany 54: 133‐144.
Centre of Excellence in Natural Resource Management (2005) Ecological water requirements of the Blackwood River and tributaries – Nannup to Hut Pool. Report for the Water Corporation of Western Australia, February 2005., pg 11
Crandall, K.A., Fetzner, J.W., Lawler, S.H., Kinnersley, M., and Austin, C.M. (1999). Phylogenetic relationships among the Australian and New Zealand genera of freshwater crayfishes (Decapoda : Parastacidae). Australian Journal of Zoology 47: 199–214.
Freeze, R.A. and Cherry, J.A. (1979). Groundwater. Prentice Hall, New Jersey. Gill, H.S., Hambleton, S.J., and Morgan, D.L. (1999). Is Gambusia holbrooki a major
threat to the native freshwater fishes of south‐western Australia? In Seret, B. & Sire, J.‐Y., (eds). Proceedings 5th Indo‐Pacific Fish Conference (Noumea, 3‐8 November1997). pp. 79‐87. Paris: Societe Francaise d’Ichtyologie & Institut de Recherche pour le Development.
Gill, H.S., Renaud, C.B., Chapleau, F., Mayden, R.L., and Potter, I.C. (2003). Phylogeny of Living Parasitic Lampreys (Petromyzontiformes) Based on Morphological Data. Copeia, 2003(4): 687‐703.
Gill, H.S., Wise, B.S., Potter, I.C. and Chaplin, J.A. (1996). Biannual spawning periods and resultant divergent patterns of growth in the estuarine goby Pseudogobius olorum: temperature‐induced? Marine Biology 125: 453‐466.
Hatton, T. and Evans, R. (1998). Dependence of ecosystems on groundwater and its significance to Australia. Land and Water Resources Research and Development Corporation, Canberra.
Hayashi, M. and Rosenberry, D.O. (2002). Effects of ground water exchange on the hydrology and ecology of surface water. Ground Water 40(3): 309‐316.
Humphreys, W.F. (2006). Aquifers: the ultimate groundwater‐dependent ecosystems. Australian Journal of Botany 54: 115‐132.

130
Horwitz, P. and Adams, M. (2000). The systematics, biogeography and conservation status of species in the freshwater crayfish genus Engaewa Riek (Decapoda: Parastacidae) from south‐western Australia. Invertebrate Taxonomy 14: 655‐680.
Morgan, D. and Beatty, S. (2004). Monitoring the Lion’s Weir Fishway Hotham River, Western Australia. Report to the Department of Environment, Government of Western Australia.
Morgan, D.L., and Beatty, S.J. (2005). Baseline study on the fish and freshwater crayfish fauna in the Blackwood River and its tributaries receiving discharge from the Yarragadee Aquifer. Murdoch University, Western Australia).
Morgan, D.L. and Gill, H.S. (2000). Fish associations within the different inland habitats of lower south‐western Australia. Records of the Western Australian Museum 20: 31‐37.
Morgan, D.L., Gill, H.S. and Potter, I.C. (1995). Life cycle, growth and diet of Balstonʹs pygmy perch in its natural habitat of acidic pools. Journal of Fish Biology 47: 808‐825.
Morgan, D. L., Gill, H. S., and Potter, I. C. (1998). Distribution, identification and biology of freshwater fishes in south‐western Australia. Records of the Western Australian Museum Supplement No. 56. 97 pp.
Morgan, D.L., Thorburn. D.C. and Gill, H.S. (2003). Salinization of south‐western Western Australian rivers and the implications for the inland fish fauna – the Blackwood River, a case study. Pacific Conservation Biology 9: 161‐171.
Morgan, D., Beatty, S., Gill, H., Thorburn, D. and Rowland, A. (2004). Assessment of groundwater discharge from the Yarragadee Aquifer on the fish and decapod fauna of Rosa Brook. Report to the Water Corporation of Western Australia.
Morrissy, N. M. (1978). The past and present distribution of marron, Cherax tenuimanus, in Western Australia. Fisheries Research Bulletin of Western Australia 22: 1–38.
Murray, B.R., Zeppel, M.J.B., Hose, G.C., Eamus, D. (2003). Groundwater‐dependent ecosystems in Australia: it’s more than just water for rivers. Ecological Management & Restoration 4: 110‐113.
Nickoll, R., and Horwitz, P. (2000). Evaluating flagship species for ecosystem restoration: a case study involving freshwater crayfish and a river in southwestern Australia. In ‘Nature Conservation 5: Nature Conservation in Production Environments: Managing the Matrix.’ (Eds J. I. Craig, N. Mitchell, and D. A. Saunders.) pp. 557–64. (Surrey Beatty and Sons, 2000.)
Pen, L.J. and Potter, I.C. (1991) Reproduction, growth and diet of Gambusia holbrooki (Girard) in a temperate Australian river. Aquatic Conservation: Marine and Freshwater Ecosystems, 1(2): 159‐172.
Pen, L.J., Potter, I.C. and Hilliard, R.W. (1991). Biology of Galaxiella munda McDowall (Teleostei: Galaxiidae), including a comparison of the reproductive strategies of this and three other local species. Journal of Fish Biology 39: 717‐731.
Petts, G.E., Bickerton, M.A., Crawford, C., Lerner, D.N. and Evans, D. (1999). Flow management to sustain groundwater‐dominated stream ecosystems. Hydrological Processes 13: 497‐513.

131
Potter, I.C. (1980). The Petromyzoniformes with particular reference to paired species. Canadian Journal of Fisheries and Aquatic Science, 37(11): 1595‐1615.
Potter, I.C., Hilliard, R.W. and Bird, D.J. (1980). Metamorphosis in the southern hemisphere lamprey, Geotria australis. Journal of Zoology, 190(3): 405‐430.
Potter, I.C. and Hilliard, R.W. (1987). A proposal for the functional and phylogenetic significance of differences in the dentition of lampreys (Agnatha: Petromyzontiformes). Journal of Zoology. 212(4): 713‐737.
Potter, I.C. Hilliard, R.W. and Neira, F.J. (1986). The biology of Australian lampreys. Deckker, Pde; Williams, WD (eds).
Power, G., Brown, R.S. and Imhof, J.G. (1999). Groundwater and fish – insights from northern North America. Hydrological Processes 13: 401‐422.
Sear, D.A., Armitage, P.D. and Dawson, F.H. (1999). Groundwater dominated rivers. Hydrological Processes 13: 255‐276.
SPSS (2005). Statistical Package Version 14.0 for WindowsTM. Strategen (2006) South West Yarragadee Water Supply Development: Sustainability
Evaluation/Environmental Review & Management Programme Volume 2. Report for the Water Corporation, February 2006.
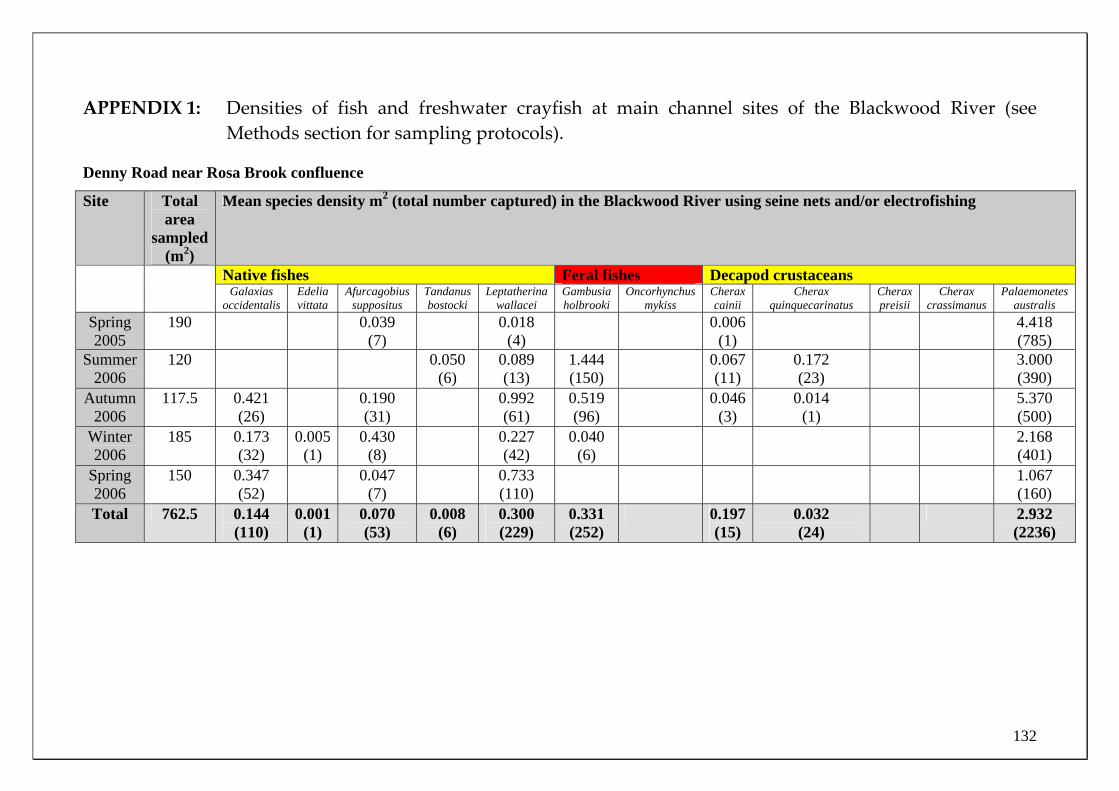
132
APPENDIX 1: Densities of fish and freshwater crayfish at main channel sites of the Blackwood River (see Methods section for sampling protocols).
Denny Road near Rosa Brook confluence
Site Total area
sampled (m2)
Mean species density m2 (total number captured) in the Blackwood River using seine nets and/or electrofishing
Native fishes Feral fishes Decapod crustaceans Galaxias
occidentalis Edelia vittata
Afurcagobius suppositus
Tandanus bostocki
Leptatherina wallacei
Gambusia holbrooki
Oncorhynchus mykiss
Cherax cainii
Cherax quinquecarinatus
Cherax preisii
Cherax crassimanus
Palaemonetes australis
Spring 2005
190 0.039 (7)
0.018 (4)
0.006 (1)
4.418 (785)
Summer 2006
120 0.050 (6)
0.089 (13)
1.444 (150)
0.067 (11)
0.172 (23)
3.000 (390)
Autumn 2006
117.5 0.421 (26)
0.190 (31)
0.992 (61)
0.519 (96)
0.046 (3)
0.014 (1)
5.370 (500)
Winter 2006
185 0.173 (32)
0.005 (1)
0.430 (8)
0.227 (42)
0.040 (6)
2.168 (401)
Spring 2006
150 0.347 (52)
0.047 (7)
0.733 (110)
1.067 (160)
Total 762.5 0.144 (110)
0.001 (1)
0.070 (53)
0.008 (6)
0.300 (229)
0.331 (252)
0.197 (15)
0.032 (24)
2.932 (2236)
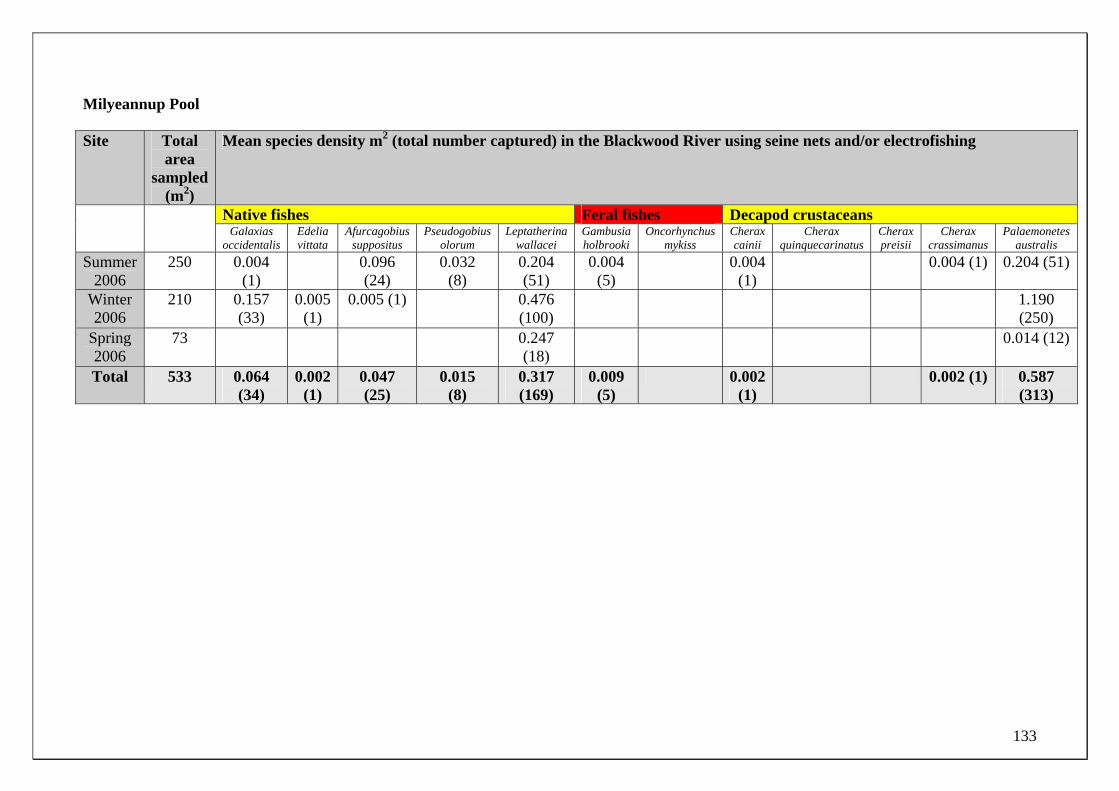
133
Milyeannup Pool
Site Total area
sampled (m2)
Mean species density m2 (total number captured) in the Blackwood River using seine nets and/or electrofishing
Native fishes Feral fishes Decapod crustaceans Galaxias
occidentalis Edelia vittata
Afurcagobius suppositus
Pseudogobius olorum
Leptatherina wallacei
Gambusia holbrooki
Oncorhynchus mykiss
Cherax cainii
Cherax quinquecarinatus
Cherax preisii
Cherax crassimanus
Palaemonetes australis
Summer 2006
250 0.004 (1)
0.096 (24)
0.032 (8)
0.204 (51)
0.004 (5)
0.004 (1)
0.004 (1) 0.204 (51)
Winter 2006
210 0.157 (33)
0.005 (1)
0.005 (1) 0.476 (100)
1.190 (250)
Spring 2006
73 0.247 (18)
0.014 (12)
Total 533 0.064 (34)
0.002 (1)
0.047 (25)
0.015 (8)
0.317 (169)
0.009 (5)
0.002 (1)
0.002 (1) 0.587 (313)
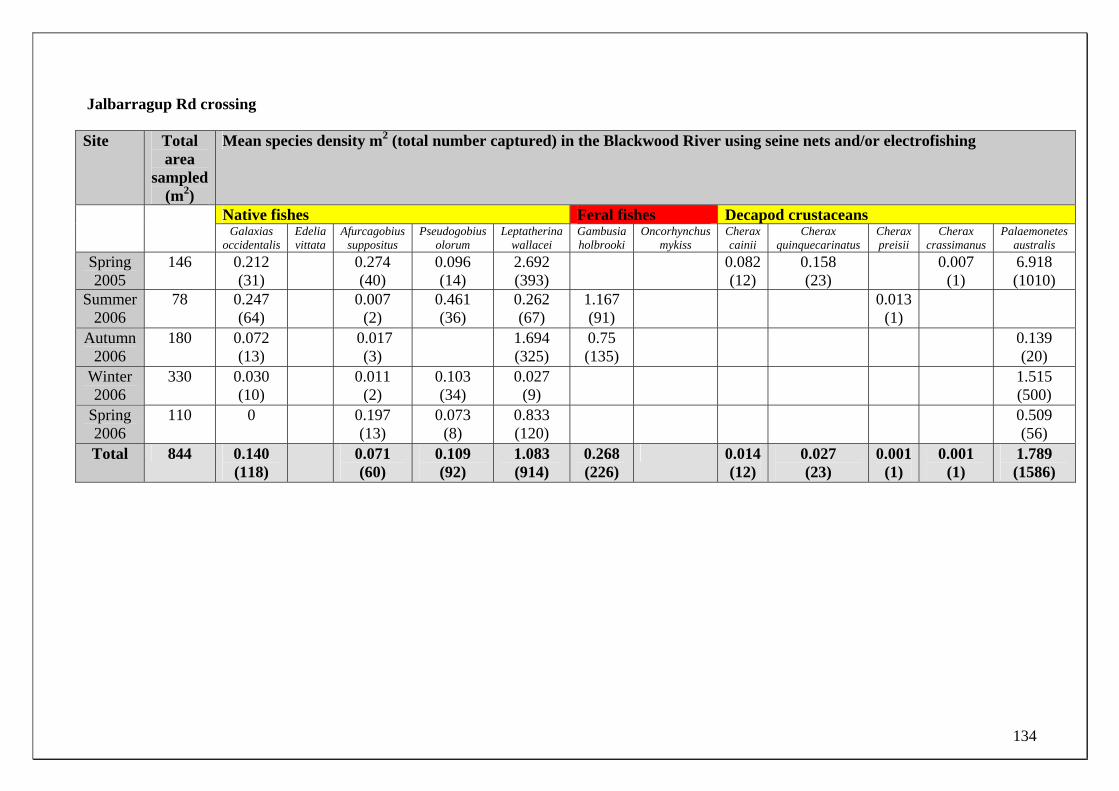
134
Jalbarragup Rd crossing
Site Total area
sampled (m2)
Mean species density m2 (total number captured) in the Blackwood River using seine nets and/or electrofishing
Native fishes Feral fishes Decapod crustaceans Galaxias
occidentalis Edelia vittata
Afurcagobius suppositus
Pseudogobius olorum
Leptatherina wallacei
Gambusia holbrooki
Oncorhynchus mykiss
Cherax cainii
Cherax quinquecarinatus
Cherax preisii
Cherax crassimanus
Palaemonetes australis
Spring 2005
146 0.212 (31)
0.274 (40)
0.096 (14)
2.692 (393)
0.082 (12)
0.158 (23)
0.007 (1)
6.918 (1010)
Summer 2006
78 0.247 (64)
0.007 (2)
0.461 (36)
0.262 (67)
1.167 (91)
0.013 (1)
Autumn 2006
180 0.072 (13)
0.017 (3)
1.694 (325)
0.75 (135)
0.139 (20)
Winter 2006
330 0.030 (10)
0.011 (2)
0.103 (34)
0.027 (9)
1.515 (500)
Spring 2006
110 0 0.197 (13)
0.073 (8)
0.833 (120)
0.509 (56)
Total 844 0.140 (118)
0.071 (60)
0.109 (92)
1.083 (914)
0.268 (226)
0.014 (12)
0.027 (23)
0.001 (1)
0.001 (1)
1.789 (1586)
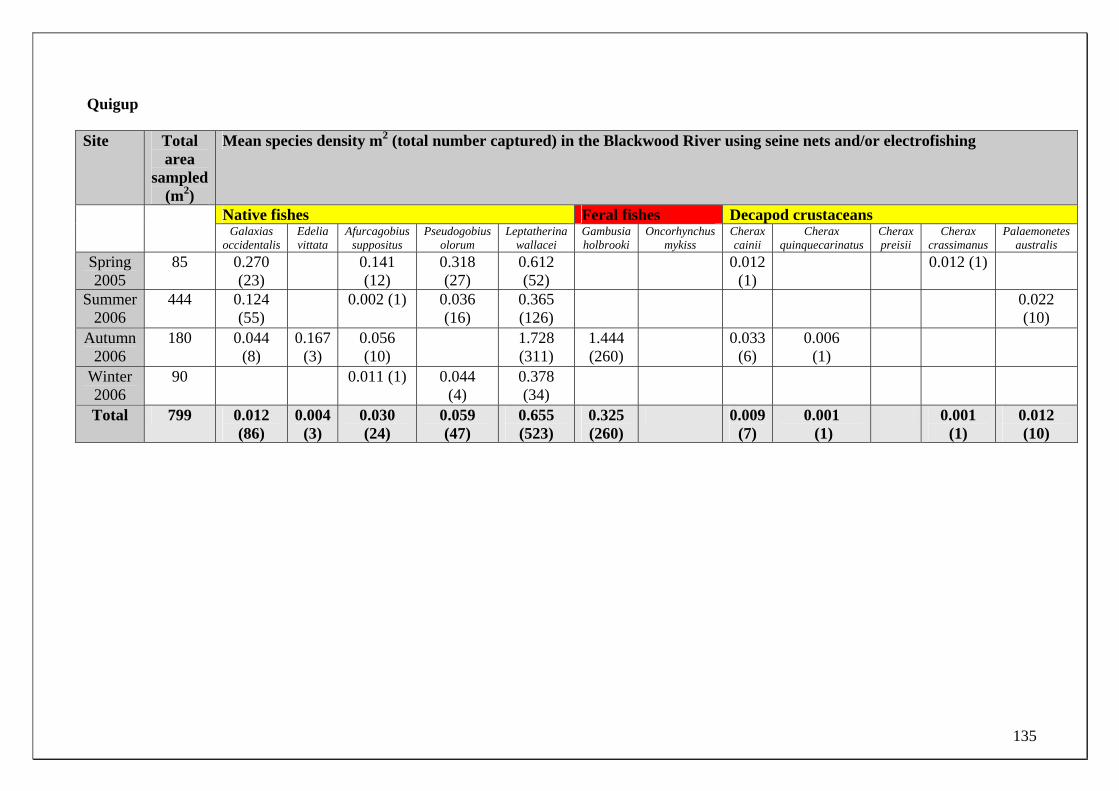
135
Quigup
Site Total area
sampled (m2)
Mean species density m2 (total number captured) in the Blackwood River using seine nets and/or electrofishing
Native fishes Feral fishes Decapod crustaceans Galaxias
occidentalis Edelia vittata
Afurcagobius suppositus
Pseudogobius olorum
Leptatherina wallacei
Gambusia holbrooki
Oncorhynchus mykiss
Cherax cainii
Cherax quinquecarinatus
Cherax preisii
Cherax crassimanus
Palaemonetes australis
Spring 2005
85 0.270 (23)
0.141 (12)
0.318 (27)
0.612 (52)
0.012 (1)
0.012 (1)
Summer 2006
444 0.124 (55)
0.002 (1) 0.036 (16)
0.365 (126)
0.022 (10)
Autumn 2006
180 0.044 (8)
0.167 (3)
0.056 (10)
1.728 (311)
1.444 (260)
0.033 (6)
0.006 (1)
Winter 2006
90 0.011 (1) 0.044 (4)
0.378 (34)
Total 799 0.012 (86)
0.004 (3)
0.030 (24)
0.059 (47)
0.655 (523)
0.325 (260)
0.009 (7)
0.001 (1)
0.001 (1)
0.012 (10)

136
APPENDIX 2: Densities of fish and freshwater crayfish at tributary sites of the Blackwood River (see Methods section for sampling protocols).
Poison Gully
Mean species density m2 (total number captured) using seine nets and/or electrofishing. Season Total area
sampled (m2)
Native fishes Feral fishes Freshwater crayfishes
Nannatherina balstoni
Galaxias occidentalis
Edelia vittata
Bostockia porosa
Galaxiella munda
Afurcagobius suppositus
Gambusia holbrooki
Oncorhynchus mykiss
Cherax cainii
Cherax quinquecarinatus
Cherax preisii
Cherax crassimanus
Spring 2005
90 0.033 (4)
0.008 (1)
0.012 (2)
0.008 (1)
0.017 (2)
0.344 (31)
0.081 (8)
Summer 2006
90 0.042 (2)
0.03 (2)
0.008 (1)
0.733 (56)
Autumn 2006
40 0.05 (19)
0.045 (2)
Winter 2006
20 1.33 (20)
0.067 (1)
0.6 (12)
Total 240 0.520 (45)
0.015 (3)
0.033 (5)
0.002 (2)
0.005 (2)
0.390 (104)
0.009 (3)
0.022 (8)
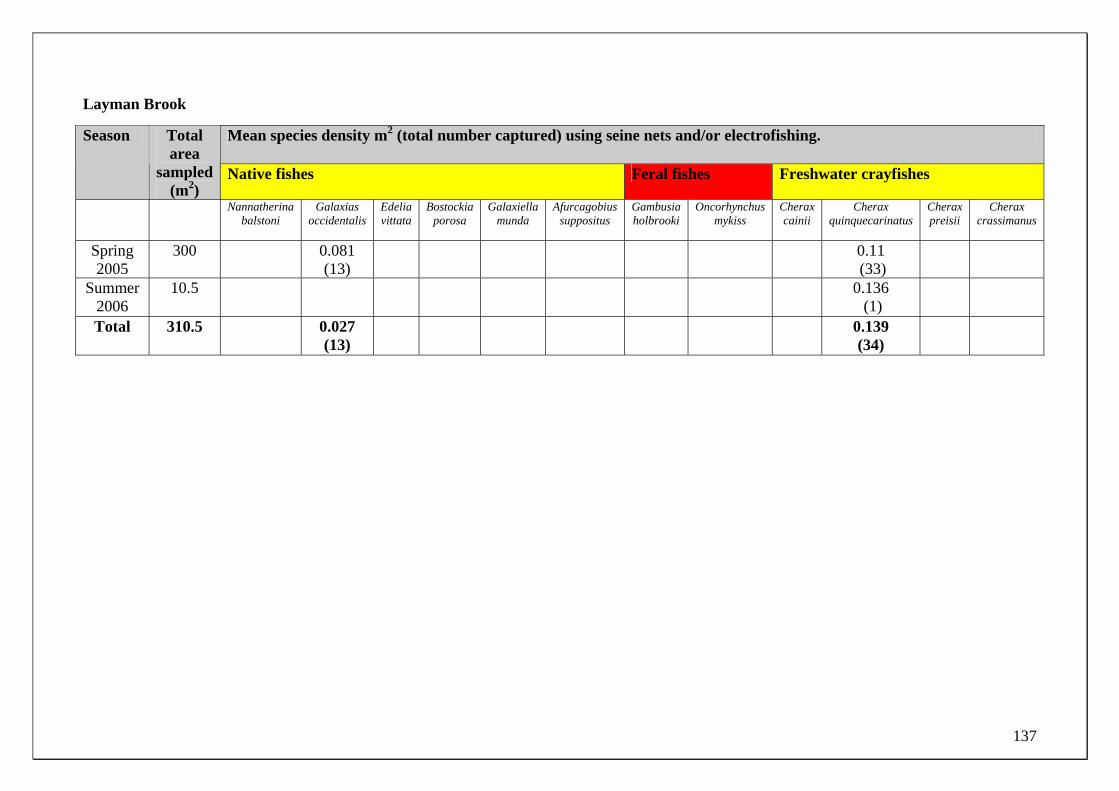
137
Layman Brook
Mean species density m2 (total number captured) using seine nets and/or electrofishing. Season Total area
sampled (m2)
Native fishes Feral fishes Freshwater crayfishes
Nannatherina balstoni
Galaxias occidentalis
Edelia vittata
Bostockia porosa
Galaxiella munda
Afurcagobius suppositus
Gambusia holbrooki
Oncorhynchus mykiss
Cherax cainii
Cherax quinquecarinatus
Cherax preisii
Cherax crassimanus
Spring 2005
300 0.081 (13)
0.11 (33)
Summer 2006
10.5 0.136 (1)
Total 310.5 0.027 (13)
0.139 (34)
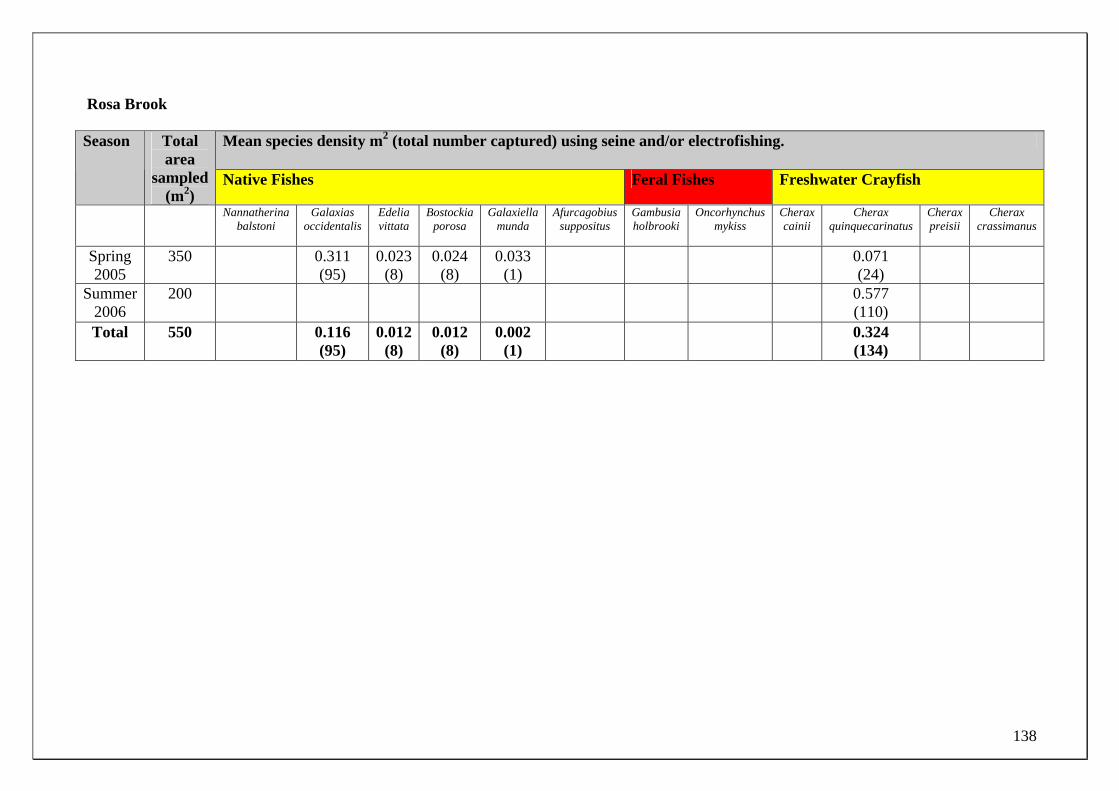
138
Rosa Brook
Mean species density m2 (total number captured) using seine and/or electrofishing. Season Total area
sampled (m2)
Native Fishes Feral Fishes Freshwater Crayfish
Nannatherina balstoni
Galaxias occidentalis
Edelia vittata
Bostockia porosa
Galaxiella munda
Afurcagobius suppositus
Gambusia holbrooki
Oncorhynchus mykiss
Cherax cainii
Cherax quinquecarinatus
Cherax preisii
Cherax crassimanus
Spring 2005
350 0.311 (95)
0.023 (8)
0.024 (8)
0.033 (1)
0.071 (24)
Summer 2006
200 0.577 (110)
Total 550 0.116 (95)
0.012 (8)
0.012 (8)
0.002 (1)
0.324 (134)
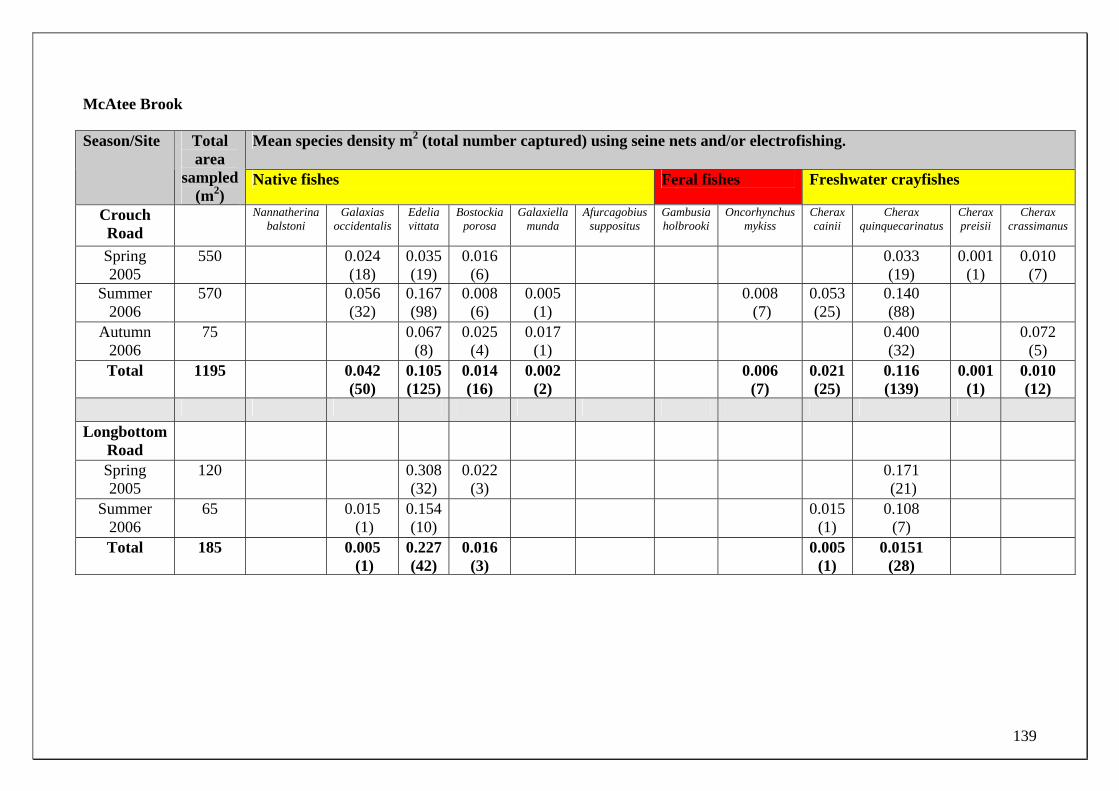
139
McAtee Brook
Mean species density m2 (total number captured) using seine nets and/or electrofishing. Season/Site Total area
sampled (m2)
Native fishes Feral fishes Freshwater crayfishes
Crouch Road
Nannatherina balstoni
Galaxias occidentalis
Edelia vittata
Bostockia porosa
Galaxiella munda
Afurcagobius suppositus
Gambusia holbrooki
Oncorhynchus mykiss
Cherax cainii
Cherax quinquecarinatus
Cherax preisii
Cherax crassimanus
Spring 2005
550 0.024 (18)
0.035 (19)
0.016 (6)
0.033 (19)
0.001 (1)
0.010 (7)
Summer 2006
570 0.056 (32)
0.167 (98)
0.008 (6)
0.005 (1)
0.008 (7)
0.053 (25)
0.140 (88)
Autumn 2006
75 0.067 (8)
0.025 (4)
0.017 (1)
0.400 (32)
0.072 (5)
Total 1195 0.042 (50)
0.105 (125)
0.014 (16)
0.002 (2)
0.006 (7)
0.021 (25)
0.116 (139)
0.001 (1)
0.010 (12)
Longbottom
Road
Spring 2005
120 0.308 (32)
0.022 (3)
0.171 (21)
Summer 2006
65 0.015 (1)
0.154 (10)
0.015 (1)
0.108 (7)
Total 185 0.005 (1)
0.227 (42)
0.016 (3)
0.005 (1)
0.0151 (28)

140
Section 2
Crayfish burrowing activity in the region of the Yarragadee Discharge Zone, Blackwood River
A Koenders & PHJ Horwitz

141
AIMS AND OBJECTIVES The overall study aimed to develop an understanding of how fish and freshwater crayfish utilise the Blackwood River and tributaries throughout the seasons, and how this movement may be related to changes in flow, groundwater discharge, and/or water physicochemistry. Information on flows and water physicochemistry has been gathered with the aim of linking changes in these attributes to patterns of fauna movements. The study specifically examines the significance of the year‐round input of fresh groundwater baseflow from the Yarragadee Aquifer to the fauna. The findings will assist the Department of Environment in identifying key parts of the river system being utilised by the endemic fauna and in characterising critical components or attributes of the water regime that are required to maintain them. Within this overall project, an investigation of the freshwater crayfish burrowing activity was conducted to:
a) determine the seasonal changes to burrowing activity for each species at each site chosen, and relate this to groundwater/surface water changes; and
b) relate these changes to the occurrence of different species in surface waters over the duration of the investigation.
These field investigations enabled us to make limited predictions about the effects of groundwater changes on freshwater crayfish distribution and abundance in the area of interest. A separate preliminary investigation sought to determine whether the Yarragadee discharge in the study area could be chemically characterised (and therefore whether fish or crayfish species might be able to detect its presence as part of their migratory or homing behaviour). This report provides:
a) results for both the burrowing activity and the water physicochemistry components of the study;
b) a discussion of the methods used to examine the relationships between burrowing freshwater crayfish and ground and surface water level changes; and
c) a series of suggestions and recommendations for areas of work required for a successful determination of critical questions that preliminary investigations raise.

142
CRAYFISH BURROWING
METHODS Transect establishment and design Transect sites were selected to provide some comparative information about ‘treatment’ systems receiving a prominent discharge from the Yarragadee aquifer (Milyeannup Brook and Poison Gully) and those not receiving such a discharge (Layman Brook, Rosa Brook and McAtee Brook). Important flowing water geomorphological habitats to be compared are headwaters, gullies (more deeply incised) and swamp gullies and tributaries of the streams (Table 1, with full details of transects in Appendix A). It was considered essential to gather faunal and water parameter data in this context, and from a full seasonal perspective. Table 1 Transect comparisons. Type of site ‘Treatment’ transect Control transect Headwater Rosa Brook, RB3a Layman Brook, LB2 Gully Milyeannup Brook, MB2 Rosa Brook, RB2a McAtee Brook, MC2a Layman Brook, LB1a Gully (swamp) Poison Gully, PG1 Rosa Brook, RB3b Milyeannup Brook, MB4 Western flowing tributary
Rosa Brook, RB2b
McAtee Brook, MC2b Layman Brook, LB1b Eastern flowing tributary
(Milyeannup Brook, MB4) Rosa Brook, RB3b
Transects were marked at one end with a star picket on the left bank facing downstream and at the other end with a piezometer on the opposite bank. Transects have been mapped and are between 13 and 70 m in length, depending on the terrain. From 2 to 5 quadrats were mapped along each transect, again depending on terrain and transect length. Water characteristics At each transect, surface water depth (and groundwater depth where possible) were measured and temperature, pH and conductivity of each recorded (using portable calibrated WTW water meters). A 500 mL sample of surface water and, where possible purged groundwater, were collected from each transect. Water samples were kept on ice until taken to the lab where they were stored at ‐20 oC until analysis.

143
In addition, 50 mL of water was filtered using a Whatman glass fibre filter (45 nm filter pore size) in a filter attachment to a syringe and acidified with 1 mL of 14 M nitric acid. All containers and other items used to handle water samples had been acid rinsed with 1% HCl.
A. B.
C. D.
E. F. Figure 1 Examples of transect details.
A. Piezometer, Layman Brook downstream tributary; B. Measurement of water level at Rosa Brook, Mowen Road; C. Extending measuring tape along transect from stake to piezometer, downstream tributary of Layman Brook; D. Measuring water parameters at St Patrick’s Elbow on Blackwood River; E. Artificial burrows at Poison Gully downstream site; F. Searching for burrows at Rosa Brook, Mowen Road.

144
Crayfish burrow monitoring Estimation of burrow densities Burrow densities are calculated for the number of burrows per metre of transect. Counting of burrows during October to December 2005 was undertaken for up to 5 sections of each transect. Each section was approximately 1 m in length, spaced along the transect in burrow hotspots, and the number of burrows counted where they occurred within a metre of the transect line. This method was amended in January 2006 and thereafter to count burrows along the full length of each transect. As burrows are distributed in clumps, burrow densities between the two collection periods are not equivalent and some correction was needed. The most comprehensive data available are for MB4, so this transect was used to obtain a correction factor that was then applied to all transects. Burrow density was calculated for December 2005, the time when water levels were low and the greatest number of burrows was visible, using the total length of all quadrats searched. This value was 4.46 burrows/m. Burrow density for January 2006 was obtained by using the total length of the transect and was 0.53 burrows/m. This indicates that burrow density using quadrat searching is overestimated by a factor of 8.4 (4.46/0.53). Therefore, burrow densities from October to December 2005 were corrected by dividing by 8.4 for all transects. The only transects for which this was not done were those that went across deep gullies, where the quadrats coincided with the functional transect, i.e. MB2, RB2a and RB3a. Burrow classification Burrows were classified by habitat according to Horwitz and Richardson (1986)1. Note that this scheme is dependent on water level. As water levels changed dramatically in many transects, the habitat type of most burrows depended on the season. In addition to burrowing habitat type, indirect evidence of burrowing activity was recorded for each burrow as one of three character states: open, soil pellets or plug (see Figure 2). Some burrows simply opened as an entrance hole in the ground. Fresh soil pellets around a burrow entrance were interpreted as evidence of recent burrowing activity. Burrows with their entrance completely blocked with a soil plug were also observed, and taken to be evidence of complete closure of a burrow system to retain moisture during drier seasons. A qualitative appraisal of soil type was recorded.
1 Horwitz PHJ & Richardson AMM. 1986. An ecological classification of the burrows of Australian freshwater crayfish. Aust. J. Mar. Freshw. Res. 37, 237-242.
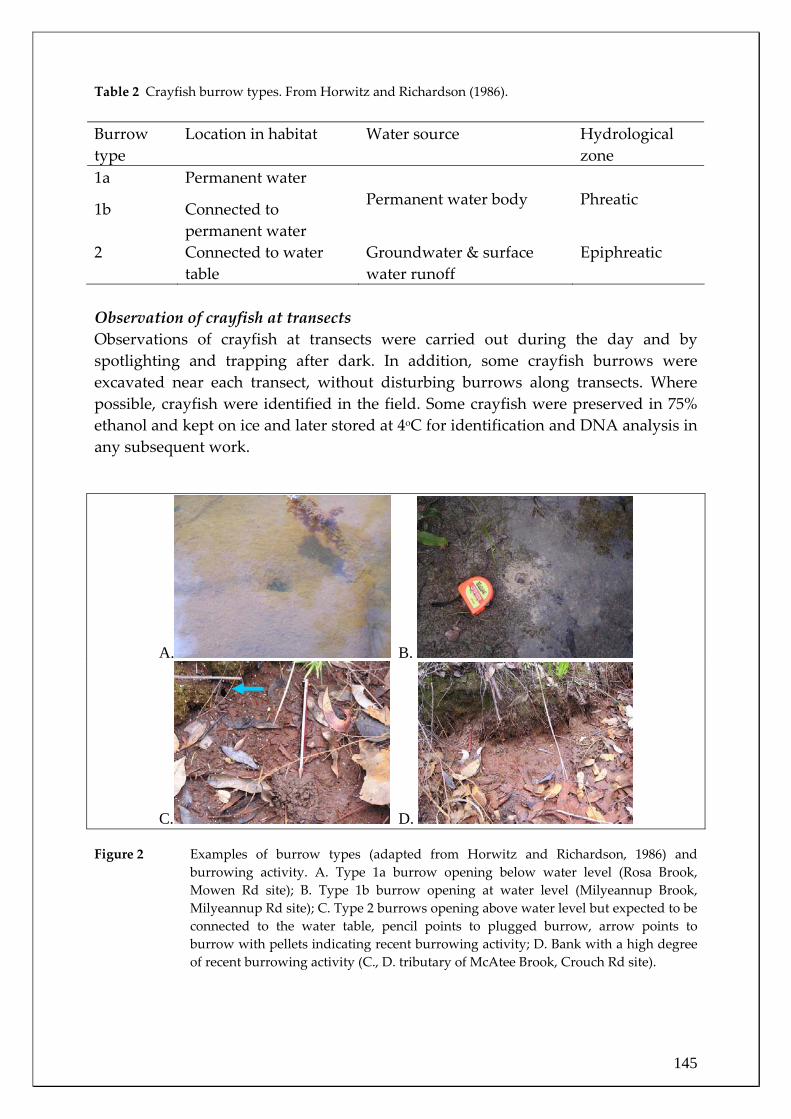
145
Table 2 Crayfish burrow types. From Horwitz and Richardson (1986). Burrow type
Location in habitat Water source Hydrological zone
1a Permanent water
1b Connected to permanent water
Permanent water body
Phreatic
2 Connected to water table
Groundwater & surface water runoff
Epiphreatic
Observation of crayfish at transects Observations of crayfish at transects were carried out during the day and by spotlighting and trapping after dark. In addition, some crayfish burrows were excavated near each transect, without disturbing burrows along transects. Where possible, crayfish were identified in the field. Some crayfish were preserved in 75% ethanol and kept on ice and later stored at 4oC for identification and DNA analysis in any subsequent work.
A. B.
C. D. Figure 2 Examples of burrow types (adapted from Horwitz and Richardson, 1986) and
burrowing activity. A. Type 1a burrow opening below water level (Rosa Brook, Mowen Rd site); B. Type 1b burrow opening at water level (Milyeannup Brook, Milyeannup Rd site); C. Type 2 burrows opening above water level but expected to be connected to the water table, pencil points to plugged burrow, arrow points to burrow with pellets indicating recent burrowing activity; D. Bank with a high degree of recent burrowing activity (C., D. tributary of McAtee Brook, Crouch Rd site).
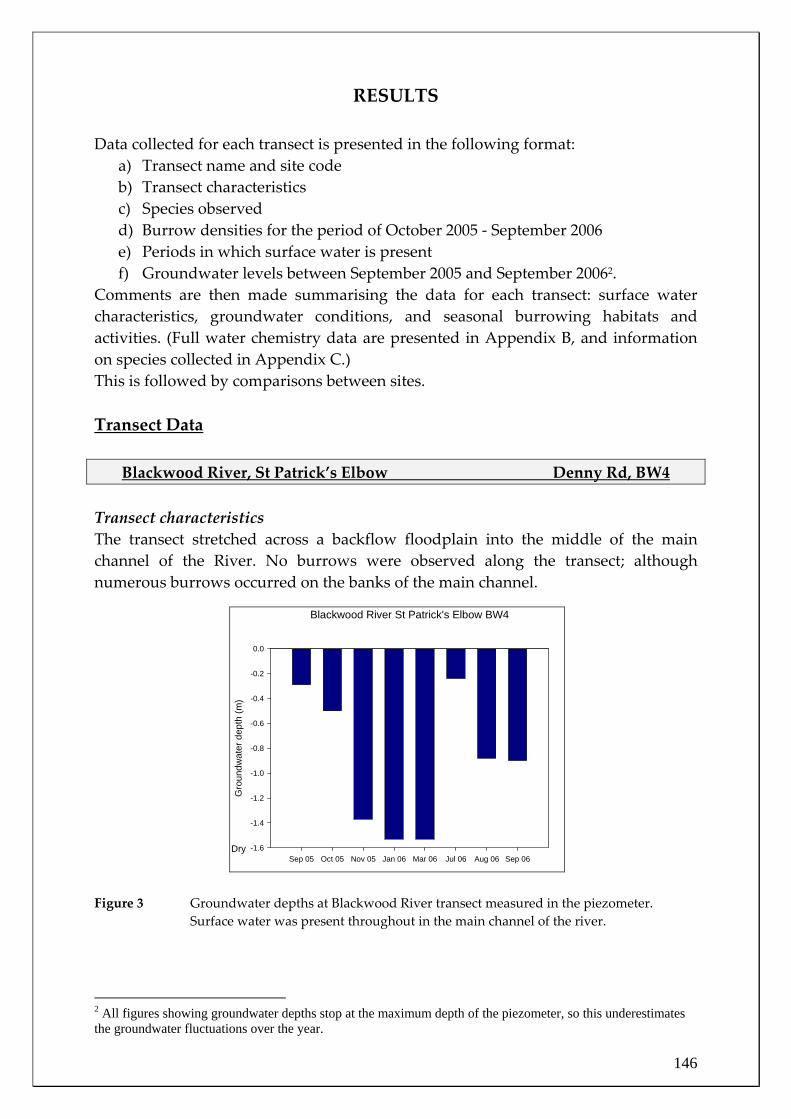
146
RESULTS
Data collected for each transect is presented in the following format: a) Transect name and site code b) Transect characteristics c) Species observed d) Burrow densities for the period of October 2005 ‐ September 2006 e) Periods in which surface water is present f) Groundwater levels between September 2005 and September 20062.
Comments are then made summarising the data for each transect: surface water characteristics, groundwater conditions, and seasonal burrowing habitats and activities. (Full water chemistry data are presented in Appendix B, and information on species collected in Appendix C.) This is followed by comparisons between sites. Transect Data
Blackwood River, St Patrick’s Elbow Denny Rd, BW4 Transect characteristics The transect stretched across a backflow floodplain into the middle of the main channel of the River. No burrows were observed along the transect; although numerous burrows occurred on the banks of the main channel. Figure 3 Groundwater depths at Blackwood River transect measured in the piezometer.
Surface water was present throughout in the main channel of the river.
2 All figures showing groundwater depths stop at the maximum depth of the piezometer, so this underestimates the groundwater fluctuations over the year.
Blackwood River St Patrick's Elbow BW4
Sep 05 Oct 05 Nov 05 Jan 06 Mar 06 Jul 06 Aug 06 Sep 06
Gro
undw
ater
dep
th (m
)
-1.6
-1.4
-1.2
-1.0
-0.8
-0.6
-0.4
-0.2
0.0
Dry
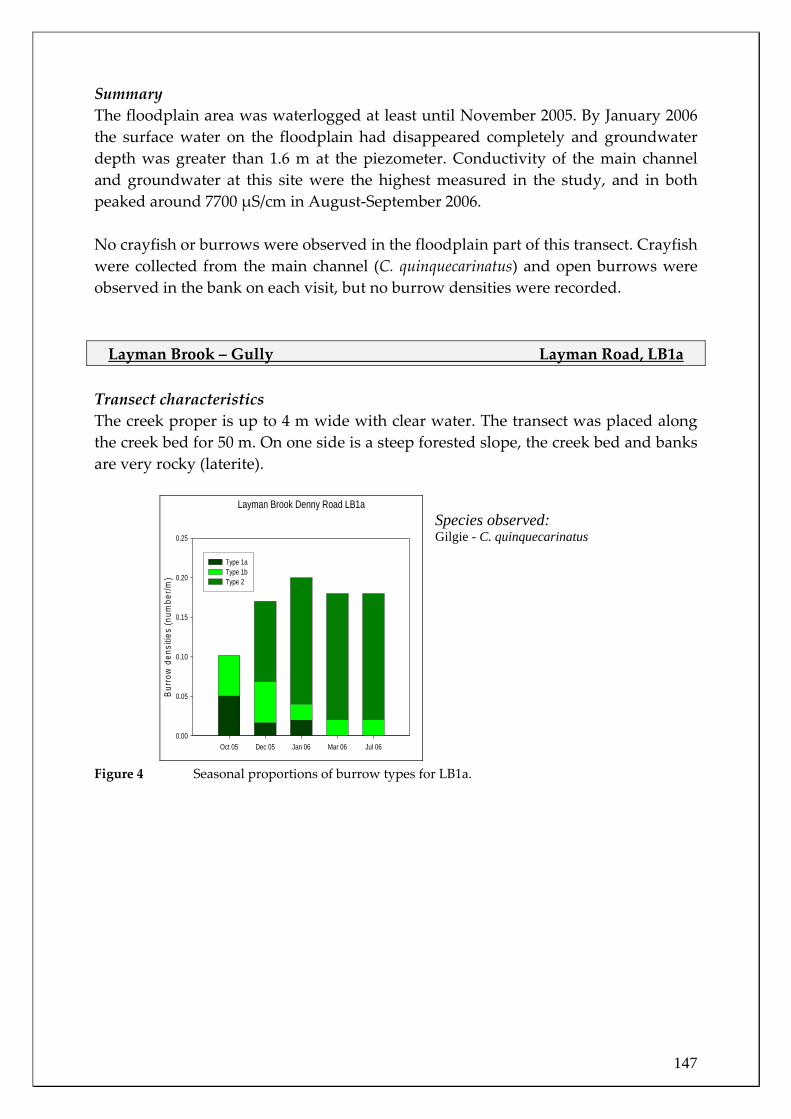
147
Summary The floodplain area was waterlogged at least until November 2005. By January 2006 the surface water on the floodplain had disappeared completely and groundwater depth was greater than 1.6 m at the piezometer. Conductivity of the main channel and groundwater at this site were the highest measured in the study, and in both peaked around 7700 μS/cm in August‐September 2006. No crayfish or burrows were observed in the floodplain part of this transect. Crayfish were collected from the main channel (C. quinquecarinatus) and open burrows were observed in the bank on each visit, but no burrow densities were recorded. Layman Brook – Gully Layman Road, LB1a
Transect characteristics The creek proper is up to 4 m wide with clear water. The transect was placed along the creek bed for 50 m. On one side is a steep forested slope, the creek bed and banks are very rocky (laterite).
Species observed: Gilgie - C. quinquecarinatus
Figure 4 Seasonal proportions of burrow types for LB1a.
Layman Brook Denny Road LB1a
Oct 05 Dec 05 Jan 06 Mar 06 Jul 06
Bur
row
den
sitie
s (n
umbe
r/m)
0.00
0.05
0.10
0.15
0.20
0.25
Type 1a Type 1b Type 2
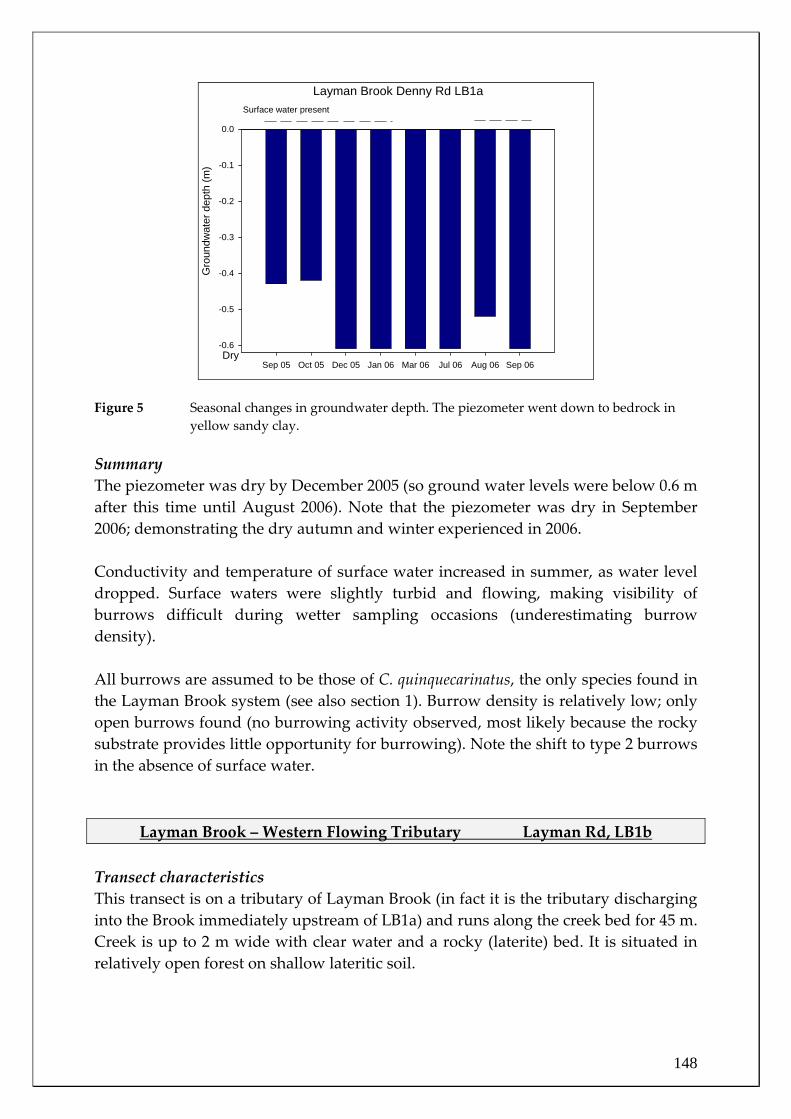
148
Layman Brook Denny Rd LB1a
Sep 05 Oct 05 Dec 05 Jan 06 Mar 06 Jul 06 Aug 06 Sep 06
Gro
undw
ater
dep
th (m
)
-0.6
-0.5
-0.4
-0.3
-0.2
-0.1
0.0
Dry
Surface water present
Figure 5 Seasonal changes in groundwater depth. The piezometer went down to bedrock in yellow sandy clay.
Summary The piezometer was dry by December 2005 (so ground water levels were below 0.6 m after this time until August 2006). Note that the piezometer was dry in September 2006; demonstrating the dry autumn and winter experienced in 2006. Conductivity and temperature of surface water increased in summer, as water level dropped. Surface waters were slightly turbid and flowing, making visibility of burrows difficult during wetter sampling occasions (underestimating burrow density). All burrows are assumed to be those of C. quinquecarinatus, the only species found in the Layman Brook system (see also section 1). Burrow density is relatively low; only open burrows found (no burrowing activity observed, most likely because the rocky substrate provides little opportunity for burrowing). Note the shift to type 2 burrows in the absence of surface water.
Layman Brook – Western Flowing Tributary Layman Rd, LB1b Transect characteristics This transect is on a tributary of Layman Brook (in fact it is the tributary discharging into the Brook immediately upstream of LB1a) and runs along the creek bed for 45 m. Creek is up to 2 m wide with clear water and a rocky (laterite) bed. It is situated in relatively open forest on shallow lateritic soil.

149
Species observed: Gilgie ‐ C. quinquecarinatus
Figure 6 Burrow types. Summary Similar characteristics to main channel at LB1a. Conductivity and temperature of surface water increased in summer, as water level dropped. Conductivity of surface water peaked at 500 μS/cm in January 2006. Groundwater depth was greater than 0.65 m at the piezometer at all months except August 2006, even though surface waters were present. These observations all suggest that the tributary receives runoff, not groundwater discharge. Burrow density is higher than in the main channel, possibly due to a greater amount of clay/loam in creek bed. Overall observable burrow density was highest when the creek was dry, with a shift to type 2 burrows. In summer, all burrows were above water level, however, no burrowing activity was observed (only open burrows found).
Layman Brook – Headwater Crouch Rd, LB2 Transect characteristics Transect (50 m) runs in gully along shallow, 1 m wide creek with clear water and sandy patches interspersed with rocky areas (laterite). Creek in forested area.
Layman Brook Denny Road LB1b
Oct 05 Dec 05 Jan 06 Mar 06 Jul 06 Aug 06 Sep 06
Bur
row
den
sity
(num
ber/m
)
0.0
0.1
0.2
0.3
0.4
Type 1a Type 1b Type 2

150
Species observed: Gilgie ‐ C. quinquecarinatus
Figure 7 Burrow densities for LB2. No burrowing activity observed.
Figure 8 Groundwater depth at LB2. Piezometer down to gravelly clay.
Summary The surface water disappeared after December 2005 and reappeared in August 2006. Surface water was characterised by low conductivity which remained low at all times, peaking at 250 μS/cm in September 2006. Groundwater showed relatively constant levels except for the dry periods between March and July 2006, consistent with the presence or absence of surface water. Burrow densities were intermediate, with all burrows out of water in summer, and all totally submerged when surface water is present, suggesting simply constructed
Layman Brook Crouch Road LB2
Oct 05 Dec 05 Jan 06 Mar 06 Jul 06 Aug 06 Sep 06
Bur
row
den
sity
(num
ber/m
)
0.0
0.2
0.4
0.6
0.8
Type 1a Type 1b Type 2
Layman Brook Crouch Rd LB2
Sep 05 Oct 05 Dec 05 Jan 06 Mar 06 Jul 06 Aug 06 Sep 06
Gro
undw
ater
dep
th (m
)
-0.6
-0.5
-0.4
-0.3
-0.2
-0.1
0.0
Dry
Surface water present

151
burrows without multiple openings. No burrowing activity was observed whilst surface water receded.
Milyeannup Brook ‐ Gully Helyar Rd, MB2 Transect characteristics This short transect (7.5 m) runs across a deeply incised creek gully. Creek is permanently flowing, deeper in winter with constant shallow flow in summer. Creek banks and bed are mostly clay (grey sandy clay over brown clayey sand) with many burrows in them. The creek is crossed by fallen logs and runs through forest.
Species observed: Gilgie ‐ C. quinquecarinatus Marron ‐ C. cainii Restricted Gilgie ‐ C. crassimanus
Figure 9 Burrow densities for MB2. No burrowing activity observed. Summary Surface water conductivity was relatively low, but increasing in summer (270 – 490 μS/cm), although water temperatures remained low (below 18 oC). Very high burrow density (as holes in the bank) were recorded during drier times, with more burrow openings visible at low water levels, probably seriously overestimating the number of crayfish at the site, and the amount of burrowing, rather than recording shallow burrows used by sheltering crayfish in past years. This site had high crayfish diversity; although only open burrows were recorded (no burrowing activity was seen). Steep sided banks, undercut in places, permanent fresh clear and cool water, the presence of coarse woody debris and rocks all contributed to high levels of habitat diversity in the creek, capable of supporting three species of freshwater crayfish (Figure 9), although in section 1, Koonacs were also recorded in this Brook. No piezometer data were available for this site.
Millyeannup Brook Helyar Road MB2
Oct 05 Dec 05 Jan 06 Mar 06 Jul 06 Aug 06 Sep 06
Burr
ow d
ensi
ty (n
umbe
r/m)
0
2
4
6
8
10
Type 1a Type 1b Type 2

152
Milyeannup Brook – Western tributary Milyeannup Rd, MB4 Transect characteristics Long (70 m) meandering transect positioned at the margin of an extensive swamp system that forms the headwater region of Milyeannup Brook. Transect with sandy clayey soil, crossing several ephemeral pools. Wooded, dense shrubby vegetation.
Species observed: Gilgie ‐ C. quinquecarinatus Restricted Gilgie – C. crassimanus Koonac ‐ C. preissii
Figure 10 Burrowing activity for MB4. As this site was dry for most of the study period, all burrows were of type 2.
Figure 11 Groundwater depths for MB4. Piezometer in sandy clayey soil. Summary Water conductivity was low (groundwater up to 400 �S/cm, surface waters lower than this). Surface waters were present only up to October 2005 (did not reappear in the 2006 wet season). Groundwater levels remained very low between March and July 2006 at least, but came very close to the surface by September 2006.
Milyeannup Brook swamp MB4
Oct 05 Nov 05 Jan 06 Mar 06 Jul 06 Aug 06 Sep 06
Burr
owin
g ac
tivity
(% to
tal b
urro
ws)
0
10
20
30
40
Pellets Plug
Surface water present
Milyeannup Brook upstream swamp MB4
Sep 05 Oct 05 Nov 05 Jan 06 Mar 06 Jul 06 Aug 06 Sep 06
Gro
undw
ater
dep
th (m
)
-1.2
-1.0
-0.8
-0.6
-0.4
-0.2
0.0
Dry
Surface water present

153
This site had intermediate burrow density (0.53 burrows/m). Instead of showing burrow densities, Figure 10 shows the proportion of burrow openings with burrowing activity over a seasonal annual sequence. Fresh pellets signify burrowing activity, and the most intensive burrow building/cleaning period occurs immediately prior to surface water drying up, and during the groundwater decline phase. Some burrowing occurred activity again in September 2006 when the surface sediments were saturated. Species diversity was high, and this was the only site where a Koonac was found. Further work is required to determine which species have been burrowing, and whether habitat partitioning is evident
McAtee Brook ‐ Gully Control Crouch Rd, MC2a Transect characteristics: Control gully site with transect (60 m) across creek. Transect incorporates small east flowing tributary, main creek channel and side (overflow) channel in the floodplain area of the creek. Creek bed is wide with flowing water. Main channel with exposed lateritic bedrock.
Species observed: Gilgie – C. quinquecarinatus Marron – C. cainii Restricted Gilgie – C. crassimanus
Figure 12 Burrow densities for MC2a. Little burrowing activity observed, with only one burrow
plugged in December 05.
McAtee Brook Crouch Road MC2a
Oct 05 Dec 05 Jan 06 Mar 06 Jul 06 Aug 06 Sep 06
Bur
row
den
sity
(num
ber/m
)
0.0
0.1
0.2
0.3
0.4
0.5
0.6
0.7
Type 1a Type 1b Type 2
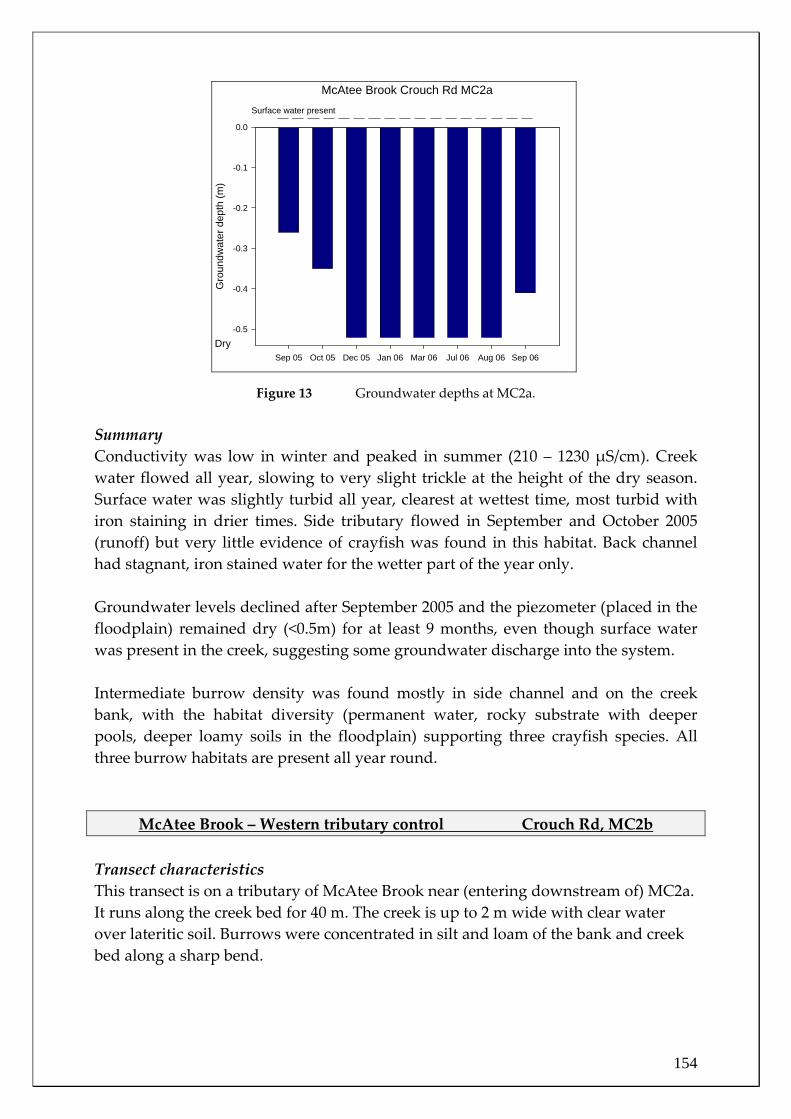
154
Figure 13 Groundwater depths at MC2a. Summary Conductivity was low in winter and peaked in summer (210 – 1230 μS/cm). Creek water flowed all year, slowing to very slight trickle at the height of the dry season. Surface water was slightly turbid all year, clearest at wettest time, most turbid with iron staining in drier times. Side tributary flowed in September and October 2005 (runoff) but very little evidence of crayfish was found in this habitat. Back channel had stagnant, iron stained water for the wetter part of the year only. Groundwater levels declined after September 2005 and the piezometer (placed in the floodplain) remained dry (<0.5m) for at least 9 months, even though surface water was present in the creek, suggesting some groundwater discharge into the system. Intermediate burrow density was found mostly in side channel and on the creek bank, with the habitat diversity (permanent water, rocky substrate with deeper pools, deeper loamy soils in the floodplain) supporting three crayfish species. All three burrow habitats are present all year round.
McAtee Brook – Western tributary control Crouch Rd, MC2b Transect characteristics This transect is on a tributary of McAtee Brook near (entering downstream of) MC2a. It runs along the creek bed for 40 m. The creek is up to 2 m wide with clear water over lateritic soil. Burrows were concentrated in silt and loam of the bank and creek bed along a sharp bend.
McAtee Brook Crouch Rd MC2a
Sep 05 Oct 05 Dec 05 Jan 06 Mar 06 Jul 06 Aug 06 Sep 06
Gro
undw
ater
dep
th (m
)
-0.5
-0.4
-0.3
-0.2
-0.1
0.0
Dry
Surface water present
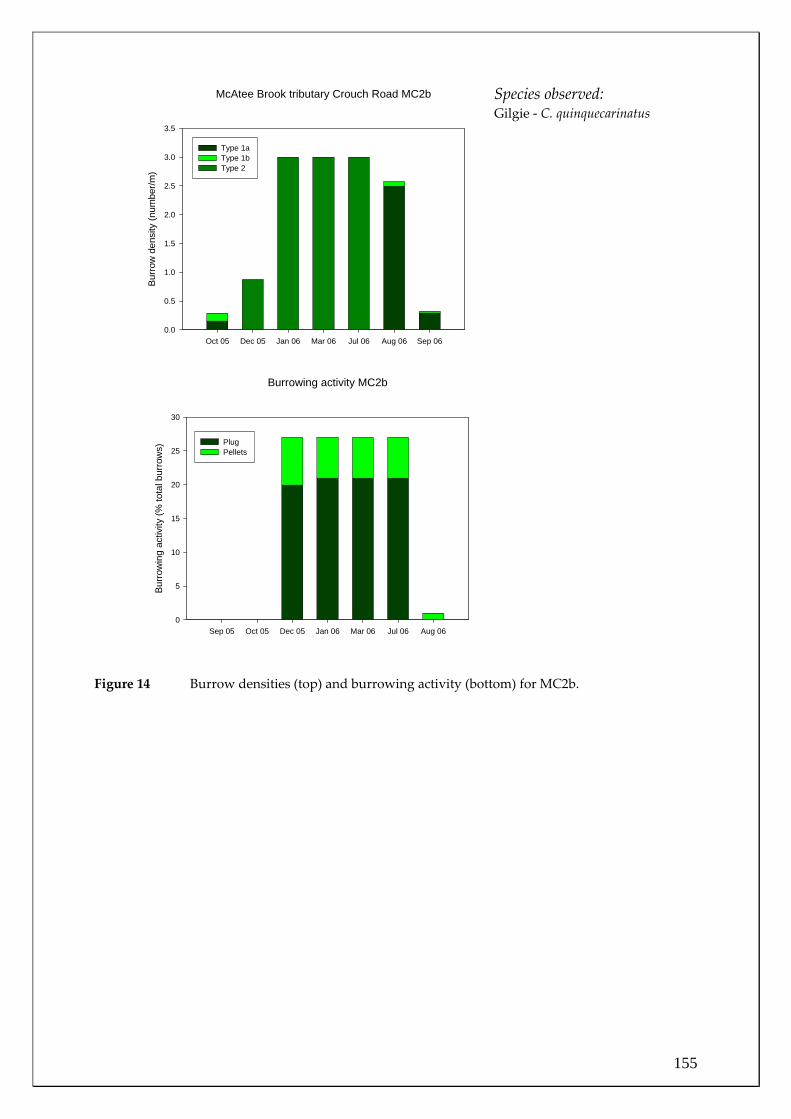
155
Species observed: Gilgie ‐ C. quinquecarinatus
Figure 14 Burrow densities (top) and burrowing activity (bottom) for MC2b.
McAtee Brook tributary Crouch Road MC2b
Oct 05 Dec 05 Jan 06 Mar 06 Jul 06 Aug 06 Sep 06
Bur
row
den
sity
(num
ber/m
)
0.0
0.5
1.0
1.5
2.0
2.5
3.0
3.5
Type 1a Type 1b Type 2
Burrowing activity MC2b
Sep 05 Oct 05 Dec 05 Jan 06 Mar 06 Jul 06 Aug 06
Burro
win
g ac
tivity
(% to
tal b
urro
ws)
0
5
10
15
20
25
30
Plug Pellets
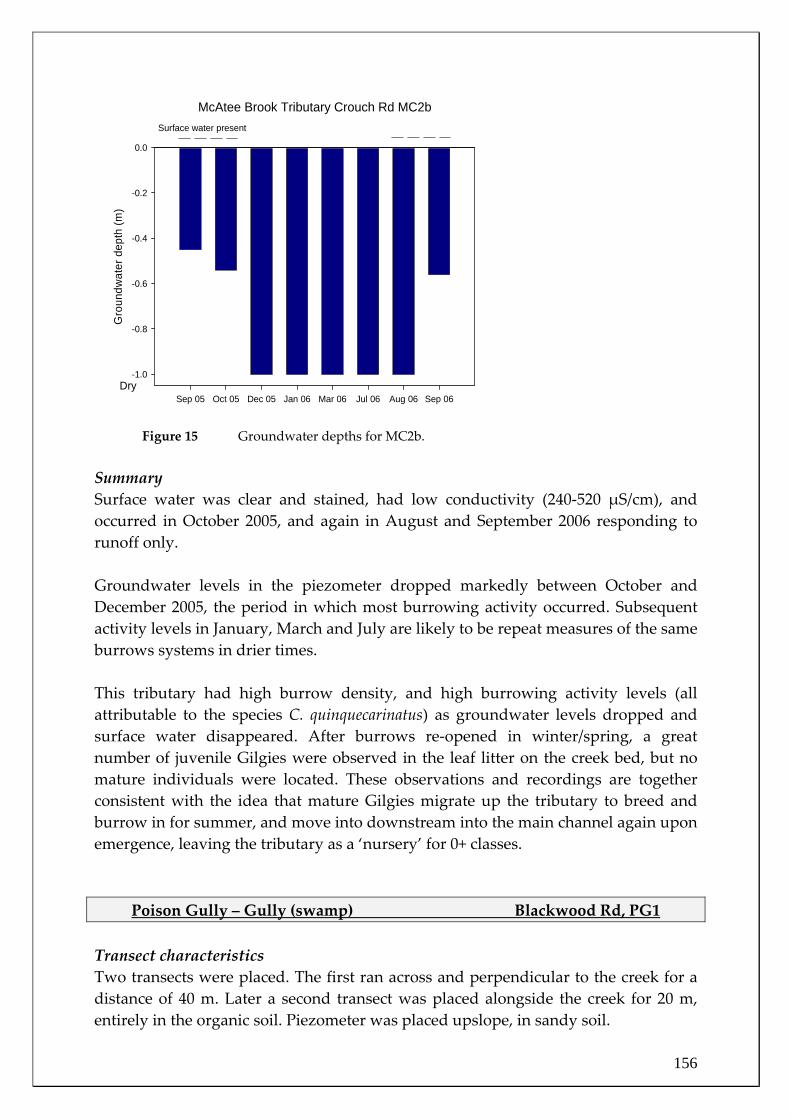
156
Figure 15 Groundwater depths for MC2b. Summary Surface water was clear and stained, had low conductivity (240‐520 μS/cm), and occurred in October 2005, and again in August and September 2006 responding to runoff only. Groundwater levels in the piezometer dropped markedly between October and December 2005, the period in which most burrowing activity occurred. Subsequent activity levels in January, March and July are likely to be repeat measures of the same burrows systems in drier times. This tributary had high burrow density, and high burrowing activity levels (all attributable to the species C. quinquecarinatus) as groundwater levels dropped and surface water disappeared. After burrows re‐opened in winter/spring, a great number of juvenile Gilgies were observed in the leaf litter on the creek bed, but no mature individuals were located. These observations and recordings are together consistent with the idea that mature Gilgies migrate up the tributary to breed and burrow in for summer, and move into downstream into the main channel again upon emergence, leaving the tributary as a ‘nursery’ for 0+ classes.
Poison Gully – Gully (swamp) Blackwood Rd, PG1 Transect characteristics Two transects were placed. The first ran across and perpendicular to the creek for a distance of 40 m. Later a second transect was placed alongside the creek for 20 m, entirely in the organic soil. Piezometer was placed upslope, in sandy soil.
McAtee Brook Tributary Crouch Rd MC2b
Sep 05 Oct 05 Dec 05 Jan 06 Mar 06 Jul 06 Aug 06 Sep 06
Gro
undw
ater
dep
th (m
)
-1.0
-0.8
-0.6
-0.4
-0.2
0.0
Dry
Surface water present

157
Species observed: Gilgie ‐ C. quinquecarinatus Restricted Gilgie – C. crassimanus Marron – C. cainii
Figure 16 Groundwater depth for PG1. Summary The creek runs through a heathy longitudinal swamp system with organic soil up to 0.5m depth in places, in the lowest part of the swamp. The organic soil becomes shallower away from the creek, upslope. Elsewhere and underlying the organic soils are sandy soils. Water in the creek was very clear and unstained flowing water, in a channel up to 1m wide with peat banks (stabilised by roots of heath species). In the channel was unconsolidated organic sediment. There were several peat clumps isolated in the creek channel. Water conductivity (< 290 μS/cm) and pH (4.6‐5.5) were both comparatively very low. Stream continued to flow all year round. No burrows were observed on the perpendicular transect. Burrow density for the second transect was relatively low, although crayfish diversity was high. Crayfish were observed to disappear into the unconsolidated sediment when disturbed. Loose poorly defined burrows were discerned in the banks of the creek and underneath peat clumps. Rosa Brook ‐ Gully Control Crouch Rd, RB2a
Transect characteristics Transect lies across deep creek gully (8.3 m). Creek banks and bed with clay substrate and a lot of burrows. Piezometer placed on a low bank above the gully.
Poison Gully Blackwood Rd PG1
Sep 05 Oct 05 Nov 05 Jan 06 Mar 06 Jul 06 Aug 06 Sep 06
Gro
undw
ater
dep
th (m
)
-1.0
-0.8
-0.6
-0.4
-0.2
0.0
Dry
Surface water present

158
Species observed: Gilgie ‐ C. quinquecarinatus
Figure 17 Burrow densities for RB2a. Only open burrows recorded; no burrowing activity observed.
Figure 18 Groundwater depths for RB2a Summary Surface water dried in January 2006 and only reappeared in September 2006. All surface waters were relatively fresh (360‐450 μS/cm). Surface water presence and groundwater levels are, in the main, consistent with one another, and exemplify a zone in the creek system where groundwater recharge occurs; despite reaches upstream having permanent water, middle reaches dry out in summer.
Rosa Brook Crouch Road RB2a
Oct 05 Dec 05 Jan 06 Mar 06 Jul 06 Aug 06 Sep 06
Burr
ow d
ensi
ty (n
umbe
r/m)
0
2
4
6
8
10
12
14
Type 1a Type 1b Type 2
Rosa Brook Crouch Rd RB2a
Sep 05 Oct 05 Dec 05 Jan 06 Mar 06 Jul 06 Aug 06 Sep 06
Gro
undw
ater
dep
th (m
)
-1.4
-1.2
-1.0
-0.8
-0.6
-0.4
-0.2
0.0
Dry
Surface water present
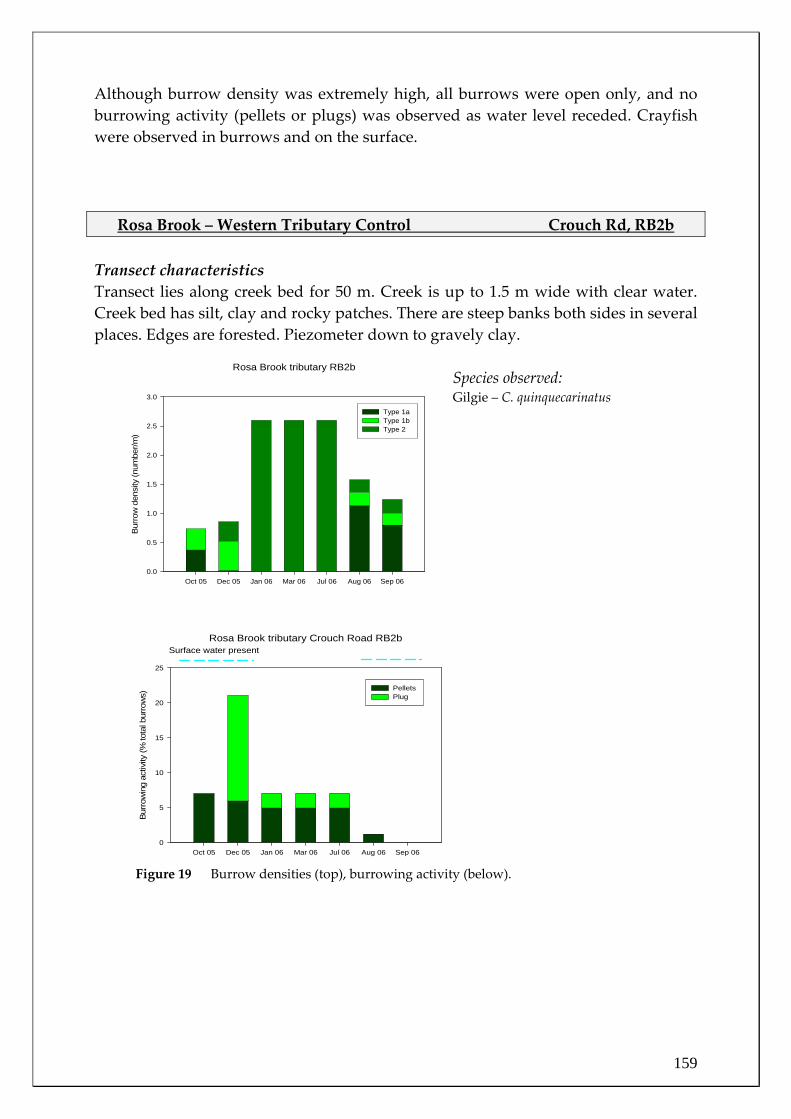
159
Although burrow density was extremely high, all burrows were open only, and no burrowing activity (pellets or plugs) was observed as water level receded. Crayfish were observed in burrows and on the surface. Rosa Brook – Western Tributary Control Crouch Rd, RB2b
Transect characteristics Transect lies along creek bed for 50 m. Creek is up to 1.5 m wide with clear water. Creek bed has silt, clay and rocky patches. There are steep banks both sides in several places. Edges are forested. Piezometer down to gravely clay.
Species observed: Gilgie – C. quinquecarinatus
Rosa Brook tributary RB2b
Oct 05 Dec 05 Jan 06 Mar 06 Jul 06 Aug 06 Sep 06
Bur
row
den
sity
(num
ber/m
)
0.0
0.5
1.0
1.5
2.0
2.5
3.0
Type 1a Type 1b Type 2
Rosa Brook tributary Crouch Road RB2b
Oct 05 Dec 05 Jan 06 Mar 06 Jul 06 Aug 06 Sep 06
Bur
row
ing
activ
ity (%
tota
l bur
row
s)
0
5
10
15
20
25
Pellets Plug
Surface water present
Figure 19 Burrow densities (top), burrowing activity (below).

160
Rosa Brook Tributary Crouch Rd RB2b
Sep 05 Oct 05 Dec 05 Jan 06 Mar 06 Jul 06 Aug 06 Sep 06
Gro
undw
ater
dep
th (m
)
-1.4
-1.2
-1.0
-0.8
-0.6
-0.4
-0.2
0.0
Dry
Surface water present
Summary Surface water presence and groundwater level changes are consistent with one another (as per RB2a). Water conductivity was low (230‐280 μS/cm).This transect had high burrowing densities, and burrowing activity coincided with decrease in surface water level. Similarly to MC2b, many juvenile crayfish were observed in the leaf litter when surface waters returned in autumn. Rosa Brook – Headwater Control Mowen Rd, RB3a
Transect characteristics Transect cuts across gully (6 m). Creek has turbid flowing water, with soft silty banks. Forested on eastern side, sedge swamp on western side (RB3b). Species observed None collected from transect; Gilgies ‐ C. quinquecarinatus found in fire dam next to brook. Summary As the creek held water throughout summer, crayfish had ample refuge with a steep undercut, permanent water, and coarse woody debris in the creek. Conductivity of the surface water was intermediate (350 – 670 μS/cm). Intermediate burrow density recorded (between 2 and 2.5 burrows/m transect) when surface water levels in the creek dropped, exposing the burrows in the steep banks. Only open burrows observed, no burrowing activity noted, and a high proportion of burrows were type 1b, with openings above and below surface water.
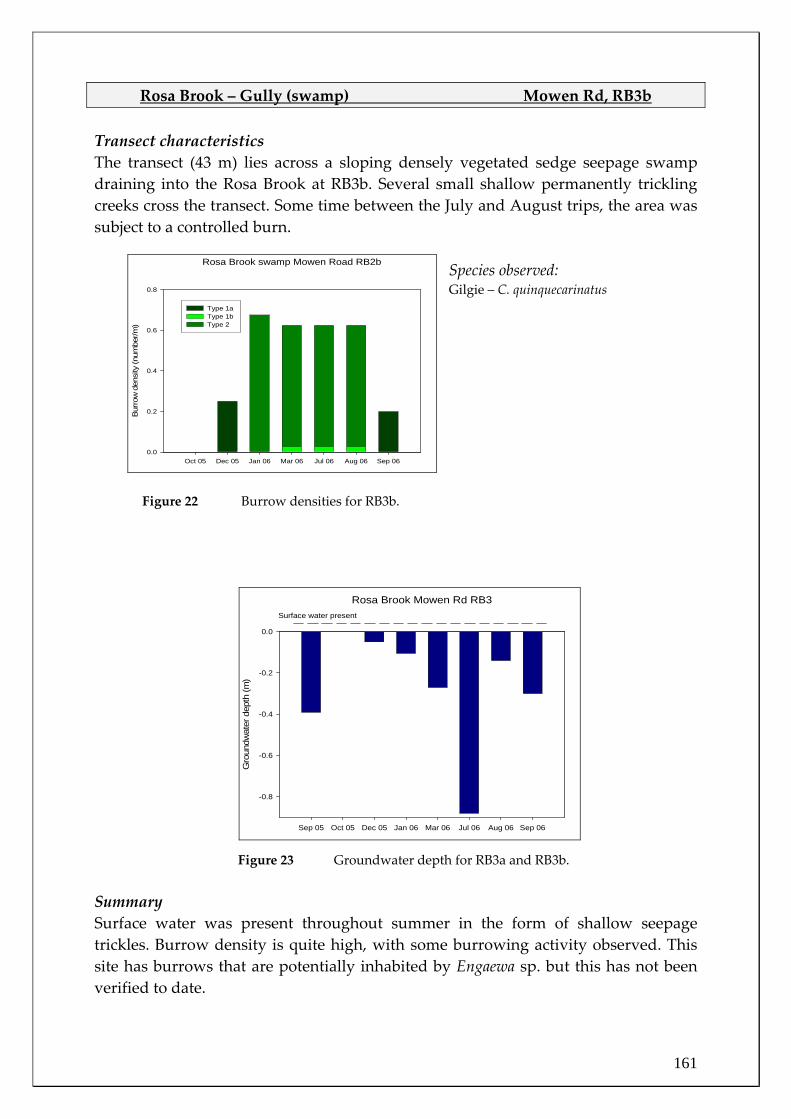
161
Rosa Brook – Gully (swamp) Mowen Rd, RB3b Transect characteristics The transect (43 m) lies across a sloping densely vegetated sedge seepage swamp draining into the Rosa Brook at RB3b. Several small shallow permanently trickling creeks cross the transect. Some time between the July and August trips, the area was subject to a controlled burn.
Species observed: Gilgie – C. quinquecarinatus
Figure 22 Burrow densities for RB3b.
Figure 23 Groundwater depth for RB3a and RB3b. Summary Surface water was present throughout summer in the form of shallow seepage trickles. Burrow density is quite high, with some burrowing activity observed. This site has burrows that are potentially inhabited by Engaewa sp. but this has not been verified to date.
Rosa Brook swamp Mowen Road RB2b
Oct 05 Dec 05 Jan 06 Mar 06 Jul 06 Aug 06 Sep 06
Bur
row
den
sity
(num
ber/m
)
0.0
0.2
0.4
0.6
0.8
Type 1a Type 1b Type 2
Rosa Brook Mowen Rd RB3
Sep 05 Oct 05 Dec 05 Jan 06 Mar 06 Jul 06 Aug 06 Sep 06
Gro
undw
ater
dep
th (m
)
-0.8
-0.6
-0.4
-0.2
0.0
Surface water present

162
Transect comparisons Headwaters: While both headwater sites received surface water runoff seasonally (September to December), conditions in Layman Brook with runoff only3 were different to Rosa Brook which cuts into (and therefore receives discharge from) the Leederville Aquifer; the catchment sizes differ, with Layman Brook being smaller than Rosa Brook and the channel only capable of delivering a smaller flow. Only Gilgies were observed in both creeks (Table 3), although the habitat diversity at Rosa Brook suggests that other species are likely to be present.
Table 3 Headwater creek comparisons.
Transect Layman Brook
Crouch Rd LB2
Rosa Brook Mowen Rd RB3a
Creek substrate White clayey sand with laterite outcrops
Light brown loam
Burrow Density (no./m)
0.7 2.4
Species present Gilgie (C. quinquecarinatus) Gilgie (C. quinquecarinatus) Surface water Clear
Dry in March 06 Turbid Surface water present all year
Conductivity (�S/cm) 192‐256 347‐674 Gullies: The deep creek gully at Milyeannup Brook was fed by Yarragadee discharge plus catchment runoff. Layman Brook, Rosa Brook (West) and McAtee Brook (East) appear not to receive input from the Yarragadee Aquifer (Table 4). Milyeannup and McAtee Brooks had the highest species diversity, including the restricted Gilgie. In addition, Milyeannup Brook had the highest burrow density and low water conductivities. Layman Brook also experiences low water conductivities until it dries completely in autumn, but these are probably more indicative of surface runoff and shallow lateritic soils. Water conductivity in McAtee Brook was highly seasonal but the permanent flows and iron staining throughout the year suggest some groundwater discharge, probably from the Leederville aquifer. 3 Only the effects of runoff were detected in the Layman Brook headwater site; no evidence of groundwater discharge was observed in transects.

163
Table 4 Gully comparisons.
Transect Layman Bk
Crouch Rd LB1a
Milyeannup Bk Helyar Rd MB2
Rosa Bk Crouch Rd RB3a
McAtee Bk Crouch Rd MC2a
Creek substrate Rocky laterite Clay with many snags
Mud Large rocks Much iron
Burrow density (no./m)
0.2 8.0 2.4 0.5
Species diversity Gilgie Gilgie, Marron, restricted Gilgie
Gilgie Gilgie, Marron, restricted Gilgie
Surface water Clear Present
Clear Present
Muddy Present
Clear Present
Conductivity (μS/cm) 237-508 272-490 347-674 210-1230 Swamp gullies: Three swamp gully transects were set up: Poison Gully (year‐round input from the Yarragadee Aquifer), Milyeannup Brook (within discharge zone but upstream of permanent Yarragadee discharge) and Rosa Brook (no input from Yarragadee) (Table 5). All three sites are characterised by low conductivity and pH of groundwater, but the sites at Poison Gully and Milyeannup Brook have lower values than Rosa Brook and in contrast to Rosa Brook, little or no iron staining. Burrow density was highest for Rosa Brook; this area is extremely densely vegetated with a soft, permanently wet substrate and therefore provides burrowing habitat for crayfish. Table 5 Swamp gully transect comparisons. Transect Poison Gully
Blackwood Rd PG1
Milyeannup Bk Milyeannup Rd MB4
Rosa Brook Mowen Rd RB3b
Substrate Sandy in broad swampy area, becoming more peaty closer to, and in, stream
White-grey Sandy clay
Light brown Loam/clay
Burrow Density (no./m)
0.1 0.5 2.6
Species diversity Gilgie, Marron, restricted Gilgie
Gilgie, Koonac, restricted Gilgie
Gilgie
Surface water Clear Present all times
Clear Dry March
Clear Present all times
Conductivity* (μS/cm)
47-180 307-381 425-860
pH* 3.5 - 4.8 4.4 - 6.1 5.4 - 5.7 * Groundwater values. Tributaries: Tributaries of larger streams were also monitored. There were three flowing west (Table 6) and two flowing east. The eastern flowing tributaries are also
164
two of the swamp gullies, Milyeannup Brook (MB4) and Rosa Brook (RB3b) and are discussed above (Table 5). The west flowing tributaries all received runoff only, had similar water characteristics with low conductivity and all dried up during summer. Only Gilgies were found in these habitats. Burrow density was low in Layman Brook, likely due to the dominance of the rocky substrate. Table 6 West flowing tributaries. Transect Layman Brook
Denny Rd LB1b
Rosa Brook Crouch Rd RB2b
McAtee Brook Crouch Rd MC2b
Creek substrate Rocky with gravel patches
Silt, clay and rocky patches
Clay with rocky patches
Burrow Density (no./m)
0.4 2.6 3.0
Species diversity Gilgie Gilgie Gilgie Surface water Clear
Dry Nov Clear Dry Jan
Clear Dry Nov
Conductivity (μS/cm) 262-549 226-280 239-520
Burrowing activity and migratory behaviour of species
Some generalisations can be made about the behaviour of each species encountered in this study. Cherax crassimanus The restricted Gilgie4 was found in Poison Gully, Milyeannup Brook, and McAtee Brook; these were the only permanent, fresh creeks under investigation. No clear information concerning the burrowing behaviour of this species could be discerned from the data gathered. However, the Poison Gully site, and to a lesser extent the Milyeannup Brook site, appear to contain significant populations of this species, suggesting that the populations may be regionally important (see Section 1). They may be significant source populations for the region, given that past studies have found low numbers of this species in the Blackwood River channel in the vicinity of the Yarragadee discharge, in McAtee Brook (like this study), and in Red Gully (see also Section 1). These possibilities raise questions about the genetic distinctiveness of the populations, and the overall population sizes in the two perennial tributaries within the Yarragadee Discharge Zone. Cherax preissii The Koonac was only found at one of the transects (MB4), where it co‐occurred with two other burrowing species. Of all the four species found in this study, it is the one that is less likely to be found in surface waters during drier seasons, and the one that is more likely to dominate assemblages where water tables fluctuate more markedly,
4 The common name ‘restricted Gilgie’ is used her to denote the ecology of the species, not it’s genetic affiliations. While it has some attributes of the habitat utilisations of the Gilgie, genetically it is more closely aligned to the Koonac C. preissii.

165
and this is certainly the case for the habitat at this transect, in the extensive swamp system at the headwaters of the Milyeannup Brook. However, it has also been found, albeit in very low numbers, from Rosa Brook and McAtee Brook (see Section 1). Cherax quinquecarinatus Perhaps the clearest data on the burrowing and migratory behaviour in this study were found for this species, and this is due to the fact that it was the only species found in some transects so the burrowing activities in those transects could be ascribed to this species exclusively. Tributary sites receiving seasonal runoff waters only (see Table 6) showed clear relationships between declining water levels and increasing burrowing activity. Observations were made of juvenile Gilgies in the leaf litter on the creek bed after burrows re‐opened in winter/spring when the creeks refilled, and an absence of mature individuals at that time. These observations and recordings are together consistent with the idea that mature Gilgies migrate up the tributaries to breed (see also Section 1) and then burrow in for summer, and move downstream into the main channel again upon emergence, leaving the tributary as a ‘nursery’ for 0+ age classes. The degree to which this species relies on these ephemeral creek systems is unknown, but the movement of Gilgies out of main channel systems (like the Blackwood River) and into more ephemeral creeks to breed, needs some more sophisticated investigation. Interestingly, the presence of Marron, restricted Gilgies as well as Gilgies in the main channel at McAtee Brook, but only Gilgies in the tributary is suggestive of a species specific useage of this tributary resource. Cherax cainii Only small immature specimens of Marron were encountered in this study, in Poison Gully, Milyeannup Brook, and McAtee Brook; these were the only permanent, fresh creeks under investigation, confirming the fact that Marron are not known from ephemeral systems, and that they are poor burrowers. However, in all of these systems, refuges for times of very low waters, and shelter from predation, were evident, including shallow burrows in the bank, and poorly defined burrows under rocks and logs. The movement of this and other crayfishes out of the Blackwood river channel and into these small tributaries (and vice versa) was examined in Section 1.
166
DISCUSSION AND RECOMMENDATIONS
The tributaries of the Blackwood River on and around the Yarragadee Discharge Zone appear to be typical burrowing habitat for south‐western Australian freshwater crayfish, displaying the broad range of physiographic habitat characteristics where crayfish shelter and burrow: permanent to ephemeral systems, creek banks, deep pools, shallow seasonally filled ponds and floodplains, clayey to sandy and rocky, organic to mineral sediments, and the presence of coarse woody debris. In general, in terms of freshwater crayfish, the more species rich sites contained permanent water, and a greater variety of these habitat features.
Four species of freshwater crayfish have been identified in this study (Marron, Gilgie, restricted Gilgie, and the Koonac). Thus far no individuals of the burrowing freshwater crayfish genus Engaewa have been found in the Yarragadee Discharge Zone, or close to it, even though some habitats have looked particularly suitable for them (for instance the site at RB3). Highest species diversity was found in streams in the YADZ, namely Milyeannup Brook and Poison Gully, as well as one outside of this zone, McAtee Brook.
It should be noted that the approach used in this study, namely to investigate the potential for burrowing activities of freshwater crayfish to be used as an indicator of the effects of groundwater declines, has never been attempted before, and this research therefore sought to pioneer methodologies. As with all pioneering studies, not all methods chosen were successful, and some problems in data interpretation emerged.
Two conspicuous general trends are observed in the data:
1. Measurements of the number of burrows increase as surface waters recede and measures of burrowing activity (proportions of burrows with pellets or plugs) increase as water levels recede.
2. The first observation is likely to be in part a measurement error, since receding waters expose sediments where burrows can be more easily observed. The second observation is more significant, and is likely to be a reflection of the burrowing behaviour of all species, since they must seek refuge during drier times.
Monitoring burrowing activities depends on some knowledge of the species inhabiting the burrow. This is not so important where reasonable assumptions can be made about the species present. It is much more problematic, however, when the species making the burrows is not known. Most of the time different species do not make species specific burrows. Perhaps Marron are an exception to this rule here, being found in shallow poorly formed Type 1a burrows almost exclusively. Distinguishing between burrows of the other three species is usually almost impossible. To determine the identity of the occupant requires either destroying the

167
burrow, or waiting for it to emerge, capture it identify it and return it to the burrow. The first was not feasible on the transect because burrows are deep and too much disturbance would have occurred. Capturing crayfish is a more viable option and was attempted with some limited success, but there were too many burrows to do this systematically. Accordingly, for some transects where more than one species was known to occur, it was impossible to provide information on how different species were responding to water level changes.
The unusual weather experienced over the twelve month study will also need to be considered. The very dry autumn and early winter experienced in 2006 resulted in a slower than usual recovery of water levels (i.e. water levels experienced in September 2005 were much higher than those found in the same months in 2006; most piezometers were still dry in July 2006).
Despite the methodological problems, the work conducted over the past year in establishing transects and documenting burrow densities shows some promise. It provides some methods and baseline data for monitoring crayfish burrowing activity in the future and can be used to document changes to burrowing activity associated with any groundwater regime shifts (that might occur as a result of climate change, land use change or groundwater extraction). In particular, future uses of this technique for monitoring the effects of groundwater decline on aquatic fauna might start with the following hypotheses:
A. If groundwater decline is extending beyond historical ranges then the burrowing activity of freshwater crayfish will produce soil from a lower stratigraphic soil layer than previously observed. AND B. If groundwater decline is extending beyond historical ranges, then periods of burrowing activity will occur earlier in spring, and burrows will open later in the autumn or winter.
The following is a list of questions that need to be answered to gain a better understanding of how freshwater crayfish populations might respond to changing groundwater and surface water regimes in the future.
1. What is the genetic structure of populations and species and do tributaries and in particular the YADZ ones have genetically distinct populations? In fact for most small burrowing crayfish in the genus Cherax, genetic typing is probably the only reliable way to identify species, and therefore to examine the relationship between surface water movements of crayfish and their burrowing activity. There is a clear need for a systematic study of populations in the region, in particular the populations of C. crassimanus, likely to be the most significantly affected species should any changes occur to the volume of discharge from the Yarragadee Aquifer.
2. Leading on from 1, a reliable distribution map for all freshwater crayfish species, but particularly Engaewa species, in the area defined by the Darling Escarpment to the east and the Dunsborough Fault to the west, is required.

168
3. How might changes to water levels influence crayfish movements into and out of burrows, and can crayfish reproductive effort be diminished by declining periods of surface water presence? The first part of this question can be at least partly answered by combining the full seasonal data of burrowing activity with the data of crayfish presence in surface waters (see Section 1). The second part will require a more detailed investigation of reproductive energetics of burrowing freshwater crayfish (for instance comparing populations of the same species experiencing different water regimes).
WATER CHEMISTRY
INTRODUCTION The purpose of this small project was to investigate the water chemistry of the tributaries of the Blackwood River in the region of the Yarragadee discharge. This information will help to:
- determine if the Yarragadee discharge, and water at transect sites could be chemically characterised; and
- determine relative contributions of the Yarragadee discharge to the water quality of the Blackwood.
In order to do this most effectively the water chemistry of groundwater, tributaries and the river itself should be examined under different seasonal conditions that amount to different hydrological/flow regimes.
METHODS Water samples from piezometers, tributaries and river channel were collected:
1. One set of samples was collected in late November/December 2005 to represent late spring moderate flows and water levels. These samples were collected mainly from piezometers and surface waters along transect sites; and
2. One set of samples was collected in March 2006 to represent the base flows and low water levels in early autumn. These samples were collected from a more extensive set of tributaries in the region of the Yarragadee discharge zone (Rosa Brook, Layman Brook, Poison Gully, Milyeannup Creek, Red Gully, St John Brook) and Blackwood River sites above, in, and below the Yarragadee discharge zone.
All water samples were taken from either just below the surface or from piezometer water siphoned out with a tube. Water was collected in a washed then acid rinsed plastic bottle, then immediately forced through a Whatman glass fibre filter (45 nm filter pore size) in a filter attachment to a syringe. The filtered water sample was preserved with concentrated nitric acid and stored for ICP‐AES analysis of elemental suite.
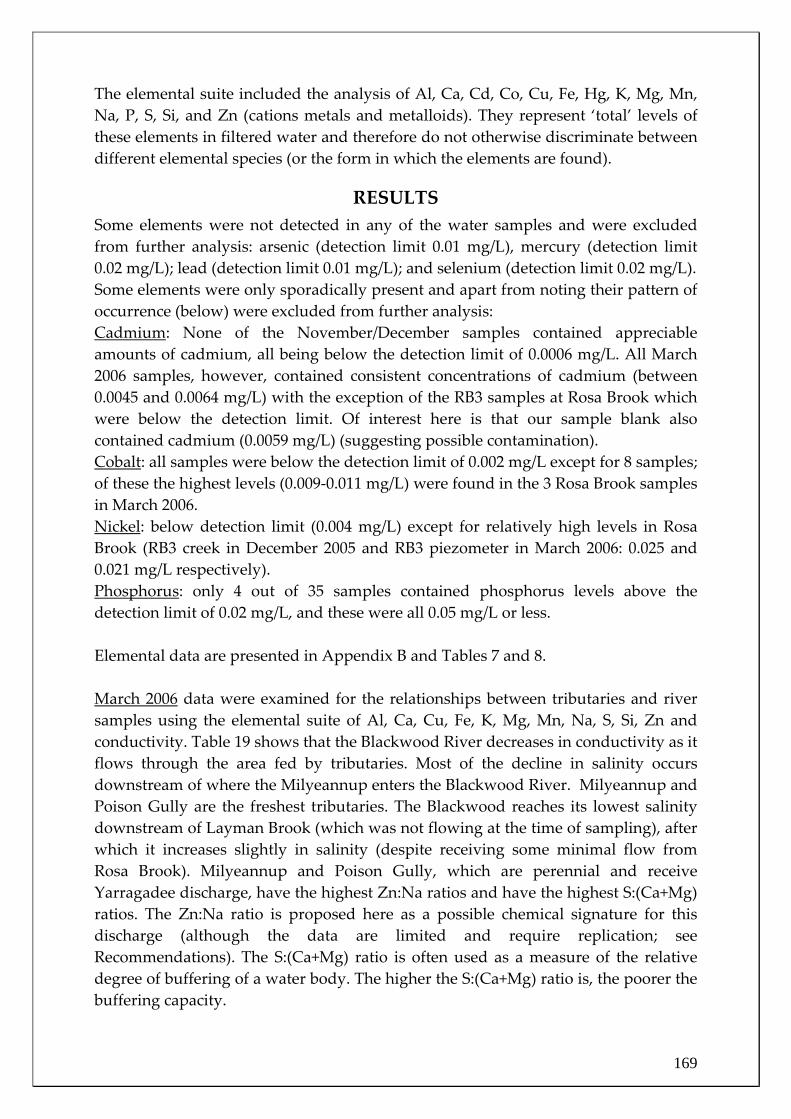
169
The elemental suite included the analysis of Al, Ca, Cd, Co, Cu, Fe, Hg, K, Mg, Mn, Na, P, S, Si, and Zn (cations metals and metalloids). They represent ‘total’ levels of these elements in filtered water and therefore do not otherwise discriminate between different elemental species (or the form in which the elements are found).
RESULTS Some elements were not detected in any of the water samples and were excluded from further analysis: arsenic (detection limit 0.01 mg/L), mercury (detection limit 0.02 mg/L); lead (detection limit 0.01 mg/L); and selenium (detection limit 0.02 mg/L). Some elements were only sporadically present and apart from noting their pattern of occurrence (below) were excluded from further analysis: Cadmium: None of the November/December samples contained appreciable amounts of cadmium, all being below the detection limit of 0.0006 mg/L. All March 2006 samples, however, contained consistent concentrations of cadmium (between 0.0045 and 0.0064 mg/L) with the exception of the RB3 samples at Rosa Brook which were below the detection limit. Of interest here is that our sample blank also contained cadmium (0.0059 mg/L) (suggesting possible contamination). Cobalt: all samples were below the detection limit of 0.002 mg/L except for 8 samples; of these the highest levels (0.009‐0.011 mg/L) were found in the 3 Rosa Brook samples in March 2006. Nickel: below detection limit (0.004 mg/L) except for relatively high levels in Rosa Brook (RB3 creek in December 2005 and RB3 piezometer in March 2006: 0.025 and 0.021 mg/L respectively). Phosphorus: only 4 out of 35 samples contained phosphorus levels above the detection limit of 0.02 mg/L, and these were all 0.05 mg/L or less. Elemental data are presented in Appendix B and Tables 7 and 8. March 2006 data were examined for the relationships between tributaries and river samples using the elemental suite of Al, Ca, Cu, Fe, K, Mg, Mn, Na, S, Si, Zn and conductivity. Table 19 shows that the Blackwood River decreases in conductivity as it flows through the area fed by tributaries. Most of the decline in salinity occurs downstream of where the Milyeannup enters the Blackwood River. Milyeannup and Poison Gully are the freshest tributaries. The Blackwood reaches its lowest salinity downstream of Layman Brook (which was not flowing at the time of sampling), after which it increases slightly in salinity (despite receiving some minimal flow from Rosa Brook). Milyeannup and Poison Gully, which are perennial and receive Yarragadee discharge, have the highest Zn:Na ratios and have the highest S:(Ca+Mg) ratios. The Zn:Na ratio is proposed here as a possible chemical signature for this discharge (although the data are limited and require replication; see Recommendations). The S:(Ca+Mg) ratio is often used as a measure of the relative degree of buffering of a water body. The higher the S:(Ca+Mg) ratio is, the poorer the buffering capacity.

170
The ordination of water chemistry shows the difference between the water chemistry of the Blackwood River proper and the tributaries during baseflow conditions in March 2006, with the two sets of data separating – all tributaries in a cluster on the left and all river sites in a cluster on the right (Figure 24). As the influence of the Yarragadee discharge increases, samples are positioned more towards the top left hand corner of the plot for both the tributaries and the river samples. The tributaries of Poison Gully and Milyeannup Brook clearly separate on the basis of their water chemistry (with Zn and S playing a significant role). Similarly, St John Brook, Rosa Brook (Upper site), and McAtee Brook separate and can be distinguished on the basis of their relatively high levels of iron (Fe) and potassium (K), possibly reflecting the iron rich waters of the Leederville aquifer. November/December 2005 samples were analysed using conductivity and the elemental suite of Al, Ca, Co, Cu, Fe, K, Mg, Mn, Na, S, Si, Zn, for a selection of surface water and groundwater samples from the transect sites. Table 8 presents the conductivity and Zn:Na ratio and S:(Ca+Mg) ratio and results are less clear than those presented for the March 2006 samples, partly due to the more heterogeneous collection of samples, and partly due to the fact that waters are complicated by surface runoff from rainfall. Tributaries and groundwater samples are all relatively fresh compared to the only Blackwood River site (BW4). This river site also had low(est) values for both ratios. The relative amounts of Zn are high in most tributaries in these samples. The piezometer sample in the upper Milyeannup Bk site (MB4) had by far the highest proportion of Zn; it also had poor buffering (highest S:(Ca+Mg) ratio) and relatively high levels of iron (Fe). In contrast to the March 2006 samples, the perennial creeks of Poison Gully and Milyeannup had lower Zn:Na ratios than other tributaries. On the basis of water chemistry the sites separated into five different groups (Fig. 15). Data for this analysis was corrected for conductivity so as to remove concentration magnitude, leaving only the relationships between elements, their proportional representation. The water sample from Rosa Brook (Upper site on Mowen road, RB3) was the most identifiable sample, with proportionately the highest levels of aluminium, iron, potassium, cobalt, magnesium, silica and sodium. Next most identifiable was the piezometer sample at the otherwise dry Milyeannup site MB4, with the highest concentration proportions of sulphur and zinc, and high iron. The headwater piezometer sample in Layman Brook is distinct, relatively high proportions of Al and K, the highest proportions of Ca and Cu, and the lowest proportions of Zn. A heterogeneous group of three samples are closely related – the piezometer from Poison Gully (which was very fresh), the Blackwood River sample (from within the Yaragadee Discharge Zone), and a surface trickle at McAtee Creek: they can be characterised as all having relatively low Al, Fe, Mg, K and Zn. All other samples belong to one cluster. The two Layman Brook surface water samples are almost identical, as are two surface water and two piezometer samples from the lower Rosa Brook sites.

171
DISCUSSION AND RECOMMENDATIONS Results from these water chemistry analyses are preliminary only since relatively few samples were taken and they were not replicated in time or at locality. Nevertheless some significant findings are worthy of further investigation: 1. Base flow water chemistry shows the potential for characterising the Yarragadee discharge, and thereby highlights the importance of attending to the water chemistry should supplementation of wetlands or creeks be required due to groundwater decline. The Zn concentrations (relative to something like Na) may be seasonally reliable, and Al is worth consideration in this regard too. 2. The relatively high S:(Ca+Mg) ratios found for Poison Gully and Milyeannup Brook surface water in March 2005, and the upper Milyeannup piezometer sample in November 2005 add further justification for an examination of the potential for acidification of surface and/or ground water should sediments become exposed due to drought and/or groundwater decline. We recommend that the following pieces of research be conducted: 1. A fully seasonal and replicated series of samples from the tributary and river channel sites (as per the March 2006 sampling) across a full suite of elements (to include significant anions). 2. An examination of the risk of acidification due to the possible exposure of potential acid sulphate soils. This will be best achieved by undertaking coring of near surface sediment in key creek and wetland systems in the Yarragadee Discharge Zone (particularly Poison Gully and the entire Milyeannup Brook system). Sediments should be examined for organic content, particle size, and chromium reducible sulphur and elemental suite for at least each stratigraphic layer.

172
Table 7 Water chemistry data for March 2006 (baseflow conditions) showing sites arranged upstream to downstream (and where tributaries enter the Blackwood River), starting at the most upstream site on the Blackwood River near Nannup, and finishing at the Blackwood River (Sues Bridge).
Site (from Upstream to
Downstream) Conductivity
(μS/cm) S:(Ca+Mg) Zn:Na
(x10000) Blackwood 1 3470 0.15 0.52 St John Bk 735 0.21 5.9
Blackwood 2 3620 0.11 0.41 McAtee Bk 1230 0.35 2.53 Red Gully 960 0.16 4.00
Blackwood 3 3630 0.11 0.71 Milyeannup Bk 490 0.3 18.57 Blackwood 4 3420 0.12 0.78 Blackwood 5 3240 0.12 0.88 Poison Gully 287 0.41 39.02 Blackwood 6 2570 0.12 1.11 Blackwood 7 2050 0.13 2.96 Rosa Bk U 1003 0.02 3.92 Rosa Bk L 674 0.09 2.81
Blackwood 8 2210 0.13 0.82
Stress: 0.0565
Figure 24 Ordination (Semi Strong Hybrid Multidimensional Scaling using PATN)
using water chemistry of samples from tributaries and river samples taken in March 2006, showing relationships between sites. Elemental suite includes Al, Ca, Cu, Fe, K, Mg, Mn, Na, S, Si, Zn.
Milyeannup Blackwood River (Nannup)
Poison Gully
Blackwood River Sues Bridge
Tributaries
Blackwood River sites
McAtee Bk
Rosa Bk Lower Red Gully
Rosa Bk Upper St Johns Bk

173
Table 8 Water chemistry data for November/December 2005 sampling of transect sites (site
codes as for report) surface water (S) and piezometer groundwater (P).
Transect/Site Conductivity (μS/cm) S:(Ca+Mg) Zn:Na (x10000) BW4 3110 0.15 4.69 LB1a 364 0.31 12.65 LB1b 366 0.31 16.33 LB2 - P 230 0.14 3.00 LB2 - S 237 0.28 7.94 MB2 346 0.31 5.40 MB4 - P 307 0.75 49.02 MC2a - S CK 567 0.27 8.35 MC2a - S T 568 0.27 11.84 PG1 - P 180 0.23 3.33 PG1 - S 276 0.48 9.00 RB2a - P 247 0.43 28.29 RB2a - S 421 0.34 12.88 RB2b - P 252 0.34 14.29 RB2b - S 245 0.35 17.65 RB3 415 0.07 25.26
Row Fusion Dendrogram
0.01
670.
0167
0.23
220.
2322
0.44
770.
4477
0.66
330.
6633
0.87
880.
8788
BW4MC2a - S TPG1 - PLB1aLB1bRB2b - SLB2 - SMB2RB2a - SPG1 - SRB2a - PRB2b - PMC2a - S CKLB2 - PMB4RB3
Figure 25 Dendrogram (agglomerative hierarchical clustering from PATN) of water chemistry
showing the relationships between transect sites in November/December sampling, using the elemental suite of Al, Ca, Co, Cu, Fe, K, Mg, Mn, Na, S, Si, Zn corrected for conductivity (so as to remove magnitude, leaving only the relationships between elements, their proportional representation). (S= surface water, P= piezometer, or if not stated then surface water).
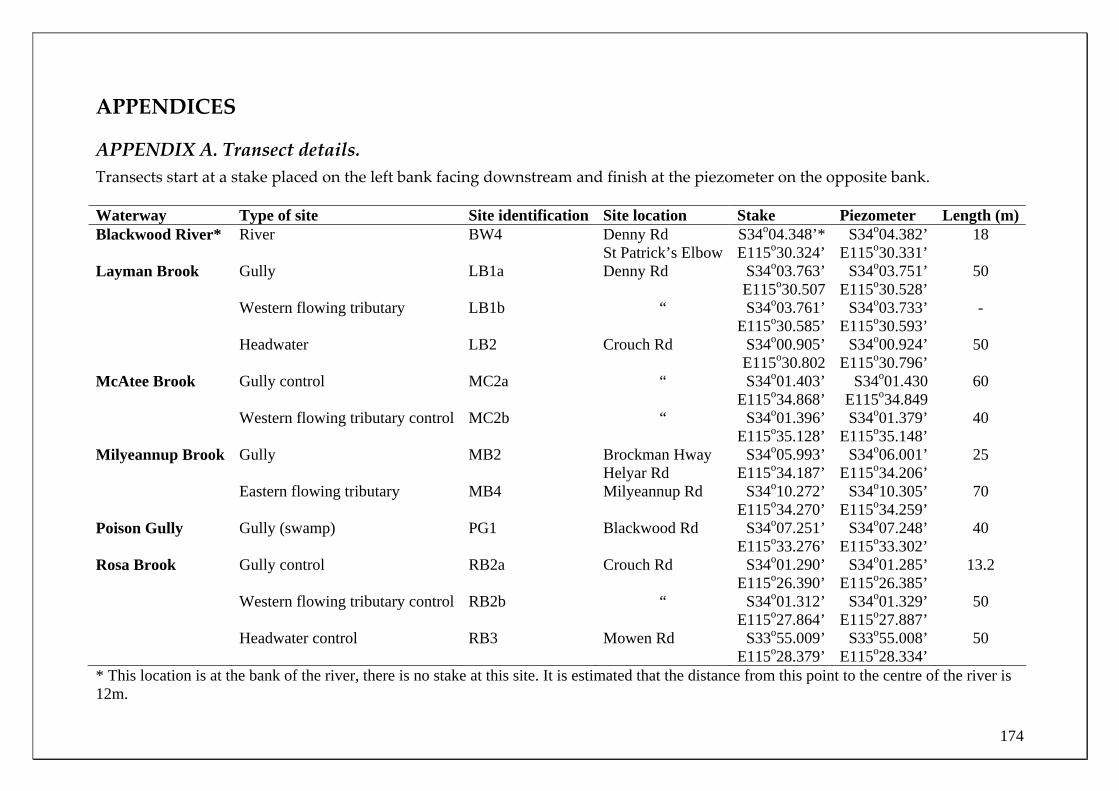
174
APPENDICES
APPENDIX A. Transect details. Transects start at a stake placed on the left bank facing downstream and finish at the piezometer on the opposite bank. Waterway Type of site Site identification Site location Stake Piezometer Length (m) Blackwood River* River BW4 Denny Rd
St Patrick’s ElbowS34o04.348’*E115o30.324’
S34o04.382’E115o30.331’
18
Layman Brook Gully LB1a Denny Rd S34o03.763’E115o30.507
S34o03.751’E115o30.528’
50
Western flowing tributary LB1b “ S34o03.761’E115o30.585’
S34o03.733’E115o30.593’
-
Headwater LB2 Crouch Rd S34o00.905’E115o30.802
S34o00.924’E115o30.796’
50
McAtee Brook Gully control MC2a “ S34o01.403’E115o34.868’
S34o01.430E115o34.849
60
Western flowing tributary control MC2b “ S34o01.396’E115o35.128’
S34o01.379’E115o35.148’
40
Milyeannup Brook Gully MB2 Brockman Hway Helyar Rd
S34o05.993’E115o34.187’
S34o06.001’E115o34.206’
25
Eastern flowing tributary MB4 Milyeannup Rd S34o10.272’E115o34.270’
S34o10.305’E115o34.259’
70
Poison Gully Gully (swamp) PG1 Blackwood Rd S34o07.251’E115o33.276’
S34o07.248’E115o33.302’
40
Rosa Brook Gully control RB2a Crouch Rd
S34o01.290’E115o26.390’
S34o01.285’E115o26.385’
13.2
Western flowing tributary control RB2b “ S34o01.312’E115o27.864’
S34o01.329’E115o27.887’
50
Headwater control RB3 Mowen Rd S33o55.009’E115o28.379’
S33o55.008’
E115o28.334’50
* This location is at the bank of the river, there is no stake at this site. It is estimated that the distance from this point to the centre of the river is 12m.

175
APPENDIX B. Water chemistry data.
Site Date Groundwater Stream water
Depth (m)
pH Conductivity (μS/cm)
Temperature (oC)
Level (m)
pH Conductivity (μS/cm)
Temperature (oC)
BW4 Nov 05 1.37 4.61 8160 16.3 - 6.68 3110 20.3 Jan 06 1.53 dry - - 10.85 6.47 2600 20.9 Mar 06 1.53 dry - - 10.94 6.82 2050 21.9 Jul 06 0.24 5.25 3700 17.0 10.40 7.17 3230 13.1 Aug 06 0.88 4.3 7730 15.0 10.08 7.44 7770 12.3 Sep 06 0.90 4.42 7700 16.0 10.73 6.93 5980 16.9 LB1a Sep 05 0.43 5.82 201 15.4 1.90 6.72 237 14.5 Oct 05 0.42 5.55 186 15.3 2.23 5.81 241 17.1 Dec 05 0.61 dry - - 2.57 6.92 364 24.5 Jan 06 0.61 dry - - 2.75 5.93 508 19.2 Mar 06 0.61 dry - - dry - - - Jul 06 0.61 moist - - dry - - - Aug 06 0.52 5.79 138 15.5 2.12 6.42 337 11.0 Sep 06 0.65 dry - - 2.45 6.18 373 17.1 LB1b Sep 05 0.65 dry - - 0.37 6.35 267 15.5 Oct 05 0.65 dry - - 0.38 5.46 262 19.1 Dec 05 0.65 dry - - 0.39 6.59 366 27.0 Jan 06 0.65 dry - - 0.38 6.06 436 19.0 Mar 06 0.65 dry - - dry - - - Jul 06 0.65 dry - - dry - - - Aug 06 0.57 5.57 475 14.9 0.35 6.37 549 13.3 Sep 06 0.65 dry - - 0.35 6.08 420 16.9 LB2 Sep 05 0.25 6.00 190 13.3 1.12 6.86 192 13.5 Oct 05 0.26 5.81 169 14.6 1.07 6.00 194 15.2 Dec 05 0.38 5.95 230 19.2 1.22 6.18 237 22.0 Jan 06 0.28 dry - - dry - - - Mar 06 0.64 dry - - dry - - - Jul 06 0.64 dry - - dry - - - Aug 06 0.33 5.61 125 12.5 1.08 5.90 207 12.7 Sep 06 0.28 5.35 212 14.2 1.09 5.90 256 14.2 MB2 Sep 05 0.41 5.96 1? 15.8 3.83 - - - Oct 05 1.54 5.72 180 18.2 3.75 5.76 272 14.7 Nov 05 1.53 dry - - 0.99 5.63 346 16.9 Jan 06 1.53 dry - - 1.08 5.60 456 18.7 Mar 06 1.53 dry - - 1.10 5.54 490 16.1 Jul 06 1.53 dry - - 1.15 5.72 472 11.2 Aug 06 1.53 dry - - 0.60 5.65 321 11.8 Sep 06 1.53 dry - - 0.82 6.24 317 13.7

176
Site Date Groundwater Stream water
Depth (m)
pH Conductivity (μS/cm)
Temperature (oC)
Level (m)
pH Conductivity (μS/cm)
Temperature (oC)
MB4 Sep 05 0.00 6.05 373 13.7 - 6.28 238 15 Oct 05 0.00 4.58 330 13.6 6.18 5.54 223 17.1 Nov 05 0.36 4.38 307 16.6 dry - - - Jan 06 1.03 4.65 381 19.2 dry - - - Mar 06 1.22 dry - - dry - - - Jul 06 1.22 dry - - dry - - - Aug 06 0.24 4.55 404 13.8 dry - - - Sep 06 0.09 4.41 391 14.9 dry - - - MC2a Sep 05 0.26 5.69 4? 17.4 1.73 5.60 210 15.3 Oct 05 0.35 5.36 215 18.5 1.74 5.41 218 14.9 Dec 05 0.52 7.18 568 23.1 1.96 6.81 567 22.3 Jan 06 0.52 dry - - 1.98 5.33 864 21.7 Mar 06 0.52 dry - - 2.10 5.10 1230 23.4 Jul 06 0.52 dry - - 1.95 6.04 990 14.1 Aug 06 0.55 4.47 841 13.4 1.50 6.01 255 12.3 Sep 06 0.41 5.54 263 15.4 1.84 5.75 487 16.9 MC2b Sep 05 0.45 5.03 555 15.1 1.45 6.18 239 15.2 Oct 05 0.54 4.30 677 14.5 1.65 5.47 255 15.5 Dec 05 0.99 dry - - dry - - - Jan 06 0.99 dry - - dry - - - Mar 06 0.99 dry - - dry - - - Jul 06 0.99 dry - - dry - - - Aug 06 0.99 dry - - 2.34 5.40 520 13.3 Sep 06 0.56 4.33 1812 14.9 1.52 6.08 294 16.0 PG1 Sep 05 0.39 4.66 132 13.1 3.50 - - - Oct 05 0.37 3.49 147 14.6 3.41 4.59 271 18.4 Nov 05 0.63 4.10 180 18.5 0.08 4.86 276 20.5 Jan 06 0.77 4.76 47.1 19.4 0.04 5.21 287 19.4 Mar 06 1.01 dry - - 1.50 4.94 287 14.7 Jul 06 1.01 dry - - 0.88 5.47 279 12.2 Aug 06 0.33 3.90 134 13.3 1.69 4.68 280 14.7 Sep 06 0.48 3.96 173 15.3 2.65 4.80 278 16.0 RB2a Sep 05 0.46 6.10 308 13.5 0 - - - Oct 05 0.50 5.50 260 13.6 2.42 5.71 356 16.0 Dec 05 0.85 5.40 247 15.8 2.90 6.19 421 18.0 Jan 06 1.49 dry - - dry - - - Mar 06 1.49 dry - - dry - - - Jul 06 1.49 dry - - dry - - - Aug 06 0.82 5.33 422 12.5 2.80 5.56 453 10.8 Sep 06 0.83 5.42 426 13.3 2.89 5.62 439 14.9

177
Site Date Groundwater Stream water
Depth (m)
pH Conductivity (μS/cm)
Temperature (oC)
Level (m)
pH Conductivity (μS/cm)
Temperature (oC)
RB2b Sep 05
0.42 6.47 270 14.0 2.90 6.63 226 14.1
Oct 05
0.53 5.62 224 14.4 3.10 6.02 239 18.4
Dec 05
0.62 5.65 252 19.0 3.60 5.65 245 20.4
Jan 06
1.33 dry - - dry - - -
Mar 06
1.33 dry - - dry - - -
Jul 06
1.33 dry - - dry - - -
Aug 06
0.63 5.35 272 13.4 3.00 5.63 280 11.2
Sep 06
0.54 5.37 273 14.1 3.10 5.81 278 14.8
RB3 Sep 05
0.39 5.52 425 5.4 1.80 - - -
Oct 05
- 5.46 464 11.3 1.70 5.91 347 14.6
Dec 05
0.05 5.71 583 15.3 2.10 5.93 415 20.0
Jan 06
0.11 5.44 652 16.1 2.16 5.95 465 16.0
Mar 06
0.27 5.7 860 16.5 2.26 5.76 674 16.5
Jul 06
0.88 6.42 878 9.4 1.90 5.96 560 9.6
Aug 06
0.14 - - - 1.62 5.60 404 12.8
Sep 06
0.30 dry - - 1.73 5.88 426 14.8
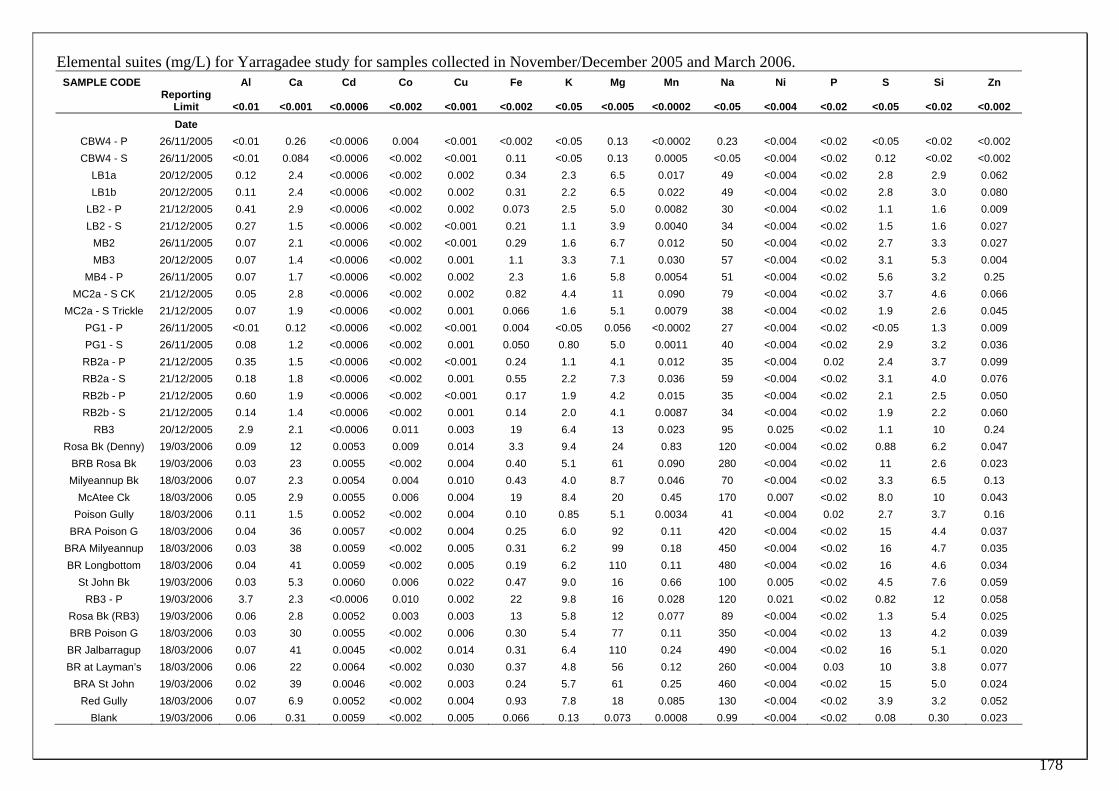
178
Elemental suites (mg/L) for Yarragadee study for samples collected in November/December 2005 and March 2006. SAMPLE CODE Al Ca Cd Co Cu Fe K Mg Mn Na Ni P S Si Zn
Reporting
Limit <0.01 <0.001 <0.0006 <0.002 <0.001 <0.002 <0.05 <0.005 <0.0002 <0.05 <0.004 <0.02 <0.05 <0.02 <0.002 Date
CBW4 - P 26/11/2005 <0.01 0.26 <0.0006 0.004 <0.001 <0.002 <0.05 0.13 <0.0002 0.23 <0.004 <0.02 <0.05 <0.02 <0.002 CBW4 - S 26/11/2005 <0.01 0.084 <0.0006 <0.002 <0.001 0.11 <0.05 0.13 0.0005 <0.05 <0.004 <0.02 0.12 <0.02 <0.002
LB1a 20/12/2005 0.12 2.4 <0.0006 <0.002 0.002 0.34 2.3 6.5 0.017 49 <0.004 <0.02 2.8 2.9 0.062 LB1b 20/12/2005 0.11 2.4 <0.0006 <0.002 0.002 0.31 2.2 6.5 0.022 49 <0.004 <0.02 2.8 3.0 0.080
LB2 - P 21/12/2005 0.41 2.9 <0.0006 <0.002 0.002 0.073 2.5 5.0 0.0082 30 <0.004 <0.02 1.1 1.6 0.009 LB2 - S 21/12/2005 0.27 1.5 <0.0006 <0.002 <0.001 0.21 1.1 3.9 0.0040 34 <0.004 <0.02 1.5 1.6 0.027
MB2 26/11/2005 0.07 2.1 <0.0006 <0.002 <0.001 0.29 1.6 6.7 0.012 50 <0.004 <0.02 2.7 3.3 0.027 MB3 20/12/2005 0.07 1.4 <0.0006 <0.002 0.001 1.1 3.3 7.1 0.030 57 <0.004 <0.02 3.1 5.3 0.004
MB4 - P 26/11/2005 0.07 1.7 <0.0006 <0.002 0.002 2.3 1.6 5.8 0.0054 51 <0.004 <0.02 5.6 3.2 0.25 MC2a - S CK 21/12/2005 0.05 2.8 <0.0006 <0.002 0.002 0.82 4.4 11 0.090 79 <0.004 <0.02 3.7 4.6 0.066
MC2a - S Trickle 21/12/2005 0.07 1.9 <0.0006 <0.002 0.001 0.066 1.6 5.1 0.0079 38 <0.004 <0.02 1.9 2.6 0.045 PG1 - P 26/11/2005 <0.01 0.12 <0.0006 <0.002 <0.001 0.004 <0.05 0.056 <0.0002 27 <0.004 <0.02 <0.05 1.3 0.009 PG1 - S 26/11/2005 0.08 1.2 <0.0006 <0.002 0.001 0.050 0.80 5.0 0.0011 40 <0.004 <0.02 2.9 3.2 0.036 RB2a - P 21/12/2005 0.35 1.5 <0.0006 <0.002 <0.001 0.24 1.1 4.1 0.012 35 <0.004 0.02 2.4 3.7 0.099 RB2a - S 21/12/2005 0.18 1.8 <0.0006 <0.002 0.001 0.55 2.2 7.3 0.036 59 <0.004 <0.02 3.1 4.0 0.076 RB2b - P 21/12/2005 0.60 1.9 <0.0006 <0.002 <0.001 0.17 1.9 4.2 0.015 35 <0.004 <0.02 2.1 2.5 0.050 RB2b - S 21/12/2005 0.14 1.4 <0.0006 <0.002 0.001 0.14 2.0 4.1 0.0087 34 <0.004 <0.02 1.9 2.2 0.060
RB3 20/12/2005 2.9 2.1 <0.0006 0.011 0.003 19 6.4 13 0.023 95 0.025 <0.02 1.1 10 0.24 Rosa Bk (Denny) 19/03/2006 0.09 12 0.0053 0.009 0.014 3.3 9.4 24 0.83 120 <0.004 <0.02 0.88 6.2 0.047
BRB Rosa Bk 19/03/2006 0.03 23 0.0055 <0.002 0.004 0.40 5.1 61 0.090 280 <0.004 <0.02 11 2.6 0.023 Milyeannup Bk 18/03/2006 0.07 2.3 0.0054 0.004 0.010 0.43 4.0 8.7 0.046 70 <0.004 <0.02 3.3 6.5 0.13
McAtee Ck 18/03/2006 0.05 2.9 0.0055 0.006 0.004 19 8.4 20 0.45 170 0.007 <0.02 8.0 10 0.043 Poison Gully 18/03/2006 0.11 1.5 0.0052 <0.002 0.004 0.10 0.85 5.1 0.0034 41 <0.004 0.02 2.7 3.7 0.16
BRA Poison G 18/03/2006 0.04 36 0.0057 <0.002 0.004 0.25 6.0 92 0.11 420 <0.004 <0.02 15 4.4 0.037 BRA Milyeannup 18/03/2006 0.03 38 0.0059 <0.002 0.005 0.31 6.2 99 0.18 450 <0.004 <0.02 16 4.7 0.035 BR Longbottom 18/03/2006 0.04 41 0.0059 <0.002 0.005 0.19 6.2 110 0.11 480 <0.004 <0.02 16 4.6 0.034
St John Bk 19/03/2006 0.03 5.3 0.0060 0.006 0.022 0.47 9.0 16 0.66 100 0.005 <0.02 4.5 7.6 0.059 RB3 - P 19/03/2006 3.7 2.3 <0.0006 0.010 0.002 22 9.8 16 0.028 120 0.021 <0.02 0.82 12 0.058
Rosa Bk (RB3) 19/03/2006 0.06 2.8 0.0052 0.003 0.003 13 5.8 12 0.077 89 <0.004 <0.02 1.3 5.4 0.025 BRB Poison G 18/03/2006 0.03 30 0.0055 <0.002 0.006 0.30 5.4 77 0.11 350 <0.004 <0.02 13 4.2 0.039 BR Jalbarragup 18/03/2006 0.07 41 0.0045 <0.002 0.014 0.31 6.4 110 0.24 490 <0.004 <0.02 16 5.1 0.020 BR at Layman’s 18/03/2006 0.06 22 0.0064 <0.002 0.030 0.37 4.8 56 0.12 260 <0.004 0.03 10 3.8 0.077
BRA St John 19/03/2006 0.02 39 0.0046 <0.002 0.003 0.24 5.7 61 0.25 460 <0.004 <0.02 15 5.0 0.024 Red Gully 18/03/2006 0.07 6.9 0.0052 <0.002 0.004 0.93 7.8 18 0.085 130 <0.004 <0.02 3.9 3.2 0.052
Blank 19/03/2006 0.06 0.31 0.0059 <0.002 0.005 0.066 0.13 0.073 0.0008 0.99 <0.004 <0.02 0.08 0.30 0.023
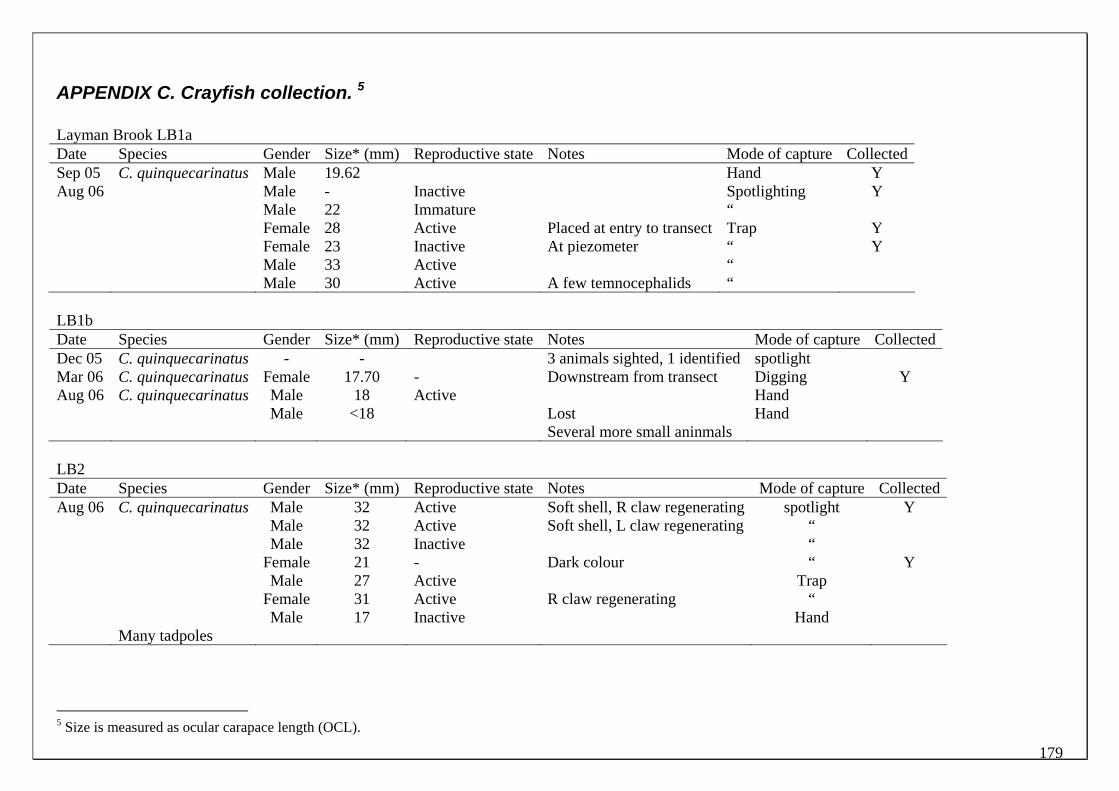
179
APPENDIX C. Crayfish collection. 5 Layman Brook LB1a Date Species Gender Size* (mm) Reproductive state Notes Mode of capture CollectedSep 05 C. quinquecarinatus Male 19.62 Hand Y Aug 06 Male - Inactive Spotlighting Y Male 22 Immature “ Female 28 Active Placed at entry to transect Trap Y Female 23 Inactive At piezometer “ Y Male 33 Active “ Male 30 Active A few temnocephalids “ LB1b Date Species Gender Size* (mm) Reproductive state Notes Mode of capture CollectedDec 05 C. quinquecarinatus - - 3 animals sighted, 1 identified spotlight Mar 06 C. quinquecarinatus Female 17.70 - Downstream from transect Digging Y Aug 06 C. quinquecarinatus Male 18 Active Hand Male <18 Lost Hand Several more small aninmals LB2 Date Species Gender Size* (mm) Reproductive state Notes Mode of capture CollectedAug 06 C. quinquecarinatus Male 32 Active Soft shell, R claw regenerating spotlight Y Male 32 Active Soft shell, L claw regenerating “ Male 32 Inactive “ Female 21 - Dark colour “ Y Male 27 Active Trap Female 31 Active R claw regenerating “ Male 17 Inactive Hand Many tadpoles
5 Size is measured as ocular carapace length (OCL).

180
Milyeannup Brook MB2 Date Species Gender Size* (mm) Reproductive state Notes Mode of capture Collected Dec 05 C. cainii Female 26.5 Immature Mar 06 C. quinquecarinatus
Female 7.90 In leaf litter spotlight
C. crassimanus Male 15.38 Spotlight Female 17.26 dig Several fish species, incl. G.
occidentalis and a small perch
Jul 06 C. quinquecarinatus Female 1.30 spotlight Male 1.40 Male 1.60 Female 1.50 ? 1.10 Many others small C. cainii Female 26 Immature Female 22 Immature C. quinquecarinatus Female 25 Trap 1 C. crassimanus Female 26 L claw missing Y Female 24 Temnocephalids Female 21 1 temnocephalid Female 22 Active Trap 2 ? Female/male 24 Dominant claws Trap 3 Y C. quinquecarinatus Female 22 Soft Y Male 24 Y Female 28 L claw regenerating Female 25 Active

181
MB2 cont’d Date Species Gender Size* (mm) Reproductive state Notes Mode of capture CollectedJul 06 C. crassimanus? Female 21 Female 22 Temnocephalids Male 21 MB4 Date Species Gender Size* (mm) Reproductive state Notes Mode of capture Collected Dec 05 C. preissii - - - Half specimen Hand Y C. quinquecarinatus - - - Several sighted Spotlight Sep 06 C. quinquecarinatus Female 26.0 Active Trapped in ditches next to road Trap 1 Male 28.0 Active Y Male 27.5 Active Trap 2 Female 32.0 Active Female 34.0 Active - - - Plugged type 2 burrow, water 36cm below surface Digging Y Female 20 ditches next to road Hand Female 21.4 Active “ Y Many 8-12 “

182
McAtee Brook MC2a Date Species Gender Size* (mm) Reproductive state Notes Mode of capture CollectedDec 05 C. quinquecarinatus Several - - In dam Spotlight Jan 06 C. quinquecarinatus 4 In dam Spotlight C. cainii 1 In dam Spotlight Other species 1 Jul 06 C. crassimanus Female 23 Active Trap in dam Male 22 Active L claw tip of propus missing “ Y Male 22 Active ? Female 26 Active L claw regenerating “ Y C. crassimanus Female 20 Active L claw regenerating “ Male 22 Hand Kept C. quinquecarinatus Female 32 Active Hairy Trap in dam No animals Trap in pool MC2b Date Species Gender Size* (mm) Reproductive state Notes Mode of capture CollectedAug 06 C. quinquecarinatus Female 27 Active Trap Y Female 24 Inactive “ Male 30 Active “ Y Female 11 R claw regenerating Hand Y ? 10 L claw missing “ Y Many small animals in leaf litter

183
Poison Gully PG1 Date Species Gender Size* (mm) Reproductive state Notes Mode of capture CollectedDec 05 - - - - No crayfish found Spotlight Jan 06 C. quinquecarinatus - - - Hand Several unidentified Mar 06 C. crassimanus Male 21.12 Spotlight ? one Galaxias occidentalis Jul 06 Male 30 Trap 1 Y C. quinquecarinatus Male 21 R claw regenerating “ Y Male 24 Male 26 Female 25 R claw regenerating C. cainii Female 24 Spines on telson Y C. quinquecarinatus Male 30 R claw missing Y Male Nightfish Trap 2 ? Male 22 Y Male 22 Y Male 21.5 C. quinquecarinatus Male 20.0 L claw missing
Main channel upstream Trap 3
? Female 21 Male 22 Male 28 Female 21 R claw & L5th leg regenerating Female 20.5

184
Rosa Brook RB2a Date Species Gender Size* (mm) Reproductive state Notes Mode of capture CollectedDec 05 C. quinquecarinatus Sighted only spotlight Mar 06 C. quinquecarinatus Female 11.30 Single burrow Digging Y Male 10.52 Male 11.58 Male 11.90 Cut in half Female 24.46 Under log Aug 06 C. quinquecarinatus Male 24.00 Inactive Wet night spotlight Female 30.00 Inactive Male 18.00 Inactive Many sighted RB2b Date Species Gender Size* (mm) Reproductive state Notes Mode of capture CollectedAug 06 C. quinquecarinatus Female 16.00 Inactive Hand Y Male - Active Large animal Spotlighting Female 20 Inactive L claw missing Y

185
RB3a Date Species Gender Size* (mm) Reproductive state Notes Mode of capture CollectedDec- Jan 05
C. quinquecarinatus In dam trap
Jul 06 C. quinquecarinatus Female Traps Y Female 28.00 In dam, soft shell Traps Female 22.00 Female/male 34.00 Some temnocephalids Female/male 26.00 R claw missing RB3b Date Species Gender Size* (mm) Repro-ductive state Notes Mode of capture CollectedMar 06 None found 3 burrows digging Jul 06 C. quinquecarinatus Female/male Traps Y Nightfish


