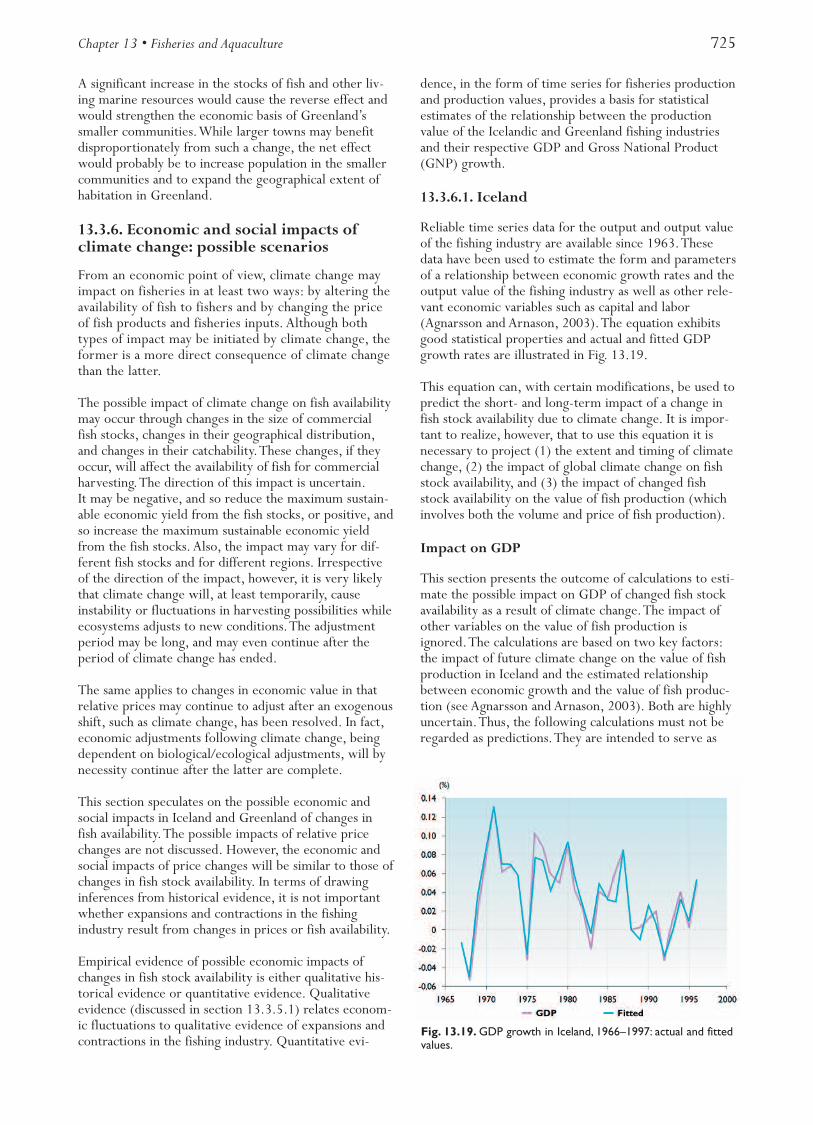
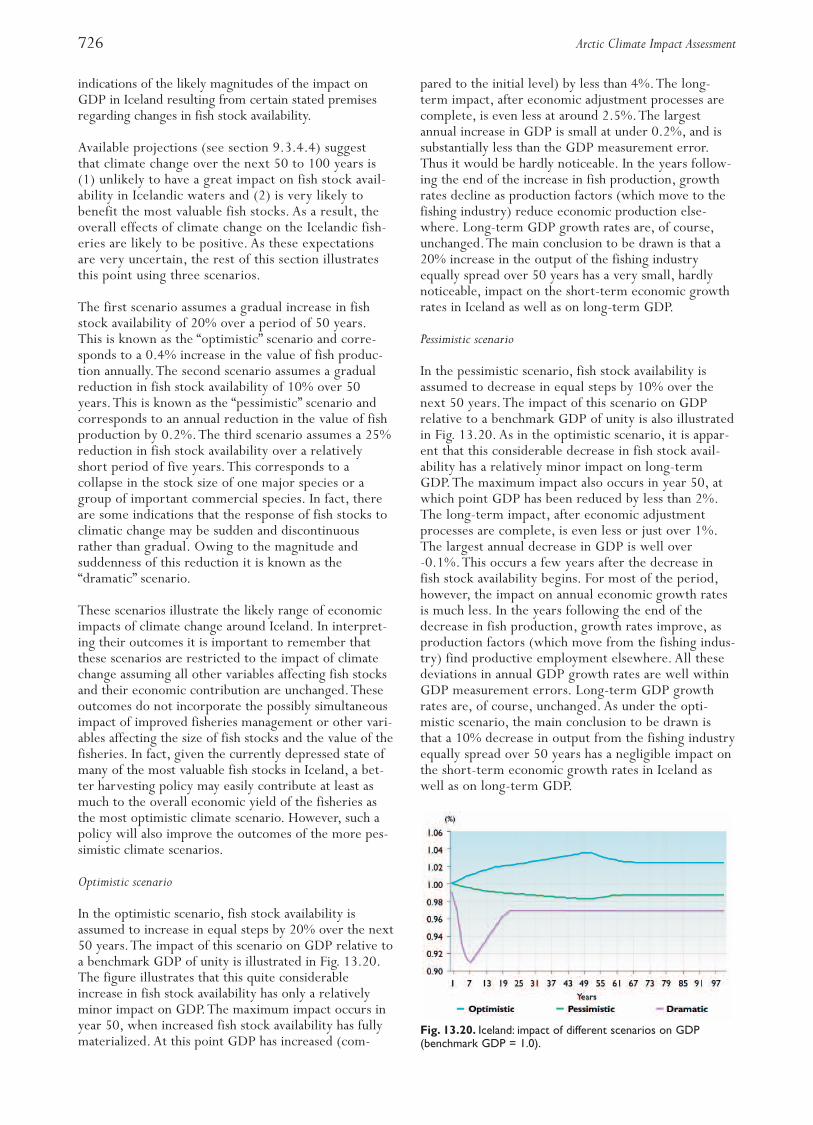
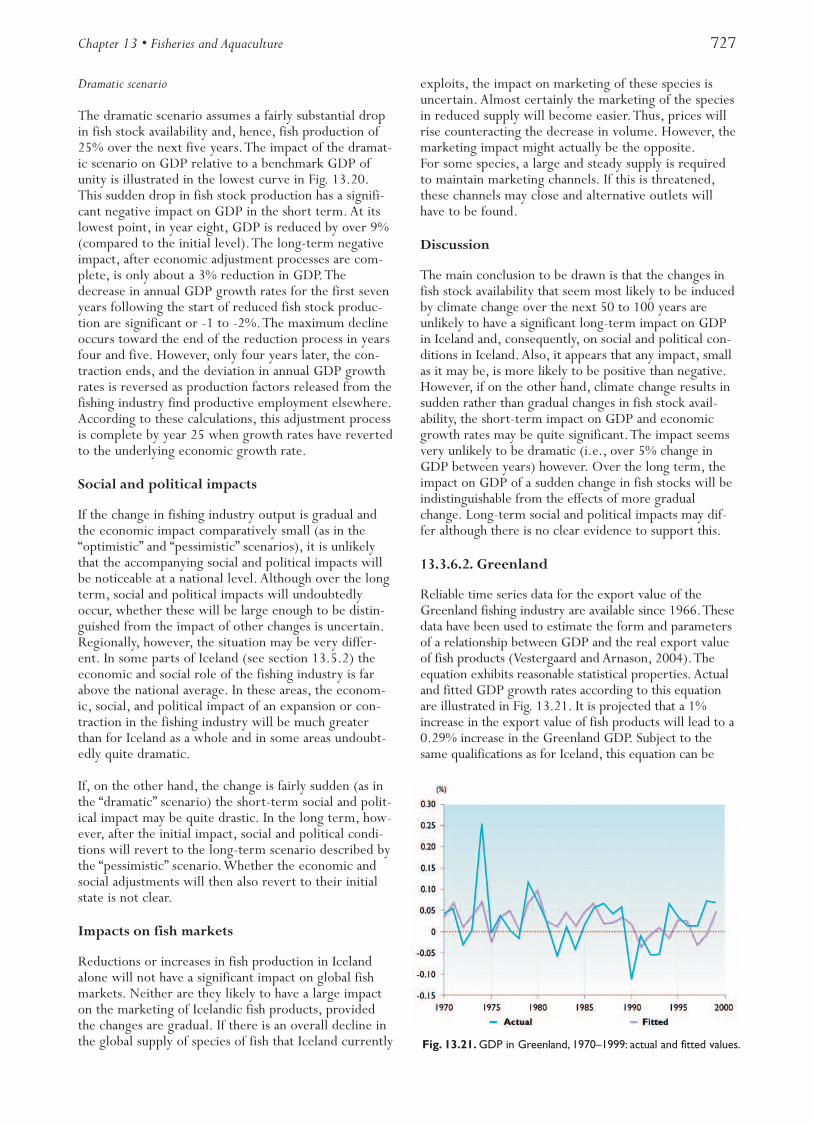
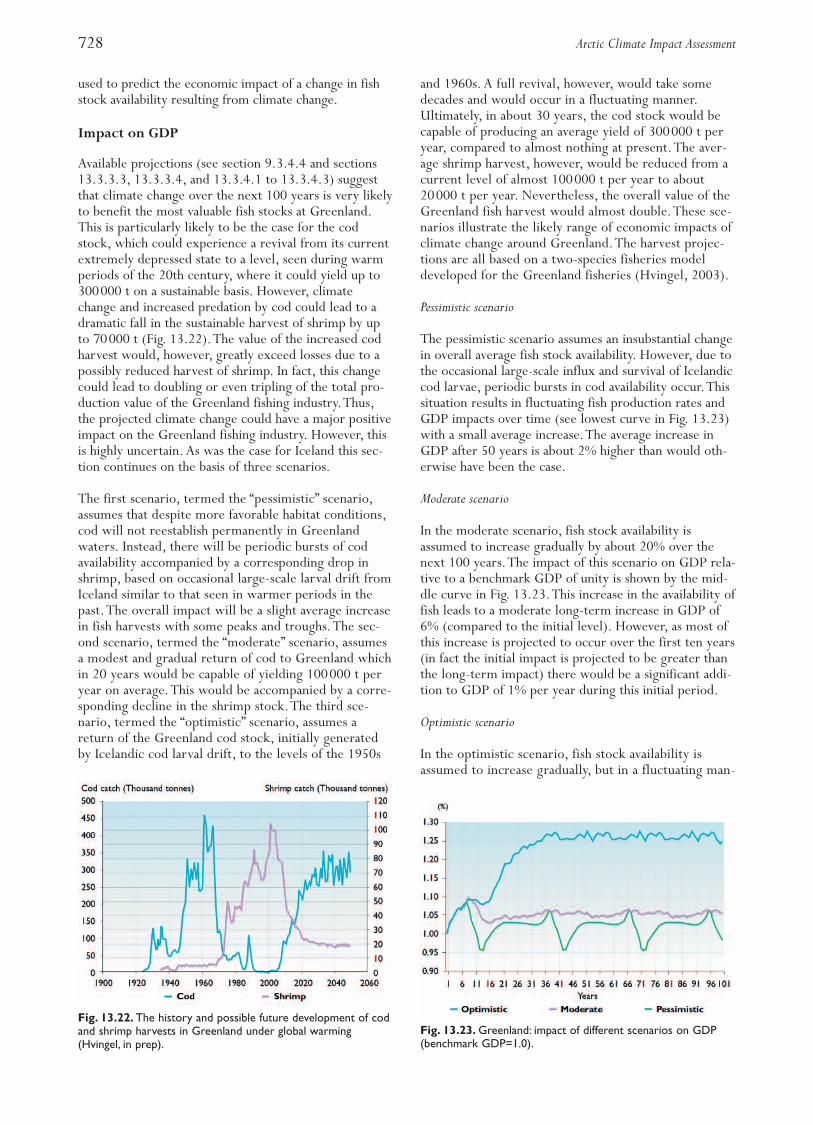
Contributing AuthorsSveinn Agnarsson, Ragnar Arnason, James E. Carscadden, Arne Eide, David Fluharty, Geir Hønneland, Carsten Hvingel, Jakob Jakobsson,George Lilly, Odd Nakken,Vladimir Radchenko, Susanne Ramstad,William Schrank, Niels Vestergaard,Thomas Wilderbuer
692 Arctic Climate Impact Assessment
Summary
This chapter addresses fisheries and aquaculture in fourlarge marine ecosystems, three in the northern NorthAtlantic and one in the North Pacific.The ecosystemsaround Greenland and off northeast Canada (east ofNewfoundland and Labrador) are of a true arctic type.Owing to a greater influence of warm Atlantic or Pacificwater, the other systems are of a cold-temperate type.Historical data are used to project the effects of a warm-ing climate on commercial and other marine stocksnative to these ecosystems.
Modeling studies show that it is difficult to simulate andproject changes in climate resulting from the response toforces that can and have been measured and even moni-tored on a regular basis for considerable periods and onwhich the models are built. Furthermore, current cli-mate models do not include scenarios for ocean temper-atures, watermass mixing, upwelling, or other relevantocean variables such as primary and secondary produc-tion, on either a global or regional basis. As fisheries typ-ically depend on such variables, any predictions concern-ing fisheries in a changing climate can only be of a verytentative nature.
Commercial fisheries in arctic regions are based on anumber of species belonging to physically differentecosystems.The dynamics of many of these ecosystemsare not well understood and therefore it is oftendifficult to identify the relative importance of fishingand the environment on changes in fish populationsand biology. Moreover, current fish populations differin abundance and biology from those in the past due toanthropogenic effects (i.e., exploitation rates). As aresult it is unclear whether current populations willrespond to climate change as they may have done inthe past.Thus the effects of climate change on marinefish stocks and the eventual socio-economic conse-quences of those effects for arctic fisheries cannot beaccurately predicted.
In general, it is likely that a moderate warming willimprove conditions for some of the most importantcommercial fish stocks, e.g., Atlantic cod, herring,and walleye pollock.This is most likely to be due toenhanced levels of primary and secondary productionresulting from reduced sea-ice cover. Reduced sea icewould automatically improve recruitment to Atlanticcod, herring, and walleye pollock stocks, as well as to anumber of other smaller stocks.
Such changes could also lead to extensive expansions ofhabitat areas for species such as cod and herring.Themost spectacular examples are cod at Greenland and theNorwegian spring-spawning herring. Atlantic cod appearto be unable to propagate off West Greenland exceptunder warm conditions when a very large self-sustainingcod stock has been observed. At the same time, therehas sometimes been a large-scale drift of juvenile codfrom Iceland to Greenland. Many of these cod have
returned to Iceland to spawn as adults, thus expandingthe distribution range of Icelandic cod. In warm periods,the Norwegian spring-spawning herring forages for foodwestward across the Norwegian Sea to the north ofIceland, but is excluded from the western half of theNorwegian Sea and northern Icelandic waters duringcold periods.This results in a loss of about a third of thesummer feeding grounds for the largest single herringstock in the world.
Global warming is also likely to induce an ecosystemregime shift in some areas, resulting in a very differentspecies composition. In such cases, relative populationsizes, fish growth rates, and spatial distributions of fishstocks are likely to change.This will result in the needfor adjustments in the commercial fisheries. However,unless there is a major climatic change, such adjustmentsare likely to be relatively minor and, although they maycall for fresh negotiations of fishing rights and totalallowable catches, such changes are unlikely to entailsignificant economic and social costs.
The total effect of a moderate warming of climate onfish stocks is likely to be of less importance than theeffects of fisheries policies and their enforcement.The significant factor in determining the future of fish-eries is sound resource management practices, which inlarge part depend upon the properties and effectivenessof resource management regimes and the underlyingresearch. Examples supporting this statement are thecollapse of the “northern cod” off Newfoundland andLabrador, the fall and rise of the Norwegian spring-spawning herring, and the stable condition of the Alaskapollock of the Bering Sea. However, all arctic countriesare currently making efforts to implement managementstrategies based on precautionary approaches, withincreasing emphasis on the inclusion of risk and uncer-tainty in all decision-making.
The economic and social impacts of altered environ-mental conditions depend on the ability of the socialstructures involved, including the fisheries managementsystem, to generate the necessary adaptations to thechanges.These impacts will be very different to thoseexperienced in earlier times, when the concept of fish-eries management was almost unknown. Furthermore,in previous times general poverty, weak infrastructure,and lack of alternative job opportunities meant that theability of societies to adapt to change, whether at anational or local level, was far less than today.Thus, it isunlikely that the impact of the climate change projectedfor the 21st century (see Chapter 4) on arctic fisherieswill have significant long-term economic or socialimpacts at a national level. Some arctic regions, espe-cially those very dependent on fisheries may, however,be greatly affected.
13.1. Introduction
This chapter identifies the possible effects of climatechange on selected fish stocks and their fisheries in the
Chapter 13 • Fisheries and Aquaculture 693
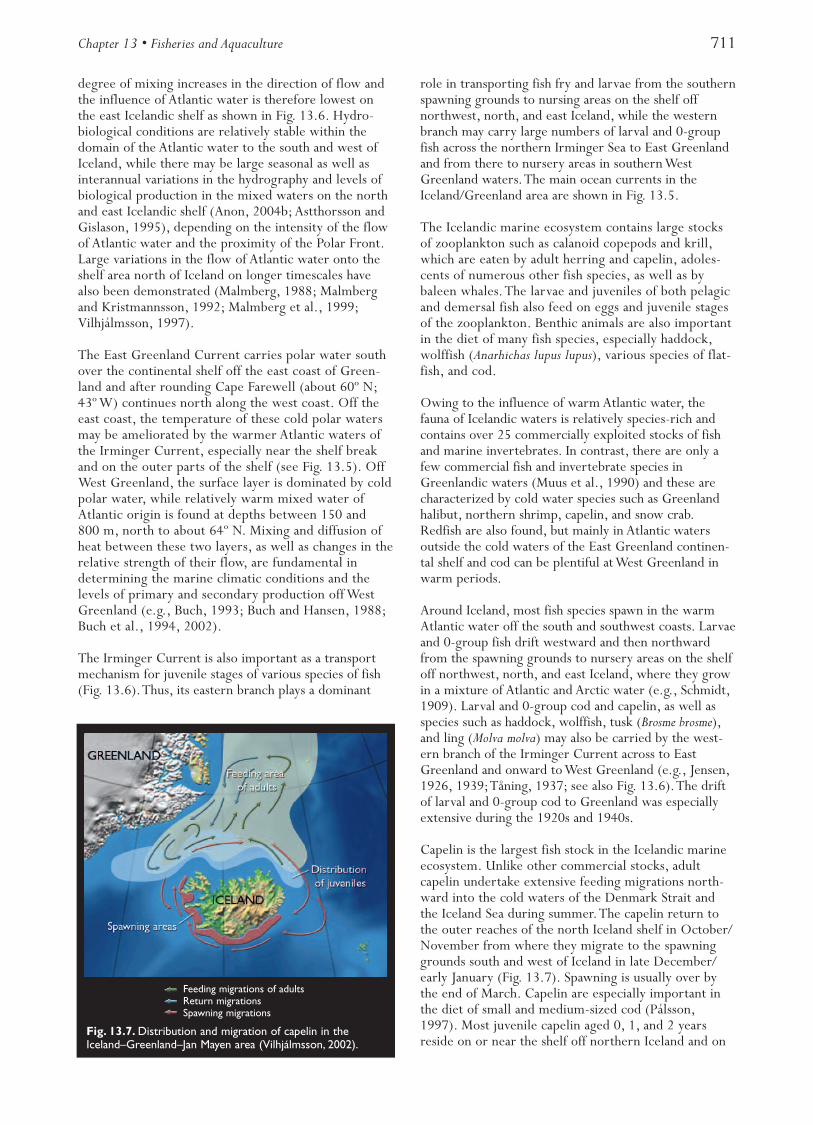
Arctic. Arctic fisheries of selected species are describedin the northeast Atlantic (i.e., the Barents and theNorwegian Seas), the waters around Iceland andGreenland, the waters off northeastern Canada, andthe Bering Sea (Fig. 13.1).The species discussed arethose few circumpolar species (capelin (Mallotus villo-sus), Greenland halibut (Reinhardtius hippoglossoides),northern shrimp (Pandalus borealis), and polar cod(Boreogadus saida)) and those of commercial importancein specific regions.The latter include Atlantic cod(Gadus morhua), haddock (Melanogrammus aeglefinus),Alaska pollock (Theragra chalcogramma), Pacific cod(Gadus macrocephalus), snow crab (Chionoecetes opilio),plus a number of others. Marine mammals are alsoconsidered in this chapter as they form an importantcomponent of northern marine ecosystems and severalare of commercial importance.
This chapter focuses on the effects of climate change oncommercial fisheries and the impacts on society as awhole. Chapters 9, 10, and 12 address the implicationsof fisheries and aquaculture for indigenous peoples.
This chapter is organized such that for each of the fourregions the discussion follows a standard format: intro-duction; ecosystem essentials; fish stocks and fisheries;past climatic variations and their impact on commercialstocks; possible impacts of global warming on fishstocks; the economic and social importance of fish-eries; past economic and social impacts of climatechange on fisheries; economic and social impacts ofglobal warming: possible scenarios; and ability to copewith change.The chapter concludes with a synthesis ofthe regional assessments of the impacts of climatechange on arctic fisheries and societies, and withresearch recommendations.
13.1.1. Biological and model uncertainties/certainties
Precise forecasts of changes in fish stocks and fisheriesand their effects on society are not possible.The sourcesof uncertainty can be grouped into three categories:(1) uncertainties in identifying the reasons for pastchanges in fish biology, (2) uncertainties in the projec-tions of potential changes in the ocean climate underclimate change scenarios, and (3) uncertainties relatingto the socio-economic effects of changes in fish stocks.
There are many biological characteristics of fish thatchange in response to natural variability in the physicalenvironment. However, when fish stocks are heavilyexploited, as many arctic stocks have been, it has provendifficult to identify the relative importance of fishing andenvironment on observed changes in biology. Also, manyfish stocks are currently much less abundant than in thepast and are showing extreme changes in populationcharacteristics.Thus, even if historical observations ofvariability in fish biology could be associated with pastchanges in ocean climate, it is not known whether thepresent populations would respond in a manner similarto the historical response.
Some of the uncertainties surrounding the response ofthe ocean to the projected changes in global climatediscussed in Chapter 4 were addressed in Chapter 9.One of the most important components of the arcticenvironment is the thermohaline circulation. Possiblechanges in the thermohaline circulation and their con-sequences are described in section 9.2.5.5. Present cli-mate models are considered to generate reasonablyreliable projections of climate change at a global scalebut are considered to generate less reliable results atthe regional level.This results in uncertainty in evalua-
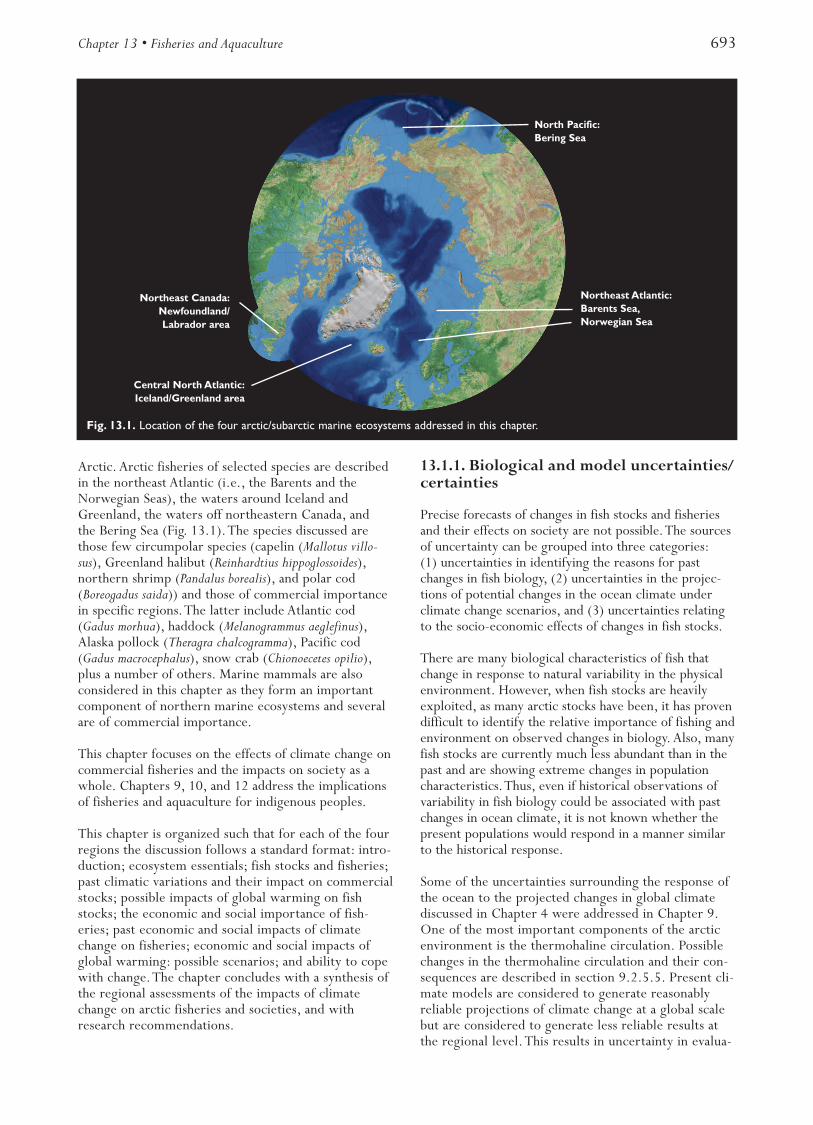
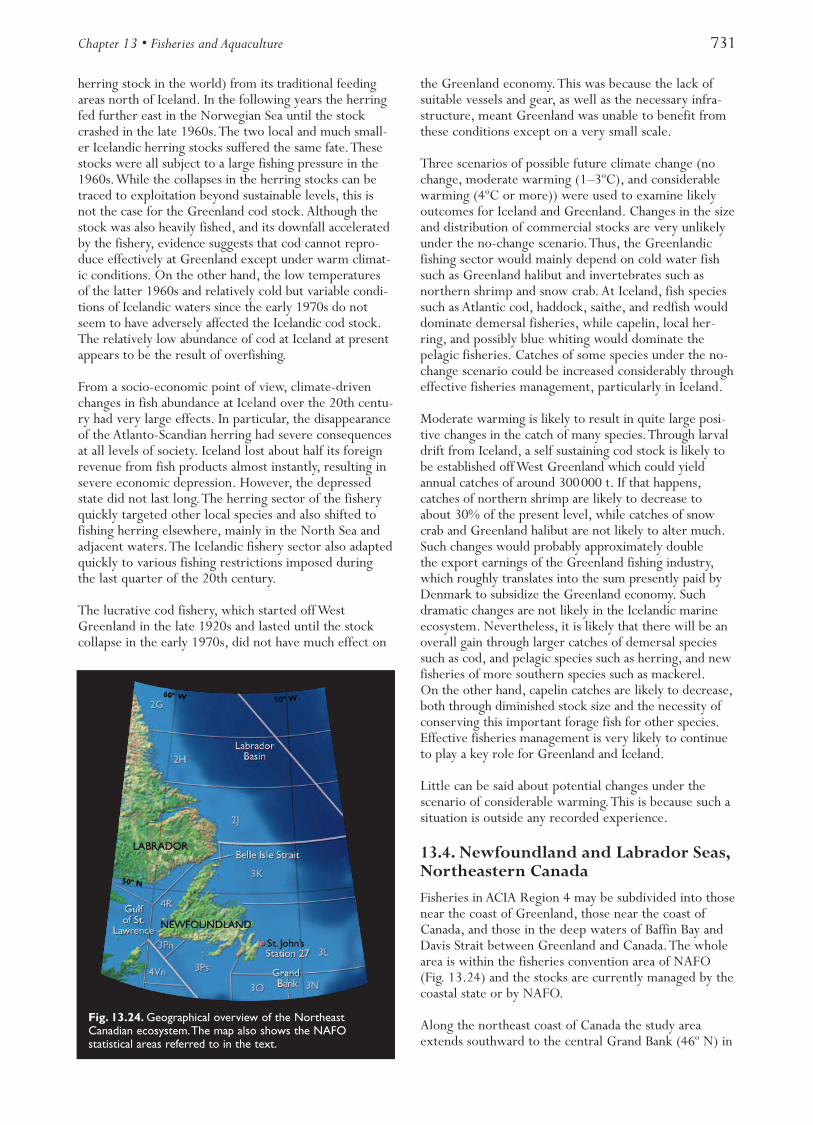
Fig. 13.1. Location of the four arctic/subarctic marine ecosystems addressed in this chapter.
Northeast Atlantic:Barents Sea,Norwegian Sea
North Pacific:Bering Sea
Central North Atlantic:Iceland/Greenland area
Northeast Canada:Newfoundland/Labrador area
694 Arctic Climate Impact Assessment
tions of potential effects of climate change on the largemarine ecosystems considered in this chapter.
Some key findings in Chapter 9 reflect a high degree ofcertainty about changes in the arctic seas. Althoughregional changes were not identified in Chapter 9, thechapter concludes that in most arctic areas upper watercolumn temperatures are very likely to increase, especially inareas with reduced sea-ice cover and that increased water tem-peratures are very likely to lead to a northward shift in the dis-tribution of many species of fish, to changes in the timing oftheir migration, to a possible extension of their feeding areas,and to increased growth rates. Chapter 9 also concludes thatmost of the present ice-covered arctic areas are very likely toexperience reductions in sea-ice extent and thickness, especiallyin summer and that in areas of reduced sea-ice cover, primaryproduction is very likely to increase, which in turn is likely toincrease zooplankton and possibly fish production. In addition,Chapter 9 concludes that increased areas and periods of openwater are likely to be favorable for some whale species and thedistribution of these species is very likely to move northward.An expansion of their feeding grounds would presum-ably lead to an increase in their abundance.Thus,although the Chapter 9 conclusions are global in scaleand do not identify specific changes in the four marineecosystems considered here, they do provide, with ahigh degree of probability, a basis for considering theseconclusions within the context of the fish stocks, fish-eries, and possible effects on human societies resultingfrom the projected changes in the four areas.
13.1.2. Societal uncertainties
Once fish population changes have been evaluated, itbecomes necessary to relate those changes to changes insociety.This raises new difficulties. Even when changesin fish populations are predictable to a high degree ofaccuracy, there is no deterministic relationship betweenthese changes and those in society. Social change is driv-en by a number of different forces; with climate changeonly one of a number of natural factors. Also, humansare important drivers of change, through economic andpolitical activities. It is extremely difficult to isolate therelative impact of the various drivers of change. In addi-tion, societies have the capacity to adapt to change.Changes in fish stocks, for example, are met by adjust-ments in fisheries management practices and the wayfisheries are performed.
The result of these uncertainties is that there are fewfirm predictions in this chapter. Instead, changes inpotential effects and likely outcomes are considered.
13.1.3.The global framework for managingliving marine resources
A global framework for the management of livingmarine resources has been developed over recentdecades, providing coastal states with extended jurisdic-tion over natural resources.The Third United NationsLaw of the Sea Conference (UNCLOS) was convened in
1973 and ended nine years later with the adoption in1982 of the United Nations Law of the Sea Convention,which lays down the rules and principles for the use andmanagement of the natural resources in the ocean.The most important elements are the provisions thatenable coastal states to establish exclusive economiczones (EEZs) up to 200 nautical miles (360 kilometers)from their coastal baselines. Coastal states have sovereignrights over the natural resources in their EEZs.TheConvention also mandates that coastal states manageresources in a sustainable manner and that they be usedoptimally.Where fish stocks are shared among countries,they shall seek to cooperate on their management.
A country’s authority to manage fish stocks is definedby its 200 mile EEZ.Within its EEZ, a coastal statehas sovereign rights over the natural resources, andtherefore the authority to manage the living marineresources there. During the 1980s it became evidentthat the framework provided by the Convention wasinadequate to cope with two major developments infisheries worldwide: the dramatic increase in fishing inthe high seas beyond the EEZs and a correspondingincrease in catches within the EEZs. Both develop-ments were driven by rapidly growing fishing capacity.The consequence was that many stocks were overfished.A treaty was therefore negotiated under the auspices ofthe United Nations to supplement the Convention,seeking to provide a legal basis for restricting fisherieson the high seas and introducing more restrictive man-agement principles, enhanced international cooperationin management, and improved enforcement of manage-ment measures.The Agreement for the Implementationof the Provisions of the United Nations Convention onthe Law of the Sea of 10 December 1982 Relating tothe Conservation and Management of Straddling FishStocks and Highly Migratory Fish Stocks (The UN FishStocks Agreement) was thus adopted in 1995 and man-dates the application of a precautionary approach tofisheries management. It also emphasizes the need forcooperation between countries at a regional level in thisrespect.These two elements have proved crucial in thedevelopment of international fisheries conservation andmanagement policies since the mid-1990s, not least inarctic areas. Existing regional arrangements have beenimproved upon in order to implement the agreements.This applies to the Northwest Atlantic Fisheries Organ-ization (NAFO), which covers the Northwest Atlantic,and the North East Atlantic Fisheries Commission(NEAFC), which covers the international waters in theNortheast Atlantic. An agreement placing a moratoriumon fishing on the high seas in the Bering Sea has been inforce since 1994.
The development of this global framework for fisheriesmanagement has been accompanied by a correspondingdevelopment of fisheries management regimes in indi-vidual countries.The design and performance of suchregimes are crucial to the fate of fish stocks. At theglobal level, the major challenges to fisheries manage-ment are related to the need to reduce a substantial
Chapter 13 • Fisheries and Aquaculture 695
overcapacity in the world’s fishing fleets, and the needto introduce more sustainable management practices.To achieve the latter, countries are introducing precau-tionary approaches to fisheries management – a crucialrequirement of the 1995 UN Fish Stocks Agreement.In addition, ecosystem-based approaches to the manage-ment of living marine resources, where natural factorssuch as climate change are taken into account in deci-sion-making, are under development.The 2002 WorldSummit on Sustainable Development stated in its imple-mentation plan that ecosystem-based approaches tomanagement are to be in place by 2010.
All arctic countries with significant fisheries have wellestablished resource management regimes with compre-hensive systems for producing the knowledge baserequired for management, the promulgation of regula-tions to govern fishing activities, and arrangements toensure compliance with regulations.While the variousregimes vary considerably with regard to the design ofmanagement policies, the challenges they confront inattempting to reduce overcapacity and in introducingprecautionary approaches to fisheries are similar.
For marine mammals there is a single international bodyat the global scale, and several regional bodies. At theglobal scale the 1946 International Convention for theRegulation of Whaling mandates an InternationalWhaling Commission (IWC) to regulate the harvest ofgreat whales. A moratorium on commercial whaling wasadopted in 1982. A number of countries, among themNorway and Russia, availed themselves of their right
under the convention not to be bound by this decision.Canada and Iceland left the Commission due to thepreservationist developments there. Iceland rejoined theCommission in 2003.The North Atlantic MarineMammal Commission (NAMMCO) is tasked with themanagement of marine mammals in the North Atlantic.
13.2. Northeast Atlantic – Barents andNorwegian SeasThis section addresses the potential impacts of climatechange on the fisheries in the arctic area of the North-east Atlantic.The area comprises the northern and east-ern parts of the Norwegian Sea to the south, and thenorth Norwegian and northwest Russian coasts and theBarents Sea to the east and north.The fisheries takeplace in areas under Norwegian and Russian jurisdictionsas well as in international waters.The total fisheries inthe area were around 2.1 million t in 2001 (based ondata in Michalsen, 2003). Aquaculture is dominated bysalmon and trout and produced 86000 t in 2001(Fiskeridirektoratet, 2002a).
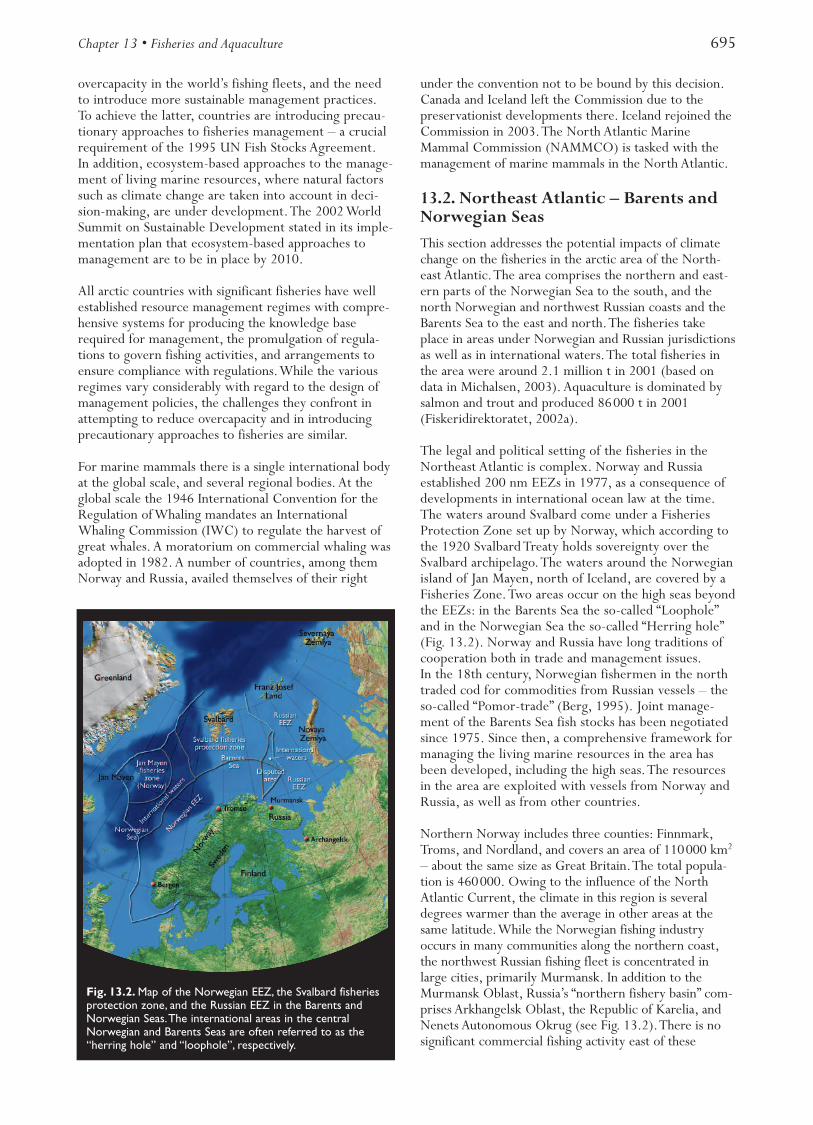
The legal and political setting of the fisheries in theNortheast Atlantic is complex. Norway and Russiaestablished 200 nm EEZs in 1977, as a consequence ofdevelopments in international ocean law at the time.The waters around Svalbard come under a FisheriesProtection Zone set up by Norway, which according tothe 1920 Svalbard Treaty holds sovereignty over theSvalbard archipelago.The waters around the Norwegianisland of Jan Mayen, north of Iceland, are covered by aFisheries Zone.Two areas occur on the high seas beyondthe EEZs: in the Barents Sea the so-called “Loophole”and in the Norwegian Sea the so-called “Herring hole”(Fig. 13.2). Norway and Russia have long traditions ofcooperation both in trade and management issues.In the 18th century, Norwegian fishermen in the northtraded cod for commodities from Russian vessels – theso-called “Pomor-trade” (Berg, 1995). Joint manage-ment of the Barents Sea fish stocks has been negotiatedsince 1975. Since then, a comprehensive framework formanaging the living marine resources in the area hasbeen developed, including the high seas.The resourcesin the area are exploited with vessels from Norway andRussia, as well as from other countries.
Northern Norway includes three counties: Finnmark,Troms, and Nordland, and covers an area of 110000 km2
– about the same size as Great Britain.The total popula-tion is 460000. Owing to the influence of the NorthAtlantic Current, the climate in this region is severaldegrees warmer than the average in other areas at thesame latitude.While the Norwegian fishing industryoccurs in many communities along the northern coast,the northwest Russian fishing fleet is concentrated inlarge cities, primarily Murmansk. In addition to theMurmansk Oblast, Russia’s “northern fishery basin” com-prises Arkhangelsk Oblast, the Republic of Karelia, andNenets Autonomous Okrug (see Fig. 13.2).There is nosignificant commercial fishing activity east of these
Fig. 13.2. Map of the Norwegian EEZ, the Svalbard fisheriesprotection zone, and the Russian EEZ in the Barents andNorwegian Seas.The international areas in the centralNorwegian and Barents Seas are often referred to as the“herring hole” and “loophole”, respectively.
696 Arctic Climate Impact Assessment
regions until the far eastern fishery basin in the NorthPacific. Since 1 January 2002, the population in the fourfederal subjects constituting Russia’s northern fisherybasin was 3.2 million people.
13.2.1. Ecosystem essentials
There are large seasonal variations in the upper waterlayers of the Barents Sea (see section 9.2.4.1).Thespring bloom starts in the southwestern areas andspreads north- and eastward following the retreat of thesea ice. Fish and marine mammals also exhibit directedmigrations: spawning migrations south- and westwardin late autumn and winter, and feeding migrationsnorth- and eastward in late spring and summer.
Relatively few species and stocks make up the bulk ofthe biomass at the various trophic levels. Fifteen totwenty species of whales and seals forage regularly in thearea. Harp seals (Phoca groenlandica) and minke whales(Balaenoptera acutorostrata) are the two most importantpredators in the pelagic ecosystem.The harp seals breedin the southeastern parts of the Barents Sea, i.e., in theWhite Sea, and feed close to the ice edge, mainly onamphipods and capelin. In periods of low capelin abun-dance, harp seals feed on other fish, such as cod, had-dock, and saithe (Pollachius virens), and migrate south-ward along the Norwegian coast (Nilssen K., 1995).Minke whales feed on various species of fish and overmost of the area from May to September (Nordøy et al.,1995). During the winter the whales occur further southin the Atlantic Ocean.
The spawning grounds of most species are situated alongthe coast of Norway and Russia. Spawning normallyoccurs in winter and spring (February to May) and eggand larval drift routes are toward the north and east.Juveniles and adults feed in the area; polar cod in thenorth- and northeasternmost parts, saithe and herring(Clupea harengus) in the southwest, as well as the eastern-most Norwegian Sea and off the Norwegian coast.Capelin reside mainly on the Atlantic side of the PolarFront during winter, but feed on the zooplankton pro-duction in the large ice-free areas north of the PolarFront in summer and autumn. Cod has the most exten-sive distribution. Adult cod spawn in Atlantic water farsouth along the coast of Norway in March to April, andthen feed along the Polar Front and even far into arcticwater masses during summer and autumn. All speciesexhibit seasonal migrations, which coincide with theformation and melting of sea ice: north- and eastwardduring spring and summer, south- and westward duringautumn and winter.
Cod, saithe, haddock, and redfish (Sebastes marinus andS. mentella) have their main spawning grounds on thecoastal banks and off the shelf edge (redfish only) ofNorway between 62º and 70º N and return to theBarents Sea after spawning. Herring migrate out of theBarents Sea before maturing, feed as adults in the Nor-wegian Sea, and have their main spawning grounds far-
ther south along the Norwegian coast, between about59º and 68º N. Capelin spawn in the northern coastalwaters mainly between 20º and 35º E, while polar codhas two main spawning areas; one in Russian waters inthe southeastern part of the Barents Sea and another inthe northwest, close to the Svalbard archipelago.Thecapelin spawning schools are followed by predatingimmature cod, four to six years old. Adult Greenlandhalibut inhabit the slope waters at depths between 400and 1000 m over the entire area. Northern shrimpoccur over most of the area in regions with bottomdepths of between 100 and 700 m on the “warm” sideof the Polar Front. Individuals are four to seven yearsold when they change sex from male to female andspawning (hatching of eggs) occurs in summer andautumn over most of the area.
From simulations of interactions between capelin, her-ring, cod, harp seals, and minke whales, Bogstad et al.(1997) found the herring stock to be sensitive to changesin minke whale abundance because whale predation inthe Barents Sea affects the number of recruits to themature herring stock.They also found that an increasingharp seal stock will reduce the capelin and cod stocks,implying that an unexploited seal population would leadto a substantial loss of catch in the cod fishery.
Cod, capelin, and herring are considered key fish speciesin the ecosystem and interactions between them gener-ate changes which also affect other fish stocks as well asmarine mammals and birds (Bogstad et al., 1997).Recruitment of cod and herring is enhanced by inflowsof Atlantic water carrying large amounts of suitable food(especially the “redfeed” copepod Calanus finmarchicus)for larvae and fry of these species. Consequently, sur-vival increases, so that juvenile cod and herring becomeabundant in the area. However, since young and juvenileherring prey on capelin larvae in addition to zooplank-ton, capelin recruitment might be negatively affectedand thus cause a temporal decline in the capelin stock,an occurrence that would affect most species in the area(fish, birds, and marine mammals) since capelin is theirmain forage fish. Predators would then prey on othersmall fish and shrimps. In particular, cod cannibalismmay increase and thus affect future recruitment of codto the fishery (Hamre, 2003).
In periods of low abundance or absence of capelinand/or herring, the top predators will have to feedsomewhere else or shift to prey on the zooplanktongroup. For cod, such shifts have been observed twice inthe past 15 years and were related to the collapses of thecapelin stock in 1986–1988 and 1993–1994.
13.2.2. Fish stocks and fisheries
For the past thousand years, fishing for cod and herringhas been important for coastal communities in Norwayand northern Russia (Solhaug, 1983).Throughout thecenturies, fishing was purely coastal and seasonal andbased on the large amounts of adult cod and herring
Chapter 13 • Fisheries and Aquaculture 697
migrating into near-shore waters for spawning duringwinter–spring and on the schools of immature cod feed-ing on spawning capelin along the northern coasts inApril to June. A certain development toward offshorefishing took place at the end of the 19th century whencod were caught on the Svalbard banks and driftnettingof herring began off northern Iceland. However, thequantities caught in these “offshore” fisheries were smallcompared to the near-shore catches in the traditionalfisheries for both species. Estimates of annual yields ofcod and herring prior to 1900 were given by Øiestad(1994). For both species large fluctuations wereexperienced.The dominant feature is the 5- to 10-foldincreases between 1820 and 1880 as compared to yieldsin previous centuries. For fish species other than cod andherring reliable estimates of yield prior to the 20th cen-tury are not available.
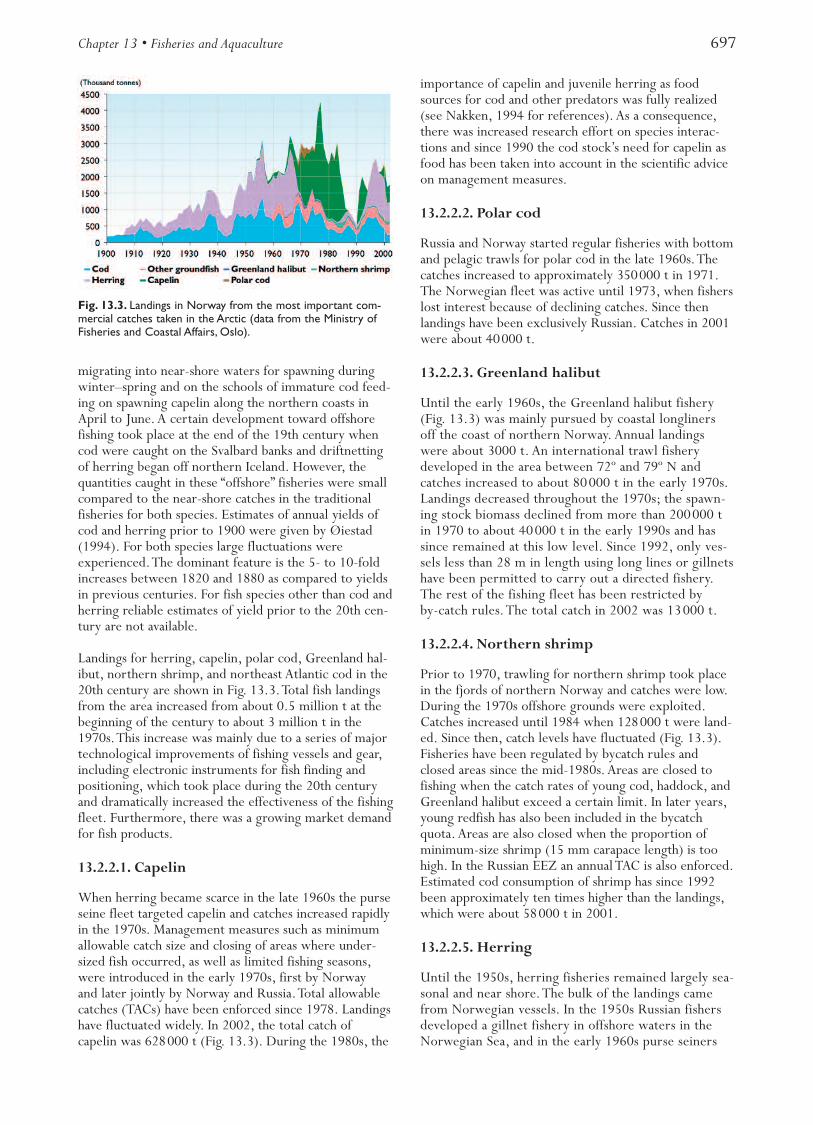
Landings for herring, capelin, polar cod, Greenland hal-ibut, northern shrimp, and northeast Atlantic cod in the20th century are shown in Fig. 13.3.Total fish landingsfrom the area increased from about 0.5 million t at thebeginning of the century to about 3 million t in the1970s.This increase was mainly due to a series of majortechnological improvements of fishing vessels and gear,including electronic instruments for fish finding andpositioning, which took place during the 20th centuryand dramatically increased the effectiveness of the fishingfleet. Furthermore, there was a growing market demandfor fish products.
13.2.2.1. Capelin
When herring became scarce in the late 1960s the purseseine fleet targeted capelin and catches increased rapidlyin the 1970s. Management measures such as minimumallowable catch size and closing of areas where under-sized fish occurred, as well as limited fishing seasons,were introduced in the early 1970s, first by Norwayand later jointly by Norway and Russia.Total allowablecatches (TACs) have been enforced since 1978. Landingshave fluctuated widely. In 2002, the total catch ofcapelin was 628000 t (Fig. 13.3). During the 1980s, the
importance of capelin and juvenile herring as foodsources for cod and other predators was fully realized(see Nakken, 1994 for references). As a consequence,there was increased research effort on species interac-tions and since 1990 the cod stock’s need for capelin asfood has been taken into account in the scientific adviceon management measures.
13.2.2.2. Polar cod
Russia and Norway started regular fisheries with bottomand pelagic trawls for polar cod in the late 1960s.Thecatches increased to approximately 350000 t in 1971.The Norwegian fleet was active until 1973, when fisherslost interest because of declining catches. Since thenlandings have been exclusively Russian. Catches in 2001were about 40000 t.
13.2.2.3. Greenland halibut
Until the early 1960s, the Greenland halibut fishery(Fig. 13.3) was mainly pursued by coastal longlinersoff the coast of northern Norway. Annual landingswere about 3000 t. An international trawl fisherydeveloped in the area between 72º and 79º N andcatches increased to about 80000 t in the early 1970s.Landings decreased throughout the 1970s; the spawn-ing stock biomass declined from more than 200000 tin 1970 to about 40000 t in the early 1990s and hassince remained at this low level. Since 1992, only ves-sels less than 28 m in length using long lines or gillnetshave been permitted to carry out a directed fishery.The rest of the fishing fleet has been restricted byby-catch rules.The total catch in 2002 was 13000 t.
13.2.2.4. Northern shrimp
Prior to 1970, trawling for northern shrimp took placein the fjords of northern Norway and catches were low.During the 1970s offshore grounds were exploited.Catches increased until 1984 when 128000 t were land-ed. Since then, catch levels have fluctuated (Fig. 13.3).Fisheries have been regulated by bycatch rules andclosed areas since the mid-1980s. Areas are closed tofishing when the catch rates of young cod, haddock, andGreenland halibut exceed a certain limit. In later years,young redfish has also been included in the bycatchquota. Areas are also closed when the proportion ofminimum-size shrimp (15 mm carapace length) is toohigh. In the Russian EEZ an annual TAC is also enforced.Estimated cod consumption of shrimp has since 1992been approximately ten times higher than the landings,which were about 58000 t in 2001.
13.2.2.5. Herring
Until the 1950s, herring fisheries remained largely sea-sonal and near shore.The bulk of the landings camefrom Norwegian vessels. In the 1950s Russian fishersdeveloped a gillnet fishery in offshore waters in theNorwegian Sea, and in the early 1960s purse seiners
Fig. 13.3. Landings in Norway from the most important com-mercial catches taken in the Arctic (data from the Ministry ofFisheries and Coastal Affairs, Oslo).
698 Arctic Climate Impact Assessment
started using echo sounding equipment to locate her-ring.These technological developments resulted in alarge increase in the total catches until 1966 (2 mil-lion t).Thereafter, catches decreased rapidly and thestock collapsed (Fig. 13.3, and see Box 13.1). Althoughindividual scientists expressed concern about the stock,effective management measures were neither advisednor implemented until after the stock had collapsedcompletely. Minor catches in the early 1970s (between7000 and 20000 t) removed most of the remainingspawning stock as well as juveniles and it was not until1975 that the fishing pressure was brought to a levelwhich permitted the stock to start recovering. For25 years the stock was very small and remained inNorwegian coastal waters throughout the year. Norwayintroduced management measures including minimumallowable landing size and annual TACs. Furthermore, acomplete ban on fishing herring was enforced for some
years. During the 1990s the stock recovered, started tomake feeding migrations into the Norwegian Sea, andcatch quotas and landings increased. In 2002 the totallandings were 830000 t.
13.2.2.6. Northeast Atlantic cod
Prior to 1920, the bulk of the northeast Atlantic cod(Gadus morhua) catch was from two large seasonal andcoastal fisheries: the fishery for immature cod feedingon spawning capelin along the northern coast ofNorway and Russia and the fishery for spawning cod(“skrei”) further south off northern Norway (theLofoten fishery). In the 1920s and 1930s an inter-national bottom trawl fishery targeting cod as well asother species (haddock, redfish) developed in offshoreareas of the Barents Sea and off Svalbard. Annual catch-es increased from about 400000 t in 1930 to 700000 to
Box 13.1.The fall and rise of the Norwegian spring-spawning herring
In the early 1950s, the spawning stock of Norwegian spring-spawning herring was estimated at 14 million t –one of the largest fish stocks in the world. Most of the adult stock migrated between Norwegian and Icelandiccoastal waters to spawn in winter and feed in summer, respectively.The herring fishery was important forseveral countries, especially Norway, Iceland, Russia, and the Faroe Islands. However, after 15 years of over-exploitation and a decreasing spawning stock, the stock collapsed in the late 1960s.
Deteriorating climatic conditions north of Iceland and in the western Norwegian Sea are crucial in explainingchanges of feeding areas and migration routes of these herring in the late 1960s. High fishing intensity was,however, the major factor behind the actual stock collapse.The breakdown had large social and economicconsequences for those depending on the fishery. Nevertheless, the industry managed to redirect its effort toother pelagic species – primarily capelin.
Over the following decades, the remaining herring kept close to the Norwegian coast.The stock was strictlyregulated and fishing was prohibited for several years.These regulations, probably in combination with favorableclimatic conditions, contributed to a considerable increase in stock size from the mid-1980s, making it possibleto resume fishing. By the late 1980s the spawning stock had reached a level of 3 to 4 million t, mainly due toabove average recruitment by the 1983 year class.
By 1995, the spawning stock had reached 5 million t. As a consequence, the stock extended its feeding groundsby resuming its old migration pattern westward into the Norwegian Sea. It therefore became available for fishingbeyond areas under Norwegian jurisdiction.The unilateral Norwegian management regime was no longeradequate to regulate fishing of the stock. Meanwhile, there was no arrangement to oversee the internationalmanagement of the fishery. Negotiations between Norway, Russia, Iceland, and the Faroe Islands failed, and thetotal catch quota recommended by ICES was exceeded in the following year.
High economic values were at stake for all actors. Fishers and fisheries managers in all involved countries and inthe EU were very engaged in the conflict. A first agreement was reached between Norway, Russia, Iceland, andthe Faroe Islands in May 1996. In December 1996, the EU was included in the arrangement, where the fiveparties set and distribute TACs of Norwegian spring-spawning herring, based on ICES advice.The responsibilityto manage the share of the stock in international waters is vested with the NEAFC, of which the aforemen-tioned parties are members. Negotiations are held every year, but the percentage allocation key has notchanged since the 1996 agreement. However, changes in the migration pattern may upset the present arrange-ment.The arrangement is, however, not currently functional due to disagreement over quota distribution.
This example shows that not only negative, but also positive changes in stock abundance may create manage-ment problems. If the parties had not reached agreement, there would have been devastating consequences forthe exploitation and development of the Norwegian spring-spawning herring stock, almost certainly resulting insignificant economic losses.This example shows the importance of political efforts to solve such conflicts.
Chapter 13 • Fisheries and Aquaculture 699
800000 t at the end of the decade. Landings alsoremained high after the Second World War until theend of the 1970s when catches declined sharply due toreduced stock size and the introduction of EEZs. Man-agement advice was given by the International Councilfor the Exploration of the Sea (ICES) from the early1960s. Increases in trawl mesh sizes were recommend-ed in 1961 and in 1965 a variety of further conserva-tion measures were recommended in order to increaseyield per recruit and to limit the overall fishing mortali-ty. From 1969 onward, ICES has expressed concernabout the future size of the spawning stock, consideringthat at low levels of spawning stock biomass therewould be an increased risk of poor recruitment to thestock.The first TAC for cod was set in 1975, but was fartoo high. Although minimum mesh size regulations hadbeen in force for some years at that time, it is fair toconclude that no effective management measures werein operation for demersal fish in the area prior to theestablishment of 200 nm EEZs in 1977.
The estimated average fishing mortality for the five-year period 1997 to 2001 is a record high (0.90) andabout twice the fishing mortality corresponding to theprecautionary approach (0.42). In the period 1998 to2000 the spawning stock biomass was well below therecommended precautionary level of 500000 t.However, despite relatively low recruitment in mostrecent years, the spawning stock has increased since2000 and is now considered to be above precautionarylevels. Landings have varied considerably over time andin 2002 were 430000 t (Fig. 13.3).
13.2.2.7. Marine mammals
Three species of marine mammals are commerciallyexploited in the Northeast Atlantic by Norwegian andRussian fishers, i.e., minke whales, hooded seals(Cystophora cristata), and harp seals. In addition, greyseals (Halichoerus grypus) and harbour seals (Phoca vituli-na) are exploited along the Norwegian coast by localhunters. Offshore exploitation of marine mammals inthe area began in the 16th century. Basque and laterDutch and British vessels hunted Greenland rightwhales (Balaena mysticetus) and seals. Processing plantswere established at shore stations as far north as north-western Spitzbergen (Arlov, 1996). Russian and Norwe-gian hunters have caught walrus (Odobenus rosmarus),polar bear (Ursus maritimus), and seals at the Svalbardarchipelago since the 16th century. By the first decadesof the 19th century the stocks of right whales hadalmost disappeared, and the walrus was so depleted thatthe hunt became unprofitable. A new era of offshoreexploitation began around 1860 to 1870 when the useof smaller ice-going vessels (“sealers”) permittedNorwegian hunters to penetrate into the drift ice.At about the same time the invention of the grenadeharpoon made hunting of great whales profitable.Catches of great whales increased between 1870 and1900, but leveled off and decreased rapidly during thefirst decade of the 20th century.
Minke whales
Minke whales have been hunted in landlocked bays(“whaling bays”) along the coast of Norway since oldentimes. Offshore hunting, using small motorized vessels,developed prior to the Second World War, essentially asan extension of fishing activities. Catches increased untilthe 1950s, the mean annual take at that time being about2300 animals. Since 1960, catches have decreased due toreductions in annual TACs. Between 1987 and 1992 nocommercial hunting was allowed. In recent years annualcatches have been 400 to 600 animals and the quota for2002 is 674 minke whales.The stock in the area is esti-mated at 112000 animals (Michalsen, 2003).
Harp seals and hooded seals
Two stocks of harp seal, in the West Ice (Greenland Sea)and the East Ice (White Sea – Barents Sea), and onestock of hooded seal in the West Ice are subject to off-shore sealing; since about 1880 mainly by Norwegianand Russian hunters.The total annual catch from thesestocks increased from about 120000 animals around1900 to an average of about 350000 per year in the1920s. Since then catches have declined, mainly becauseof catch regulations (i.e.,TACs). In recent years the lossof markets has been the main limiting factor. In the1990s, catches of harp seal in the West Ice were 8000 to10000 animals each year and 8000 to 9000 for hoodedseal, while catches of harp seal in the East Ice rangedfrom 14000 to 42000 per year. Russian catches, whichconstitute about 82% of the total, are taken in the EastIce, while the Norwegian catches (about 18%) are takenin both the West Ice and East Ice.
Hooded seals are found in the North Atlantic betweenNovaya Zemlya, Svalbard, Jan Mayen, Greenland, andLabrador. All the Norwegian catch of hooded seal takesplace in the West Ice (Greenland Sea). Russia has notcaught hooded seals since 1995.The total catch in 2001was 3820 animals. All seal stocks are assessed every sec-ond year by a joint ICES/NAFO working group, whichprovides ICES with sufficient information to give adviceon stock status and catch potential. All three stocks arewell within safe biological limits, and harvesting ratesare sustainable.
13.2.3. Past climatic variations and theirimpact on commercial stocks
The relationship between the physical effects of climatechange and effects on the ecosystem is complex. It is notpossible to isolate, let alone quantify, the effects of cli-mate change on biological resources.The following dis-cussion is therefore of a tentative and qualitative nature.
A number of climate-related events have been observedin the Northeast Atlantic fisheries (see section 9.3.3.3).During the warming of the Nordic Seas between 1900and 1940, there were substantial northward shifts in thegeographical boundaries for a range of marine species
700 Arctic Climate Impact Assessment
from plankton to commercial fish, as well as for terres-trial mammals and birds (Dickson, 1992). Recruitmentof both cod and herring is positively related to inflowsof Atlantic waters to the area and thus to temperaturechanges. Both stocks increased significantly between1920 and 1940 when water temperatures increased(Hylen, 2002;Toresen and Østvedt, 2000).The increasein stock size was probably an effect of enhanced recruit-ment, because catches increased in the same period.A similar development may have occurred between1800 and 1870 (Øiestad, 1994). Øiestad (1994) alsoprovided evidence that cod abundance was low duringthe cold period between 1650 and 1750.
Since the Second World War both cod and herring havebeen subject to overfishing.This resulted in a collapse ofthe herring stock in the 1960s, with serious conse-quences for other inhabitants of the ecosystem as well asman (see Box 13.1). For cod, the most likely result ofthe overfishing has been a far lower average annual yieldsince 1980 than the stock has potential to produce.Recruitment of cod depends heavily on parent stock sizein addition to environmental factors (Ottersen andSundby, 1995; Pope et al., 2001). For several decadesheavy fishing pressure has prevented maintenance of thecod spawning stock at a level which optimizes recruit-ment levels in the long run.Therefore, management ofthese stocks is the key issue in assessing the effects ofpotential climate variations (Eide and Heen, 2002).
13.2.4. Possible impacts of climate changeon fish stocks
Global models project an increase in surface tempera-ture in the Northeast Atlantic area of 3 to 5 ºC by 2070(see Chapter 4). Regional models however, project thatfor surface temperatures in this area there will be “acooling of between 0 and -1 ºC” by 2020 (Furevik et al.,2002). By 2050 the area is projected to have becomewarmer and by 2070 surface temperatures are projectedto have increased by 1 to 2 ºC (Furevik et al., 2002).
Research over the last few decades shows that cod pro-duction increases with increasing water temperature forstocks inhabiting areas of mean annual temperaturebelow 6 to 7 ºC, while cod stocks in warmer watersexhibit reduced recruitment when the temperatureincreases (Sundby, 2000).The mean annual ambienttemperature for northeast Atlantic cod is 2 to 4 ºC(depending on age group) and the stock has experiencedgreatly improved recruitment during periods of highertemperature in the past (Sundby, 2000). A rise in meanannual temperature in the Barents Sea over the period to2070 is therefore likely to favor cod recruitment andproduction, and result in an extended distribution area(i.e., spawning and feeding areas) to the north and east.A similar statement may be made for herring (seeChapter 9).This statement is based on the assumptionthat the production and distribution of animals at lowertrophic levels (particularly copepods – the food for lar-vae) remain unchanged.The projection is also based on
the assumption that harvest rates are kept at levels thatmaintain spawning stock biomass above the level atwhich recruitment is adversely affected.
Experience indicates that it is likely that a rise in watertemperature, as projected for the area, will result inlarge displacements to the north and east of the distri-bution ranges of resident marine organisms, includingfish, shrimps, and marine mammals.Their boundariesare very likely to be extended as waters get warmer andsea-ice cover decreases. “Warm water” pelagic species,such as blue whiting (Micromesistius poutassou) and mack-erel (Scomber scombrus), are likely to occur in the area inhigher concentrations and more regularly than in thepast. Eventually, these species will possibly inhabit thesouthwestern parts of the present “arctic area” on a per-manent basis.
The effects of a temperature rise on the production bythe stocks of fish and marine mammals presently inhab-iting the area are more uncertain.These depend onhow a temperature increase is accompanied by changesin ocean circulation patterns and thus plankton trans-port and production. In the past, recruitment to sever-al fish stocks in the area, cod and herring in particular,has shown a positive correlation with increasing tem-perature.This was due to higher survival rates of larvaeand fry, which in turn resulted from increased foodavailability. Food is transported into the area viainflows of Atlantic water, which have also caused theocean temperature to increase. Hence, high recruit-ment in fish is associated with higher water tempera-ture but is not caused by the higher water temperatureitself (Sundby, 2000).
Provided that the fluctuations in Atlantic inflows to thearea are maintained along with a general warming ofthe North Atlantic waters, it is likely that annual aver-age recruitment of herring and cod will be at about thelong-term average until around 2020 to 2030.This pro-jection is also based on the assumption that harvestrates are kept at levels that maintain spawning stockswell above the level at which recruitment is impaired.How production will change further into the future isimpossible to guess, since the projected temperatures,particularly for some of the global models, are so highthat species composition and thus the interactions in theecosystem may change completely.
13.2.5.The economic and social importanceof fisheries
The fishery sector is of considerable economic signifi-cance in Norway, being among the country’s mainexport earners. Data used in this section are based onstatistics from “Fisken og Havet” and the NorwegianDirectorate of Fisheries, and include landings fromcatches taken in ICES statistical areas I, IIa, and IIb.In 2001, the export of fish products accounted for 14%of the total exports from mainland Norway (based ondata from the Statistical Yearbook of Norway and infor-
Chapter 13 • Fisheries and Aquaculture 701
mation from the Norwegian Seafood Exports Council).The fisheries constituted 1.5% of the Norwegian GrossNational Product in 1999, excluding petroleum.In northwest Russia, fisheries are of less economicimportance nationally. A substantial share of the catchestaken in Russian fisheries in the north is landed abroad.
Most northern coastal communities are heavilydependent on the fisheries in economic terms, as wellas being culturally and historically attached to fisheries.As early as AD 1000 an extensive trade in dried codhad developed in northern Norway, through theHanseatic trade (Solhaug, 1983).The coastal fisheryand trade made up the economic foundation for thecommunities along the northern coast. Since the early1980s, aquaculture has become increasingly important,accounting for a significant part of the economic valueof the fisheries sector (Ervik et al., 2003).
The total fishery in the arctic Northeast Atlanticyields about 2.1 million t and has a total annual valueof around US$ 2 billion. The resources occurring inthe Arctic are also significant to fishery communitieselsewhere. A substantial component of the catches inthe Arctic is taken by fishers from outside the region,such as those from southern Norway and elsewherein Europe.
13.2.5.1. Fish stocks and fisheries
Most of the Norwegian fish harvest is taken in theNorwegian EEZ (Fig. 13.2). Altogether, the watersunder Norwegian jurisdiction cover around 2 mil-lion km2 – more than six times the area of mainlandNorway.The arctic fisheries occur in three main areas:the Barents Sea/Svalbard area, the north Norwegiancoast, and around Jan Mayen.
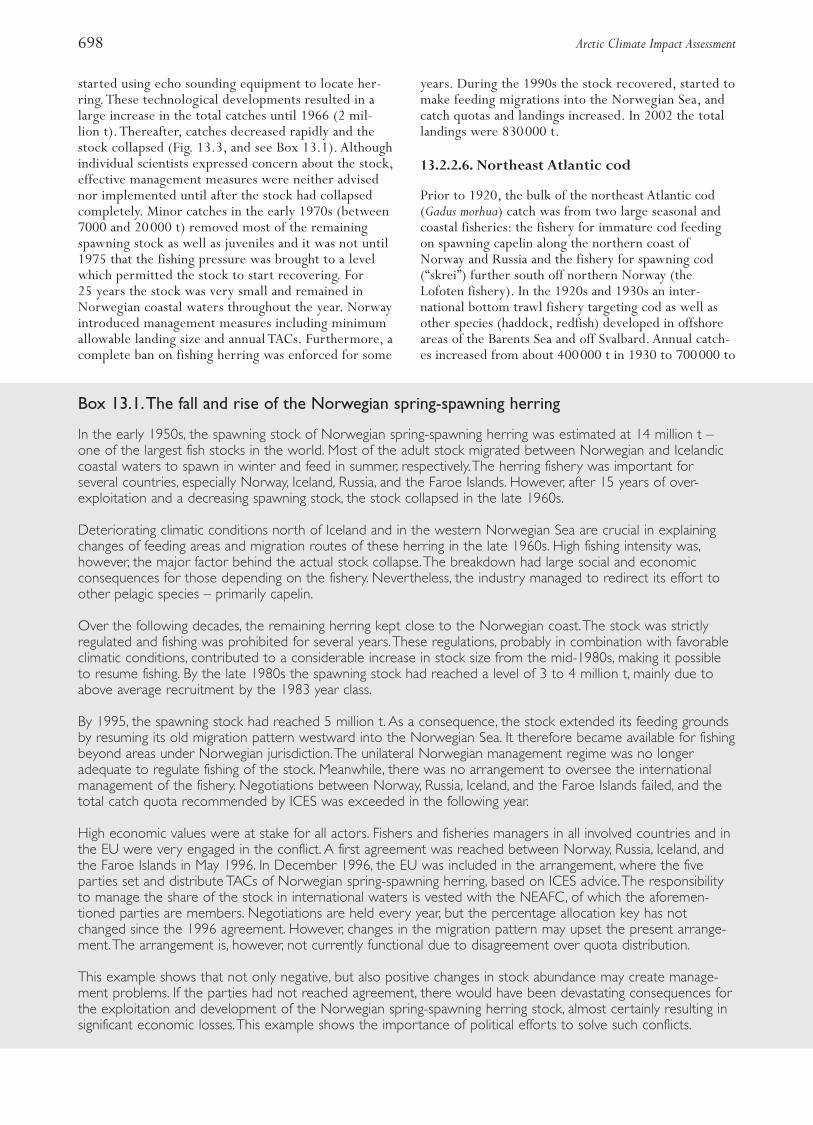
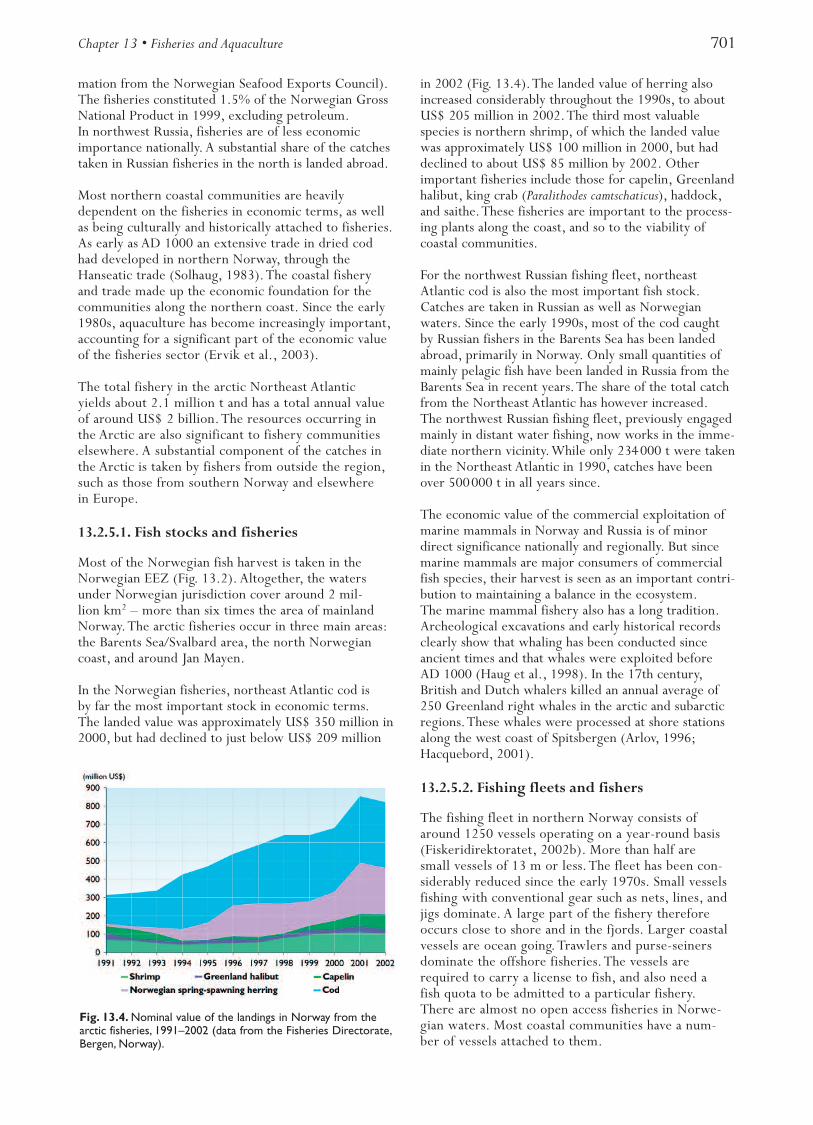
In the Norwegian fisheries, northeast Atlantic cod isby far the most important stock in economic terms.The landed value was approximately US$ 350 million in2000, but had declined to just below US$ 209 million
in 2002 (Fig. 13.4).The landed value of herring alsoincreased considerably throughout the 1990s, to aboutUS$ 205 million in 2002.The third most valuablespecies is northern shrimp, of which the landed valuewas approximately US$ 100 million in 2000, but haddeclined to about US$ 85 million by 2002. Otherimportant fisheries include those for capelin, Greenlandhalibut, king crab (Paralithodes camtschaticus), haddock,and saithe.These fisheries are important to the process-ing plants along the coast, and so to the viability ofcoastal communities.
For the northwest Russian fishing fleet, northeastAtlantic cod is also the most important fish stock.Catches are taken in Russian as well as Norwegianwaters. Since the early 1990s, most of the cod caughtby Russian fishers in the Barents Sea has been landedabroad, primarily in Norway. Only small quantities ofmainly pelagic fish have been landed in Russia from theBarents Sea in recent years.The share of the total catchfrom the Northeast Atlantic has however increased.The northwest Russian fishing fleet, previously engagedmainly in distant water fishing, now works in the imme-diate northern vicinity.While only 234000 t were takenin the Northeast Atlantic in 1990, catches have beenover 500000 t in all years since.
The economic value of the commercial exploitation ofmarine mammals in Norway and Russia is of minordirect significance nationally and regionally. But sincemarine mammals are major consumers of commercialfish species, their harvest is seen as an important contri-bution to maintaining a balance in the ecosystem.The marine mammal fishery also has a long tradition.Archeological excavations and early historical recordsclearly show that whaling has been conducted sinceancient times and that whales were exploited beforeAD 1000 (Haug et al., 1998). In the 17th century,British and Dutch whalers killed an annual average of250 Greenland right whales in the arctic and subarcticregions.These whales were processed at shore stationsalong the west coast of Spitsbergen (Arlov, 1996;Hacquebord, 2001).
13.2.5.2. Fishing fleets and fishers
The fishing fleet in northern Norway consists ofaround 1250 vessels operating on a year-round basis(Fiskeridirektoratet, 2002b). More than half aresmall vessels of 13 m or less. The fleet has been con-siderably reduced since the early 1970s. Small vesselsfishing with conventional gear such as nets, lines, andjigs dominate. A large part of the fishery thereforeoccurs close to shore and in the fjords. Larger coastalvessels are ocean going. Trawlers and purse-seinersdominate the offshore fisheries. The vessels arerequired to carry a license to fish, and also need afish quota to be admitted to a particular fishery.There are almost no open access fisheries in Norwe-gian waters. Most coastal communities have a num-ber of vessels attached to them.
Fig. 13.4. Nominal value of the landings in Norway from thearctic fisheries, 1991–2002 (data from the Fisheries Directorate,Bergen, Norway).
702 Arctic Climate Impact Assessment
Northwest Russian fisheries include a variety offishery-related activities and participants.They arebased in Murmansk and Arkhangelsk Oblasts, and inthe Republic of Karelia (Hønneland and Nilssen, 2000;Nilssen F. and Hønneland, 2001). Most of the activityis located in the city of Murmansk, where most vesselowners, fish processing plants, and managementauthorities have their premises.The association of fish-ing companies in “the northern basin” of the SovietUnion, Sevryba (“North Fish”), was founded in 1965and given the status of General Directorate of theSoviet Ministry of Fisheries in Northwestern Russia.Sevryba was made a private joint-stock company in1992.The majority of the approximately 450 fishingvessels located in northwestern Russia are controlledby a handful of fishing companies (referred to hence-forth as the “traditional” companies).The rest are dis-tributed between kolkhozy (fishing collectives) and pri-vate fishing companies (referred to henceforth as the“new” companies).The total number of vessels hasbeen stable since the early 1990s: few old vessels havebeen taken out of service and few new vessels havebeen purchased (Hønneland, 2004).
The “traditional” fishing companies are a legacy fromthe Soviet period. This fleet mainly consists of medi-um-sized (50 to 70 m) and large (over 70 m) vessels,and has around 250 to 300 ships. Before the dissolu-tion of the Soviet Union, their main activity was theexploitation of pelagic species in distant waters andfisheries in the northern Atlantic Ocean.These compa-nies now deploy a fleet of mid-sized factory trawlersfor fishing and processing codfish. The collective fleetis significantly smaller in number, with some 80 to100 vessels. Nearly all are of medium size (50 to70 m).The fishing collectives are more diversified thanother companies. Like the traditional companies, thecollectives also aim at upgrading their fleet. The “new”companies (including the so-called coastal fishing fleet)have the smallest fleet, both in number and vessel size,limiting the range of the vessels and so the marketsfor the sale of the fish.The fleet comprises around100 vessels, including around 30 coastal fishing vesselsof less than 50 m in length.
The Russian perception of “coastal fishing” differs fromthat in neighboring countries.While a Norwegian“coastal” fishing vessel normally has a small crew andgoes to port for daily delivery of catches, a northwestRussian “coastal” fishing vessel has a crew of more thana dozen and stays at sea for weeks before landing thecatch.The reasons for this are two-fold.The fishingindustry that was developed during the Soviet periodwas based on large-scale fishing and processing.Traditions, skills, and infrastructure for small-scalecoastal fisheries are therefore non-existent in the mainfishing regions of the Russian Federation. In addition,fish stocks for developing a viable coastal fishery arenot available. Also, the financial status of the fishingcompanies is an obstacle to the development of coastalfisheries (Hønneland, 2004).
13.2.5.3.The land side of the fishing industry
More than 90% of the fish landed in Norway – byNorwegian, Russian, and other countries’ vessels – isexported. Changes in the international market for fishand fish products may thus have substantial effects on theprocessing plants as well as on the rest of the industry.Many fish processing plants are heavily dependent onlandings by Russian vessels. In 2001, around 70% of theRussian cod quota was landed in Norway.This percent-age has since decreased, with the increase in landings inother countries and trans-shipments in the open ocean.The fishing industry, especially the fillet-producingplants, has experienced low profitability and an increas-ing number of bankruptcies in recent years (Bendiksenand Isaksen, 2000). Increased competition for rawmaterials and high production costs in Norway help toexplain the problems. In addition, the advantage of theNorwegian industry has been its location near theresources. New freezing and defrosting technologies,and infrastructure developments that make frozen prod-ucts more valuable (Dreyer, 2000), reduce the advantageof proximity to the resource.
There are around 170 fish processing plants in northernNorway (Roger Richardsen, Fiskeriforskning, pers.comm., 2002 data).The size of the plants varies substan-tially. Most are engaged in producing traditional white-fish products, for example dried cod, salted fish, andstockfish. In Finnmark, a relatively large proportion ofthe plants concentrate on fillet production, while theshrimp industry is more important in Troms (NORUT,2002). In Nordland, both fillet and traditional produc-tion is important.
Before the dissolution of the Soviet Union, Murmanskhad the largest fish processing plant of the entire Union.Since fishing in distant waters has been reduced andcatches from northern waters landed abroad, activities atthe fish processing plants in Murmansk have been drasti-cally reduced.The production of consumer products fellfrom 83300 t in 1990, to 10100 t in 1998 (Nilssen F.and Hønneland, 2001). Processing of fish outsideMurmansk is insignificant.
13.2.5.4. Aquaculture
Since around 1980, Atlantic salmon (Salmo salar) andtrout (Oncorhynchus mykiss)-based aquaculture has devel-oped in Norway, making this country the world’s biggestfarmed salmon producer.Total production in 2000 was485000 t, worth US$ 1.6 billion. Of this, around145000 t of salmon and trout were produced in north-ern Norway, at a production (i.e., before sales) value ofapproximately US$ 470 million.This makes salmon thesingle most important species in terms of economicvalue, both in northern Norway and in the Norwegianfishing industry as a whole.
In 2000, there were 854 licenses for salmon and troutproduction in Norway, of which some 30% were for
Chapter 13 • Fisheries and Aquaculture 703
sites located in the three northern counties (Fiskeri-direktoratet, 2001).The number of plants and sites innorthern Norway is expected to increase considerablyin the future (Hartvigsen et al., 2003). In addition tosalmon, this development will also involve other fishspecies such as Atlantic halibut (Hippoglossus hippoglossus)and cod. Over time, aquaculture is expected to becomemore important to the north Norwegian economy thanthe combined marine fisheries.
An important aspect of the aquaculture industry is that itis dependent on a huge supply of pelagic fish species.Fishmeal and oils are important components of the dietof many species of farmed fish, including salmon andtrout.The quantity needed is so high that the industry ata global level is sensitive to rapid fluctuations in impor-tant pelagic stocks. El Niño–Southern Oscillation(ENSO) events in the Pacific have already affected theindustry through impacts on anchovy (Engraulis spp.)stocks. From 1997 to 1998, the global marine fisherywas reduced by nearly 8 million t, mainly due to ENSOevents (FAO, 2000). Reduced supply on the internation-al market led to increased prices of fishmeal in this peri-od.The latest assessment by the Intergovernmental Panelon Climate Change (IPCC, 2001) states that unless alter-native sources of protein are found, aquaculture could inthe future be limited by the supply of fishmeal and oils.
Aquaculture is in its infancy in northwest Russia and thetotal production is negligible. It is however likely toincrease in the future.
13.2.5.5. Employment in the fisheries sectorand the fisheries communities
There are approximately 17000 fishers in Norway, ofwhich almost half live in the three northern counties.In northern Norway it is common to combine fishingwith other trades to make a living, particularly inremote areas. Part-time fishers make up about a thirdof the total number of people in the profession.The number of fishers has been sharply reduced overrecent decades.This reflects broader societal changeswith a shift in the workforce from primary to second-ary and tertiary occupations, as well as technologicaldevelopment in the industry. A total of 12420 personsworked in fish processing in Norway in 2000 (Ministryof Fisheries, 2002). About half of these worked in thenorthernmost counties.
In 2001, around 3600 people worked in aquaculturein Norway (Ministry of Fisheries, 2002). Of theseabout a third worked in the three northernmost coun-ties.The combined direct employment in the fisheriessector in northern Norway is 16000 to 17000 people.The fisheries also generate substantial employment inrelated activities, such as shipbuilding, ship repairs, andgear production, as well as sales and exports.The num-ber of people employed in the related industries hasincreased substantially over recent decades.Theemployment generated in related industries by the fish-
eries sector is 0.75 man-years per year in the fisheries(KPMG and SINTEF, 2003), amounting to some12000 people in northern Norway.The total employ-ment generated is therefore close to 30000 people.With a total population in northern Norway of460000, this implies that the fisheries are crucial toemployment and income in the region.
Corresponding data on employment in the fisheries sec-tor for northwest Russia were not available.
According to Lindkvist (2000) there are 96 communitiesin Norway that can be characterized as fishing communi-ties. Of these, 42 occur in the three northern counties.Of these, 31 may be defined as fisheries-dependent inthe sense that more than 5% of the working populationis employed in fisheries and fish processing (Lindkvist,2000).These communities are typically small and locat-ed in remote areas. Most face depopulation and prob-lems such as lack of qualified personnel to maintain pub-lic services, but at the same time have few alternativetrades to fishing. In Finnmark county, about 10% of thetotal employment is in the fisheries sector (Hartvigsen etal., 2003). Remote, fisheries-dependent communities innorthern Norway have the highest depopulation rates inthe country. Since the 1980s, none of its municipalitieshave increased in population. On average the coastalmunicipalities have experienced a population reductionof around 30% (Hartvigsen et al., 2003).
Demographic pressure towards urbanization, which isexpected to continue (IPCC, 2001), may be said to beone of the major driving forces behind this develop-ment. Other factors, such as lack of employment oppor-tunities and inferior public services, may be seen both asa cause of the problem as well as a consequence.There isalso the trend of fishing boats being sold out of the com-munities.These trends indicate that the small fishery-dependent societies are under continuous pressure.These societies are subject to a “double exposure”(O’Brien and Leichenko, 2000), where climate changeoccurs simultaneously with economic marginalization.The Norwegian government has for a long period runprograms aimed at strengthening the viability of fishery-dependent societies in the north. In recent years theseefforts have been directed towards market orientation,flexibility, and a more robust industrial structure, ratherthan towards subsidies to the industry. Some regionaldevelopment programs are aimed at diversification ofthe economic activity in remote areas by supporting,among other things, female-run enterprises(Lotherington and Ellingsen, 2002).
Among the Russian Federation subjects in the north-west, the Murmansk Oblast is most important from thepoint of view of fisheries.This region is one of the mosturbanized in Russia, with around 92% of the populationliving in cities and towns. Most of the northwest Russianfishing fleet is concentrated in the city of Murmansk.Some companies are located in the three other RussianFederation subjects: Arkhangelsk (Arkhangelsk Oblast),
704 Arctic Climate Impact Assessment
Petrozavodsk (Republic of Karelia), and Narjan-Mar(Nenets Autonomous Okrug).
The fishing industry is important for several majorcities in northwestern Russia, but these cannot be char-acterized as “fishing communities” in the sense that thisconcept is understood in the West.Their viability is notdependent on fisheries. Also, the significance of thefishing industry has been severely reduced in the post-Soviet period as the catches of Russian vessels are main-ly delivered to the West.The redirection of landings tothe home market has been one of the main ambitions ofRussian fishery authorities at both the federal andregional level since the early 1990s.That this has notbeen achieved points to the relative impotency of thesebodies. At the federal level, the State Committee forFisheries has twice lost its status as an independentbody of governance (subsumed into the Ministry ofAgriculture in 1992–1993 and 1997–1998) and seen itstraditional all-embracing influence over fisheries man-agement significantly reduced. In 2000, the Ministry ofTrade and Economic Development succeeded in intro-ducing a system for quota auctions, against the will ofthe State Committee for Fisheries. Regional authoritiesincreased their influence during the 1990s.This devel-opment has now been reversed owing to the re-centralization that began around 2000, commensuratewith wider developments in Russia since PresidentPutin came to power. Hence, while regional authoritiesin northwestern Russia have a declared aim of develop-ing coastal fisheries, actual development in this spherecan only be considered minimal.
13.2.5.6. Markets
All data in this section are from the Norwegian SeafoodExport Council (http://www.seafood.no).
Norway is one of the worlds biggest fish exporters –more than 90% of the landings are exported (in 2001Norway was the world’s second largest fish exporter,after Thailand).There are two aspects to this. First, theincome generated by fish exports is substantial – aroundUS$ 4 billion in 2001. As the production in aquaculturewill increase, and the production of petroleum willdecrease, exports of fish products can be expected tobecome more important in the future.The Ministry ofFisheries envisages that aquaculture will become amainstay of the Norwegian economy in the years tocome, and that the sales value in northern Norway willbe nearly five times higher in 2020 than today. Second,Norway is a major supplier to many markets.TheNorwegian imports are important to, for example, theEU market for seafood, which is therefore vulnerable tofluctuations in Norwegian fisheries.
The single most important species in terms of exportvalue is salmon, which had an export value of US$ 1.8billion in 2000.The second most important category iswhitefish, the exports of which (consisting mainly ofcod, haddock, and saithe) are worth in the range of
US$ 1.2 billion annually. Pelagic species, of whichherring is the most important, had an export value ofUS$ 920 million in 2001.The fourth most importantspecies in terms of export value is northern shrimp.
Landings of Russian-caught cod in Norway haveincreased since 1990. During 1995 to 1997, landingswere around 250 000 to 300 000 t per year. Sincethen, there has been a reduction in Russian landings ofcod as well as other fish in Norway. Trans-shipments offish at sea and landings in other countries are increas-ing while landings in Norway are decreasing. Catcheslanded in Russia mostly go to the Russian consumermarket. Imports of fish to Russia from Norway arerapidly increasing.
13.2.5.7.The management regime
In addition to the EEZ, Norway also manages theresources in the Fishery Zone around Jan Mayen and inthe Fishery Protection Zone around Svalbard.TheNorwegian EEZ borders the EU zone to the south, theFaroe Islands to the southwest, and Russia to the east.A large area beyond the EEZ boundary in the Norwe-gian Sea and a smaller area in the Barents Sea are inter-national waters. Most of the economically importantstocks move between the zones of two or more states.
Cooperation between the owner countries in themanagement of these stocks is essential to ensure theirsustainable use. A series of agreements has been negoti-ated among the countries in the Northeast Atlantic thatestablish bilateral and multilateral arrangements forcooperation on fisheries management.The most exten-sive management regime on arctic stocks in theNortheast Atlantic is that between Norway and Russia.A joint fisheries commission meets annually to agree onTACs and the allocation for the major fisheries in theBarents Sea: i.e., those for cod, haddock, and capelin(since 2001 a total quota has also been set for the kingcrab fishery).The total quotas set are shared between thetwo countries – the allocation key is 50-50 for cod andhaddock, and 60-40 for capelin. A fixed additional quan-tity is traded to third countries.There are also agree-ments on mutual access to the EEZs and exchange ofquotas through this arrangement (Hoel, 1994). Animportant aspect of the cooperation with Russia is that asubstantial part of the Russian harvest in the Barents Seais taken in the Norwegian zone and landed in Norway.The cooperation also entails joint efforts in fisheriesresearch and in enforcement of fisheries regulations.
Despite disagreement between Norway and Russia onthe delimitation of the boundary between their EEZ andthe shelf in the Barents Sea, the cooperation on resourcemanagement between the two countries may generallybe characterized as well functioning (Hønneland, 1993).However, agreed TACs by Norway and Russia have, insome years, exceeded those recommended by fisheriesscientists. In addition, the actual catches have sometimesbeen larger than those agreed. Since the late 1990s, a
Chapter 13 • Fisheries and Aquaculture 705
precautionary approach has been gradually implementedin the management of the most important fisheries.However, retrospective analyses have shown that ICESestimates of stock sizes have often been too high, there-by incorrectly estimating the effect of a proposed regula-tory measure on the stock.This has had the unfortunateeffect that stock sizes for a given year are adjusteddownward in subsequent assessments, rendering adoptedmanagement strategies ineffective (Korsbrekke et al.,2001; Nakken, 1998). However, the Joint Norwegian–Russian Fisheries Commission has decided that from2004 onward multi-annual quotas based on a precau-tionary approach will be applied. A new managementstrategy adopted in 2003 shall ensure that TACs for anythree-year period shall be in line with the precautionaryreference values provided by ICES.
A number of other agreements are also in effect in thearea, notably a five-party agreement among the coastalstates in the Northeast Atlantic to manage Atlanto-Scandian herring (Ramstad, 2001).Total quotas for thefollowing year’s herring fishery are set, and dividedamong the parties. A separate quota is set for the areaon the high-seas in the Norwegian Sea.The high seasquota, most of which is given to the same coastalstates, is formally managed by the NEAFC, which ismandated to manage the fishing on the high seas in theNortheast Atlantic. Norway also has an extensive coop-eration with the EU on the management of sharedstocks in the North Sea, as well as on the exchange offish quotas, which entails access for EU vessels tonorth Norwegian waters.The EU is given a majorshare of the third country quota of cod in the Norwe-gian waters north of 62º N.
Management measures for marine mammals harvested inthe area are decided by the IWC, NAMMCO, and theJoint Norwegian–Russian Fisheries Commission.TheIWC has not been able to adopt a Revised ManagementScheme and so does not set quotas. Since 1993, Norwayhas set unilateral quotas for the take of minke whales, onthe basis of the work of the IWC Scientific Committee(Hoel, 1998). NAMMCO adopts management measuresfor cetaceans and seals in the northern NortheastAtlantic (Hoel, 1993).
A precondition for sound management of living mar-ine resources is that sufficient knowledge about theresources is available. In Norway, the Institute ofMarine Research is the main governmental researchinstitution, while the Northern Institute of MarineResearch (PINRO) plays the same role on the Russianside. ICES is the international institution for formulat-ing scientific advice to the fisheries authorities in theNorth Atlantic countries. Its work is generally based oninputs from the research institutions in the membercountries.The ICES advice is now based on a precau-tionary approach, which seeks to introduce a greatersensitivity to risk and uncertainty into management.Three of the challenges for fisheries management in thefuture are: a better understanding of species interac-
tions (multi-species management), more reliable datafrom scientific surveys, and a better understanding ofthe impact of physical factors – such as changing cli-matic conditions – on stocks. A major challenge is thedevelopment and implementation of an ecosystem-based approach to the management of living marineresources, where the effects of climate change are alsoconsidered when establishing management measures.
The management measures essentially fall into threecategories:
• input regulations in the form of licensing schemesrestricting access to a fishery;
• output regulations, consisting of the fish quotasgiven to various groups of fishers which limit theamount of fish they are entitled to in any givenseason; and
• technical measures specifying for example the typeof fishing gear to be used in a particular fishery.
The objectives of fisheries management in Norway arerelated to conservation, efficiency, and regional consid-erations (Report to Parliament, 1998). Conservation ofresources is seen as a precondition for the developmentof an efficient industry and maintenance of viable fishingcommunities. An important objective of the fisheriespolicy is to improve the economic efficiency of theindustry. An important issue is therefore to reduce thecapacity of the fishing fleet, which is much larger thanneeded to take the quotas available and therefore makesthe costs of fishing too high. Attempts to remove excesscapacity include scrapping of vessels, regulatory mecha-nisms, and vessel construction regulations. A quotaarrangement allowing for merging two vessels’ quotaswhile removing one of the vessels from the fishery givesvessel owners an incentive to remove excess fishingcapacity, and can contribute to a more efficient fleet.However, this can result in coastal communities seeingtheir local fleet reduced or even disappearing, threaten-ing the viability of that community.
The enforcement of the fisheries regulations in Norwayis carried out both at sea and when the fish is landed.At sea, the Coast Guard is responsible for inspectingfishing vessels and checking their catch against vessellogbooks. Foreign vessels fishing in Norwegian watersare also inspected.The activity of the Coast Guard isvital for the functioning of the management regime as awhole. Ocean-going vessels are required to install anduse a satellite-based vessel-monitoring system enablingthe authorities to continually monitor their activities.The Directorate of Fisheries also inspects activities onthe fishing grounds, as well as at the landing sites.When fish is landed, the sales organization buying thefish reports the landed quantity to the FisheriesDirectorate, which is responsible for maintaining thefisheries statistics.
The regulation of Soviet fisheries in the NortheastAtlantic used to be the responsibility of the Sevryba
706 Arctic Climate Impact Assessment
association. As this organization lost its status in fish-eries regulation in the mid-1990s, the regulatory taskswere partly taken over by the enforcement bodyMurmanrybvod, partly by the fisheries departments ofregional authorities in each federal subject in the area,and since 2000 to an increasing extent the regulatorytasks have been the remit of federal authorities. Duringthe 1990s, the Russian share of the Barents Sea quotaswas first divided among the four federal subjects of theregion by the so-called Scientific Catch Council (for-merly headed by Sevryba, since 2001 by the federalState Committee for Fisheries).Within each federalsubject, a Fisheries Council (led by regional authorities)distributed quota shares among individual ship owners.The influence of both the Scientific Catch Council andthe regional Fisheries Councils was reduced after theintroduction of quota auctions in 2000/2001. Sincethen, an increasing share of the quotas has been sold atauctions, administered by the federal Ministry of Tradeand Economic Development. In November 2003, theRussian Government decided to abolish the auctionsand instead introduce a resource rent (a fee on quotashares).The quotas will from 2004 be distributed by aninter-ministerial commission at the federal level, so theregional authorities will also lose the influence of inter-regional quota allocation (Hønneland, 2004).
Apart from quotas, the Russians have fishery regulationssimilar to those in the Norwegian system: regulationspertaining to fishing gear, size of the fish, and composi-tion of individual catches. In addition, the Russians havea more fine-meshed system than the Norwegians forclosing and opening of fishing grounds. Individualinspectors from the enforcement body Murmanrybvodor researchers from the scientific institute PINRO canclose a “rectangle” (a square nautical mile) on site for aperiod of three days. After three days, the “rectangle” isreopened if scientists make no objections, i.e., if theproportion of undersized fish in catches does not con-tinue to exceed legal limits.
Traditionally, the civilian fishery inspection serviceMurmanrybvod, subordinate to the Russian StateCommittee for Fisheries, has been responsible forenforcing Russian fishery regulations in the Barents Sea.In 1998, responsibility for fisheries enforcement at seain the Russian Federation was transferred to the FederalBorder Service. In the northern fishery basin, theMurmansk State Inspection of the Arctic RegionalCommand of the Federal Border Service was estab-lished to take care of fisheries enforcement. However,this body is only responsible for physical inspections atsea, while inspection of landed catches has been trans-ferred to the Border Guard. Murmanrybvod is still incharge of keeping track of how much of the quotas hasbeen caught by individual ship owners at any one time.It has also retained its responsibility for the closing offishing grounds in areas with excessive intermingling ofundersized fish, a very important regulatory measure inboth the Russian and Norwegian part of the BarentsSea. Finally, Murmanrybvod is still responsible for
enforcement in international convention areas. In prac-tice, Murmanrybvod places its inspectors on boardnorthwest Russian fishing vessels that fish in theNEAFC or NAFO areas.
The reorganization of the Russian enforcement system isgenerally believed to have led to a reduction in the sys-tem’s effectiveness, at least from a short-term perspec-tive. For example, officers in the Murmansk StateInspection of the Federal Border Service generally lackexperience in fisheries management and enforcement.This has partly been compensated for by the transfer ofsome of Murmanrybvod’s inspectors. More apparent isthe lack of material resources to maintain a presence atsea. Contrary to the intentions of the reorganization ofthe enforcement system, the presence at sea by monitor-ing vessels has declined since the Border Guard tookover this duty in 1998. Precise data for presence at seaand inspection frequency are not available, but Jørgensen(1999) estimated that the Border Guard performedaround 160 inspections at sea in 1998, which representsa significant reduction compared to an estimated 700 to1000 annual inspections at sea by Murmanrybvod priorto the reorganization. For periods of several months dur-ing 1998, not a single enforcement vessel was present onthe fishing grounds in the Russian part of the BarentsSea. Officials of the Border Service explain this by a lackof funds to purchase fuel. Critics question the genuine-ness of the Border Service’s will to play a role in fish-eries management.The result of the reorganization has,in any event, so far led to a tangible reduction in theeffectiveness of Russian enforcement in the Barents Sea.
13.2.6. Economic and social impacts ofclimate change on fisheries in theNortheast Atlantic
The economic importance of fisheries to northernNorway is substantial, cod being the most significantspecies. Problems related to profitability in the fishingindustry have been evident for a long time, and havecontributed to depopulation problems in remote, fishery-dependent areas. Aquaculture is, however, a growingindustry and is expected to be important to the futureviability of local communities in northern Norway.In northwest Russia, the fishing industry is based inbig cities, Murmansk in particular, and is therefore notas significant to local communities as it is in Norway.
A study by Furevik et al. (2002) developing regionalocean surface temperature scenarios for the NortheastAtlantic concluded that for the 2020 scenario, no sub-stantial change is likely in the physical parameters.The authors concluded that a slight cooling in oceansurface temperature is likely by 2020 with warminglikely in the longer-term scenarios. For the near-termfuture, climate change is therefore not likely to have amajor impact on the fisheries in the region. Uncertain-ties surrounding these scenarios are however consider-able.These are amplified when the physical effects onbiota are included, and amplified again when the effects
Chapter 13 • Fisheries and Aquaculture 707
of climate change on society are added. In addition,social change is driven by a vast number of factors, ofwhich climate change is only one.The rest of this sec-tion is therefore tentative and should be read more asdiscussions of likely patterns of change than predictionsof future developments.
The effects of climate change are closely related to thevulnerability of industries and communities, and to theircapability to adapt to change and mitigate the effects ofchange.Within this context vulnerability is defined as“the extent to which a natural or social system is suscep-tible to sustaining damage from climate change” (IPCC,2001). It depends on the ability and capacity of societyat the international, national, and regional level to copewith change and to remedy its negative effects. Climatechange may also result in positive changes.
The fisheries sector is one in which the industry hasalways had to adapt to and cope with environmentalchange: the abundance of various species of fish andmarine mammals has varied throughout history, oftendramatically and also within short periods of time.Adapting to changing circumstances is therefore secondnature to the fishing industry as well as to the communi-ties that depend upon it. An important issue is thuswhether climate change brings about changes at scalesand rates that are unknown, and whether adaptation canbe achieved within the existing institutional structures.
13.2.6.1. Resource management
Resource management is the key factor in deciding thebiological and economic sustainability of the fisheries.The fishing opportunities are decided by the manage-ment regime.There are virtually no remaining fisherieswhere the economic result is decided by the industryitself.The design and operation of both the domestic andinternational management regimes are crucial to the sus-tainability and economic efficiency of the fisheries, andhence to the economic viability of the communities thatdepend upon them.The development and implementa-tion of a precautionary approach, as well as the emer-gence of ecosystem-based management, may enhancethe resilience of the stocks and therefore make theindustry and communities more robust to future exter-nal shocks. As discussed in section 13.2.5.7, the mainarrangements for managing living marine resources inthe Northeast Atlantic are being modified in this direc-tion, with the implementation of a precautionaryapproach and the development of an ecosystem-basedapproach to management.
A major challenge for the management regime is thatof adjusting to the possible changes in migration pat-terns of stocks resulting from climate change.Thisfinding is in conformity with that of the IPCC (2001)and Everett et al. (1996). Changes in migration pat-terns of fish stocks have previously upset establishedarrangements for resource management, and can trig-ger conflicts between countries. One example is that of
northeast Atlantic cod: in the early 1990s, the stockextended its range northward in the Barents Sea, intothe high seas in the area (the so-called “loophole”).Vessels from a number of countries without fishingrights in the cod fishery took the opportunity to initi-ate an unregulated fishery in the area, thereby under-mining the Norwegian–Russian management regime.This triggered a conflict between Norway and Russia onthe one hand, and Iceland on the other.The conflict waslater resolved through a trilateral agreement (Stokke,2001). Another example is that of the Norwegianspring-spawning herring (Box 13.1): following morethan two decades of effort at rebuilding the stock onthe part of Norwegian authorities, in the mid-1990s thestock began to migrate from the Norwegian EEZ andinto international waters for parts of the year. By doingso the stock became accessible to vessels from othercountries, and in the absence of an effective manage-ment regime for the stock in the high seas, efforts atrebuilding the stock could prove futile. A regime secur-ing a management scheme for the stock eventually cameinto place, but took several years to negotiate (Box13.1).Thus, changes in migration patterns, which arelikely to be triggered by changes in water temperatures,tend to result in unregulated fishing and conflictsamong countries.The outcome of such conflicts may beconflicting management strategies, new distributionformulas, or even new management regimes.
Another important factor is that negative events tend tobe a liability to the management regime.The so-called“cod crisis” in the late 1980s, for example, led to severalmodifications of the existing regime.The managementregime is likely to be held responsible for social and eco-nomic consequences of climate change.This may in turnaffect the legitimacy and authority of the regime, and itseffectiveness in regulating the industry. An importantaspect in that regard is the way decisions about resourcemanagement and allocation of resources are made.A regime that involves those interests that are affectedby decisions in the decision-making processes tends toproduce regulations that are considered more legitimatethan regimes that do not involve stakeholders (Mikalsenand Jentoft, 2003).
Current fisheries management models are mainly basedon general assumptions of constant environmental fac-tors.The current methods applied in fisheries manage-ment can not accommodate environmental changes.A study by Eide and Heen (2002) investigated the eco-nomic output from the fisheries under different environ-mental scenarios and under different managementregimes for the cod and capelin fisheries in the BarentsSea. Using the ECONMULT fleet model (Eide andFlaaten, 1998) and a regional impact model for thenorth Norwegian economy (Heen and Aanesen, 1993),they concluded that even a narrow range of managementregimes has a variety of possible economic outcomes.Even though climate change may result in significantpotential effects on catches, profitability, employment,and income, changes in the management regimes seem
708 Arctic Climate Impact Assessment
to have an even larger impact.This conclusion sets thediscussion of effects of global climate change in perspec-tive. It implies that a large number of factors influencethe economic activities and their output and, further-more, that the operation of the management regimeseems to be the most significant of these factors.
The crucial factor for resource management under con-ditions of climate change is therefore the developmentof robust and precautionary approaches and institutionsfor managing the resources.The decisive factor for thehealth of fish stocks, and therefore the fate of the fishingindustry and its dependent communities, appears to bethe resource management regime.
13.2.6.2.The fishing fleet
The ability to adapt to changes in migration patterns orstock size of commercially exploited species will varybetween different vessel groups in the fishing fleet.The ocean-going fleet is capable of adjusting to changesin migration patterns, as it has a wide operating range.Small coastal vessels are more limited in that regard.Thus, northern communities with a strong dependencyon small coastal vessels are likely to be more affected ifmigration patterns and availability of important fishstocks change significantly. If fish stocks move closer tothe coast it is an advantage to the coastal fleet, while itis a disadvantage for this fleet if the stocks move moreseaward. Such a development may be confounded bychanging weather patterns with severe weather eventsbecoming more prevalent. All vessel groups will beaffected if changes lead to stocks crossing jurisdictionalborders.That may imply a change in distribution ofresources among countries.
Increased production and larger stocks of cod and her-ring are possible outcomes of climate change in theNortheast Atlantic. A question arises as to which fleetgroups are most capable of making the best of such posi-tive changes in the resource. Such changes may result indifferent availability of the resources between groups offisheries (e.g., coastal versus ocean-going vessels), affect-ing the domestic allocation of resources. It may also leadto a greater political pressure to change the allocation ofresources between the main groups of resource users.
Changes in stock abundance and migration patterns arenot new to the industry.The availability of fish stocksand their accessibility to the coastal fleet has changedthroughout recorded history, and the industry as well asthe management regime is used to adapting to changingcircumstances.The key question is whether climatechange would amplify such variations and aggravate theireffects beyond the scale with which the industry and theregulating authorities are familiar.
Changes in oceanic conditions may also affect themigrating ranges of marine mammals, and hence marinemammal–fisheries interactions. Such interactions couldinclude marine mammals preying on fish, thus increasing
competition with fishers, or marine mammals interact-ing directly with the fishery, for example by interferingwith fishing gear. Marine mammals are also vectors ofparasites that may affect fish and fisheries.
13.2.6.3. Aquaculture
Higher water temperature generally has positive effectson aquaculture in terms of fish growth.The IPCCreported that warming and consequent lengthening ofthe growing season could have beneficial effects withrespect to growth rates and feed conversion efficiency(IPCC, 2001).Warmer waters may also have negativeeffects on aquaculture since the presence of lice and dis-eases may be related to water temperature. In recentyears high water temperatures in late summer havecaused high mortality at farms rearing halibut and cod,the production of which is still at a pre-commercialstage. Salmon is also affected by high temperatures andfarms may expect higher mortalities of salmon. A rise insea temperatures may therefore favor a northwardmovement of production, to sites where the peak watertemperatures are unlikely to be above levels at whichfish become negatively affected.
An increase in severe weather events can be a cause ofescapes from fish pens and consequent loss of produc-tion. Escapes are also a potential problem in terms ofthe spread of disease. However, technological develop-ments may compensate for this.
The aquaculture industry is dependent on capture fishfor salmon feed. Climate change may cause a lack ofand/or variability in the market for such products, butthis is also an area where research may lead to the devel-opment of other feed sources.
The fish processing industry in the north faces challengesin the structural changes both in the first-hand market(from fisher to buyer) and in the export market.Increased international competition for scarce resourceshas left the processing side of the industry increasinglyvulnerable to globalization pressures. At the same timemany of the communities, depending on fisheries fortheir existence, experience economic marginalization-and depopulation-related problems.The vulnerabilityof the fishing industry and fishing communities cantherefore be considered as relatively high at the outset,rendering them particularly susceptible to any negativeinfluences resulting from climate change. Such impactsmay however be minor compared to that of other driv-ers of change. Furthermore, the fish processing industryis very varied.The size of fish processing plants is oneaspect of this, their versatility and ability to vary produc-tion and adapt to changing circumstances is another.The ability of the particular type of industry to adapt tovarious earlier “crises”, whether in terms of demand orsupply failures, could be an indicator of their future
Chapter 13 • Fisheries and Aquaculture 709
“coping-capacity” for effects resulting from climatechange. Another issue is that climate-induced changeselsewhere in the world may affect the situation for thenorth Norwegian fishing industry and fishing communi-ties. Experience from, for example, the fisheries crisis inCanada in the 1990s indicates that such situations tendto intensify competition for further processing of theraw material.To the industry in Norway, with high laborcosts, such a scenario is negative.
13.2.7. Ability to cope with change
Many factors contribute to a community’s “coping capac-ity” in relation to depopulation and to structural changesin the fisheries sector (Baerenholdt and Aarsaether,2001).The future of these settlements may depend ontheir ability to adapt to increased competition, efficien-cy, deregulation, and liberalization of the markets, asmuch as on the accessibility of fishing resources for theirlocal production systems (Lindkvist, 2000).
While the management regime can be seen as aninstrument to ease negative effects of climate change, itis however also important to consider public measuresbeyond the fisheries management regime that affect theconditions of the fishing industry more broadly, as forexample regional policies and the development ofalternative means of employment. Measures for build-ing infrastructure such as roads or to develop harborfacilities are but one example. Government support forfisheries in the form of direct subsidies is now effec-tively prohibited by international agreements. But inNorway in particular there is a strong tradition for sup-porting regional development in a broader sense, andprograms to this end may enhance the resilience ofnorthern communities.
In addition to adapting to possible changes in theresource resulting from climate change, the fishingcommunities will also need to adapt to possible otherclimate-related changes in their vicinity (e.g., weatherevents) and their effects on terrestrial biota and infra-structure.These may have indirect effects on the fisherysector, related economic activities, or on other aspects oflife, valued by the people in the respective communities.
13.2.8. Concluding comments
The Northeast Atlantic area comprises the northern andeastern parts of the Norwegian Sea to the south, and thenorth Norwegian coast and the Barents Sea to the eastand north.The total fisheries in the area amounted to2.1 million t in 2001. Aquaculture production is domi-nated by salmon and trout and amounted to 86000 t in2001. Norway and Russia have long traditions for co-operating both in trade and management issues. Since1975, a comprehensive framework for managing theliving marine resources in the area has been developed,covering also the areas on the high seas.While theNorwegian fishing industry is located in numerous com-munities all along the northern coast, the northwest
Russian fishing fleet is concentrated in large cities, pri-marily Murmansk.
Owing to the influence of the North Atlantic Current,the climate in this region is several degrees warmer thanthe average in other areas at the same latitude. Historical-ly, a number of climate-related events have been observedin the Northeast Atlantic fisheries. Since the SecondWorld War both cod and herring, the two major fishstocks in the area, have been subject to overfishing.Thishas resulted in a far lower average annual yield than thesestocks have the potential to produce.Therefore, the man-agement of stocks is the key issue in assessing the effectsof potential climate variations on fish stocks.
Provided that the fluctuations in Atlantic water inflows tothe area are maintained along with a general warming ofthe North Atlantic waters, it is likely that the annualaverage recruitment in herring and cod will be at aboutthe long-term average during the first two to threedecades of the 21st century.This projection is based onthe assumption that harvest rates are kept at levels thatmaintain spawning stocks well above the level at whichrecruitment is impaired. How production will changefurther in the future is impossible to guess, since the pro-jected temperatures, particularly for some global models,are so high that species composition and thus the interac-tions in the ecosystem may change completely.
Resource management is the key factor in deciding thebiological and economic sustainability of the fisheries.The design and operation of both the domestic andinternational management regimes are therefore crucialin determining sustainability and economic efficiency.The development and implementation of a precautionaryapproach, as well as the emergence of ecosystem-basedmanagement, may enhance the resilience of the stocksand thus lessen the vulnerability of the industry to futureexternal shocks. A large number of factors influenceeconomic activities and their output, and an effectiverational management regime seems to be the most sig-nificant of these.The crucial factor for resource manage-ment under conditions of climate change is therefore thedevelopment of robust and precautionary approachesand institutions for resource management.
13.3. Central North Atlantic – Icelandand GreenlandThis section deals with the marine ecosystems of Icelandand Greenland. Although there are large differences,both physical and biological, between these two ecosys-tems there are also many similarities. Seafood exportsrepresent a major source of revenue for both countries.Figure 13.5 shows the locations of the sites referred tomost frequently in the text.
The waters around Iceland are warmer than thosearound Greenland due to a greater Atlantic influenceand are generally ice free under normal circumstances.Exceptions are infrequent and usually last for relatively
710 Arctic Climate Impact Assessment
short periods in late winter and spring when drift icemay come close inshore and or even become landlockedoff the north and east coasts. However, drift ice has beenknown to surround Iceland during cold periods, such asduring the winter of 1918. Greenlandic waters are cold-er, sea-ice conditions more severe, and ports on thecoastline commonly close for long periods due to thepresence of winter sea ice and icebergs.
The reason for treating these apparently dissimilarecosystems together is the link between the stocks ofAtlantic cod at Iceland and Greenland.There is a docu-mented drift of larval and 0-group cod (in its first yearof life) from Iceland to Greenland with the westernbranch of the warm Irminger Current (Jensen, 1926).Spawning migrations in the reverse direction have beenconfirmed by tagging experiments (e.g., Hansen et al.,1935; Jónsson, 1996;Tåning, 1934, 1937).There are,however, large variations in the numbers of cod andother fish species, which drift from Iceland to Greenlandand not all these fish return to Iceland as adults.
The history of fishing the waters around Iceland andGreenland dates back hundreds of years but is mainlycentered on Atlantic cod, the preferred species innorthern waters in olden times. Icelandic waters areusually of a cold/temperate nature and are thereforerelatively species-rich. Consequently, with the diversi-fication of fishing gear and vessel types in the late 19thcentury and the beginning of the 20th century, numer-ous other fish species, both demersal and pelagic,began to appear in catches from Icelandic waters.The Greenlandic marine environment is much colderand commercially exploitable species are thereforefewer. Present-day catches only comprise nine demer-sal fish species, two pelagic fish species, and three
species of invertebrates.There is currently almost nocatch of cod at Greenland.
Whale products feature in Icelandic export recordsfrom 1948 until the whaling ban (zero quotas) wasimplemented in 1986, but their value was never a signif-icant component of exported seafood. Iceland has a longhistory of hunting porpoises, seals, and seabirds, andgathering seabird eggs for domestic use. Although thishunting and gathering gradually decreased with time, itis still a traditional activity in some coastal communities.For Greenland, several species of marine mammals(at least five different whale species, five species of seals,plus walrus) and six species of seabird are listed in catchstatistics. Catches of marine mammals and seabirds arestill important in Greenland, culturally and socially, aswell as in terms of the local economy.
13.3.1. Ecosystem essentials
The marine ecosystem around Iceland is located southof the Polar Front in the northern North Atlantic(Fig. 13.5).The area to the south and west of Iceland isdominated by the warm and saline Atlantic water of theNorth Atlantic Current, the most important componentbeing its westernmost branch, the Irminger Current(Fig. 13.5).The Irminger Current bifurcates off thenorthern west coast of Iceland.The larger branch flowswest across the northern Irminger Sea towardsGreenland.The smaller branch is advected eastwardonto the North Icelandic shelf where the Atlantic watermixes with the colder waters of the East IcelandicCurrent, an offshoot from the cold East GreenlandCurrent. On the shelf north and east of Iceland the
Fig. 13.6. The main water masses in the Iceland–EastGreenland–Jan Mayen areas.The larval drift is driven by thetwo branches of the Irminger Current, which splits to thewest of northwest Iceland (based on Stefánsson, 1999;Vilhjálmsson, 1994, 2002).
Fig. 13.5. Location map for the Iceland/Greenland area.The arrows show the main surface ocean currents (based onBlindheim, 2004; Stefánsson, 1999).
Polar FrontCold polar waterMixed cold water
Warm water of the Irminger Currentand the North Atlantic DriftMixed cool water
Chapter 13 • Fisheries and Aquaculture 711
degree of mixing increases in the direction of flow andthe influence of Atlantic water is therefore lowest onthe east Icelandic shelf as shown in Fig. 13.6. Hydro-biological conditions are relatively stable within thedomain of the Atlantic water to the south and west ofIceland, while there may be large seasonal as well asinterannual variations in the hydrography and levels ofbiological production in the mixed waters on the northand east Icelandic shelf (Anon, 2004b; Astthorsson andGislason, 1995), depending on the intensity of the flowof Atlantic water and the proximity of the Polar Front.Large variations in the flow of Atlantic water onto theshelf area north of Iceland on longer timescales havealso been demonstrated (Malmberg, 1988; Malmbergand Kristmannsson, 1992; Malmberg et al., 1999;Vilhjálmsson, 1997).
The East Greenland Current carries polar water southover the continental shelf off the east coast of Green-land and after rounding Cape Farewell (about 60º N;43º W) continues north along the west coast. Off theeast coast, the temperature of these cold polar watersmay be ameliorated by the warmer Atlantic waters ofthe Irminger Current, especially near the shelf breakand on the outer parts of the shelf (see Fig. 13.5). OffWest Greenland, the surface layer is dominated by coldpolar water, while relatively warm mixed water ofAtlantic origin is found at depths between 150 and800 m, north to about 64º N. Mixing and diffusion ofheat between these two layers, as well as changes in therelative strength of their flow, are fundamental indetermining the marine climatic conditions and thelevels of primary and secondary production off WestGreenland (e.g., Buch, 1993; Buch and Hansen, 1988;Buch et al., 1994, 2002).
The Irminger Current is also important as a transportmechanism for juvenile stages of various species of fish(Fig. 13.6).Thus, its eastern branch plays a dominant
role in transporting fish fry and larvae from the southernspawning grounds to nursing areas on the shelf offnorthwest, north, and east Iceland, while the westernbranch may carry large numbers of larval and 0-groupfish across the northern Irminger Sea to East Greenlandand from there to nursery areas in southern WestGreenland waters.The main ocean currents in theIceland/Greenland area are shown in Fig. 13.5.
The Icelandic marine ecosystem contains large stocksof zooplankton such as calanoid copepods and krill,which are eaten by adult herring and capelin, adoles-cents of numerous other fish species, as well as bybaleen whales.The larvae and juveniles of both pelagicand demersal fish also feed on eggs and juvenile stagesof the zooplankton. Benthic animals are also importantin the diet of many fish species, especially haddock,wolffish (Anarhichas lupus lupus), various species of flat-fish, and cod.
Owing to the influence of warm Atlantic water, thefauna of Icelandic waters is relatively species-rich andcontains over 25 commercially exploited stocks of fishand marine invertebrates. In contrast, there are only afew commercial fish and invertebrate species inGreenlandic waters (Muus et al., 1990) and these arecharacterized by cold water species such as Greenlandhalibut, northern shrimp, capelin, and snow crab.Redfish are also found, but mainly in Atlantic watersoutside the cold waters of the East Greenland continen-tal shelf and cod can be plentiful at West Greenland inwarm periods.
Around Iceland, most fish species spawn in the warmAtlantic water off the south and southwest coasts. Larvaeand 0-group fish drift westward and then northwardfrom the spawning grounds to nursery areas on the shelfoff northwest, north, and east Iceland, where they growin a mixture of Atlantic and Arctic water (e.g., Schmidt,1909). Larval and 0-group cod and capelin, as well asspecies such as haddock, wolffish, tusk (Brosme brosme),and ling (Molva molva) may also be carried by the west-ern branch of the Irminger Current across to EastGreenland and onward to West Greenland (e.g., Jensen,1926, 1939;Tåning, 1937; see also Fig. 13.6).The driftof larval and 0-group cod to Greenland was especiallyextensive during the 1920s and 1940s.
Capelin is the largest fish stock in the Icelandic marineecosystem. Unlike other commercial stocks, adultcapelin undertake extensive feeding migrations north-ward into the cold waters of the Denmark Strait andthe Iceland Sea during summer.The capelin return tothe outer reaches of the north Iceland shelf in October/November from where they migrate to the spawninggrounds south and west of Iceland in late December/early January (Fig. 13.7). Spawning is usually over bythe end of March. Capelin are especially important inthe diet of small and medium-sized cod (Pálsson,1997). Most juvenile capelin aged 0, 1, and 2 yearsreside on or near the shelf off northern Iceland and on
Fig. 13.7. Distribution and migration of capelin in theIceland–Greenland–Jan Mayen area (Vilhjálmsson, 2002).
Feeding migrations of adultsReturn migrationsSpawning migrations
712 Arctic Climate Impact Assessment
the East Greenland plateau west of the Denmark Strait(Fig. 13.7).These components of the stock are there-fore accessible to fish, marine mammals, and seabirdsthroughout the year. On the other hand, the summerfeeding migrations of maturing capelin into the colderwaters of the Denmark Strait and the Iceland Sea placethe larger part of the adult stock out of reach of mostfish, except Greenland halibut, for about five to sixmonths. However, these capelin are then available towhales, seals, and seabirds. During the feeding migra-tions, adult capelin increase 3- to 4-fold in weight andtheir fat content increases from a few percentage pointsup to 15 to 20%.When the adult capelin return to thenorth Icelandic shelf in autumn they are preyed onintensively by a number of predators, apart from cod,until the end of spawning in the near-shore waters tothe south and west of Iceland.Thus, adult capelin repre-sent an enormous energy transfer from arctic regions toimportant commercial fish stocks in Icelandic watersproper (Vilhjálmsson, 1994, 2002).
Off West Greenland, northern shrimp and Greenlandhalibut spawn at the shelf edge off the west coast.This isalso the case for the northern shrimp stock, which isfound in the general area of the Dohrn Bank, aboutmid-way between East Greenland and northwestIceland. Greenlandic waters also contain capelin popula-tions that spawn at the heads of numerous fjords on thewest and east coasts.These capelin populations appear tobe self-sustaining and local, feeding at the mouths oftheir respective fjord systems and over the shallowerparts of the shelf area outside these fjords (Friis-Rødeland Kanneworff, 2002). During the warm period fromthe early 1930s until the late 1960s there was also anextensive spawning of cod to the southeast, southwest,and west of Greenland (e.g., Buch et al., 1994).
In the pelagic ecosystem off Greenland the populationdynamics of calanoid copepods and to some extent krillplay a key role in the food web, being a direct link tofish stocks, baleen whales, and some important sea-birds, such as little auk (Alle alle) and Brünnich’s guille-mot (Uria lomvia). But polar cod, capelin, sand eel(Ammodytes spp.), and squid (Illex illecebrosus) are proba-bly the most important pelagic/semi-pelagic macrofaunaacting as forage for fish such as Greenland halibut andcod, marine mammals, and seabirds. Benthic animalsare also important. Northern shrimp is a major fooditem for Atlantic cod and many other species of fish andmarine mammals (e.g., Jarre, 2002).
13.3.2. Fish stocks and fisheries
13.3.2.1. Atlantic cod
Historically, demersal fisheries at Iceland and Greenlandfall into two categories: land-based fisheries conductedby local inhabitants and those of distant water foreignfleets. For centuries the main target species was cod.Until the late 19th century, the local fisheries were pri-marily conducted with open rowboats, while the distant
water fishing fleets consisted of much larger, deckedocean-going sailing vessels. Until the end of the 19thcentury, almost all fishing for demersal species, whetherfrom small open rowboats or larger ocean going sailingvessels, was by hand lines.
Jónsson (1994) estimated that the combined landings byIcelandic, Dutch, and French fishing vessels werearound 35000 t per year for the period 1766 to 1777.One hundred years later, the combined French andIcelandic catches averaged about 55000 t per year.From the subsequent development of fishing effort andknowledge of stock sizes and exploitation rates, it isobvious that even large fleets of several hundred sailingvessels and open rowboats, fishing with primitive handlines, can not have had a serious effect on the abundantcod stock and other demersal species at Iceland.
This situation changed dramatically with the introduc-tion of steam and combustion engines to the fishingfleet, and the adoption of active fishing gear at theturn of the 19th century. By the beginning of the 20thcentury the otter trawl had been adopted by the for-eign fleet (e.g., Thor, 1992), while the smaller motorpowered Icelandic boats began to use gill nets, longlines, and Danish seines. Landings from the Icelandicarea were no longer almost exclusively cod, butspecies such as haddock, halibut, plaice (Pleuronectesplatessa), and redfish (Sebastes marinus) also becamecommon items of the catch. The demersal catch atIceland is estimated to have increased from about50 000 t in the 1880s to about 160 000 t in 1905,reaching 250 000 t just before the First World War.Although cod was still the most important species,the proportion of other demersal species landed hadincreased to about 30% (Fig. 13.8).
With the increasing effort and efficiency of theinternational distant water and local fishing fleets,cod catches in Icelandic waters increased to peak at520 000 t in 1933, while the catch of other demersalspecies increased to about 200 000 t (Fig. 13.8).
Fig. 13.8. Total catch from Icelandic fishing grounds, 1905–2002(data from the Icelandic Directorate of Fisheries and the MarineResearch Institute).
Chapter 13 • Fisheries and Aquaculture 713
Catches declined during the late 1930s, while theexploitation rate increased until the fishing effort felldrastically due to the Second World War. Nevertheless,the exploitation rate of cod remained at a moderatelevel due to recruitment from the superabundant1922 and 1924 year classes (Schopka, 1994). After theSecond World War, catches of demersal fish fromIcelandic grounds increased again. Landings peaked atabout 860 000 t in 1954, with cod accounting forabout 550 000 t (Fig. 13.8). Because of the very strong1945 cod year class and good recruitment to otherdemersal stocks, the exploitation rate of cod and otherdemersal species remained at a low level, althoughalmost 50% higher than during the late 1920s andearly 1930s. From 1955, the exploitation rate of alldemersal stocks at Iceland, but especially that of cod,increased rapidly and with few exceptions has sincebeen far too high. Until 1976, this was due to thecombined effort of Icelandic and foreign distant waterfleets. However, since the extension of the IcelandicEEZ to 200 nautical miles in 1977, the high rate offishing has continued due to the enhanced efficiency ofIceland’s fishing fleet.
Although cod has been fished intermittently off WestGreenland for centuries, the success of the cod fisheryat Greenland has been variable. Despite patchy datafrom the 17th and 18th centuries, there is little doubtthat cod abundance at West Greenland fluctuated wide-ly (e.g., Buch et al., 1994). Information from the 19thcentury suggests that cod were plentiful in Greenlandicwaters until about 1850. After that there seems to havebeen very few cod on the banks and in inshore watersoff Greenland until the late 1910s to early 1920s, whena small increase in the occurrence of cod in inshoreareas was noted (Hansen, 1949; Jensen, 1926, 1939).Cod were also registered in offshore regions off WestGreenland in the late 1920s, where fisheries by foreignvessels expanded quickly and catches increased fromabout 5000 t in 1926 to 100000 t in 1930. From thenuntil the end of the Second World War in 1945, thisfishery yielded annual catches between about 60000and 115000 t (Fig. 13.9).The total cod catch reached
about 200000 t by 1950 and then fluctuated around300000 t between 1952 and 1961. After that the codcatch increased dramatically and landings varied fromabout 380000 to 480000 t between 1962 and 1968.By 1970, the catch had fallen to 140000 t and was,with large variations, within the range 10000 to150000 t until the early 1990s (Fig. 13.9). Since 1993,almost no Atlantic cod has been caught in Greenlandicwaters. Before the introduction of the 200 nm EEZaround Greenland in 1978 the cod fishery was mostlyconducted by foreign fleets, but since then theGreenlandic fleet has dominated the fishery.
13.3.2.2. Greenland halibut
An Icelandic Greenland halibut fishery began in theearly 1960s (Fig. 13.8). Initially, long line was the mainfishing gear but this method was abandoned becausekiller whales (Orcinus orca) removed more than half thecatch from the hooks. Since the early 1970s this fisheryhas been conducted using otter trawls.
At Greenland, a fishery for Greenland halibut began ina very modest way around 1915 and had by 1970 onlyreached an annual catch of about 2700 t, most of whichwas taken by Greenland. From 1970 to 1980 othercountries participated in the Greenland halibut fishery,which peaked in 1976 at about 26000 t. By 1980 thecatch had fallen to about 7000 t. During the 1990s, thecatch increased rapidly to about 25000 t in 1992 andwas in the range of 30000 to 35000 during 1998 to2002. Since 1980, foreign vessels have not played a sig-nificant role in the Greenland halibut fishery off WestGreenland.The total catch of Greenland halibut in WestGreenland waters is shown in Fig. 13.9.
13.3.2.3. Northern shrimp
A small inshore fishery for northern shrimp began inIcelandic waters in the mid-1950s. Initially, this was afjordic fishery of high value to local communities.An offshore shrimp fishery, which began in the mid-1970s on the outer shelf off the western north coast,soon expanded to more eastern areas. Annual landingsfrom this fishery increased to between 25000 and35000 t in the late 1980s and to between 45000 and75000 t in the 1990s. Recently, catches have declineddrastically, both in offshore and coastal areas (Fig. 13.8).
The catch of northern shrimp off West Greenland hasincreased steadily since its beginning in 1960. At theoutset, this species was fished only by the Greenlandicfleet, but from 1972 large vessels from other coun-tries joined this fishery. This led to a large increase inthe total catch of northern shrimp, which peaked atabout 61 000 t in 1976. Between 1976 and the early1980s, the catch by other countries decreased and hasbeen insignificant since. On the other hand, theGreenlandic catch increased steadily, from a totalcatch in 1960 of about 1800 t to 132 000 t in 2002 asshown in Fig. 13.9.
Fig. 13.9. Total catch off West Greenland, 1900–2002 (data from the Greenland Statistical Office and Directorate ofHunting and Fishing).
714 Arctic Climate Impact Assessment
13.3.2.4. Herring
Commercial fishing for herring started at Iceland in the1860s when Norwegian fishermen initiated a land-basedfishery on the north and east coasts using traditionalScandinavian beach seines.This fishery proved veryunstable and was abandoned in the late 1880s. Driftnetting was introduced at the turn of the 19th centuryand purse seining in the early 20th century (1904).The latter proved very successful off the north coast,where the herring schools used to surface regularly,while drift nets had to be used off the south and westcoasts where the herring rarely surfaced.The northcoast herring fishery increased gradually during the1920s and 1930s and had reached 150000 to 200000 tby the beginning of the 1940s (Fig. 13.8). During thisperiod, the fishery was limited mainly by lack of pro-cessing facilities. Around 1945 the herring behavior pat-tern changed and as a result purse seining for surfacingschools north of Iceland became ineffective and catchesdeclined.The reasons for this change in behavior havenever been identified.
Horizontally ranging sonar, synthetic net fibers, andhydraulic power blocks for hauling the large seine netswere introduced to the herring fishery during the late1950s and early 1960s (Jakobsson, 1964; see also Box13.1).These technical innovations, as well as betterknowledge of the migration routes of the great Atlanto-Scandian herring complex (i.e., Norwegian spring-spawning herring and much smaller stocks of Icelandicand Faroese spring-spawning herring), lead to an interna-tional herring boom in which Icelandic, Norwegian,Russian (USSR), and Faroese fishermen were the mainparticipants (for Icelandic catches see Fig. 13.8).Thisextraordinary herring fishery ended with a collapse of theAtlanto-Scandian herring complex during the late 1960sdue to overexploitation of both adults and juveniles (Box13.1). Catches of Atlanto-Scandian herring (now calledNorwegian spring-spawning herring since the Icelandicand Faroese components have not recovered) in theIcelandic area have been negligible since the late 1960sand Iceland’s share of the TAC of this herring stock sincethe mid-1990s has mainly been taken outside Icelandicwaters.There is no fishery for herring at Greenland.
It took the Norwegian spring-spawning stock about twoand a half decades to recover despite severe catchrestrictions (Box 13.1). Both the Icelandic spring- andsummer-spawning herring suffered the same fate.Retrospective analysis of historical data shows that therewere no more than 10000 to 20000 t left of theIcelandic summer-spawning herring stock in the late1960s/early 1970s (Jakobsson, 1980). A fishing ban wasintroduced and since 1975 the fishery has been regulat-ed, both by area closures and minimum landing size, aswell as by having a catch rule corresponding to a TAC ofroughly 20% of the estimated adult stock abundance inany given year.The stock recovered gradually, is at a his-torical high at present, and the annual yield over the1980s and 1990s was on average about 100000 t.
13.3.2.5. Capelin
An Icelandic capelin fishery began in the mid-1960s andwithin a few years replaced the rapidly dwindling her-ring fishery, as was also witnessed in the Barents Sea(Vilhjálmsson, 1994, 2002;Vilhjálmsson and Carscad-den, 2002).The capelin fishery is conducted by thesame high-technology fleet as used for catching herring.During the first eight to ten years, the fishery only pur-sued capelin spawning runs in near-shore waters off thesouthwest and south coasts of Iceland in February andMarch and annual yields increased to 275000 t.In 1972, the fishery was extended to deep waters eastof Iceland in January, resulting in an increase in theannual catch by about 200000 t. In 1976, an oceanicsummer fishery began north of Iceland and in theDenmark Strait. In 1978, the summer fishery becameinternational as it extended north and northeast intothe EEZs of Greenland and Jan Mayen (Norway).Within two years the total seasonal (July to March)capelin catch increased to more than one million t.Total annual international landings of capelin from thisstock during 1964 to 2002 are shown in Fig. 13.8.
Historically, capelin have been caught at Greenland fordomestic use and animal fodder. A small commercialfishery for roe-bearing females began at West Greenlandin 1964 with a catch of 4000 t, which is also the largestcatch on record.There were relatively large fluctuationsin the capelin catch from 1964 to 1975, but since thenthe catch has been insignificant.This fishery is conduct-ed by Greenlanders.
13.3.2.6. Blue whiting
The most recent addition to Icelandic fisheries is that ofthe semi-pelagic blue whiting.This is a straddlingspecies commonly encountered in that part of theIcelandic ecosystem dominated by Atlantic water, i.e.,off the west, south, and southern east coast. A smallblue whiting fishery began in the early 1970s, increasedto about 35000 t in 1978 and then dwindled to 105 t in
Fig. 13.10. Total catch off East Greenland, 1950–2002 (data from the Greenland Statistical Office and Directorate of Hunting and Fishing).
Chapter 13 • Fisheries and Aquaculture 715
1984.There was renewed interest in this fishery in themid-1990s and from 1997 to 2002 the blue whitingcatch increased from 10000 to 285000 t (Fig. 13.8).
13.3.2.7. Fisheries off East Greenland
East Greenland waters have been fished commerciallyonly since the Second World War (Fig. 13.10).The mainreason for this is the rough bottom topography as wellas the speed and irregularity of the ocean currents,especially near the edge of the continental shelf.These conditions render it difficult to fish EastGreenland waters except with large powerful vesselsand robust fishing gear.The main species that have beenfished commercially off East Greenland are Greenlandhalibut, northern shrimp, cod, and redfish.With theexception of northern shrimp since the 1980s, the fish-eries off East Greenland have almost exclusively beenconducted by foreign fleets.
13.3.2.8. Marine mammals and seabirds
The Icelandic marine ecosystem contains a number ofspecies of large and small whales, most of which aremigratory. Commercial whaling has been conductedintermittently in Iceland for almost a century. Initially,large Norwegian whaling stations were operated fromthe mid-1880s until the First World War, first on theVestfirdir peninsula (northwest Iceland) and later on theeast coast. By about 1912, stocks had become depletedto the extent that whaling was no longer profitable andin 1916 the Icelandic Parliament passed an act prohibit-ing all whaling. In the following decades whale stocksgradually recovered and from 1948 until zero quotas onwhaling were set in 1986, a small Icelandic companyoperated with four boats from a station on the westcoast, just north of Reykjavík.The main target specieswere fin (Balaenoptera physalus), sei (B. borealis), andsperm (Physeter catodon) whales and the average yearlycatches were 234, 68, and 76 animals respectively. Inaddition, 100 to 200 (average 183) minke whales weretaken annually by small operators between 1974 and1985. Although never commercially important at anational level, whaling was very profitable for those
engaged in the industry. Icelandic whale catches byspecies are shown in Fig. 13.11.
The numbers of seals in Icelandic waters are com-paratively small. The populations of the two mainspecies, harbour seals and grey seals, are estimated at15 000 and 6000 animals, respectively (Anon, 2004c).Harbour seal abundance is stable while the numbersof grey seals have decreased. Sealing has never reachedindustrial proportions in Iceland, the total number ofskins varying between 1000 and 7000 annually sincethe 1960s.
Although foreign fleets have pursued large-scale whal-ing in Greenlandic waters, native Greenlanders havehunted whales for domestic use only. Harvest of themain species has been modest and is unlikely to havehad any effect on stocks. Five seal species are exploitedin Greenland, with harp and ringed (Phoca hispida) sealsby far the most important. Ringed seal catchesincreased from the mid-1940s until the late 1970s andthen dropped until the mid-1980s after which theyincreased.The harp seal catches increased until the1960s at which point they began to decrease and werevery low during the 1970s. Since then, harp seal catcheshave increased continuously and at the time of writingwere higher than ever.
Greenlandic catches of whales, seals, walrus, and sea-birds between 1993 and 2000 are shown in Fig. 13.12.Sealskin prices were subsidized in Greenland whenprices started to decline on the world market and seal-skin campaigns are thought unlikely to have influencedhunting effort for seals in Greenland.There have, how-ever, been indirect positive effects, in that Canadiancatches (Labrador plus Newfoundland) of both speciesfell dramatically and the harp seal population increasedto double its size within a relatively few years.Thedecrease in ringed seal catches during the early 1980scoincided with the sealskin campaign, but the underly-ing cause was probably population dynamics, triggeredby climatic fluctuations (Rosing-Asvid, 2005).
Fig. 13.11. Catch of large whales at Iceland, 1948–2000 (data from the Icelandic Directorate of Fisheries and the Marine Research Institute).
Fig. 13.12. Greenland catch of marine mammals and seabirds,1993–2000 (data from the Greenland Statistical Office andDirectorate of Hunting and Fishing).
716 Arctic Climate Impact Assessment
13.3.2.9. Aquaculture
In the late 1970s and 1980s there was much interest inaquaculture in Iceland. A number of facilities weredeveloped for the cultivation of salmon, rainbow trout(Salmo gairdneri), and Arctic char (Salvelinus alpinus) atvarious sites on the coast. Practically all failed, either forfinancial reasons or lack of expertise, or both.The fewthat survived, or were rebuilt on the ruins of others,have until recently not produced much more than neces-sary for the domestic market.
In comparative terms, aquaculture has therefore been oflittle economic importance for Iceland in the past.However, renewed interest began in the 1990s. Iceland isonce again investing heavily in fish farming – but thistime it is private capital rather than short-term loans orstate funding which governs the progress.The largestquantitative increase will almost certainly be in salmon.Total production in 2001 was around 4000 t of salmonand related species. It is expected that by 2010 the pro-duction of these species will have increased to around25000 to 30000 t. In addition, there is increased inter-est and success in the farming of Atlantic halibut, seabass (Dicentrachus labrax), turbot (Psetta maxima), cod, andsome other marine fish, and recently there has been aconsiderable increase in the production of abalone(Haliotis rufuscens) and blue mussel (Mytilus edulis).
Despite fish farmers working closely with the industryand with researchers to accelerate growth in productionof both salmonids and whitefish species, it is expected tobe a few more years before the industry is operatingsmoothly. Area conflicts with wild salmon have not beenresolved, cod farming is still at the fry stage, and char –a high price product – has a limited market. Neverthe-less, aquaculture is being developed to become morethan an extra source of income and as a consequence,major fisheries companies are investing in developmentprojects in this sector.
Aquaculture was attempted in Greenland in the 1980s.The experiment failed and aquaculture is not conductedin Greenland at the present time.
13.3.3. Past climatic variations and theirimpact on commercial stocks
The main climate change over the Nordic Seas and inthe northwest North Atlantic over the 20th century wasa rise in air temperature during the 1920s and 1930swith a concurrent increase in sea temperature and adecrease in drift ice.There was distinct cooling in the1940s and early 1950s followed by reversal to condi-tions similar to those of the 1920s and 1930s.Thesechanges and their apparent effect on marine biota andcommercial stocks in Icelandic and Greenlandic waterswere studied and reported on by a number of contem-porary researchers (e.g., Fridriksson, 1948; Jensen,1926, 1939; Sæmundsson, 1934;Tåning, 1934, 1948).Summaries have been given by, for example, Buch et al.(1994) and Vilhjálmsson (1997).
Figure 13.13 shows five-year running averages of seasurface temperature anomalies off the central northcoast of Iceland and illustrates trends in the physicalmarine environment of Icelandic waters over the 20thcentury.The main features are an increased flow ofAtlantic water onto the shelf north of Iceland between1920 and 1964 followed by a sudden cooling in 1965 to1971 and more variable conditions since then. A strongpresence of Atlantic water on the north and eastIcelandic shelf promotes vertical mixing and thus favorsboth primary and secondary production, i.e., prolongsalgal blooms and increases zooplankton biomass.Greenland also experienced a climatic warming in the1920s probably with similar effects on the lowest levelsof the food chain (Fig. 13.14).
At Iceland, one of the most striking examples of theeffects of the climatic warming during the 1920s was amass spawning of cod off the north and east coasts inaddition to the usual spawning off south and westIceland (Sæmundsson, 1934). Furthermore, there waslarge-scale drift of larval and 0-group cod across thenorthern Irminger Sea to Greenland in 1922 and 1924
Fig. 13.14. Variations in sea temperature and temperature anom-alies on the Fylla Bank off southwest Greenland (adapted fromBuch et al., 1994, 2002). Five-year running means, 1875–2000.
Fig. 13.13. Sea surface temperature anomalies north of Iceland(based on Anon, 2004b; Stefánsson, 1999). Five-year runningmeans, 1900–2001.
Chapter 13 • Fisheries and Aquaculture 717
(Jensen, 1926; Schopka, 1994).This is described indetail in Box 13.2.
Changes in the marine fish fauna off West Greenlandwere even more spectacular than those off Iceland.There was a large increase in cod abundance and catch-es in the 1920s (Fig. 13.15), and other gadids, such assaithe, haddock, tusk, and ling, previously rare orabsent at Greenland, also appeared there in the 1920sand 1930s. Furthermore, herring appeared in largenumbers off West Greenland in the 1930s and began tospawn there in the period July through September,mainly south of 65º N (Jensen, 1939).These herringspawned near beaches, similar to capelin in thesewaters. Like capelin, herring are bottom spawners withtheir eggs adhering to the substrate or even, as in thiscase, the fronds of seaweed. In 1937, the northernmostdistribution of adult herring reached 72º N (Jensen,1939). However, a herring fishery of commercial scalehas never been pursued at Greenland.
In the early 1900s capelin were very common at WestGreenland between Cape Farewell and Disko Bay (Fig.13.5), but unknown further north (Jensen, 1939). Inthe 1920s and 1930s, the center of the West Greenlandcapelin populations gradually shifted north and capelinbecame rare in their former southern area of distribu-tion. By the 1930s, the main spawning had shifted northby 400 nm to the Disko Bay region (Fig. 13.5). Off EastGreenland capelin have gradually extended their distri-bution northward along the coast to Ammassalik(Jensen, 1939). However, capelin are an arctic speciesand have probably been common in that area for cen-turies since Ammassalik means “the place of capelin”.
During the latter half of the 1960s there was a suddenand severe climatic cooling with an associated drop insea temperature, salinity, and plankton production(Fig. 13.16), and an increase in sea ice to the north andeast of Iceland (e.g., Astthorsson and Gislason, 1995;Malmberg, 1988;Thórdardóttir, 1977, 1984).Temperatures increased again in the 1970s, but were
then more variable during the previous warm period.The low sea temperatures were also recorded in WestGreenland waters (Fig. 13.14).This low temperature,low salinity water (the “Great Salinity Anomaly”) driftedaround the North Atlantic and had noticeable, and insome cases serious, effects on marine ecosystems(reviewed e.g., by Jakobsson, 1992).
In the Icelandic area, herring was the fish species mostaffected by the cold conditions of the 1960s (Dragesundet al., 1980; Jakobsson, 1969, 1978, 1980; Jakobssonand Østvedt, 1999).This is not surprising as herring areplankton feeders and in north Icelandic waters are neartheir limit of distribution.This was manifested in large-scale changes in migrations and distribution (seeFig. 9.19) and a sudden and steep drop in abundance(which however was mostly brought about by overfish-ing – see Box 13.1).The abundance of the Norwegianspring-spawning herring stock increased dramaticallyin the 1990s (see section 13.2.2.5 and Box 13.1) andregained some semblance of its previous feeding pattern(for an overview of these changes see Chapter 9).Presently, Norwegian spring-spawning herring stilloverwinter in the Lofoten area on the northwest coastof Norway.Whether and when they revert completelyto the “traditional” distribution and migration patterncannot be predicted.
The two Icelandic herring stocks, i.e., the spring- andsummer-spawning herring stocks, suffered the same
Fig. 13.15. Temperature anomaly and the catch of cod off WestGreenland, 1910–1940 (Vilhjálmsson, 1997).
Fig. 13.16. Deviations of (a) temperature and salinity, and(b) zooplankton volume north of Iceland, spring 1952–2003(Anon, 2004b).
(a)
(b)
718 Arctic Climate Impact Assessment
fate. The spring-spawning stock still shows no sign ofrecovery, while the summer-spawning stock recovereda few years after a fishing ban was imposed in the early1970s (Jakobsson and Stefánsson 1999). It seems that,like the West Greenland cod, the Icelandic spring-spawning herring had difficulties in self propagationin cold periods and would probably have collapsed inthe late 1960s and early 1970s, even without a fishery(Jakobsson, 1980).The summer-spawning herring,on the other hand, have adapted much better to vari-ability in Icelandic waters. For all three stocks it canbe concluded that environmental adversities placedthem under reproductive stress and disrupted feedingand migration patterns. Environmental stress, coupledwith far too high fishing pressure on both adults andjuveniles, resulted in the actual collapses of theseherring populations.
While the growth rate of Icelandic capelin has shown asignificant positive correlation with temperature andsalinity variations in the north Icelandic area since themid-1970s, this relationship probably describes feeding
conditions in the Iceland Sea rather than a direct effectof temperature (Astthorsson and Vilhjálmsson, 2002;Vilhjálmsson, 1994, 2002). Results of attempts to relaterecruitment of the Icelandic capelin stock to physicaland biological variables, such as temperature, salinity,and zooplankton abundance, have been ambiguous.Nevertheless, judging by their stock size, the Icelandiccapelin, which spawn in shallow waters off the southand west coasts of Iceland, seem to have been successfulin recent decades and probably also in most years dur-ing the latter half of the 20th century.
However, at the peak of warming in the late 1920s andthe first half of the 1930s, it was noted that capelin hadceased to spawn on the traditional grounds off the southand west coasts of Iceland and spawned instead off theeasternmost part of the south coast as well as in fjordsand inlets on the southeast and north coasts (Sæmunds-son, 1934). Sæmundsson also noted that the cod hadbecome unusually lean and attributed this to lowercapelin abundance. Although there can be other causesof reduced growth of cod, e.g., competition due to a
Box 13.2.The Iceland/Greenland cod and climate variability
Although the abundance of the Icelandic cod stock prior to 1920 is not known, it was unquestionably large(e.g., Schmidt, 1909). Furthermore, the climatic warming of the 1920s and 1930s appears to have greatlyincreased reproductive success of Icelandic cod through extended spawning areas and increased primary andsecondary production in the mixed waters north and east of Iceland compared to previous decades. In addition,huge amounts of larval and 0-group cod drifted west across the northern Irminger Sea in 1922 and 1924, grewoff West Greenland, and returned to Iceland in large numbers to spawn (Schopka, 1994;Vilhjálmsson, 1997).Tagging experiments indicate that the majority of these fish then remained within the Icelandic marine ecosystem(Hansen, 1949; Hansen et al., 1935; Jakobsson, 2002; Jónsson, 1996;Tåning, 1934, 1937).Thus, the distribution areaand biomass of cod in the Icelandic marine ecosystem can be enormously enlarged through larval drift andreturning adults during warm periods.
The climatic warming in the 1920s (Fig. 13.14) resulted in far greater changes in the distribution and abundanceof cod at Greenland than Iceland. Until the 1920s, cod occurred in scattered numbers in inshore waters nearCape Farewell, the southernmost promontory of Greenland (Jensen, 1926, 1939;Tåning, 1948). In the 1920s, codappeared over wider areas and in increasing numbers.This is shown in the rapid rise in the international catch ofcod at West Greenland in the late 1920s, which coincides with the time needed for the 1922 and 1924 yearclasses to grow to marketable size. Furthermore, cod extended their distribution northward along the west coastof Greenland by 600 to 800 nm in the 1920s and 1930s (Tåning, 1948). At East Greenland, cod appeared insmall schools in the Ammassalik area around 1920 and became common around 1930 along the east coastsouth from Ammassalik (Schmidt, 1931).The drift of 0-group cod from Iceland to Greenland continued on andoff from the 1930s to the mid-1960s, although on a smaller scale than for the superabundant year classes of1922, 1924, and 1945 (Schopka, 1994).
By the early 1930s,West Greenland waters were warm enough for successful spawning of cod (Buch et al., 1994;Hansen, 1949; Hansen et al., 1935; Jensen, 1939;Tåning, 1937). Some members of the 1922 and 1924 year classestook advantage of this, spawned off West Greenland and, with the small inshore cod population, were instrumen-tal in giving rise to a local self-sustaining component.The West Greenland cod stock became very large and sus-tained annual catches of 300000 to 470000 t throughout the 1950s and 1960s. From 1973 to 1993 the averageannual catch off West Greenland was about 55000 t. Peak catches in this period are associated with year classeswhich drifted as 0-group from Iceland to Greenland. At present, there are few cod at East and West Greenlandand no local recruitment to the cod stock (Buch et al., 1994, 2002).
Although fishing mortalities at Greenland increased in the 1950s and 1960s and accelerated the crash of theGreenland cod in the 1970s, the spawning stock remained above 500000 t until 1970 and produced large year
c
Chapter 13 • Fisheries and Aquaculture 719
large stock size, Sæmundsson’s conclusion may havebeen correct.The change in capelin spawning areas hedescribed is probably disadvantageous for this capelinstock.The reason being that suitable spawning areaswould be much reduced compared to those previouslyand presently occupied by the stock. Furthermore, lar-val drift routes could be quite different and a propor-tion of the larvae would probably end up in the westernNorwegian Sea and be spread to regions where theirsurvival rate might be much lower.
The catch history and series of stock assessments ofnorthern shrimp in deep waters northwest, north,and east of Iceland, as well as at Greenland are tooshort for establishing links with environmental vari-ability. Being a frequent item in the diet of small andmedium-sized cod, stocks of northern shrimp arelikely to be larger when cod abundance is low.However, in general terms, the stock probably benefitsfrom cooler sea temperatures, possibly through bothenhanced recruitment and a reduced overlap of shrimpand cod distribution.
13.3.4. Possible impacts of climate changeon fish stocks
To project the effects of climate change on marineecosystems is a very difficult task, despite knowing theeffects of previous climatic change. Previous sectionsdescribed how the marine climate around Icelandchanged over the 20th century, from a cold to a warmstate in the 1920s, lasting with some deviations for about45 years, with a sudden cooling in 1965 which lasteduntil 1971. Since then, conditions have been warmer butvariable and temperatures have not risen to the 1925 to1964 levels. Available evidence suggests that, as a generalrule, primary and secondary production and thereby thecarrying capacity of the Icelandic marine ecosystem isenhanced in warm periods, while lower temperatureshave the reverse effect.Within limits, this is a reasonableassumption since the northern and eastern parts of theIcelandic marine ecosystem border the Polar Front,which may be located close to the coast in cold years butoccurs far offshore in warm periods when levels of bio-logical production are enhanced through nutrient
classes until 1964. Like at Iceland, there was a severe cooling of the Greenlandic marine environment in the latterhalf of the 1960s and since then the only year classes of commercial significance at Greenland are those of 1973and 1984, both of which drifted to Greenland as 0-group from Iceland. Despite warmer Greenlandic waters afterthe cooling of the late 1960s, no year classes of Greenlandic origin have appeared (Vilhjálmsson and Fri)geirsson,1976;Vilhjálmsson and Magnússon, 1984; Schopka, 1994).This indicates that cod cannot reproduce efficiently atGreenland except under hydrographic conditions that are warmer than “normal”.
The fishable part of the Icelandic cod stock (age 4+) declined from almost 2.5 million t in the early 1950s tobelow 600000 t in 1986.The spawning stock decreased from about 1260 to below 200000 t over this period.The initial large stock size was due to low fishing pressure in and immediately after the Second World War andto the recruitment of the superabundant 1945 year class. A large part of this year class drifted across toGreenland as 0-group and grew in Greenlandic waters. Later, around 500 million members of this year classmigrated back to Iceland for spawning and appear not to have left (Schopka, 1994). Despite the cold period of1965 to 1971 and warmer but more variable conditions since then, recruitment remained at a normal level until1985, with occasional boosts by immigrants from Greenland, although on a much smaller scale than in 1922,1924, and 1945 (Schopka, 1994).
Compared to other cod stocks in arctic/subarctic areas, recruitment variability of cod which grow within theIcelandic ecosystem is low or about 1:4 in the period 1920 to 1984. Although it seems that the Icelandic ecosys-tem cannot support juvenile year classes much beyond sizes corresponding to 300 million recruits at age 3, it haseasily accommodated very large numbers of adult cod migrating back from Greenland to their natal spawninggrounds. Even the very cold period from 1965 to 1971, and the variable conditions since then, do not appear tohave had much detrimental effect on recruitment to the cod stock by fish that grew locally. Average recruitmentduring 1920 to 1985 was 210 million age 3 cod per annum.
However, since 1985 there has been a large and protracted decline in recruitment, from 210 million to about135 million age 3 cod per annum. A very small and young spawning stock in the range of 120000 to 210000 t isthe only common denominator over this period.This is very likely to have resulted in lower quality eggs, shorterspawning time, smaller spawning grounds, and possibly different drift routes, and seems to be the most plausibleexplanation for the reduced recruitment (Marteinsdottir and Begg, 2002; Marteinsdottir and Steinarsson, 1998).The most likely explanation for the large year classes of 1983 and 1984, which derived from small spawningstocks, is that old fish from the abundant year classes of 1970 and 1973 were still present in the spawning stockin sufficient numbers to enhance recruitment.
720 Arctic Climate Impact Assessment
renewal and associated mixing processes, resulting froman increased flow of Atlantic water onto the north andeast Icelandic plateau.
Over the last few years the salinity and temperaturelevels of Atlantic water off south and west Iceland haveincreased and approached those of the pre-1965 period.At the same time, there have been indications ofincreased flow of Atlantic water onto the mixed waterareas over the shelf north and east of Iceland in springand, in particular, in late summer and autumn.This maybe the start of a period of increased presence of Atlanticwater, resulting in higher temperatures and increasedvertical mixing over the north Icelandic plateau, but thetime series is still too short to enable firm conclusions.
However, there are many other parameters which canaffect how an ecosystem and its components, especiallythose at the upper trophic levels, will react to changes intemperature, salinity, and levels of primary and second-ary production.Two of the most important are stocksizes and fisheries, which are themselves connected.Owing to high fishing pressure since the early 1970s,most of the important commercial fish stocks inIcelandic waters are smaller than they used to be, andmuch smaller than at the onset of the warming period inthe 1920s. Associated with this are changes in age andsize distributions of spawning stocks; spawners are nowfewer, younger, and smaller.These changes can affectreproductive success through decreased spawning areasand duration of spawning, smaller eggs of lower quality,and changes in larval drift routes and survival rates(Marteinsdottir and Begg, 2002; Marteinsdottir andSteinarsson, 1998). It is unlikely that the response ofcommercial fish stocks to a warming of the marine envi-ronment at Iceland, similar to that of the 1920s and1930s, will be the same in scope, magnitude, and speedas occurred then. Nevertheless, a moderate warming islikely to improve survival of larvae and juveniles of mostspecies and thereby contribute to increased abundance ofcommercial stocks in general.The magnitude of thesechanges will, however, be no less dependent on the suc-cess of future fishing policies in enlarging stock sizes ingeneral and spawning stock biomasses in particular, sincethe carrying capacity of Icelandic waters is probablyabout two to three times greater than that needed by thebiomass of commercial species in the area at present.
The following sections describe three possible scenariosof warming for the marine ecosystems of Iceland andGreenland and attempt to project the associated biologi-cal and socio-economic changes.
13.3.4.1. No climate change
Although the marine climate may dictate year-class suc-cess in some instances, there is little if any evidence tosuggest that year-class failure and thereby stock prop-agation is primarily due to climate-related factors.Therefore, assuming no change from the ACIA baselineclimate conditions of 1981–2000, the development and
potential yield in biomass of commercial stocks will inmost cases depend on effective rational management,i.e., a management policy aimed at increasing the abun-dance of stocks through reduced fishing mortalities andprotection of juveniles.This is the present Icelandic poli-cy. Although it has not yet resulted in much tangible suc-cess, it should eventually do so and with a speed thatlargely depends on how well incoming year classes ofbetter than average size can be protected from beingfished as adolescents.
A successful fishing policy of this kind should ensure anincrease in the abundance of many demersal fish stocksby around 2030.This would considerably increase thesustainable yield from these stocks compared to thepresent.This could also apply for the Icelandic summer-spawning herring, although that stock is already exceed-ing its historical maximum abundance.The increase inyield in tonnes is, however, not directly proportional toincrease in stock abundance.Thus, a doubling of the fish-able biomass of the Icelandic cod stock would probablyincrease its long-term sustainable yield in tonnes byabout 20 to 30% compared to the present annual catchof about 200000 t. Furthermore, due to natural variabil-ity in the size of recruiting year classes, increases instock biomasses of the various species are most likely tooccur in a stepwise fashion and the value of the catchwould not necessarily increase proportionally.
However, on the negative side, it is likely that thenorthern shrimp catch would decrease due to increasedpredation by cod and that the capelin summer/autumnfishery would have to be reduced or stopped altogether,in order for the needs of their more valuable fish preda-tors to be met and those of large whales, if whalesremain subject to a moratorium on commercial whal-ing. Increases in abundance, but especially extendedmigrations of the Norwegian spring-spawning herringto feed in north Icelandic waters, will determine thevalue of the yield from that stock for Iceland. For thisto occur on a long-term basis, the intensity of the coldEast Icelandic Current must weaken and temperaturesnorth of Iceland must increase. Such conditions are notenvisaged under this scenario.
At Greenland, the no-change scenario will have littleeffect on the present situation, given that stocks arepresently managed in a rational manner and that this isexpected to continue.
13.3.4.2. Moderate warming
Most criteria in the no-change scenario are probablyalso valid for a moderate warming of 1 to 3 ºC.However, due to greater primary and secondary pro-duction and a direct temperature effect per se, stock-rebuilding processes are likely to be accelerated in mostcases. Nevertheless, as for the no-change scenario, arational fishing policy must be maintained. Indeed, it isvery likely that harvesting strategies can be used whichwould give higher returns from most of the major dem-
Chapter 13 • Fisheries and Aquaculture 721
ersal stocks in the Icelandic area. As under the no-change scenario, a side effect of such a policy would bea rise in the mean age and number of older fish in thespawning stock of cod, which would further enhancelarval production and survival.
Drift of larval and 0-group cod across the northernIrminger Sea to East Greenland and onward to WestGreenland waters is likely to become more frequentand the number of individuals transported to increasecompared to the latter half of the 20th century. Sincesea temperature off West Greenland will also increaseunder this scenario, it is very likely that the drift of codlarvae and juveniles from Iceland will lead to the estab-lishment of a self-sustaining Greenlandic cod stock.With a successful management strategy and in the lightof past events, that cod stock could become very largeand have enormous positive economic benefits forGreenland (see section 13.3.6.2). However, it is unlike-ly that this will contribute much to cod abundance atIceland.This is because present fish finding and catchtechnologies are so effective that these cod can, andvery likely will, be easily fished in Greenlandic watersbefore they could return to Iceland for spawning at theage of seven to eight years.
An increase in temperature of 1 to 3 ºC in the northIcelandic area is large in comparative terms and will,among other things, be associated with a weakening ofthe East Icelandic Current and a considerable reductionin its domain.The degree of reduction is very likely tobe sufficient to enable the Norwegian spring-spawningstock to again take advantage of the rich supply ofCalanus finmarchicus over the north Icelandic shelf.This scenario would make it easier and cheaper forIceland to take its share of this stock, and would alsomake the stock more valuable.The reason for this is alarge increase in the proportion of the catch whichcould be processed for human consumption comparedto the current situation where a large proportion mustbe reduced to the comparatively cheaper fishmeal andoil. It is also very likely that more southern species suchas mackerel and tuna will enter Icelandic waters in suf-ficient concentrations for commercial fishing in latesummer and autumn.
13.3.4.3. Considerable warming
According to the B2 emissions scenario, model resultsindicate that a rise in temperature beyond 2 to 3 ºC inthe Icelandic area in the 21st century is unlikely.However, should that happen, the high temperature islikely to lead to dramatic changes to the Icelandicmarine ecosystem. Section 13.3.1 described the key roleof capelin for the well-being of many demersal stocks,and highlighted the large reduction in weight-at-age ofIcelandic cod during the two capelin stock collapses.Capelin spawning also ceased on their traditionalgrounds off the south and west coasts of Iceland in thelate 1920s and early 1930s, occurring instead in fjordsand inlets on the southeast and north coasts (Sæmunds-
son, 1934). Under such conditions the extent of capelinspawning grounds would reduce considerably. Shouldthe rise in sea temperature increase beyond that of the1920 to 1940 period, it is likely that capelin spawningmight be even further reduced and limited to the northand east coasts of Iceland.This would result in majorchanges in larval drift routes and survival and, eventual-ly, to a large reduction in, or even a complete collapseof, the Icelandic capelin stock.
Owing to the key role of capelin as forage fish in theIcelandic marine ecosystem this scenario would be verylikely to have a considerable negative impact on mostcommercial stocks of fish, whales, and seabirds whichare dominant in this ecosystem at present. Such a sce-nario is also very likely to result in species from moretemperate areas moving into the area and at least partial-ly replacing those most affected by a lack of capelin.
13.3.5.The economic and social importanceof fisheries
13.3.5.1.The fishing industry and past economicfluctuations
Iceland
During the 20th century, the Icelandic gross domesticproduct (GDP) had an average annual growth of about4% per year.This was largely driven by expansion in thefisheries and fish processing industries. Furthermore,fluctuations in aggregate economic output were highlycorrelated with variations in the fishing industry.Good catches and high export prices resulted in eco-nomic growth, while poor catches and adverse foreignmarket conditions led to economic slowdown and evendepression. All five major economic depressions in the20th century can be directly related to changes in thefortunes of the fishing sector, either wholly or partially(Agnarsson and Arnason, 2003).
The first of these major depressions covers the period ofthe First World War, which had catastrophic effects onIceland, as it did on many other European countries.The first two years of the war were favorable for thefishing sector however, as increased demand pushed upforeign prices, but in 1916 the international trade struc-ture broke down and Iceland had to accept harsh termsof trade with the Allies. In 1917, Iceland was forced tosell half its trawler fleet to France.This led to substan-tially reduced demersal fish and herring catches in 1917and 1918.The result was a sharp drop in GDP and adepressed economy until 1920 (Fig. 13.17).
The effects of the “Great Depression” were first felt inIceland in autumn 1930, and in the following two yearsGDP fell by 0.5% and 5% respectively as demand formaritime exports declined sharply. Following a briefrecovery, the economy was hit again when the SpanishCivil War broke out in 1936 and closed Iceland’s mostimportant market for fish products. Despite these
722 Arctic Climate Impact Assessment
events, economic growth still averaged 3% in the1930s, mostly because of strong rebound in the fish-eries, especially the herring fisheries, in 1933 to 1939.The strong performance of the fisheries in the 1930sappears to be the reason that the “Great Depression”was felt less in Iceland than most other countries ofWestern Europe.
The Second World War was a boom period for Icelandled by good catches and very favorable export prices.But in 1947 and subsequent years, herring catches fellconsiderably and real export prices subsided from thehigh wartime levels.The result was a prolonged eco-nomic recession from 1949 to 1952.
During the 1960s, the economy grew at an average rateof 4.8%.This was largely due to very good herring fish-eries.When the herring stocks collapsed toward the endof the decade the result was a severe economic depres-sion in 1968 and 1969, when the GDP declined by 1.3%and 5.5% respectively. Unemployment reached over 2%– a great shock for an economy used to excess demandfor labor since the 1930s – and many households movedabroad in search of jobs. Net emigration amounted to0.6% of the total population in 1969 and 0.8% in 1970.
High economic growth resumed between 1971 and1980 with annual rates averaging 6.4%. However, just asduring the 1960s, this growth was to a significant extentbased on overexploitation of the most important fishstocks. Reduced fishing quotas and weak export pricesreduced fishing profitability in the late 1980s. And, part-ly as a consequence of this, the Icelandic economy wasstagnant between 1988 and 1993, with an average annualdecline in GDP of 0.12%.
Since 1993, the Icelandic economy has shown steady andimpressive annual growth rates. One reason for this is arecovery of some fish stocks. More important, however,are more favorable fish export prices and the impact ofthe individual transferable quota (ITQ) system.The ITQsystem has enabled the fishing industry to increase andstabilize profits and more easily adjust to changing quo-tas and fish availability.
Thus, over the 20th century as a whole, it appears thatmajor fluctuations in the Icelandic economy largelyreflect changes in the fortunes of the fishing industryboth in terms of harvest quantity and output prices.This implies that possible changes in fish stocks due toclimate change may have similar macro-economiceffects. However, it is very likely the macro-economicimpact of any given change in fish availability will besmaller in the future than in the past. First, because theimportance of the fishing industry for the Icelandiceconomy has declined substantially, and second,because the ITQ system has probably made the fishingindustry more capable of adapting to changes in fishstocks. However, it must be noted that if the currentdepressed state of some of the most important fishstocks persists, adverse environmental changes mayactually translate into larger biological shocks thanthose experienced in the past.
Greenland
Greenland does not offer the same overwhelming evi-dence of the national economic importance of the fish-ing industry as Iceland.This, however, does not meanthat the economic importance of the Greenland fishingindustry is any less than in Iceland. In fact it is probablymuch greater.
First, the Greenland fishing industry developed muchlater than that in Iceland.Thus, the Greenland fishingactivity was relatively insignificant over the first half ofthe 20th century (see Fig. 13.9) even when compared tothe rest of the Greenland economy. Second, being basedon underexploited fish stocks, the Greenland fishingindustry expanded relatively smoothly until the 1980s,resulting in far fewer of the dramatic fluctuations in fish-eries output experienced in Iceland.Third, the Green-land economic statistics are less comprehensive than inIceland, meaning fewer data.
Since 1970, there have been two major cycles inthe Greenland economy (Fig. 13.18) both associatedwith changes in the fishing industry, more preciselythe cod fishery.
Fig. 13.18. GDP growth in Greenland, 1975–1999: showingmajor depressions (Anon, 2000).
Fig. 13.17. GDP growth in Iceland, 1901–2000: showing majordepressions (Agnarsson and Arnason, 2003).
Chapter 13 • Fisheries and Aquaculture 723
Historically, the cod fishery has been Greenland’s mostimportant fishery (although this has now been super-ceded by the shrimp fishery).The cod fishery under-went a major expansion in the latter half of the 1970sdue to reduction in foreign fishing following the exten-sion of the Greenland fisheries jurisdiction to200 nm and a greatly expanded Greenland fishingeffort.This led to a period of good economic growththat reversed abruptly in 1981 with a major contractionof the cod fishery due to a combination of overfishingand low export prices.The subsequent period of eco-nomic depression lasted for three years during whichthe GDP decreased by 9% per year. Another short-livedboom in the cod fishery from about 1985 led to a cor-responding boom and bust cycle in the economy with afive-year growth period followed by a sharp depressionlasting four years during which GDP decreased by over20%. Economic growth resumed in Greenland in 1995,not on the basis of cod, which has not reappeared, butshrimp fishing which expanded very rapidly during thelatter half of the 1990s.
As in Iceland, historical evidence indicates a close con-nection between fluctuations in GDP and variations inthe Greenland fishing industry.
13.3.5.2.The economic and social role of fisheries
Iceland
The relative importance of the fishing industry in theIcelandic economy seems to have peaked before themiddle of the 20th century. Since then, both the shareof fish products in merchandise exports and the fractionof the total labor force engaged in fishing have declinedsignificantly. In 2000, the fishing industry employed 8%of the labor force, accounted for 63% of merchandiseexports, and generated 42% of export earnings.Total export value of fish products in 2000 was aboutUS$ 1220 million.
National accounts estimates of the contribution of thefishing industry to GDP – available since 1980 – confirmthis trend.Thus, in 1980 the direct contribution of thefishing industry to GDP was over 16%. In 2000, this haddropped to just over 11%, which corresponds to anadded US$ 900 million.
These aggregate statistics will understate the real contri-bution of the fishing industry to the Icelandic economy.There are two fundamental reasons for this.The first isthat there are a number of economic activities closelylinked to the fishing industry but not part of it.Thesecomprise the production of inputs to the fishing indus-try, the so-called “backward linkages”, and the varioussecondary uses of fish products, the so-called “forwardlinkages” (Arnason, 1994).The backward linkagesinclude activities such as shipbuilding and maintenance,fishing gear production, the production of fishing indus-try equipment and machinery, the fish packaging indus-try, fisheries research, and education.The forward link-
ages comprise the transport of fish products, the pro-duction of animal feed from fish products, the marketingof fish products, and retailing of fish products. Accordingto Arnason (1994), these backward and forward linkagesmay add at least a quarter to the direct GDP contribu-tion of the fishing industry.
The other reason why the national accounts may under-estimate the contribution of the fishing industry to GDPis the role of the fishing industry as a disproportionatelystrong exchange earner.To the extent that the availabilityof foreign currency constrains economic output, theeconomic contribution of a disproportionately strongexport earner may be greater than is apparent from thenational accounts.While the size of this “multipliereffect” is not easy to measure, some studies suggest itmay be quite significant (Agnarsson and Arnason, 2003;Arnason, 1994). If this is the case, the total contributionof the fishing industry to GDP may be much higher thanestimates suggest, in the sense that removing the fishingindustry would, with all other things remaining thesame, lead to this reduction in GDP.
There are also economic reasons as to why a change inthe conditions of the fishing industry due, for example, toclimate change, might have a lesser economic impact thansuggested by the direct (and indirect) contribution of thefishing industry to GDP. Most economies exhibit someresilience to exogenous shocks.This means that the initialimpact of such shocks is at least partly counteracted bythe movement of labor and capital to economic activitiesmade comparatively more productive by the shock.Thus,a negative shock in the fishing industry would to a certainextent be offset by labor and capital moving from thefishing industry to alternative industries and vice versa.Thus, the long-term impact of such a shock may be muchless than the initial impact.The extent to which this hap-pens depends on the availability of alternative industries.However, with increased labor mobility, communicationtechnology, and human capital this type of flexibility isprobably much greater than in the past.
Regional importance
Analysis in terms of macro-economic aggregates doesnot take into account that the economic importance ofthe fishing industry varies from one region of the coun-try to another. In 2000, when the fishing industry (har-vesting and processing) employed only about 8% of the
Labor share of thefishing sectors (%)
Number ofcommunities
Number ofinhabitants
Percentage oftotal population
>40 24 12812 7.7
25–40 16 23063 8.6
10–25 14 36959 13.7
5–10 16 26832 10.0
<5 54 161922 60.1
Table 13.1. The importance of the fishing sectors to Icelandiccommunities in 1997.
724 Arctic Climate Impact Assessment
national workforce, it provided jobs for over 35% of theworking population in the western fjords and almost30% of the working population in the eastern fjords.Both regions are sparsely populated and account for onlya small proportion of the total Icelandic population.Near the capital, Reykjavík, where most of the alterna-tive industries such as manufacturing and services arelocated, the fishing industry employed only about 3% ofthe working population.
The local importance of the fishing industry is even moreapparent at the community level. In 1997, the fishingindustry accounted for over 40% of the local employ-ment in 24 out of a total of 124 municipalities in Iceland(Table 13.1). A typical example of a community totallydependent on fishing is Raufarhofn, a small community of400 inhabitants in northeast Iceland. Almost 70% of theadult population worked in the fishing industry in 1997.In four other communities the fishing industry accountedfor over 60% of total employment in 1997.
By contrast, in 54 communities the fishing industryaccounted for less than 5% of total employment. Most ofthe largest municipalities in Iceland belong to this group.It is mainly the smaller, economically less developed com-munities that depend heavily on fisheries (see Table 13.1).
Thus, the effects of a significant reduction in fish avail-ability around Iceland, or the benefits of fisheries expan-sion would be differently felt in the various regions andcommunities of Iceland. In general terms, a significantreduction in fish availability is liable to be economicallyand socially disastrous for the western and eastern fjordregions and for certain other smaller regions of Iceland,while in the more densely populated southwest ofIceland such a reduction would be felt mainly as anincreased influx of labor from the outlying regions andthe corresponding realignment of economic activity.
Although labor mobility is high in Iceland, it may not beeasy for inhabitants of fishing villages to find jobs else-where following a decline in fisheries due to climatechange, especially if the economy is already depressed.Also, as many of the employment opportunities in andaround the capital require particular education and train-ing, individuals transferring from the fishing industrymay have to accept relatively inferior jobs. At the sametime, reduced employment and movement out of thefisheries-dependent regions and communities of Icelandwill decrease real estate values in these areas, meaningthat these migrants may have to suffer a significantdecrease in the value of their assets at the same time asmoving to seek new employment.
Thus, a significant reduction in the Icelandic fishingindustry would lead to noticeable social disruption.However, given the nature of Icelandic society, it wouldprobably be resolved within five to ten years of the ini-tial shock, although the disruption would impose a cer-tain stress on the social and political system during thisperiod of adjustment.
Greenland
The fishing industry is by far Greenland’s most impor-tant production sector. In the 1960s and early 1970sfish and fish products accounted for between 80 and90% of Greenland’s total export value. In 1974, therewas a very large increase in the export of lead and zinc,which increased GDP by about 50% and caused fish andfish products to fall to between 60 and 70% of totalexport value.The export of lead and zinc ceased in1990. Since then, export of fish and fish products hasaccounted for about 90% of Greenland’s total exportvalue. In 2000, the export value of fish and fish prod-ucts was about US$ 270 million and the total exportvalue about US$ 285 million.
Exact statistics about the direct contribution of the fish-ing industry to the Greenland GDP are not available.However, the contribution to the gross national income(GNI) may be as high as 20%.This, however, does nottell the complete story. Greenland is part of Denmarkwith a “Home Rule” government.This means thatGreenlanders can decide their own policies, except forforeign and defense policy. Every year, the Home Rulegovernment receives economic support from theDanish State. In 2000 this amounted to about US$ 350million or almost 25% of GNI. Correcting for this indi-cates a direct contribution of the fishing industry to theGreenland GDP of 25 to 30%.
As for Iceland, however, the fishing industry also has anindirect contribution to the Greenland economy viaforward and backward linkages as well as multipliereffects. Adding these may bring the total contributionof the fishing industry to the Greenland economy as awhole to over 50%.
Regional importance
Greenland as a whole is highly dependent on the fish-ing industry.This is even more the case in less populat-ed communities along the coast. About 20% of Green-land’s population lives in small villages and settlementswith an average population of about 150 inhabitants.Many more live in small towns with less than a thou-sand inhabitants.The economic activity in these com-munities is almost exclusively based on the exploitationof living marine resources, i.e., through fishing andhunting. Also, the geographical isolation of many ofthese communities means alternative employmentopportunities are few if any.
Thus, a significant drop in the fish stocks and otherliving marine resources would have a devastatingimpact on these communities. Most would decreasesignificantly and many would disappear altogether,causing those inhabitants that left to become economi-cally and socially dispossessed. A secondary effectwould be the substantial influx of these people to themore urban areas of Greenland and the problems thatthis would cause.
Chapter 13 • Fisheries and Aquaculture 725
A significant increase in the stocks of fish and other liv-ing marine resources would cause the reverse effect andwould strengthen the economic basis of Greenland’ssmaller communities.While larger towns may benefitdisproportionately from such a change, the net effectwould probably be to increase population in the smallercommunities and to expand the geographical extent ofhabitation in Greenland.
13.3.6. Economic and social impacts ofclimate change: possible scenarios
From an economic point of view, climate change mayimpact on fisheries in at least two ways: by altering theavailability of fish to fishers and by changing the priceof fish products and fisheries inputs. Although bothtypes of impact may be initiated by climate change, theformer is a more direct consequence of climate changethan the latter.
The possible impact of climate change on fish availabilitymay occur through changes in the size of commercialfish stocks, changes in their geographical distribution,and changes in their catchability.These changes, if theyoccur, will affect the availability of fish for commercialharvesting.The direction of this impact is uncertain.It may be negative, and so reduce the maximum sustain-able economic yield from the fish stocks, or positive, andso increase the maximum sustainable economic yieldfrom the fish stocks. Also, the impact may vary for dif-ferent fish stocks and for different regions. Irrespectiveof the direction of the impact, however, it is very likelythat climate change will, at least temporarily, causeinstability or fluctuations in harvesting possibilities whileecosystems adjusts to new conditions.The adjustmentperiod may be long, and may even continue after theperiod of climate change has ended.
The same applies to changes in economic value in thatrelative prices may continue to adjust after an exogenousshift, such as climate change, has been resolved. In fact,economic adjustments following climate change, beingdependent on biological/ecological adjustments, will bynecessity continue after the latter are complete.
This section speculates on the possible economic andsocial impacts in Iceland and Greenland of changes infish availability.The possible impacts of relative pricechanges are not discussed. However, the economic andsocial impacts of price changes will be similar to those ofchanges in fish stock availability. In terms of drawinginferences from historical evidence, it is not importantwhether expansions and contractions in the fishingindustry result from changes in prices or fish availability.
Empirical evidence of possible economic impacts ofchanges in fish stock availability is either qualitative his-torical evidence or quantitative evidence. Qualitativeevidence (discussed in section 13.3.5.1) relates econom-ic fluctuations to qualitative evidence of expansions andcontractions in the fishing industry. Quantitative evi-
dence, in the form of time series for fisheries productionand production values, provides a basis for statisticalestimates of the relationship between the productionvalue of the Icelandic and Greenland fishing industriesand their respective GDP and Gross National Product(GNP) growth.
13.3.6.1. Iceland
Reliable time series data for the output and output valueof the fishing industry are available since 1963.Thesedata have been used to estimate the form and parametersof a relationship between economic growth rates and theoutput value of the fishing industry as well as other rele-vant economic variables such as capital and labor(Agnarsson and Arnason, 2003).The equation exhibitsgood statistical properties and actual and fitted GDPgrowth rates are illustrated in Fig. 13.19.
This equation can, with certain modifications, be used topredict the short- and long-term impact of a change infish stock availability due to climate change. It is impor-tant to realize, however, that to use this equation it isnecessary to project (1) the extent and timing of climatechange, (2) the impact of global climate change on fishstock availability, and (3) the impact of changed fishstock availability on the value of fish production (whichinvolves both the volume and price of fish production).
Impact on GDP
This section presents the outcome of calculations to esti-mate the possible impact on GDP of changed fish stockavailability as a result of climate change.The impact ofother variables on the value of fish production isignored.The calculations are based on two key factors:the impact of future climate change on the value of fishproduction in Iceland and the estimated relationshipbetween economic growth and the value of fish produc-tion (see Agnarsson and Arnason, 2003). Both are highlyuncertain.Thus, the following calculations must not beregarded as predictions.They are intended to serve as
Fig. 13.19. GDP growth in Iceland, 1966–1997: actual and fittedvalues.
726 Arctic Climate Impact Assessment
indications of the likely magnitudes of the impact onGDP in Iceland resulting from certain stated premisesregarding changes in fish stock availability.
Available projections (see section 9.3.4.4) suggestthat climate change over the next 50 to 100 years is(1) unlikely to have a great impact on fish stock avail-ability in Icelandic waters and (2) is very likely tobenefit the most valuable fish stocks. As a result, theoverall effects of climate change on the Icelandic fish-eries are likely to be positive. As these expectationsare very uncertain, the rest of this section illustratesthis point using three scenarios.
The first scenario assumes a gradual increase in fishstock availability of 20% over a period of 50 years.This is known as the “optimistic” scenario and corre-sponds to a 0.4% increase in the value of fish produc-tion annually.The second scenario assumes a gradualreduction in fish stock availability of 10% over 50years.This is known as the “pessimistic” scenario andcorresponds to an annual reduction in the value of fishproduction by 0.2%.The third scenario assumes a 25%reduction in fish stock availability over a relativelyshort period of five years.This corresponds to acollapse in the stock size of one major species or agroup of important commercial species. In fact, thereare some indications that the response of fish stocks toclimatic change may be sudden and discontinuousrather than gradual. Owing to the magnitude andsuddenness of this reduction it is known as the“dramatic” scenario.
These scenarios illustrate the likely range of economicimpacts of climate change around Iceland. In interpret-ing their outcomes it is important to remember thatthese scenarios are restricted to the impact of climatechange assuming all other variables affecting fish stocksand their economic contribution are unchanged.Theseoutcomes do not incorporate the possibly simultaneousimpact of improved fisheries management or other vari-ables affecting the size of fish stocks and the value of thefisheries. In fact, given the currently depressed state ofmany of the most valuable fish stocks in Iceland, a bet-ter harvesting policy may easily contribute at least asmuch to the overall economic yield of the fisheries asthe most optimistic climate scenario. However, such apolicy will also improve the outcomes of the more pes-simistic climate scenarios.
Optimistic scenario
In the optimistic scenario, fish stock availability isassumed to increase in equal steps by 20% over the next50 years.The impact of this scenario on GDP relative toa benchmark GDP of unity is illustrated in Fig. 13.20.The figure illustrates that this quite considerableincrease in fish stock availability has only a relativelyminor impact on GDP.The maximum impact occurs inyear 50, when increased fish stock availability has fullymaterialized. At this point GDP has increased (com-
pared to the initial level) by less than 4%.The long-term impact, after economic adjustment processes arecomplete, is even less at around 2.5%.The largestannual increase in GDP is small at under 0.2%, and issubstantially less than the GDP measurement error.Thus it would be hardly noticeable. In the years follow-ing the end of the increase in fish production, growthrates decline as production factors (which move to thefishing industry) reduce economic production else-where. Long-term GDP growth rates are, of course,unchanged.The main conclusion to be drawn is that a20% increase in the output of the fishing industryequally spread over 50 years has a very small, hardlynoticeable, impact on the short-term economic growthrates in Iceland as well as on long-term GDP.
Pessimistic scenario
In the pessimistic scenario, fish stock availability isassumed to decrease in equal steps by 10% over thenext 50 years.The impact of this scenario on GDPrelative to a benchmark GDP of unity is also illustratedin Fig. 13.20. As in the optimistic scenario, it is appar-ent that this considerable decrease in fish stock avail-ability has a relatively minor impact on long-termGDP.The maximum impact also occurs in year 50, atwhich point GDP has been reduced by less than 2%.The long-term impact, after economic adjustmentprocesses are complete, is even less or just over 1%.The largest annual decrease in GDP is well over-0.1%.This occurs a few years after the decrease infish stock availability begins. For most of the period,however, the impact on annual economic growth ratesis much less. In the years following the end of thedecrease in fish production, growth rates improve, asproduction factors (which move from the fishing indus-try) find productive employment elsewhere. All thesedeviations in annual GDP growth rates are well withinGDP measurement errors. Long-term GDP growthrates are, of course, unchanged. As under the opti-mistic scenario, the main conclusion to be drawn isthat a 10% decrease in output from the fishing industryequally spread over 50 years has a negligible impact onthe short-term economic growth rates in Iceland aswell as on long-term GDP.
Fig. 13.20. Iceland: impact of different scenarios on GDP(benchmark GDP = 1.0).
Chapter 13 • Fisheries and Aquaculture 727
Dramatic scenario
The dramatic scenario assumes a fairly substantial dropin fish stock availability and, hence, fish production of25% over the next five years.The impact of the dramat-ic scenario on GDP relative to a benchmark GDP ofunity is illustrated in the lowest curve in Fig. 13.20.This sudden drop in fish stock production has a signifi-cant negative impact on GDP in the short term. At itslowest point, in year eight, GDP is reduced by over 9%(compared to the initial level).The long-term negativeimpact, after economic adjustment processes are com-plete, is only about a 3% reduction in GDP.Thedecrease in annual GDP growth rates for the first sevenyears following the start of reduced fish stock produc-tion are significant or -1 to -2%.The maximum declineoccurs toward the end of the reduction process in yearsfour and five. However, only four years later, the con-traction ends, and the deviation in annual GDP growthrates is reversed as production factors released from thefishing industry find productive employment elsewhere.According to these calculations, this adjustment processis complete by year 25 when growth rates have revertedto the underlying economic growth rate.
Social and political impacts
If the change in fishing industry output is gradual andthe economic impact comparatively small (as in the“optimistic” and “pessimistic” scenarios), it is unlikelythat the accompanying social and political impacts willbe noticeable at a national level. Although over the longterm, social and political impacts will undoubtedlyoccur, whether these will be large enough to be distin-guished from the impact of other changes is uncertain.Regionally, however, the situation may be very differ-ent. In some parts of Iceland (see section 13.5.2) theeconomic and social role of the fishing industry is farabove the national average. In these areas, the econom-ic, social, and political impact of an expansion or con-traction in the fishing industry will be much greaterthan for Iceland as a whole and in some areas undoubt-edly quite dramatic.
If, on the other hand, the change is fairly sudden (as inthe “dramatic” scenario) the short-term social and polit-ical impact may be quite drastic. In the long term, how-ever, after the initial impact, social and political condi-tions will revert to the long-term scenario described bythe “pessimistic” scenario.Whether the economic andsocial adjustments will then also revert to their initialstate is not clear.
Impacts on fish markets
Reductions or increases in fish production in Icelandalone will not have a significant impact on global fishmarkets. Neither are they likely to have a large impacton the marketing of Icelandic fish products, providedthe changes are gradual. If there is an overall decline inthe global supply of species of fish that Iceland currently
exploits, the impact on marketing of these species isuncertain. Almost certainly the marketing of the speciesin reduced supply will become easier.Thus, prices willrise counteracting the decrease in volume. However, themarketing impact might actually be the opposite.For some species, a large and steady supply is requiredto maintain marketing channels. If this is threatened,these channels may close and alternative outlets willhave to be found.
Discussion
The main conclusion to be drawn is that the changes infish stock availability that seem most likely to be inducedby climate change over the next 50 to 100 years areunlikely to have a significant long-term impact on GDPin Iceland and, consequently, on social and political con-ditions in Iceland. Also, it appears that any impact, smallas it may be, is more likely to be positive than negative.However, if on the other hand, climate change results insudden rather than gradual changes in fish stock avail-ability, the short-term impact on GDP and economicgrowth rates may be quite significant.The impact seemsvery unlikely to be dramatic (i.e., over 5% change inGDP between years) however. Over the long term, theimpact on GDP of a sudden change in fish stocks will beindistinguishable from the effects of more gradualchange. Long-term social and political impacts may dif-fer although there is no clear evidence to support this.
13.3.6.2. Greenland
Reliable time series data for the export value of theGreenland fishing industry are available since 1966.Thesedata have been used to estimate the form and parametersof a relationship between GDP and the real export valueof fish products (Vestergaard and Arnason, 2004).Theequation exhibits reasonable statistical properties. Actualand fitted GDP growth rates according to this equationare illustrated in Fig. 13.21. It is projected that a 1%increase in the export value of fish products will lead to a0.29% increase in the Greenland GDP. Subject to thesame qualifications as for Iceland, this equation can be
Fig. 13.21. GDP in Greenland, 1970–1999: actual and fitted values.
728 Arctic Climate Impact Assessment
used to predict the economic impact of a change in fishstock availability resulting from climate change.
Impact on GDP
Available projections (see section 9.3.4.4 and sections13.3.3.3, 13.3.3.4, and 13.3.4.1 to 13.3.4.3) suggestthat climate change over the next 100 years is very likelyto benefit the most valuable fish stocks at Greenland.This is particularly likely to be the case for the codstock, which could experience a revival from its currentextremely depressed state to a level, seen during warmperiods of the 20th century, where it could yield up to300000 t on a sustainable basis. However, climatechange and increased predation by cod could lead to adramatic fall in the sustainable harvest of shrimp by upto 70000 t (Fig. 13.22).The value of the increased codharvest would, however, greatly exceed losses due to apossibly reduced harvest of shrimp. In fact, this changecould lead to doubling or even tripling of the total pro-duction value of the Greenland fishing industry.Thus,the projected climate change could have a major positiveimpact on the Greenland fishing industry. However, thisis highly uncertain. As was the case for Iceland this sec-tion continues on the basis of three scenarios.
The first scenario, termed the “pessimistic” scenario,assumes that despite more favorable habitat conditions,cod will not reestablish permanently in Greenlandwaters. Instead, there will be periodic bursts of codavailability accompanied by a corresponding drop inshrimp, based on occasional large-scale larval drift fromIceland similar to that seen in warmer periods in thepast.The overall impact will be a slight average increasein fish harvests with some peaks and troughs.The sec-ond scenario, termed the “moderate” scenario, assumesa modest and gradual return of cod to Greenland whichin 20 years would be capable of yielding 100000 t peryear on average.This would be accompanied by a corre-sponding decline in the shrimp stock.The third sce-nario, termed the “optimistic” scenario, assumes areturn of the Greenland cod stock, initially generatedby Icelandic cod larval drift, to the levels of the 1950s
and 1960s. A full revival, however, would take somedecades and would occur in a fluctuating manner.Ultimately, in about 30 years, the cod stock would becapable of producing an average yield of 300000 t peryear, compared to almost nothing at present.The aver-age shrimp harvest, however, would be reduced from acurrent level of almost 100000 t per year to about20000 t per year. Nevertheless, the overall value of theGreenland fish harvest would almost double.These sce-narios illustrate the likely range of economic impacts ofclimate change around Greenland.The harvest projec-tions are all based on a two-species fisheries modeldeveloped for the Greenland fisheries (Hvingel, 2003).
Pessimistic scenario
The pessimistic scenario assumes an insubstantial changein overall average fish stock availability. However, due tothe occasional large-scale influx and survival of Icelandiccod larvae, periodic bursts in cod availability occur.Thissituation results in fluctuating fish production rates andGDP impacts over time (see lowest curve in Fig. 13.23)with a small average increase.The average increase inGDP after 50 years is about 2% higher than would oth-erwise have been the case.
Moderate scenario
In the moderate scenario, fish stock availability isassumed to increase gradually by about 20% over thenext 100 years.The impact of this scenario on GDP rela-tive to a benchmark GDP of unity is shown by the mid-dle curve in Fig. 13.23.This increase in the availability offish leads to a moderate long-term increase in GDP of6% (compared to the initial level). However, as most ofthis increase is projected to occur over the first ten years(in fact the initial impact is projected to be greater thanthe long-term impact) there would be a significant addi-tion to GDP of 1% per year during this initial period.
Optimistic scenario
In the optimistic scenario, fish stock availability isassumed to increase gradually, but in a fluctuating man-
Fig. 13.23. Greenland: impact of different scenarios on GDP(benchmark GDP=1.0).
Fig. 13.22. The history and possible future development of codand shrimp harvests in Greenland under global warming(Hvingel, in prep).
Chapter 13 • Fisheries and Aquaculture 729
ner, by about 100% over the next 50 years.The pro-jected relationship between the value of fish exportsand GDP suggests that this will lead to an ultimateincrease in GDP of 28% compared what would other-wise have been the case.This impact relative to abenchmark GDP of unity is illustrated in Fig. 13.23.Such an impact would be very noticeable.The additionto economic growth would be close to 0.8% per yearover the first 30 years but would then decrease, stop-ping after 40 years.
Social and political impacts
If the optimistic scenario were to occur and theincreased cod harvest was mainly caught and processedby Greenlanders there would be a dramatic improvementin the Greenland unemployment/underemployment situ-ation and in the income of the large group of self-employed small-boat fishers/hunters. Everything elsebeing the same, the current high level of unemploymentwould disappear and the total income of many familieswould increase markedly.This would have a major socialimpact in Greenland. Cod fishing of the magnitude pro-jected under the optimistic scenario might easily lead tothe establishment of large-scale fish processing factoriesin the more densely populated regions of Greenland.
Under the pessimistic and moderate scenarios employ-ment and consequently social impact would be far moremoderate, especially if the changes appeared graduallyover a long period. If, however, the change is sudden(as in the “dramatic” scenario for Iceland), short-termsocial and political impacts may be drastic.
Discussion
The likely impacts of the possible changes in fish stockavailability in Greenland waters resulting from climatechange cover a wider range than for Iceland. At oneextreme, they could lead to a 30% increase in GDP,while at the other extreme the impact on GDP could benegligible.This range in outcomes reflects (1) thegreater importance of the fisheries sector in Greenlandcompared to Iceland and (2) that during warm periodsthe very large marine habitat around Greenland canaccommodate a biomass of commercial species which ismany times greater than that at present. Since the arcticinfluence is more pronounced in the Greenland marineenvironment than in that around Iceland, it follows thatimpacts resulting from a moderate climate change, if itoccurs, are very likely to be more dramatic in themarine environment around Greenland.
13.3.7. Ability to cope with change
Climate change will almost certainly lead to changesin the relative sizes, biological productivity, andspatial distribution of commercial fish stocks. Thesechanges may be predominantly advantageous or pre-dominantly disadvantageous. They may be sudden ormay emerge gradually.
The economic and social impacts of changes in fish stockavailability depend on the direction, magnitude, andrapidity of these changes.The economic and socialimpacts also depend, possibly even more so, on the abili-ty of the relevant social structures to adapt to alteredconditions. Good social structures facilitate fast adjust-ments to new conditions and thus mitigate negativeimpacts.Weak or inappropriate social structures exhibitsluggish and possibly inappropriate responses and thusmay exacerbate problems resulting from adverse envi-ronmental changes.
One of the most crucial social structures in this respectis the fisheries management system.This determines theextent to which the fisheries can adapt in an optimalmanner to new conditions. Other important socialstructures relate to (1) the adaptability of the economicsystem – especially price flexibility, labor education andmobility, and the extent of economic entrepreneurship;(2) the ability to adjust macro-economic policies; and(3) the extent and nature of the social welfare system.These structures influence the form of the necessaryadjustments to new conditions, for example whetherthey are smooth and quick or difficult and long-term.
The Icelandic fisheries management system is based onpermanent harvest shares in the form of ITQs and so isinherently forward-looking and thus probably well-suited to adjust optimally to changes in the availabilityof fish, especially if these changes are to an extent fore-seen. For any time path of fish stock productivity, ITQ-holders have a strong incentive to maximize the expect-ed present value of the fishery as this will also maximizetheir expected wealth. As a result, there is a high likeli-hood that TACs and other stock size determinants willbe adjusted optimally to altered conditions. In otherwords, with the Icelandic fisheries management system,there is little chance that the fishing activity will exacer-bate a negative biological impact arising from climatechange. Also, the opportunities generated by a positivebiological impact will probably be close to fully exploit-ed by the fishing sector. In Greenland, however, fishers’rights to harvest shares are considerably weaker. As aresult, Greenland seems less prepared than Iceland toadapt in an economically efficient manner to changedfish stock availability.
For the other relevant social structures, it also appearsthat those in Iceland are well-suited to facilitating adjust-ment to adverse environmental changes. First, Icelandicsocial structures are used to having to adapt to quite dras-tic fluctuations in the economy (see section 13.3.5.1),which implies that these institutions have evolved to copewith such fluctuations. Second, labor education andmobility is high in Iceland. High labor mobility refers tolabor movements within Iceland as well as to betweenIceland and other countries.This means that negativeregional impacts resulting from climate change areunlikely to lead to permanently depressed unemploymentareas or even persistent national unemployment.Third,the level of private and commercial entrepreneurship is
730 Arctic Climate Impact Assessment
high in Iceland.This suggests that in the case of negativeimpacts, economic substitute activities are likely to bequickly spotted and exploited. Fourth, there is an exten-sive social welfare system in Iceland that would provide atleast temporary compensation to individuals adverselyaffected by environmental change. Although this social“safety net” will tend to delay adjustments to new condi-tions, it will also ensure that the burden of adversechanges is shared among the total population and so pre-vents individual hardship.
Thus, broadly speaking, it appears that Icelandic socialstructures are well suited to cope with sudden changesin fish stock availability resulting from climate change.This means that adjustments to changes are likely to befast and smooth. Adverse environmental changes willnevertheless be economically and socially costly.However, they are unlikely to be exacerbated by socialand economic responses. On the other hand, althoughthe Icelandic economy seems well prepared to deal withchanges in fish stock availability, an adverse biologicalimpact may be felt more strongly than in the past.This isbecause some of the most valuable commercial stocksare currently close to their historical minimum. Hence,if there is an adverse environmental change, the initialreduction in harvests may be more dramatic than previ-ously experienced and, also, the risk of a long-tem stockdepression greater.
The ability of social structures in Greenland to adjust tonew conditions is similar to the situation in Iceland.Greenlanders are used to variable environmental andeconomic conditions. Although perhaps not at the levelof Iceland, general education and labor training is alsohigh in Greenland. However, partly due to the size ofGreenland and the isolation of many communities, labormobility is considerably less than in Iceland. Mostimportantly, however, the degree of private and com-mercial entrepreneurship in Greenland seems much lessthan in Iceland.
Thus, while the Greenland social structure and institu-tions seem reasonably well placed to adjust to thechanges in fish stock availability that might result fromclimate change, they presently appear less suited in thisrespect than those in Iceland.
13.3.8. Concluding comments
The ecosystems of Iceland and Greenland are very dif-ferent. Icelandic waters occur to the south of the PolarFront under normal circumstances and are thereforeunder the influence of warm Atlantic water. Greenlandwaters are dominated by the cold East GreenlandCurrent.This difference is reflected in higher numbersof exploited species at Iceland than at Greenland wherethere is also a dominance of arctic species of plankton,commercial invertebrates, and fish.
Both ecosystems were subject to large climatic changesin the 20th century. After a prolonged period of cold
conditions (lasting several decades), a warm periodstarted around 1920 and peaked in the 1930s.Conditions were cooler in the 1940s, but warmedagain and stayed warm for several years.There was asudden cooling associated with decreased salinity andsevere ice conditions in the mid-1960s.These changesreverberated around the North Atlantic at least twiceduring the next two decades. Conditions improved atIceland in 1972 but remained variable for the next twoand a half decades. Since the late 1990s, conditionshave been persistently warmer at Iceland and evenmore so off West Greenland.
The warming of the 1920s and the early 1930s was fol-lowed by spectacular changes in the fish fauna ofIcelandic and, in particular, Greenlandic waters. Cod andherring began to spawn in large numbers off the northcoast of Iceland in addition to the traditional spawningareas in the Atlantic water off the south and west coasts.For some years, capelin were absent from their usualspawning areas to the south and west of Iceland, butspawned instead off southeast Iceland as well as in fjordsand bays on the north and east coasts. Despite searchesby Danish biologists and fishers, almost no cod werefound to the south and west of Greenland between 1900and 1920. However, after 1920 cod began to appear inincreasing numbers in these areas and in the 1930s a codfishery off West Greenland yielded on average about100000 t per year.This change is attributed to a massivedrift of 0-group cod from Iceland across the northernIrminger Sea to the east and then west of Greenland.
Other changes associated with the warm period weremanifested in a regular appearance of more southerlyspecies such as mackerel and tuna at Iceland, whilecold-temperate species such as haddock, saithe, andherring became fairly common at Greenland. In thelatter case, cod extended their distribution northwardto the west of Greenland for hundreds of kilometers toDisco Bay. Likewise, the center of capelin distributionshifted from off southwest Greenland to the Disco Bayarea and the northern limit of their distributionreached as far as Thule.
Although many of the cod which had drifted across toGreenland as juveniles returned to spawn in theirnative areas off south and west Iceland, many did not,but spawned instead off West Greenland and eventuallygave rise to a self-sustaining Greenlandic cod compo-nent.The Greenland cod were very successful for anumber of decades and eventually formed a large localstock that supported catches in the hundreds of thou-sands of tonnes.
The cooling of the mid-1960s had a devastating effect,both at Iceland and Greenland.The spawning of cod atGreenland seems to have ceased completely and the stockcrashed. At Iceland, the zooplankton community in thenorth and east changed from an atlantic to an arctic type.The most drastic effect was the disappearance of theNorwegian spring-spawning herring (the largest known
Chapter 13 • Fisheries and Aquaculture 731
herring stock in the world) from its traditional feedingareas north of Iceland. In the following years the herringfed further east in the Norwegian Sea until the stockcrashed in the late 1960s.The two local and much small-er Icelandic herring stocks suffered the same fate.Thesestocks were all subject to a large fishing pressure in the1960s.While the collapses in the herring stocks can betraced to exploitation beyond sustainable levels, this isnot the case for the Greenland cod stock. Although thestock was also heavily fished, and its downfall acceleratedby the fishery, evidence suggests that cod cannot repro-duce effectively at Greenland except under warm climat-ic conditions. On the other hand, the low temperaturesof the latter 1960s and relatively cold but variable condi-tions of Icelandic waters since the early 1970s do notseem to have adversely affected the Icelandic cod stock.The relatively low abundance of cod at Iceland at presentappears to be the result of overfishing.
From a socio-economic point of view, climate-drivenchanges in fish abundance at Iceland over the 20th centu-ry had very large effects. In particular, the disappearanceof the Atlanto-Scandian herring had severe consequencesat all levels of society. Iceland lost about half its foreignrevenue from fish products almost instantly, resulting insevere economic depression. However, the depressedstate did not last long.The herring sector of the fisheryquickly targeted other local species and also shifted tofishing herring elsewhere, mainly in the North Sea andadjacent waters.The Icelandic fishery sector also adaptedquickly to various fishing restrictions imposed duringthe last quarter of the 20th century.
The lucrative cod fishery, which started off WestGreenland in the late 1920s and lasted until the stockcollapse in the early 1970s, did not have much effect on
the Greenland economy.This was because the lack ofsuitable vessels and gear, as well as the necessary infra-structure, meant Greenland was unable to benefit fromthese conditions except on a very small scale.
Three scenarios of possible future climate change (nochange, moderate warming (1–3ºC), and considerablewarming (4ºC or more)) were used to examine likelyoutcomes for Iceland and Greenland. Changes in the sizeand distribution of commercial stocks are very unlikelyunder the no-change scenario.Thus, the Greenlandicfishing sector would mainly depend on cold water fishsuch as Greenland halibut and invertebrates such asnorthern shrimp and snow crab. At Iceland, fish speciessuch as Atlantic cod, haddock, saithe, and redfish woulddominate demersal fisheries, while capelin, local her-ring, and possibly blue whiting would dominate thepelagic fisheries. Catches of some species under the no-change scenario could be increased considerably througheffective fisheries management, particularly in Iceland.
Moderate warming is likely to result in quite large posi-tive changes in the catch of many species.Through larvaldrift from Iceland, a self sustaining cod stock is likely tobe established off West Greenland which could yieldannual catches of around 300000 t. If that happens,catches of northern shrimp are likely to decrease toabout 30% of the present level, while catches of snowcrab and Greenland halibut are not likely to alter much.Such changes would probably approximately doublethe export earnings of the Greenland fishing industry,which roughly translates into the sum presently paid byDenmark to subsidize the Greenland economy. Suchdramatic changes are not likely in the Icelandic marineecosystem. Nevertheless, it is likely that there will be anoverall gain through larger catches of demersal speciessuch as cod, and pelagic species such as herring, and newfisheries of more southern species such as mackerel.On the other hand, capelin catches are likely to decrease,both through diminished stock size and the necessity ofconserving this important forage fish for other species.Effective fisheries management is very likely to continueto play a key role for Greenland and Iceland.
Little can be said about potential changes under thescenario of considerable warming.This is because such asituation is outside any recorded experience.
13.4. Newfoundland and Labrador Seas,Northeastern Canada Fisheries in ACIA Region 4 may be subdivided into thosenear the coast of Greenland, those near the coast ofCanada, and those in the deep waters of Baffin Bay andDavis Strait between Greenland and Canada.The wholearea is within the fisheries convention area of NAFO(Fig. 13.24) and the stocks are currently managed by thecoastal state or by NAFO.
Along the northeast coast of Canada the study areaextends southward to the central Grand Bank (46º N) in
Fig. 13.24. Geographical overview of the NortheastCanadian ecosystem.The map also shows the NAFO statistical areas referred to in the text.
732 Arctic Climate Impact Assessment
order to assess climate-driven impacts on marine ecosys-tems that are comparable to those considered for thenortheast Atlantic (section 13.2) and around Iceland(section 13.3).This southward extension reflects thepresence of the Labrador Current, which transports coldwater southward from Davis Strait, the CanadianArchipelago, and Hudson Bay.The median southerlyextent of sea ice is on the northern Grand Bank atapproximately 47º N (Anon, 2001) and bottom watertemperatures on the northern Grand Bank are below0 ºC for long periods.The southerly extent of cold con-ditions is also indicated by the regular presence of polarcod along the northeast coast of Newfoundland and theiroccasional occurrence on the northern Grand Bank(Lilly and Simpson, 2000; Lilly et al., 1994).
Fish has dominated the history of Newfoundland sincethe time of British colonization.The British interest inNewfoundland after its “discovery” during the Cabotvoyage of 1497 was due to the incredibly largeamounts of codfish. Exploitation of this fishery by theBritish reduced its dependence on Iceland for fish, adependence that was creating difficulties.The Frenchalso saw the value of Newfoundland’s fishery, and pos-session of the island became an important part of thecolonial wars of the 18th century (for the historicalbackground of Newfoundland, see Chadwick, 1967;Innis, 1954; Lounsbury, 1934). As an inducement forFrance to enter the revolutionary war on the side ofthe American colonies, Benjamin Franklin offered ashare of the Newfoundland fishery to the French asbounty once the war was won (Burnett, 1941). Indeed,until the late 1800s, when a cross-island railroad wasbuilt, fishing was Newfoundland’s only industry.Therewas then a series of diversification programs, whichhave continued in one form or another until the pres-ent day. Although in the early 1970s Newfoundland hadthe world’s largest hydroelectric plant (in Labrador),and despite many attempts to diversify the economywith both small-scale industries (e.g., cement produc-tion, knitting mills, a shoe factory, a chocolate factory)and numerous large-scale industries (e.g., the ChurchillFalls hydroelectric station, a petroleum refinery, a thirdpaper mill, iron mines in Labrador) in the twenty yearsfollowing Confederation with Canada in 1949, none ofthese made any difference to the dominance of the fish-ery in Newfoundland (Letto, 1998). However, whatdid change in Newfoundland with Confederation, andafter revisions in Canadian federal/provincial intergov-ernmental arrangements, was the emergence ofextremely large government, health, and educationsectors which, as shares of GDP, eclipsed the fishery.By 1971, the fish and fish processing sectors accountedfor less than 5% of Newfoundland GDP. By 2001, theircontribution was 3.5 %.
13.4.1. Ecosystem essentials
The ecosystem off northeastern Canada has been charac-terized by a relatively small number of species, a few ofwhich have historically occurred in high abundance
(Bundy et al., 2000; Carscadden et al., 2001; Livingstonand Tjelmeland, 2000).The dominant fodder fish hasbeen capelin, with polar cod more prominent to thenorth and sand lance (Ammodytes dubius) more prominentto the south on the plateau of Grand Bank. Herring isfound only in the bays and adjacent waters.These fourspecies of planktivorous fish feed mainly on calanoidcopepods and larger crustaceans, the latter predomi-nantly hyperiid amphipods to the north and euphausiidsto the south.The dominant piscivorous fish has beenAtlantic cod, but Greenland halibut and American plaice(Hippoglossoides platessoides) have also been important.Snow crab and northern shrimp have been the dominantbenthic crustaceans.The top predators are harp seals andhooded seals which migrate into the area from the northduring late autumn and leave in spring. Other importantpredators include whales, most of which migrate intothe area from the south during late spring and leaveduring autumn.The most important are humpback(Megaptera novaeangliae), fin, minke, sei, sperm, and pilotwhales (Globicephala melaena). Additional immigrantsfrom the north during the winter include many birds,such as thick-billed murre, northern fulmar (Fulmarusglacialis), and little auk. Additional immigrants from thesouth during summer include short-finned squid, fishsuch as mackerel and bluefin tuna (Thunnus thynnus), andbirds such as greater shearwater (Puffinus gravis) andsooty shearwater (P. griseus).
The Labrador/Newfoundland ecosystem has experiencedmajor changes since 1980. Atlantic cod and most otherdemersal fish, including species that were not targetedby commercial fishing, had declined to very low levelsby the early 1990s (Atkinson, 1994; Gomes et al.,1995). In contrast, snow crab (DFO, 2002a) and espe-cially northern shrimp (DFO, 2002b) increased consid-erably in abundance during the 1980s and 1990s andnow support the most important fisheries in the area.Harp seals increased in abundance between the early1970s and the mid-1990s (DFO, 2000c). Capelin havebeen found in much reduced quantities in offshoreacoustic surveys since the early 1990s, but indices ofcapelin abundance in the inshore surveys have not shownsimilar declines, leaving the status of capelin uncertainand controversial (DFO, 2000b, 2001). Atlantic salmon,the major anadromous fish in the area, has declined inabundance, due in part to lower survival at sea (DFO,2003b; Narayanan et al., 1995).
The waters of eastern Newfoundland have been fishedfor centuries, primarily for Atlantic cod but with anincreasing emphasis on other species during the latterhalf of the 20th century.These fisheries have undoubted-ly had an influence on both the absolute abundance ofsome species and the abundance of species relative toone another. However, the role of the fisheries in struc-turing the ecosystem is often difficult to distinguish fromthe role of changes in the physical environment.The areacooled during the last three decades of the 20th century,with particularly cold periods in the early 1970s, earlyto mid-1980s, and early 1990s.This cooling, which was
Chapter 13 • Fisheries and Aquaculture 733
associated with an intensification of the positive phaseof the North Atlantic Oscillation (Colbourne andAnderson, 2003; Colbourne et al., 1994; Mann andDrinkwater, 1994; Narayanan et al., 1995), may haveplayed an important role in the dramatic decline inAtlantic cod and other demersal fish, and the increasein crustaceans, especially northern shrimp.
13.4.2. Fish stocks and fisheries
Catches are from official NAFO statistics (as ofFebruary 2004) or from relevant assessment docu-ments if there is a difference between the two (e.g.,NAFO 2001a,b). Figure 13.25 provides an overview ofdevelopments in the main fisheries off Newfoundlandand Labrador since 1960.
13.4.2.1. Atlantic cod
The distribution of Atlantic cod off Canada has histori-cally been from the northern Labrador Shelf southwardto beyond the limit of this study, although during the1990s there were few cod off Labrador. Atlantic codtends to occur on the continental shelf, but has been
found at depths of at least 850 m on the upper slope offeastern Newfoundland (Baird et al., 1992).
The European fishery for Atlantic cod off easternNewfoundland began in the late 15th century. For thefirst few centuries fishing was by hook and line, so thecod were exploited only from late spring to earlyautumn and only in shallow water along the coast andon the plateau of Grand Bank to the southeast of theisland.There is evidence that local inshore over-exploitation was occurring in the 19th century(Cadigan, 1999), but improvements in gear and anincrease in the area fished tended to compensate forlocal reductions in catch rate. Annual landings increasedthrough the 18th and 19th centuries to about 300000 tin the early 20th century.The deep waters were refugiauntil the 1950s, when larger vessels with powered gur-dys were introduced to exploit cod in deep coastalwaters and European trawlers started to fish the deeperwater on the banks. Landings increased dramatically inthe 1960s as large numbers of trawlers located andexploited the overwintering aggregations on the edge ofthe Labrador Shelf and the Northeast NewfoundlandShelf. At the same time, the numbers of large cod indeep water near the coast of Newfoundland are thoughtto have declined quickly as the longliner fleet switchedto synthetic gillnets. Catches peaked at 894000 t in1968, and then declined steadily to only 143000 t in1978. Following Canada’s declaration of a 200 nm EEZin 1977, the stock recovered slightly and catches werebetween 230000 and 270000 t for most of the 1980s.However, catches fell rapidly in the early 1990s as thestock declined to very low levels. A moratorium ondirected fishing was declared in 1992 (Fig. 13.26). Asmall cod-directed inshore fishery was opened in 1998but closed in 2003. Additional details on the history ofthe Atlantic cod fishery of Newfoundland and Labrador,including changes in technology and temporal variabili-ty in the spatial distribution of fishing effort, may befound in Templeman (1966), Lear and Parsons (1993),Hutchings and Myers (1995), Lear (1998), Neis et al.(1999), and Hutchings and Ferguson (2000).
13.4.2.2. Greenland halibut
Greenland halibut (also called Greenland turbot) is dis-tributed off West Greenland from Cape Farewell north-ward to about 78º N and then southward off easternCanada to beyond the limit of this study. It is a deep-water species, occurring at depths from about 200 m toat least 2200 m off West Greenland (Bowering andBrodie, 1995).The history of the fishery is complicatedby temporal and spatial variation in effort and catch bydifferent fleets and by alleged underreporting of land-ings. For details of the fisheries, refer to Bowering andBrodie (1995), Bowering and Nedreaas (2000), andNAFO (2001b).
The fishery off eastern Newfoundland dates back to themid-19th century (Bowering and Brodie, 1995;Bowering and Nedreaas, 2000). Annual catches from
Fig. 13.25. Total catch of selected species off northeasternCanada, 1960–2002 (data from NAFO STATLANT 21A onlinedatabase www.nafo.int/activities/FRAMES/AcFrFish.html;Anon,2004a; Darby et al., 2004; Dawe et al., 2004; Hvingel, 2004; Lillyet al., 2003; Murphy and Bishop, 1995; Orr et al., 2003, 2004;Stenson et al., 2000).
Fig. 13.26. Catch of Atlantic cod, 1960–2002 (data fromMurphy and Bishop, 1995; Lilly et al., 2003).
734 Arctic Climate Impact Assessment
longlines were less than 1000 t until the early 1960s,when catches began to increase substantially. Landingsfrom offshore trawlers, mainly from European coun-tries, also increased after the mid-1960s. Catches in SA2 + Div. 3KL fluctuated around 25000 to 35000 t fromthe late 1960s to the early 1980s, after which there wasa gradual decline to about 15000 t in 1986. Landingsincreased dramatically in 1990 with the arrival of manynon-Canadian trawlers that fished deep waters on thenorthern Grand Bank (see Fig. 13.24 for location).Catches over the next four years were high (estimated atbetween 55000 and 75000 t in 1991; NAFO, 2001b),declined substantially in 1995 due to an internationaldispute, and increased again in the late 1990s underNAFO quotas that maintained catches well below thoseof the early 1990s (Fig. 13.27).
The fishery to the north (NAFO SA 0), which has beenconducted primarily with otter trawlers in the secondhalf of the year (Bowering and Brodie, 1995), reportedan average annual catch of 2100 t between 1968 and1989 (including a high of 10000 t in 1972). Catchesincreased dramatically to 14500 t in 1990 withincreased effort by Canada, but declined to about 4000 tfrom 1994 onward.These landings came mainly from offsoutheastern Baffin Island.The fishery expanded evenfurther north into Baffin Bay in the mid- to late 1990s(Treble and Bowering, 2002).This fishery, whichextended to 73º N in 2002 (M.A.Treble, Fisheries andOceans Canada, pers. comm., 2003), has been limitedby sea-ice cover in September through November.
13.4.2.3. Capelin
Before the start of a commercial offshore fishery in theearly 1970s, capelin were fished on or near the spawningbeaches. Annual catches, used for local consumption, mayhave reached 20000 to 25000 t (Templeman, 1968).Offshore catches by foreign fleets increased rapidly, peak-ing in 1976 at about 250000 t, and then declined rapidly.This offshore fishery continued at a low level until 1992.Catches in the offshore fishery were taken at differenttimes of the year in different areas.The spring fishery wasdominated by large midwater trawlers operating in Div.3L. During the autumn, the offshore fishery first
occurred in Div. 2J, off the coast of Labrador, and gradu-ally moved south into Div. 3K as the capelin migratedtoward their overwintering area (see Fig. 13.24 forNAFO statistical areas).This fishery was also dominatedby large midwater trawlers, which mostly took feedingcapelin that would spawn the following year. During thelate 1970s, as the foreign fishery declined, Canadian fish-ers began fishing mature capelin near the spawningbeaches to supply the Japanese market for roe-bearingfemales.This fishery expanded rapidly, exhibited highestcatches during the 1980s, and declined over the 1990s.Catches in the inshore fishery have generally been lowerthan from the offshore fishery.The total internationalcatch of capelin off Newfoundland and Labrador from1960 to 2002 is shown in Fig. 13.28.
13.4.2.4. Herring
Herring in the Newfoundland and Labrador area are atthe northern extent of their distribution. Stocks arecoastal in distribution and stock abundance is low com-pared to other stocks in the Atlantic. A peak catch of30000 t occurred in 1979, supported by strong yearclasses from the 1960s. Recruitment since the 1960shas been lower. Stock sizes in the late 1990s were lessthan 90000 t and annual catches less than 10000 t(DFO, 2000a).
13.4.2.5. Polar cod
Polar cod is broadly distributed through the Arctic andin cold waters of adjacent seas. It occurs on the shelffrom northern Labrador to eastern Newfoundland, withthe average size of individuals and the size of aggrega-tions decreasing from north to south (Lear, 1979).There has been no directed fishery for polar cod offeastern Canada, but a small bycatch was reported in theRomanian capelin fishery in 1979 (Maxim, 1980), and itis likely that small quantities were also taken in otheryears and by other countries.
13.4.2.6. Northern shrimp
Northern shrimp is distributed off West Greenlandfrom Cape Farewell northward to about 74º N and then
Fig. 13.28. Catch of capelin, 1960–2002 (data from NAFOSTATLANT 21A online database www.nafo.int/activities/FRAMES/AcFrFish.html).
Fig. 13.27. Catch of Greenland halibut, 1960–2002 (data fromNAFO STATLANT 21A online database www.nafo.int/activities/FRAMES/AcFrFish.html; Darby et al., 2004).
Chapter 13 • Fisheries and Aquaculture 735
southward off eastern Canada to beyond the limit ofthis study.The depth of highest concentration tends tovary from area to area but is generally between 200 to600 m. A fishery with large trawlers began off north-eastern Canada in the late 1970s (Orr et al., 2001a).For the first decade most of the catch was taken fromtwo channels in the central and southern LabradorShelf, but in the late 1980s there was an increase ineffort and landings both to the south on the NortheastNewfoundland Shelf and to the north off northernLabrador. Catches increased above 25000 t by the mid-1990s. New survey technology introduced in 1995 indi-cated that commercial catches were very small relativeto survey biomass, and quotas were increased consider-ably in the late 1990s.Total landings rose to more than90000 t by 2000 (Fig. 13.29). Much of the increase incatch from 1997 onward was from a new fleet of small(<100 feet) vessels that fished with bottom trawls main-ly on the mid-shelf. In the 1990s fishing also expandedto Div. 3L (Orr et al., 2001b).
13.4.2.7. Snow crab
Snow crab is distributed from the central LabradorShelf at approximately 55º N southward off easternCanada to beyond the limit of this study.The depth dis-tribution extends from approximately 50 to 1400 m,but most of the fishery occurs at 100 to 500 m.Thefishery off eastern Newfoundland began in the late
1960s as a small bycatch fishery, but soon expandedinto a directed fishery with crab traps (pots) alongmost of the inshore areas of eastern Newfoundland(Div. 3KL) (Taylor and O’Keefe, 1999). During thelate 1970s and early 1980s there was an increase ineffort and an expansion of fishing grounds. Catches inDiv. 3KL reached almost 14000 t in 1981, but thendeclined. In the mid-1980s there was expansion of thefishery to the area off southern Labrador (Div. 2J) andnew entrants gained access to supplement decliningincomes from the groundfish fisheries.The number ofparticipants and the area fished expanded further dur-ing the 1990s, and total catches rose quickly, reachingalmost 55000 t in 1999. Quotas and landings werereduced for the next two years following concerns thatthe resource may have declined.
Commercial catch rates in Div. 3KL increased during thelate 1970s to a peak in about 1981, declined to theirlowest point by 1987, and then increased in the late1980s and early 1990s to a level comparable to that inthe early 1980s (DFO, 2002a). Catch rates remainedhigh to the end of the 1990s, despite the substantialincrease in fishing effort and landings (Fig. 13.30).Thispartly reflects an increase in the area fished, althoughthere must also have been an increase in productivity.
13.4.2.8. Marine mammals
Harp seals summer in the Canadian Arctic or Greenlandbut winter and breed in Canadian Atlantic waters.Thereare two major breeding groups: the first breeding in theGulf of St. Lawrence and the second breeding off south-ern Labrador and northeast Newfoundland (Bundy etal., 2000).The total population increased from less than2 million in the early 1970s to more than 5 million inthe mid-1990s (Healey and Stenson, 2000; Stenson etal., 2002).The increase was largely due to a reduction inthe hunt after 1982 (Stenson et al., 2002).The popula-tion stabilized when the hunt was increased in the mid-1990s. Reported Canadian catches of harp seals include
Fig. 13.30. Catch of snow crab, 1960–2002 (data from NAFOSTATLANT 21A online database www.nafo.int/activities/FRAMES/AcFrFish.html; Hvingel, 2004; Orr et al., 2003, 2004).
Fig. 13.31. Catch of harp and hooded seals, 1952–2002.The catches also include seals taken in the Gulf of St. Lawrence(data from Anon, 2004a; Stenson et al., 2000).
736 Arctic Climate Impact Assessment
harvests off the coast of Newfoundland/Labrador (the“Front”) and in the Gulf of St. Lawrence. Seals caught inboth areas belong to the same population: the NorthwestAtlantic Harp Seals.The proportion of the populationthat occurs in the two areas varies among years, as doesthe relative number of seals caught in each area. Catchesfrom both areas are combined in official statistics and sothose presented here are combined “Front” and Gulf ofSt. Lawrence catches (Fig. 13.31).
Hooded seals are less abundant than harp seals.Whelping occurs on pack ice off northeast Newfound-land, in Davis Strait, and in the Gulf of St. Lawrence.Pups migrate into arctic waters and remain there asjuveniles. Adults migrate south in the autumn andreturn to the Arctic in April (Bundy et al., 2000).The harvest of hooded seals (“Front” and Gulf of St.Lawrence combined) is shown in Fig. 13.31.
There has been no commercial whaling in the area sincethe late 1970s. Using north Atlantic population esti-mates, assumed growth rates, and an assumed propor-tion of the total population in the Newfoundland andLabrador area, Bundy et al. (2000) estimated populationabundances of 33000 for humpback whales, 1000 for finwhales, 5000 for minke whales, 1000 for sperm whales,1000 for sei whales, and 9000 for pilot whales.
13.4.3. Past climatic variations and theirimpact on commercial stocks
13.4.3.1. Atlantic cod
The severe decline in Atlantic cod in the Newfound-land and Labrador area seems to have occurred fromnorth to south. On the northern and central Labradorshelf (Div. 2GH), catches of 60000 to 90000 t werereported for the period 1965 to 1969, but catchesdeclined to less than 5000 t for most of the 1970s andearly 1980s, and to less than 1000 t in the latter half ofthe 1980s (Fig. 13.32).There are no analyses of factorsthat contributed to the decline in this area.
In the area from southern Labrador to the northernGrand Bank, the Div. 2J+3KL stock (the so-called“northern cod”) collapsed in the 1970s in response tosevere overfishing.The stock recovered slightly in the1980s but collapsed to even lower levels in the late1980s and early 1990s.There is controversy as towhether there was a rapid but progressive decline fromthe mid-1980s onward or a precipitous decline in theearly 1990s (Atkinson and Bennett, 1994; Shelton andLilly, 2000). Many studies (e.g., Haedrich et al., 1997;Hutchings, 1996; Hutchings and Myers, 1994; Myersand Cadigan, 1995; Myers et al., 1996a,b, 1997a,b)have concluded that the final stock collapse was entire-ly due to fishing activity (landed catch plus discards).However, several authors have pointed to ways inwhich the decline in water temperature and increase insea-ice cover might have contributed to the collapse,either directly by reducing productivity (Drinkwater,2000, 2002; Mann and Drinkwater, 1994; Parsons L.and Lear, 2001) or indirectly by affecting distribution(Rose et al., 2000).
Despite many studies on this cod stock, there are fewuncontested demonstrations of the influence of climatevariability on stock dynamics.There is an expectationthat recruitment might be positively influenced bywarm temperatures, because the stock is at the north-ern limit of the species’ range in North America(Planque and Frédou, 1999). However, there have beenconflicting reports of whether such a relationship canbe detected (deYoung and Rose, 1993; Hutchings andMyers, 1994; Planque and Frédou, 1999;Taggart et al.,1994). Part of the problem is that recruitment is alsopositively influenced by the number and size of spawn-ers in the population (the spawning stock biomass orSSB; Hutchings and Myers, 1994; Morgan et al., 2000;Myers et al., 1993; Rice and Evans, 1988; but seeDrinkwater, 2002). Both temperature and SSB declinedfrom the 1960s to the 1990s, increasing the difficulty ofdemonstrating a temperature effect. A reported positiverelationship between recruitment and salinity (Sutcliffeet al., 1983) was subsequently supported (Myers et al.,1993) and later rejected (Hutchings and Myers, 1994;Shelton and Atkinson, 1994) as data for additional yearsbecame available.The negative effect of temperature onindividual growth has been well documented (Krohn etal., 1997; Shelton et al., 1999). Additional aspects ofcod biology that changed during the early 1990s, possi-bly in response to changes in the physical environment,include a delay in arrival on traditional inshore fishinggrounds in early summer (Davis, 1992), a concentrationof distribution toward the shelf break in autumn (Lilly,1994;Taggart et al., 1994), a move to deeper water inwinter (Baird et al., 1992), and an apparent southwardshift in distribution (Kulka et al., 1995; Rose andKulka, 1999; Rose et al., 1994).
Of much interest is the possibility that an increase innatural mortality contributed to the rapid disappear-ance of cod in the early 1990s.The sharp decline insurvey abundance indices occurred during a period of
Fig. 13.32. Catch of Atlantic cod by NAFO statistical division,1960–2000 (data from Murphy and Bishop, 1995; Lilly et al., 2003).
Chapter 13 • Fisheries and Aquaculture 737
severe cold and extensive sea-ice cover. A considerabledecline in the condition of the cod occurred at thesame time, especially in the north (Bishop and Baird,1994; Lilly, 2001). Steep declines in abundance alsooccurred among other groundfish in the 1980s and1990s (Atkinson, 1994; Gomes et al., 1995), and whilethere have been some suggestions that these declineswere caused by captures during fishing for cod andother species (Haedrich and Barnes, 1997; Haedrichand Fischer, 1996; Haedrich et al., 1997; Hutchings,1996), there is no direct evidence of large removals.In the case of American plaice, a species studied indetail, Morgan et al. (2002) demonstrated that thedeclines were too large to have resulted from fishingalone.The contribution of increased natural mortalityto the decline in cod and other demersal fish in thisarea during the last two decades of the 20th century,and particularly during the early 1990s, remains unre-solved (Lilly, 2002; Rice, 2002).
The northern cod stock was still at a very low level adecade after the moratorium on directed fishing (DFO,2003a; Lilly et al., 2001). Recruitment to ages 0 to 2remained very low, possibly due in part to a very smallspawning stock biomass; juveniles in the offshore areasappeared to show very high mortality, possibly due inpart to predation by harp and hooded seals; and a direct-ed fishery during 1998 to 2002 targeted the inshoreaggregations, resulting in increased mortality on thelarger fish.The unquantified impacts of low spawningstock biomass, high predation, and fishing make it diffi-cult to establish whether some aspect of ocean climatehas had a role in impeding recovery.
13.4.3.2. Greenland halibut
The status of Greenland halibut in the northwestAtlantic has been uncertain because the stock structureis still unclear, the fish have extensive ontogeneticmigrations, there appear to have been shifts in distribu-tion, the fisheries have undergone many changes infleet composition and in areas and depths fished, andindividual research surveys have only covered part ofthe distribution range. Nevertheless, evidence suggeststhat the biomass of Greenland halibut on the westernside of the Labrador Sea declined substantially duringthe 1980s, with the decline off Baffin Island and north-ern Labrador (Div. 0B and 2GH) most pronounced inthe first half of the decade and the decline off southernLabrador and eastern Newfoundland (Div. 2J3K) to thesouth most pronounced in the latter half of the 1980sand the early 1990s (Bowering and Brodie, 1995).Evidence for a decline in biomass in Div. 2J3K is alsoseen in the declining success of the gillnet fishery inthe 1980s.The history of the fish exploited during the1990s by the new deep-water trawler fishery to thesouth on the northern Grand Bank (Div. 3L) is lessclear. At least some of these fish may have migratedinto the area from the shelf to the north (Bowering andBrodie, 1995), in which case the decline in Div. 2J3Kwas partly due to a southward shift in distribution.
Reasons for the declines in biomass and shift in distri-bution remain unclear. Bowering and Brodie (1995)drew attention to the decline in water temperatureson the shelf in the early 1990s, but thought it unlikelythat such a change would in itself have affected thedistribution and abundance of Greenland halibutbecause this species occupies relatively deep water.Also, much of the shift in distribution must haveoccurred in the latter half of the 1980s, a periodduring which water temperatures were low but not aslow as during the early 1990s.
Variability in the physical environment had no observedeffect on either size at age (Bowering and Nedreaas,2001) or maturity at size or age (Morgan and Bowering,1997) between the late 1970s and mid-1990s.
13.4.3.3. Capelin
The relationship between capelin biology and thephysical environment has been extensively studied inthe Newfoundland and Labrador area. Of particularrelevance to this assessment is the observation thatmany aspects of capelin biology changed during the1990s and, initially, it appeared that these were theresult of changes in water temperature. However,water temperatures in the latter half of the 1990sreturned to normal while the biological changesexhibited by capelin did not revert to earlier patterns.There are many environmental variables that are linkedto capelin biology which may be relevant in the eventof global climate change and these are briefly describedin the rest of this section.
Mean fish length of the mature population was smallerduring the 1990s (Carscadden et al., 2002).Thesesmall sizes have been attributed to smaller fish sizes atage with fewer older and more younger fish in the pop-ulation. Condition (calculated as a relationship betweenlength and weight and regarded as a measure of “well-being”) of capelin was generally higher in the 1980sthan the 1990s. Condition was not related to tempera-ture (Carscadden and Frank, 2002).
Spawning occurs most often on fine gravel and grainsize and beach orientation have been shown to explain61% of the variation in egg concentration among beach-es (Nakashima and Taggart, 2002;Vilhjálmsson,1994).Water temperature is also a determinant ofcapelin spawning.The lowest and highest recordedtemperatures for beach spawning in Newfoundland are3.5 and 11.9 ºC, with beach spawning ceasing whentemperatures exceed 12.0 ºC (Nakashima and Wheeler,2002). Capelin eggs are very cold- and salinity-tolerant,surviving down to -5 ºC and in salinities from 3.4 to 34(Davenport, 1989; Davenport and Stene, 1986).Therate of egg development in the beach gravel is directlyrelated to average incubation temperatures, which inturn are determined by water temperature, maximumand minimum air temperature, and hours of sunlight(Frank and Leggett, 1981).
738 Arctic Climate Impact Assessment
Some capelin that move close to spawning beacheseventually spawn in deeper water adjacent to beaches.This demersal spawning can occur simultaneously withintertidal spawning when temperatures are suitable aswell as when water temperatures at the beach–waterinterface become too warm. Egg mortality amongthese demersal eggs has been observed to be higher.Reproductive success may have been lower during the1990s because the water temperatures encounteredwhen the capelin reached the spawning beaches wouldhave increased the incidence of demersal spawning(Nakashima and Wheeler, 2002). Historically, thespawning of capelin off Newfoundland beaches in Juneand July was a predictable event. In the early 1990s,spawning was later, and 80% of the variation in spawn-ing time (1978–1994) was significantly and negativelyrelated to mean fish size and sea temperatures experi-enced during gonadal maturation (Carscadden et al.,1997). Spawning on Newfoundland beaches continuedto be delayed through 2000 despite sea temperatureshaving returned to normal. However, mean lengths ofcapelin continued to be small.
There are historical reports of capelin occurring outsidetheir normal distribution range. Unusual appearances inthe Bay of Fundy and on the Flemish Cap were attrib-uted to cooler water temperatures while occurrences inUngava Bay coincided with warming trends (summa-rized by Frank et al., 1996).
In the early 1990s, capelin distribution occurred moreto the south, centered on the northern Grand Banks.Originally attributed to the colder water temperatures(Frank et al., 1996), this shift within the normal distri-bution area continued through 2000. Because capelin didnot return to their usual pattern of seasonal distributionas water temperatures increased, this suggests that fac-tors other than water temperature were also operating.Outside their normal distribution area, capelin occurredon the Flemish Cap and eastern Scotian Shelf in the early1990s and occasionally during earlier cold periods.Capelin continued to appear on the Flemish Cap and onthe eastern Scotian Shelf through 2000. In this case,capelin appear to be gradually declining in abundance asthe waters warm. For mature capelin offshore duringspring, Shackell et al. (1994) concluded that tempera-ture was not a proximate cue during migration but thatseasonal temperatures moderated offshore capelinmigration patterns through the regulation of growth,maturation, food abundance, and distribution.
Capelin typically move up and disperse throughout thewater column at night, descending and aggregating atgreater depths during the day. However, during springsurveys throughout the 1990s they remained deeper inthe water column and exhibited reduced vertical migra-tion (Mowbray, 2002; Shackell et al., 1994).Thischange in vertical distribution was not related to theseveral factors tested, including temperature and preda-tion, but may have been linked to feeding success(Mowbray, 2002).
Recruitment of beach-spawning capelin is partly deter-mined by the frequency of onshore winds during larvalresidence in the beach gravel (Carscadden et al., 2000;Leggett et al., 1984). Capelin assessments have beenespecially problematic since the early 1990s, resulting inconsiderable uncertainty in the status of the stock.However, there is no evidence to indicate that exploita-tion has had a direct effect on population abundance(Carscadden et al., 2001), suggesting that any variationsin abundance are due to environmental factors. It is notknown whether some changes in biology such as condi-tion and distribution have affected abundance, however,spawning time and increased demersal spawning may becontributing to poor survival.
Thus, exploitation has not been shown to affect anyaspect of capelin biology in this area. Although therehave been several changes in capelin biology beginningin the early 1990s, there is no clear indication of whatexternal factor(s) has (have) influenced the changes.Earlier studies concluded that temperature was animportant factor for some changes, but it now seemsunlikely that temperature is the sole factor, given thatwater temperatures have returned to normal.There aresuggestions that changes in food supply (zooplankton)may be affecting capelin biology but the exact mecha-nisms have not been identified.
13.4.3.4. Herring
Recruitment is positively related to warm overwinter-ing water temperatures and high salinities (Winters andWheeler, 1987); these conditions seldom exist in thisregion and so, large year classes rarely occur.
13.4.3.5. Polar cod
The distribution of polar cod off eastern Newfound-land expanded to the south and east during the coldperiod of the early 1990s (Lilly and Simpson, 2000;Lilly et al., 1994).
13.4.3.6. Northern shrimp
The shrimp resource off northeastern Canada hasincreased in density and expanded in distribution since themid-1980s.There is no indication that increased catcheshave negatively affected the resource (DFO, 2002b).
There is much support for the hypothesis that theincrease in northern shrimp off northeastern Canadawas, at least in part, a consequence of a reduced preda-tion pressure by Atlantic cod and other groundfish(Bundy, 2001; Lilly et al., 2000;Worm and Myers,2003). Nevertheless, there is evidence that other factorswere involved. For example, Lilly et al. (2000) notedthat the increase in shrimp density on the NortheastNewfoundland Shelf might have started in the early1980s, a time when the biomass of Atlantic cod wasincreasing following its first collapse in the 1970s.Parsons D. and Colbourne (2000) found that catch per
Chapter 13 • Fisheries and Aquaculture 739
unit effort in the shrimp fishery on the central LabradorShelf was positively correlated with sea-ice cover sixyears earlier.They suggested that cold water or sea-icecover itself was beneficial to the early life history stagesof shrimp in that area.
13.4.3.7. Snow crab
The increased productivity of snow crab in the 1990smay have been caused, at least in part, by the release inpredation pressure from Atlantic cod and other demersalfish (Bundy, 2001). However, the relationships betweenAtlantic cod and snow crab have not yet been exploredto the same extent as for Atlantic cod and northernshrimp. A preliminary examination of the influence ofoceanographic conditions on snow crab productivity hasshown a negative relationship between ocean tempera-ture and lagged catch rates (DFO, 2002a).This has beeninterpreted to indicate that cold conditions early in thelife cycle are associated with the production of strongyear classes of snow crab in this area.
13.4.3.8. Marine mammals
Trends in populations of marine mammals over recentdecades appear to be influenced mainly by the commer-cial harvest. As populations of harp seals have increasedin abundance, changes in biological characteristics indi-cate that density-dependence may be operating (Stensonet al., 2002). Density-independent influences may alsoregulate harp seal populations. Harp seals whelp on seaice and mortalities may vary according to sea-ice condi-tions in this critical period. Mortalities of newlywhelped pups may also occur during winter storms.
Concerns regarding the impact of predation by seals oncommercial fish species increased as seal populationsincreased. It has been estimated that 74% (about 3 mil-lion t) of the total annual consumption by four species ofseals in eastern Canada occurred off southern Labradorand Newfoundland (Hammill and Stenson, 2000).Predation by harp seals has been implicated in the lackof recovery of the northern cod stock (DFO, 2003a),and predation on cod by hooded seals may be large(DFO, 2003a).
13.4.3.9. Aquaculture
Salmonid aquaculture does not occur in the ACIApart of Newfoundland because the water is too coldin winter.The main species cultured is blue mussel.Production of this species has grown over the lasttwenty years such that, in 2002, around 1700 t wereraised in the whole of Newfoundland.
13.4.4. Possible impacts of climate changeon fish stocks
Two recent papers (Frank et al., 1990; Shuter et al.,1999) discussed the possible influence of climate changeon ecosystems and fisheries off eastern Canada. Frank
et al. (1990) predicted shifts in the ranges of severalgroundfish stocks because of redistribution of popula-tions and changing recruitment patterns. Stocks at thesouthern limit of a species’ distribution should retractnorthward, whereas those near the northern limitshould expand northward. Frank et al. (1990) did notmake predictions specifically for Labrador and easternNewfoundland, but events during the decade followingpublication of their paper were in many respects oppo-site to these general predictions.The changes offLabrador and eastern Newfoundland were unprecedent-ed and not predicted, and illustrate the uncertainty ofpredictions, even on a regional scale and in the relative-ly short term. Shuter et al. (1999) had the advantage ofwitnessing the dramatic changes that occurred in thephysical and biotic environment during the 1990s.They concluded that greenhouse gas accumulation willlead to a warmer, drier climate and, for the fisheries ofAtlantic Canada, this will result in a “decrease in overallsustainable harvests for coastal and estuarine popula-tions due to decreases in freshwater discharge and con-sequent declines in ecosystem productivity”. For fish-eries in the Arctic, they predicted “increases in sustain-able harvests for most fish populations due to increasedecosystem productivity, as shrinkage of ice cover per-mits greater nutrient recycling”.
As the relative importance of fishing and environment isdifficult to determine for any species or group ofspecies, it is not surprising that the importance attrib-uted to each has varied for different studies. It is alsonot surprising, given the differences among species inthe magnitude of fishery removals relative to stock size,that opinion favors fishing as the dominant factor forsome species and environment for others. For demersalfish, there are many statements to the effect thatdeclines were caused entirely by overfishing, but thereis evidence that changes in oceanographic propertiescontributed to changes in distribution and declines inproductivity. For crab and especially shrimp, it has beensuggested that increases in biomass were simply a con-sequence of a release in predation pressure fromAtlantic cod and perhaps other demersal fish, but againthere is evidence that changes in oceanographic factorscontributed to an increase in reproductive success.For capelin, most information supports the hypothesisthat fishing had little impact on population dynamics,and that environmental factors were the primary deter-minant of stock size, well-being (growth and condi-tion), distribution, and timing of migrations. For polarcod, fishing may be dismissed as a contributor tochanges in distribution and biomass.
An important constraint on predicting changes in fishstocks and the fisheries that exploit them off Labradorand eastern Newfoundland is uncertainty about thedirection and magnitude of change in importantoceanographic variables. For surface air temperature,some model outputs project a cooling over the centralNorth Atlantic, and it is not clear where the Labrador/Newfoundland region lies within the gradation from
740 Arctic Climate Impact Assessment
significant warming in the high Arctic to cooling overthe central North Atlantic. In addition, there is nomodel for downscaling the output of general circulationmodels to specifics of the Labrador/Newfoundland area.As an example of the importance of regional models,many large-scale models project an increase in air tem-perature over the Norwegian and Barents Seas, whilesimulations with one specific regional model (Furevik etal., 2002) indicate that sea surface temperature in thatarea may decline in the next 20 years before increasinglater in the century. Another concern is that naturalvariability in a specific region, such as the LabradorShelf, may be greater than variability in the global mean(Furevik et al., 2002).Thus, a warming trend in shelfwaters off Labrador and Newfoundland might beaccompanied by substantial annual variability, such aswas witnessed during the last three decades of the 20thcentury, and it is even possible that the amplitude ofthat variability could increase. For biota, extremeevents associated with this variability might be at leastas influential as any long-term trend. For the LabradorShelf and Northeast Newfoundland Shelf, it is probablyat least as important to know how the North AtlanticOscillation will behave (especially the intensity andlocation of the Icelandic Low) as it is to know that glob-al temperature will rise.
In the absence of region-specific information on likelyfuture developments of climate, all predictions ofclimate-driven changes in the marine ecosystem offNewfoundland and Labrador can only be highly tenta-tive.The following subsections describe the changes thatseem most likely under three different scenarios: nochange or even cooling of climate, moderate warming,and considerable warming.
13.4.4.1. No change
As temperatures were generally below the long-termaverage during the ACIA baseline period (1981–2000),no change from present conditions or even a cooling arelikely to favor the current balance of species in the sys-tem.This implies a predominance of commercial inver-tebrates like northern shrimp and snow crab and coldwater species of fish such as Greenland halibut, polarcod, and capelin.
13.4.4.2. Moderate warming
The moderate warming scenario (an increase of 1 to3 ºC) assumes that there will be a gradual warming ofthe shelf waters off Labrador and Newfoundland.Using the events in West Greenland during the firsthalf of the 20th century (Vilhjálmsson, 1997) as aspatial/temporal analogue, there is likely to be betterrecruitment success and northward expansion ofAtlantic cod and some other demersal fish that livemainly on the shelf. Capelin is also likely to shiftnorthward. If zooplankton abundance is enhanced bywarmer water, capelin growth is likely to improve.It is possible that many existing capelin spawning
beaches will disappear with the projected rise in sealevel (Shaw et al., 1998). Depending on the increase insea level, storm events, and the availability of glacialdeposits, some beaches may move and new beaches beformed, while others may disappear completely.While beach-spawning capelin can adapt to spawningon suitable sediment in deeper water, survival of eggsand larvae appears to be adversely affected (Nakashimaand Wheeler, 2002), suggesting that a rise in sea levelis likely to result in reduced survival and recruitmentfor capelin. A warming of sea temperatures is likely toretard recruitment to snow crab and northern shrimp,so these species might experience gradual reductions inproductivity.Thus, a gradual, moderate warming of seatemperature is likely to promote a change back to acod–capelin system from the present system wheresnow crabs and northern shrimp are the major com-mercial species. In addition, both cod and capelin arealso likely to become more prominent off centralLabrador than they were during the 1980s.
A gradual warming of shelf waters is also likely to pro-mote a shift of more southerly species into the area.For example, haddock is likely to become more abun-dant on the southern part of Grand Bank, and expandinto the study area. Migrants from the south, such asshort-finned squid, mackerel, and bluefin tuna, are likelyto occur more regularly and in greater quantities than inthe 1980s and early 1990s.
The simple scenario of a gradual change back to acod–capelin system under moderate warming conditionsis uncertain.This is because the influence of oceano-graphic variability in the past is still not clear, andbecause it is likely that the dynamics of some species arenow dominated by a different suite of factors than wasthe case in the past. It is highly likely that the ecosystemoff northeastern Canada changed substantially as a con-sequence of fishing during the first four centuries afterthe arrival of European fishers, changed even furtherwith the increasingly intensive fishing of the 20th centu-ry, and has changed dramatically from the 1960sonward.The magnitude of these changes is such that itwould be difficult to predict accurately the future stateof this ecosystem even without the added complicationsof climate change.Thus, the system could remain in itscurrent state, could revert to some semblance of an his-toric state (or at least the state of the early 1980s), orcould evolve toward something previously unseen.
Changes in sea ice (see Tables 9.2 and 9.3) are likely tohave a negative impact on harp seals, the most impor-tant marine mammal predator in the area. Sea-ice dura-tion is projected to shorten and it is not known whetherharp seals would be able to adjust their breeding timeto accommodate this change. A decrease in sea-iceextent is unlikely to affect harp seals because theywould probably shift their distribution with the sea ice.However, thinner sea ice may be deleterious, resultingin increased pup mortality. Increases in regional stormintensities (see Table 9.1) are likely to result in higher
Chapter 13 • Fisheries and Aquaculture 741
pup mortalities if such storms occur during the criticalperiod shortly after birth (G. Stenson, Fisheries andOceans Canada, St. John’s, pers. comm., 2003).Changes in seal abundance are likely to cascade throughthe ecosystem, since seals are important predators onmany fodder fish and commercially important ground-fish (Bundy et al., 2000; Hammill and Stenson, 2000),and are thought by some to be important in impedingthe recovery of cod (DFO, 2003a) and thus maintainingthe present balance within the ecosystem.
In addition to uncertainty regarding the response ofindividual species and the ecosystem as a whole, thereis uncertainty regarding the influence of changing sea-ice cover on the fisheries themselves. A reduction inthe extent and duration of sea ice may permit fishingfurther to the north and would increase the periodduring which ships would have access to certain fishinggrounds. In particular, these changes in sea-ice coverwould affect the Greenland halibut and shrimp fisheriesin Baffin Bay and Davis Strait. For example, anincreased open water season and extended fishingperiod is thought to have the potential to increase theharvest of Greenland halibut at the time of spawning(late winter/spring).
A reduction in sea-ice cover (see Tables 9.2 and 9.3) isalso likely to negatively impact upon Greenland halibutfisheries that are conducted through fast ice. For exam-ple, a fishery that was developed in Cumberland Soundon Baffin Island in the late 1980s has developed into alocally important enterprise (Crawford, 1992; Pike,1994).The fishery is conducted with longlines setthrough ice over deep (600–1125 m) water, with theseason extending in some years from mid-January toJune. Since the mid-1990s, the season has been shorter,typically from early February to May (M.A.Treble,Fisheries and Oceans Canada,Winnipeg, pers. comm.,2003).To date, attempts at fishing during the openwater season have not proved successful.The catcheshave been small and the fish appear dispersed. It isunclear whether the fish would be present in commer-cial concentrations in the winter/spring if sea ice werenot present. Even if they were, the absence of sea icewould certainly affect the conduct of the fishery.
13.4.4.3. Considerable warming
Since a warming of 4 to 7 ºC is beyond any recordedexperience in the Newfoundland–Labrador area, ameaningful discussion of the considerable warmingscenario is not practicable. In very general terms, sucha shift could favor cold-temperate species such as cod,improve conditions for more southern species such ashaddock and herring, and even lead to the formationof demersally spawning stocks of capelin in additionto beach spawning stocks. However, there are likely tobe other changes, such as a freshening of the surfacelayer due to freshwater from melting sea ice furthernorth, which would be likely to reduce primaryproduction in the area.
13.4.5.The economic and socialimportance of fisheries
From an economy based primarily on the fishery,Newfoundland has, along with most of North America,moved to a service economy. By 1971, for instance, thefishing and fish processing sectors accounted for lessthan 5% of Newfoundland’s GDP, whereas the servicesector accounted for more than half. Mining accountedfor 11% and construction 18% (although that includedconstruction of some of the large diversification proj-ects). Nearly twenty years later, in 1989, shortly beforethe groundfish collapse, the fishery harvesting and pro-cessing sectors together accounted for slightly morethan 5%, service industries had grown to 68%, mininghad fallen to less than 6%, and construction to 8% (fora more extensive discussion see Schrank et al., 1992).By 2001, the fishery harvesting and processing sectorsaccounted for only 3% of GDP, the service industriesremained constant at 68%, construction had slipped to4.7%, and conventional mining to 3%. Oil production,a new industry in Newfoundland, already accounted for8.4% of the provincial GDP, with every prospect ofgrowing (the 2001 data were from the NewfoundlandStatistics Agency; www.nfstats.gov.nf.ca/statistics/GDP/GDP_Industry.asp). Mining was also expected tosee resurgence with the potential opening of a largenickel mine in Labrador.
While the fishery may not be of great importance to theoverall Newfoundland economy, it continues to domi-nate completely the economy in rural areas, and per-haps even more importantly, its culture. After fiftyyears, there is still a daily Fisheries Broadcast on radio andwhen the Canadian Broadcasting Company decided tocancel the weekly television program Land and Sea,which often focuses on the fishery, public pressureforced the crown corporation to continue the program.With the fishery in deep trouble in 1989, the dominantnewspaper in the province, The Evening Telegram, com-mented in an editorial entitled “Too Many Fishermen?”on 1 June 1989, that “Newfoundland’s fishery musteventually be expanded and diversified so that it canemploy more people, not fewer...”
With the spectacular change in fisheries employmentthat accompanied the collapse of the northern codstock, there has been a sharp reemphasis on economicdiversification.The two areas paraded as holding thehope of the future are tourism and information tech-nology (Government of Newfoundland and Labrador,2001). Progress has been made in both areas (e.g., fish-ing vessels converted to tour boats for whale watching,and many bed and breakfast establishments), but hasbeen uneven, and some government policies have beeninconsistent with the promotion of these industries.For instance, despite its interest in developing tourism,the Newfoundland government decommissioned orprivatized a substantial number of the parks in theprovince’s extensive parks system (Overton, 2001).How many of those sold remain as parks is unknown.
742 Arctic Climate Impact Assessment
The real problem with the emphasis on tourism andinformation technology is that it is happening at the timeas it is happening throughout the world.Why shouldNewfoundland have an advantage over the rest of theworld in either field? It is too early to tell whether thisdiversification will be successful.
The story of the Newfoundland fishery does not endwith the collapse of the groundfishery, its catastrophicconsequences for many families, and the serious pres-sures it placed on the government.Two critical sets ofchanges have occurred since 1992: (1) the fishery man-agement process has evolved and (2) shellfish havereplaced groundfish as the main components of fisherylandings in Newfoundland.
Fishery management by restricting total allowable catch-es began in Newfoundland in the mid-1970s. Followinga particularly dramatic race to the fish in 1981, the gov-ernment imposed, at the industry’s request, enterpriseallocations on the offshore groundfish fleet in 1982.These allocations were divisible and transferable in theyear in which they were assigned. Government empha-sized that these were rights to fish as opposed to proper-ty rights, which could be permanently sold. By thistime, gear and geographic restrictions had beenimposed, as had limited entry to non-groundfish inshorefisheries.With the expansion of the crab fishery, enter-prise allocations have also been assigned to this inshoresector.These allocations are not transferable.The federalgovernment has relinquished the licensing of fishers infavor of the provincial Professional Fish Harvester’sCertification Board.This board was established as part ofa professionalization program and it licenses harvesterseither as apprentices or in one of two professional class-es.The federal government, in turn, in 1996 established“core” fishing enterprises for the inshore fisheries. Seniorlevel professional fishers who met certain conditionswere declared the heads of core fishing enterprises.Approximately 5500 of these were established and thegovernment claimed that no additional core licenseswould be issued; the only way that fishers could obtainsuch status would be to buy out the core license of anexisting core fisher. In an attempt to reduce the numberof fishers, the federal government bought approximately1500 core licenses, claiming that these will not be reis-sued.The final major changes in the management systemare that (1) species license fees (access fees) are nolonger nominal, for most important species they arebased on the anticipated gross income from the fishery;and (2) there is now an extensive system of public con-sultations before recommendations concerning totalallowable catches are made to the Minister of Fisheriesand Oceans. For a discussion of the current fishery man-agement system, see Schrank and Skoda (2003).
The value of landings in all Newfoundland fisheries in1991 was Can$ 282838000.This fell during the firstyear of the moratorium to Can$194745000 and thendoubled to Can$ 388700000 by 2000.Viewed alterna-tively, the period of the northern cod moratorium saw
an increase of one-third in the real value of Newfound-land fish and shellfish landings. But, while in 1991 43%of the value of landings was for cod, in 2000 46% wasaccounted for by crab and a further 30% by shrimp.With some cod stocks reopened on a limited basis forcommercial fishing, cod accounted for 9% of the totallandings in 2000, although this had earlier (in 1996)fallen to less than one-half of one percent (www.dfo-mpo.gc.ca/communic/statistics/landings).
For environmental reasons, whether the lack of preda-tion or favorable climatic conditions, the shellfish popu-lation has surged and there has been a nearly completeconversion of Newfoundland’s fishing industry fromgroundfish to shellfish.The conversion took years tooccur. Labor requirements for shellfish are lower thanfor groundfish and, having higher unit prices, the shell-fish quantities that yield these landings figures are muchsmaller than for groundfish.
Since all major species are under quota, total allowablecatches for shrimp and crab have been increasing rapid-ly, along with the number of harvesting and processinglicenses for shrimp and crab.The number of shrimpharvesting licenses rose from 19 in 1986 and 57 in 1991to 438 in 2000.The numbers of crab licenses for thoseyears were 274, 721, and 3333 (Corbett, 2002).There has been much controversy as to whether the olderror of issuing too many licenses has occurred for crab.Even with the exodus from the province, in February2003 there was still a 17.5% seasonally adjusted unem-ployment rate in the province (where the national fig-ure was 7.4%) with continued pressure to open closedplants and increase licenses for crab fishers.While thenumber of crab fishing licenses has increased substan-tially, the increase in the number of crab processingplants has been modest.
13.4.6. Past variations in the fishing industryand their economic and social impacts
The Evening Telegram editorial, referred to in section13.4.5, appeared within the context of a fishery that hadlong been in trouble. In 1967, a provincially financedreport supported the trend away from a seasonal inshorefishery in Newfoundland toward a capital-intensive year-round offshore fishery.The report also noted that the“number of people dependent on the fishery should bereduced” (Pushie, 1967, 185).This has been a recurringtheme. In 1970, the federal fisheries departmentappealed to the Canadian cabinet to permit the depart-ment to establish regulations that would lead to a 50%reduction in the number of Atlantic Canadian (meaningmainly Newfoundland) fishers.
The authority to effect these changes was denied(Schrank, 1995).The fishery faced repeated crises, wasrepeatedly studied, and the conclusion was repeatedlydrawn that too many people were dependent on it. Onestudy estimated that of the then 35000 licensed fishers,only 6000 could be supported unsubsidized by the fish-
Chapter 13 • Fisheries and Aquaculture 743
ery at a better than poverty-level income.The samestudy concluded that for every dollar of fish landed,there was a dollar of subsidy (Schrank et al., 1986).In 1976, with the extension of coastal states’ fisheryjurisdiction to 200 nm from shore, the two Canadiandepartments concerned (fisheries and regional economicexpansion) both published reports stating that there wassufficient extra capacity in the industry that no signifi-cant employment benefits could be expected from theexpanded jurisdiction (Government of Canada,1976a,b).Two years later, a provincial governmentreport made a similar point by stating that the Canadian-ized fishery, when fully developed, could employ only9000 inshore fishers (Government of Newfoundland andLabrador, 1978).Yet, in response to popular pressure,both federal departments, as well as the provincial gov-ernment, licensed and subsidized a tremendous expan-sion in the physical capacity of the industry: from 13636registered fishers in 1975 to 33640 in 1980; from 9517registered inshore vessels in 1976 to 19594 in 1980;from a fish freezing capacity of 181000 t in 1974 to467000 t in 1980; from net fishers’s unemploymentinsurance benefits of US$30724000 in 1976/77 toUS$66060000 in 1980/81; and from outstanding loansof the provincial Fisheries Loan Board (to financeinshore vessels) from US$36869000 in 1976/77 toUS$78558000 in 1980/81 (Schrank, 1995). By 1981the expansion had stopped and the two federal depart-ments agreed that no further expansion of fish process-ing facilities would be built with federal financing(LeBlanc and De Bané, 1981). However, the damage hadalready occurred and, in the face of the anti-inflationrecession of the early 1980s in the United States (wheremost of the Newfoundland fish production was sold),the market for Newfoundland fish products shrank dra-matically and most Newfoundland fish processing com-panies faced bankruptcy.
As a result, the industry was financially, but not struc-turally, reorganized and the massive industrial closuresimplicit in bankruptcy were averted (Kirby, 1982).Yet, starting in 1982, inshore groundfish catches fell andafter 1986 offshore catches followed. By 1992, the situa-tion was so bad that a moratorium on the commercialcatching of the formerly massive northern cod stock wasput into place. Shortly after, nearly all Newfoundlandgroundfisheries were closed and the moratorium wasextended to non-commercial fishing (Schrank, 1995).The closure of most of these groundfisheries continues,in whole or in part, to the present.The closure of theNewfoundland groundfisheries is reputed to haveinvolved the largest mass layoff of labor in Canadian his-tory. In social terms (due to the mass layoff), in biologi-cal terms (due to the decimation of the fish stock), andin governmental financial terms (due to billions of dol-lars spent on income maintenance for fishers and fishplant workers) the moratoria were disasters.
The response of government, industry, and the publicto the moratoria indicates what might happen withclimate change. Although the cause of the stock
destruction in Newfoundland waters may be debated,the dramatic effect on the fish population is incontro-vertible. Should significant changes in environmentalconditions occur, and should these changes have sub-stantial effects on commercial fish stocks, then theNewfoundland experience may provide a templatefor what might be expected to happen elsewhere.Moreover, the Newfoundland experience may alsoindicate the need for alternative policies.
The decline in the cod fisheries was better understoodafter the reports by Alverson (1987) and Harris L.(1989, 1990).That major problems were developing inthe groundfishery was no longer debatable. In 1990, inresponse to the decline of the fishery, the federal gov-ernment introduced the Atlantic Fisheries AdjustmentProgram (AFAP; see Schrank, 1997).The emphasis wason the word “adjustment”. People were to be retiredfrom the fishery, rural communities were to receivemoney to help them diversify their economies awayfrom the fishery, and steps were to be taken to increasescientific understanding of the declining fish stocks.But only a few hundred fishers left the industry.Withthe shock of the total closure of the commercial north-ern cod fishery in July 1992, the federal government,anticipating that the fishery would revive in two years,created the Northern Cod Adjustment and RecoveryProgram (NCARP; see Schrank, 1997). Again there wasan emphasis on people adjusting out of the fishery.This program called for early retirement of fishers,buybacks of fishing licenses, training of fishers for othertrades, and income maintenance payments to fishersand fish plant workers. A third of the 9000 northerncod fishers and half the 10000 plant workers affectedby the northern cod shutdown were expected to leavethe fishery. In fact, only 1436 took early retirement and876 fishers sold their licenses. Fishers were not con-vinced that the shutdown would continue for long, andbelieved that the government would support them untilthe fishery reopened; the relatively uneducated, poten-tial low end laborers did not see a need to leave anindustry in which they were skilled and for which theywere trained from an early age. One reason for loweducational levels (until 1991, less than half Newfound-land’s adult population had completed high school) wasthe fishing tradition. Boys started fishing with theirfathers at a young age and looked forward to leavingschool as soon as possible to join the family fishingenterprise. Boys and girls with little interest in fish har-vesting could work for life in the local fish plant, in jobswhich mostly required little formal education.
However, the fish did not return after two years, andhave still not returned a decade after the start of themoratorium. As NCARP was ending, a new adjustmentprogram began.The Atlantic Groundfish Strategy(TAGS; see Schrank, 1997) was to be a five-year pro-gram of income maintenance and adjustment (licensebuybacks and retirements) in which a 50% reduction infishing capacity was anticipated. Again, there was verylittle movement of people out of the fishery.Their reluc-
744 Arctic Climate Impact Assessment
tance to abandon the fishery was for the same reasons asunder the NCARP program.
As TAGS drew to a close at the end of the 1990s, thegovernment took a harder line.The post-TAGS programdid not resemble its predecessors: income maintenancewas severely cut and many people were removed fromthe program.With government financial support gone,or going, and the fish still not returned, an exodus fromthe fishery finally occurred.
Between 1986 and 1991, the Newfoundland populationstagnated, at least partially from a dramatic drop infamily size. From the highest birth rate of Canadianprovinces, by 1991 Newfoundland had the lowest.Also, there had always been modest migration out ofthe province. But in the five years between 1991 and1996 (from the year after the start of AFAP to halfwaythrough TAGS) the population actually fell by 3%.With the continuing moratorium and the change in gov-ernment policy, the exodus increased significantly andbetween 1996 and 2001 there was a further drop of7%. Census figures for 2001 are from Statistics Canada(2002a), while those for 1991 and 1996 are fromStatistics Canada (1999).
Even though such a population drop in a province overa decade is dramatic, this value of 10% actually hidesthe severity of the impact of the fishery collapse onNewfoundland’s rural communities.Trepassey, on thesouthern shore of the Avalon Peninsula, was the locationof a major groundfish processing plant. Newfoundlandgroundfish operators had been operating under anEnterprise Allocation scheme since 1982.With the dropin fish stocks toward the end of the 1980s, enterpriseallocations were cut and, in response, a number of fishplants closed. One of the first to close, in 1990, wasthat in Trepassey.The result was that a town with 1375inhabitants in 1991 had shrunk by more than 35% to889 in 2001. Many rural communities in Newfoundlandhave seen population declines since 1990 of 15 to 30%(Statistics Canada, 2002b).
13.4.7. Economic and social impacts ofclimate change: possible scenarios
Climate change is likely to cause changes in the size offish stocks.The effects are unlikely to be greater thanthe historical changes described in section 13.4.6.With human society, responses to impulses are not“natural” in the sense that a climatic change “causes” ahuman response.The human response is determined bythe magnitude of the stimulus plus the politicalresponse of the society. In this sense, societal responsesto climate change will not be qualitatively differentfrom society’s responses to past changes.The politicalsystem will respond, and the details of that response areimpossible to predict. But models exist from past expe-rience. However, many of the federal and provincialinterventions in the fishery since 1992 have appeared illthought out, often unfair, and have raised controversy.
A recent case provides an illustration.The groundfishplant in Twillingate was once owned by the largest fishcompany in Newfoundland, Fishery Products Inter-national, Ltd., but had been sold to another operator inthe mid-1980s (Schrank et al., 1995).With the northerncod moratorium in 1992, the plant was shut andremained shut until 2002 when it opened as a shellfishplant with more technologically sophisticated equipmentthan had been used for groundfish.The Marine Institute,a branch of Memorial University, introduced a course toteach fish plant workers to use the new equipment,charging more than CAN$ 400 per person. For unem-ployed people receiving (un)employment insurance thefee was paid by the federal government. Others had topay for themselves. Most unemployed people withoutemployment insurance could not afford the fee. Mostworking people, wanting higher paying jobs in the fishplant, or former fish plant workers wanting to return tothe industry, would need to quit their jobs to take thecourse, unless they were granted time off, which isunlikely in unskilled trades. But if they quit their jobsand completed the course, there was no guarantee of ajob in the Twillingate, or any other technologicallyadvanced, fish plant (CBC, 2002).Thus, every aspect ofthe long adjustment process which started with thedecline of the groundfishery in the 1980s has been char-acterized by a deep sense of unfairness.
The Newfoundland experience shows that a “catastroph-ic” event concerning the fishery leads to severe adjust-ment problems, and that the adjustment period may bevery long, but that it also raises new potential for a suc-cessful industry.The issues seem to be:
• how to convince participants in the industry thatthere is a crisis;
• adjustments that need to be made;• the role of government; and• how to protect the new fishery from the mistakes
of the failed fishery.
In terms of predicting the socio-economic effects of long-term climate change, this is one case where it is easier toprescribe than to predict.The Newfoundland experiencehas shown reactions to expanding fish populations and toshrinking fish populations. In neither case was the reac-tion, in terms of government action or political pressure,appropriate. During the expansion period of the late1970s, the fishery expanded too much, with excessiveand ultimately largely immobile labor and capital enteringthe industry.Whereas a properly managed fishery wouldhave restricted the expansion of production factors, theexpansion was almost without letup until stopped by ageneral economic crisis. It was understood at the timethat employment expansion was an incorrect response.Should fish stocks off Newfoundland increase over thenext 20 or 50 years, care should be taken (1) to restrictby government regulation the magnitude of any expan-sion of capital and labor in the fishery; or (2) to ensurethat such economic incentives are in place that excessivegrowth does not occur; or (3) to combine the two.
Chapter 13 • Fisheries and Aquaculture 745
Should fish stocks decrease over the next 20 or50 years, then it should be clear from the start thatendless subsidies will not be forthcoming. Licensebuyouts, even generous license buyouts of core enter-prises for instance, would help.While these paymentsare subsidies, they are limited in scope and time andwould have the effect of permanently shrinking thefactor base of the industry. In the 1990s, such a policywould have been much cheaper and much less stressfulfor the fishing families affected, than the offering ofincome maintenance payments.
A gradual warming of shelf waters is likely to lead toincreased opportunity for aquaculture.Warmer temper-atures and shorter periods of sea-ice cover are likely toenable mussel farming to be more productive.Warmerwaters are also likely to promote the development ofAtlantic cod farming. If inshore waters become suffi-ciently warm, it is likely to be possible to farm Atlanticsalmon along the east coast of Newfoundland.This ispresently impossible because water temperature in win-ter falls below the lethal temperature for salmon.
13.4.8. Ability to cope with change
Climate change will affect all aspects of the fishery: therange of existing species, the relative populations of dif-ferent species, and the economic circumstances of peo-ple who depend on the fishery for a living. How readythe economic and social systems of Newfoundland areto cope with these changes is not clear.When theNewfoundland fishery was revitalized after the declara-tion of the 200 nm limit, its economic structure over-expanded with largely immobile capital and labor andresulted in disaster.When the cod fishery started todecline in the late 1980s, several years passed beforemany of the necessary adjustments occurred.Whetherthe situation will be any different in response to climatechange depends on whether lessons have been learned,and whether the social and political systems are pre-pared to adjust. Both the expansion of the ground-fishery in the late 1970s and the failure of the fishery toadjust to decimated stocks in the early and mid-1990swere largely due to the subsidies. During the 1970s theexpansion was mainly financed by the federal andprovincial governments. Despite the efforts of the fed-eral government to adjust fishers out of the industry inthe 1990s, the adjustment programs became incomemaintenance programs, which in effect encouraged fish-ers to remain in the industry in the hope that the fishwould return. It was only when the subsidies were sub-stantially reduced after 1998 that a significant numberof fishers left the industry (based on the assumptionthat departures from the fishery are reflected in thecensus figures).
Subsidies are not the results of whimsical acts of gov-ernments or politics but are responses to real social andeconomic concerns. As long as the government consid-ers the survival of small rural communities a major pri-ority, subsidies to the fishery (the primary industry in
these communities) will continue.While subsidies exist,the response of people to changes in the industry willbe slow.Without subsidies, economic forces willrequire change, probably rapid change if the fishery isdeclining. If the biological base of the fishery is expand-ing, there is always the possibility that the industry willoverexpand without government help. Governmentfinancial assistance would virtually ensure that over-expansion would occur.
To the extent that adjustments induced by climatechange cause human suffering, the government can beexpected to ameliorate the situation and ease the neces-sary transitions. But there is strong precedent for transi-tion programs being transformed into short-run incomemaintenance programs. If that were to happen again, theprocess of adjustment is likely to be as long, painful, andwasteful as before.
Thus, it is impossible to predict how ready society is tocope with the effects of climate change.The responsemechanisms are not automatic and political reactionswill play a major role.
13.4.9. Concluding comments
The ecosystem off the northeast coast of Canada isunder the influence of the Labrador Current, which car-ries cold water south from Davis Strait, the CanadianArchipelago, and Hudson Bay. As a result, climateimpacts in this ecosystem can be compared to impactson comparable ecosystems in the Northeast Atlantic andIceland. Historically, the dominant demersal specieswere cod, Greenland halibut, and American plaice, thedominant invertebrates were northern shrimp and snowcrabs, the dominant pelagic fish was capelin, and thedominant top predators were harp seals and whales.
The Labrador/Newfoundland ecosystem experiencedmajor changes in the 1980s and 1990s. Atlantic cod andmost other demersal fish, including species that werenot targeted by commercial fishing, had declined tovery low levels by the early 1990s. In contrast, snowcrab and especially northern shrimp surged during the1980s and 1990s and now support the most importantfisheries in the area. Harp seals increased in abundancebetween the early 1970s and the mid-1990s. Capelinhave been found in much reduced quantities in offshoreacoustic surveys since the early 1990s, but indices ofcapelin abundance in the inshore surveys have not expe-rienced similar declines, leaving the status of capelinuncertain and controversial.
The relative importance of overfishing and the environ-ment on changes in cod and Greenland halibut has notbeen determined, although fishing is generally acceptedas the most important factor affecting cod abundance.Ocean climate is thought to have had an impact on thelack of cod recovery, although this has not been quanti-fied. Exploitation has not been shown to have affectedany aspect of capelin biology in this area. Although there
746 Arctic Climate Impact Assessment
have been several changes in capelin biology since theearly 1990s, there is no clear indication of what externalfactor(s) has (have) influenced the changes. A combina-tion of reduced predation and favorable environmentalconditions probably contributed to the success of north-ern shrimp and snow crab. Harp seals increased becauseof reduced commercial harvesting.
Changes of the magnitude that have occurred in thebiological components of the ecosystem since the early1980s are unprecedented and together with the lack ofregional predictions of changes in the ocean due to cli-mate change, make predictions of biological responses toclimate change highly speculative.
If there is no change from the present state or even acooling, it is likely that the current balance of specieswill persist.
With a moderate, gradual warming, there is likely to bea change back to a cod–capelin system with a gradualdecline in northern shrimp and snow crab. Cod andother demersal, shelf-dwelling species and capelin arelikely to move north. Many existing capelin spawningbeaches are likely to disappear as sea levels rise. If thereis an increase in demersal spawning by capelin in theabsence of new spawning beaches, capelin survival islikely to decline. Seals are likely to experience higherpup mortality as sea ice thins. Increases in regionalstorm intensities are also likely to result in higher pupmortality. A reduction in the extent and duration of seaice is likely to permit fishing further to the north.A reduction in sea-ice cover is likely to shorten Green-land halibut fisheries that are conducted through fast ice.
If a more intense regional warming occurs as a conse-quence of extensive climatic warming, then predictingthe responses of the biological community to thesechanges must occur in the absence of historic prece-dence and be completely speculative. Such an event islikely to improve conditions for cold-temperate speciessuch as cod, improve conditions for more southernspecies such as haddock and herring, and even result inthe formation of demersally spawning stocks of capelin.
Although the fishery in Newfoundland has accounted for5% or less of provincial GDP since 1971, it dominatesthe economy and culture in rural areas.The cod fisheryexpanded rapidly in the 1980s and then contracted rap-idly in the 1990s, the latter in response to the fishingmoratorium.The social and economic effects of changesin fish stocks due to climate change are likely to be lessthan the historical changes experienced in the latter partof the 20th century in Newfoundland and Labrador.
Past experience suggests that the political system willrespond but that the details of the response are impossi-ble to predict. It is, however, possible to prescribe direc-tions that governments should follow in the event ofexpansions or contractions of fish stocks resulting fromclimate change. If fish stocks off Newfoundland increase
over the next 20 or 50 years, care should be taken (1) torestrict by government regulation the magnitude of anyexpansion of capital and labor in the fishery; (2) toensure that such economic incentives are in place thatexcessive growth does not occur; or (3) to combine thetwo. If fish stocks decrease over the next 20 or 50 years,then it should be clear from the start that endless subsi-dies will not be forthcoming. License buyouts, even gen-erous license buyouts of core enterprises for instance,would help.While these payments are subsidies, they arelimited in scope and time and would have the effect ofpermanently shrinking the factor base of the industry.
Aquaculture in Newfoundland and Labrador is relativelysmall but there is interest in expansion, especially withthe lack of recovery of cod stocks. A gradual warming ofshelf waters is likely to lead to increased opportunity foraquaculture.Warmer temperatures and shorter periodsof sea-ice cover are likely to enable mussel farming to bemore productive.Warmer waters are also likely to pro-mote the development of Atlantic cod farming and thefarming of Atlantic salmon along the east coast ofNewfoundland.
13.5. North Pacific – Bering Sea
The continental shelves of the eastern and westernBering Sea together produce one of the world’s largestand most productive fishing areas (Fig. 13.33).Theycontain some of the largest populations of marine mam-mals, birds, crabs, and groundfish in the world(Overland, 1981). A quarter of the total global yield offish came from here in the 1970s.The central BeringSea contains a deep basin that separates the shelves onthe Russian and American sides and falls partly outsidethe 200 nm EEZs of the two countries. Prior to extend-ed fishing zones, a complex set of bi- and multilateralfisheries agreements was established for the area.Theserange from agreements on northern fur seal (Callorhinusursinus) harvests and Canada/US fisheries for Pacificsalmon (Oncorhynchus spp.) and Pacific halibut(Hippoglossus stenolepis), to the multilateral International
Fig. 13.33. Bering Sea and adjacent areas overlain by theEEZs of Russia and the United States, respectively.
Chapter 13 • Fisheries and Aquaculture 747
North Pacific Fisheries Convention for the developmentand use of scientific information for managing fisherieson the high seas (Miles et al., 1982a,b). (Various post-EEZ license agreements have permitted fishing by non-Russian and US fleets. At present such fishing is pre-cluded in the US EEZ and is much reduced in waters ofthe Russian Federation.) In the so-called “Donut Hole”,a pocket of high seas area surrounded by US andRussian EEZs, scientific research and commercial fish-ing are carried out in accordance with the Conventionon the Conservation and Management of PollockResources in the Central Bering Sea by the two coastalstates and Japan, Korea, Poland, and China.The NorthPacific Science Organization and the North PacificAnadromous Fish Commission were established to facil-itate fisheries and ecosystem research in the NorthPacific region, including the Bering Sea.
Commercial fisheries in the Bering Sea are generallylarge-scale trawl fisheries for groundfish of which about30% of the total catch is processed at sea and the restdelivered to shoreside processing plants in Russia andthe United States. Home port for many of the BeringSea vessels is outside the ACIA region reflecting thecomparative advantage of supply and service available inlower cost regions. Small coastal communities have astrong complement of indigenous peoples with subsis-tence fishing interests.They depend on coastal species,especially salmon, herring, and halibut, but the overlapwith commercial activities is generally small. Anadrom-ous species extend far inland via the complex river sys-tems and are critical resources for indigenous peoples.The chief indigenous involvement in the marine com-mercial sector is the Community Development Programin the Northeast Pacific where 10% of TACs are allocat-ed to coastal communities and their chosen partners(Ginter, 1995). Because the eastern Bering Sea is withinthe EEZ of the United States, harvest levels of commer-cially important species of fish and invertebrates are reg-ulated through federal laws. Management plans exist forthe major target species that specify target fishing mor-tality levels calculated to maintain the long-term femalespawning stock levels at 40% of the unfished equilibriumlevel for fully exploited species. In the western BeringSea, within the Russian EEZ, fishery management is exe-cuted on the basis of an annual TAC established for allcommercial stocks of fish, invertebrates, and marinemammals. Allowable catch is calculated as a percentageof the fishable stock. Percentages for individual stocksand species were based on early scientific studies and donot exhibit annual change. However, since 1997, theseharvest percentages have been revised by governmentresearch institutes, using new modeling applications andadaptive management approaches.The recommendedTACs are approved by the special federal agency andissued as a governmental decree.
Annual catches of all commercial groundfish speciesbetween 1990 and 2001 in the US eastern Bering SeaEEZ ranged from 1.3 to 1.8 million t and averaged 1.6million t.The walleye pollock (Theragra chalcogramma)
catch averaged 1.2 million t and ranged from 0.99 to1.45 million t (Hiatt et al., 2002). In the western BeringSea, the total groundfish catch reached 1.45 million t in1988 of which walleye pollock contributed 1.29 milliont.The annual catch of walleye pollock between 1990 and2001 averaged 0.73 million t ranging from 0.45 to 1.06million t.Walleye pollock comprised 89% of the catch,on average, over the 11-year period.
Aquaculture is not a particularly important activity inthe Bering Sea region. In the eastern Bering Searegion, Alaska has adopted policies that prohibit aqua-culture but enable some land-based hatcheries that pro-duce salmon for release into the sea to supplement attimes of low escapement. Some of these salmon passthrough the eastern Bering Sea and may have someeffect on larvae, for example red king crab (Paralithodescamtschaticus) larvae, but this has not been demonstrat-ed. None of the hatcheries operate in the westernBering Sea region (NPAFC, 2001).
13.5.1. Ecosystem essentials
The Bering Sea is a subpolar sea bounded by the BeringStrait to the north and the Aleutian Islands archipelagoto the south (Fig. 13.33). Geographically, the Bering Sealies between 52º and 66º N, and 162º E and 157º W.The narrow (85 km long) and shallow (<42 m deep)passage of the Bering Strait connects the Bering Sea tothe more northern Chukchi Sea and the Arctic Ocean tothe north.The sea area covers almost 3 million km2 andis divided almost equally between a deep basin in thesouthwest and a large, extensive continental shelf in theeast and north.The eastern continental shelf is 1200 kmin length, exceeds 500 km in width at its narrowestpoint, and is the widest continental shelf outside theArctic Ocean (Coachman, 1986).The shelf is a feature-less plain that deepens gradually from its extensiveshoreline to the shelf break at about 170 m depth.There are very limited commercial fisheries in theChukchi Sea or the Arctic Ocean north of the BeringStrait due to a known lack of resources, operating diffi-culties, and distance from markets. Marine mammalpopulations are locally important for subsistence use.
13.5.2. Fish stocks and fisheries
This section describes the life history characteristics,distribution, and trends in abundance and fisheries forthe main species which are or have been the subject ofimportant fisheries or which are important as forage fishfor such species. Catch records for the major groundfishspecies of the eastern and western Bering Sea are shownby species in Figs. 13.34 and 13.35 respectively.
13.5.2.1. Capelin
In the Bering Sea, adult capelin only occur near shoreduring the month surrounding the spawning run.In other months they occur far offshore. In the easternBering Sea capelin occur in the vicinity of the Pribilof
748 Arctic Climate Impact Assessment
Islands and the continental shelf break; in the westernBering Sea they occur in the northern Anadyr Gulf andnear the northwestern Kamchatka coast.The seasonalmigration may be associated with the advancing andretreating sea-ice edge. In the eastern Bering Sea, seaice retreats during summer. As a coldwater species,capelin may migrate in close association with theretreating ice edge resulting in the summer capelin bio-mass located in the northern Bering Sea, an area notcovered by surveys and with very little commercial fish-ing. Capelin aggregations near the northwesternKamchatka coast have a stable distribution over thewarm season. It is reported that the biomass of capelinand smelt grows in periods of climatic transition, whenthe abundance of other common pelagic fish (walleyepollock and herring) are low in the western Bering Sea(Naumenko et al., 1990). Capelin biomass was estimat-ed at 200000 t on the western Bering Sea shelf between1986 and 1990.Their biomass may be much larger onthe expanded eastern shelf. Nevertheless, capelin arenot commercially exploited in the Bering Sea. InRussia, some attempts were made to include capelinand polar cod in a commercial fishery in the mid-1990s.Capelin are a major component of the diets of marinemammals feeding along the ice edge in winter(Wespestad, 1987) and of seabirds in spring.
13.5.2.2. Greenland halibut
In the Bering Sea, Greenland halibut (commonlyknown as Greenland turbot) spend the first three orfour years of life on the continental shelf after whichthey migrate to deep waters of the continental slopewhere they live as adults (Alton et al., 1988; Shuntov,1970; Templeman, 1973). Although tagging studiesshow that they undergo feeding and spawning migra-tions in the North Atlantic Ocean, it is unknown towhat extent this happens in the Bering Sea. A slow-growing and long-lived species, Greenland halibutreach over 100 cm in length and 20 years of age in theBering Sea. Greenland halibut are a valuable commer-cial product and have been caught in trawling opera-tions and by longlines. Catches of Greenland halibutand arrowtooth flounder were reported together in
the 1960s; combined catches ranged from 10 000 to58 000 t per year with an average annual catch of33 700 t.The Greenland halibut fishery intensified inthe 1970s with catches of this species peaking between1972 and 1976 at 63000 to 78000 t per year, primari-ly taken by distant-water trawl fleets from Japan.Catches declined after implementation of theMagnuson Fishery Conservation and Management Act(FCMA) in 1977, where the US fisheries jurisdictionwas extended to 200 nm from the coast. However,catches were still relatively high in 1980 to 1983 withan annual range of 48000 to 57000 t. After that, trawlharvest declined steadily and averaged 8000 t between1989 and 2000.This decline is mainly due to catchrestrictions placed on the fishery because of decliningrecruitment and market conditions. In the westernBering Sea, Greenland halibut were lightly exploiteddue to low stock abundance before the FCMA tookeffect in the eastern Bering Sea. In 1978, a Greenlandhalibut fishery began on the northwestern continentalslope, mostly by longlines. Annual harvest varied from2010 to 6589 t between 1978 and 1990 with part ofthe harvest resulting from bycatch in the Pacific codlongline fishery. Since the early 1990s, Greenland hal-ibut stock abundance and catches have declined.Resource assessment surveys on the continental shelfin 1975 and between 1979 and 2002 showed thatintermediate size Greenland halibut (40–55 cm) werepresent throughout the region from 50 to 200 m depthduring the late 1970s and early 1980s (Alton et al.,1988). By 1985 and 1986 the distribution range haddecreased such that Greenland halibut were onlyencountered in the area to the west and south of St.Matthew Island and at much reduced densities. Sincethen, fish of this size range have only been caught insmall quantities in the northern part of the surveyarea. It is unknown whether environmental conditionsin the late 1970s and early 1980s were favorable forstrong recruitment of Greenland halibut and levelshave since returned to more normal recruitment lev-els, or whether there has been reduced recruitment to
Fig. 13.34. Catch by species from the eastern Bering Sea,1955–2002 (NPFMC, 2004).
Fig. 13.35. Catch by species from the western Bering Sea,1965–2002 (1965–1993 data from Committee on the Bering SeaEcosystem, 1996; 1994–2003 data from the TINRO-Centerarchive,Vladivostok, Russia).
Chapter 13 • Fisheries and Aquaculture 749
this stock since the mid-1980s. However, stock assess-ment models suggest a declining population since 1985(Ianelli at el., 2001). Greenland halibut are widely dis-tributed in the western Bering Sea but are not abun-dant there. The most significant Greenland halibutaggregations occur on the outer continental shelf andslope along the Korjak coast (Borets, 1997; Novikov,1974). Survey results indicate that Greenland halibutabundance was higher in the northern Bering Sea inthe 1990s than in the 1980s. However, the total bio-mass and overall distribution of this flatfish decreasedin the Bering Sea region as a whole.
13.5.2.3. Shrimp
Pandalid shrimp (primarily Pandalus jordani) are widelydistributed along the outer third of the eastern continen-tal shelf where they are consistently caught in resourceassessment trawl catches in small numbers. Humpyshrimp (P. goniurus) are distributed throughout the north-ern Bering Sea shelf and the Anadyr Gulf, in contrast tonorthern shrimp (P. borealis), which are much less abun-dant. Northern shrimp were the first commerciallyexploited shrimp in the Bering Sea after aggregationswere discovered on the outer shelf north of the PribilofIslands in 1960 (Ivanov, 1970).This fishery was conduct-ed by Japanese vessels and peaked at 31600 t in 1963.After that the northern shrimp stock declined sharplyand commercial fishing ceased after 1967. Since thenthere has been no fishery for pandalid shrimp in theBering Sea. Humpy shrimp aggregations were discoveredin the Anadyr Gulf in 1967. A large-scale Russian trawlfishery harvested humpy shrimp in the northern BeringSea in late 1960s to 1970s until they too became lessabundant. Individual trawl catches of Humpy shrimpreached 10 t per 15 minute haul in the Anadyr Gulf,which became the catch value record in the worldshrimp fishery. Humpy shrimp biomass was estimated at350000 t in the Anadyr Gulf in 1975.The annualRussian harvest of humpy shrimp exceeded 11200 t in1978 (Ivanov, 2001) but then declined due to the lack ofa market for small-sized shrimp. Other pandalid shrimpspecies were also caught as bycatch in the pursuit ofother target species.
13.5.2.4. Polar cod
Polar cod are caught in small amounts in resourceassessment surveys at the northernmost survey stationson the eastern Bering Sea shelf.The southern extent oftheir summer distribution is related to bottom watertemperature where they have been found to range from59º N in 1999 (coldest year) to 62º N in 1996(warmest survey year on record, except 2003). Sincepolar cod are found at such high latitudes, little infor-mation is available on their life history characteristicsin the eastern Bering Sea and they are not pursued as acommercial species due to their low abundance. In thenorthwestern Bering Sea and the Chukchi Sea, polarcod are distributed at depths from 15 to 251 m(Tuponogov, 2001). A local fishery on polar cod exist-
ed there during years of high abundance (1967–1970;see Tuponogov, 2001).
13.5.2.5. Crabs
Snow crab and Tanner crab (Chionoecetes bairdi) are dis-tributed throughout the eastern Bering Sea shelf withthe exception of the shallow waters of Bristol Bay(Otto, 1998).The abundance of commercial size maleswas estimated at 183.5 million crabs in 1988 (Stevenset al., 1993).The distribution extends beyond thestudy area to the north and west, and to a small extentinto the Gulf of Alaska. Owing to the relatively narrowshelf area of the western Bering Sea, snow crab abun-dance is notably less there. In 1969 the number ofcommercial size males was estimated at 25 millioncrabs (Slizkin and Fedoseev, 1989). An intensive direct-ed fishery began for snow crab in the Bering Sea in the1980s.They were initially caught incidental to the pur-suit of red king crab until 1964 when both Japan andRussia increased their effort for this species due to abilateral agreement with the United States to limit kingcrab catches (Davis, 1982).The combined Japanese–Russian catch of snow and Tanner crab increased until1970 to 22844 t (ADF&G, 2002), after which quotaswere established for these nations’ fishing fleets and thecatch was sharply reduced.The American pot fishery(non trawl) began shortly after and catches increasedduring the 1980s to a peak in 1991 at 172588 t.Catches rapidly declined with stock decrease butincreased again in the mid-1990s as the snow crabstock condition improved. Since 2000, the stock hasagain declined and the commercial fishery is presentlyoperating under reduced quotas.The Tanner crab fish-ery has been closed since 1997 in the eastern BeringSea (NPFMC, 2002). In the western Bering Sea, therewas no commercial snow crab or Tanner crab fishery in2000 and 2001. Only insignificant catches (250 t) wereallowed during research surveys.The results indicatedsome improvement in stock condition and a small com-mercial fishery was allowed in 2002.
13.5.2.6. Pollock
Walleye pollock (hereafter referred to as pollock) isthe most abundant species within the Bering Sea and iswidely distributed throughout the North Pacific Oceanin temperate and subarctic waters (Shuntov et al.,1993;Wolotira et al., 1993). Pollock are a semi-demersal schooling fish, which become increasinglydemersal with age.They are a relatively short-lived(natural mortality estimated at 0.3) and fast-growingfish, females usually become sexually mature at fouryears of age.The maximum recorded age is about 22years.The stock structure of Bering Sea pollock is notwell defined. In the US part of the Bering Sea, pollockare considered to form three stocks for managementpurposes: the eastern Bering Sea stock (which com-prises pollock occurring on the eastern Bering Seashelf from Unimak Pass and to the US–RussianConvention line), the Aleutian Islands Region stock
750 Arctic Climate Impact Assessment
(which occurs within the Aleutian Islands shelf regionfrom 170° W to the US–Russian Convention line), andthe Central Bering Sea stock (known as the BogoslofIsland pollock, and which are thought be a mixture ofpollock that migrate from the US and Russian shelvesto the Aleutian Basin around the time of maturity).There are only two stocks in the Russian EEZ. Pollockcurrently support the largest fishery in US waters andcomprise 75 to 80% of the annual catch in the easternBering Sea and around the Aleutian Islands. From 1954to 1963, pollock were only harvested at low levels inthe eastern Bering Sea. Directed foreign fisheries firstbegan in 1964 after which catches increased rapidlyduring the late 1960s, and peaked in 1970 to 1975when they ranged from 1.3 to 1.9 million t per year.Following a peak catch of 1.9 million t in 1972, catch-es were reduced through bilateral agreements withJapan and Russia. Since the US claim to extended juris-diction in 1977, the annual average eastern Bering Seapollock catch has been 1.2 million t, ranging from 0.9million t in 1987 to nearly 1.5 million t (including theBogoslof Islands area catch in 1990), while stock bio-mass has ranged from a low of 4 to 5 million t to highsof 10 to 12 million t (NPFMC, 2002). In 1980, USvessels began fishing for pollock and by 1987 were ableto take 99% of the quota. Since 1988, only US vesselshave been operating in this fishery and by 1991, thecurrent domestic observer program for this fishery wasfully operational. In the southwestern Bering Sea, thepollock fishery developed slowly during the mid-1960sstabilizing at 200000 to 300000 t in the latter half ofthe 1970s and the 1980s. After 1995, there was areduction in harvest due to a decline in pollock stocksin the western Bering Sea. After that, the total pollockcatch in the Russian EEZ was maintained by increasingfishing activity in the Navarin region between 1996 and1999, and ranged from 596000 to 753000 t.The pol-lock catch subsequently declined in the northernregion due to poor stock condition as well as to theapplication of precautionary approaches in pollock fish-ery management.The total pollock catch in the RussianEEZ declined from 1327000 t in 1988 to 393180 t in2000.Vessels of “third countries” began fishing in themid-1980s in the international zone of the Bering Sea(commonly referred to as the “Donut Hole”).TheDonut Hole is located in the deep water of theAleutian Basin and is distinct from the customary areasof pollock fisheries, namely the continental shelves andslopes. Japanese scientists began reporting the presenceof large quantities of pollock in the Aleutian Basin inthe mid- to late 1970s, but large-scale fisheries did notbegin until the mid-1980s.Thus, the Donut Hole catchwas only 181000 t in 1984, but grew rapidly and by1987 exceeded the catch within the US Bering SeaEEZ.The outside-of-EEZ catch peaked in 1989 at1.45 million t and then declined sharply. By 1991, theDonut Hole catch was 80% less than the peak value,with subsequent low catches in 1992 and 1993.A moratorium was enforced in 1993 and since thenonly minimal pollock catches have been harvested fromthe Aleutian Basin by resource assessment fisheries.
In response to continuing concerns over the possibleimpacts groundfish fisheries may have on rebuildingpopulations of Steller sea lions (listed as an endangeredspecies after four decades of decline), changes havebeen made in regulations of the pollock fisheries in theeastern Bering Sea and at the Aleutian Islands. Pollockare important prey items for Steller sea lions and thesechanges were designed to reduce the possibility ofcompetitive interaction of the fishery with Steller sealions. For the fisheries, comparisons of seasonal fisherycatch and pollock biomass distributions in the easternBering Sea led to the conclusion that the fishery haddisproportionately high seasonal harvest rates withincritical sea lion habitat which could lead to reduced sealion prey densities. Consequently, management meas-ures were designed to redistribute the fishery bothtemporally and spatially according to pollock biomassdistributions (the underlying assumption being that theindependently derived area-wide and annual exploita-tion rate for pollock would not reduce local prey den-sities for sea lions).
13.5.2.7. Pacific cod
Pacific cod are widely distributed from southernCalifornia to the Bering Sea, although the Bering Sea isthe center of greatest abundance for this species.Tagging studies have shown that they migrate seasonal-ly over large areas. In late winter, Pacific cod convergein large spawning concentrations over relatively smallareas. Spawning takes place over a wide depth range(40–290 m) near the bottom. Eggs are demersal andadhesive. Estimates of natural mortality range from0.29 to 0.99, while a value of 0.37 is used in the stockassessment model. Pacific cod have been found aged upto 19 years and females are estimated to reach 50%maturity at 5.7 years, corresponding to an averagelength of 67 cm. Pacific cod are the second largestBering Sea groundfish fishery. Beginning in 1964, theJapanese trawl fishery for pollock expanded and codbecame an important bycatch species and an occasionaltarget species during pollock operations (in the early1960s, a Japanese longline fishery harvested Bering SeaPacific cod for the frozen fish market). By 1977, for-eign catches of Pacific cod had consistently been in the30000 to 70000 t range for a full decade (Thompsonand Dorn, 2001).The foreign and joint venture sectorsdominated catches through 1988, when a US domestictrawl fishery and several joint venture fisheries beganoperations. By 1989, the domestic sector was dominantand by 1991 the foreign and joint venture operationshad been displaced entirely. Catches of Pacific codsince 1978 have ranged from 33000 t in 1979 to232600 t in 1997 with an average of about 141900 t.At present, the Pacific cod stock is exploited by amultiple-gear fishery, including trawl, longline, pot,and jig components (with the exception of 1992, thetrawl catch was the largest component of the fishery(in terms of catch weight) between 1978 and 1996.Since 1997, the longline fleet has taken the greatestproportion of Pacific cod). Pacific cod were estimated
Chapter 13 • Fisheries and Aquaculture 751
to be at low abundance levels in 1978 but experiencedstrong recruitment (age 3) in the early 1980s, whichbuilt the stock to high levels.The population biomasspeaked at 2.5 million t in 1987 and then declined grad-ually to about half the peak value in 2001. In the west-ern Bering Sea, the Russian cod fishery developedslowly and was mostly unsuccessful until the late1960s. Several attempts were undertaken by Japaneseand local fishermen in longline and trawl fisheriesdevelopment in the 1920s and 1930s. Meanwhile, com-mercially significant Pacific cod concentrations weredescribed by scientific expeditions. In particular, denseaggregations were found in the northwestern area in1950 to 1952 near the Navarin Cape (Gordeev, 1954).This led to the organization of a special cod fisheryexpedition in 1968 (Vinnikov, 1996). Pacific cod har-vest from this area ranged from 6500 to 24500 t in thefirst years, and peaked at 117650 t in 1986. In the1990s, catches declined due to a restructuring of thefishery and, in recent years, from decreases in codabundance in the North Pacific. Pacific cod biomasswas estimated at 766000 t in 1989 (Vinnikov, 1996)and had declined to 172000 t by 2000.
13.5.2.8. Flatfish
The flatfish harvest and resource is much smaller in thesouthwestern Bering Sea with its relatively narrowshelf than in the eastern Bering Sea. A directed flatfishfishery began in the mid-1950s in the southwesternBering Sea.This is a small-scale land-based fisheryusing Danish seines and, to a lesser extent, trawls.Yellowfin sole (Limanda aspera) comprise the main partof the flatfish harvest in the southwestern Bering Sea(72.7% of the predicted flatfish TAC for 2002 andabout 74% in Danish seine catches in recent years) andits biomass is estimated at 78000 t on the southwest-ern shelf compared to 1.6 million t in the easternBering Sea. Maximum catches in the southwesternBering Sea, 32000 and 20000 t respectively, were reg-istered in 1958 and 1959.The situation changed dra-matically in 1960 and 1961 when the flatfish harvestfell to its lowest ever values (100 to 160 t).The stockcondition improved over the following decades. By themid-1960s catches had stabilized at approximately6000 t per year which continued through 1974, afterwhich they declined until the early 1980s. During 1996to 2002, the flatfish catch in the southwestern BeringSea varied from 6000 to 13500 t. In terms of otherflatfish species, Alaska plaice (Pleuronectes quadritubercu-latus), rock sole (Lepidopsetta bilineata), and northernflathead sole (Hippoglossoides robustus) are the mostimportant in the southwestern Bering Sea.
The abundance of yellowfin sole is low in the north-western Bering Sea.The most important flatfish speciesis northern flathead sole, which accounts for abouttwo-thirds of the total flatfish biomass, followed byAlaska plaice, and rock sole. A directed flatfish fisherydid not begin in the northwestern region until the1990s and never developed extensively. However, the
flatfish bycatch sometimes reached significant levelsand between 1965 and 1984 ranged from 2440 to29140 t in the northwestern Bering Sea.The flatfishbycatch increased to 33460 t in 1985 and 39900 t in1986, leveling off at 24000 to 29000 t over the nextsix years, and then declining to an average of 9700 tafter 1993. A target flatfish fishery did not developextensively, and the target catches remained less thanthe bycatch in the large cod and pollock fisheries.
In the eastern Bering Sea, yellowfin sole is distributedfrom British Columbia to the Chukchi Sea, into thewestern Bering Sea, and south along the Asian coast toabout 35º N off the South Korean coast (Hart, 1973).In the Bering Sea, it is the most abundant flatfish speciesand is the target of the largest flatfish fishery in theUnited States.While also found in the Aleutian Islandsregion and the Gulf of Alaska, the center of abundancefor this stock is on the eastern Bering Sea shelf. Adultsare benthic and occupy separate winter and spring/summer spawning and feeding grounds.They over-winter near the shelf break at approximately 200 mdepth and move into nearshore spawning areas as theshelf ice recedes (Nichol, 1997). Spawning is protractedand variable, beginning as early as May and continuingthrough August, occurring primarily in shallow water atdepths less than 30 m (Wilderbuer et al., 1992). Eggs,larvae, and juveniles are pelagic and usually found inshallow areas.The estimated age at 50% maturity is10.5 years with a length of about 29 cm (Nichol,1994).The natural mortality rate is likely to be withinthe range 0.12 to 0.16, with a maximum recorded ageof 33 years (Wilderbuer, 1997).Yellowfin sole havebeen caught with bottom trawls on the Bering Sea shelfevery year since the fishery began in 1954. Between1959 and 1962 yellowfin sole was overexploited byJapanese and Russian trawl fisheries when catches aver-aged 404000 t annually. As a result stock abundancedeclined. Catches also declined to an annual average of117800 t between 1963 and 1971, declining further toan annual average of 50700 t between 1972 and 1977.The yield in this latter period was partially due to thediscontinuation of the Russian fishery. In the early1980s, catches increased peaking at over 227000 t in1985. In the 1980s, there was a major transition in thecharacteristics of the fishery in the eastern Bering Sea.Before this, yellowfin sole were taken exclusively bynon-US fisheries and these fisheries continued to domi-nate through 1984. However, US fisheries developedrapidly in the 1980s, and foreign fisheries were phasedout. Since 1990, only domestic harvesting and process-ing has occurred.The 1997 catch of 181389 t was thelargest since the fishery became completely domestic,but decreased to 101201 t in 1998.The 2000 catchtotaled 83850 t and the 2001 catch was 63400 t.For many years in the 1990s the yellowfin sole fisherywas constrained by closures in order to attain thebycatch limit of Pacific halibut allowed in the yellowfinsole directed fishery. Stock biomass has declined by1 million t from the peak biomass observed in 1985 andwas estimated at 1.6 million t in 2002.
752 Arctic Climate Impact Assessment
13.5.2.9. Salmon
The Bering Sea is important habitat for many stockscomprising the five species of Pacific salmon during theocean phase of their life history. Here, the variousstocks intermingle from origins in Siberia, Alaska, theAleutian Islands, Japan, Canada, and the US west coast.The earliest fisheries for salmon were probably indige-nous subsistence fisheries in which salmon were cap-tured returning to their native streams to spawn.During the 20th century there were three main fish-eries for salmon in the Bering Sea: the Russian andAlaskan domestic fisheries, the Japanese high-seas gill-net and longline fishery, and the bycatch of salmon inthe groundfish fisheries.
Salmon canneries first appeared on the Alaskan side ofthe Bering Sea in the late 1890s to process fish return-ing to Bristol Bay. It is reported that between 1894 and1917 the Kvichak and Nushagak rivers flowing intoBristol Bay produced 10 million sockeye salmon(Oncorhynchus nerka) annually (Netboy, 1974). Purseseines and gill nets were the primary fishing gear in theearly days of the fishery. Gill nets were hauled from thebeach using horses, which were later replaced byengines, whereas the purse seine fishery started around1915 with the advent of powered fishing craft. Purseseining continues to the present as the primary gear ina highly mobile fleet fishing near-shore, which assuresthe targeting of specific salmon stocks. Although all fivespecies of Pacific salmon are present in Bristol Bay,sockeye salmon are the most abundant and have domi-nated the salmon catch for years.The Bristol Baysalmon catch for all species totaled 42 million fish in1993, of which 41 million were sockeye salmon, thelargest catch on record (fishery statistics from thePacific salmon fishery on the western Bering Sea coast(eastern Kamchatka region) are available since 1906).On average, pink salmon (O. gorbuscha) contributed73.8% of the Russian salmon catch in the westernBering Sea between 1952 and 1993, chum salmon(O. keta) 24.2%, sockeye salmon 1.3%, chinook salmon(O. tshawytscha) 0.6%, and coho salmon (O. kisutch) only0.1% (Chigirinsky, 1994). Since 1989, the runs of pinksalmon to the eastern Kamchatka coast have been ingood condition in odd years.The historical highestcatch totaled 83640 t in 1999.The average pink salmoncatch (38390 t) for 1989 to 2001 is more than twicethe average level of 15996 t for 1952 to 1993 (Chigir-insky, 1994). Similarly, chum salmon catches were sta-ble at 11000 to 12000 t in 2000 to 2001 compared to5250 t for 1952 to 1993.The recent improved stockconditions coincide with new fishery regulations, whichlimit the chum salmon bycatch during the pink salmonfishery.The main sockeye salmon fishery in easternKamchatka results from the productive KamchatkaRiver, slightly south of the Bering Sea.
The Japanese high-seas gillnet and longline salmonfishery expanded into the Bering Sea in 1952 withthree motherships and 57 catcher boats, which
increased to 14 motherships and 407 catcher boats by1956 (Netboy, 1974). (Motherships are large vessels towhich catcher boats deliver their catches and where thefish are processed for human consumption or reducedto meal and oil, they also carry fuel and otherprovisions for the catcher fleet.) The peak catch of116200 t occurred in 1955 and annual catches rangedfrom 71000 to 87000 t between 1957 and 1977(Harris C., 1989). Sockeye, chum, and pink salmoncomprised 95% of the catch in this fishery, whichceased operations in 1983.The bycatch of salmon inthe commercial groundfish fisheries is of lessimportance than for the directed fisheries, but stillaccounts for fishing mortality important to resourcemanagers. Observer sampling of the groundfish fisheryindicates that chinook salmon are more frequent inbottom trawls and the other species more frequent inthe pelagic trawls (Queirolo et al., 1995). In thewestern Bering Sea, primarily chinook and chumsalmon were present in the bottom trawl catchesduring research surveys in 1974 to 1991 (Radchenkoand Glebov, 1998).
13.5.2.10. Marine mammals
The Bering Sea contains a rich and diverse assemblageof marine mammals, including north temperate, arcticand subarctic species. Twenty-six species from theorders Pinnipedia (sea lions, walrus, and seals),Cetacea (whales, dolphins, and porpoises), andCarnivora (sea otter), and polar bears are present atvarying times of the year (Lowry and Frost, 1985).Some species are resident throughout the year (e.g.,harbour seal, Steller sea lion, sea otter (Enhydra lutris),beluga whale (Delphinapterus leucas), and Dall’s por-poise (Phocoenoides dalli)) while others migrate into theBering Sea during the summer on feeding excursions.Arctic species including polar bears, walrus, ringedand bearded seals (Erignathus barbatus), and bowheadwhales (Balaena mysticetus) mostly occur in the BeringSea during autumn and winter and are associated withthe presence of seasonal sea ice. Most of the marinemammal species are found over the continental shelfand in coastal areas, although five whale species residein the deep/oceanic waters of the Bering Sea basin(Lowry et al., 1982).
Harvesting of marine mammals has occurred since atleast 1790, the first year when northern fur seal har-vests were recorded (Langer, 1980).The harvestpeaked in the 1870s at over 100000 animals and was atlevels exceeding 40000 males annually until 1985when the northern fur seal commercial harvest wasstopped and only subsistence hunting by Aleuts wasallowed in the Pribilof Islands. In the Russian EEZ,fur seal hunting has seen many changes since the mid-1980s. Since 1987, the experimental hunting of “silver”fur seals (aged 3–4 months) has been conducted on theCommander Islands (Boltnev, 1996).The harvest ratewas established at 60% from the average annual maleabundance for 1987 to 1989. Actually, significantly lessthan 50% were killed, which has further decreased to
Chapter 13 • Fisheries and Aquaculture 753
less than 30% since 1989.The number of animalskilled decreased from 6700 in 1995 to 3000 in 1999and 2180 in 2000.The declining harvest is related tothe decline in the fur seal population and the negativeeffect of disturbance by hunters on seal reproduction.All fur seal hunting is presently restricted to BeringIsland. Bachelor males aged from two to five yearswere hunted on Medny Island until the mid-1990s(2134 animals were killed in 1994) and this area wasthen closed to harvesting in 1995.Whaling spread tothe Bering Sea in the mid-19th century when largenumbers (2500 in 1853) of bowhead whales weretaken (NMFS, 1999).This harvest continued for50 years until the bowhead whale population becamedepleted.The current subsistence harvest totals 60 to70 whales annually. Some species, such as humpbackand grey whales (Eschrictius robustus), which are presentin the Bering Sea in summer, were historically harvest-ed during the winter near Hawaii and California andin waters off the Chukotski Peninsula (about 130 to135 whales). Kenyon (1962) reported that Steller sealions were very abundant in the Pribilof Islands whendiscovered in 1786, but were soon overhunted. Afterprotective measures were taken, numbers grew froma few hundred in 1914 to about 6000 in 1960.Thepopulation has since declined to low numbers and hasbeen the subject of extensive research to find the causeof the decline.
In the United States, stock assessment information onthe 39 stocks of the 24 species of marine mammals inthe Bering Sea are used to classify each stock as eitherstrategic, non-strategic, or not available (Angliss et al.,2001). Strategic stocks are those considered threat-ened, endangered, or depleted under US law. Thestrategic stocks include: northern fur seal, spermwhale, humpback whale, fin whale, the North Pacificright whale (Eubalaena japonica), and the bowheadwhale. Three Bering Sea stocks also have further desig-nations: northern fur seals are designated as depletedunder the Marine Mammal Protection Act, and thewestern stock of Steller sea lion is listed as endangeredunder the Endangered Species Act, as is the bowheadwhale. Nine of the 39 marine mammal stocks are esti-mated to be increasing, five are stable, three aredeclining, and the status of the others is unknown.Subsistence harvest is allowed for three species: north-ern fur seals, beluga, and bowhead whales. In Russia,marine mammal populations are classified as commer-cial, non-commercial, or protected. Protected speciesinclude all whales and dolphins (with the exception ofgrey whales, whaled by indigenous people for subsis-tence), sea otter, and polar bear. Some commercialquota is established for beluga whales, but is nottaken.Walrus, spotted seal (Phoca largha), ringed seal,and ribbon seal (P. fasciata) are hunted in the north-western Bering Sea. However, their harvest has beenrelatively low since the cessation of ship-based huntingoperations. In 1998 to 2000, the harvest was less than60% of the established TAC on different seal speciesand averaged 32.8%.
13.5.3. Past climatic variations and theirimpact on commercial stocks
Climate change primarily influences ocean watertemperatures through the regulation of synoptic atmo-spheric processes and water exchange between thewestern Bering Sea and the Pacific Ocean. Four physi-cal processes determine the change in ocean climateregimes in the North Pacific (Schumacher, 2000): thelunar tidal cycle, variations in solar radiation (Davydov,1972;Van Loon and Shea, 1999), changes in the NorthPacific circulation that affect air–sea exchange of heatand, finally, changes in the momentum of the AleutianLow atmospheric pressure pattern.These processesgenerate a subset of basin-scale factors, each of whichcontributes to the oceanographic conditions of theBering Sea.The Aleutian Low is an example of anatmospheric activity center in the northern-hemisphere(Beamish and Bouillon, 1993; Francis et al., 1998;Hollowed and Wooster, 1992; Latif and Barnet, 1994;Luchin et al., 2002;Wooster and Hollowed, 1995).Water inflow and atmospheric forcing appear to serveas links in the signal transfer chain for the Bering Searegion.Their functioning reflects the direct effect ofthe atmosphere on the marine environment throughthe temperature regime of shelf waters, and the undi-rected oceanographic phenomena offshore.The signalpropagates through changes in the general current pat-tern and tidal wave parameters, which determine theintensity of the water exchange between the shelf andopen sea regions.
The direct effects of atmospheric forcing resulting fromclimate variations are very important to the physicaloceanographic dynamics of the eastern Bering Sea shelf,which has a characteristically sluggish mean flow and isseparated from any direct oceanographic connection tothe North Pacific Ocean by the Alaska Peninsula.Therefore, linkages between the eastern Bering Seashelf and the climate system are mainly a result of theocean–atmosphere interaction (Stabeno et al., 2001).Climate variations in this region are directly linked tothe location and intensity of the Aleutian Low pressurecenter which affects winds, surface heat fluxes, and theformation of sea ice (Hollowed and Wooster 1995).The pressure index shows eight statistically significant
Fig. 13.36. Regime shifts in the Bering Sea, 1968–2000(composite of 31 physical indicators: Hare and Mantua, 2000).
754 Arctic Climate Impact Assessment
shifts, alternating between cool and warm periods, overthe 20th century, which occurred on roughly decadaltime scales (Overland et al., 1999). A well-documentedshift (Trenberth 1990; Hare and Mantua, 2000) from acool to a warm period occurred between 1977 and1989, which coincided with the commencement offishery-independent sampling programs and fisherycatch monitoring of major groundfish species. Infor-mation from the contrast between this period and theprior and subsequent cool periods (1960–1976 and1989–2000) forms the basis of the following discussionof the response of eastern Bering Sea species to climate-induced system changes (Fig. 13.36).
13.5.3.1. Effects on primary productivity
The influx of Pacific waters northward into the westernBering Sea results in a warming effect.The dynamics ofthe environmental conditions of the Bering Sea offshorezone and the relatively narrow western shelf are largelydetermined by the periodic behavior of current patterns(Shuntov and Radchenko, 1999).The direction andvelocity of these currents coincide with changes in theatmospheric circulation pattern, effects which are mani-fested through the change in intensity of the inflow ofNorth Pacific Ocean water. From 1977 to 1989, a peri-od of enhanced atmospheric transport, an intensifica-tion of currents into the Bering Sea resulted inenhanced fluctuations in the thermal properties of thesystem towards a warmer state. During those years, theeffect of horizontal water movement and mixing on pri-mary production was almost as important as verticalmixing due to the renewed supply of nutrients neces-sary for phytoplankton blooms. According to long-termdata series, the highest concentrations of spring-timenutrients in the upper mixed layer were observed in theAleutian straits, over the continental slope, and in areaswhere the influx of North Pacific water was present.The enhanced rate of primary production may be asmuch as 10 to 13 g C/m2 per day (Sapozhnikov et al.,1993), which is more than can be used by the zooplank-ton and microheterotrophs (especially in the westernBering Sea shelf).The unutilized primary productionaccumulates at the upper boundary of subsurfacewaters, which is relatively cold for microheterotrophs,and the organic matter gradually rises into the upperlayers in divergence zones and cyclonic eddies duringthe warm season.Therefore, favorable conditions forplankton development during spring, both from heatingand nutrient supply from Pacific waters, may cascadethrough higher trophic levels and play a large role indetermining the total biological productivity for theyear (Radchenko et al., 2001).
Changes in atmospheric climate are mainly transmittedthrough the eastern Bering Sea physical environment tothe biota through wind stress (Francis et al., 1998) andannual variation in sea-ice extent (Niebauer et al., 1999;Stabeno et al., 2001).These mechanisms directly alterthe timing and abundance of primary and secondary pro-duction through changes in salinity, mixed-layer depth,
upwelling, nutrient supply, and vertical mixing.Theseenvironmental changes vary at a decadal scale and result-ed in higher levels of primary and secondary productionduring the warm period of 1977 to 1988 than in theearlier cool period (Brodeur and Ware, 1992; Hollowedet al., 2001; Luchin et al., 2002; Minobe, 1999;Polovina et al., 1995; Sugimoto and Tadokoro, 1997).During periods of low summer storm activity in theBering Sea region, as in 1993 to 1998, water columnstratification increases. Heating of a thin surface layerabove the seasonal thermocline prevents vertical nutri-ent transport from the underlying, stratified layers,which reduces levels of primary production and biologi-cal productivity in the Bering Sea (Shuntov et al., 1997),despite warmer surface water temperature.This is con-sistent with the total heat budget of the upper layer ofthe Bering Sea, which was lower in 2002 than in thewarmer period of the previous decade (Fig. 13.37).
In the relatively warm years of 1997 to 1998, there wassignificant growth in euphausiid biomass in the westernBering Sea (Radchenko et al., 2001) suggesting thatwarmer waters provide favorable conditions for thesurvival and growth of some subarctic zooplanktonspecies. Crustacean growth rates have also been foundto be above average in warm conditions (Vinogradovand Shushkina, 1987; Zaika, 1983).This enhancedgrowth rate allows for a longer maturation period andspawning season. A meta-analysis of marine copepodspecies indicates that growth rate is positively correlat-ed with increasing temperature and that generationtime decreases, allowing more productivity in warmerclimates (Huntley and Lopez, 1992).The oceanographicconditions in the epipelagic layer are not consideredcrucial for copepod reproduction in the Bering Sea,since copepod species reproduce in relatively stabledeeper layers below 500 m. However, calanoid copepodbiomass was much higher in the eastern Bering Sea
Fig. 13.37. Comparison of vertical temperature (ºC) sectionsacross the Kamchatka Strait on August 13–14, 1991 (black lines,after Stabeno et al., 2001) and June 27, 2002 (blue lines,TINRO-Center data,Vladivostok). Pink area indicates the layers wherethe water temperature was higher in 2002, green area – in 1991.
Chapter 13 • Fisheries and Aquaculture 755
middle shelf in warm years (Smith and Vidal, 1986),probably due to higher growth rates.These findings sug-gest that climate change to a warm period enhancesecosystem productivity from the lower trophic levels,particularly for planktonic crustaceans.
13.5.3.2. Effects on sea-ice formation,distribution, and longevity
If it is assumed that any future climate change maintainsthe scale and periodicity of recent climate changeevents in the Bering Sea, then the period of meridional-type predominance in the wind transport above theBering Sea, which began in the early 1990s, may last for10 to 12 years before changing to a period of enhancedzonal transport. During the warm 1980s the zonal pat-tern of atmospheric circulation predominated (Luchinet al., 1998), as was the case in the 1920s and 1930s(Shuntov and Vasilkov, 1982). Periods of decreasedzonal atmospheric circulation index (Girs, 1974) arecharacterized by colder arctic air masses over theBering Sea region and a decrease in air temperature.The transitional 1989 to 1990 years were also charac-terized by a decrease in the zonal atmospheric circula-tion pattern above the far-eastern seas (Glebova, 2001;Overland, 2004).
Sea-ice distribution and residence time are frequentlyregarded as integral with the thermal regime of theBering Sea pelagic zone (Ikeda, 1991; Khen, 1997;Luchin et al., 2002; Niebauer et al., 1999; Overland,1991;Wyllie-Echeverria and Ohtani, 1999).Thedynamics of sea-ice conditions directly depend on theintensity of the shelf water cooling in winter, winddirection, and water exchange between the shelf andthe open sea. Similarly, ice conditions determine theintensity and degree of winter convection, the forma-tion of cold near-bottom shelf waters, and the temper-ature distribution of surface and intermediate layers.The extent and timing of the sea ice also determine thearea where cold bottom water temperatures will per-sist throughout the following spring and summer.This area of cold water, known as the “cold pool”,varies with the annual extent and duration of the icepack, and can influence fish distributions. For example,adult pollock have shown a preference for warmerwater and exhibit an avoidance of the cold pool(Wyllie-Echeverria, 1995) such that in colder yearsthey utilize a smaller proportion of the shelf watersand in warm years have been observed as far north asthe Bering Strait and the Chukchi Sea.
13.5.3.3. Oscillating control hypothesis
During warm periods, favorable environmental condi-tions after the seasonal sea-ice retreat can result in asignificant increase in the Bering Sea biological produc-tivity. In contrast, physical factors during cold periodsadversely affect zooplankton growth and biomass, andthus the viability of the pelagic fish juveniles feeding onthis production.The “oscillating control hypothesis”
proposes that the southeastern Bering Sea pelagicecosystem alternates between primarily bottom-upcontrol in cold regimes and primarily top-down con-trol in warm regimes (Hunt et al., 2002). Late iceretreat (late March or later) leads to an early, ice-associated bloom in cold water (as occurred in 1995,1997, and 1999), whereas no sea ice, or early iceretreat before mid-March, leads to an open-waterbloom in May or June in warm water (as occurred in1996, 1998, and 2000). Zooplankton, particularlycrustaceans, are sensitive to water temperature. Inyears when the spring bloom occurs in cold water, lowtemperatures limit the production of zooplankton, thesurvival of larval and juvenile fish, and their recruit-ment. Such a phenomenon may be important for largepiscivorous fish, such as walleye pollock, Pacific cod,and arrowtooth flounder.When continued over decadalscales, this situation leads to bottom-up limitation anda decreased biomass of piscivorous fish. Alternatively,in periods when the bloom occurs in warm water, zoo-plankton populations should grow rapidly, providingplentiful prey for larval and juvenile fish. In the south-eastern Bering Sea, important changes in the biotasince the mid-1970s include a marked increase in thebiomass of large piscivorous fish and a concurrentdecline (due to predation) in the biomass of foragefish, including age-1 walleye pollock, particularly overthe southern part of the shelf (Hunt et al., 2002).
13.5.3.4. Effects on forage fish
Spatial distributions of forage fishes including herring,capelin, eulachon (Thaleichtys pacificus), and juvenilecod and pollock indicate temperature-related differ-ences (Brodeur et al., 1999;Wyllie-Echeverria andOhtani, 1999). Annual capelin distributions exhibit anexpanded range in years with a larger cold pool andcontract in years of reduced sea-ice cover. Although theproductivity of capelin stocks in relation to tempera-ture is not known, population growth of this relativelycold-water dwelling fish is not expected under the con-ditions of a warm regime. As discussed, capelin biomassincreased when the abundance of walleye pollock andPacific herring were low in the western Bering Sea(Naumenko et al., 1990), possibly due to a reduction inpredation pressure of these species on capelin larvae.The eastern Bering Sea herring stocks showedimproved recruitment in warm years (Williams andQuinn, 2000), similar to herring stocks on the Pacificcoast of the United States where the timing of spawn-ing is also temperature related (Zebdi and Collie,1995). In the western Bering Sea, Pacific herring havealso demonstrated a dependence on reproductive suc-cess related to the thermal conditions of coastal waters.However, herring stock increase and large-scale fisheryrestoration are related to the “historically most abun-dant” (Naumenko, 2001) year class, which appeared inthe anomalously cold year of 1993. Generally, strongherring year classes have appeared in the westernBering Sea in years with high sea surface temperaturesin May but the lowest sea surface temperatures in June
756 Arctic Climate Impact Assessment
(Naumenko, 2001). After 2000, herring biomassdecreased in the western Bering Sea but still exceedsthe average level for the last warm period (1977–1989). In general, the distributions of all forage speciesfrom trawl surveys in a cold year (1986) were morewidespread and with greater overlap among speciesthan in a warm year (1987) (Brodeur et al., 1999).
13.5.3.5. Effects on pollock stocks
Pollock larvae concentrate in the water mass under theseasonal thermocline (Nishiyama et al., 1986). Moreproductive year classes of pollock coincided with bet-ter nursery conditions for their larvae, which wererelated to a well-developed thermocline (pycnocline),large biomass of copepod nauplii, and low abundanceof predators (Bailey et al., 1986; Nishiyama et al.,1986; Shuntov et al., 1993).The first two factors arerelated to warm conditions in the Bering Sea epipelagiclayer. Age-1 pollock may also be distributed throughoutthe cold pool and move between water masses. Duringcold conditions, predation pressure on age-1 pollock isintense by their major piscine predators (adult pollock,arrowtooth flounder, and Pacific cod). As the cold poolreduced, predation on age-1 pollock increased due tooverlapping distributions of Greenland halibut, yellowIrish lords (Hemilepidotus jordani), and thorny sculpins(Icelus spiniger) (Wyllie-Echeverria and Ohtani, 1999).The total biomass of the first group of predators wasmuch higher in the 1980s than the second group(Aydin et al., 2002) and has remained higher until thepresent, despite some declines in western Bering Seawalleye pollock and cod stocks. In addition, the secondgroup of predators comprises relatively small-sized fish(except Greenland halibut) and age-1 pollock couldavoid predation through higher growth rates duringwarm conditions. In the relatively warm 1980s, strongyear classes of pollock occurred synchronouslythroughout the Bering Sea (Bulatov, 1995) and coincid-ed with above-normal air and bottom temperaturesand reduced sea-ice cover (Decker et al., 1995; Quinnand Niebauer, 1995).These favorable years of produc-tion were due to high juvenile survival and are relatedto how much cold water habitat is present (Ohtani andAzumaya, 1995), the distribution of juveniles relativeto the adult population to avoid predation (Wespestadet al., 2000), and enhanced rates of embryonic devel-opment in warmer water (Haynes and Ingell, 1983).Strong year classes of pollock were also observed inthe eastern Bering Sea in the 1990s (Stepanenko,2001), which may be related to the higher frequency ofENSO events, which contributed to heat transportthroughout the region (Hollowed et al., 2001).However, there were no strong year classes of pollockin the western Bering Sea in the 1990s.This could bedue to a general cooling of the Bering Sea climate andthe oceanographic regime in a period of less intensivePacific water inflow in the 1990s.The pelagic layerheat budget may need to be similar to that of the late1970s and 1980s for the pollock reproduction condi-tions to improve in the Bering Sea as a whole.
13.5.3.6. Effects on other groundfish
Time series of recruitment and stock biomass have beenexamined for evidence that climate shifts induceresponses in the production of groundfish species in theBering Sea and North Pacific Ocean (Hollowed andWooster, 1995; Hollowed et al., 2001). Even thoughresults from these studies can be highly variable, strongautocorrelation in recruitment, associated with thesignificant change in climate in 1977, was observed forsalmonids and some winter-spawning flatfish species.Substantial increases in the abundance of Pacific cod,skates, flatfish, and non-crab benthic invertebrates alsooccurred on the Bering Sea shelf in the 1980s as evi-denced from trawl survey CPUE (Conners et al., 2002).This warm period was characterized by larger researchcatches and a change in the benthic invertebrate speciescomposition from a system largely dominated by crabsto a more diverse mix of starfish, ascidians, and sponges.
In the southwestern Bering Sea, transition from the rel-atively warm period of 1977 to 1989 to the subsequentcool period was also evident in the groundfish commu-nity.The proportion of Pacific cod decreased from 80%in 1985 to 12 to 26.3% in the 1990s, while sculpin(8.2% in 1985) and flatfish (9.3% in 1985) proportionsincreased by 15.1 to 31.5% and 24.2 to 39.6%, respec-tively (Gavrilov and Glebov, 2002). Anthropogenic fac-tors can also affect the state and dynamics of benthiccommunities. For example, large fishery removals ofred king crab occurred in the 1970s and may have con-tributed to the reorganization of the benthos in theeastern Bering Sea.The climatic change related torecruitment success for winter-spawning flatfish may beassociated with cross-shelf advection of larvae to favor-able nursery areas, instead of with water temperature(Wilderbuer et al., 2002).
Sea-ice conditions and water temperatures can influencefishery effectiveness in addition to fish stock distribu-tions and abundance. Coldwater effects have beenobserved in the behavior of flatfish species that maycause changes in the annual operation of the fishery.Because cold water causes slower metabolism in highlatitude fish stocks, spawning migrations of yellowfinsole may be delayed in cooler years (Wilderbuer andNichol, 2001), which can alter the temporal and spatialcharacteristics of the fishery. In addition, high catchrates have been obtained by targeting yellowfin soleclose to the retreating ice edge, which has a high tem-poral variability and in warm years only occurs in areasnorth of the spring distribution of yellowfin sole.The catch process can also be affected as it is believedthat flatfish bury themselves in muddy substrate duringcold years and so become less vulnerable to herding bythe sweep lines of bottom trawls (Somerton andMunro, 2001).This would result in lower catch rates incold years for shelf flatfish species.These temperature-related behavior effects may also occur in other com-mercial species, particularly in pelagic fish, which reactto avoid capture (Sogard and Olla, 1998).
Chapter 13 • Fisheries and Aquaculture 757
13.5.3.7. Effects on salmon
Throughout their century-long exploitation, Alaskansalmon stocks have had periods of high and low produc-tion which persist for many consecutive years beforeabruptly reversing to the opposite production state.These production regimes coincide with low frequencyclimate changes in the North Pacific Ocean and the sub-arctic Bering Sea (i.e., the Pacific Decadal Oscillationand the Aleutian Low Pressure Index). In the 1930s andearly 1940s, and then again in the late 1970s, BeringSea salmon catches reached high levels during warmtemperature regimes in their oceanic habitat. It ishypothesized that improved feeding conditions may pre-vail during warm oceanic regimes (Hare and Francis,1995).There is also evidence of an upper thermal toler-ance for salmon species that has set limits on their dis-tributions (Welch et al., 1995), but it is doubtful thatthis effect would occur in the Bering Sea because thehistorical temperature range there is much lower.
13.5.3.8. Effects on crab stocks
The three species of crab that inhabit the easternBering Sea shelf (red king crab,Tanner crab, and snowcrab) exhibit highly periodic patterns of increasedabundance. Rosenkranz et al. (2001) investigated fivehypotheses on factors affecting year class strength ofTanner crab in Bristol Bay in order to understand thesepatterns.They determined that anomalously cold bot-tom temperatures may adversely affect the Tanner crabreproductive cycle and that northeast winds maypromote coastal upwelling, which advects larvae toregions of fine sediments favorable for survival uponsettling. Incze et al. (1987) linked low densities ofcopepods inside the 70 m isobath of Bristol Bay withlow abundance of Tanner crab larvae. An examinationof recruitment patterns of red king crab in relation todecadal shifts in climate indicates that the Bristol Baystocks are negatively correlated with the deepening ofthe Aleutian Low and warmer water temperatures(Zheng and Kruse, 2000). Red king crabs were alsomoderately exploited during the late 1970s, whichcontributed to the population decline.
13.5.4. Possible impacts of climate changeon fish stocks
Given the present state of knowledge of complex marineecosystems such as in the Bering Sea, it is not possible topredict with any certainty the effects of future atmo-spheric forcing, in this case increased sea surface tem-perature, on commercial fish and invertebrate species.Evaluation of a future state of nature would requireknowledge of the future values of many ocean–atmosphere parameters to describe how these changeswould be manifested in upper trophic level commercialstocks.These parameters include storm activity and fre-quency, wind direction and intensity, shelf stratificationcharacteristics, effects on circulation and transport activ-ity, sea level pressure (location and intensity of the
Aleutian Low pressure system), and precipitation as wellas projections of sea surface temperature.
Three future climate scenarios are considered for theBering Sea: no change from present conditions; moder-ate warming; and considerable warming.
13.5.4.1. No change
Under the no-change scenario the Bering Sea climatewill continue to exhibit decadal-scale shifts alternatingbetween warm and cool periods.These shifts in temper-ature regime have been shown to favor some specieswhile their effect on others is unclear (section 13.5.3.4to 13.5.3.8).
Under the present US and Russian management sys-tems, it is expected that fish and invertebrate popula-tions would be at or rebuilt to target spawning biomasslevels as dictated by the management plans.This shouldresult in an increase in total catches from the BeringSea. Over the long term, however, a large total averageincrease is unlikely, but could nevertheless be consider-able in individual cases.
13.5.4.2. Moderate warming
A moderate warming scenario can be developed byextrapolating trends characterizing the decadal-scalevariability in the key physical factors influencing theBering Sea ecosystem. On the basis of a moderateincrease in air temperature (of 1 to 3 ºC) and ageneral warming of the upper pelagic zone, severalchanges are likely:
• an increase in the zonal type repetition of atmo-spheric circulation for the early 2000s and for theperiod of the next 11-year cycle of solar radiation;
• an increase in storm activity and wind-inducedturbulence for the same period;
• a gradual increase in water exchange with thePacific Ocean, reaching a maximum in 2015 to2020; and
• reduced sea ice, accelerated by an increase in airtemperature, for the next 10 to 20 years afterwhich time sea ice might increase again.
Variability in solar radiation correlates with many phe-nomena (Schumacher, 2000). It is a potential forcingmechanism for decadal-period oscillations of the coupledair–ice–sea system in the northern-hemisphere (Ikeda,1990). Changes in solar fluxes correlate with change inthe height of an atmospheric pressure surface in the tro-posphere of the northern-hemisphere (correlation co-efficient = 0.72;Van Loon and Shea, 1999). Spectralmaxima occur roughly every 7–17 (with an average of11) and 22 years.The North Pacific Index also has phas-es similar to those noted for changes in solar radiation(Minobe, 1999). Storm activity and wind-induced turbu-lence of the sea surface layer are determined by thetracks and strength of cyclones, which are in turn deter-
758 Arctic Climate Impact Assessment
mined by the nature of the pressure field. In the BeringSea, a strong Aleutian Low is the source of most of thestorm energy, and results in intense mixing of the seasurface layer in winter. Strengthening of the AleutianLow occurs in years of zonal air transfer predominance(Shuntov, 2001). Such interrelations enable a predictionof high storm activity and wind-induced turbulence forall of the next 11-year cycle of solar activity.
Available information for the recent warm period inthe Bering Sea suggests that primary productivity, andthus carrying capacity, would be enhanced under thewarming scenario. However, because mixed-layerdepth and water movements are not available for thisscenario, the extent of this increase cannot be predict-ed owing to uncertainties concerning the renewal ofthe nutrient supply essential for sustaining the phyto-plankton and zooplankton blooms. Also, as springblooms are associated with the ice edge, a decrease insea-ice extent associated with climate warming could
delay the onset of primary production in spring (Huntet al., 2002). High water-column stability, whichoccurs at the ice edge during ice retreat, also supportsintense phytoplankton blooms.
Recent studies on phytoplankton sinking velocities showthat diatom cells sink more quickly than flagellates,which are lighter (Huisman and Sommeijer, 2002).Thus,it is possible that iceless winters could create unfavorableconditions for diatom blooms.This implies that climatewarming could result in decreased biological productionin the Bering Sea until the start of the projected increasein sea-ice cover after 2010.The dynamics of the BeringSea sea-ice conditions are characterized by several peri-ods of cyclic recurrence, ranging from 2–3 to 50 years(Plotnikov, 1996; Plotnikov and Yurasov, 1994; Ustinovaand Sorokin, 1999). Obviously, this series is short for anexact tracking of the 50-year cycle. However, dramaticshifts in ice-cover anomalies were noted in the Beringand Chukchi Seas between 1976 and 1979, which divide
Group Increase inwater
temperaturein upper
pelagic layer
Increase inwind stress,
zonal transportoscillation
Increase inwater
exchangewith Pacific
Ocean
Mild sea-iceconditions
Prevalent biologicaleffects related to thephysical environment
Table 13.2. Changes to stocks in the western Bering Sea and projected stock dynamics in response to a moderate warming(+ positive effect evident, - negative effect evident, 0 no effect evident or unclear effect).
positive trend in stock abundance negative trend in stock abundance no trend expected or uncertain trend
Chapter 13 • Fisheries and Aquaculture 759
the 1952–1994 data series into two distinct periods,which differ by 5.4% in average values (Niebauer et al.,1999). Alternatively, a warmer period could increasethermal stratification such that the bloom, which is notice-dependent, would start sooner. However, it couldalso be that the nutrient supply is quickly depleted dur-ing a short and intense bloom and that photosynthesis isslowed. In addition to upwelling and nutrient recyclingin the pelagic layer, Pacific water inflow is also a sourceof nitrogen and phosphorus. Intensification of waterexchange with the Pacific Ocean under climate warmingis thus likely to result in increased primary production inthe Bering Sea (Shuntov et al., 2002, 2003; Ustinova,and Sorokin, 1999). Increased levels of primary produc-tion are usually associated with improved survival forjuveniles of most fish species (Cushing, 1969) and sub-sequent contribution to the adult spawning stock.
Predictions of the relationship between climate changeand commercial species distribution, abundance, andharvest patterns are based on the assumption that futuremanagement policies will be the same as at present.Namely, that target fishing mortality values will bedesigned to maintain the female spawning stock at aminimum of 40 to 60% of the unfished level (dependingon species). Also, that when stocks are assessed to bebelow this level, harvest is reduced proportionally torebuild the spawning stock to the target level.Thisapproach is likely to result in fisheries for species whichrespond favorably to warmer conditions realizing greatercatches and possibly shifting to areas of increased abun-dance or expanded habitat, while fisheries for specieswhich are negatively affected by a warmer climate arelikely to have smaller quotas, reduced areas of operation,and even vastly different areas.
Literature documenting changes in the Bering Sea ecosys-tem under the previous warm period suggests thatincreases in the abundance of many groundfish species arevery likely under future warming. Pollock, Pacific cod,Pacific halibut (Clark and Hare, 2002), skates, some flat-fish species, salmon, eastern Bering Sea herring, andTanner crab are all likely to benefit under warmer condi-tions (Table 13.2), although the mechanisms underlyingthe increase are not clear in most cases. Strickland andSibley (1984) proposed a possible northward expansionof pollock feeding and spawning habitat under a warmingscenario due to reduced sea-ice cover, water columnstratification, and increased food supply.
There are very likely to be many changes in the BeringSea ecosystem following a change to warmer conditionsfrom those at present. Centers of capelin distributionare likely to move northward to colder waters andforego the large areas of spawning habitat that would beavailable in colder years. Polar cod and five species ofmarine mammals that are associated with the ice edge(harbour seal, Steller sea lion, sea otter, beluga whale,and Dall’s porpoise) are likely to be restricted to theChukchi Sea for large parts of the year. Red king crab,which decreased in abundance during the past warming
period, is unlikely to do well under future warming.Deep-water species such as Greenland halibut areunlikely to be affected during their larval and juvenilestages, except when they are present in shallow water.Greenland halibut recruitment is likely to be enhancedin colder years, perhaps due to a decrease in overlapwith adult pollock (Livingston et al., 1999). Similarly,predation by large piscivorous fish is likely to affect thepandalid shrimp stocks; these shrimp species are amongthe preferred prey of Pacific cod during summer feed-ing in the northern Bering Sea, especially for newrecruits (Napazakov et al., 2001). Predation on shrimpstocks is likely to increase with increased recruitmentof Pacific cod. Annual consumption of gonatid squidspecies was estimated at 4.2 million t in the Bering Seafor the late 1980s (Radchenko, 1992). A growth insquid stocks is unlikely under a warming regime due topredicted increases in the abundance of their mainpredators (except for Greenland halibut). Increasedabundance of sculpins and western Bering Sea herringin the 1990s was attributed to the weakening of inter-specific competition in the pelagic and benthic fishcommunities by Naumenko et al. (2001).These stocksare likely to experience future decreases due to increas-es in pollock stock size.
Although some flatfish species on the Bering Sea shelfhave shown increased productivity under warmer condi-tions, their distributions are unlikely to shift in responseto ocean temperature.These species migrate to deeper,warmer waters in winter (where some spawn) and thenmigrate to the mid-shelf area in spring and early sum-mer where they feed on the benthic infauna. Site fidelityis important for feeding purposes and these species arelikely to tolerate moderate thermal changes. Habitatspecialists, which have successfully developed niche pref-erences, are much less likely to be affected by climatechange than “colonizing” species which have a morediverse diet so might be inclined to shift with the chang-ing conditions. Such characteristics are expected toinfluence the extent to which fisheries would changeunder a warmer climate. However, the total fisherycatch occurring under a climate change scenario wouldonly increase to the extent allowable under currentmanagement practices.This also corresponds to histori-cal data for the western Bering Sea fishery (Fig. 13.35).Attempts to forecast this increase, as described in therest of this section, are based on the previously achievedmaximum fishery harvest and assume that current man-agement philosophies continue.
The maximum pollock catch in the Bering Sea was 4.07million t in 1988, and averaged 3.55 million t between1986 and 1990 (Fadeev and Wespestad, 2001).The totalwalleye pollock biomass in the Bering Sea over thatperiod was about 20 million t (Shuntov et al., 1997).Conventional wisdom assumes that the 1990s stockreduction was due to a decrease in productivity inresponse to environmental conditions rather than tooverfishing.This means that the pollock harvest in thefavorable period of the late 1980s can be used as the ref-
760 Arctic Climate Impact Assessment
erence point for predicting future catch for the project-ed warm period. As a rule, an increase in the pollockfishery stock is due to several average and strong yearclasses, as in the latter 1960s, or one super-strong yearclass. A super-strong generation appeared in the BeringSea in 1978 and ensured a stabilization of stock abun-dance and the development of the large-scale pollockfishery at the end of the 1980s (Stepanenko, 2001).The eastern Bering Sea population of pollock almostdoubled between 1995 and 2001 and supports an annualcatch of more than 1 million t with strict regulations.The stable condition of this population provides for thelikely increase in future abundance associated with amoderate climatic warming. However, the 1978 yearclass occurred 13 years after the first strong year class in1965 (Wespestad, 1993) and no cohorts of this strengthhave been observed since.Thus, a swift increase in stocksize and catch of pollock in the near future is unlikely.
The annual Pacific cod harvest ranged from 33100 to117650 t and averaged 65210 t in the western BeringSea during the period of Dutch seine trawls and, to alesser degree, longline fisheries between 1981 and 2001.The catch for the whole Bering Sea for that periodtotaled 207110 t.This is a relatively low catch comparedto an estimated cod biomass of 3.27 million t. AdultPacific cod are the main predator for some commerciallyimportant fish (e.g., pollock and herring) and crus-taceans, particularly Tanner crab and shrimp. Relative totheir weight, one unit of Pacific cod biomass consumesabout 1.11 biomass units of Tanner crab juveniles, 1.12of shrimp, 0.8 of walleye pollock, 0.39 of squid, and0.31 of herring on the western Kamchatka shelf duringthe six months of the warm season (Chuchukalo et al.,1999).Whether an assumed increase in fishing pressureis justifiable for the purpose of decreasing predation byPacific cod on other species in the ecosystem is underinvestigation. If the Pacific cod stock attains the sameabundance in the Bering Sea as in the mid-1980s, it islikely that the total harvest could be increased (in boththe western and eastern Bering Sea) to the level experi-enced in the 1980s and 1990s, i.e., around 350000 t.
Between 1981 and 1991, herring fisheries in the south-eastern Bering Sea, in the vicinity of the Alaskan coast,harvested around 30000 t, while harvests in the south-western part of the Bering Sea (Fig. 13.38) were around17000 t over this period, relative to a total biomasslevel of nearly 500000 t.The same level of harvest islikely for the next warm period.The western BeringSea “fat herring” fishery is very likely to decline duringthe next decade, but the Alaskan roe-sac herring fisheryis likely to increase.
The Pacific salmon fishery recently surpassed its topharvest level in the northeastern Kamchatka area due tothe record pink salmon catches in 1997 (82300 t) and1999 (83600 t). However, some decline is likely tooccur there since the local stocks of other Pacificsalmon species are not as abundant.The chum salmoncoastal catch did not exceed 12200 t, while the sockeyesalmon catch did not exceed 7000 t for these years.However, these relatively high catches were made in thelatter half of the 1990s. On the basis of the 5-years rateof increase in the 1990s, the total chum and sockeyesalmon harvest could reach a surplus of 20 and 12%,respectively, by the end of the 2020s. Eastern BeringSea salmon production is dominated by sockeye salmonwhich contributed 41 million fish from a total catch of42 million Pacific salmon in Bristol Bay in 1993.This was a historical record and followed the previousrecord of 37 million fish (101550 t) in 1983 (NationalResearch Council, 1996).The Bristol Bay sockeye stockhas since declined and is presently in a period of lowproduction. Stock dynamics observed over the 1960s to1990s (Chigirinsky, 1994) suggest that periods of lowproductivity can last for 15 to 20 years and with anaverage annual sockeye catch of about 20000 t.However, if moderate climatic warming is favorable forPacific salmon growth and survival during the marinepart of its life cycle, it is likely that the annual catch willapproach that of the previous warm period (1977 to1993), i.e., about 110000 t.The proportion of sockeyesalmon is very likely to increase from the mid-2000s tothe 2020s from 25 to 30%, to 50 to 55% of the totaland the proportion of pink salmon will decreaseaccordingly. Chum salmon are very likely to take thirdplace, chinook salmon fourth, and coho salmon fifth.
Although flatfish biomass will possibly increase in futurewarm periods, the catch is likely to remain low due tobycatch and market constraints.The Atka mackerel(Pleurogrammus monoptergius) of the Aleutian Islands,skates, smelt, and saffron cod (Eleginus gracilis) of thesoutheastern shelf are other potential stocks in goodcondition. Development of new markets for these fish-ery products could increase future harvests. Commentsconcerning a future crab fishery in the Bering Sea cannotbe made as it is not well understood which environmen-tal conditions would enable better survival and growthof crab larvae and juvenile stages. Also, the reasons forthe sharp crab stock decrease in the Bering Sea in the1980s are not known and there is debate as to whetherthe decline was due to overfishing or environmental
Fig. 13.38. Long-term changes in pelagic fish biomass in thewestern Bering Sea, 1951–2000 (after Naumenko et al., 2001).
Chapter 13 • Fisheries and Aquaculture 761
change. Polar cod, capelin, sculpin, mesopelagic fish,shrimp, and squid fisheries are presently undeveloped inthe Bering Sea, and no precondition exists to developthese fisheries under a warmer climate regime. Somebycatch of commander squid (Berryteuthis magister magis-ter) and sculpins in the trawl fishery for pollock in theDutch seine fishery on groundfish is used, but the totalvalue of this harvest is insignificant.
13.5.4.3. Considerable warming
Since a warming of >4 ºC has not previously beenobserved, it is not possible to comment on changeswhich might occur in the marine ecosystem based onpast cause and effects. It is likely that the distributionsof many species would shift poleward and that therewould be significant changes in the arctic ecosystem.Ice-associated species would encounter a shrinking habi-tat and there would be greater potential for stock col-lapse for species forced to forego past areas of desirablespawning and nursery habitats due to thermal intoler-ance.The species succession likely under a scenario ofconsiderable warming is not known, but a suddenreduction in the economic potential of Bering Sea fish-eries is possible.
13.5.5.The economic and socialimportance of fisheries
In comparison to other areas of the Arctic, the commer-cial fisheries of the North Pacific, including the Sea ofOkhostk, and the Bering Sea, are relative newcomers.Near-shore artesanal fisheries by indigenous peopleshave occurred for centuries in the Bering Sea (Frost,2003; Ray and McCormick-Ray, 2004; see also Chapters3 and 12).The first documented commercial exploita-tion of groundfish dates back to 1864, when a singleschooner fished for Pacific cod in the Bering Sea (Cobb,1927), although salmon were part of commerce duringearlier times. In 1882, American sailing schooners begana regular handline cod fishery. As recorded in Russianliterature, the California-based fishers ceased to sail tofish in the Sea of Okhotsk after the cod shoals near theShumagin Islands in the Gulf of Alaska were discovered.In the western Bering Sea, the early Russian fisherieswere poorly developed and limited to near shore subsis-tence fishing by indigenous peoples and settlers (Ray andMcCormick-Ray, 2004). However, even at this early datethe Bering Sea was known to contain a rich resource offish.The herring fishery area expanded northward to theBering Strait and operated during two weeks in Maywhen herring migrated near the coasts.The Pacificsalmon fishery yielded 12 million fish each year of which2 to 4 million fish were from the Yukon Delta area, whilethe remainder were caught by Russian developmentcompanies and Japanese corporations operating conces-sions on Russian rivers (Netboy, 1974).
In contrast to the slow development of the early fish-eries, the hunting of marine mammals developed rapid-ly. In the western Bering Sea, the fur seal harvest
ranged from 20000 to 50000 animals on the Com-mander Islands. A Russian–American Company wasmainly responsible for the hunting and fur purchaseoperations in the eastern Bering Sea, Gulf of Alaska,and Aleutian Archipelago regions between 1786 and1862.The sea otter harvest totaled 201403 animalsduring the time of the Russian–American Company ofwhich nearly a third was purchased by merchants fromthe indigenous peoples. Other marine mammal har-vests included sea lion hunting on St. George Island(on the Pribilof Archipelago), which yielded 2000 ani-mals per year, and walrus hunting, which yielded 300to 2000 animals per year until the harvest was reducedin the 1830s due to a declining population. Owing tooverexploitation, the fur seal breeding grounds disap-peared from the Pribilof Islands, Unalashka Island, andadjacent areas in 1830 to 1840. From 1743 to 1823,2324364 fur seals, 200839 sea otters, about 44.2 t ofwalrus tusk, and 47.8 t of baleen were harvested fromthe Aleutian Arc, other islands, and the Alaskan coast.The first protective measures on fur seal populationsfrom Japanese and American illegal sealers were set byRussia in 1893.There is an illustration of this in theRudyard Kipling ballad The Rhyme of the Three Sealers:
Now this is the Law of the Muscovite, that he proves withshot and steel
When ye come by his isles in the Smoky Sea ye must nottake the seal.
In 1911, a three-sided treaty was concluded betweenRussia, the United States, and Japan, which established asealing prohibition on the high seas in exchange for com-pensation paid from harvests in the rookeries (Miles etal., 1982a,b).
Large-scale commercial exploitation of the Bering Seafish stocks developed slowly. Between 1915 and 1920,as many as 24 US vessels fished Pacific cod. Annual har-vests ranged from 12000 to 14000 t (Pereyra et al.,1976). Small and infrequent halibut landings were madeby US and Canadian fishers between 1928 and 1950,which increased sharply and exceeded 3300 t between1958 and 1962 (Dunlop et al., 1964). In the early1970s, the halibut catch fell to a low of 130 t beforerecovering to a high in 1987, and then slowly declined.The International Pacific Halibut Commission, estab-lished by Canada and the United States in 1923 to man-age the halibut resource, determined that factors suchas over-exploitation by the setline fishery, juvenile hal-ibut bycatch, and adverse environmental conditions ledto the decline in abundance (National ResearchCouncil, 1996). In the western Bering Sea, theexploitation of groundfish resources was mainly bysmall-scale coastal operations. Information on ground-fish abundance was lacking until the first Soviet PacificIntegrated Expedi-tion in 1932 to 1933.This coveredthe entire Bering Sea and found the eastern shelf andcontinental slope to be more productive fishing groundsthan the narrower western ones. As a result, Soviet fish-
762 Arctic Climate Impact Assessment
eries concentrated their efforts in the eastern BeringSea after 1959. By the mid-1960s, newly organizedSoviet fishing on the eastern Bering Sea shelf and in theGulf of Alaska yielded about 600000 t of Pacific oceanperch, yellowfin sole, herring, cod, crabs, and shrimps(Zilanov et al., 1989).
The Japanese and Russian fleets expanded rapidlybetween 1959 and 1965, with vessels from the Republicof Korea and other nations also participating in lateryears.These fishery efforts were added to the solelyJapanese fishery efforts, which have actively operated inthe Bering Sea since the 1930s, especially after theSecond World War. By 1960, 169 vessels from Japanwere present on the Bering Sea fishing grounds alongwith 50 to 200 vessels from the Soviet Union (Alversonet al., 1964). Significant growth in fishing effort led tooverfishing of several stocks.The Soviet walleye pollockfishery began in the early 1970s after the decline of somecommercially valuable fish stocks. Before that, walleyepollock was not regarded in the Soviet fishery as a targetspecies.The Japanese mothership operations had three tofive conventional catcher/trawlers and as many as eightpairs of trawlers associated with each mothership(Alverson et al., 1964).The catch was processed at seawith the frozen products transported ashore for food.Japanese catches were mostly processed aboard mother-ships into fishmeal, with livers extracted for vitamin oil.Female walleye pollock in spawning condition soonbecame an important source of roe-bearing fish, whichwere processed into valuable products such as differentkinds of fish roe and surimi.The increase in productvalue, combined with an increase in pollock abundanceafter the latter half of the 1960s led to the gradualincrease in catch: up to 550000 t in 1967 and 1307000 tin 1970 (Fadeev and Wespestad, 2001). Groundfishcatches were mainly by vessels from Japan and the SovietUnion until 1986, when US fishing vessels participating
in joint ventures with foreign processing vessels took alarger proportion of the catch. By 1990, the distantwater fleets were phased out of the eastern Bering Sea(the US EEZ) and US fishing vessels became the sole par-ticipants in the fishery. Some fishing occurs under licensefrom the Russian Federation in its EEZ.
13.5.5.1. Fisheries
United States fisheries off Alaska constitute more thanhalf of landings and about half the value of nationallandings of fish and shellfish from federal waters(NMFS, 2003a). Depending on species, approximately90% of the landings in Alaska are from the BeringSea/Aleutian Islands area. All the groundfish, crab, andsalmon in the US EEZ of the Bering Sea are caught bydomestic fishing bodies (Hiatt et al., 2002). In theRussian EEZ the majority of the harvests are taken bydomestic fleets with a decreasing amount harvestedunder agreements with neighboring states. In 1997 it isestimated that the Russian Far East fisheries accountedfor 70% of the Russian Federation total fisheries pro-duction (Conover, 1999; Zilanov, 1999), however thisproportion may be decreasing due to the declines inpollock, crab, herring, and other species not being off-set by the increases in Pacific salmon.
In the Bering Sea, walleye pollock is the major harvestby volume and value, with Pacific cod, flatfish, salmon,and crabs constituting most of the rest (Table 13.3).The total wholesale (raw fish landings) value for ground-fish harvests in the eastern Bering Sea was approximatelyUS$ 426 million in 2001.The total primary processedvalue was approximately US$ 1.4 billion. Crab harvests,mainly from the Bering Sea/Aleutian Islands area,amounted to US$ 124 million even at the low popula-tion abundances noted earlier (Hiatt et al., 2002). Pacificsalmon, a large amount of which comes from the Bristol
Table 13.3.Trends in abundance and value of major Alaskan fisheries (inflation-adjusted US dollars) (Alaska Department of Fish andGame, as cited by Pacific Fishing, January 2002).
Species Stock 1977 Value 1977 Stock 2001 Value 2001 Discussion
Salmon 200 million fish US$ 500 million withpeak value in 1988 of US$ 1.18 billion
175 million fish US$ 205 million A small decrease in totalcatch but a large decreasein price due to competi-tion with farmed fish
Groundfish Very small US harvest
US$ 2–3 million but rapidly increasing to US$1.0 billion in 1988 as aresult of Americanization
1.65 million t harvested
US$ 400 million Whitefish markets strong yet price weak but US dollar also weak
Shellfish (primarilycrab species butsome shrimp inearly years)
Red king crabstrong, otherspecies small harvests
US$ 440 million. Dropswhen red king crab bubble bursts but Opilio crab takes over
Most species atlow levels
US$ 125 million Strong competition inOpilio fishery fromEastern Canada but weakcompetition from Russia
Pacific halibut Low catch mostlikely due to for-eign fleet bycatch
Less than US$ 30 million High abundance US$ 150 million Strong stocks and goodprice vis a vis other white fish
Herring Low abundance Less than US$ 30 millionalthough value increasedin mid-1980s/mid-1990sto US$ >50 million
Low abundance Less than US$ 30 million
Herring in same situationin 1977 and 2001
Chapter 13 • Fisheries and Aquaculture 763
Bay and Yukon River areas, had a Bering Sea catch valueof between US$ 122 million (2001) and US$ 179 mil-lion (2000) (Link et al., 2003).The Community Devel-opment Quota (CDQ) Program, which allocates 10% ofthe total Bering Sea TAC to 65 coastal communitiesorganized into six CDQ corporations, earns more thanUS$ 40 million annually (NPFMC, 2003a). A separatevalue is not assigned in this study to recreation or subsis-tence harvests in the Bering Sea due to lack of adequateanalyses, despite their local and cultural significance.Economic value data for the Russian Far East are difficultto locate (Pautzke, 1997). Press reports for productvalue estimate the total 2001 production to account forUS$ 3.0 billion (Pacific Rim Fisheries Update, May2002). Since the transition to a market economy beganin the early 1990s and the Soviet style management offisheries has changed, it appears that there are significanttracking and reporting difficulties with less fish beinglanded to avoid taxation and fees. Instead, harvests maybe transferred at sea or transported directly to foreignmarkets by fishing vessels (Velegjanin, 1999).Thus, pro-duction and value data must be treated with cautionuntil a more robust accounting system is developed.
13.5.5.2. Fishing fleet and fishers
Almost every fishing vessel in the Bering Sea fleet isregistered outside the region.Vessels must be of requi-site size to weather the environmental conditions and tohave adequate scale efficiencies to operate in the area.These factors plus the lack of deepwater moorings andother support services make the eastern North Pacific alargely “distant water” fishery. Overall, the number ofvessels eligible to fish for the increasing stocks ofgroundfish in the federal waters of the Bering Sea hasdecreased since the mid-1990s from 464 vessels in 1995to 398 in 2001.This is the case for all groundfish vesselclasses and types. In 2001, there were 163 hook andline (longline) vessels, 81 pot vessels, and 162 trawlvessels fishing, of which around 20 were at-sea capture/processors for pollock.The overall decrease in numberresults from rationalization programs for pollock underthe American Fisheries Act 1998 and the North PacificFishery Management Council’s license limitation pro-gram for all species (although this figure does notinclude halibut/sablefish vessels which have IndividualFishing Quota qualification) (Hiatt et al., 2002).For other sectors, there were around 274 eligibleBering Sea/Aleutian Islands crab fishing vessels, 2500catcher longliners (including Alaska state-water vessels)mostly involved in halibut/sablefish and Pacific cod fish-eries, and some 5200 salmon fishing vessels of varioustypes (Natural Resources Consultants, 1999).
Employment in the groundfish harvesting sector (at-seacatching and processing on land as well as motherships)in 2001 amounted to 4000 full-time equivalent jobsincluding skippers, fishing crew, processing crew, andhome office staff (NMFS, 2003b).With few exceptions,most of this employment is in relatively small corpora-tions. North Pacific Fishery Management Council license
limitation regulations limit the size and ability to growof existing catching bodies.Thus, few large integratedharvesting and processing companies exist. Still, eventhe smaller organizations deal in multi-million dollarinvestments with substantial annual operating expenses,e.g., a typical catcher vessel of about 35 to 40 m inlength would require a family owner or small business tohave a fair market value of US$ 2.5 million to 3.5 mil-lion (Natural Resources Consultants, 1999).
In the western Bering Sea, the situation is similar tothat in the Alaskan EEZ. A large part of the harvestingcapacity is located in the southern parts of the area, asare the financial and supply and repair services.The number of fishing vessels has declined drasticallysince the end of the Soviet era distant water fishing,owing to other nations extending their EEZs and toefforts to renew the fishing fleet and to reorganize it onmarket economy terms (Zilanov, 1999). Between 1990and 1999 the Russian fishing fleet decreased by nearly44% in number. Most of the fleet was privatized in theform of joint stock companies (56.7%), or transferredto cooperatives (kolkhozes; 23.7%), private companies(12.5%), or joint Russian–foreign ventures (2.4%)(Zilanov, 1999). In the Russian Far East, this hasenabled small and mid-scale fisheries to develop whilesome large entities under Soviet style fisheries havechanged and remained dominant forces. Likewise, totalemployment in the fisheries sector fell from 550000 in1990 to 398000 in 1998. Contributing to the decline inemployment in the Russian Far East was an exodus ofpeople assigned to duties there returning to families andfriends in their home regions.
13.5.5.3.The land side of the fishing industry
Approximately 70% of the Bering Sea harvests areprocessed on shore in a relatively small number (8) ofgroundfish processing plants near Dutch Harbor/Onalaska (NMFS, 2003b). Recent efforts have beenmade to locate processing facilities on Adak Island in thewestern Aleutians. Crabs are processed on the PribilofIslands during periods of high abundance of red kingcrabs and snow crab in the Bering Sea. Salmon tenderingand processing is focused around Bristol Bay althoughnot exclusively. Sites where processing occurs requiresignificant infrastructure for processing as well as forproviding services to the fishing fleet. Given the remotenature of the Bering Sea fish processing activities, thecommunities in which these occur are highly dependenton the fishing industry for economic activity, with gov-ernment services and tourism distant rivals. Most of thegroundfish processing occurs adjacent to the densestaggregations of groundfish and where catcher vesselswith refrigerated sea-water holds can make relativelyrapid trips to maintain product quality. However, forsome species and products (e.g., high grade surimi) it isdifficult for shoreside processors to compete.
Employment in Alaskan shoreside processing for ground-fish is estimated at 3525 full-time equivalents (NMFS,
764 Arctic Climate Impact Assessment
2003b).The number of processing jobs onshore in theBering Sea has increased by as much as 50% between theearly 1990s and the present because of policies decreas-ing the amount allocated to at-sea processing versusonshore processing. Much of the work force is an ethni-cally diverse group of work permit holders from otherparts of the world, mostly west coast United States,Mexico, and the Philippines. Over time, Alaskan com-munities in the Bering Sea region are being transformedas workers stay on and climb the corporate ladder.
In the Russian Far East a significant proportion of thecatches have been processed at sea with the restprocessed on shore or kept in cold storage, etc.With domestic demand low in terms of the ability tocompete with global market price and other tax andregulatory issues onshore, there is a substantial incen-tive to process offshore and export directly (Velegjanin,1999).This has contributed to a sizeable decrease indomestic consumption and employment in shoresideprocessing and other services to the fishing industry.The transition to a market economy has been difficultbut the learning curve is trending upward with newmanagement institutions and experience. However,without the full cooperation of the fishing industry andmanagement, and tensions over the allocation of rev-enue between the Far East and Moscow, it will be sometime before the industry stabilizes.
13.5.5.4. Fisheries communities
The North Pacific fishing communities surrounding theBering Sea are different to those of the North Atlantic.There is no history of small coastal fishing communitiesdeveloping commercial fishing on the currently harvest-ed large stocks of pollock, Pacific cod, etc. In the east-ern Bering Sea some 65 communities exist with a totalpopulation of around 27500.They are frequently inhab-ited by a large percentage of indigenous Alaskans, butnot exclusively (NPFMC, 2003a). Until they becameparticipants in the CDQ program, they had limitedcoastal subsistence fisheries as well as some small-scalecommercial fisheries for salmon and halibut. Involve-ment in the groundfish and crab fisheries has providedvaluable income and employment as well as a role inmanagement of the offshore fisheries.The main locationof the fish processing on Akutan and Dutch Harbor/Onalaska had been important for crab, halibut, andsome salmon fisheries. It was not until foreign anddomestic investment was encouraged in shoreside pro-cessing of groundfish in the late 1980s that these com-munities were transformed. Loss of access to fishing inthe US EEZ prompted Japanese investment in process-ing so that raw fish could be purchased at low pricesand benefits gained in value-added processing fromshore-based plants.
The history of the purchase of Alaska from Russia in1867 and its status as a territory until Statehood in 1959was that of a domestic colony. In particular, fishing inter-ests in western Washington and Oregon were some of
the prime early investors in Alaskan fisheries. Ownershipof the highly seasonal Alaskan canneries was mostly out-side Alaska. Salmon fishing brought labor from thesouth. Halibut fisheries were developed as soon as ice-making and refrigeration technologies permitted catch-ing and transport of fish to southern markets. Early crabfishing interests were based out of Seattle.Thus, the fish-eries of Alaska have strong personal, financial, and serv-ice connections to Seattle due to the laws of comparativeadvantage. Alaska is a high cost area for living and carry-ing out a business (Natural Resources Consultants,1999). In the federal water fisheries, residents of otherstates must not be discriminated against in managementregulations, which further enforces the long, mostlycooperative, relationship between fishing interests inWashington and Oregon and those in Alaska. Overalldependence on fisheries varies by community but inAlaska as a whole, fisheries is a distant second to oil pro-duction in terms of revenue from resource extractionand for some cities with onshore processing, fisheries arethe prime source of local landing tax revenue.
Similar to Alaska, small indigenous Russian settlementsexisted around the western Bering Sea.With the colo-nization by Russians, larger towns developed and duringthe Soviet era these grew as bases for resource develop-ment and national defense. Population in the sevenadministrative regions of the Far East is concentrated incoastal cities and declined slowly throughout the 1990s(Zilanov, 1999). Several large cities account for themajority of the population such that much of theRussian coastline is undeveloped. Fisheries are dominat-ed by fishing interests in Vladivostok and Nakhodka.Increasingly stronger demands are being made by otherregional fishing bases for more autonomy in manage-ment and greater allocations to proximate users.
13.5.5.5. Markets
The relatively low populations of the Bering Sea regiondo not constitute a very large local market for thelarge-scale fisheries.Thus, both Alaska and the RussianFar East look to distant markets at home and abroad.For Alaska, the prime markets are Japan, Korea, andChina with Europe providing entry for some products.Over 90% of Alaskan fish is exported. Korea and nowChina with their relatively low wage labor have servedas processing centers for some products that are re-exported, i.e., imported back in some value-addedform. For the Russian Far East, exports have started toplay an increasing role in the fisheries economy. Duringthe Soviet era up to 80% of the Far Eastern fish prod-ucts were processed and sent on to domestic markets inthe western more populous parts of the country.The rest was exported or taken under fisheries agree-ments with neighboring states to obtain hard currenciesneeded by the central government.While low effectivedemand (i.e., domestic consumers) is not able to payinternational prices for seafood products, many of thehigher value species are exported and low value speciesand products are imported so that around 50% of the
Chapter 13 • Fisheries and Aquaculture 765
seafood harvested is destined for export (Zilanov,1999).Thus, the remote Bering Sea is a major player interms of global seafood markets where declines inabundance of Atlantic cod, for example, open marketsfor fillets of pollock at the same time demand for pol-lock surimi products seems to be slackening as a resultof weak Japanese and Korean markets. Similarly, highabundance of snow crab in Canada causes market ero-sion for this species in the eastern Bering Sea.
Owing to the significant price competition from farmedAtlantic salmon, the wild salmon dependent fishingenterprises and communities are facing major adjust-ments. Even though North Pacific wild salmon stocksare abundant at present, the large quantity of farm raisedsalmon and its method of sale and delivery reduce theprice that can be obtained.There is some considerationin Alaska and Russia about starting aquaculture but it isrecognized that the investment, organization, and tech-nology may be significant hurdles (Link et al., 2003).Given the experience with salmon, there is also concernover the farming of halibut, sablefish, and cod becomingcompetitive with wild stock harvests.
13.5.5.6. Management regime
The US and Russian EEZs are the major managementjurisdictions in the Bering Sea although the multilateralconventions for management of the “Donut Hole” fish-ery outside these boundaries also has an important rolein fisheries management. Similarly, the Convention for aNorth Pacific Marine Science Organization and theConvention for the Conservation of Anadromous Stocksin the North Pacific Ocean provide frameworks for sci-entific exchange and cooperation. Even though themajor activities covered by these conventions occur tothe south of the ACIA boundary, the WellingtonConvention for the Prohibition of Fishing with LargeDriftnets constrains fisheries on the high seas withpotential to intercept salmon of Russian and US originas well to have negative bycatch effects on Dall’s por-poise and some seabird species. Bilateral agreements,such as between Canada and the United States forsalmon and halibut management and between Russiaand Japan for salmon, also exist.
At the national level, the Magnuson-Stevens FisheryConservation and Management Act is the prime legisla-tion guiding fisheries management in federal waters.In Alaska, this means that all waters between 3 nm fromthe state’s baselines and 200 nm is under federal juris-diction. Other relationships exist, such as federal man-agement for halibut in all waters due to the Conventionbetween Canada and the United States for the Preser-vation of the Halibut Fishery of the Northern PacificOcean and Bering Sea, and Alaskan state jurisdiction(with federal oversight) over crabs as creatures of thecontinental shelf and salmon that are harvested withinstate waters (Miles et al., 1982a).The waters off Alaskaconstitute one of the nation’s eight fishery managementregions.This is administered by the regional office of
the National Marine Fisheries Service, with manage-ment decision-making taking place in the North PacificFishery Management Council – an advisory body to theregional director and thereby to the Secretary of Com-merce.The federal regulations aim to develop a decisionprocess that is comprehensive, transparent, and open toparticipation by all interested parties (NMFS, 2003b).
The main tools for fishery management are FisheryManagement Plans that set out the rules and regulationsfor management of each species or species complexes.Under the current management approach,TAC is set onan annual basis in the Stock Assessment Fishery Eval-uation process (e.g., NPFMC, 2002). As part of thisprocess, ecosystem considerations are made explicit inthe form of a chapter of the Stock Assessment FisheryEvaluation document that addresses ecosystem trendsand relationships to fishing, as well as in the environ-mental assessments required in accordance with theNational Environmental Policy Act. All meetings of theCouncil and its Advisory Committee and Scientific andStatistical Committee are open to the public.Thus, anyinterested party can observe and participate in delibera-tions of Plan Development Teams setting TACs.
The North Pacific Fishery Management Council hasdeveloped innovative approaches to management.Scientific advice is rigorously adhered to in the setting ofTACs and conservative harvest limits are applied. A capof two million tonnes has been set on total removals inthe fishery even when allowable catches might be con-siderably higher. Bycatch is counted against TAC and tar-get fisheries can be closed if the bycatch limit is reachedbefore the target fishery TAC. Larger boats are requiredto carry and pay for one or more observers to gatherscientific information about harvests. Species such ashalibut, salmon, and herring are considered prohibitedspecies in the groundfish and other non-target speciesfisheries. Finally, significant areas of the fishing groundsare closed to trawling to protect habitat necessary forother species, e.g., red king crab savings area (Witherellet al., 2000). In addition, much of the present work ofthe North Pacific Fishery Management Council is ondeveloping spatially explicit relationships between fish-eries and fish habitats under the Essential Fish HabitatProvisions of the Magnuson-Stevens Fishery Conser-vation and Management Act (NPFMC, 2003b).There isalso a Council emphasis on rationalization of fisheriesthrough share-based management systems such as theIndividual Fishing Quota program for halibut and sable-fish (and as proposed for Bering Sea and Aleutian Islandscrabs) or through using a cooperative approach as forpollock under the American Fisheries Act, 1999.
In the EEZ of the Russian Far East, the issues and basicmanagement system are similar to those in the North-east Atlantic (see section 13.2.5) with the exception ofthe reciprocal fishing agreements.The regional adminis-tration is subject to central control for setting alloca-tions and for Border Guard enforcement. From com-ments about the implementation of enforcement in
766 Arctic Climate Impact Assessment
western Russia, it seems the US Coast Guard and theBorder Guards have developed a more effective cooper-ation on enforcement in the Bering Sea, particularlywith respect to the fishing zone boundary and high seasdriftnet fishing.The scientific basis for setting alloca-tions in Russia is similar to that of Alaska. Significantconcerns have been expressed about how well suchallocations are being followed and enforced (Velegjanin,1999). Similarly, the role of the central as opposed tothe regional fishery administrations in the setting andallocation of quotas is being challenged. For severalyears, significant proportions of the total allowable har-vest are being auctioned to the highest bidders.Thisinnovative effort has been controversial.
13.5.6.Variations in Bering Sea fisheries andsocio-economic impacts: possible scenarios
The major changes in the commercial fisheries of theBering Sea have been in the distribution of the harvestsamong nations and sub-nation user groups. Changes inthe species composition of the catch due to changes inenvironmental conditions and fishing pressures havealso affected those employed in the fishing industry andtheir communities. However, while the latter are ofconsiderable interest in the present assessment, it isimportant to note that the adjustments to changingclaims to jurisdiction in the Bering Sea have beenextensive (Miles et al., 1982a).The enormous disloca-tion of fishing fleets from Japan and then the SovietUnion post-EEZ extension, shows that major adjust-ments can be made but with considerable hardship.Similarly, the response of the US fishing industry assist-ed by favorable government incentives shows howquickly it can respond to opportunity.The questionthus is how fully occupied fisheries can respond to sus-tainable and precautionary management.
Fisheries in the Bering Sea are largely a post SecondWorld War phenomenon in terms of the technologyand scale of enterprise necessary to fish the inhos-pitable and enormous expanses of the remote BeringSea shelf.With the developments in mothership opera-tions and food processing technology came the devel-opment of new markets for species such as walleyepollock that despite being available in large quantitieshad not previously been considered a target species.Little is known about the fisheries ecosystem of theBering Sea prior to the development of the intensiveindustrial-scale fisheries. Attention has been given tothe early whaling activity in the North Pacific as thisaffected the more valuable and easier to harvestspecies.The effects of removing this biomass of whaleson controls in the Bering Sea ecosystem is not clear(National Research Council, 1996) but cannot havebeen insignificant.The decline in the North Pacificwhaling was offset by effort directed toward otherareas, including the Southern Ocean. For communitieswhere rending and processing occurred onshore, thedisplacement of effort meant the end of whaling as asource of employment and income.
Fisheries development after the Second World Wartended to target the highest value species first. Despiteefforts to develop sufficient scientific information andinternational management under the InternationalConvention for High Sea Fisheries of the North PacificOcean, some stocks such as Pacific ocean perch andother longer-lived, high value species were overfished.The opportunity to fish on previously unfished stocksof very large size and extent resulted in significantemployment and income benefits.With the develop-ment of coastal state management came the need tomanage these large-scale fisheries properly. Mostobservers do not consider the harvests reported for theearly period to be an accurate representation of catch-es.The valuable but limited joint scientific survey ofstocks, performed by Canada, Japan, and the UnitedStates under the Convention, provides some informa-tion.This results in the period of record beingextremely limited. Another factor is that the BeringSea is a large, remote, and difficult area to characterizeand monitor.Thus, the linking of scientific advice tofisheries management objectives has been a process ofsuccessive refinement.The ability to assess the range innatural variability in stock sizes is very imprecise andhow the ecosystems function is only now being mod-eled with a significant degree of sophistication to beginto understand some of the issues involved (NationalResearch Council, 2003).
Eight periods of alternating cold/warm sea tempera-tures are evident in the instrumental record.The extentto which these have altered population sizes and con-centrations is difficult to establish for the reasons men-tioned. Furthermore, population sizes may have beenaffected by high levels of fishing for some high valuespecies, and low levels of fishing for species with lowmarket value or with high levels of bycatch. Fisherymanagement is generally thought to mediate for over-fishing and to manage to maintain abundance of desiredspecies. Since the mid- to late 1970s warmer tempera-tures and the associated patterns of atmospheric and seasurface circulation may have favored salmonids, winter-spawning flatfish, walleye pollock, Pacific cod, andPacific halibut, and have been detrimental to capelin,Pacific herring, shrimps, and several species of largecrab. Fisheries have developed on those species that areat high levels of abundance and left those whose abun-dance is low (NMFS, 2003b).
The US fishing industry in the Bering Sea survivedchanges in the relative abundance of particular speciesduring the growth phase by, for example, shifting fromcrab fishing to walleye pollock fishing and Pacific codfisheries.This has altered conditions for traditional crabprocessing ports in the Pribilof Islands but has con-tributed to the growth of groundfish processing inDutch Harbor/Onalaska and Akutan.The question iswhat would happen to the industry under a pronouncedshift to a coldwater period. Fisheries management isattempting to rationalize effort in these fisheries toincrease efficiency, to reduce bycatch of prohibited
Chapter 13 • Fisheries and Aquaculture 767
species, and to increase capture value through higherquality products and utilization rates.This tends toreduce flexibility of movement, as occurred when thedomestic fisheries developed.There is little planning inplace for how fishery management could operate in atransition between cold and warm regimes. For most ofthe groundfish species management under quotas, theexpectation is that small or large year classes would bedetected in the assessments and that quotas would riseand fall to prevent overfishing. For species with shortlifespans this approach may be less effective, althoughhigh natural variability is considered by managers.For exceptionally long-lived species such as rockfish(Sebastes spp.), experience shows that very conservativeharvest rates may need to be used and no-take marinereserves have been suggested as a tool to insure againstloss of older highly productive fish.
This is an important issue, as is evident from the mas-sive buildup of the red king crab fleet in the late 1970sto harvest anomalously large quantities of a Bristol Baystock that subsequently crashed – probably due torecruitment failure following changes in environmentalconditions. Additional effort entered the crab fleet withthe strong stocks of snow crabs in the 1980s and 1990s.A sharp decline in these fisheries, again associated withchanges in environmental conditions, caused severeproblems for operators with high debt service and rela-tively few assets.These problems in the eastern BeringSea crab fisheries provided an incentive to find otherpot gear fishing opportunities and so other fixed gearoperators in Pacific cod are now being squeezed by theentry of crab vessels into their traditional fisheries.This domino effect is highly predictable even if theunderlying phenomena driving the process are not.
Warmer conditions are less favorable for pinnipeds.This appears to be an indirect food web effect ratherthan a direct effect through predation, although theremay be interacting effects.This complex interactionbetween climate and pinniped survival has a pro-nounced effect on major commercial fisheries in theeastern Bering Sea under US jurisdiction.The spatialextent and timing of walleye pollock, Atka mackerel,and Pacific cod fisheries have been modified as aprecautionary measure to protect Steller sea lions(National Research Council, 2003). In this way,changes in environmental conditions that result ineffects on non-target species can be sufficiently signifi-cant in terms of the management of endangered andthreatened species that they result in increased fishingcosts and thus reduced profits.
The many subsistence fishing villages on the shores ofthe Bering Sea experience climate variability directly.The 65 CDQ communities in the eastern Bering Searegion have direct connections with climate variabilitythrough subsistence fishery activities and participation inthe industrial fisheries through their partners. Industrialfisheries in the Bering Sea are dependent on large-scaleshore-based processing plants that can operate, like the
fishery itself, under difficult conditions.This is becausecatcher vessels that deliver to the shoreside plants mustnow operate further offshore because of the closed areasto buffer sea lion competition for prey. At-sea processorsare more adaptable to changing environmental condi-tions because they can follow the fish and fishing condi-tions and can deliver to various ports.
Salmonids have well-documented aggregate north/south shifts in production under warm and cold peri-ods (Beamish and Bouillon, 1993; Hare and Francis,1995; Mantua et al., 1997). Although this does notexplain all sources of variability it has been used suc-cessfully to gain a better management understanding.These trends are now being exacerbated by thedecrease in market price following the decline in theAsian market and competition from farmed sources ofAtlantic salmon. Even at high levels of abundance fish-ing for wild salmonids in the Bering Sea is at best mar-ginal.This may force fundamental change in the struc-ture and practices of salmon fishing. Also, extremelylow returns to the Yukon River make survival of theAlaskan and Canadian indigenous peoples dependenton the abundance of migrating salmonids precarious.This has brought disaster relief in the form of federaland state loans and welfare programs. Recent studies(Kocan et al., 2001) suggest that the decline in Yukonstocks may be due to warmer environmental condi-tions and so beyond the control of fishery managers.The low levels of salmon have already resulted inrenewed calls for reducing the salmon bycatch inBering Sea trawl fisheries. Even though salmon bycatchrates have been reduced, more salmon are wanted byYukon and other peoples.The trawl industry that hasbeen pushed from low to higher bycatch areas due tomeasures for Steller sea lion protection has takenproactive real time measures to avoid salmon bycatch.
The location of the sea-ice edge and of the extent andtiming of the melting of the sea ice as well as thedevelopment of the “cold pool” can have positive andnegative effects on fisheries through their tendency toconcentrate or disperse certain species or to contributeto increased levels of primary and secondary produc-tion within the Bering Sea ecosystem. Direct impactson crab pot loss resulting from shifts in the position ofthe ice edge have been noted in the opilio fisheries insome cold years.The economic consequences of thesetypes of variability are considered part of the risks offishing in the Bering Sea. At present, it is possible tomake only general comments about the effects of cli-mate variability on fisheries in the Bering Sea from asocio-economic perspective. Better analyses require abetter scientific understanding of ecosystem dynamicswithin the Bering Sea and a better ability to predict.A complicating factor is the difficulty of understandingthe dynamics within the fisheries due to the very shortperiod of record. Also, external market forces are cur-rently affecting the value of the fisheries to a very sig-nificant extent and this may be more important thanvariability in landings or overall fish abundance.
768 Arctic Climate Impact Assessment
At the industrial scale of fishing and processing that ischaracteristic of groundfish and crab fisheries in theBering Sea, the social effects reflect broader economictrends. Lower prices and quantities generate fewer andless well paid jobs. However, high world market pricesfor species such as red king crab may offset declines instocks when other sources of supply decrease (e.g., inRussian waters), or increase (e.g., red king crab innorthern Norway). Rationalization through the eco-nomic system or fishery management systems mayallow greater long-term stability with less overallinvestment in harvesting and processing. Fewer opera-tors earning a greater return on investment are morelikely to absorb swings in abundance due to changes inenvironmental or other conditions. It is difficult toassess impacts on consumers as the world trade in fish-eries tends to find ways to satisfy market demands.However, impacts on fishery dependent communitiesand small family-owned enterprises can be devastatingas the high costs of fishing may exceed the price avail-able (Link et al., 2003). Having most assets tied up inownership of a fishing vessel and gear, a limited entryarea permit, and nowhere to sell is a formula for disas-ter. Many operations face bankruptcy and in communi-ties with many such entities, there are few alternatives.
13.5.7. Ability to cope with change
Over the past few decades Bering Sea fisheries havebeen built around fairly consistent warm water speciesalthough there are some differences between the west-ern and eastern Bering Sea. Coastal states have benefit-ed more in recent years than distant water fishingnations. However, the management response to a transi-tion to a cold phase has not been adequately considerednor has the response to continued warm periods.Changes to stocks in the western Bering Sea and pro-jected stock dynamics in response to a moderate warm-ing are explored in Table 13.2. Assuming a shiftbetween a cold and warm regime in the mid-1970s,which for the Bering Sea is only ±1 ºC (see section13.5.4.2), could result in many effects and other coin-cident changes. For example: salmon increase in num-ber but the world market price declines; groundfishabundance increases but the Asian market is weak owingto other economic factors; US snow crab stocks declinebut Canadian stocks increase due to possible unfavor-able or favorable environmental conditions.
A very small difference in ocean conditions can bedetected as a cold or warm phase in the Bering Sea.Although a global climate change scenario for theBering Sea per se does not exist, this shift between coldand warm periods provides some working hypothesesabout what could be expected. At a minimum, it islikely that the conditions that have prevailed over thepast few decades might constitute a baseline for slightlywarmer conditions.Which means there is unlikely tobe a resurgence of crab or shrimp populations or her-ring and capelin and other small pelagic species.Theecosystem would continue to be dominated by walleye
pollock, Pacific cod, and flatfish.Walleye pollock juve-niles may continue to occupy the role of coldwater for-age fish. Salmonids would probably remain abundant inthe aggregate in northern waters but in the south offBritish Columbia and Washington and Oregon stockswould decrease.
Socio-economically this baseline case would replicate thecurrent system in terms of production of fish commodi-ties.Through improvements in fishery management, itmay be possible to increase the harvests of certain stocksby managing for recovery to levels of former abundance.However, it is just as likely that unforeseen events orinteractions may result in management mistakes that off-set such gains. Exploitation of underutilized species maybe feasible to some degree.There may be some gains incatching the whole TAC due to changes in gear and fish-ing practices to generate lower bycatch rates.To attainincreases in value added and utilization rates, it may benecessary to further rationalize the industry.
Additional factors to be included in the scenario of acontinuation of prevailing conditions are declines inmarine mammal and seabird populations. In some cases,fishery interactions, while modest and indirect, may jus-tify further efforts to protect the numbers of seabirdsand marine mammals under an adverse environmentalregime, and such requirements may constrain fisheriesmore than would be the case if the stock was the soleinterest of management. Similarly, environmental groupsmay change the level of performance that they expectfishery management to attain, i.e., no detectable impactstandard or negligible effect standard and this wouldalter the management “field of play”.
With continued warming, there is likely to be a range ofsea temperatures that would continue to generate posi-tive recruitment and growth scenarios for some of thewarm water species (Table 13.2).This is likely to resultin unfavorable conditions (i.e., increased predation) forpandalid shrimp and most crab species. If walleye pol-lock stocks increase, their impact as a predator on fishmay also increase with unpredictable outcomes. Migra-tion paths, timing of spawning, timing of the start ofprimary production, and species composition are veryunlikely to remain the same. Similarly, reduced sea ice islikely to change the early spring ecosystem processes butgreater surface exposure to winter storm conditions islikely to increase nutrient cycling and resuspension fromshallower waters.To date, there are no credible pub-lished predictions of changes to fisheries north of theBering Strait under a no or low sea ice scenario.
13.5.8. Concluding comments
In comparison to fisheries in other areas of the Arctic,commercial fisheries of the North Pacific, including theSea of Okhostk and the Bering Sea, are relative new-comers. Commercial fishing for groundfish stocks otherthan Pacific halibut began in the Bering Sea in the 1950sby fleets from Japan and Russia and soon developed into
Chapter 13 • Fisheries and Aquaculture 769
large-scale operations involving many nations.Thesefleets primarily harvested walleye pollock, Pacific cod,flatfish, sablefish, Atka mackerel, crab, herring, andsalmon stocks. In the late 1970s, EEZs were established200 nm seaward from the coast by Russia and theUnited States and fisheries management plans wereestablished. By 1990, the distant water fleets werephased out of the eastern Bering Sea (i.e., the US EEZ).US fisheries off Alaska constitute more than half thelandings and about half the value of national landings offish and shellfish from federal waters. In the RussianEEZ, most catches are taken by domestic fleets with adecreasing proportion harvested under agreements withneighboring states.
Well-documented climate regime shifts occurred in theBering Sea over the 20th century at roughly decadal timescales, alternating between warm and cool periods.A climate regime shift in the Bering Sea in 1977 changedthe marine environment from a cool to a warm state.The warming-induced ecosystem shifts favored recruit-ment to herring stocks and enhanced productivity forPacific cod, skates, flatfish, and non-crustacean inverte-brates.The species composition of the benthic communi-ty changed from a crab-dominated assemblage to a morediverse mix of starfish, ascidians, and sponges. Pacificsalmon production was found to be positively correlatedwith warmer temperatures. Consecutive strong yearclasses were established and historically high commercialcatches were taken. Levels of walleye pollock biomasswere low in the 1960s and 1970s (2 to 6 million t) butsubsequently increased to levels greater than 10 million tand have remained large in most years since 1980.
Information from the contrast between the 1977 to1989 warm period and the prior and subsequent coolperiods (1960–1976 and 1989–2000) form the basis ofthe predicted response of the Bering Sea ecosystem toscenarios of future warming. Predictions includeincreased primary and secondary productivity with agreater carrying capacity, increased catches for speciesfavored by a warm regime, poleward shifts in the distri-butions of some cold-water species, and possible nega-tive effects on ice-associated species.
Walleye pollock is the major harvest species by volumeand value, with Pacific cod, flatfish, salmon, and crabsconstituting most of the rest.Total wholesale value forgroundfish harvests in the eastern Bering Sea is approxi-mately US$ 426 million, while the total primaryprocessed value is approximately US$ 1.4 billion.The North Pacific fishing communities surrounding theBering Sea are different from those of the NorthAtlantic. On the coast of the eastern Bering Sea thereare some 65 communities with a total population ofaround 27500 inhabitants, but these do not have a longhistory of fishing.
Fishery Management Plans are the main tool for fisherymanagement in US waters.These set forth the rules andregulations for the management of each species or
species complexes. Under the current managementapproach,TACs are set on an annual basis in the StockAssessment Fishery Evaluation process. Ecosystem con-siderations are explicitly made available at the time ofthe TAC setting process.The North Pacific FisheryManagement Council has developed some fairly innova-tive approaches to management. In the EEZ of theRussian Far East, the regional administration is subjectto central control for setting TAC allocations and forBorder Guard enforcement.
The main changes over the years in the commercialfisheries of the Bering Sea have been in the distributionof the harvests among nations and sub-national usergroups.There have been extensive adjustments tochanging claims to jurisdiction in the Bering Sea.Thetremendous dislocation of fishing fleets from Japan andRussia (then the Soviet Union) after the EEZ extensionto 200 nm shows that major adjustments can be madebut with considerable hardship. Similarly, the responseof the US fishing industry, assisted by favorable govern-ment incentives, shows how quickly the fishery canrespond to changed opportunities.
Eight periods of alternating cold/warm sea tempera-tures are evident in the instrumental record. Populationsizes may have been affected by both high levels of fish-ing for some high-value species and low levels of fishingfor species with low market value or with high levels ofbycatch. Fishery management is generally intended toprevent overfishing and maintain the abundance ofdesired species. Since the mid- to late 1970s, warmertemperatures and associated atmospheric and sea surfacecirculation may have favored salmonids, winter-spawningflatfish, walleye pollock, Pacific cod, and Pacific halibutbut have been detrimental to capelin, Pacific herring,shrimps, and several species of large crab. Fisheries arefully developed on those species that are at high levels ofabundance, but have essentially ceased on those whoseabundance is low.The last few decades of Bering Seafisheries have been built around species that consistentlyfavor warm water. However, there are some contradic-tions between the western and eastern Bering Sea.Thereis no question that coastal states have benefited more inrecent years than distant water fishing nations. However,the management response to a transition to a cold phasehas not been adequately considered, nor has it for theopposite, i.e., continued prevailing warm conditions.
Previous sections of this chapter have demonstratedthat a very small difference in ocean environmentalconditions can be detected as a cold or warm phasein the Bering Sea.While there is not a global climatechange scenario for the Bering Sea per se, this shiftbetween cold and warm periods does provide a basisfor some working hypotheses about what to expect inthe area in future. At a minimum, it is likely that theconditions which have prevailed over the last fewdecades might constitute a baseline for slightly warmerconditions.Therefore, there is not likely to be a resur-gence of crab or shrimp populations, or herring and
770 Arctic Climate Impact Assessment
capelin and other small pelagic fish species.The ecosys-tem is likely to continue to be dominated by walleyepollock, Pacific cod, and flatfish.Walleye pollock juve-niles are likely to continue their role as cold-water for-age fish. Salmonids are likely to remain abundant in theaggregate in northern waters, but south off BritishColumbia and Washington and Oregon stock abun-dance would be depressed.
Socio-economically this baseline case would replicate thecurrent system in terms of production of fish commodi-ties.Through improvements in fisheries management, itmay be possible to increase harvests of certain stocks bymanaging for recovery to levels of former abundance.However, it is probably just as likely that unforeseenevents or interactions may produce management mis-takes that offset such gains in a dynamic ocean system.Exploitation of underutilized species may be feasible tosome degree. Some gains in catching the whole TACmight be possible due to improvements in gear and fish-ing practices to lower bycatch rates. In order to attainincreases in value added and in utilization rates, theindustry may need to be further rationalized.
Under a continued warming scenario, it is very likelythat there could be a range of temperatures that wouldcontinue to generate positive recruitment and growthscenarios for some of the warm advantaged species.These conditions would be negative for pandalid shrimpand most crab species. If walleye pollock stocks increase,their impact as a predator on fish may also increase withunpredictable outcomes. It is very unlikely that migra-tion paths, timing of spawning, timing of start of pri-mary production, and composition of species wouldremain the same. Similarly, loss of sea ice may result inchanges to the early spring bloom and associated ecosys-tem processes, however greater surface exposure to win-ter storm conditions might increase nutrient circulationand resuspension in shallower waters.To date, there areno credible published data on what could happen in thewaters north of the Bering Strait with respect to fish-eries under a change to a significantly warmer climate.
13.6. Synthesis and key findings
Modeling experiments show that it is not easy to projectchanges in climate due to forces, which can and havebeen measured and even monitored on a regular basisfor considerable periods of time and are the data uponwhich such models are built.The main reason being thatmajor natural events occur over time scales greater thandecades or even centuries and the period of regularmonitoring of potentially important forcing events isrelatively short. Also, current climate models do notinclude scenarios for ocean temperatures, watermassmixing, upwelling, and other relevant ocean variablessuch as primary and secondary production, neither glob-ally nor regionally.Thus, it is not possible to predict theeffects of climate change on marine fish stocks with anydegree of certainty and so the eventual socio-economicconsequences of these effects for arctic fisheries.
Nevertheless, and despite these difficulties, the scien-tific community should still rise to the challenge ofpredicting reactions of marine stocks in or near theArctic to climate change, basing initial studies on pastrecords of apparent interactions, however imperfectand inconclusive. It is on such bases – and such basesonly – that effective future research can and should beplanned and undertaken.
Commercial fisheries in arctic regions are based on anumber of species belonging to physically differentecosystems.The dynamics of many of these ecosystemsare not well understood.This adds a significant degreeof uncertainty to attempts to predict the response ofindividual species and stocks to climate change. Indeed,to date it has been difficult to identify the relativeimportance of fishing and the environment on changesin fish populations and biology. Moreover, current fishpopulations differ in abundance and biology from pastpopulations due to anthropogenic effects (i.e., exploita-tion rates). As a result it is unclear whether currentpopulations will respond to climate change as they mayhave done in the past.
Nevertheless, it does appear likely that a moderatewarming will improve the conditions for some of themost important commercial fish stocks, as well as foraquaculture.This is most likely to be due to enhancedlevels of primary and secondary production resultingfrom reduced sea-ice cover and more extensive habitatareas for subarctic species such as cod and herring.Global warming is also likely to induce an ecosystemregime shift in some areas, resulting in a very differentspecies composition. Changing environmental condi-tions are likely to be deleterious for some species andbeneficial for others.Thus, relative population sizes, fishgrowth rates, and spatial distributions of fish stocks arelikely to change (see Table 9.11).This will result in theneed for adjustments in the commercial fisheries.However, unless there is a major climatic change over avery short period, these adjustments are likely to berelatively minor and are unlikely to entail significanteconomic and social costs.
The total effect of climate change on fish stocks is prob-ably going to be of less importance than the effects offisheries policies and their enforcement.The significantfactor in determining the future of fisheries is soundresource management practices, which in large partdepend upon the properties and effectiveness ofresource management regimes. All arctic countries arecurrently making efforts to implement managementstrategies based on precautionary approaches, withincreasing emphasis on ecosystem characteristics, effectsof climate changes, and including risk and uncertaintyanalyses in decision-making. Ongoing adjustments tomanagement regimes are likely to enhance the ability ofsocieties to adapt to the effects of climate change.
The economic and social impacts of altered environ-mental conditions depend on the ability of the social
Chapter 13 • Fisheries and Aquaculture 771
structures involved, including the fisheries manage-ment system, to generate the necessary adaptations tothe changes. It is unlikely that the impact of the climatechange projected for the 21st century (see Chapter 4)on arctic fisheries will have significant long-term eco-nomic or social impacts at a national level. Some arcticregions, especially those very dependent on fisheries ormarine mammals and birds in direct competition witha fishery may, however, be greatly affected. Local com-munities in the north are exposed to a number offorces of change. Economic marginalization, depopula-tion, globalization-related factors, and public policiesin the different countries are very likely to have astronger impact on the future development of northerncommunities than climate change, at least over thenext few decades.
This chapter considers the possible effects of projectedclimate change on four major ecosystems: the North-east Atlantic (Barents Sea), the central North Atlantic(Iceland/Greenland), Northeast Canada (Newfoundland/Labrador), and the North Pacific (Bering Sea).There aresubstantial differences between these regions in that theBarents Sea and Icelandic waters are of a subarctic/temperate type, while the arctic influence is muchgreater in Greenland waters, the waters off northeastCanada, and the Bering Sea. It follows, therefore, that cli-mate change need not affect these areas in the same or asimilar manner. Also, the length of useful time series onpast environmental variability and associated changes inhydrobiological conditions, fish abundance, and migra-tions varies greatly among regions. Finally, there aredifferences in species interactions and variable fishingpressure, which must also be considered.
Owing to heavy fishing pressure and stock depletions,the Barents Sea, Icelandic waters, and possibly also theBering Sea could, through more efficient management,yield larger catches of many fish species. For that tohappen research must increase, and more cautious man-agement strategies must be developed and enforced.However, a moderate warming could enhance therebuilding of stocks and could also result in higher sus-tainable yields of most stocks, among others, throughenlarged distribution areas and increased availability offood in general. On the other hand, warming could alsocause fish stocks to change their migratory range andarea of distribution.This could (as history has shown)trigger conflict among nations over distribution of fish-ing opportunities and would require tough negotiationsto generate viable solutions regarding internationalcooperation in fisheries management.
The waters around Greenland and off northeast Canadaare very different from the above.These regions are morearctic in nature. Greenland appears unable to supportsubarctic species such as cod and herring except duringwarm periods. Examples from the 20th century provethis point. For example, there were no cod in the firsttwo and a half decades, but a large local self-sustainingcod stock from 1930 until the late 1960s, apparently
initiated by larval and 0-group drift from Iceland. If cur-rent climate conditions remain unchanged little change islikely around Greenland. On the other hand, a “moderatewarming” such as that between 1920 and the late 1960sis likely to result in dramatic changes in species composi-tion – a scenario where cod would play the major role.The northeast Canadian case is an extreme example of asituation where a stock of Atlantic cod (the so-called“northern” cod), which had sustained a large fishery forat least two centuries, is suddenly gone. Opinion differsas to how this has happened; most people believe that thedecline was due entirely to overfishing, whereas othersthink that adverse environmental factors were significantcontributors. In the present situation, however, thenorthern cod stock is so depleted that it is very likely totake decades to rebuild – even under the conditions of awarming climate.
An evaluation of what could happen to marine fisheriesand aquaculture in the Arctic should the climate warmby more than 1 to 3 ºC is not attempted in the presentassessment.This is beyond the range of available data andwould be of limited value. In general terms, however, itis likely that at least some of the ecosystems wouldexperience reductions in present-day commercial stockswhich might be replaced partially or in full by speciesfrom warmer waters.
13.7. Research recommendations
Past experience shows that marine living resources arenot unlimited and must be harvested with caution.Although management practices have improved in recentdecades, the present situation still leaves much room forimprovement. More and better research is required tofill this gap.
1. Present monitoring of the physical and biologicalmarine environment must be continued and inmany cases increased. Basic research is often con-sidered a burden, but is a prerequisite for under-standing biological processes. Modern technologyenables the automation of many of the time con-suming tasks previously conducted from expensiveresearch vessels. For example, buoys can now bedeployed in strategic locations on land and at seafor continuous measurement of many variablesrequired in marine biological studies.The monitor-ing of commercial stocks must also continue,applying new technologies as these become avail-able.There is a general shortage of ship time forsea-based work. Administrators (governments) areoften unaware of this, also that despite computersenabling more extensive and deeper analyses ofexisting datasets, people are still required to oper-ate and program the computers.
2. Although the modeling of marine processes, partic-ularly the modeling of climate variability, is still inits infancy, such work is the key to increasingunderstanding of the effects of the projected cli-mate change scenarios (see Chapter 4).The devel-
772 Arctic Climate Impact Assessment
opment of regional applications is particularlyimportant. Regional effects might differ substantial-ly from those considered average global effects. Inorder to relate physical changes in the atmosphereand oceans to changes within specific ecosystems,the modeling of regional effects is essential.Current fisheries management models are based ongeneral assumptions of constant environmental fac-tors.The use of ecosystem-based approaches forfisheries management will require that physical andbiological factors that do not directly affect the tar-get species are also taken into account.
3. It is extremely difficult to estimate the economicconsequences of climate change on the world fish-eries or the fisheries for any given region. It isimportant to invest in the development of bettermethods for examining the economic and social con-sequences of climate change, at both the global andregional level, and at the national and local level.
ReferencesADF&G, 2002. Alaska Commercial Harvests of King,Tanner, and Snow
Crab, 1953–2000. Alask department of Fish and game,www.cf.adfg.state.ak.us/region4/shellfsh/crabs/1953–00.htm
Agnarsson, S. and R. Arnason, 2003.The Role of the Fishing Industry inthe Icelandic Economy. An Historical Examination.Working paperW03:08. Institute of Economic Studies, University of Iceland.
Alton, M.S., R.G. Bakkala, G.E.Walters and P.T. Munro, 1988.Greenland turbot, Rheinhardtius hippoglossoides, of the eastern BeringSea and Aleutian Islands. NOAA Tech. Rep. NMFS 71, 31 p.
Alverson, D.L., 1987. A Study of Trends of Cod Stocks off Newfoundlandand Factors Influencing their Abundance and Availability to theInshore Fishery: A Report to the Honorable Tom Siddon, Minister ofFisheries of Canada.Task Group on Newfoundland Inshore Fisheries.
Alverson, D.L., A.T. Pruter and L.L. Ronholt, 1964. A study of demer-sal fishes and fisheries of the northeastern Pacific Ocean. H.R.MacMillan Lectures in Fisheries. Institute of Fisheries, University ofBritish Columbia.
Anon, 2000. Udvikling i nogle centrale økonomiske konjunkturindikator-er. Konjunkturstatistik 200:2. Statistics Greenland.http://www.statgreen.gl/dk/publ/konjunk/00-1konj.pdf
Anon, 2001. Sea Ice Climatic Atlas, East Coast of Canada, 1971–2000.Canadian Ice Service, Ministery of Public Works.
Anon, 2004a. Report of the joint ICES/NAFO Working Group on Harpand Hooded Seals. ICES CM 2004/ACFM:6.
Anon, 2004b. Environmental Conditions in Icelandic Waters 2004.Technical Report 101. Marine Research Institute, Reykjavík, 37p.(In Icelandic – English summary, table and figure legends)
Anon, 2004c. State of Marine Stocks in Icelandic Waters 2003/2004.Prospects for the Quota Year 2004/2005.Technical Report 202.Marine Research Institute, Reykjavík, 181p. (In Icelandic – Englishsummary, table and figure legends)
Arlov,T.B., 1996. Svalbards historie. H. Aschehoug & Co.Arnason, R., 1994.The Icelandic Fisheries: Evolution and Management
of a Fishing Industry. Fishing News Books, Oxford.Astthorsson, O.S. and A. Gislason, 1995. Long-term changes in zoo-
plankton biomass in Icelandic waters in spring. ICES Journal ofMarine Science, 52:657–668.
Astthorsson, O.S. and H.Vilhjálmsson, 2002. Iceland Shelf LME: decadalassessment and resource sustainability. In: K. Sherman and H.R.Skjoldal (eds.). Large Marine Ecosystems of the North Atlantic,pp. 219–243. Elsevier Science.
Atkinson, D.B., 1994. Some observations on the biomass and abundanceof fish captured during stratified-random bottom trawl surveys inNAFO Divisions 2J and 3KL, autumn 1981–1991. NAFO ScientificCouncil Studies, 21:43–66.
Atkinson, D.B. and B. Bennett, 1994. Proceedings of a Northern CodWorkshop Held in St. John’s, Newfoundland, Canada, January27–29, 1993. Canadian Technical Report of Fisheries and AquaticSciences No. 1999, 64p.
Aydin, K.Y.,V.V. Lapko,V.I. Radchenko and P.A. Livingston, 2002.A comparison of the eastern Bering and western Bering Sea shelfand slope ecosystems through the use of mass-balance food webmodels. NOAA Technical Memorandum, NMFS-AFSC-130. 78p.
Baerenholdt, J.O and N. Aarsaether, 2001.Transforming the Local.Coping Strategies and Regional Policies. Nord 2001:25, 208p.
Bakkala, R.G., 1993. Structure and Historical changes in the ground-fish complex of the eastern Bering Sea. NOAA Tech. Rep NMFS114. 91p.
Bailey, K.M., R.C. Francis and J.D. Schumacher, 1986. Recent infor-mation on the causes of variability in recruitment of Alaska pollockin the eastern Bering Sea: physical conditions and biological inter-actions. Bulletin of the International North Pacific FisheriesCommission, 47:155–165.
Baird, J.W., C.R. Stevens and E.F. Murphy, 1992. A review of hydroa-coustic surveys conducted during winter for 2J3KL cod,1987–1992. Canadian Atlantic Fisheries Scientific AdvisoryCommittee, Res. Doc. 92/107, 14p.
Beamish, R.J. and D.R. Bouillon, 1993. Pacific salmon productiontrends in relation to climate. Canadian Journal of Fisheries andAquatic Sciences, 50(5):1002–1016.
Bendiksen, B.I and J.R. Isaksen, 2000. Fiskerinæringen i Finnmark -Analyse av verdiskapning og råstoffomsetning. Rapport nr.12/2000,Tromsø: Fiskeriforskning.
Berg, R., 1995. Norge på egen hånd. Norsk utenrikspolitisk historiebd 2. Universitetsforlaget, Oslo.
Bishop, C.A. and J.W. Baird, 1994. Spatial and temporal variability incondition factors of Divisions 2J and 3KL cod (Gadus morhua).Northwest Atlantic Fisheries Organization, Scientific CouncilStudies, 21:105–113.
Blindheim, J., 2004. Oceanography and climate. In: H.R. Skjoldal,R. Sætre, A. Færnø, O.A. Misund, I. Røttingen (eds.).TheNorwegian Sea Ecosystem, pp. 65–96.Tapir Academic Press.
Boltnev, A.I., 1996. Status of the northern fur seal (Callorhinus ursinus)population on the Commander Islands. In: O.A. Mathisen and K.O. Coyle (eds.). Ecology of the Bering Sea: A Review of RussianLiterature. Alaska Sea Grant College Program Report No. 96–01,pp. 277–288.
Borets, L.A., 1997. Bottom ichthyocoenoses of the Russian shelf ofthe far-eastern seas: composition, structure, functioning elements,and commercial significance.TINRO-Center. 217 p. (In Russian)
Bowering,W.R. and W.B. Brodie, 1995. Greenland halibut(Reinhardtius hippoglossoides). A review of the dynamics of its distri-bution and fisheries off Eastern Canada and Greenland. In: A.G.Hopper (ed.). Deep-water Fisheries of the North Atlantic OceanicSlope, pp. 113–160. Kluwer Academic.
Bowering,W.R. and K.H. Nedreaas, 2000. A comparison of Greenlandhalibut (Reinhardtius hippoglossoides (Walbaum)) fisheries and distri-bution in the Northwest and Northeast Atlantic. Sarsia, 85:61–76.
Bowering,W.R. and K.H. Nedreaas, 2001. Age validation and growthof Greenland halibut (Reinhardtius hippoglossoides (Walbaum)): a com-parison of populations in the Northwest and Northeast Atlantic.Sarsia, 86:53–68.
Brodeur, R.D. and D.M.Ware, 1992. Long term variability in zoo-plankton biomass in the subarctic Pacific Ocean. FisheriesOceanography, 1(1):32–38.
Brodeur, R.D., M.T.Wilson, G.E.Walters and I.V. Melnikov, 1999.Forage fishes in the Bering Sea: distribution, species associations,and biomass trends. In:T. Loughlin and K. Ohtani (eds.). Dynamicsof the Bering Sea, pp. 509–536. University of Alaska Fairbanks.
Buch, E., 1993.The North Atlantic water component of the WestGreenland Current. ICES CM 1993/C: 20.
Buch, E. and H.H. Hansen, 1988. Climate and cod fishery at WestGreenland. In:T.Wyatt and M.G. Larraneta (eds.). Long TermChanges in Marine Fish Populations. A symposium held in Vigo,Spain, 18–21 November 1986, pp. 345–364.
Buch, E., S.A. Horsted and H. Hovgaard, 1994. Fluctuations in theoccurrence of cod in Greenland waters and their possible causes.ICES Marine Science Symposia, 198:158–174.
Buch, E., M.H. Nielsen and S.A. Pedersen, 2002. Ecosystem variabili-ty and regime shift in West Greenland waters. Northwest AtlanticFisheries Organization, Standing Committee on Research Doc.02/16, Ser. No. N4617.
Bulatov, O.A., 1995. Biomass variation of walleye pollock of theBering Sea in relation to oceanological conditions. In: R.J. Beamish(ed.). Climate Change and Northern Fish Populations, pp.631–640. Canadian Special Publication of Fisheries and AquaticSciences, 121.
Bundy, A., 2001. Fishing on ecosystems: the interplay of fishing andpredation in Newfoundland-Labrador. Canadian Journal ofFisheries and Aquatic Sciences, 58:1153–1167.
Chapter 13 • Fisheries and Aquaculture 773
Bundy, A., G.R. Lilly and P.A. Shelton, 2000. A Mass Balance Model ofthe Newfoundland-Labrador Shelf. Canadian Technical Report ofFisheries and Aquatic Sciences 2310, xiv + 157p.
Burnett, E.C., 1941.The Continental Congress. Macmillan.Cadigan, S.T., 1999. Failed proposals for fisheries management and
conservation in Newfoundland, 1855–1880.In: D. Newell and R.E. Ommer (eds.). Fishing Places, Fishing People:Traditions andIssues in Canadian Small-scale Fisheries, pp. 147–169. University ofToronto Press.
Carscadden, J.E. and K.T. Frank, 2002.Temporal variability in the condi-tion factors of Newfoundland capelin (Mallotus villosus) during the pasttwo decades. ICES Journal of Marine Science, 59:950–958.
Carscadden, J.E., B.S. Nakashima and K.T. Frank, 1997. Effects of fishlength and temperature on the timing of peak spawning in capelin(Mallotus villosus). Canadian Journal of Fisheries and Aquatic Sciences,54:781–787.
Carscadden, J.E., K.T. Frank and W.C. Leggett, 2000. Evaluation of anenvironment-recruitment model for capelin (Mallotus villosus). ICESJournal of Marine Science, 57:412–418.
Carscadden, J.E., K.T. Frank and W.C. Leggett, 2001. Ecosystem changesand the effects on capelin (Mallotus villosus), a major forage species.Canadian Journal of Fisheries and Aquatic Sciences, 58:73–85.
Carscadden, J.E.,W.A. Montevecchi, G.K. Davoren and B.S. Nakashima,2002.Trophic relationships among capelin (Mallotus villosus) andseabirds in a changing ecosystem. ICES Journal of Marine Science,59:1027–1033.
CBC, 2002. Item broadcast on The Morning Show in St. John’s,Newfoundland on Canadian Broadcasting Company Radio 1 in thehalf hour starting at 7:00 a.m.Wednesday, April 24, 2002.
Chadwick, St. J., 1967 Newfoundland: Island into Province. CambridgeUniversity Press.
Chigirinsky, A.I., 1994. Commercial fishing of Pacific salmon in theBering Sea.TINRO Transactions, 116:142–151. (In Russian)
Chuchukalo,V.I.,V.I. Radchenko,V.A. Nadtochii,V.N. Koblikov, A.M.Slabinskii and D.A.Terent’ev, 1999. Feeding and some features ofecology of Gadidae of the western Kamchatka shelf in summer 1996.Journal of Ichthyology, 39(4):309–321. (Translated from VoprosyIkhthiologii, 1999, 39(3):362–374)
Clark,W.G. and S.R. Hare, 2002. Effects of climate and stock size onrecruitment and growth of Pacific halibut. North American Journal ofFisheries Management, 22:852–862.
Clark,W.G., S.R. Hare, A.M. Parma, P.J. Sullivan and R.J.Trumble,1999. Decadal changes in growth and recruitment of Pacific halibut(Hippoglossus stenolepis). Canadian Journal of Fisheries and AquaticSciences, 56:242–252.
Coachman, L.K. 1986. Circulation, water masses, and fluxes on thesoutheastern Bering Sea shelf. Continental Shelf Research, 5:23–108.
Cobb, J.N., 1927. Pacific cod fisheries. US Bureau of Fisheries,Document 1014, Appendix VII to the Report of the USCommissioner of Fisheries for 1926. US Government Printing Office.
Colbourne, E.B. and J.T. Anderson, 2003. Biological response in a chang-ing ocean environment in Newfoundland waters during the latterdecades of the 1900s. ICES Marine Science Symposia, 219:169–181.
Colbourne, E.B., S. Narayanan and S. Prinsenberg, 1994. Climatechanges and environmental conditions in the Northwest Atlantic,1970–1993. ICES Marine Science Symposia, 198:311–322.
Committee on the Bering Sea Ecosystem, 1996. R.C. Francis (Chair),L.G. Anderson,W.D. Bowen, S.K. Davis, J.M. Grebmeier, L.F. Lowry,I. Merculieff, C.H. Peterson, C. Pungowiyi,T.C. Royer, A.M.Springer and W.S.Wooster, 1996.The Bering Sea Ecosystem.Commission on Geosciences, Environment and Resources (CGER),Polar Research Board (PRB). 320p.
Conners, M.E., A.B. Hollowed and E. Brown, 2002. Retrospective analy-sis of Bering Sea bottom trawl surveys: regime shift and ecosystemreorganization. Progress in Oceanography, 55:209–222.
Conover, S., 1999.The 1997/98 Directory of Russian Far East FishingCompanies. Alaska Center for International Business, Anchorage, 99p.
Corbett, F., 2002. Fax message from F. Corbett, Department of Fisheriesand Oceans to A. St. Croix, May 27, 2002.
Crawford, R.E., 1992. Life history of the Davis Strait Greenland halibut,with reference to the Cumberland Sound fishery. CanadianManuscript Report of Fisheries and Aquatic Sciences 2130.
Cushing, D.H., 1969.The fluctuation of year-classes and the regulation offisheries. Fiskeridirektoratets skrifter, 15:368–379.
Darby, C., B. Healey, J.-C. Mahé and W.R. Bowering, 2004. Greenlandhalibut (Reinhardtius hippoglossoides) in Subarea 2 and Divisions3KLMNO: an assessment of stock status based on ExtendedSurvivors Analysis, ADAPT, and ASPIC analyses, with stochasticprojections of potential stock dynamics. Northwest AtlanticFisheries Organization, Scientific Council Research Doc. 04/55,Serial No. N5008.
Davenport, J., 1989.The effects of salinity and low temperature on eggsof the Icelandic capelin Mallotus villosus. Journal of the MarineBiological Association of the United Kingdom, 69:1–9.
Davenport, J. and A. Stene, 1986. Freezing resistance, temperature andsalinity tolerance in eggs, larvae and adults of the capelin, Mallotusvillosus, from Balsfjord. Journal of the Marine Biological Associationof the United Kingdom, 66:145–157.
Davis, M.B., 1992. Description of the inshore fishery during 1991 for2J3KL cod as reported by inshore fisherpersons. Canadian AtlanticFisheries Scientific Advisory Committee, Research Document 93/37.
Davydov, I.V., 1972. On oceanological fundamentals of yield formationof the separate herring generations in the western Bering Sea.TINRO Transactions, 82:281–307. (In Russian)
Dawe, E., D.Taylor, D. Orr, D. Parsons, E. Colbourne, D. Stansbury,J. Drew, P. Beck, P. O’Keefe, P.Veitch, E. Seward, D. Ings and A. Pardy, 2004. An assessment of Newfoundland and Labrador snowcrab in 2003. Department of Fisheries and Oceans, Canadian ScienceAdvisory Secretariat Res. Doc. 2004/024.
Decker, M.B., G.L. Hunt Jr. and G.V. Byrd Jr., 1995.The relationshipsamong sea surface temperature, the abundance of juvenile walleyepollock, and the reproductive performance and diets of seabirds atthe Pribilof Islands, southeastern Bering Sea. In: R.J. Beamish (ed.).Climate Change and Northern Fish Populations, pp. 425–437.Canadian Special Publication of Fisheries and Aquatic Sciences 121.
deYoung, B. and G.A. Rose, 1993. On recruitment and distribution ofAtlantic cod (Gadus morhua) off Newfoundland. Canadian Journal ofFisheries and Aquatic Sciences, 50:2729–2741.
DFO, 2000a. East and Southeast Newfoundland Atlantic Herring.Department of Fisheries and Oceans, Canada, Science Stock StatusReport B2-01.
DFO, 2000b. Capelin in Subarea 2 + Div. 3KL. Department of Fisheriesand Oceans, Canada, Science Stock Status Report B2-02.
DFO, 2000c. Northwest Atlantic harp seals. Department of Fisheriesand Oceans, Canada, Science Stock Status Report E1-01.
DFO, 2001. Capelin in Subarea 2 + Div. 3KL - Update. Department ofFisheries and Oceans, Canada, Science Stock Status Report B2-02.
DFO, 2002a. Newfoundland and Labrador snow crab. Department ofFisheries and Oceans, Canada, Science Stock Status Report C2-01.
DFO, 2002b. Northern shrimp (Pandalus borealis) - Div. 0B to 3K.Department of Fisheries and Oceans, Canada, Science Stock StatusReport C2-05.
DFO, 2003a. Northern (2J+3KL) Cod. Department of Fisheries andOceans, Canada, Stock Status Report 2003/018.
DFO, 2003b. Newfoundland and Labrador Atlantic salmon 2003 stockstatus update. Department of Fisheries and Oceans, Canada, StockStatus Update Report 2003/048.
Dickson, R., 1992. Hydrobiological variability in the ICES area,1980–1990. Introduction. ICES Marine Science Symposia, 195:1–10.
Dragesund, O., J. Hamre and Ø. Ulltang, 1980. Biology and populationdynamics of the Norwegian spring spawning herring. ICES Rapportset Procès-Verbaux des Réunions, 177:43–71.
Dreyer, B., 2000. Globalisering av råvaremarkedet - strategiske utfor-dringer for lokal fiskeindustri. Økonomisk FiskeriforskningReport no. 10:2.
Drinkwater, K.F., 2000. Changes in ocean climate and its general effecton fisheries: examples from the north-west Atlantic. In: D. Mills(ed.).The Ocean Life of Atlantic Salmon: Environmental andBiological Factors Influencing Survival, pp. 116–136. Fishing NewsBooks, Oxford.
Drinkwater, K.F., 2002. A review of the role of climate variability in thedecline of northern cod. American Fisheries Society Symposium,32:113–130.
Dunlop, H.A., Bell, F.H., Myhre, R.J., Hardman,W.H., and Southward,G.M. 1964. Investigation, Utilization and Regulation of Halibut inSoutheastern Bering Sea. International Pacific Halibut CommissionReport 35. Seattle,Washington: International Pacific HalibutCommission.
Eide, A. and O. Flaaten, 1998. Bioeconomic Multispecies Models of theBarents Sea Fisheries. In T. Rødseth (ed.). Models for MultispeciesManagement, pp. 141–172. Physica-Verlag.
Eide, A. and K. Heen, 2002. Economic impacts of global warming.A study of the fishing industry in North Norway. Fisheries Research,56(3):261–274.
Ervik, A., A. Kiessling, O. Skilbrei and T. van der Meeren (eds.), 2003.Havbruksrapport. Fisken og havet, særnummer 3.
Everett, J.T., A. Kronvin, D. Luch-Belda, E. Okemwa. H.A. Regier andJ.P.Troadec, 1996. Fisheries. In: Climate Change 1996. Impacts,Adaptations, and Mitigation of Climate Change: Scientific-technicalAnalyses. Contribution of Working Group II to the SecondAssessment Report of the Intergovernmental Panel of ClimateChange, pp. 511-537.
774 Arctic Climate Impact Assessment
Fadeev, N.S. and V.Wespestad, 2001. Review of walleye pollock fishery.TINRO Transactions, 128:75–91. (In Russian)
FAO, 2000.The State of World Fisheries and Aquaculture 2000. U.N.Food and Agriculture Organization.
Fiskeridirektoratet, 2001. Nøkkeltall fra norsk havbruksnæring.Rapport, Fiskeridirektoratet, Bergen.
Fiskeridirektoratet, 2002a. Beskrivelse av havbruksnæringen i områdetLofoten til den norsk-russiske grense. Fiskeridirektoratet, Bergen.
Fiskeridirektoratet, 2002b. Fiskeriaktiviteten i området Lofoten –Barentshavet. Fiskeridirektoratet, Bergen.
Francis, R.C., S.R. Hare, A.B. Hollowed and W.S.Wooster, 1998.Effects of interdecadal variability on the oceanic ecosystems of theNE pacific. Fisheries Oceanography, 7:1–21.
Frank, K.T. and W.C. Leggett, 1981. Prediction of egg development andmortality rates in capelin (Mallotus villosus) from meteorological,hydrographic, and biological factors. Canadian Journal of Fisheriesand Aquatic Sciences, 38:1327–1338.
Frank, K.T., R.I. Perry and K.F. Drinkwater, 1990. Predicted responseof Northwest Atlantic invertebrate and fish stocks to CO2-inducedclimate change.Transactions of the American Fisheries Society,119:353–365.
Frank, K.T., J.E. Carscadden and J.E. Simon, 1996. Recent excursionsof capelin (Mallotus villosus) to the Scotian Shelf and Flemish Cap during anomalous hydrographic conditions. Canadian Journal ofFisheries and Aquatic Sciences, 53:1473–1486.
Fridriksson, Á., 1948. Boreo-tended changes in the marine vertebratefauna of Iceland during the last 25 years. ICES Rapports et Procès-Verbaux des Réunions, 125:30–32.
Friis-Rødel, E. and P. Kanneworff, 2002. A review of capelin (Mallotusvillosus) in Greenland waters. ICES Marine Science Symposia,216:890–896.
Frost, O., 2003. Bering:The Russian Discovery of America.YaleUniversity Press, 330p.
Furevik,T., H. Drange and A. Sorteberg, 2002. Anticipated changes inthe Nordic Seas marine climate: scenarios for 2020, 2050 and 2080.Institute of Marine Research, Bergen. Fisken og Havet No. 4.
Gavrilov, G.M. and I.I. Glebov, 2002.The composition of demersalichthyocenosis in the western part of Bering Sea in November, 2002.TINRO Transactions, 130:1027–1037. (In Russian)
Ginter, J., 1995.The Alaska community development quota fisheriesmanagement program. Ocean and Coastal Management,28(1–3):147–163.
Glebova, S.Yu., 2001. Coordination of types of atmospheric processesabove the far-eastern seas.TINRO Transactions, 128:58–74.(In Russian)
Gomes, M.C., R.L. Haedrich and M.G.Villagarcia, 1995. Spatial andtemporal changes in the groundfish assemblages on the north-eastNewfoundland/Labrador Shelf, north-west Atlantic, 1978–1991.Fisheries Oceanography, 4:85–101.
Gordeev,V.D., 1954. Results of the Bering Sea trawl expedition of1950–52.TINRO Transactions, 41:253–269. (In Russian)
Government of Canada, 1976a. Policy for Canada’s CommercialFisheries. Fisheries and Marine Service of the Department of theEnvironment, Ottawa.
Government of Canada, 1976b. Community and EmploymentImplications of Restructuring the Atlantic Fisheries. Analysis andLiaison Branch of the Department of Regional EconomicExpansion, Ottawa.
Government of Newfoundland and Labrador, 1978. Setting a Course:A Regional Strategy for Development of the Newfoundland FishingIndustry to 1985. Department of Fisheries, St. John’s,Newfoundland.
Government of Newfoundland and Labrador, 2001. Securing OurFuture Together: Final Report on the Renewal Strategy for Jobs andGrowth. Government of Newfoundland and Labrador, St. John’s,Newfoundland.
Hacquebord, L., 2001.Three centuries of whaling and walrus hunting inSvalbard and its impact on the Arctic ecosystem. Environment andHistory, 7:169–185.
Haedrich, R.L. and S.M. Barnes, 1997. Changes over time of the sizestructure in an exploited shelf fish community. Fisheries Research,31:229–239.
Haedrich, R.L. and J. Fischer, 1996. Stability and change of exploitedfish communities in a cold ocean continental shelf ecosystem.Senckenbergiana Maritima, 27:237–243.
Haedrich, R.L., J. Fischer and N.V. Chernova, 1997. Ocean tempera-tures and demersal fish abundance on the northeast Newfoundlandcontinental shelf. In: L.E. Hawkins and S. Hutchinson (eds.).Theresponses of marine organisms to their environments - Proceedingsof the 30th European Marine Biology Symposium, pp. 211–221.University of Southampton.
Haflinger, K.E. and C.P. McRoy, 1983. Final Report:Yellowfin sole(Limanda aspera) predation on three commercial crab species(Chionoecetes opilio, C. Bairdi, and Paralithodes camtschatica) in thesoutheastern Bering Sea. National Marine Fisheries Service FinalReport, Contract #82-ABC-00202.
Hammill, M.O. and G.B. Stenson, 2000. Estimated prey consumption byharp seals (Phoca groenlandica), hooded seals (Cystophora cristata), greyseals (Halichoerus grypus) and harbour seals (Phoca vitulina) in AtlanticCanada. Journal of Northwest Atlantic Fishery Science, 26:1–23.
Hamre, J., 2003. Capelin and herring as key species for the yield ofnorth-east Arctic cod. Results from multispecies model runs. ScientiaMarina, 67(1):315–323.
Hansen, P.M., 1949. Studies of the biology of the cod in Greenlandwaters. ICES Rapports et Procès-Verbaux des Réunions, 123:1–83.
Hansen, P.M., A.S. Jensen and Å.V.Tåning, 1935. Cod marking experi-ments in the waters of Greenland 1924–1933. Meddelelser fraKommissionen for Danmarks Fiskeri- og Havundersøgelser. Serie:Fiskeri, 10(1):3–119.
Hare, S.R. and R.C. Francis, 1995. Climate change and salmon produc-tion in the northeast Pacific Ocean. In: R.J. Beamish (ed.). ClimateChange and Northern Fish Populations, pp. 357–372. CanadianSpecial Publication of Fisheries and Aquatic Sciences 121.
Hare, S.R. and N. Mantua, 2000. Empirical evidence for North Pacific(climatic) regime shifts in 1977 and 1989. Progress in Oceanography,47(2–4):103–145.
Harris, C.K., 1989.The effect of international treaty changes on Japan’shigh seas salmon fisheries, with emphasis on their catches of NorthAmerican sockeye salmon, 1972–1984. University of Washington,Phd. Dissertation, 231p.
Harris, L. (Chairman), 1989. Independent Review of the State of theNorthern Cod Stock. Department of Fisheries and Oceans, Ottawa.
Harris, I. (Chairman), 1990. Independent Review of the State of theNorthern Cod Stock: Final Report of the Northern Cod ReviewPanel. Department of Supply and Services, Ottawa.
Hart, J.L. 1973. Pacific Fishes of Canada. Fisheries Research Board ofCanada Bulletin 180, 740p.
Hartvigsen, R., A. Olsen, P.K. Hansen, O. Bjerk, E. Bolle and S. Jensen,2003. Beskrivelse av havbruksnæringen I området Lofoten til dennorsk-russiske grense. Fiskeridirektoratet, Bergen.
Haug,T., L.Walløe, S. Grønvik, N. Hedlund, M. Indregaard, H.Lorentzen, D. Oppen-berntsen and N. Øien, 1998. Sjøpattedyr - omhval og sel i norske farvann. Universitetsforlaget, Oslo.
Haynes, E.G. and G. Ingell, 1983. Effect of temperature on rate ofembryonic development of walleye pollock (Theragra chalcogramma).Fishery Bulletin, 81:890–894.
Healey, B.P. and G.B. Stenson, 2000. Estimating pup production andpopulation size of the Northwest Atlantic harp seal (Phoca groenlandi-ca). Department of Fisheries and Oceans, Canadian Stock AssessmentSecretariat Res. Doc. 2000/081.
Heen, K. and M. Aanesen, 1993. Kryssløpsmodell for nordnorsk økonomi 1987. Rapport NORUT samfunn forskning,Tromsø.(In Norwegian)
Hiatt,T., R. Felthoven and J.Terry, 2002. Stock assessment and fisheryevaluation report for the groundfish fisheries of the Gulf of Alaskaand Bering Sea/Aleutian Island Areas. Appendix D economic status ofthe groundfish fisheries of Alaska, 2001. Alaska Fisheries ScienceCenter, National Marine Fisheries Service, National Oceanic andAtmospheric Administration, Seattle, 119p.
Hoel, A.H., 1993. Regionalisation of international whale management:the case of the Northeast Atlantic Marine Mammals Commission.Arctic, 46, 2:116–123.
Hoel, A.H., 1994.The Barents Sea: fisheries resources for Europe andRussia. In: O.S. Stokke and O.Tunander (eds.).The Barents Region.Cooperation in Arctic Europe. International Peace Research Institute,Oslo and the Fridtjof Nansen Institute.
Hoel, A.H., 1998. Political uncertainty in international fisheries man-agement. Fisheries Research, 37:239–250.
Hollowed, A.B. and W.S.Wooster, 1992.Variability of winter ocean conditions and strong year classes of Northeast Pacific groundfish.ICES Marine Science Symposia, 195:433–444.
Hollowed, A.B. and W.S.Wooster, 1995. Decadal-scale variations in theeastern subarctic Pacific: II. Response of Northeast Pacific fishstocks. In: R.J. Beamish (ed.). Climate Change and Northern FishPopulations, pp. 373–385. Canadian Journal of Fisheries and AquaticSciences 121.
Hollowed, A.B., S.R. Hare and W.S.Wooster, 2001. Pacific Basin climatevariability and patterns of Northeast Pacific marine fish production.Progress in Oceanography, 49:257–282.
Hønneland, 1993. Fiskeren og allmenningen; forvaltning og kontroll:Makt og kommunikasjon i kontrollen med fisket i Barentshavet,University of Tromsø.
Chapter 13 • Fisheries and Aquaculture 775
Hønneland, G., 2004. Russian Fisheries Management:The PrecautionaryApproach in Theory and Practice. Martinus Nijhoff Publishers/BrillAcademic Publishers, 210p.
Hønneland, G. and F. Nilssen, 2000. Comanagement in NorthwestRussian fisheries. Society and Natural Resources, 13:635–648.
Huisman, J. and B. Sommeijer, 2002. Maximal sustainable sinking veloc-ity of phytoplankton. Marine Ecology Progress Series, 244:39–48.
Hunt, G.L., P. Stabeno, G.Walters, E. Sinclair, R.D. Brodeur, J.M. Nappand N.A. Bond, 2002. Climate change and control of the southeast-ern Bering Sea pelagic ecosystem. Deep Sea Research II,49(26):5821–5853.
Huntley, M.E. and M.D.G. Lopez, 1992.Temperature-dependent pro-duction of marine copepods: a global analysis. American Naturalist,140:201–242.
Hutchings, J.A., 1996. Spatial and temporal variation in the density ofnorthern cod and a review of hypotheses for the stock’s collapse.Canadian Journal of Fisheries and Aquatic Sciences, 53:943–962.
Hutchings, J.A. and M. Ferguson, 2000.Temporal changes in harvestingdynamics of Canadian inshore fisheries for northern Atlantic cod,Gadus morhua. Canadian Journal of Fisheries and Aquatic Sciences,57:805–814.
Hutchings, J.A. and R.A. Myers, 1994.What can be learned from thecollapse of a renewable resource? Atlantic cod, Gadus morhua, ofNewfoundland and Labrador. Canadian Journal of Fisheries andAquatic Sciences, 51:2126–2146.
Hutchings, J.A. and R.A. Myers, 1995.The biological collapse ofAtlantic cod off Newfoundland and Labrador: an exploration of historical changes in exploitation, harvesting technology, and man-agement. In: R. Arnason and L. Felt (eds.).The North AtlanticFisheries: Successes, Failures, and Challenges, pp. 39–93.TheInstitute of Island Studies, Charlottetown, Prince Edward Island.
Hvingel, C., 2003. A Predictive Fisheries Model for Greenland.Discussion paper.
Hvingel, C., 2004.The fishery for northern shrimp (Pandalus borealis)off West Greenland, 1970–2004. Northwest Atlantic FisheriesOrganization, Scientific Council Research Doc. 04/75, Serial No.N5045.
Hvingel, C., in prep. Shrimp (P. borealis)-cod (G. morhua) interactionsand their implications for the management of the West Greenlandfisheries.
Hylen, A., 2002.Variation in abundance of Arcto-Norwegian cod duringthe 20th century. ICES Marine Science Symposia, 215:543–550.
Ianelli, J.N.,T.K.Wilderbuer and T.M. Sample, 2001. Greenland turbot.In: Stock Assessment and Fishery Evaluation Report for theGroundfish Resources of the Bering Sea/Aleutian Islands regions.Chapter 4.
Ikeda, M., 1990. Decadal oscillations of the air–ice–sea system in thenorthern hemisphere. Atmosphere-Ocean, 28:106–139.
Incze L.E., D.A. Armstrong and S.L. Smith, 1987. Abundance of larvalTanner crabs (Chionoecetes spp.) in relation to adult females andregional oceanography of the southeastern Bering Sea. CanadianJournal of Fisheries and Aquatic Sciences, 44:1143–1156.
Innis, H.A., 1954.The Cod Fisheries. University of Toronto Press,revised edition.
IPCC, 2001. Climate Change 2001 – Impacts, Adaptation, andVulnerability. Contribution of Working Group II to the ThirdAssessment Report of the Intergovernmental Panel on ClimateChange. Cambridge University Press.
Ivanov, B.G., 1970. Distribution of northern shrimp (Pandalus borealisKr.) in the Bering Sea and the Gulf of Alaska.TINRO Transactionsvol. 72.VNIRO Transactions, Mutual issue, 70:131–148. (In Russian)
Ivanov, B.G., 2001. Studies and fisheries of pandalid shrimps (Crustacea,Decapoda, Pandalidae) in the Northern Hemisphere: A review in theXXI century eve (with special reference to Russia), pp. 9–31.In: Ivanov, B.G. (ed.). Study of biology of commercial crustaceansand algae of Russian seas. (In Russian)
Jakobsson, J., 1964. Recent developments in the Icelandic purse-seineherring fishery. In: H. Kristjonsson (ed.). Modern Fishing Gear ofthe World 2, pp. 294–395. Fishing News Books, Oxford.
Jakobsson, J., 1969. On herring migration in relation to changes in seatemperature. Jökull, 19:134–145.
Jakobsson, J., 1978.The north Icelandic herring fishery and environ-mental conditions 1960–1968. ICES Symposium on the BiologicalBasis of Pelagic Fish Stock Management. Paper no. 30, 101p.
Jakobsson, J., 1980. Exploitation of the Icelandic spring- and summer-spawning herring in relation to fisheries management, 1947–1977.ICES Rapports et Procès-Verbaux des Réunions, 177:23–42.
Jakobsson, J., 1992. Recent variability in the fisheries of the NorthAtlantic. ICES Marine Science Symposia, 195:291–315.
Jakobsson, J. and O.J. Østvedt, 1999. A review of joint investigationsof the distribution of herring in the Norwegian and Iceland Seas1950–1970. In: H. Vilhjalmsson, J. Olafsson and O.S. Astthorsson(eds.). Unnsteinn Stefánsson Festschrift. Rit Fiskideildar,XVI:209–238.
Jakobsson, J. and G. Stefánsson, 1999. Management of Icelandic sum-mer spawning herring off Iceland. ICES Journal of Marine Science,56:827–833.
Jarre, A. (ed.), 2002. Ecosystem West Greenland.Workshop held atthe Greenland Institute of Natural Resources, Nuuk 29 November–03 December 2001. Arctic Research Journal 1.
Jensen, A.S., 1926. Indberetning av S/S Dana’s praktisk videndska-belige fiskeriundersøgelser ved Vestgrønland i 1925. Beretninger ogKundgørelser vedr. Styrelsen af Grønland, 2:291–315.
Jensen, A.S., 1939. Concerning a change of climate during recentdecades in the Arctic and Subarctic regions, from Greenland in thewest to Eurasia in the east, and contemporary biological and physi-cal changes.The Royal Danish Science Society. Biological Reports,14, 8:1–77.
Jónsson, J., 1996.Tagging of cod (Gadus morhua) in Icelandic waters1948–1986. Rit Fiskideildar, 14(1):5–82.
Jørgensen, A.K., 1999. Norwegian and Russian Fisheries Enforcementin the Barents Sea – a Comparison with Regard to Effectiveness.MA Thesis, University of Oslo.
Kenyon, K.W., 1962. History of the Steller sea lion at the PribilofIslands, Alaska. Journal of Mammalogy, 43:68–75.
Khen, G.V., 1997. Main regularities of multi-year changes in ice coverof the Bering Sea and Sea of Okhotsk. Complex investigations ofthe Sea of Okhotsk Ecosystem. Moscow:VNIRO. pp. 64–67.(In Russian)
Kirby, M.J.L. (Chairman), 1982. Navigating Troubled Waters – A NewPolicy for the Atlantic Fisheries. Department of Supply andServices of the Government of Canada, Ottawa.
Kocan, R., P. Hershberger and J.Winton, 2001. Effects ofIchthyophonus on survival and reproductive success of Yukon RiverChinook salmon: Final Report for Study 01-200 for the US Fishand Wildlife Service, Subsistence Management, Fisheries ResourceMonitoring Program. University of Washington, Seattle.
Korsbrekke, K., S. Mehl, O. Nakken and M. Pennington, 2001.A survey-based assessment of the Northeast Arctic cod stock.ICES Journal of Marine Science, 58:763–769.
KPMG and SINTEF, 2003. Betydningen av fiskeri- og havbruksnærin-gen for Norge – en ringvirkningsanalyse. SINTEF (Foundation forScientific and Industrial Research at the Norwegian Institute ofTechnology) and KPMG,Trondheim, Norway. (In Norwegian)
Krohn, M., S. Reidy and S. Kerr, 1997. Bioenergetic analysis of theeffects of temperature and prey availability on growth and condi-tion of northern cod (Gadus morhua). Canadian Journal of Fisheriesand Aquatic Sciences, 54(1):113–121.
Kulka, D.W., J.S.Wroblewski and S. Narayanan, 1995. Recent changesin the winter distribution and movements of northern Atlantic cod(Gadus morhua Linnaeus, 1758) on the Newfoundland-LabradorShelf. ICES Journal of Marine Science, 52:889–902.
Langer, R.H., 1980. Summary of Northern Fur Seal data and collec-tion procedures. NOAA Tech. Mem. NMFS F/NWC-3.
Latif, M. and T.Barnett, 1994. Causes of decadal climate variabilityover the North Pacific and North America. Science, 266:634–637.
Lear,W.H., 1979. Distribution, size, and sexual maturity of Arctic cod(Boreogadus saida) in the northwest Atlantic during 1959–1978.Canadian Atlantic Fisheries Scientific Advisory Committee, Res.Doc. 79/17.
Lear,W.H., 1998. History of fisheries in the Northwest Atlantic: the500-year perspective. Journal of Northwest Atlantic FisheryScience, 23:41–73.
Lear,W.H. and L.S. Parsons, 1993. History and management of thefishery for northern cod in NAFO Divisions 2J, 3K and 3L.In: L.S. Parsons and W.H. Lear (eds.). Perspectives on CanadianMarine Fisheries Management. pp. 55–89. Canadian Bulletin ofFisheries and Aquatic Sciences 226.
LeBlanc, R. and P. de Bané, 1981. A Proposed Memorandum ofUnderstanding between DFO and DREE Respecting Joint Actionfor Development of the Fisheries of Eastern Canada. Signed byRoméo LeBlanc and Pierre De Bané, March 20, 1981. NationalArchives of Canada, RG124, Accession 87–88/35,File #4560-F-0 Part 1.
Leggett,W.C., K.T. Frank and J.E. Carscadden, 1984. Meteorologicaland hydrographic regulation of year-class strength in capelin(Mallotus villosus). Canadian Journal of Fisheries and AquaticSciences, 41:1193–1201.
776 Arctic Climate Impact Assessment
Letto, D.M., 1998. Chocolate Bars and Rubber Boots: the SmallwoodIndustrialization Plan. Blue Hill Publishers.
Lilly, G.R., 1994. Predation by Atlantic cod on capelin on the southernLabrador and Northeast Newfoundland shelves during a period ofchanging spatial distributions. ICES Marine Science Symposia,198:600–611.
Lilly, G.R., 2001. Changes in size at age and condition of cod (Gadusmorhua) off Labrador and eastern Newfoundland during 1978–2000.ICES CM 2001/V:15, 34p.
Lilly, G.R., 2002. Ecopath modelling of the Newfoundland Shelf:observations on data availability within the Canadian Department ofFisheries and Oceans. In:T. Pitcher, M.Vasconcellos, S. Heymans,C. Brignall and N. Haggan (eds). Information Supporting Past andPresent Ecosystem Models of Northern British Columbia and theNewfoundland Shelf. Fisheries Centre, University of BritishColumbia. Fisheries Centre Research Reports, 10(1):22–27.
Lilly, G.R. and M. Simpson, 2000. Distribution and Biomass ofCapelin, Arctic Cod and Sand Lance on the NortheastNewfoundland Shelf and Grand Bank as Deduced from Bottom-trawl Surveys. Department of Fisheries and Oceans, Canadian StockAssessment Secretariat Res. Doc. 2000/091, 40p.
Lilly, G.R., H. Hop, D.E. Stansbury and C.A. Bishop, 1994.Distribution and abundance of polar cod (Boreogadus saida) offsouthern Labrador and eastern Newfoundland. ICESC.M.1994/O:6, 21p.
Lilly, G.R., D.G. Parsons and D.W. Kulka, 2000.Was the increase inshrimp biomass on the Northeast Newfoundland Shelf a conse-quence of a release in predation pressure from cod? Journal ofNorthwest Atlantic Fishery Science, 27:45–61.
Lilly, G.R., P.A. Shelton, J. Brattey, N.G. Cadigan, B.P. Healey, E.F.Murphy and D.E. Stansbury, 2001. An Assessment of the Cod Stockin NAFO Divisions 2J+3KL. Department of Fisheries and Oceans,Canadian Stock Assessment Secretariat Res. Doc. 2001/044, 148p.
Lilly, G.R., P.A. Shelton, J. Brattey, N.G. Cadigan, B.P. Healey,E.F. Murphy, D.E. Stansbury and N. Chen, 2003. An assessment ofthe cod stock in NAFO Divisions 2J+3KL in February 2003.Department of Fisheries and Oceans, Canadian Science AdvisorySecretariat Res. Doc. 2003/023, 157p.
Lindkvist, K.B., 2000. Dependent and independent fishing communi-ties in Norway. In: D. Symes (ed.). Fisheries Dependent Regions.Fishing News Books, Blackwell Science.
Link, M.R., M.L. Hartley, S.A. Miller, B.Waldrop, J.Wilen and J. Barnett. 2003. An analysis of options to restructure the BristolBay salmon fishery. Prepared for Bristol Bay Economic DevelopmentCorporation and the Joint Legislative Salmon Industry Task Force,Anchorage. 104p.
Livingston, P.A. and S.Tjelmeland, 2000. Fisheries in boreal ecosys-tems. ICES Journal of Marine Science, 57:619–627.
Livingston, P.A., L-L. Low and R.J. Marasco, 1999. Eastern Bering Seaecosystem trends. In:Tang, Q. and K. Sherman (eds.). Large MarineEcosystems of the Pacific Rim – Assessment, Sustainability, andManagement, pp. 140–162. Blackwell Science.
Lotherington, A.-T. and M.B. Ellingsen, 2002. Små penger og Store Forventninger. Evaluering av Nettverkskreditt. NORUT,rapport nr.8.
Lounsbury, R.G., 1934.The British Fishery in Newfoundland,1634–1763.Yale University Press.
Lowry, L.F. and K. J. Frost, 1985. Biological interactions betweenmarine mammals and commercial fisheries in the Bering Sea.In: J.R. Beddington, R.J.H. Beverton and D.M. Lavigne (eds.).Marine Mammals and Fisheries, pp. 42–61. George Allen & Unwin.
Lowry, L.F., K.J. Frost, D.G. Calkins, G.L. Swartzman and S. Hills,1982. Feeding habits, food requirements, and status of Bering Seamarine mammals. North Pacific Fishery Management Council,Anchorage, Alaska. Document Nos. 19 and 19A. 574p.
Luchin,V.A., A.V. Saveliyev and V.I. Radchenko, 1998. Long-period climatic waves in the western Bering Sea ecosystem. In:V.F. Kozlov(ed.). Climate and Interannual Variability in the Atmosphere-Land-Sea system in the American-Asian sector of the Arctic, pp. 31–42.Proceedings of the Arctic regional center.V.1.Vladivostok: Far-Eastern State University Press. (In Russian)
Luchin,V.A., I.P. Semiletov and G.E.Weller, 2002. Changes in theBering Sea region: atmosphere-ice-water system in the second half ofthe twentieth century. Progress in Oceanography, 55(1–2):23–44.
Malmberg S.A., 1988. Ecological impact of hydrographic conditions inIcelandic waters. In:T.Wyatt and M.G. Larraneta (eds.). Long-termchanges in marine fish populations, pp. 95-123. Symposium held inVigo, Spain, 18–21 November 1986.
Malmberg, S.A. and S. Kristmannsson, 1992. Hydrographic conditionsin Icelandic waters, 1980–1989. ICES Marine Science Symposia,195:76–92.
Malmberg, S.A., J. Mortensen and H.Valdemarsson, 1999. Decadalscale climate and hydrobiological variability in Icelandic waters inrelation to large scale atmospheric conditions in the North Atlantic.International Council for the Exploration of the Sea. ICES CM1999/L:13, 9p.
Mann, K.H. and K.F. Drinkwater, 1994. Environmental influences onfish and shellfish production in the Northwest Atlantic.Environmental Reviews, 2:16–32.
Mantua, N.J., S.R. Hare,Y. Zhang, J.M.Wallace and R.C. Francis,1997. A Pacific interdecadal climate oscillation with impacts onsalmon production. Bulletin of the American MeteorologicalSociety, 78(6):1069–1080.
Marteinsdottir, G. and G. Begg, 2002. Essential relationships incorpo-rating the influence of age, size and condition on variables requiredfor estimation of reproductive potential in Atlantic cod Gadus morhuastocks. Marine Ecology Progress Series, 235:235–256.
Marteinsdottir, G. and A. Steinarsson, 1998. Maternal influence on thesize and viability of Iceland cod (Gadus morhua L.) eggs and larvae.Journal of Fish Biology, 52(6):1241–1258.
Maxim, C., 1980. Capelin (Mallotus villosus) Catch, Effort, andBiological Characteristics in the Romanian Fishery in Division 2J,September–October 1979. Northwest Atlantic FisheriesOrganization Scientific Council Research Doc. 80/4, Serial No.N030.
Michalsen, K. (ed.), 2003. Fisken og havet, særnummer 1. Institute ofMarine Research, Bergen.
Mikalsen, K. and S. Jentoft, 2003. Limits to participation? On the history, structure, and reform of Norwegian fisheries management.Marine Policy, 27(5):397–407.
Miles, E., S. Gibbs, D. Fluharty, C. Dawson and D.Teeter, 1982a.The Management of Marine Regions:The North Pacific. CaliforniaUniversity Press, 656p.
Miles, E., J.Sherman, D. Fluharty and S. Gibbs, 1982b. Atlas of MarineUse:The North Pacific. California University Press, 121p.
Ministry of Fisheries, 2002. Fiskeri og havbruk 2002. StatisticalReport, Ministry of Fisheries, Oslo.
Minobe, S, 1999. Resonance in bidecadal and pentadecadal climateoscillations over the North Pacific: Role in climate regime shifts.Geophysical Research Letters, 26(7):853–858.
Morgan, M.J. and W.R. Bowering, 1997.Temporal and geographic variation in maturity at length and age of Greenland halibut(Reinhardtius hippoglossoides) from the Canadian north-west Atlanticwith implications for fisheries management. ICES Journal of MarineScience, 54:875–885.
Morgan, M.J., P.A. Shelton, D.P. Stansbury, J. Brattey and G.R. Lilly,2000. An Examination of the Possible Effect of Spawning StockCharacteristics on Recruitment in four Newfoundland GroundfishStocks. Canadian Stock Assessment Secretariat Res. Doc. 2000/028.
Morgan, M.J., W.B. Brodie and D.W. Kulka, 2002. Was over-exploitation the cause of the decline of the American plaice stockoff Labrador and northeast Newfoundland? Fisheries Research,57:39–49.
Mowbray, F.K., 2002. Changes in the vertical distribution of capelin(Mallotus villosus) off Newfoundland. ICES Journal of MarineScience, 59:942–949.
Murphy, E.F. and C.A. Bishop, 1995.The status of 2GH cod, 3LNOhaddock, 3Ps haddock and 3Ps pollock. Canadian Department ofFisheries and Oceans, Atlantic Fisheries Research Doc. 95/33.
Muus, B.J., F. Salomonsen and F.C.Vibe, 1990. Grønlands fauna: fisk,fugle, pattedyr.The Greenland Fauna: fish, birds and mammals,463p. (In Danish)
Myers, R.A. and N.G. Cadigan, 1995.Was an increase in natural mortality responsible for the collapse of northern cod? CanadianJournal of Fisheries and Aquatic Sciences, 52:1274–1285.
Myers, R.A., K.F. Drinkwater, N.J. Barrowman and J.W. Baird, 1993.Salinity and recruitment of Atlantic cod (Gadus morhua) in theNewfoundland region. Canadian Journal of Fisheries and AquaticSciences, 50:1599–1609.
Myers, R.A., N.J. Barrowman, J.M. Hoenig and Z. Qu, 1996a.The collapse of cod in Eastern Canada: the evidence from taggingdata. ICES Journal of Marine Science, 53:629–640.
Myers, R.A., J.A. Hutchings and N.J. Barrowman, 1996b. Hypothesesfor the decline of cod in the North Atlantic. Marine EcologyProgress Series, 138:293–308.
Myers, R.A., N.J. Barrowman and J.A. Hutchings, 1997a. Inshoreexploitation of Newfoundland Atlantic cod (Gadus morhua) since1948 as estimated from mark-recapture data. Canadian Journal ofFisheries and Aquatic Sciences, 54(1):224–235.
Myers, R.A., J.A. Hutchings and N.J. Barrowman, 1997b.Why do fishstocks collapse? The example of cod in Atlantic Canada. EcologicalApplications, 7:91–106.
NAFO, 2001b. Scientific Council Report, Northwest Atlantic FisheriesOrganization. June 2001, 339p.
Nakashima, B.S. and C.T. Taggart, 2002. Why are some beaches better for spawning than others? ICES Journal of Marine Science,59:897–908.
Nakashima, B.S. and J.P.Wheeler, 2002. Capelin (Mallotus villosus)spawning behaviour in Newfoundland waters – the interactionbetween beach and demersal spawning. ICES Journal of MarineScience, 59:909–916.
Nakken, O., 1994. Causes of trends and fluctuations in the Arcto-Norwegian cod stock. ICES Marine Science Symposia, 198:212–228.
Nakken, O., 1998. Past, present and future exploitation and manage-ment of marine resources in the Barents Sea and adjacent areas.Fisheries Research, 37:23–35.
Napazakov,V.V.,V.I. Chuchukalo, N.A. Kuznetsova,V.I. Radchenko,A.M. Slabinskii and V.A. Nadtochii, 2001. Feeding and some fea-tures of ecology of Gadidae fish in the western part of Bering Sea inthe summer – autumn season.TINRO Transactions, 128:907–928.(In Russian)
Narayanan, S., J. Carscadden, J.B. Dempson, M.F. O’Connell,S. Prinsenberg, D.G. Reddin and N. Shackell, 1995. Marine climateoff Newfoundland and its influence on Atlantic salmon (Salmo salar)and capelin (Mallotus villosus). In: R.J. Beamish (ed.). Climate Changeand Northern Fish Populations, pp. 461–474. Canadian SpecialPublication of Fisheries and Aquatic Sciences 121.
National Research Council, 1996.The Bering Sea Ecosystem.Committee on the Bering Sea Ecosystem, Polar Research Board,Commission on Geosciences, Environment and Resources. NationalAcademy Press.
National Research Council, 2003. Decline of the Steller Sea Lion inAlaskan Waters: Untangling Food Webs and Fishing Nets. NationalAcademies Press.
Natural Resources Consultants, 1999. Status of Washington-based com-mercial fisheries and the fleets’ future utilization of Fishermen’sTerminal. Port of Seattle, Seattle. 195p.
Naumenko, N.I., 2001. Biology and fisheries on marine herring of thefar-eastern seas. Kamchatsky Publishers. 330p. (In Russian)
Naumenko, N.I., P.A. Balykin, E.A. Naumenko and E.R. Shaginyan,1990. Long-term changes in pelagic fish community in the westernBering Sea.TINRO Transactions, 111:49–57. (In Russian)
Naumenko, N.I., P.A. Balykin and E.A. Naumenko, 2001. Long-termfluctuations in the pelagic community in the western Bering Sea.In: Abstracts of PICES Tenth Annual Meeting,Victoria, BC, Canada.pp. 125.
Neis, B., D.C. Schneider, L. Felt, R.L. Haedrich, J. Fischer and J.A. Hutchings, 1999. Fisheries assessment: what can be learnedfrom interviewing resource users? Canadian Journal of Fisheries andAquatic Sciences, 56:1949–1963.
Netboy, A., 1974.The salmon: their fight for survival. Houghton Mifflin,Boston.
Nichol, D.G., 1994. Maturation and spawning of female yellowfin solein the eastern Bering Sea. Proceedings of the International PacificFlatfish Symposium, Anchorage, Alaska.
Nichol, D.G., 1997. Effects of geography and bathymetry on growth andmaturity of yellowfin sole, Pleuronectes asper, in the eastern BeringSea. Fishery Bulletin, 95:494–503.
Niebauer, H.J., N.A. Bond, L.P.Yakunin and V.V. Plotnikov, 1999.An update on the climatology and sea ice of the Bering Sea.In:T.R. Loughlin and K. Ohtani (eds.). Dynamics of the Bering Sea,pp. 29–59. Alaska Sea Grant College Program. AK-SG-99-03.
Nilssen, F. and G. Hønneland, 2001. Institutional change and the prob-lems of restructuring the Russian fishing industry. Post-CommunistEconomies, 13:313–330.
Nilssen, K.T., 1995. Seasonal distribution, condition, and feeding habitsof Barents Sea harp seals. In: A.S. Blix, L.Walloe and O. Ulltang(eds.).Whales, Seals, Fish and Man. Proceedings of the InternationalSymposium on the Biology of Marine Mammals in the NortheastAtlantic, pp. 241–254.Tromsø, Norway, 29 November – 1December 1994. Developments in Marine Biology 4. Elsevier.
Nishiyama,T., K. Hirano and T. Haryu, 1986.The early life history andfeeding habits of larval walleye pollock in the southeast Bering Sea.Bulletin of the International North Pacific Fisheries Commission,45:177–227.
NMFS, 1999. Our Living Oceans. Report on the Status of US LivingMarine Resources, 1999. NOAA Tech. Memo. NMFS-F/SPO-41,301p. National Marine Fisheries Service,Washington, D.C.
NMFS, 2003a. Fisheries of the United States, 2002. National MarineFisheries Service,Washington, D.C.
Nordøy, E., P.E. Mortensson, A.R. Lager, L.P. Folkow and A.S. Blix,1995. Food consumption of the Northeast Atlantic stock of harpseals. In: A.S. Blix, L.Walloe and O. Ulltang (eds.).Whales, Seals,Fish and Man. Proceedings of the International Symposium on theBiology of Marine Mammals in the Northeast Atlantic, pp.255–260.Tromsø, Norway, 29 November – 1 December 1994.Developments in Marine Biology 4, Elsevier
NORUT Samfunnforskning, 2002. Konjunkturbarometer for Nord-Norge, NORUT,Tromsø, 63p.
Novikov, N.P., 1974. Commercial fishes of continental slope of thenorthern part of Pacific Ocean. Moscow: Food Industry. 308 p.(In Russian)
NPAFC, 2001. Annual Report, 2001. North Pacific Anadromous FishCommission,Vancouver.
NPFMC, 2003a. Discussion paper on Western Alaska CommunityDevelopment Quota (CDQ) Program. North Pacific FisheryManagement Council, Alaska.
NPFMC, 2003b. Preliminary draft Environmental Impact Statementfor Essential Fish Habitat identification and conservation in Alaska.North Pacific Fishery Management Council Anchorage.Vol. I,II.
NPFMC, 2004. Stock Assessment and Resource Evaluation Report.The groundfish resources of the Bering Sea. North Pacific FisheriesManagement Council.
O’Brien, K. and R. Leichenko, 2000. Double exposure: assessing theimpacts of climate change within the context of globalization.Global Environmental Change, 10:221–232.
Ohtani, K. and T. Azumaya, 1995. Influence of interannual changes inocean conditions on the abundance of walleye pollock in the east-ern Bering Sea. In: R.J. Beamish (ed.). Climate Change andNorthern Fish Populations, pp. 87–95. Canadian SpecialPublication of Fisheries and Aquatic Sciences 121.
Øiestad,V., 1994. Historic changes in cod stocks and cod fisheries:Northeast Arctic cod. ICES Marine Science Symposia, 198:17–30.
Orr, D., D.G. Parsons, P.J.Veitch and D.J. Sullivan, 2001a. NorthernShrimp (Pandalus borealis) off Baffin Island, Labrador andNortheastern Newfoundland – First Interim Review. Departmentof Fisheries and Oceans, Canadian Stock Assessment SecretariatRes. Doc. 2001/043.
Orr, D.C., D.G. Parsons, P.Veitch and D. Sullivan, 2001b. An Updateof Information Pertaining to Northern Shrimp (Pandalus borealis)and Groundfish in NAFO Divisions 3LNO. Northwest AtlanticFisheries Organization, Scientific Council Research Doc. 01/186,Serial No. N4576.
Orr, D.C., P.J.Veitch and D.J. Sullivan, 2003. Northern shrimp(Pandalus borealis) off Baffin Island, Labrador and NortheasternNewfoundland. Department of Fisheries and Oceans, CanadianScience Advisory Secretariat Res. Doc. 2003/050.
Ottersen, G. and S. Sundby, 1995. Effects of temperature, wind andspawning stock biomass on recruitment of Arcto-Norwegian cod.Fisheries Oceanography, 4:278–292.
Otto, R.S., 1998. Assessment of the eastern Bering Sea snow crab,Chionoecetes opilio, stock under the terminal molting hypothesis.In: G.S. Jamieson and A. Campbell (eds.). Proceedings of theNorth Pacific Symposium on Invertebrate Stock Assessment andManagement. Can. Spec. Publ. Fish. Aquat. Sci. 125:109–124.
Overland, J.E. 1981. Marine Climatology of the Bering Sea. In:D.W. Hood and J.A. Calder (eds.). The eastern Bering Sea shelf:oceanography and resources, pp. 15–22. University ofWashington Press.
Overland, J.E., 1990: Prediction of vessel icing at near-freezing seatemperatures.Weather and Forecasting, 5:62–77.
Overland, J.E., 2004. Ocean and climate changes. In:V. Alexander,R.I. Perry (eds.). PICES Report on Marine Ecosystems of theNorth Pacific. Special Publication of the North Pacific MarineScience Organization, 1:39–57.
Overland, J.E., J.M. Adams and N.A. Bond, 1999. Decadal variabilityand the Aleutian Low and its relation to high-latitude circulation.Journal of Climate, 12:1542–1548.
Overton, J., 2001. Official acts of vandalism: privatizingNewfoundland’s Provincial Parks in the 1990s. In: D. McGrath(ed.). From Red Ochre to Black Gold. Flanker Press,Newfoundland.
778 Arctic Climate Impact Assessment
Pálsson, Ó.K., 1997. Food and feeding of cod (Gadus morhua).In: J. Jakobsson and Ó. K. Pálsson (eds.). Multispecies Research1992–1995, pp. 177–191. Marine Research Institute, Reykjavík,Technical Report, 57. (In Icelandic)
Parsons, D.G. and E.B. Colbourne, 2000. Forecasting fishery perform-ance for northern shrimp (Pandalus borealis) on the Labrador Shelf(NAFO Divisions 2HJ). Journal of Northwest Atlantic FisheryScience, 27:11–20.
Parsons, L.S. and W.H. Lear, 2001. Climate variability and marineecosystem impacts: a North Atlantic perspective. Progress inOceanography, 49:167–188.
Pautzke, C., 1997. Russian Far East Fisheries Management – NorthPacific Fishery Management Council Report to Congress.Anchorage, 68p.
Pereyra,W.T., J.E. Reeves and R.A. Bakala, 1976. Demersal Fish andShellfish Resources of the Eastern Bering Sea in the Baseline Year1975. Northwest Fisheries Center, National Marine FisheriesService. Seattle.
Pike, D.G., 1994.The Fishery for Greenland Halibut (Reinhardtius hippoglossoides) in Cumberland Sound, Baffin Island, 1987–1992.Canadian Technical Report of Fisheries and Aquatic Sciences 1924.
Planque, B. and T. Frédou, 1999.Temperature and the recruitment ofAtlantic cod (Gadus morhua). Canadian Journal of Fisheries andAquatic Sciences, 56:2069–2077.
Plotnikov,V.V., 1996.Variability of ice conditions of the far-eastern (theBering, Okhotsk and Japan) seas and their forecast. Ph.D. thesis.Vladivostok: POI DVO of Russian Academy of Sciences. In Russian
Plotnikov,V.V. and G.I.Yurasov, 1994. Seasonal and interannual variabil-ity of ice cover in the North Pacific marginal seas, pp. 13–24.PICES-STA workshop on monitoring subarct. Pacific Ocean,Nemuro, Japan.
Polovina, J.J., G.T. Mitchum and G.T. Evans, 1995. Decadal and basin-scale variation in mixed layer depth and the impact on biologicalproduction in the Central and North Pacific, 1960–88. Deep-SeaResearch, 42(10):1701–1716.
Pope, J., P. Large and T. Jakobsen, 2001. Revisiting the influences ofparent stock, temperature and predation on the recruitment of theNortheast Arctic cod stock, 1930–1990. ICES Journal of MarineScience, 58:967–972.
Pushie, G.F. (Chairman), 1967. Report of the Royal Commission onthe Economic Prospects of Newfoundland and Labrador. Office ofthe Queen’s Printer, St. John’s, Newfoundland.
Queirolo, L.E., L.W. Fritz, P.A. Livingston, M.R. Loefflad, D.A. Colpoand Y.L. deReynier, 1995. Bycatch, utilization, and discards in thecommercial groundfish fisheries of the Gulf of Alaska, EasternBering Sea and Aleutian Islands. NOAA Tech. Mem. NMFS-AFSC-58. 148p.
Quinn,T.J. II and H.J. Niebauer, 1995. Relation of eastern Bering Seawalleye pollock (Theragra chalcogramma) recruitment to environmen-tal and oceanographic variables. In: R.J. Beamish (ed.). ClimateChange and Northern Fish Populations, pp. 497–507. CanadianSpecial Publication of Fisheries and Aquatic Sciences 121.
Radchenko,V.I., 1992.The role of squids in the Bering Sea pelagicecosystem. Oceanology, 32(6): 1093–1101. (In Russian)
Radchenko V.I., 1994. Composition, structure and dynamics of theepipelagic nekton communities. MSc. Thesis. Vladivostok. 24p.(in Russian)
Radchenko,V.I. and I.I. Glebov, 1998. Incidental by-catch of Pacificsalmon during Russian bottom trawl surveys in the Bering Sea andsome remarks on its ecology. North Pacific Anadromous FishCommission Bulletin, 1:367–374.
Radchenko,V.I., G.V. Khen and A.M. Slabinsky, 2001. Cooling in thewestern Bering Sea in 1999: quick propagation of La Niña signal orcompensatory processes effect? Progress in Oceanography,49(1–4):407–422.
Ramstad, S., 2001. Etableringen av et InternasjonaltForvaltningsregime for Norsk Vårgytende Sild. En kamp om ressurs-er mellom Norge, Russland, Island, Færøyene og EU.Hovedoppgave i Statsvitenskap, Universitetet i Tromsø.
Ray, G.C. and J. McCormick-Ray, 2004. Coastal Marine Conservation:Science and Policy. Blackwell.
Rice, J., 2002. Changes to the large marine ecosystem of theNewfoundland-Labrador Shelf. In: K. Sherman and H.R. Skjoldal(eds.). Large Marine Ecosystems of the North Atlantic, pp. 51–103.Elsevier Science.
Rice, J.C. and G.T. Evans, 1988.Tools for embracing uncertainty in themanagement of the cod fishery of NAFO divisions 2J+3KL. Journaldu Conseil International pour l’Exploration de la Mer, 45:73–81.
Report to Parliament, 1998. Perspectives on the Development of theNorwegian Fishing Industry. Ministry of Fisheries, Oslo.(In Norwegian)
Rose, G.A. and D.W. Kulka, 1999. Hyperaggregation of fish and fish-eries: how catch-per-unit-effort increased as the northern cod(Gadus morhua) declined. Canadian Journal of Fisheries and AquaticSciences, 56(1):118–127.
Rose, G.A., B.A. Atkinson, J. Baird, C.A. Bishop and D.W. Kulka,1994. Changes in distribution of Atlantic cod and thermal varia-tions in Newfoundland waters, 1980–1992. ICES Marine ScienceSymposia, 198:542–552.
Rose, G.A., B. deYoung, D.W. Kulka, S.V. Goddard and G.L. Fletcher,2000. Distribution shifts and overfishing the northern cod (Gadusmorhua): a view from the ocean. Canadian Journal of Fisheries andAquatic Sciences, 57:644–663.
Rosenkranz, G.E., A.V.Tyler and G.H. Kruse, 2001. Effects of watertemperature and wind on year-class success of Tanner crabs inBristol Bay, Alaska. Fisheries Oceanography, 10(1):1–12.
Rosing-Asvid, A., 2005. Climate variability around Greenland and itsinfluence on ringed seals and polar bears. Ph.D.Thesis, Universityof Copenhagen.
Sæmundsson, B., 1934. Probable influence of changes in temperatureon the marine fauna of Iceland. ICES Rapports et Procès-Verbauxdes Réunions, 86:3–6.
Sapozhnikov,V.V., N.V. Arzhanova and V.V. Zubarevitch, 1993.Estimation of primary production in the ecosystem of westernBering Sea. Russian Journal of Aquatic Ecology, 2(1):23–34.
Schmidt., J., 1909.The distribution of the pelagic fry and spawningregions of the Gadoids in the North-N-Atlantic from Iceland toSpain. ICES Rapports et Procès-Verbaux des Réunions, 10:1–229.
Schmidt, J., 1931. Summary of the Danish marking experiments oncod, 1904–1929, at the Faroes, Iceland and Greenland. Rapp. P-v.Reun.Cons.perm.int..Explor.Mer, 72. 13 pp.
Schopka, S.A., 1994. Fluctuations in the cod stock off Iceland duringthe twentieth century in relation to changes in the fisheries andenvironment. In: J. Jakobsson, O.S. Asthorsson, R.J.H. Beverton,B. Björnsson, N.Daan, K.T. Frank, J.B. Rothschild, S.Sundby and S.Tilseth (eds.). Cod and Climate. ICES Marine Science Symposia,198:175–193.
Schrank, W.E., 1995. Extended fisheries jurisdiction: origins of thecurrent crisis in Atlantic Canada’s fisheries. Marine Policy,19:285–299.
Schrank,W.E., 1997.The Newfoundland fishery: past, present andfuture. In S. Burns (ed.). Subsidies and Depletion of WorldFisheries: Case Studies.World Wildlife Fund,Washington, D.C.
Schrank,W.E. and B. Skoda, 2003.The cost of marine fishery manage-ment in eastern Canada: Newfoundland, 1989/1990 to 1999/2000.In:W.E. Schrank, R. Arnason and R. Hannesson (eds.).The Cost ofFisheries Management, pp, 91–128. Ashgate Publishers.
Schrank,W.E., N. Roy and E.Tsoa, 1986. Employment prospects in acommercially viable Newfoundland fishery: An application of ‘An Econometric Model of the Newfoundland Groundfishery’.Marine Resource Economics, 3:237–263.
Schrank,W.E., N. Roy, R. Ommer and B. Skoda, 1992. An inshorefishery: A commercially viable industry or an employer of lastresort. Ocean Development and International Law, 23:335–367.
Schrank,W.E., B. Skoda, P. Parsons and N. Roy, 1995.The cost to government of maintaining a commercially unviable fishery: thecase of Newfoundland 1981/82 to 1990/91. Ocean Developmentand International Law, 26:357–390.
Schumacher, J.D., 2000. Regime shift theory: A review of changingenvironmental conditions in the Bering Sea and the Eastern NorthPacific. In: S. Connover (ed.). Proceedings of the Fifth NorthPacific Rim Fisheries Conference, pp. 127–142. Cooperation,coordination and communication, AK: Pacific Rim FisheriesProgram, Institute of the North, Alaska Pacific University.
Shackell, N.L., J.E. Carscadden and D.S. Miller, 1994. Migration ofpre-spawning capelin (Mallotus villosus) as related to temperature onthe northern Grand Bank, Newfoundland. ICES Journal of MarineScience, 51:107–114.
Shaw, J., R.B.Taylor, D.L. Forbes, M.-H. Ruz and S. Solomon, 1998.Sensitivity of the Coasts of Canada to Sea-level Rise. GeologicalSurvey of Canada Bulletin 505, 79p.
Shelton, P.A. and D.B. Atkinson, 1994. Failure of the Div. 2J3KL CodRecruitment Prediction using Salinity. Department of Fisheries andOceans, Canadian Stock Assessment Secretariat Res. Doc.94/66.14p.
Shelton, P.A. and G.R. Lilly, 2000. Interpreting the collapse of thenorthern cod stock from survey and catch data. Canadian Journalof Fisheries and Aquatic Sciences, 57:2230–2239.
Shelton, P.A., G.R. Lilly and E. Colbourne, 1999. Patterns in theannual weight increment for Div. 2J+3KL cod and possible predic-tion for stock projection. Journal of Northwest Atlantic FisheryScience, 25:151–159.
Chapter 13 • Fisheries and Aquaculture 779
Shuntov,V.P. 1970. Seasonal distribution of black and arrow-toothedhalibuts in the Bering Sea.TINRO Transactions, vol. 72.VNIROTransactions, Mutual issue, 70:391–401. (In Russian)
Shuntov,V.P., 2001. Biology of far-eastern seas of Russia.TINRO-Center.V.1. 580p. (In Russian)
Shuntov,V.P. and V.I. Radchenko, 1999. Summary of TINROEcosystem Investigations in the Bering Sea. In:T.R. Loughlin andK. Otani (eds.). Dynamics of the Bering Sea. Alaska Sea GrantProgram. AK-SG-99-03. pp. 771–776.
Shuntov, V.P. and V.P. Vasilkov, 1982. Epochs of atmospheric circula-tion and cyclic reoccurrence of abundance dynamics of Far-Eastern and Californian sardine. Journal of Ichthyology,22(1):187–199. (In Russian)
Shuntov,V.P., A.F.Volkov, O.S.Temnykh and E.P. Dulepova, 1993.Walleye pollock in the far-eastern seas ecosystems.TINRO, 426p.(In Russian)
Shuntov,V.P.,V.V. Lapko,V.V. Nadtochiy and E.V. Samko, 1994.Interannual changes in fish communities in upper epipelagic layerin the western Bering Sea and Pacific waters off Kamchatka.Journal of Ichthyology, 34(5):642–648. (In Russian)
Shuntov,V.P.,V.I. Radchenko, E.P. Dulepova and O.S.Temnykh, 1997.Biological resources of the Far Eastern Russian economic zone:structure of pelagic and bottom communities, up-to-date status,tendencies of long-term dynamics.TINRO Transactions, 122:3–15.(In Russian)
Shuntov,V.P., E.P. Dulepova and I.V.Volvenko, 2002. Up-to-date status and long-term dynamics of biological resources in the FarEastern economic zone of Russia.TINRO Transactions, 130:3–11.In Russian
Shuntov,V.P., L.N. Bocharov, E.P. Dulepova, A.F.Volkov, O.S.Temnykh, I.V.Volvenko, I.V. Melnikov and V.A. Nadtochy, 2003.Results of monitoring and ecosystem research of biologicalresources of the Far East seas of Russia.TINRO Transactions,132:3–26. In Russian
Shuter, B.J., C.K. Minns, H.A. Regier and J.D. Reist, 1999. Canadacountry study: Climate impacts and adaptations: fishery sector.Vol.VII, National Sectoral Volume, pp 258–317.
Sinclair E.H., A.A. Balanov,T. Kubodera,V.I. Radchenko and Yu.A. Fedorets, 1999. Distribution and ecology of mesopelagic fishesand cephalopods. In:T.R. Loughlin and K. Ohtani (eds.). Dynamicsof the Bering Sea, pp. 485–508. Fairbanks: Alaska Sea GrantCollege Program.
Slizkin, A.G. and V.Ya. Fedoseev, 1989. Distribution, biology, popula-tion structure and abundance of Tanner crabs in the Bering Sea.In: Proceedings of the International Scientific Symposium onBering Sea Fisheries. Sitka, Alaska. Seattle, pp. 316–347.
Smith, S.L., and J.Vidal, 1986.Variations in the distribution, abun-dance, and development of copepods in the southeastern BeringSea in 1980 and 1981. Continental Shelf Research, 5:215–239.
Sogard, S.M. and B.L. Olla, 1998. Contrasting behavioral responses tocold temperatures by two marine fish species during their pelagicjuvenile interval. Environmental Biology of Fishes, 53:405–412.
Solhaug,T., 1983. De norske fiskeriers historie 1815–1880.Universitetsforlaget, Bergen.
Somerton, D.A. and P. Munro, 2001. Bridle efficiency of a surveytrawl for flatfish. Fishery Bulletin, 99:641–652.
Stabeno, P.J., N.A. Bond, N.B. Kachel, S.A. Salo and J.D. Schumacher,2001. On the temporal variability of the physical environment overthe south-eastern Bering Sea. Fisheries Oceanography, 10(1):81–98.
Statistics Canada, 2002b. 2001 Community Profiles. ww12.statcan.ca/english/profil01/PlaceSearchForm1.cfm (March 18, 2003).
Stefánsson, U., 1999. Hafi? (The Ocean). Háskólaútgáfan, Reykjavík.480p. (In Icelandic)
Stenson, G.B., B.P. Healey, B. Sjare and D.Wakeham, 2000. Catch-at-age of northwest Atlantic harp seals, 1952–1999. Department ofFisheries and Oceans, Canadian Stock Assessment Secretariat Res.Doc. 2000/079.
Stenson, G.B., M.O. Hammill, M.C.S. Kingsley, B. Sjare,W.G.Warrenand R.A. Myers, 2002. Is there evidence of increased pup produc-tion in northwest Atlantic harp seals, Pagophilus groenlandicus? ICESJournal of Marine Science, 59:81–92.
Stepanenko, M.A., 2001.The state of stock, interannual variability ofrecruitment, and fisheries of the eastern Bering Sea pollock in1980s – 1990s.TINRO Transactions, 128:145–152. (In Russian)
Stevens, B.G. R.A. MacIntosh, G.A. Haaga and J.H. Bowerman, 1993.Report to the industry on the 1992 eastern Bering Sea crab survey.Alaska Fisheries Science Center. Processed Rep. 93–14. 53 p.
Stokke, O.S. (ed.) 2001. Governing High Seas Fisheries:The Interplayof Global and Regional Regimes. Oxford University Press.
Strickland, R.M. and T. Sibley, 1984. Projected Effects of CO2 InducedClimate Change on the Alaska Walleye Pollock (Theragra chalcogram-ma) Fishery in the Eastern Bering Sea and the Gulf of Alaska.University of Washington, FRI-UW-8411. 112p.
Sugimoto,T. and K.Tadokoro, 1997. Interannual-interdecadal varia-tions in zooplankton biomass, chlorophyll concentration and physi-cal environment in the subarctic Pacific and Bering Sea. FisheriesOceanography, 6(2):74–93.
Sundby, S., 2000. Recruitment of Atlantic cod stocks in relation to tem-perature and advection of copepod populations. Sarsia, 85:277–289.
Sutcliffe,W.H., R.H. Loucks, K.F. Drinkwater and A.R. Coote, 1983.Nutrient flux onto the Labrador Shelf from Hudson Strait and itsbiological consequences. Canadian Journal of Fisheries and AquaticSciences, 40:1692–1701.
Taggart, C.T., J. Anderson, C. Bishop, E. Colbourne, J. Hutchings,G. Lilly, J. Morgan, E. Murphy, R. Myers, G. Rose and P. Shelton,1994. Overview of cod stocks, biology, and environment in theNorthwest Atlantic region of Newfoundland, with emphasis onnorthern cod. ICES Marine Science Symposia, 198:140–157.
Tåning, Å.V., 1934. Survey of long distance migrations of cod in theNorth Western Atlantic according to marking experiments. ICESRapports et Procès-Verbaux des Réunions, 89(3):5–11.
Tåning, Å.V., 1937. Some features in the migration of cod. Journal duConseil International pour l’Exploration de la Mer, 12:1–35.
Tåning, Å.V., 1948. On changes in the marine fauna of the North-N-Western Atlantic Area, with special reference to Greenland. ICESRapports et Procès-Verbaux des Réunions, 25:26–29.
Taylor, D.M. and P.G. O’Keefe, 1999. Assessment of the 1998Newfoundland and Labrador Snow Crab Fishery. Department ofFisheries and Oceans, Canadian Stock Assessment Secretariat Res.Doc. 99/143.
Templeman,W., 1966. Marine resources of Newfoundland. FisheriesResearch Board of Canada Bulletin 154.
Templeman,W., 1968. Review of some aspects of capelin biology in theCanadian area of the northwest Atlantic. ICES Rapports et Procès-Verbaux des Réunions, 158:41–53.
Templeman,W., 1973. Distribution and abundance of the Greenlandhalibut, Rheinhardtius hipploglossoides (Walbaum) in the NorthwestAtlantic. International Commission Northwest Atlantic FisheriesResearch Bulletin, 10:82–98.
Thompson, G.G. and M. Dorn, 2001. Pacific cod. In: Stock Assessmentand Fishery Evaluation Report for the Groundfish Resources of theBering Sea/Aleutian Islands regions. Chapter 2.
Thor, J.Th., 1992. British trawlers and fishing grounds at Iceland1889–1916. Hi? íslenska bókmenntafélag, Reykjavik. 237p.(In Icelandic)
Thórdardóttir,Th., 1977. Primary production in North Icelandicwaters in relation to recent climatic changes. In: M.J. Dunbar (ed.).Polar Oceans. Proceedings of the Polar Oceans Conference held atMcGill University, Montreal, 1974, pp. 655–665. Arctic Institute ofNorth America, Canada.
Thórdardóttir,Th., 1984. Primary production north of Iceland in rela-tion to water masses in May–June 1970–1980. ICES CM 1984/L:20.
Toresen, R. and O.J. Østvedt, 2000. Variations in abundance ofNorwegian spring-spawning herring throughout the 20th centuryand the influence of climatic fluctuations. Fish and Fisheries,1:231–256.
Treble, M.A. and R. Bowering, 2002.The Greenland Halibut(Reinhardtius hippoglossoides) Fishery in NAFO Division 0A. NAFOSCR Doc. 02/46. Serial No. N4658. 9p.
Trenberth, K.E., 1990. Recent observed interdecadal climate changesin the Northern Hemisphere. Bulletin of the AmericanMeteorological Society, 71:988–993.
Tuponogov,V.N., 2001. Polar cod. In: Hydrometeorology andHydrochemistry of Seas, pp. 199–204.Vol. 10.The Bering Sea. Issue2. Hydrochemical Conditions and Oceanological Fundamentals ofFormation of Biological Productivity. Hydrometeoizdat. (In Russian)
Ustinova, E.I. and Yu.I. Sorokin, 1999. Some regularities of climatevariability of the far-eastern seas, pp. 50–51. Proc. of 11th allRussian conference on fish. Oceanogr. Moscow:VNIRO. In Russian
Van Loon, H. and D.J. Shea, 1999. A probable signal of the 11-yearsolar cycle in the troposphere of the northern hemisphere.Geophysical Research Letters, 26:2893–2896.
Velegjanin, A.N., 1999. International legal aspects of the RussianFar East seafood trade with the North Pacific Rim Countries.In:V.M. Kaczynski and D.L. Fluharty (eds.). Impacts of Populationsand Markets on the Sustainability of Ocean and Coastal Resources:Perspectives of Developing and Transition Economies of the NorthPacific, pp 189–198. Collection of papers from the InternationalConference June 3–4, 1999. School of Marine Affairs, Universityof Washington.
780 Arctic Climate Impact Assessment
Vestergaard, N. and R. Arnason, 2004. On the relationship betweenGreenland’s Gross Domestic Product and her fish exports: empiricalestimates.Working paper W04:07. Institute of Economic Studies,University of Iceland.
Vilhjálmsson, H., 1994.The Icelandic capelin stock. Capelin Mallotus villosus (Muller) in the Iceland, Greenland, Jan Mayen area. RitFiskideildar, 13(1), 281p.
Vilhjálmsson, H., 1997. Climatic variations and some examples of theireffects on the marine ecology of Icelandic and Greenland waters, inparticular during the present century. Rit Fiskideildar, 15(1):7–29.
Vilhjálmsson, H., 2002. Capelin (Mallotus villosus) in the Iceland–EastGreenland–Jan Mayen ecosystem. ICES Marine Science Symposia,216:870–883.
Vilhjálmsson, H. and J.E. Carscadden, 2002. Assessment surveys forcapelin in the Iceland-East Greenland-Jan Mayen area, 1987–2001.ICES Marine Science Symposia, 216:1096–1104.
Vilhjálmsson, H. and E. Fri?geirsson, 1976. A review of 0-group surveysin the Iceland-East Greenland area in the years 1970–1975. ICESCooperative Research Report, 54:1–34.
Vilhjálmsson, H. and J.V. Magnússon, 1984. Report on the 0-group fishsurvey in Icelandic and East-Greenland waters, August 1984. ICESC.M. 1984/H:66, 26p.
Vinnikov, A.V., 1996. Pacific cod (Gadus macrocephalus) of the westernBering Sea. In: O.A. Mathisen and K.O. Coyle (eds.). Ecology of theBering Sea: A review of Russian literature, pp. 183–202. Alaska SeaGrant College Program Report No. 96–01.
Vinogradov, M.E. and E.A. Shushkina, 1987. Functioning of pelagiccommunities in the oceanic epipelagic layer. Nauka Publishers, 240p.(In Russian)
Welch, D.W., A.I. Chigirinsky and Y. Ishida, 1995. Upper thermal limitson the oceanic distribution of Pacific salmon in the spring. CanadianJournal of Fisheries and Aquatic Sciences, 52:489–503.
Wespestad,V.G., 1987. Population dynamics of Pacific herring (Clupeapallasii), capelin (Mallotus villosus) and other coastal pelagic fishes inthe eastern Bering Sea. In: Forage fishes of the Southeastern BeringSea. US Dep. Int., Min. Mgt. Serv., Alaska OCS Region, MMS87-0017:55–60.
Wespestad,V.G., 1993.The status of the Bering Sea pollock and theeffect of ‘donut hole’ fishery. Fisheries, 18(3):18–24.
Wespestad,V.G., L.W. Fritz,W. Ingraham and B.A. Megrey, 2000. Onrelationships between cannibalism, climate variability, physical trans-port, and recruitment success of Bering Sea walleye pollock (Theragrachalcogramma). ICES Journal of Marine Science, 57(2):272–278.
Wilderbuer,T.K., 1997.Yellowfin sole. In: Stock Assessment and FisheryEvaluation Report for the Groundfish Resources of the Bering Seaand Aleutian Islands Regions as projected for 1998, pp. 160–187.
Wilderbuer,T.K. and D.G. Nichol, 2001.Yellowfin sole. In: StockAssessment and Fishery Evaluation Report for the GroundfishResources of the Bering Sea/Aleutian Islands. Chapter 3. NorthPacific Fisheries Management Council.
Wilderbuer,T.K., A.B. Hollowed,W.J. Ingraham, P.D. Spencer, M.W.Conners, N.A. Bond and G.E.Walters, 2002. Flatfish recruitmentresponse to decadal climate variability and ocean conditions in theeastern Bering Sea. Progress in Oceanography, 55(1–2):235–248.
Williams, E.H. and T.J. Quinn II, 2000. Pacific herring, Clupea pallasi,recruitment in the Bering Sea and north-east Pacific Ocean, II: rela-tionships to environmental variables and implications for forecasting.Fisheries Oceanography, 9(4):300–315.
Winters, G.H. and J.P.Wheeler, 1987. Recruitment dynamics of spring-spawning herring in the Northwest Atlantic. Canadian Journal ofFisheries and Aquatic Sciences, 44:882–900.
Witherell, D., C. Pautzke and D. Fluharty, 2000. An ecosystem-basedapproach for Alaska groundfish management. ICES Journal of MarineScience, 57:771–777.
Wolotira Jr., R.J.,T.M. Sample, S.F. Noel and C.R. Iten, 1993.Geographic and bathymetric distributions for many commerciallyimportant fishes and shellfishes off the west coast of North Americabased on research survey and commercial catch data, 1912–1984.NOAA Tech. Memorandum NMFS-AFSC-6, 184p.
Wooster,W.S. and A.B. Hollowed, 1995. Decadal-scale variations in theeastern subarctic Pacific: I.Winter ocean conditions. In: R.J. Beamish(ed.). Climate Change and Northern Fish Populations, pp. 81–85.Canadian Special Publication in Fisheries and Aquatic Science 121.
Worm, B. and R.A. Myers, 2003. Meta-analysis of cod-shrimp interac-tions reveals top-down control in oceanic food webs. Ecology,84:162–173.
Wyllie-Echeverria,T., 1995. Sea-ice conditions and the distribution ofwalleye pollock (Theragra chalcogramma) on the Bering and ChukchiShelf. In: R.J. Beamish (ed.). Climate Change and Northern FishPopulations, pp. 131–136. Canadian Special Publication in Fisheriesand Aquatic Science 121.
Wyllie-Echeverria,T. and K. Ohtani, 1999. Seasonal sea ice variabilityand the Bering Sea ecosystem. In:T.R. Loughlin and K. Ohtani(eds.). Dynamics of the Bering Sea. Alaska Sea Grant CollegeProgram. AK-SG-99-03. pp. 435–451.
Zaika,V.E., 1983. Comparative hydrobiont productivity. NaukovaDumka Publishers, 203p. (In Russian)
Zebdi, A. and J.S. Collie, 1995. Effect of climate on herring (Clupeapallasi) population dynamics in the Northeast Pacific Ocean.In: R.J. Beamish (ed.). Climate Change and Northern FishPopulations. Canadian Special Publication of Fisheries and AquaticSciences 121: 277–290.
Zheng, J. and G.H. Kruse, 2000. Recruitment patterns of Alaska crabsin relation to decadal shifts in climate and physical oceanography.ICES Journal of Marine Science, 57:438–451.
Zilanov,V.K., 1999. Marine living resources of the Russian Far East inthe time of change: impacts of population, markets, reforms, and cli-mate. In:V.M. Kaczynski and D.L. Fluharty (eds.). Impacts ofPopulations and Markets on the Sustainability of Ocean and CoastalResources: Perspectives of Developing and Transition Economies ofthe North Pacific, pp. 97–111. Collection of Papers from theInternational Conference June 3–4, 1999. School of Marine Affairs.University of Washington. 277p.
Zilanov,V.K., L.I. Shepel, A.N.Vylegjanin, M.A. Stepanenko,T.I.Spivakova and N.V.Yanovskaya, 1989. International problems of con-servation and exploitation of Bering sea living resources.WorldFisheries, 1:1–102. (In Russian)