Fisheries and the Canadian Food Strategy. Pêches et la Stratégie alimentaire canadienne. Dr. Jean-Charles Le Vallée Senior Research Associate, Centre for Food in Canada 2014 FCC Conference – 8 Oct. 2014. Introduction. Human consumption, health, safety, traceability, and demand. - PowerPoint PPT Presentation
conferenceboard.ca Fisheries and the Canadian Food Strategy. Pêches et la Stratégie alimentaire canadienne. Dr. Jean-Charles Le Vallée Senior Research Associate, Centre for Food in Canada 2014 FCC Conference – 8 Oct. 2014
Transcript
conferenceboard.ca
Fisheries and the Canadian Food Strategy.
Pêcheset la Stratégie alimentaire canadienne.
Dr. Jean-Charles Le ValléeSenior Research Associate, Centre for Food in Canada2014 FCC Conference – 8 Oct. 2014
2
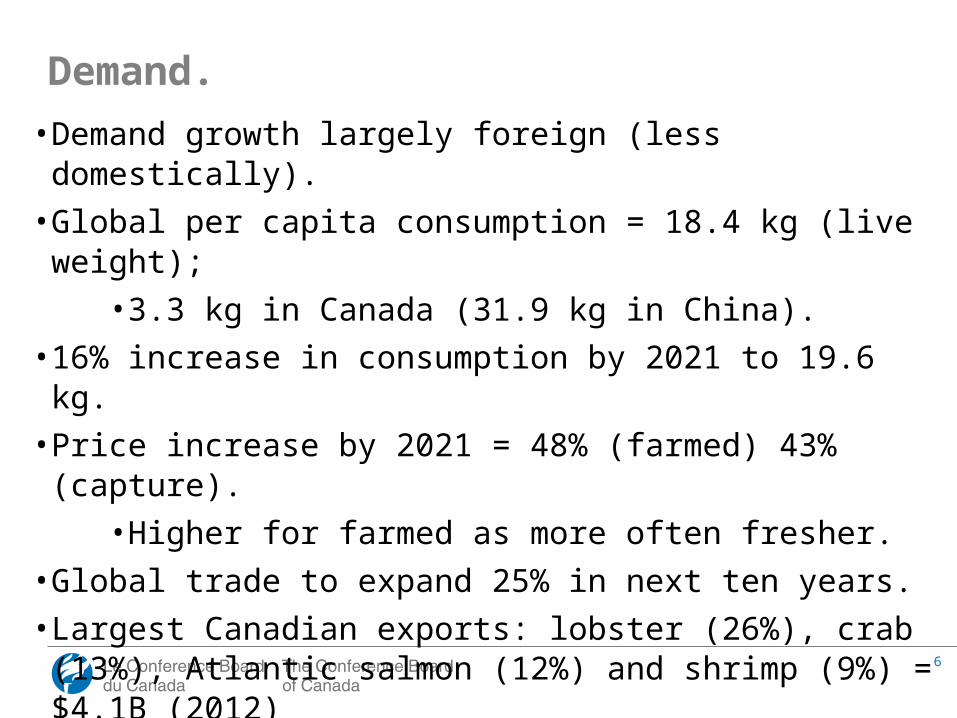
• Human consumption, health, safety, traceability, and demand.
• Challenges and opportunities in supply.
• Environmental sustainability.
• Future opportunities to improve sector prosperity and sustainability.
Introduction.
3
• Focus on commercial fisheries (and aquaculture).
• Includes capture (and farmed) freshwater and marine fisheries - inshore to offshore.
• Recreational and aboriginal fisheries not examined.
• Fisher and harvester livelihoods, fishing gear and ocean stewardship beyond scope of research.
Scope.
4
• Fish/seafood = valuable source of nutrients, protein, omega-3, and part of a healthy diet.
• Health benefits = reduced risk of chronic disease, healthy growth/development and vitality.
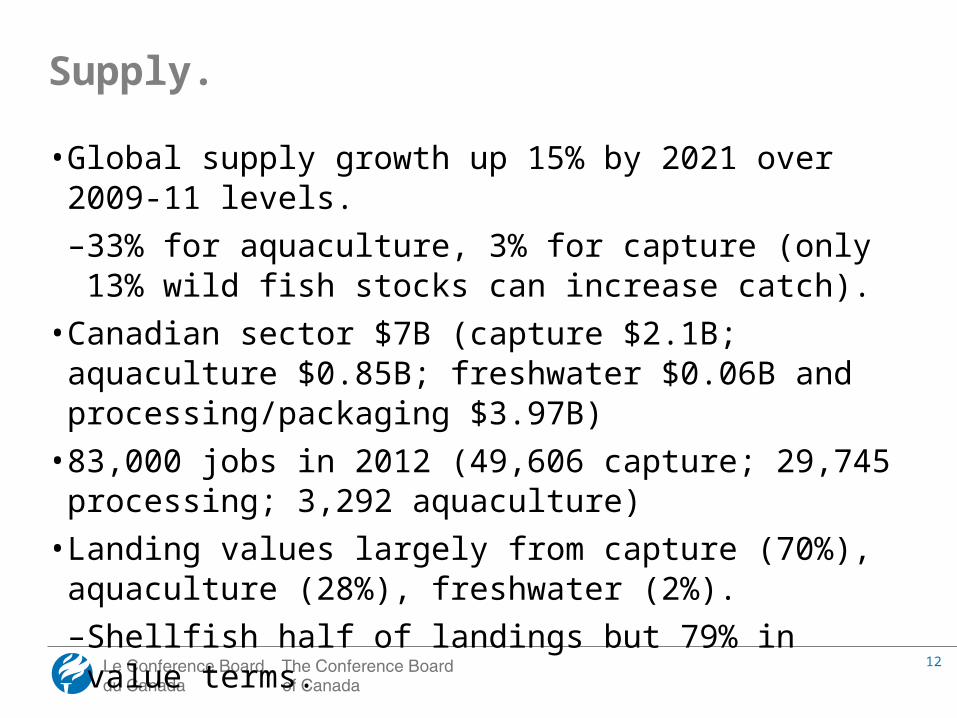
–Shellfish half of landings but 79% in value terms.
Supply.
13
14
• 15,984 vessels (2008); 91% inshore ˂ 45 feet.
• Mid-offshore 10% but 42% of landing values.
• Overcapacity remains; further consolidation expected.
• Gains include efficiencies, profitability, ROI.
• Small/artisan fishers can look to increase value and prosperity through direct marketing, CSFs, regional hubs.
• More labour-intensive models result in employment, social and environmental gains.
Shrinking Marine Fleet.
15
• Modernizing separation policy should improve coordination, capacity utilization, market opportunities and higher value products.
• Requires shared model allowing restrictions to be removed, tendering current licenses for sale and investment, though harvesters would retain control of the licenses.
• Would provide needed equity and reduce debt financing.
• Shares risks, information.
• Support community prosperity.
• Possible through pan-sector stakeholder approach and involvement.
Separation Policy Modernization.
16
• Commercial fishery largely turbot (67%), shrimp (31%), char, freshwater (17% in Great Lake) (Unfished quota, fisheries undersubscribed.)
• Nunavut char brand a hit in US.
• Country food.
• Greenland commercial fishery experience positive but difficult to emulate.
Arctic Fisheries.
17
• Top of North American markets.
• Freshwater Fish Marketing Corporation (single processing and marketing desk).
• Mostly exported (84%) - 2/3 to US; 15% Canada.
• Highest value fish: walleye(pickerel) and lake whitefish.
• Bushing in inland fisheries. 1,400 tonnes in Lake Winnipeg (whitefish $1.32/kg thrown out in favour of pickerel $3.96/kg).
• Bycatch with quota can be retained and sold.
• Various monitoring tools and practices tested and underway.
• At-sea observer coverage desirable but difficult to achieve (cost support no longer provided by DFO).
• Bycatch diversion to food banks for tax credit in MB.
Bycatch.
27
• Pressure not only to produce and harvest more fish and seafood, but to do so through sustainable, well/responsibly-managed, safe, and traceable practices.
• For consumers, MSC, and SeaChoice/OceanWise guides.
• MSC, 50% salt water volume, 52% value certified or in full assessment (2011); 24 certifications to Canadian fisheries (2013), 509 products.
• Industry receptive; improvements in biodiversity, managerial openness/accountability (though some contested).
• Market governance tool in support of public governance.
• Global Trust, responsible fisheries/aquaculture management (Iceland/Alaska), ecolabelling.
Sustainability Certification.
28
• DFO management tools include input (quantity, intensity, gear type), output (seasons/dates, total allowable catch) and technical controls (closings, fish size/age).
• TACs divided into quotas.
• ‘Race to fish’ to reach TAC can lead to poor performance, depressed prices, overcapacity and overcapitalization: thus, barriers to fish.
Market-based rights-based approach to manage fish stocks. ITQs transferable property right bought, sold, leased or traded.
• ITQ system expansion welcome, modernization necessary and possible.
• Areas for improvement for ITQ fishery management: absentee ownership; high quota lease fees; lack of legal protection when quota reallocated; little improvement in monitoring; greater open quota exchange; ownership caps; in-season adjustments; longer tenures or licenses.
ITQs. Continued.
30
Fisheries in theCanadian Food Strategy.
31
Centre for Food in Canada.To raise public awareness of the nature and importance of the food sector to Canada’s economy and society.
Conscientiser et sensibiliser le public de la nature et de l’importance du secteur alimentaire dans la société et l’économie canadienne.
To create a shared vision for the future of food in Canada articulated in a framework for a Canadian Food Strategy to meet our country’s need for a coordinated long-term strategy for change.
Créer une vision partagée sur l’avenir alimentaire au pays exprimée par une Stratégie alimentaire canadienne qui comblera un besoin pour une stratégie coordonnée de changement à long-terme.
32
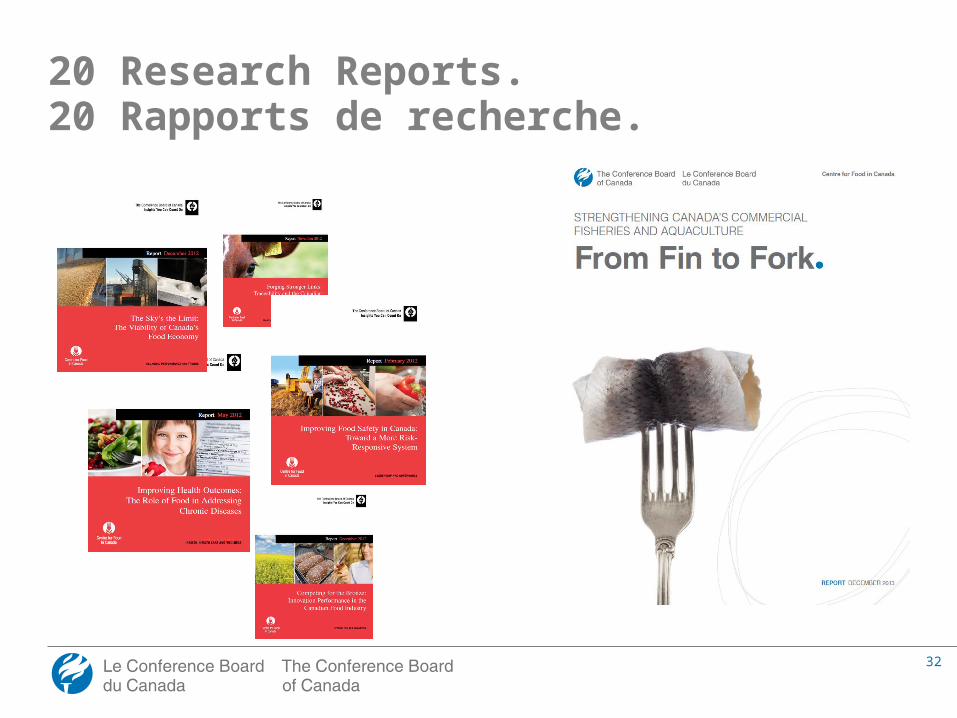
20 Research Reports. 20 Rapports de recherche.
33
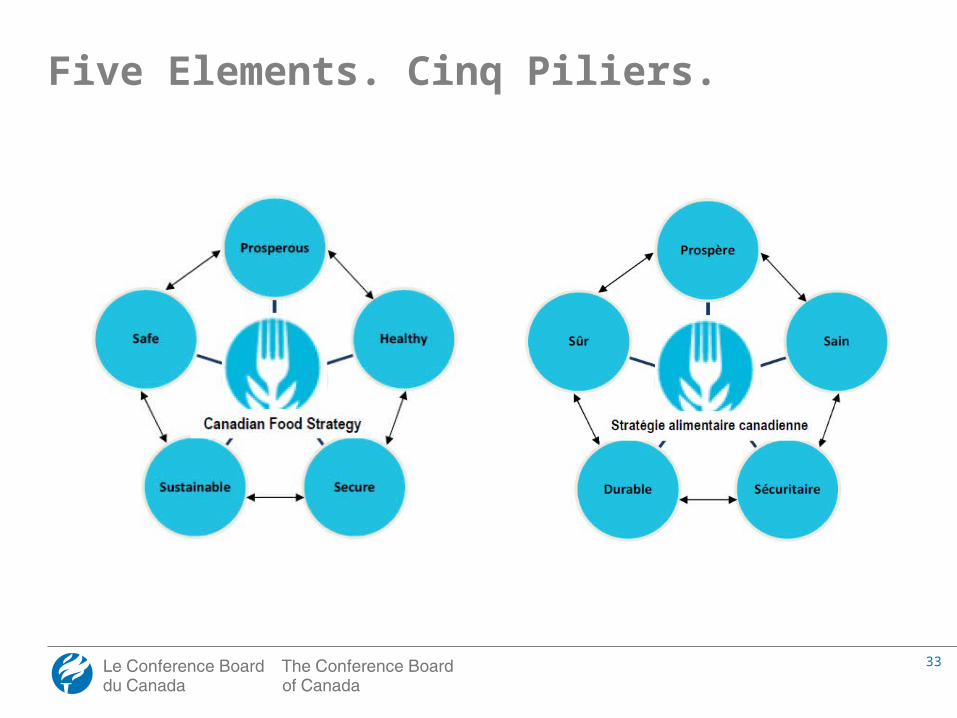
Five Elements. Cinq Piliers.
34
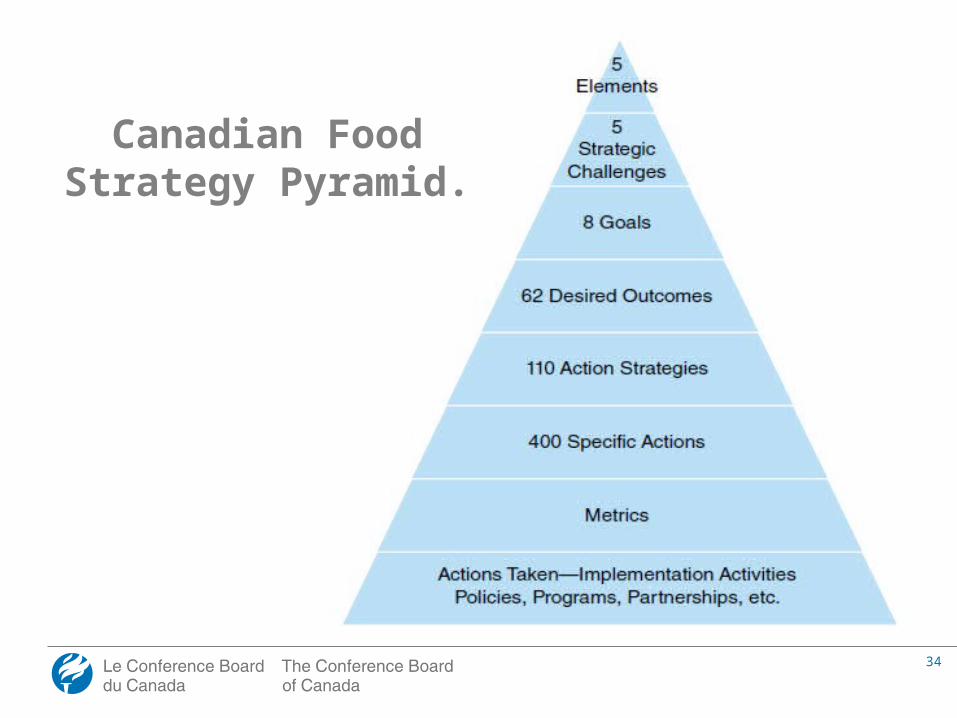
Canadian Food Strategy Pyramid.
35
Prospérité• 1: Le secteur de l’alimentation est viable pour ceux qui œuvrent dans
les domaines de la production, de la fabrication, de la transformation, de la distribution, de l’importation et de l’exportation, de la vente au détail et des services alimentaires.
• 2: Le secteur de l’alimentation est novateur, compétitif et en pleine croissance.
• 3: Des lois et des règlements modernes défendent les intérêts de l’industrie de l’alimentation et des consommateurs.
Santé• 4: Le régime alimentaire des Canadiens est plus sain et plus équilibré.• 5: Les Canadiens souffrent peu de maladies chroniques liées à
l’alimentation, comme l’obésité, le diabète, les maladies cardiovasculaires et le cancer.
Salubrité• 6: Le Canada est le chef de file mondial de la salubrité des aliments.
Sécurité• 7: Tous les Canadiens ont un accès physique et économique à des
aliments salubres, nourrissants et abordables qui répondent à leurs besoins nutritionnels.
Durabilité• 8: Le secteur de l’alimentation est un excellent défenseur de
l’environnement qui accroît la durabilité de la production alimentaire.
Goals. Objectifs.
36
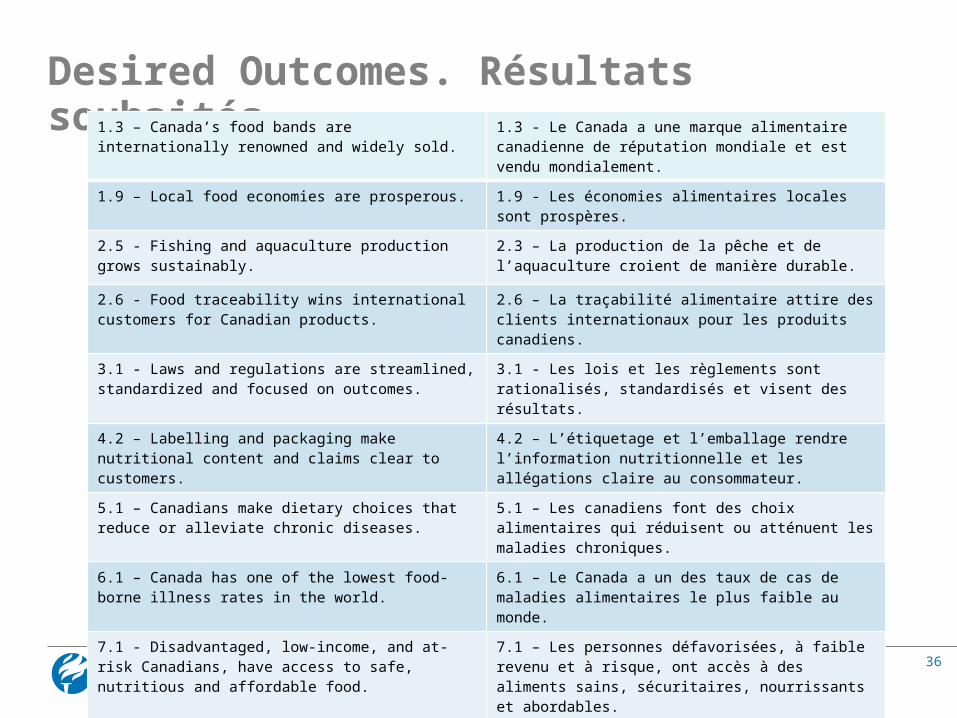
Desired Outcomes. Résultats souhaités. 1.3 – Canada’s food bands are internationally renowned and widely sold.
1.3 - Le Canada a une marque alimentaire canadienne de réputation mondiale et est vendu mondialement.
1.9 – Local food economies are prosperous. 1.9 - Les économies alimentaires locales sont prospères.
2.5 - Fishing and aquaculture production grows sustainably.
2.3 – La production de la pêche et de l’aquaculture croient de manière durable.
2.6 - Food traceability wins international customers for Canadian products.
2.6 – La traçabilité alimentaire attire des clients internationaux pour les produits canadiens.
3.1 - Laws and regulations are streamlined, standardized and focused on outcomes.
3.1 - Les lois et les règlements sont rationalisés, standardisés et visent des résultats.
4.2 – Labelling and packaging make nutritional content and claims clear to customers.
4.2 – L’étiquetage et l’emballage rendre l’information nutritionnelle et les allégations claire au consommateur.
5.1 – Canadians make dietary choices that reduce or alleviate chronic diseases.
5.1 – Les canadiens font des choix alimentaires qui réduisent ou atténuent les maladies chroniques.
6.1 – Canada has one of the lowest food-borne illness rates in the world.
6.1 – Le Canada a un des taux de cas de maladies alimentaires le plus faible au monde.
7.1 - Disadvantaged, low-income, and at-risk Canadians, have access to safe, nutritious and affordable food.
7.1 – Les personnes défavorisées, à faible revenu et à risque, ont accès à des aliments sains, sécuritaires, nourrissants et abordables.
8.8 - Fisheries and aquaculture’s environmental sustainability performance improves.
8.8 – La performance environnementale du secteur des pêches et de l’aquaculture s’améliore.