49
Gascoyne demersal scalefish resource harvest strategy 2017 – 2021 Version 1.0 Fisheries Management Paper No. 284 September 2017

Gascoyne demersal scalefish resource harvest strategy
2017 – 2021 Version 1.0
Fisheries Management Paper No. 284
September 2017

ii Fisheries Management Paper No. 284
Important disclaimer The Chief Executive Officer of the Department of Primary Industries and Regional Development and the State of Western Australia accept no liability whatsoever by reason of negligence or otherwise arising from the use or release of this information or any part of it. Fisheries Division, Department of Primary Industries and Regional Development Gordon Stephenson House 140 William Street PERTH WA 6000 Telephone: (08) 6551 4444 Website: dpird.wa.gov.au ABN: 18 951 343 745 ISSN: 0819-4327 Copyright © Department of Primary Industries and Regional Development, 2017.
3936/17

Fisheries Management Paper No. 284 iii
TABLE OF CONTENTS LIST OF ACRONYMS ............................................................................................................. V
1 INTRODUCTION ................................................................................................................... 1
1.1 Review Process .................................................................................................................. 1
2 SCOPE ..................................................................................................................................... 1
2.1 Environmental Context ...................................................................................................... 5
2.2 Indicator Species ................................................................................................................ 6
2.2.1 Pink Snapper ................................................................................................................ 6
2.2.2 Goldband Snapper ........................................................................................................ 6
2.3 Other Retained (non-indicator) Species in the Resource ................................................... 6
2.4 Fishing Activities ............................................................................................................... 7
2.4.1 Governance................................................................................................................... 7
2.4.2 Commercial Fishing ..................................................................................................... 7
2.4.3 Recreational Fishing ..................................................................................................... 8
2.4.4 Customary Fishing ....................................................................................................... 8
2.5 Catch-Share Allocations .................................................................................................... 9
3 HARVEST STRATEGY ......................................................................................................... 9
3.1 Long-term Objectives ........................................................................................................ 9
3.1.1 Ecological Sustainability .............................................................................................. 9
3.1.2 Economic and Social Benefits.................................................................................... 10
3.2 Operational Objectives ..................................................................................................... 10
3.3 Overview of Management Approach ............................................................................... 10
3.4 Overview of Harvest Strategy Procedures ....................................................................... 11
3.5 Resource Status - Performance Indicators, Reference Levels & Control Rules .............. 13
3.5.1 Identifying Performance Indicators & Reference Levels ........................................... 14
3.5.2 Application of Harvest Control Rules ........................................................................ 16
3.6 Annual Fishery Performance & Annual Tolerance Levels .............................................. 29
3.6.1 Annual Catch Tolerance Levels ................................................................................. 29
3.6.2 Annual Catch Rate Tolerance .................................................................................... 30
3.6.3 Unacceptable Performance Review Timelines .......................................................... 30
3.7 Monitoring and Assessment Procedures .......................................................................... 31
3.7.1 Information and Monitoring ....................................................................................... 31

iv Fisheries Management Paper No. 284
3.7.2 Assessment Procedures .............................................................................................. 32
3.7.3 Reports and Publications ............................................................................................ 34
4 MANAGEMENT MEASURES AND IMPLEMENTATION .............................................. 34
4.1 Implementing Changes to the Management Arrangements ............................................. 36
4.1.1 Consultation ............................................................................................................... 36
4.2 Compliance ...................................................................................................................... 38
4.2.1 Operational Compliance Plans ................................................................................... 38
5 REFERENCES ...................................................................................................................... 40

Fisheries Management Paper No. 284 v
LIST OF ACRONYMS AFMA Australian Fisheries Management Authority
ALC Automatic Location Communicator
ARMA Aquatic Resources Management Act 2016
DPIRD Department of Primary Industries and Regional Development
CAES Catch and Effort Statistics
CDR Catch and Disposal Record
EBFM Ecosystem Based Fisheries Management
EPBC Act Environment Protection and Biodiversity Conservation Act 1999
ERA Ecological Risk Assessment
ESD Ecologically Sustainable Development
ETP Endangered, Threatened and Protected (species)
FRMA Fish Resources Management Act 1994 FRMR Fish Resources Management Regulations 1995 GDSMF Gascoyne Demersal Scalefish Managed Fishery
GDSR Gascoyne Demersal Scalefish Resource
GPS Global Positioning System
GVP Gross Value of Production
HCR Harvest Control Rule
IFM Integrated Fisheries Management
ITQ Individual Transferable Quota
MSC Marine Stewardship Council
MSY Maximum Sustainable Yield
OCP Operational Compliance Plan
RFBL Recreational Fishing from Boat Licence
SPR Spawning Potential Ratio
TACC Total Allowable Commercial Catch
TBD To Be Determined
TL Total Length
VMS Vessel Monitoring System
WA Western Australia
WAFIC Western Australian Fishing Industry Council

vi Fisheries Management Paper No. 284

Fisheries Management Paper No. 284 1
1 INTRODUCTION
Harvest strategies for aquatic resources managed by the Western Australian Department of Primary Industries and Regional Development (DPIRD) Fisheries Division (Fisheries) are formal documents that are prepared based on a formal policy (Department of Fisheries 2015a) to support the decision-making processes and ensure these processes are consistent with the principles of Ecologically Sustainable Development (ESD; Fletcher 2002) and Ecosystem Based Fisheries Management (EBFM; Fletcher et al. 2010). The objectives of ESD are reflected in the objects of the Fish Resources Management Act 1994 (FRMA), Section 3, and the Aquatic Resources Management Act 2016 (ARMA), Clause 9, which will replace the FRMA once enacted.
The publication of harvest strategies is intended to make the decision-making considerations and processes for the management of specified aquatic resources publicly transparent and provide a basis for informed dialogue on management actions with resource users and other stakeholders (Department of Fisheries 2015a).
These strategies provide guidance for decision-makers, but do not derogate from or limit the exercise of discretion required for independent decision-making under the FRMA by either the Minister for Fisheries, the Director General of the DPIRD (as Chief Executive Officer) or other delegated decision-makers in order to meet the objects of the FRMA.
Harvest strategies make explicit the objectives, performance indicators, reference levels, and harvest control rules for each defined ecological asset taken into consideration by Fisheries when preparing advice for the Minister for Fisheries (Department of Fisheries 2015a). They also indicate the scope of management actions required in relation to the status of each resource in order to meet the specific long- and short-term management objectives and the broader goals of ESD and EBFM. Finally, they specifically outline the expected performance of the fisheries that access each resource.
1.1 Review Process
The Western Australian harvest strategy policy (Department of Fisheries 2015a) recognises that fisheries change over time and that a review period should be built into each harvest strategy to ensure that it remains relevant. This harvest strategy will remain in place for a period of five (5) years, after which time it will be fully reviewed; however, given that this is the first harvest strategy for this resource, this document may be subject to review and amended as appropriate within this five year period.
2 SCOPE
This harvest strategy relates to the Gascoyne Demersal Scalefish Resource (GDSR) of Western Australia and all fishing activities that impact this resource. The overall resource comprises around 60 demersal scalefish species that inhabit the inshore and offshore waters of the Gascoyne Coast Bioregion (Figure 1).

2 Fisheries Management Paper No. 284
Demersal scalefish in open marine waters are primarily harvested by the commercial sector within the Gascoyne Demersal Scalefish Managed Fishery (GDSMF; Figure 2), and the recreational and charter fishing sectors within the Gascoyne Coast Bioregion. Areas fished by the commercial, recreational (randomly selected RFBL holders during 2011-12 and 2013-14 state-wide recreational surveys), and charter sectors within the waters of the GDSMF are illustrated in Figure 3. Commercial vessels in the GDSMF fish with mechanised handlines and mainly target two demersal species; pink snapper (Chrysophrys auratus) and goldband snapper (Pristipomoides multidens).
In addition, three state-managed commercial trawl fisheries; the Shark Bay Prawn Managed Fishery, the Shark Bay Scallop Managed Fishery and the Exmouth Gulf Prawn Managed Fishery, and a small number of operators in the Pilbara Line Fishery, also retain small quantities of demersal scalefish in the Gascoyne Coast Bioregion. Commercial vessels in the Commonwealth-managed Western Deepwater Trawl Fishery, which operate outside of the 200 m isobath, may also retain demersal scalefish but primarily target deep-water crustaceans. All catches from these fisheries are accounted for in other harvest strategies (Australian Fisheries Management Authority [AFMA] 2011; Department of Fisheries 2014a; Department of Fisheries 2014b; Department of Fisheries 2016c).
Monitoring and assessment of the demersal scalefish resource in the Gascoyne Coast Bioregion is based on identification and sustainability evaluation of indicator species (Department of Fisheries 2011). Indicator species are determined using a risk-based approach that calculates the ‘sustainability risk’ of the stocks (based on the inherent vulnerability and the current risk to the wild stock) and the current or likely future ‘management risk’ of the species or stock to the community (measured as a combination of the current management information requirements, and their economic and social values).
The status of these fished stocks is subsequently used as a robust indicator of the sustainability status and risks within the suite of inshore demersal scalefish exploited in that region. In accordance with this approach, the focus of this harvest strategy is on the target stocks of the two predominate indicator species for the Gascoyne Coast Bioregion — pink snapper and goldband snapper. Periodic assessments of selected non-indicator species are also undertaken to validate the indicator species approach and ensure that the status of other retained species remains at acceptable levels.
This harvest strategy has been developed in-line with Fisheries’ over-arching Harvest Strategy Policy for Aquatic Resources (Department of Fisheries 2015a), which is consistent with relevant national policies and strategies (ESD Steering Committee 1992), guidelines (e.g. Sloan et al. 2014) and international best practice (Fletcher et al. 2016). It also sets out and summarises matters relevant to independent third-party certification assessment of the GDSMF against the Marine Stewardship Council (MSC) standard for sustainable fishing and should be read in conjunction with other documentation relevant to this assessment.
The use of indicator species as the basis for developing harvest strategies of an entire resource has facilitated the successful management of multi-species fisheries in WA including the West Coast Demersal Scalefish Resource for over a decade (e.g. Wise et al., 2007). The precautionary element of this approach means that should an indicator species

Fisheries Management Paper No. 284 3
breach a threshold or limit reference level, the entire suite of species covered by that indicator species will be deemed to have breached this level. Therefore, to enable recovery of an overfished species an overall reduction in fishing intensity across the entire resource is often required.
Figure 1. Gascoyne Coast Bioregion in Western Australia.

4 Fisheries Management Paper No. 284
Figure 2. Boundaries and management areas of the GDSMF in Western Australia.
Figure 3. Areas fished by the GDSMF and charter sector (2011-2015), and randomly selected
RFBL holders during the 2011-12 and 2013-14 state-wide recreational surveys.
Fisheries Management Paper No. 284 5
In addition to considering fishing impacts from all fishing activities on the retained species, this harvest strategy also covers impacts on bycatch1, endangered, threatened and protected (ETP) species, habitats and other ecological components to ensure any risks to these elements are managed effectively. As the MSC assessment of the GDSMF is a key driver in formalising this initial version of the harvest strategy, the waters of Shark Bay’s inner gulfs are not currently in the scope of this harvest strategy. Likewise, the impacts on the ecological components other than the retained species from other commercial fisheries, namely the Shark Bay Prawn and Scallop Fisheries, the Exmouth Gulf Prawn Fishery, the Pilbara Line Fishery and the Western Deepwater Trawl Fishery, are not within the scope of this document. Future versions may be expanded to include these impacts where relevant.
This document has been developed by an independently chaired working group with representation from the commercial and recreational fishing sectors and the Department of Fisheries. The development of this document involved the release of a draft version for a four week public comment period. The draft has been refined as a result of comments received during the public comment period and to ensure consistency with MSC standards. This final document has been approved by DPIRD and the Minister for Fisheries.
2.1 Environmental Context
The GDSR includes species that inhabit inshore (shelf) waters of 20-250 m depth and offshore >250 m depth in the Gascoyne Coast Bioregion of Western Australia. The marine environment of the Gascoyne Coast Bioregion represents a transition between the tropical waters of the North West Shelf and the temperate waters of the west coast. The coastline is characterised by fringing coral reefs in the north, changing to high cliffs in the south. The northern part of the bioregion is seasonally influenced by tropical cyclones during summer. Although these cyclones occur very infrequently in the southern end of the bioregion, the region is affected at times by river outflows from inland cyclone-based summer rainfall. The limited local rainfall comes mostly from the northern edge of winter storm fronts.
The waters off the Gascoyne Coast Bioregion are also strongly influenced by the southward-flowing Leeuwin Current, generated by flow from the Pacific through the Indonesian archipelago. The low productivity associated with the Leeuwin Current restricts total finfish production off the Western Australian coast to a globally modest level (Molony et al. 2011).
There are two areas of internationally recognised conservation value located in the Gascoyne, the Shark Bay World Heritage Property and the Ningaloo Coast World Heritage Area.
1 Bycatch is described as the part of the catch which is returned to the sea (usually referred to as non-retained or discarded) either because it has no commercial value or because legislative requirements preclude it being retained.

6 Fisheries Management Paper No. 284
2.2 Indicator Species
The two indicator species selected for assessing the inshore demersal scalefish suite in the southern Gascoyne Coast Bioregion are pink snapper and goldband snapper. These two species represent approximately 80% of the total demersal scalefish catch taken in oceanic waters of the Gascoyne Coast Bioregion in 2014 (Jackson et al. 2015).
2.2.1 Pink Snapper
Pink snapper are distributed around southern Australia from northern Queensland to north-west Western Australia (Kailola et al. 1993) and around the north island of New Zealand (Parsons et al. 2014). Stock structure of this species within Australian waters is complex particularly in Western Australia where six biological stocks/management units are currently recognised (Jackson et al. 2012), four of these in the Gascoyne. The GDSMF targets the Gascoyne ‘oceanic’ pink snapper stock. Juveniles typically inhabit inshore waters while adults and sub-adults inhabit waters of the continental shelf out to depths of more than 300 m. Pink snapper are long-lived (maximum age around 30 years in the Gascoyne Coast Bioregion), mature around 3-5 years of age and, in the oceanic waters of the Gascoyne, form spawning aggregations on nearshore reefs during May to August.
2.2.2 Goldband Snapper
Goldband snapper are widely distributed throughout the Indo-Pacific from Samoa to the Red Sea and from southern Japan to Australia (Allen 1985). In Australia, goldband snapper stocks in the Kimberley and Northern Territory were found to be genetically distinct and otolith chemistry analysis indicated that adults remained sedentary on individual reefs (Lloyd et al. 1996; Newman et al. 2000; Ovenden et al. 2002). No studies of the genetic stock structure of goldband snapper have been undertaken in the Gascoyne Coast Bioregion. For the purposes of stock assessment, Marriott et al. (2012) assumed that goldband snapper within the Gascoyne Coast Bioregion constitute one genetic stock. Goldband snapper inhabit hard bottom mostly in depths of 80-150 m (Allen 1985; S.J. Newman, unpubl. data). Goldband snapper are long-lived (~30 years), mature around 4-5 years of age, and spawn predominantly in October to April in the Gascoyne.
2.3 Other Retained (non-indicator) Species in the Resource
For other retained species, annual risk (including vulnerability) assessments are undertaken to identify if there have been any substantial changes, particularly in the catches of these species, relative to historical levels. If an increase in risk is identified, a review is triggered to investigate the reasons for the variation. If the increase in risk is considered significant a higher level of monitoring and assessment of the species is necessary (e.g. collection of an age sample to allow for estimation of fishing mortality and/or some other proxy for biomass of the stock).

Fisheries Management Paper No. 284 7
2.4 Fishing Activities
2.4.1 Governance
The GDSR is targeted by the commercial, recreational (including charter) and customary fishing sectors. These fishing sectors are managed by Fisheries under the following legislation:
• Fish Resources Management Act 1994 (FRMA, will be replaced by the ARMA once enacted);
• Fish Resources Management Regulations 1995 (FRMR);
• FRMA Part 6 — Gascoyne Demersal Scalefish Managed Fishery Management Plan 2010; Shark Bay Prawn Limited Entry Fishing Notice 1993; the Shark Bay Scallop Limited Entry Fishing Notice 1994; and the Exmouth Gulf Prawn Management Plan 1989;
• FRMA Section 43 - Prohibition on Commercial Fishing for Demersal Scalefish (Pilbara Area) Order 1997;
• Gascoyne Demersal Scalefish Managed Fishery Vessel Monitoring System Approved Directions.
Fishers must also comply with the requirements of other legislation, including:
• The Commonwealth Environment Protection and Biodiversity Conservation Act 1999 (EPBC Act);
• Western Australian Marine Act 1982;
• Western Australian Wildlife Conservation Act 1950; and
• Western Australian Conservation and Land Management Act 1984.
2.4.2 Commercial Fishing
Commercial line fishing in oceanic waters of the southern Gascoyne Coast Bioregion is managed as the GDSMF. Demersal scalefish are caught using gunwhale-mounted hydraulic or electric powered reels (up to 10 per vessels) rigged with up to 15 to 30 snoods and circle hook(s) baited with mullet, sardines and squid.
This present-day multi-species fishery evolved from a line-fishery that targeted pink snapper in the waters off Shark Bay from the early 1900s (Moran and Jenke 1989; Moran et al. 2005). The pink snapper fishery developed in the 1950s, with rock lobster boats heading north during winter from Geraldton and Fremantle to fish alongside local (Denham-based) vessels. Trap fishing for pink snapper began around 1957 (Moran and Jenke 1989). Following years of conflict between the line-only and trap fishing sectors, trap fishing effort was progressively reduced between 1961 and 1987 when, due predominately to lower market prices for trap caught fish, the fishery returned to being a line-only fishery.

8 Fisheries Management Paper No. 284
Following the increase in catch and effort in the pink snapper fishery in the early 1980s, culminating in the peak 1,300 tonne catch in 1985, a limited entry fishery was proposed and a closed season in July was implemented in 1986. The Shark Bay Snapper Limited Entry Fishery came into full effect in 1987 which included different class access holders, peak season quotas and area and time closures (Department of Fisheries 1995). During the late 1980s to mid-1990s, fishing efficiency improved significantly with the adoption of new technologies including mechanised (hydraulic) hand lines, colour sounders and GPS (Marriott et al. 2012). To provide for simpler and more explicit management of pink snapper a formal Individual Transferable Quota (ITQ) system was introduced in 2001, followed by the introduction of Vessel Monitoring System (VMS) requirements in 2008.
As the pink snapper component of the fishery developed into a fully managed, year-round fishery, operators in the fishery, as well as ‘wetliners’ (without access to snapper), moved offshore to explore deeper waters (greater than 120 to 150 m) to target a wider range of demersal species (including goldband snapper). Consequently, the Shark Bay Snapper Managed Fishery expanded to become the Gascoyne Demersal Scalefish Managed Fishery in 2010.
Due to the highly selective nature of line fishing, bycatch and interactions with endangered, threatened and protected species are negligible. Any impacts on habitats through anchoring have previously been assessed as low risk (Department of Fisheries 2002; Department of Environment and Heritage 2004).
2.4.3 Recreational Fishing
Recreational (and charter) fishing for demersal scalefish in the Gascoyne Coast Bioregion is mostly line-based fishing from boats. Fishers operate out of Denham, Carnarvon, Gnaraloo Bay, Coral Bay, Tantabiddi and Exmouth and catch a similar range of demersal species as the commercial GDSMF.
Estimated recreational boat-fishing effort in the Gascoyne Coast Bioregion has ranged between approximately 212,000 hours fished in 2013/14 and 254,000 hours fished in 2011/12 (Ryan et al. 2015). An estimated 16-26 tonne of pink snapper (oceanic stock, i.e. excluding inner gulfs of Shark Bay) and 7-22 tonne of goldband snapper was retained by boat-based recreational fishers in the Gascoyne in 2013/14 (Ryan et al. 2015). The reported Gascoyne charter catches of (oceanic) pink snapper and goldband snapper in 2014 were 11 tonne and 8 tonne, respectively (Jackson et al. 2015).
2.4.4 Customary Fishing
Although there is no quantitative information available on the customary fishing of demersal scalefish in the Gascoyne Coast Bioregion, catches of pink snapper and other demersal scalefish from oceanic waters are likely to be negligible (in contrast to inner Shark Bay).

Fisheries Management Paper No. 284 9
2.5 Catch-Share Allocations
The GDSR in Western Australia is fished by commercial and recreational sectors without any explicit catch share allocation between sectors. A formal sectoral allocation process (designated as Integrated Fisheries Management, IFM, in Western Australia) to define and assign long-term sectoral shares of the permitted catch of the resource has not yet been undertaken (Department of Fisheries 2009).
3 HARVEST STRATEGY
This harvest strategy is structured to describe, hierarchically:
1) the high-level, long-term objectives of management (Section 3.1);
2) the short-term, operational objectives (Section 3.2); and
3) how these translate into the management approach used for this fishery (Section 3.3).
This is followed by a more detailed description of:
4) the harvest strategy procedures (Section 3.4);
5) the processes for managing stock status (Section 3.5);
6) fishery performance (Section 3.6); and
7) the specific monitoring and assessment procedures used to ascertain if objectives are
being met (Section 3.7).
3.1 Long-term Objectives
In addition to ensuring the biological sustainability of all captured aquatic resources (through the use of the indicator species approach), this harvest strategy includes broader ecological objectives for each ecosystem component relevant to the GDSMF currently undergoing MSC full assessment, as well as social and economic objectives for each fishing sector as a whole. It is important to note that the social and economic objectives are applied within the context of ESD.
3.1.1 Ecological Sustainability
1) To maintain spawning stock biomass of each retained species above BMSY to maintain high productivity and ensure the main factor affecting recruitment is the environment;
2) To ensure fishing impacts do not result in serious or irreversible harm2 to bycatch species populations;
2 Serious or irreversible harm relates to a change caused by the fishery that fundamentally alters the capacity of the component to maintain its function or to recover from the impact.

10 Fisheries Management Paper No. 284
3) To ensure fishing impacts do not result in serious or irreversible harm to endangered, threatened and protected (ETP) species populations;
4) To ensure the effects of fishing do not result in serious or irreversible harm to habitat structure and function; and
5) To ensure the effects of fishing do not result in serious or irreversible harm to ecosystem structure and function.
3.1.2 Economic and Social Benefits
1) To provide flexible opportunities to ensure commercial fishers can maintain or enhance their livelihood (economic and social), within the constraints of ecological sustainability and while having regard for the objectives of other fishing sectors;
2) To maintain and provide opportunity to maximise the flow of commercial fishing related economic benefit to the broader community within the constraints of ecological sustainability and while having regard for the objectives of other fishing sectors;
3) To maintain or improve cultural, recreational and lifestyle benefits for recreational fishing participants within the constraints of ecological sustainability and while having regard for the objectives of other fishing sectors;
4) To provide flexible opportunities to ensure charter operators can maintain or enhance their livelihood (economic and social), within the constraints of ecological sustainability and while having regard for the objectives of other fishing sectors;
5) To maintain and provide opportunity to maximise the flow of recreational (including charter) fishing tourism related economic benefit to the broader community within the constraints of ecological sustainability and while having regard for the objectives of other fishing sectors.
3.2 Operational Objectives
Longer-term management objectives are often operationalised by using shorter-term (e.g. annual or periodic) fishery-specific objectives for which one or more performance indicators (that can be measured) are identified. Identification of performance indicators enables performance to be assessed against pre-defined reference levels. Consequently, both the commercial and recreational fisheries that access the GDSR have operational objectives designed to maintain each resource or component above the threshold level (and, where relevant, close to the target range or level), or to rebuild the resource if it has fallen below the threshold or the limit levels.
3.3 Overview of Management Approach
The regulatory harvesting system for the GDSR is based on a constant catch approach (where catch is kept constant) when a stock is in recovery, and a constant exploitation

Fisheries Management Paper No. 284 11
approach (where the catch varies in proportion to variations in stock abundance) when a stock is above BMSY (i.e. the threshold).
In line with this harvesting approach, the main commercial fishery that targets this resource (GDSMF) is primarily managed using output controls via an ITQ system. There are two types of quota in the GDSMF; a separate pink snapper Total Allowable Commercial Catch (TACC), and a combined TACC for other non-pink snapper demersal scalefish species. Given the multi-species nature of the fishery, the two quota systems are linked to ensure fishers cannot target one quota group in isolation of the other.
A licence cannot be operated unless there is a minimum of 100 units of usual or current entitlement of each quota group on the licence, and a person must not operate in the fishery unless there is unexhausted pink snapper and combined species quota remaining on a licence. Furthermore, a ‘minimum debit rule’ of 50 kilograms of pink snapper quota per fishing day applies to reduce any incentive to discard pink snapper while targeting non-pink snapper species demersal scalefish, particularly in deeper offshore waters where barotrauma issues are more prevalent. Fishers must also comply with gear restrictions, spatial closures and applicable species size limits.
The recreational and charter fishery in the Gascoyne Coast Bioregion is primarily managed using output controls, including size limits for some species, and daily bag and possession limits. Recreational fishers operating from a boat are required to hold a current Recreational Fishing from Boat Licence (RFBL). Unlicensed fishers on boats can fish if at least one other person on board has an RFBL, provided the total catch of everyone on board stays within the bag limits of the licensed fisher(s). Charter operators are required to hold a Fishing Tour Operators Licence.
The decision-making process required to ensure the objectives are being met is framed around a series of linked procedures within the operational part of this harvest strategy.
3.4 Overview of Harvest Strategy Procedures
The procedures used within this harvest strategy involve two interrelated decision-making processes (see Figure 4 and Figure 5). The first is the formal, resource-level review process that, for the GDSR, will be undertaken every 3 - 5 years. This assesses the current status of the resource against defined (target, threshold and limit) reference levels to determine the risks associated with each operational objective and therefore whether the current Harvest Control Rules (HCRs) and their associated management arrangements are still appropriate. If the status falls outside the target reference level/range, HCRs are triggered and management adjustments/measures implemented to return the resource status back to the target range.

12 Fisheries Management Paper No. 284
Figure 4. Decision tree for regular review of resource status (Source: Department of Fisheries
2015a). ‘New arrangements' can include any activity associated with management process. * Not all operational objectives have target levels. ** The primary sustainability objective must be met.
The second process involves an annual, fishery-level review. This determines whether the current catch/effort by each of the relevant sectors is consistent with the levels defined (or expected) by the current HCRs and the status of the resource (i.e. the resource-level review process). If the annual catch, effort and/or catch rate for one or more species/sectors falls outside of an annual tolerance range and cannot be adequately explained the performance is termed ‘Unacceptable’. This result would generate a review that may lead to management adjustments, or the need for a re-assessment of the resource status and determine whether the current HCRs and their associated management arrangements are still appropriate. These are described in detail in the following sections.
Fisheries Management Paper No. 284 13
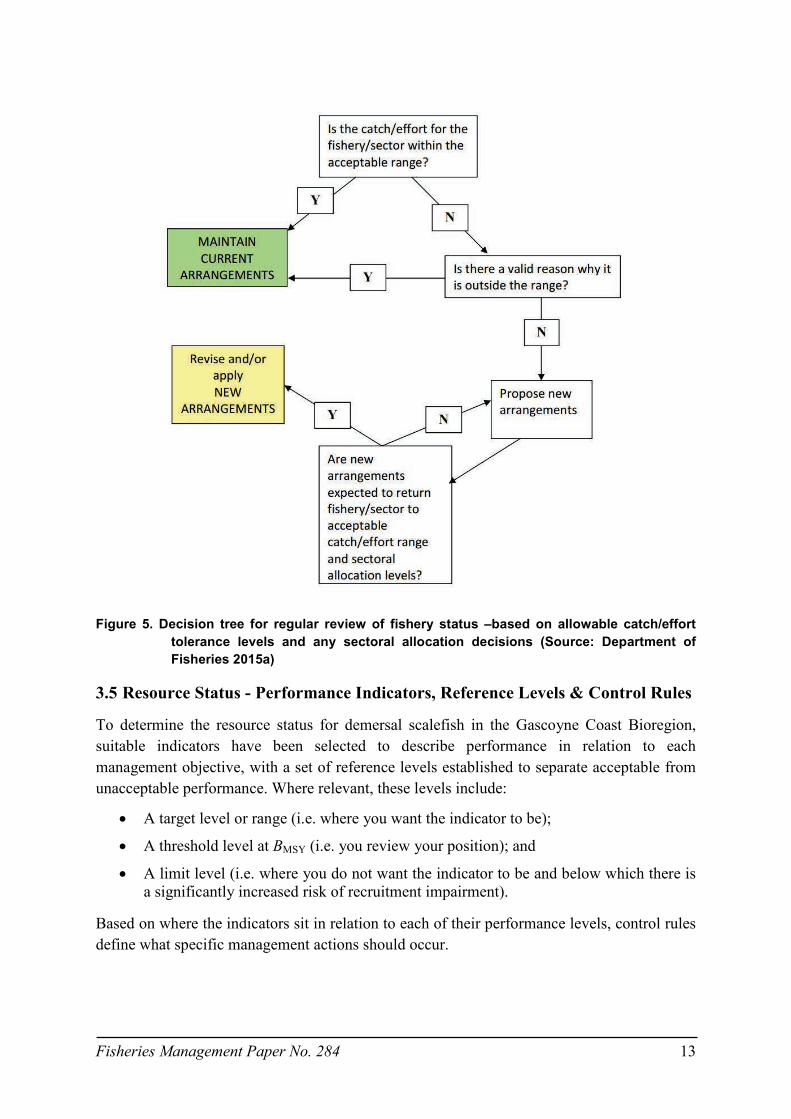
Figure 5. Decision tree for regular review of fishery status –based on allowable catch/effort
tolerance levels and any sectoral allocation decisions (Source: Department of Fisheries 2015a)
3.5 Resource Status - Performance Indicators, Reference Levels & Control Rules
To determine the resource status for demersal scalefish in the Gascoyne Coast Bioregion, suitable indicators have been selected to describe performance in relation to each management objective, with a set of reference levels established to separate acceptable from unacceptable performance. Where relevant, these levels include:
• A target level or range (i.e. where you want the indicator to be);
• A threshold level at BMSY (i.e. you review your position); and
• A limit level (i.e. where you do not want the indicator to be and below which there is a significantly increased risk of recruitment impairment).
Based on where the indicators sit in relation to each of their performance levels, control rules define what specific management actions should occur.

14 Fisheries Management Paper No. 284
3.5.1 Identifying Performance Indicators & Reference Levels
3.5.1.1 Retained species (Indicator Species & Non-Indicator Species)
The primary performance indicator used to evaluate the stock status of indicator species and non-indicator species in the Gascoyne Coast Bioregion is spawning biomass (B) or an appropriate proxy (see Table 1). For each stock, the performance indicator is estimated periodically (at least every 5 years) and compared to associated reference levels (BTarget, BThreshold and BLimit) consistent with those used by Fisheries in similar assessments and based on internationally accepted benchmarks for moderate to long-lived fish species (Caddy and Mahon 1995; Gabriel and Mace 1999; Mace 2001; Wise et al. 2007).
The life history characteristics of the indicator species for this fishery are commensurate with a steepness (of the stock recruitment relationship) of around 0.75. Investigation into the relationship between virgin biomass (B0) and BMSY for stocks with a range of steepness values around this level (0.6 to 1.0) indicates BMSY is likely to be close to B30 (30% of unfished biomass) (N. Hall, unpublished). Accordingly, the B30 threshold level used for this fishery corresponds to BMSY. By extension the B40 target and B20 limit levels correspond to 1.33BMSY and 0.67 BMSY respectively. These levels that are more conservative than the target and limit of 1.3 BMSY and 0.5 BMSY respectively, suggested in Fisheries’ Harvest Strategy Policy.
In line with the ecological objectives of this harvest strategy, the reference levels and control rules act to maintain stocks of all retained species above BMSY, with management action triggered should they drop below this level. Any stock size above the B30 threshold is consistent with meeting the objectives for biological sustainability. Maintaining the stock at or above the B30 threshold is also sufficient to meet the stock status requirements as defined for purposes of certification under the Marine Stewardship Council’s standard for sustainability. Note that while being above the BMSY threshold meets the objectives of this harvest strategy, setting a specific target level for this fishery (i.e. one that is > BMSY) is not feasible due to natural variability in the sizes of fish populations. Rather, a target range has been set between B30 and B40. Within this range there would generally be no need to adjust management settings. However, if stock size exceeds B40 then there may be a need to review management settings to ensure other objectives are being met.
For the non-indicator species, additional risk-based reference levels have also been set to differentiate acceptable fishery impacts from unacceptable fishery impacts (see below).
Table 1. Performance indicators and associated reference levels used to evaluate the status of indicator species and non-indicator species in the Gascoyne Coast Bioregion
Performance Indicator
Reference Levels
Target (1.33 BMSY) Threshold (BMSY) Limit (0.67 BMSY)
Spawning biomass (B) B40 B30 B20
Spawning potential ratio (SPR) SPR40 SPR30 SPR20

Fisheries Management Paper No. 284 15
3.5.1.2 Risk Assessments
Other ecological assets incorporated in this harvest strategy include bycatch and ETP species, habitats and ecosystem processes. As explained in Section 2, only impacts of fishing by the commercial GDSMF and the recreational (and charter) fishing sector on these ecological components are currently assessed within this harvest strategy. Reference levels used to monitor the performance of the GDSMF and the recreational sector against management objectives relating to these assets have been set to differentiate acceptable fishery impacts from unacceptable fishery impacts according to the risk levels defined in Fletcher (2012, 2015).
3.5.1.3 Economic and Social Benefits
In line with the principles of ESD, this harvest strategy also includes objectives and performance indicators for the economic and social benefits of fishing which have been developed by a stakeholder working group (see section 3.7.2.4). It is important to note that management actions relating to these objectives are to be applied within the constraints of meeting objectives for ecological sustainability and while having regards to the objectives of other sectors.
The economic and social benefit objectives for the commercial GDSMF are to:
1. provide flexible opportunities to ensure fishers can maintain or enhance their livelihood; and
2. maintain or provide opportunity to maximise the flow of commercial fishing related economic benefit to the broader community.
Gross Value of Production (GVP) has been chosen as a performance indicator to evaluate whether commercial fishers in the GDSMF have been able to maintain or enhance their livelihood. GVP is calculated by multiplying the landed catch (kg) by the state-wide average beach price ($/kg). GVP has been estimated on an annual basis for all species landed by the GDMSF since 2011/12 for the purpose of determining commercial access fees. Based on the current pink snapper and combined species quota (approx. 505 tonnes total) and an industry aspiration of achieving an average beach price of $10 kilogram, the target reference level (GVPTarget) has been set at $5 million with the threshold reference level (GVPThreshold) set at $3 million. This may need to be revised following any changes in management arrangements which impact on fishery performance such as changes in the TACC.
No performance indicators or reference levels currently exist to evaluate flow of commercial fishing related economic benefit to the broader community. It is envisaged that this objective will be measured using socio-economic surveys in the future.
The economic and social benefit objectives for the recreational fishing sector are to:
1. maintain or improve cultural and recreational lifestyle benefits for recreational fishing participants; and
16 Fisheries Management Paper No. 284
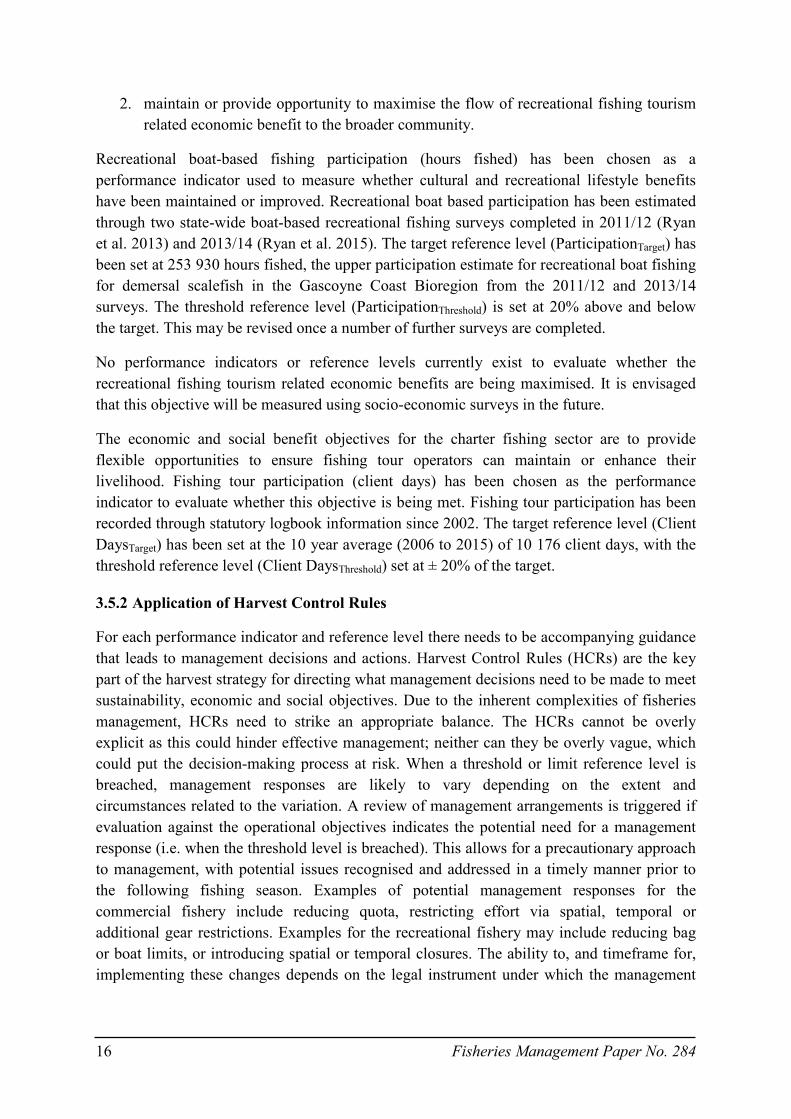
2. maintain or provide opportunity to maximise the flow of recreational fishing tourism related economic benefit to the broader community.
Recreational boat-based fishing participation (hours fished) has been chosen as a performance indicator used to measure whether cultural and recreational lifestyle benefits have been maintained or improved. Recreational boat based participation has been estimated through two state-wide boat-based recreational fishing surveys completed in 2011/12 (Ryan et al. 2013) and 2013/14 (Ryan et al. 2015). The target reference level (ParticipationTarget) has been set at 253 930 hours fished, the upper participation estimate for recreational boat fishing for demersal scalefish in the Gascoyne Coast Bioregion from the 2011/12 and 2013/14 surveys. The threshold reference level (ParticipationThreshold) is set at 20% above and below the target. This may be revised once a number of further surveys are completed.
No performance indicators or reference levels currently exist to evaluate whether the recreational fishing tourism related economic benefits are being maximised. It is envisaged that this objective will be measured using socio-economic surveys in the future.
The economic and social benefit objectives for the charter fishing sector are to provide flexible opportunities to ensure fishing tour operators can maintain or enhance their livelihood. Fishing tour participation (client days) has been chosen as the performance indicator to evaluate whether this objective is being met. Fishing tour participation has been recorded through statutory logbook information since 2002. The target reference level (Client DaysTarget) has been set at the 10 year average (2006 to 2015) of 10 176 client days, with the threshold reference level (Client DaysThreshold) set at ± 20% of the target.
3.5.2 Application of Harvest Control Rules
For each performance indicator and reference level there needs to be accompanying guidance that leads to management decisions and actions. Harvest Control Rules (HCRs) are the key part of the harvest strategy for directing what management decisions need to be made to meet sustainability, economic and social objectives. Due to the inherent complexities of fisheries management, HCRs need to strike an appropriate balance. The HCRs cannot be overly explicit as this could hinder effective management; neither can they be overly vague, which could put the decision-making process at risk. When a threshold or limit reference level is breached, management responses are likely to vary depending on the extent and circumstances related to the variation. A review of management arrangements is triggered if evaluation against the operational objectives indicates the potential need for a management response (i.e. when the threshold level is breached). This allows for a precautionary approach to management, with potential issues recognised and addressed in a timely manner prior to the following fishing season. Examples of potential management responses for the commercial fishery include reducing quota, restricting effort via spatial, temporal or additional gear restrictions. Examples for the recreational fishery may include reducing bag or boat limits, or introducing spatial or temporal closures. The ability to, and timeframe for, implementing these changes depends on the legal instrument under which the management

Fisheries Management Paper No. 284 17
measure occurs. Further information on the management measures in place for this fishery is provided in Section 4.
The management objectives, performance indicators, reference levels and control rules for the resource is provided in Table 2. Figure 6 (a-d) graphically illustrates how these rules are intended to apply to the indicator species.
18 Fisheries Management Paper No. 284
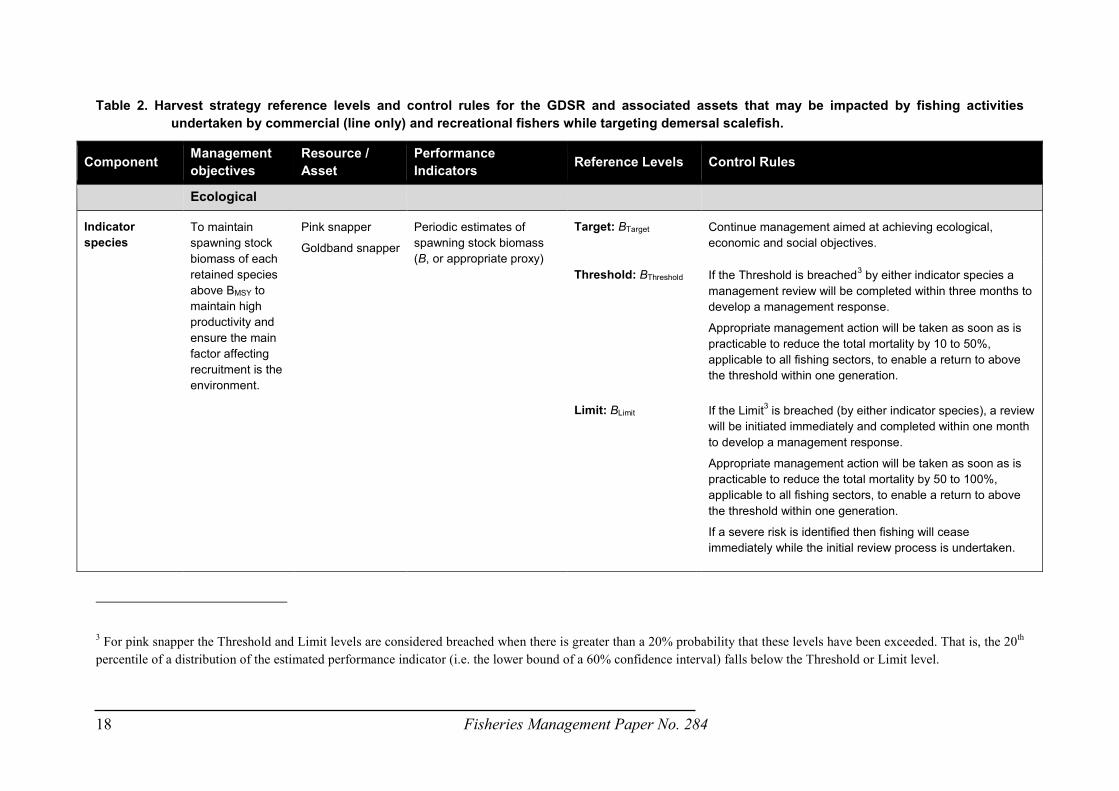
Table 2. Harvest strategy reference levels and control rules for the GDSR and associated assets that may be impacted by fishing activities undertaken by commercial (line only) and recreational fishers while targeting demersal scalefish.
Component Management objectives
Resource / Asset
Performance Indicators Reference Levels Control Rules
Ecological
Indicator species
To maintain spawning stock biomass of each retained species above BMSY to maintain high productivity and ensure the main factor affecting recruitment is the environment.
Pink snapper
Goldband snapper
Periodic estimates of spawning stock biomass (B, or appropriate proxy)
Target: BTarget Continue management aimed at achieving ecological, economic and social objectives.
Threshold: BThreshold If the Threshold is breached3 by either indicator species a management review will be completed within three months to develop a management response.
Appropriate management action will be taken as soon as is practicable to reduce the total mortality by 10 to 50%, applicable to all fishing sectors, to enable a return to above the threshold within one generation.
Limit: BLimit If the Limit3 is breached (by either indicator species), a review will be initiated immediately and completed within one month to develop a management response.
Appropriate management action will be taken as soon as is practicable to reduce the total mortality by 50 to 100%, applicable to all fishing sectors, to enable a return to above the threshold within one generation.
If a severe risk is identified then fishing will cease immediately while the initial review process is undertaken.
3 For pink snapper the Threshold and Limit levels are considered breached when there is greater than a 20% probability that these levels have been exceeded. That is, the 20th percentile of a distribution of the estimated performance indicator (i.e. the lower bound of a 60% confidence interval) falls below the Threshold or Limit level.
Fisheries Management Paper No. 284 19
Component Management objectives
Resource / Asset
Performance Indicators Reference Levels Control Rules
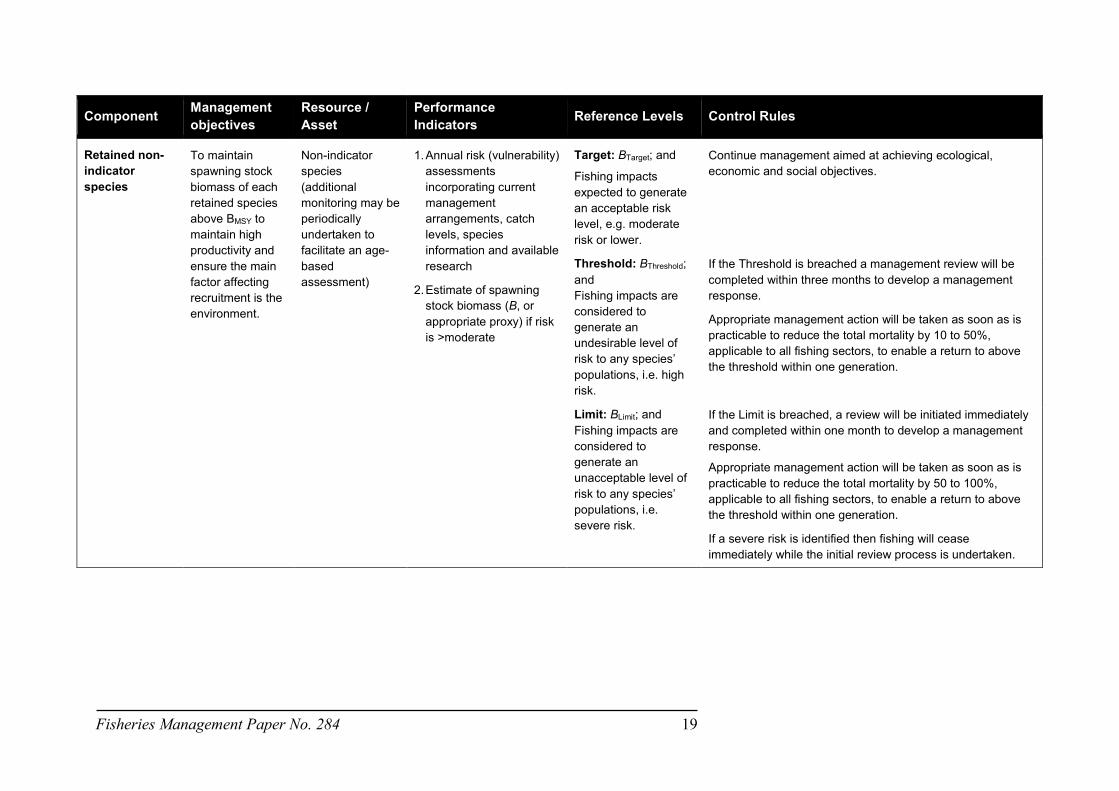
Retained non-indicator species
To maintain spawning stock biomass of each retained species above BMSY to maintain high productivity and ensure the main factor affecting recruitment is the environment.
Non-indicator species (additional monitoring may be periodically undertaken to facilitate an age-based assessment)
1. Annual risk (vulnerability) assessments incorporating current management arrangements, catch levels, species information and available research
2. Estimate of spawning stock biomass (B, or appropriate proxy) if risk is >moderate
Target: BTarget; and
Fishing impacts expected to generate an acceptable risk level, e.g. moderate risk or lower.
Continue management aimed at achieving ecological, economic and social objectives.
Threshold: BThreshold; and Fishing impacts are considered to generate an undesirable level of risk to any species’ populations, i.e. high risk.
If the Threshold is breached a management review will be completed within three months to develop a management response.
Appropriate management action will be taken as soon as is practicable to reduce the total mortality by 10 to 50%, applicable to all fishing sectors, to enable a return to above the threshold within one generation.
Limit: BLimit; and Fishing impacts are considered to generate an unacceptable level of risk to any species’ populations, i.e. severe risk.
If the Limit is breached, a review will be initiated immediately and completed within one month to develop a management response.
Appropriate management action will be taken as soon as is practicable to reduce the total mortality by 50 to 100%, applicable to all fishing sectors, to enable a return to above the threshold within one generation.
If a severe risk is identified then fishing will cease immediately while the initial review process is undertaken.

20 Fisheries Management Paper No. 284
Component Management objectives
Resource / Asset
Performance Indicators Reference Levels Control Rules
Bycatch (non-Endangered, threatened and protected species)
To ensure fishing impacts do not result in serious or irreversible harm to bycatch species populations.
All bycatch species (commercial and recreational sector)4
Periodic risk assessments incorporating current management arrangements, catch levels, species information and available research
Target: Fishing impacts expected to generate an acceptable risk level to bycatch species’ populations, e.g. moderate risk or lower.
Continue management aimed at achieving ecological, economic and social objectives.
Threshold: Fishing impacts are considered to generate an undesirable level of risk to any bycatch species’ populations, i.e. high risk.
A review is completed within three months to investigate the options to reduce the risk. Appropriate management action will be taken as soon as is practicable to reduce risk to an acceptable level before the next season.
Limit: Fishing impacts are considered to generate an unacceptable level of risk to any bycatch species’ populations, i.e. severe risk.
A review is completed within one month to investigate the options to reduce the risk. Appropriate management action will be taken as soon as is practicable to reduce the risk to an acceptable level as soon as is practicable.
4 Note that only the impacts of line fishing on ecological assets other than the retained species are currently assessed within this harvest strategy (see Section 2).

Fisheries Management Paper No. 284 21
Component Management objectives
Resource / Asset
Performance Indicators Reference Levels Control Rules
Endangered, threatened and protected (ETP) species
To ensure fishing impacts do not result in serious or irreversible harm to endangered, threatened and protected (ETP) species populations.
All ETP species5 Periodic risk assessments incorporating current management arrangements, number of reported interactions, species information and available research.
Target: Fishing impacts expected to generate an acceptable risk level to ETP species’ populations, i.e. moderate risk or lower.
Continue management aimed at achieving ecological, economic and social objectives.
Threshold: Fishing impacts are considered to generate an undesirable level of risk to any ETP species’ populations, i.e. high risk.
A review is completed within three months to investigate the options to reduce the risk. Appropriate management action will be taken as soon as is practicable to reduce risk to an acceptable level before the next season.
Limit: Fishing impacts are considered to generate an unacceptable level of risk to any ETP species’ populations, i.e. severe risk.
A review is completed within one month to investigate the options to reduce the risk. Appropriate management action will be taken as soon as is practicable to reduce the risk to an acceptable level as soon as is practicable.
5 Note that only the impacts of line fishing on ecological assets other than the retained species are currently assessed within this harvest strategy (see Section 2).

22 Fisheries Management Paper No. 284
Component Management objectives
Resource / Asset
Performance Indicators Reference Levels Control Rules
Habitats To ensure the effects of fishing do not result in serious or irreversible harm to habitat structure and function.
All habitats6 Periodic risk assessments incorporating current management arrangements, extent of fishing activities, habitat distribution and available research.
Target: Fishing impacts are considered to generate an acceptable level of risk to all benthic habitats, i.e. moderate risk or lower.
Continue management aimed at achieving ecological, economic and social objectives.
Threshold: Fishing impacts are considered to generate an undesirable level of risk to any benthic habitats, i.e. high risk.
A review is completed within three months to investigate the options to reduce the risk. Appropriate management action will be taken to reduce risk to an acceptable level before the next season.
Limit: Fishing impacts are considered to generate an unacceptable level of risk to any benthic habitats, i.e. severe risk.
A review is completed within one month to investigate the options to reduce the risk. Appropriate management action will be taken to reduce the risk to an acceptable level as soon as is practicable.
6 Note that only the impacts of line fishing on ecological assets other than the retained species are currently assessed within this harvest strategy (see Section 2).

Fisheries Management Paper No. 284 23
Component Management objectives
Resource / Asset
Performance Indicators Reference Levels Control Rules
Ecosystem To ensure the effects of fishing do not result in serious or irreversible harm to ecological processes.
Trophic interactions7
Periodic risk assessments incorporating current management arrangements, catch levels, extent of fishing activities, ecosystem information and available research.
Target: Fishing impacts are considered to generate an acceptable level of risk to ecological processes within the ecosystem, i.e. moderate risk or lower.
Continue management aimed at achieving ecological, economic and social objectives.
Threshold: Fishing impacts are considered to generate an undesirable level of risk to any ecological processes within the ecosystem, i.e. high risk.
A review is completed within three months to investigate the options to reduce the risk. Appropriate management action will be taken to reduce risk to an acceptable level before the next season.
7 Note that only the impacts of line fishing on ecological assets other than the retained species are currently assessed within this harvest strategy (see Section 2).
24 Fisheries Management Paper No. 284
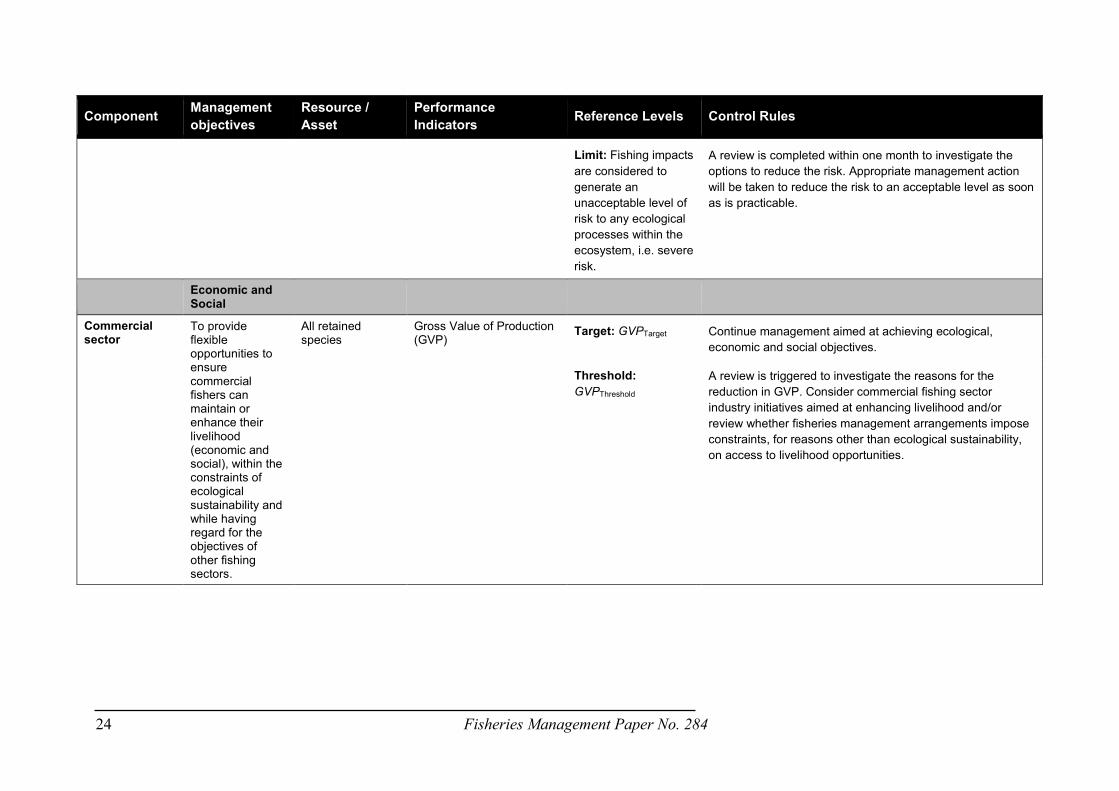
Component Management objectives
Resource / Asset
Performance Indicators Reference Levels Control Rules
Limit: Fishing impacts are considered to generate an unacceptable level of risk to any ecological processes within the ecosystem, i.e. severe risk.
A review is completed within one month to investigate the options to reduce the risk. Appropriate management action will be taken to reduce the risk to an acceptable level as soon as is practicable.
Economic and Social
Commercial sector
To provide flexible opportunities to ensure commercial fishers can maintain or enhance their livelihood (economic and social), within the constraints of ecological sustainability and while having regard for the objectives of other fishing sectors.
All retained species
Gross Value of Production (GVP)
Target: GVPTarget Continue management aimed at achieving ecological, economic and social objectives.
Threshold: GVPThreshold
A review is triggered to investigate the reasons for the reduction in GVP. Consider commercial fishing sector industry initiatives aimed at enhancing livelihood and/or review whether fisheries management arrangements impose constraints, for reasons other than ecological sustainability, on access to livelihood opportunities.

Fisheries Management Paper No. 284 25
Component Management objectives
Resource / Asset
Performance Indicators Reference Levels Control Rules
Commercial sector (cont)
To maintain and provide opportunity to maximise the flow of commercial fishing related economic benefit to the broader community within the constraints of ecological sustainability and while having regard for the objectives of other fishing sectors.
All retained species
Satisfaction and/or economic surveys using recognised social science and/or economic methodologies and measures
Target: To be developed (see section 3.5.1.3)
To be developed (see section 3.5.1.3).
Recreational sector (including charter)
To maintain or improve lifestyle benefits for recreational fishing participants within the constraints of ecological sustainability and while having regard for the objectives of other fishing sectors.
All retained species
Recreational boat based participation (Hours Fished)
Target: ParticipationTarget
Continue management aimed at achieving ecological, economic and social objectives.
Threshold: ParticipationThreshold
A review is triggered to investigate the reasons for the change in participation. Consider recreational fishing sector initiatives aimed at maintaining or improving lifestyle benefits for fishing participants and/or review whether fisheries management arrangements impose constraints, for reasons other than ecological sustainability.

26 Fisheries Management Paper No. 284
Component Management objectives
Resource / Asset
Performance Indicators Reference Levels Control Rules
Recreational sector (including charter – cont)
To provide flexible opportunities to ensure charter operators can maintain or enhance their livelihood (economic and social), within the constraints of ecological sustainability and while having regard for the objectives of other fishing sectors.
All retained species
Charter client Target: ClientTarget Continue management aimed at achieving ecological, economic and social objectives.
Threshold: ClientThreshold
A review is triggered to investigate the reasons for the reduction in clients or trips. Consider charter fishing sector industry initiatives aimed at enhancing livelihood and/or review whether fisheries management arrangements impose constraints, for reasons other than ecological sustainability, on access to livelihood opportunities.

Fisheries Management Paper No. 284 27
Component Management objectives
Resource / Asset
Performance Indicators Reference Levels Control Rules
Recreational sector (including charter – cont)
Maintain and provide opportunity to maximise the flow of recreational fishing (and charter) tourism related economic benefit to the broader community within the constraints of ecological sustainability and while having regard for the objectives of other fishing sectors.
All retained species
Satisfaction and/or economic surveys using recognised social science and/or economic methodologies and measures
Target: To be developed (see section 3.5.1.3)
To be developed (see section 3.5.1.3).

28 Fisheries Management Paper No. 284
Figure 6. Graphical illustration of harvest control rules for indicator species under hypothetical biomass trajectories:
a) Spawning biomass fluctuating above Target range. Ecological objective met, Target level exceeded. An increase in catch may be considered.
b) Spawning biomass fluctuating between Threshold and Target. Ecological objective met, continue management to maintain biomass above Threshold.
c) Spawning biomass below Threshold. Ecological objective not met, reduce fishing mortality by an agreed level (10-50%) to rebuild spawning biomass to above Threshold within one generation.
d) Spawning biomass below Limit. Ecological objective not met, reduce fishing mortality by an agreed level (50-100%) to rebuild spawning biomass to above Threshold within one generation.
B40
B30
B20
B40
B30
B20
B40
B30
B20
B40
B30
B20
A
Spa
wni
ng B
iom
ass
Time
B
C D
Biomass Target
Threshold (BMSY) Limit
Fisheries Management Paper No. 284 29
3.6 Annual Fishery Performance & Annual Tolerance Levels
Defining annual tolerance levels provides a formal but efficient basis to annually evaluate the effectiveness of current management arrangements in delivering the levels of catch (or effort for quota-managed fisheries), specified by HCRs and where relevant, any sectoral allocation decisions (Fletcher et al. 2016). If the annual catch and effort remains within the ‘tolerance range’ (based on historical variations in recruitment and/or fishing operations) the fishery is considered to be operating ‘acceptably’ with no need to review the management settings. Where the annual catch or effort falls outside of this range and this cannot be adequately explained (e.g. documented evidence of, for example, environmental or market induced impacts), this will result in a review of the cause which may lead to a re-assessment of the resource status. This would necessitate reassessing the status against the performance indicators and HCRs which could potentially lead to a change in management settings and therefore a revision of the tolerance levels.
For the GDSR, the catch tolerance ranges used to assess annual recreational fishery performance within the Gascoyne Coast Bioregion are currently under development.
The current catch tolerance ranges used to assess annual commercial fishery performance are evaluated by 1) assessing whether the GDSMF has achieved the TACC for each quota group; 2) comparing the annual catch rate of pink snapper with the catch rate tolerance level; 3) comparing annual catch of other demersal scalefish species within their catch tolerance ranges; and 4) comparing annual effort (fishing days) within effort tolerance ranges. As part of the annual performance review, vulnerability of all species will be assessed (e.g. with regard to current management arrangements, catch levels, new species information). If the status of the resource changes such that the control rules trigger additional management adjustments, the tolerance range for each of these fisheries must also be adjusted accordingly (Fletcher et al. 2016).
3.6.1 Annual Catch Tolerance Levels
The catch tolerance range for the GDSMF is currently defined as achieving at least 85% of the pink snapper TACC. The current catch tolerance range for pink snapper is based on historical catch levels and recognises that the entire TACC cannot realistically be caught in any season for a range of economic and operational reasons (such as the management relationship between the two quota groups – see Section 3.3).
A catch tolerance range for the non-pink snapper TACC, which has only been in place since the 2015-16 season, will be developed once the quota system has been in operation for several years.
The catch tolerance range for non-pink snapper species is currently defined as the historic catch range of each species or species complex between 1990 and 2013 (Table 3), with the exception of goldband snapper where an upper catch tolerance level of 120 tonnes is based on an assessment of fishing mortality (Marriot et al. 2012).

30 Fisheries Management Paper No. 284
Table 3. Annual commercial catch tolerance ranges (in tonnes) for pink snapper and combined species quota and key species.
Fishery Performance Measure Lower Tolerance Range
Upper Tolerance Range^
Pink snapper quota (% TACC) 85% 100%
Combined species quota (% TACC) TBD 100%
Goldband snapper complex (3 sp.) 35 t 120 t
Red emperor 6 t 24 t
Redthroat emperor 0.5 t 28 t
Rankin cod 1 t 12 t
Ruby snapper 0.5 t 32 t
Mulloway 3 t 28 t
Northern pearl perch 2 t 14 t
Eightbar grouper 0.5 t 17 t
Spangled emperor 2 t 15 t
Amberjack 0.5 t 9 t
Goldspotted rockcod 1 t 4 t
Blackspotted rockcod 0.5 t 4 t
Trevallies 2 t 21 t
^ Note: The capacity for the upper catch tolerance ranges for all non-pink snapper species achieved is limited by the combined species TACC (currently 227 tonnes).
3.6.2 Annual Catch Rate Tolerance
A catch rate tolerance level based on an annual standardised commercial catch rate of 500 kg pink snapper per standard boat day was established in 2003 (Department of Fisheries 2002; Department of Fisheries 2011; Marriott et al. 2012). Given changes in fishing operations since this time (e.g. using fewer hooks to reduce the impact of shark depredation), a review of the standardisation methodology is currently underway.
3.6.3 Unacceptable Performance Review Timelines
The catch and catch rate tolerance levels are reviewed annually and published in the State of Fisheries and Aquatic Resource Report and in DPIRD’s Annual report to the WA Parliament (see Section 3.7.3). Where one or more unacceptable performance levels have been identified, a review is completed within a time period relevant to the level of risk:
1) If there is a low likelihood that the resource is below the limit (and therefore possibly below the threshold), then a management review is completed within six months and outcomes implemented as soon as is practicable.

Fisheries Management Paper No. 284 31
2) If there is a moderate likelihood that the resource is below the limit (and therefore likely to be below the threshold) then a management review is completed within three months and outcomes implemented as soon as is practicable.
3) If there is a high likelihood that the resource is below the limit then all fishing should cease while the management review is undertaken.
3.7 Monitoring and Assessment Procedures
3.7.1 Information and Monitoring
3.7.1.1 Commercial Catch and Effort Information
Commercial catch and effort in the GDSMF has been monitored using statutory daily/trip logbooks (reporting blocks 10 x 10 nautical miles) since 2008. Prior to the introduction of these finer-resolution logbooks, catch and effort information was collected via monthly returns (CAES, 60 x 60 nautical mile blocks). Commercial operators are also required to complete statutory catch disposal records (CDRs) for pink snapper and other demersal scalefish on landing. VMS has been used to monitor fishing activity since 2008.
3.7.1.2 Recreational Catch and Effort Information
Estimates of recreational fishing effort and demersal scalefish catches on the Gascoyne Coast Bioregion are available from a number of recreational fishing surveys undertaken by Fisheries, including creel surveys of boat-based recreational fishing in the Gascoyne in 1998/99 (Sumner et al. 2002) and 2007/08 (Marriot et al. 2012).
More recently, a biennial survey of boat-based recreational fishing focused on providing a broader-scale and integrated system involving several survey methods has been used to survey boat-based recreational fishers in Western Australia (Ryan et al. 2013). Two state-wide recreational fishing surveys have been completed to date using this methodology, in 2011/12 (Ryan et al. 2013) and 2013/14 (Ryan et al. 2015). Results of a third survey should be available in 2017.
Information on charter vessel catches and effort has been routinely collected since 2001, when a licensing framework and compulsory logbook system was implemented.
The recreational and charter catch estimates are used together with the commercial catch estimates to inform the stock assessment of the indicator species.
3.7.1.3 Economic and Social Monitoring
Processor production and value has been monitored using statutory logbooks since 2001. This information provides estimates of weighted average price which, when multiplied with total landings produces estimates of GVP of the GDSMF.
Fisheries’ biennial survey of boat-based recreational fishing collects economic and social information including expenditure data and recreational fisher satisfaction. This information

32 Fisheries Management Paper No. 284
will be investigated to determine appropriate indictors for social and economic objectives in the future.
3.7.1.4 Fishery-Dependent Catch Sampling
The age composition of commercial pink snapper catches in the Gascoyne has been closely monitored using a stratified fishery-dependent sampling program since 2003/04. Sampling design is based on the seasonality of pink snapper catches, with larger numbers of otolith samples collected during the months of highest catch. A total of approximately 500-600 otoliths are collected in each sampling year, based on a target of 25-30 otoliths from 20 separate catches per fishing season.
The age composition of goldband snapper is currently monitored on a periodic basis.
3.7.2 Assessment Procedures
The different methods used by Fisheries to assess the status of aquatic resources in WA have been categorised into five broad levels, ranging from relatively simple analysis of annual catch levels and catch rates, through to the application of more sophisticated analyses and models that involve estimation of fishing mortality and biomass (Fletcher and Santoro 2015). Irrespective of the types of assessment methodologies used, all stock assessments undertaken by Fisheries take a risk-based, weight of evidence approach that considers all of the available (fishery-dependent and fishery-independent) information (Fletcher 2015, Wise et al. in prep.).
3.7.2.1 Pink Snapper
The status of the pink snapper oceanic stock in the Gascoyne Coast Bioregion is primarily assessed based on estimates of spawning stock biomass relative to internationally accepted reference points (Table 1). Spawning biomass is estimated periodically (at least every five years) for the stock using an age- and sex-structured, integrated assessment model that is fitted to available time series of total catches, catch rates (index of abundance) and age composition data. The model takes into account the major features relevant to the biology of pink snapper, including sex-specific growth characteristics, the lengths and ages at which individuals mature, and the selectivity characteristics of the fishing gear used to catch this species.
Standardised commercial catch rates for pink snapper are calculated annually using effort measured as ‘standard boat days’. These are defined as the days fished by vessels that caught more than four tonnes each of pink snapper by handline fishing during June–July each year (referred to as the ‘Moran method’).
3.7.2.2 Goldband Snapper & Non-Indicator Species
In the absence of direct estimates of spawning stock biomass, the stock status of goldband snapper and the non-indicator species in the Gascoyne Coast Bioregion is assessed primarily based on estimated proxies for biomass, e.g. spawning potential ratio (SPR; Goodyear 1993) and/or fishing mortality from catch curve and per-recruit analyses. The estimates are

Fisheries Management Paper No. 284 33
periodically compared to specified reference points (Table 1) to determine the status of each stock.
3.7.2.3 Risk Assessments
Fisheries uses a risk-based EBFM framework to assess the impacts of fishing on all parts of the marine environment, including the sustainability risks of retained species, bycatch, ETP species, habitats and the ecosystem. The MSC assessment of the GDSMF has led the development of a periodic risk assessment process, which is used to prioritise research, data collection, monitoring needs and management actions and to ensure that line-fishing activities in the oceanic waters of the Gascoyne Coast Bioregion are managed both sustainably and efficiently.
An ecological risk assessment (ERA) workshop was held to assess the impacts of commercial line fishing in the Gascoyne Coast Bioregion in September 2016. The workshop participants included representatives from the commercial fishing industry, the recreational and charter fishing sectors, the Department of Biodiversity, Conservation and Attractions Parks and Wildlife, and Fisheries. The risk assessment framework is based on the global standard for risk assessment and risk management (AS/NZS ISO 31000), which has been adopted for use in a fisheries context (see Fletcher et al. 2002). Four aspects were considered for the risk assessment: ecological sustainability, community well-being, external factors and governance (note only ecological sustainability is currently considered as part of this harvest strategy).
Future risk assessments will be undertaken periodically (every 3–5 years) to reassess any current or new issues that may arise in the fishery. Risk assessments can be undertaken more frequently if there are significant changes identified in fishery operations, management activities or controls that are likely to result in a change to previously assessed risk levels.
3.7.2.4 Economic and Social Benefits
Economic and social benefit objectives, and their associated performance indicators and controls continue to be developed for Western Australia commercial and recreational fisheries. Provisional economic and social benefit objectives and associated performance indicators and control rules have been developed for the GDSR by an independently chaired stakeholder based working group with representation from the Western Australia Fishing Industry Council (WAFIC), Recfishwest, the recreational and commercial fishing sectors, and the Department of Fisheries.
The working group selected GVP as a performance indictor for the GDSMF on the basis that it is a factor of two key elements that affect the economic performance of the fishery; total catch and beach price. Total catch is influenced the annual TACC setting (see Section 4.1.1.1.1) and the capacity for fishers to achieve the TACC (see Section 3.6.1). Beach price is market driven and can be influenced by factors such as product quality, continuity of supply and seasonal demand.
Participation (hours fished) was selected by the working group as a performance indicator for the recreational fishing sector on the basis that is a broad measure of the social amenity of

34 Fisheries Management Paper No. 284
recreational fishing in the Gascoyne Coast Bioregion. Social amenity is influenced by a variety of factors including an individual’s ability to realise their fishing experience expectations (e.g. catch, catch rate, species composition and access etc.). Participation (client numbers) was selected as the performance indicator for the charter sector as a measure of economic performance.
While changes in participation over time provides a measure that the amenity or economic value associated with a recreational fishery may have been affected (in a positive or negative manner), additional tools (such as satisfaction/economic surveys) may be required to determine exactly what factors are driving the change.
3.7.3 Reports and Publications
Information on the current status of Western Australian fisheries and aquatic resources is reported annually in the Status Reports of the Fisheries and Aquatic Resources of Western Australia: the State of the Fisheries (e.g. Fletcher and Santoro 2015). Other comprehensive information on fisheries management and the findings and recommendations from research and monitoring activities are also regularly compiled and published in a number of publically-available documents8, including:
• DPIRD’s Annual Report to Parliament;
• The Research, Monitoring, Assessment and Development Plan (e.g. Department of Fisheries 2015b); and
• Fisheries Research Reports, Fisheries Management Papers, Fisheries Occasional Publications, and peer-reviewed scientific journal articles. Examples include:
- Fisheries Research Report No. 228: Biology and stock status of demersal indicator species in the Gascoyne Coast Bioregion (Marriott et al. 2012); and
- Fisheries Occasional Publication No. 101: Gascoyne Demersal Scalefish Managed Fishery, an operators’ guide to the management arrangements 1 September 2015 – 31 August 2016 (Department of Fisheries 2016a).
4 MANAGEMENT MEASURES AND IMPLEMENTATION
There are a number of management measures in place for managing the GDSR (Table 4). These measures can be amended as needed to ensure the management objectives are achieved; however, these do not preclude the consideration of other options.
8 Departmental reports are available at http://www.fish.wa.gov.au/About-Us/Publications/Pages/default.aspx

Fisheries Management Paper No. 284 35
Table 4. Management measures and instrument of implementation for the GDSR
Measure Description Instrument
Quota System The GDSMF is managed via an ITQ system, with separate TACCs for pink snapper and mixed non-pink snapper dermersal scalefish catch. Operators must have unexhausted quota of both quota groups to fish. A minimum debit rule of 50 kg of pink snapper for each day’s fishing applies.
GDSMF Management Plan
Licence Requirements
Operators in the commercial GDSMF must hold a Managed Fishery Licence with a minimum of 100 units of both pink snapper and combined species quota. Recreational fishers must hold a Recreational Fishing from Boat Licence. Charter operators must hold a Fishing Tour Operators Licence. Licences are renewed annually.
GDSMF Management Plan; FRMR
Bag and possession limits
Daily recreational bag limits apply for all demersal species. There is a recreational possession limit of 2 days’ bag limit; or 20 kg of fillets; or one day’s bag limit and 10 kg of fillets.
FRMR
Gear restrictions Operators in the commercial GDSMF are only permitted to fish using handlines and droplines. Commercial fishers are permitted to use up to 10 lines per vessel and must have VMS installed. Recreational fishers are only permitted to catch demersal scalefish by hook and line (up to three hooks per line) or by pointed instrument.
GDSMF Management Plan; ALC Approved Directions; FRMR
Processing restrictions
All commercially caught fish must be landed in whole form. All recreationally caught fish must be landed whole; or trunked/filleted with a minimum length of 300 mm and skin and scales attached.
GDSMF Management Plan; FRMR
Species Restrictions
Restrictions on the species permitted to be retained apply to all commercial and recreational fishers (e.g. they may not retain any protected species).
GDSMF Management Plan; FRMR
Size Limits Minimum size for pink snapper 410 mm (TL). Minimum size for some other bycatch species (e.g. Lutjanids, Lethrinids and Cods) Maximum size for some Cods (>1000 mm TL, Recreational fishery only)
FRMR
Spatial Closures Commercial closures: Point Quobba, inside Bernier and Dorre Islands, inner gulfs of Shark Bay, and Commonwealth Marine Reserve waters. Recreational and commercial closures: Marine Park sanctuary zones.
GDSMF Management Plan; Marine Park Orders

36 Fisheries Management Paper No. 284
4.1 Implementing Changes to the Management Arrangements
Decision-making processes can be triggered following the identification of new or potential issues as part of a risk assessment (generally reviewed every 3–5 years), results of research, management or compliance projects or investigations, monitoring or assessment outcomes (including those assessed as part of the harvest strategy) and/or expert workshops and peer review of aspects of research and management.
There are two main processes for making decisions about the implementation of management measures and strategies for the GDSR:
• annual decision-making processes that may result in measures to meet the short-term fishery objectives (driven by the control rules); and
• longer-term decision-making processes that result in new measures and/or strategies to achieve the long-term fishery objectives (i.e. changes to the management system).
However, if there is an urgent issue, consultation with stakeholders may be undertaken to discuss the issue and determine appropriate management action, as needed.
4.1.1 Consultation
Management changes are generally given effect through amendments to legislation, such as the commercial fishery management plan, regulations and orders. These changes require the approval of the Minister for Fisheries. In making decisions relevant to fisheries, the Minister for Fisheries may choose to receive advice from any source, but has indicated that:
1) Fisheries is the primary source of management advice; and
2) Peak Bodies (Western Australian Fishing Industry Council [WAFIC] and Recfishwest) are the primary source of industry advice and representation.
Under a funding agreement, the Peak Bodies are funded by Government to undertake their representation/advisory and consultation roles.
4.1.1.1 Commercial Sector Consultation
Under its funding agreement with Fisheries, WAFIC has been contracted to conduct statutory consultation related to fisheries management plans and the facilitation of management meetings for licensed fisheries.
The FRMA requires the Minister to consult with affected parties when changes to a management plan are being considered. In the case of the GDSMF, this includes all licence holders. Management meetings between Fisheries, WAFIC and licence holders are generally held in September-October and are used as the main forum to consult with stakeholders and licence holders on the management of the fishery. During these meetings, Fisheries’ staff (research, management and compliance), licence holders and WAFIC discuss current and future management issues, and any proposed changes to the management plan including changes to the TACC. Follow-up meetings may be held as required.

Fisheries Management Paper No. 284 37
Fisheries also consults directly with industry, where relevant, on specific management and operational issues.
4.1.1.1.1 TACC Setting and Review Process
The capacity setting and review process for the pink snapper and combined species (non-pink snapper) quota is undertaken by Fisheries based on research advice and in consultation with GDSMF licence holders in accordance with the controls rules outlined in this harvest strategy (see Table 2 and Figure 6). During this process consideration is also given to the fishery performance (see Section 3.6), and the economic and social benefit objectives.
The capacity (TACC) for pink snapper and combined species quota is reviewed following each periodic assessment of spawning biomass (or proxy). Where the spawning biomass estimate is below the threshold level for either indicator species the relevant HCRs are applied.
If the pink snapper spawning biomass estimate is above the target level, licence holders in the GDSMF may be consulted on options to increase in the pink snapper TACC to a level which will maintain the spawning biomass above BMSY for the next 3-5 year period.
If the goldband snapper spawning biomass estimate is above the target level, and fishery impacts are generating an acceptable level of risk to all other retained non-indicator species, licence holders in the GDSMF may be consulted on options to an increase in the non-pink snapper TACC to a level which will maintain the spawning biomass of goldband snapper above BMSY for the next 3-5 year period while maintaining an acceptable level of risk for all other retain non-indicator species.
The capacity for the GDSMF is contained in the management plan. A change in capacity is given effect through an amendment to the management plan following statutory consultation with licence holders and the approval of the Minister for Fisheries.
4.1.1.2 Recreational Sector Consultation
Under the funding agreement with Recfishwest, Fisheries is required to consult with Recfishwest as the recognised peak body for recreational fishing in Western Australia. Recfishwest is required to engage and consult with recreational fishers as necessary in order to meet its obligations.
4.1.1.3 Consultation with Other Stakeholder Groups
Consultation with non-fisher stakeholders including Government agencies, conservation sector Non-Government Organisations, customary fishers, statutory advisory committees and other affected or interested parties is undertaken by Fisheries in accordance with the Stakeholder Engagement Guideline (Department of Fisheries 2016b). Fisheries approach to stakeholder engagement is based on a framework designed to assist with selecting the appropriate level of engagement for different stakeholder groups and includes collaborating with and involving key stakeholders, seeking input from interested parties through a public

38 Fisheries Management Paper No. 284
consultation process and keeping all parties fully informed through the provision of balanced, objective and accurate information. Key fishery-specific documents such as harvest strategies, recovery plans and bycatch action plans are subjected to both formal key stakeholder consultation and public consultation processes.
4.2 Compliance
The primary objectives of Fisheries regarding compliance is to 1) encourage voluntary compliance through education, awareness and consultation activities, and 2) provide effective deterrence for non-compliance through a penalty based system.
4.2.1 Operational Compliance Plans
Management arrangements are monitored under the Operational Compliance Plan (OCP) for the GDSMF and the recreational sector. An OCP is informed and underpinned by a compliance risk assessment conducted for each fishery. The OCP has the following objectives:
• to provide clear and un-ambiguous direction and guidance to Fisheries and Marine Officers for the yearly delivery of compliance in the fishery;
• to protect the environmental values of fisheries, while providing fair and sustainable access to their commercial and social values; and
• to encourage voluntary compliance through education, awareness and consultation activities.
The OCP is reviewed every 1-2 years.
4.2.1.1 Compliance Strategies for the GDSMF
Compliance strategies and activities that are used in the fishery include:
• land and sea patrols;
• inspections of scalefish wholesale and retail outlets;
• undertaking covert operations and observations;
• inspections at scalefish processing facilities;
• inspection in port;
• at-sea inspection of fishing boats;
• quota management;
• aerial surveillance; and
• intelligence gathering and investigations.
Inspections may involve:
• inspection of all compartments on board the vessels;

Fisheries Management Paper No. 284 39
• inspection of all authorisations;
• inspection of CDR book and associated paperwork; and
• inspection of catch on board the boat.
4.2.1.2 Vessel Monitoring System
VMS was introduced to the GDSMF in 2008 to allow real time monitoring of the commercial fleet and to support the pre-fishing nomination system. VMS helps to ensure fishers are working in their designated fishing areas.
Vessels operating within a fishery requiring VMS are fitted with an automatic location communicator (ALC), which is used to track the location of a boat by transmitting information such as the geographical position, course and speed of the boat. Information from the ALC is submitted to Fisheries via satellite to the Fisheries’ Marine Operations Centre in Fremantle. The information is processed by specialised software designed to receive, analyse, display and record position reports and messaging via satellites.
4.2.1.3 Compliance Strategies for the Recreational Sector
Compliance strategies and activities that are used in the fishery include:
• land patrols;
• on-water patrols;
• catch, licence and gear inspections;
• covert surveillance of persons of interest under approved operations;
• road-side checkpoints; and
• wholesale and retail inspections.

40 Fisheries Management Paper No. 284
5 REFERENCES
Allen, G.R. (1985). FAO species catalogue Vol. 6. Snappers of the world: an annotated and illustrated catalogue of Lutjanid species known to date. FAO Fisheries Synopsis, No. 125, Vol. 6. Food and Agriculture Organization of the United Nations, Rome.
Australian Fisheries Management Authority (AFMA) (2011). Harvest strategy for the Deepwater Trawl Fishery and North West Slope Trawl Fishery. AFMA, Canberra.
Caddy, J. and Mahon, R. (1995). Reference points for fisheries management. FAO Fisheries Technical Paper 347. FAO, Rome, 84 pp.
Department of Environment and Heritage (2004). Assessment of the Western Australian Shark Bay Snapper Fishery. Department of the Environment and Heritage, Canberra ACT 2601. https://www.environment.gov.au/system/files/pages/a701ffd3-982e-46c2-88f3-ce9f2d8d38bc/files/wa-snapper-assessment-report.pdf Department of Fisheries (1985). Shark Bay Snapper Fishery Working group. Report to the Minister for Fisheries. November 1985. Department of Fisheries, Western Australia
Department of Fisheries (1995). Management options for the Shark bay Snapper Limited Entry Fishery: Shark Bay Snapper Limited Entry working group. Fisheries Management Paper No 81. Department of Fisheries, Western Australia.
Department of Fisheries (2002) Application to Environment Australia on the Shark Bay Snapper Managed Fishery Against the Commonwealth Guidelines for the Ecologically Sustainable Management of Fisheries December 2002. https://www.environment.gov.au/system/files/pages/465b0cf8-b852-4db8-91f9-8ada7b6c0ff8/files/snapper.pdf
Department of Fisheries (2009). Integrated Fisheries Management - Government Policy. Department of Fisheries, Western Australia.
Department of Fisheries (2011). Resource Assessment Framework (RAF) for finfish resources in Western Australia. Fisheries Occasional Publication No. 85. Department of Fisheries, Western Australia.
Department of Fisheries (2014a). Exmouth Gulf Prawn Managed Fishery Harvest Strategy 2014 – 2019. Fisheries Management Paper No. 265. Department of Fisheries, Western Australia.
Department of Fisheries (2014b). Shark Bay Prawn Managed Fishery Harvest Strategy 2014-2019. Fisheries Management Paper No. 267. Department of Fisheries, Western Australia.
Department of Fisheries (2015a). Harvest Strategy Policy and Operational Guidelines for the Aquatic Resources of Western Australia. Fisheries Management Paper No. 271. Department of Fisheries, Western Australia.
Department of Fisheries (2015b). Research, Monitoring, Assessment and Development Plan 2015–2020. Fisheries Occasional Publication No. 122. Department of Fisheries, Western Australia.

Fisheries Management Paper No. 284 41
Department of Fisheries (2016a). Gascoyne Demersal Scalefish Managed Fishery, an operators’ guide to the management arrangements 1 September 2015 – 31 August 2016. Fisheries Occasional Publication No. 101. Department of Fisheries, Western Australia.
Department of Fisheries (2016b). Guideline for stakeholder engagement on aquatic resource management-related processes. Fisheries Occasional Publication No. 131. Department of Fisheries, Western Australia.
Department of Fisheries (2016c). North Coast Demersal Scalefish Resource Harvest Strategy 2016-2021. Fisheries Management Paper No. 279. Department of Fisheries, Western Australia.
ESD Steering Committee (1992). National Strategy for Ecologically Sustainable Development. Endorsed by the Council of Australian Governments, December 1992. ISBN0 644 27253 8.
Fletcher, W.J. (2002). Policy for the implementation of ecologically sustainable development for fisheries and aquaculture within Western Australia. Fisheries Management Paper No. 157. Department of Fisheries, Western Australia.
Fletcher, W.J. (2012). National Application of Sustainability Indicators for Australian Fisheries; Part 2: Ecosystem-based frameworks for aquaculture, multi-fishery and international applications. FRDC Report on Project No. 2000/145. Fisheries Research Report No. 235. Department of Fisheries, Western Australia, 60 pp.
Fletcher, W.J. (2015). Review and refinement of an existing qualitative risk assessment method for application within an ecosystem-based management framework. ICES Journal of Marine Science 72: 1043-1056.
Fletcher, W.J. and Santoro, K. (eds.) (2015). Status Reports of the Fisheries and Aquatic Resources of Western Australia 2014/15: State of the Fisheries. Department of Fisheries, Western Australia.
Fletcher, W., Chesson, J., Sainsbury, K., Fisher, M., Hundloe, T. and Whitworth, B. (2002). Reporting on Ecologically Sustainable Development: A “how to guide” for fisheries in Australia. Canberra, Australia, 120 pp.
Fletcher, W.J., Shaw, J., Metcalf, S.J. and Gaughan, D.J. (2010). An Ecosystem Based Fisheries Management framework: the efficient, regional-level planning tool for management agencies. Marine Policy 34: 1226-1238.
Fletcher, W.J., Wise, B.S., Joll, L.M., Hall, N.G., Fisher, E.A., Harry, A.V., Fairclough, D.V., Gaughan, D.J., Travaille, K., Molony, B.W. and Kangas, M. (2016). Refinements to harvest strategies to enable effective implementation of Ecosystem Based Fisheries Management for the multi-sector, multi-species fisheries of Western Australia. Fisheries Research. http://dx.doi.org/10.1016/j.fishres.2016.04.014
Gabriel, W.L. and Mace, P.M. (1999). A review of biological reference points in the context of the precautionary approach. NOAA Technical Memo NMFS-F/SPO-40, pp. 34-45.
Goodyear, C.P. (1993). Spawning stock biomass per recruit in fisheries management: foundation and current use. In S.J. Smith, J.J. Hunt and D. Rivard [ed.] Risk evaluation
42 Fisheries Management Paper No. 284
and biological reference points for fisheries management. Canadian Special Publications in Fisheries and Aquatic Science, 120.
Jackson, G., Cheng, Y.W. and Wakefield C.B. (2012). An evaluation of the daily egg production method to estimate spawning biomass of snapper (Pagrus auratus) stocks in inner Shark Bay, Western Australia, following more than a decade of surveys 1997-2007. Fisheries Research 117-118: 22-34.
Jackson, G., Newman, S.J., Turner, S. and Zilles, H. (2015). Gascoyne Demersal Scalefish Fishery Status Report. In: Fletcher, W.J. and Santoro, K. (eds.), Status Reports of the Fisheries and Aquatic Resources of Western Australia 2014/15: State of the Fisheries. Department of Fisheries, Western Australia.
Kailola, P.J., Williams, M.J., Stewart, P.C., Reichelt, R.E., McNeee, A. and Grieve, C. (1993). Australian Fisheries Resources. Bureau of Resource Sciences, Canberra.
Lloyd, J., Ovenden, J., Newman, S. and Keenan, C. (1996). Stock structure of Pristipomoides multidens resources across Australia. Final Report to Fisheries Research and Development Corporation on Project No 1996/131. Fishery Report No 49. Northern Territory Department of Primary Industry and Fisheries.
Mace, P.M. (2001). A new role for MSY in single-species and ecosystem approaches to fisheries stock assessment and management. Fish and Fisheries, 2(1), pp.2-32.
Marriott, R., Jackson, G., Lenanton, R., Telfer, C., Lai, E., Stephenson, P., Bruce, C., Adams, D. and Norriss, J. (2012). Biology and stock status of demersal indicator species in the Gascoyne Coast Bioregion. Fisheries Research Report No. 228. Department of Fisheries, Western Australia.
Molony, B.W., Newman, S.J., Joll, L., Lenanton, R.C.J. and Wise, B. (2011). Are Western Australian waters the least productive waters for finfish across two oceans? A review with a focus on finfish resources in the Kimberley region and North Coast Bioregion. Journal of the Royal Society of Western Australia 94: 323–332.
Moran, M.J. and Jenke, J. (1989). Effects of fish trapping on the Shark Bay snapper fishery. Fisheries Research Report No. 82. Fisheries Department of Western Australia.
Moran, M., Stephenson, P., Gaughan, D., Tapp, N. and Moore, J. (2005). Minimising the cost of future stock monitoring, and assessment of the potential for increased yields, from the oceanic snapper, Pagrus auratus, stock of Shark Bay. Fisheries Research and Development Corporation Final Report, Project 2000/138. Department of Fisheries Western Australia.
Newman, S.J., Steckis, R.A., Edmonds, J.S. and Lloyd, J. (2000). Stock structure of the goldband snapper Pristipomoides multidens (Pisces: Lutjanidae) from the waters of northern and western Australia by stable isotope ratio analysis of sagittal otolith carbonate. Marine Ecology Progress Series 198: 239-247.
Ovenden, J.R., Lloyd, J., Newman, S.J., Keenan, C.P. and Slater, L.S. (2002). Spatial genetic subdivision between northern Australian and southeast Asian populations of Pristipomoides multidens: a tropical marine reef fish species. Fisheries Research 59: 57–69.

Fisheries Management Paper No. 284 43
Parsons, D.M., Sim-Smith, C.J., Cryer, M., Francis, M.P., Hartill, B., Jones, E.G., Le Port, A., Lowe, M., McKenzie, J., Morrison, M., Paul, L.J., Radford, C., Ross, P.M., Spong, K.T., Trnski, T., Usmar, N., Walsh, C. and Zeldis, J. (2014) Snapper (Chrysophrys auratus): a review of life history and key vulnerabilities in New Zealand, New Zealand Journal of Marine and Freshwater Research 48: 256-283.
Ryan, K.L., Wise, B.S., Hall, N.G., Pollock, K.H., Sulin, E.H. and Gaughan, D.J. (2013). An integrated system to survey boat-based recreational fishing in Western Australia 2011/12. Fisheries Research Report No. 249. Department of Fisheries, Western Australia.
Ryan, K.L., Hall, N.G., Lai, E.K., Smallwood, C.B., Taylor, S.M. and Wise, B.S. (2015). Statewide survey of boat-based recreational fishing in Western Australia 2013/14. Fisheries Research Report No. 268. Department of Fisheries, Western Australia.
Sloan, SR; Smith, ADM; Gardner, C; Crosthwaite, K; Triantafillos, L; Jeffries, B and Kimber, N (2014) National Guidelines to Develop Fishery Harvest Strategies. FRDC Report – Project 2010/061. Primary Industries and Regions, South Australia, Adelaide, March.
Sumner, N.R., Williamson, P.C. and Malseed, B.E. (2002). A 12-month survey of recreational fishing in the Gascoyne bioregion of Western Australia during 1998-99. Fisheries Research Report No 139. Department of Fisheries, Western Australia.
Wise, B.S., St John, J. and Lenanton, R. (eds.) (2007). Spatial scales of exploitation among populations of demersal scalefish: Implications for management. Part 1: Stock status of the key indicator species for the demersal scalefish fishery in the West Coast Bioregion. FRDC Final Report on Project No. 2003/052. Fisheries Research Report No. 163. Department of Fisheries, Western Australia, 130 pp.
Wise et al. (in prep). A risk-based, weight of evidence approach to improve transparency and robustness of fishery stock assessment outcomes.


