FISHERIES RESEARCH REPORT NO. 132, 2002 A review of food availability, sea water characteristics and bivalve growth performance at coastal culture sites in temperate and warm temperate regions of the world Sidney A. Saxby Fisheries Research Division WA Marine Research Laboratories PO Box 20 NORTH BEACH Western Australia 6920
Transcript
FISHERIES RESEARCH REPORT NO. 132, 2002
A review of food availability, sea water characteristics and bivalve growth performance
at coastal culture sites in temperate and warm temperate regions of the world
Sidney A. Saxby
Fisheries Research DivisionWA Marine Research Laboratories
PO Box 20 NORTH BEACHWestern Australia 6920
Fisheries Research ReportTitles in the fisheries research series contain technical and scientificinformation that represents an important contribution to existing knowledge,but which may not be suitable for publication in national or internationalscientific journals.
Fisheries Research Reports may be cited as full publications. The full citation is:Saxby, S. A. A review of food availability, sea water characteristics and bivalvegrowth performance at coastal culture sites in temperate and warm temperateregions of the world, Fisheries Research Report No. 132, Department ofFisheries, Western Australia, 42p.
Numbers 1-80 in this series were issued as Reports. Numbers 81-82 wereissued as Fisheries Reports, and from number 83 the series has been issuedunder the current title.
EnquiriesDepartment of Fisheries3rd floor SGIO Atrium168-170 St George’s TerracePERTH WA 6000Telephone (08) 9482 7333Facsimile (08) 9482 7389Website: http://www.wa.gov.au/westfish/res
Published by Department of Fisheries, Perth, Western Australia. August 2002.ISSN: 1035 - 4549 ISBN: 0 7309 8462 1
An electronic copy of this report will be available at the above website whereparts may be shown in colour where this is thought to improve clarity.
Fisheries research in Western AustraliaThe Fisheries Research Division of the Department of Fisheries is based at theWestern Australian Marine Research Laboratories, P.O. Box 20, North Beach(Perth), Western Australia, 6920. The Marine Research Laboratories serve asthe centre for fisheries research in the State of Western Australia.
Research programs conducted by the Fisheries Research Division andlaboratories investigate basic fish biology, stock identity and levels,population dynamics, environmental factors, and other factors related tocommercial fisheries, recreational fisheries and aquaculture. The FisheriesResearch Division also maintains the State data base of catch and effortfisheries statistics.
The primary function of the Fisheries Research Division is to provide scientificadvice to government in the formulation of management policies fordeveloping and sustaining Western Australian fisheries.
Fisheries Research Report [Western Australia] No. 132, 2002 1
A review of food availability, sea watercharacteristics and bivalve growthperformance at coastal culture sites intemperate and warm temperate regions of the world
Sidney A. SaxbyWestern Australian Marine Research LaboratoriesPO Box 20, North Beach WA 6920
Abstract
The suitability of a coastal area for bivalve farming, as well as the density at whichbivalves can be farmed in that area, is limited by the available food supply and otherenvironmental variables. In this review, a range of successful and marginal bivalvegrowing areas in temperate and warm temperate coastal areas around the world arecharacterised. These include areas of high food and nutrient levels, such as SaldanhaBay in South Africa, and the Seto Inland Sea, Japan, through to more oligotrophicareas, typefied by parts of the South Australian coastline and the Mediterranean sea.The latter areas are likely to be most similar to prospective sites that may be availablein southernWestern Australia.
Environmental data collected at monthly or bimonthly intervals from commercialbivalve sites, and experimental sites, throughout the world, over periods extendingfrom one to four years, reveals erratic but generally high phytoplankton levels at mostsites. The presence of adequate particulate food is the consistent stimulus for goodgrowth or condition of bivalves at most of these localities. Water temperature,current speed, water depth, nutrient levels and salinity also affect growth andcondition, influencing both bivalve physiology and food availability.
Phytoplankton levels, measured as chlorophyll a (Chl a) concentrations, variedpredominantly between 1 and 10 mg/m3 at sites where bivalve growth did not appearto be greatly restricted by food availability, for example, around Vancouver Island,British Columbia, Saldanha Bay, South Africa, Tasmania, Australia, the Seto InlandSea, Japan, and the Ria de Arousa, Spain. Where food supplies and/or nutrients wereadequate, increased water temperature was associated with improved growth andcondition and increased phytoplankton abundance. At these sites, watertemperatures between 10 and 18°C promoted good mussel (Mytilus edulis, M. galloprovincialis) growth, while Pacific oysters (Crassostrea gigas) appeared togrow well between 12 and 25°C.
Salinity studies from 12 sites in Pelorus-Kenepuru Sound, Marlborough, NewZealand, showed that reduced salinity correlated with improved mussel (Pernacanaliculus) condition index (CI = 100 x steamed meat weight ÷ [live weight - shellweight]), higher nutrient levels, higher Chl a and larger quantities of particulates.These correlations revealed the input of nutrient- and organic particulate-rich freshwater into the system, promoting phytoplankton growth and food availability.Salinities consistently ranged from 29-35‰ with no noted adverse effects upongrowth, condition or survival. In contrast, prolonged salinity levels below 20‰ in the
2 Fisheries Research Report [Western Australia] No. 132, 2002
presence of abundant food, at inner regions of estuaries in British Columbia, Canada,caused restrictions in Pacific oyster growth, as measured by whole weight, shellweight, shell height and dry meat weight. Condition (dry meat weight/shell weight)remained as high as in oysters from the most productive sites, but growth wasgreatly restricted. Prolonged exposure to low salinity may have depressed all growthparameters in these oysters through reduced mineral availability and stress-induceddepressions of metabolic activity. Oysters at 4 sites within Coffin Bay, SouthAustralia, experienced salinities between 36 and 45‰ over a 5 month summer -winter trial period. Chl a levels were similar among sites, and, at levels between 0.5 and 1.5 mg/m3, appeared adequate to sustain growth. Temperatures were alsosatisfactory, decreasing from 23 to 13° C. However, tissue and shell growth weregreatly restricted at the two sites which had salinities predominantly above 40‰,while growth appeared more normal at the other two sites, where salinities laymostly between 36 and 40‰. Unfortunately, high salinity was not established in thisstudy as the cause of, or a contributing factor to, depressed growth. Furtherlaboratory investigations were needed to determine local oyster salinity tolerances.Controlled growth trials at the high salinities encountered in the bay would haveestablished if high salinity caused observed effects upon the oysters. Measurementsof phytoplankton availability, which combine water flow and phytoplankton content,were also needed. These would have established if food was depleted at the farmsites where growth was arrested.
Increased salinity and reduced temperature with depth (haloclines and thermoclines)in the outer regions of Pelorus Sound and in Saldanha Bay, correlated with increasedChl a abundance, reflecting the subsurface inputs (advection) of nutrient-rich oceanicbottom water, arising from wind-driven upwelling. These inputs were seen as themain source of nutrients at both sites, stimulating subsurface phytoplankton blooms.Saldanha Bay also received inputs of phytoplankton-rich oceanic surface water, fromthe highly-productive Banguela upwelling system, through wind-forcing. The highproductivity of Pipeclay Lagoon, Tasmania was also due to the levels ofphytoplankton in surface waters, combined with the rapid tidal flushing rate of thisshallow embayment.
The effects of stocking density (rope spacing) upon water flow rates through ropes wereexamined in Saldanha Bay. In this region, alternating longshore winds create most ofthe weak, intermittent current flow in the embayment. Even though this site shows agreat abundance of phytoplankton, and mussels are harvested twice yearly, ropes at 60 cm spacings drastically reduced current flow, and consequently food supply wasrestricted in the centre of rafts. A 50% increase in rope spacing substantially lifted ropeyields, mussel sizes and growth rates, especially in the centre of rafts. Yields improvedoverall by 10%, and the growth period was reduced by two weeks.
Concerns held by oyster growers and government authorities about the impact, onexisting farms, of new leases and enlarged farms in productive oyster localities inTasmania, led to an extensive ongoing study of water conditions, oyster clearancerates, phytoplankton levels and regeneration rates in major Tasmanian farmingestuaries and embayments. Preliminary modelling of the effects of higher oysterfarm stocking rates, in contrasting extremes of light, water dispersion andphytoplankton replacement by advection and regeneration, was undertaken forPittwater. The region is a shallow marine embayment with very uniform verticalconditions of food availability, nutrient levels, salinity and temperature. Little input offresh water and nutrient from terrigenous sources occurs, especially in summer. Themodel was able to predict that, in stable summer conditions with increased stockingrates on existing farms, or increases in number of farm leases, peak oyster feeding
rates in Pittwater would seriously deplete food resources. As a result, growth andcondition of oysters would be compromised, and the viability of existing andproposed sites affected. Other sites in Tasmania are yet to be modelled, and data arestill being gathered. Monthly Chl a readings were consistently above 1 mg/m3 at allsites while annual averages were above 2 mg/m3. Phytoplankton bloomspredominantly resulted from input of terrigenous nutrient following rainfall.Temperatures ranged between 7°C and 20°C, and salinities were predominantlybetween 30 ‰ and 35‰.
Since water conditions and food availability fluctuate widely in coastal environments,sampling the various parameters accurately and representatively can be impracticable.Food availability and water conditions also interact in complex ways in their effectsupon bivalve growth performance, and complete analysis of these effects has, insome of the studies, not occurred. Hence, the environmental data gathered may havebeen too limited or may not, in some studies, have correlated strongly with growthperformance. Nevertheless, data made available from these studies do give useful,general indications of environmental conditions under which bivalve growth willsupport commercial exploitation.
In common with other productive sites around the world, existing commercial sites inAustralasia have shown generally high phytoplankton levels combined with seasonalblooms, in favourable water conditions. It is logical that a potential Australian farmsite would need patterns of phytoplankton levels, food availability and sea waterconditions similar to, or better than, those reported at existing commercial sites.
Using the existing sites as a guide, a potential bivalve site in Western Australia may need:
• monthly Chl a levels consistently in excess of 1 mg/m3,
• a mean annual Chl a reading between 2 and 3 mg/m3,
• water temperatures ranging between 7 and 25°C ,
• adequate water exchange and current flow,
• sheltered conditions,
• a regular marine or terrestrial source of dissolved nutrient or particulate food,
• a range of salinity, and a temporal salinity regime, that does not put the animalsunder prolonged periods of physiological stress (perhaps 20‰ to 40‰ for C. gigas).
Under such conditions, bivalve growth may be commercially exploitable, and abivalve industry may be both viable and sustainable. Stocking at lower densities thanthose seen at existing commercial sites may allow farming to occur in areas wherethe above conditions of food availability cannot be met.
Fisheries Research Report [Western Australia] No. 132, 2002 3
4 Fisheries Research Report [Western Australia] No. 132, 2002
1.0 IntroductionThis review was undertaken because of commercial interest in farming of bivalves intemperate and warm temperate coastal and estuarine waters of Western Australia. Therelatively low nutrient levels and hence low phytoplankton content of much of the coastalwaters of this state may be a limiting factor for bivalve farming. Pearce et al. (2000) havereviewed chlorophyll a concentrations for many of these coastal areas. Chlorophyll aconcentration is a measure of the amount of phytoplankton in the water. Phytoplankton arethe principal food source for sedentary bivalves. However, the chlorophyll a content ofwater alone may not be sufficient to indicate site suitability for bivalve farming. Otherenvironmental factors have been identified as major determinants in the productivity ofcommercial bivalve growing areas in temperate and warm temperate waters throughout theworld. In this review, a study of the range of influences upon bivalve growth and conditionin each of the areas is undertaken to build a broad picture of the environmentalcharacteristics of successful bivalve farms. This information may provide a guide to theselection of suitable sites and the method of cultivation of bivalves in coastal regions ofsouthern Western Australia.
Sedentary bivalve molluscs are able to tolerate the wide range of water conditions whichcommonly occur in their natural estuarine or coastal habitats, however, their growth ratesand flesh condition are strongly influenced by these fluctuations in environmentalconditions. Temperature, salinity, particulate matter, food availability, current speed andwater depth have been examined in multiple- and single-locality studies, and have beenfound to exert varying degrees of influence upon their growth and condition (Brown andHartwick, 1988a; 1988b; Hickman et al., 1991; Thorarinsdottir, 1994; Pérez-Camacho et al.,1995; Stirling and Okumus 1995; Fernandez-Reiriz et al., 1996; Sara and Mazzola, 1997).These studies of Pacific oysters (Crassostrea gigas), blue mussel varieties (Mytilus edulis,M. edulis galloprovincialis), scallops (Pecten maximus and Chlamys islandica) and NewZealand mussels (Perna canaliculus) indicate that substantial variability in bivalve growthrates can occur even within a single estuary or embayment, and that the relationship betweengrowth or flesh condition and environmental parameters is complex. This reflects the widerange and rapid fluctuation that can occur in environmental variables within an area.Consequently, there is difficulty in obtaining representative environmental data to correlatewith growth. In most of the sites studied, environmental data indicate that increasedtemperature and food availability may have the strongest positive influence on bivalvegrowth and condition (Hickman et al., 1991; Thorarinsdottir, 1994; Stirling and Okumus,1995; Sara and Mazzola, 1997). Prolonged exposure to low salinity may restrict shell andtissue growth, even though high nutrient levels in these water conditions promotephytoplankton growth (Brown and Hartwick, 1988a). While shell growth is slow, fleshcondition may remain unaffected by low salinity (Brown and Hartwick, 1988b; Hickman et al., 1991). Adequate vertical mixing and current flow can promote food availability,nutrient and water exchange rates (Heasman et al., 1998; Boyd et al., 1998; Gibbs et al.,1992) while correct rope spacing is very important in maintaining food availability andtherefore growth rates of mussels suspended in rafts (Boyd et al., 1998).
As mentioned earlier, the food of bivalves is predominantly phytoplankton, which are single-celled or linked aggregations of autotrophic cells. Since the photosynthetic pigmentchlorophyll a is present in all autotrophs, levels of phytoplankton at bivalve culture sites canbe directly correlated with the amount of chlorophyll a extracted from site water samples.A sea water sample is filtered to remove particulates above a defined mesh size, say 50 µm,and the phytoplanktonic pigment, chlorophyll a, is extracted from the suspensoids in the
filtrate, using acetone. Chlorophyll a concentration is determined by the difference ofabsorption at 665 nm of an acidified and non-acidified sample (which corrects for absorptionof phaeopigments) (Hickman et al., 1991). As this is a single, “instantaneous” measurement,phytoplankton levels may be converted to phytoplankton availability, by introducing suchfactors as tidal current flow and depth readings in sample localities. Researchers have foundthat high phytoplankton levels are a stimulant to improving growth and meat condition ofbivalves (Brown and Hartwick, 1987a; 1987b; Sara and Mazzola, 1997; Heasman et al.,1998), but these animals are also able to derive nourishment from other particulate organicmatter (Hickman et al., 1991; Pérez-Camacho et al., 1995).
In selecting sites for bivalve culture, determinations of food abundance, current speed,mixing rates, temperature and salinity variations over an extended period of time wouldappear essential. It is likely that these environmental parameters will need to be similar tothose of existing commercial bivalve culture sites, for any new venture to be viable.
The purpose of this report is to describe trophic and physico-chemical culture conditions atexisting and experimental bivalve sites in different regions, with a view to providingreference information concerning the suitability of future sites for bivalve culture.Environmental conditions and details of research findings at various bivalve sites will bedescribed, and a summary of conditions tabulated for between-site comparisons ofenvironmental parameters and growth. Conclusions will suggest environmental parameterswhich may be required if an Australian bivalve site is to be sufficiently productive forcommercial farming.
2.0 Marlborough, New Zealand
2.1 Pelorus Sound
Hickman et al. (1991) determined the monthly condition index (CI = 100 x steamed meatweight ÷ [live weight - shell weight]) of green-lipped New Zealand mussels from 12commercial longline sites in the Marlborough Sounds of New Zealand. The sites had variablecurrent flows, degree of exposure and geographical position (inner, middle or outer region ofthe sound). Over two years, 6 of the 12 stations were sampled every two months for watersalinity, total particulate matter, Chl a and particulate carbon. Chl a varied considerablybetween sites, with the most seaward sites generally having the lower values (Fig 1).Seasonal patterns in Chl a across the whole area and within regions were not evident. Valuesranged between 0.3 and 3.2 mg/m3, with the highest values (above 2.0 mg/m3) restricted tothe inner region of the sounds. Particulate carbon concentration was generally in the range 50-400 mg/m3, with higher levels only at the inner stations (up to 700 mg/m3). Salinityvaried from 29-34 ‰ typically increasing between the inner and middle regions, andremaining steady in the outer regions, while water temperature variations showed a similartrend, being higher toward the inner stations in the summer and lower in the winter.
Condition index showed an annual cycle (high in autumn, winter and spring and low insummer) which varied from year to year, and a distinctive regional pattern of lowest in themost seaward positions and highest toward the upper reaches of the sound. Environmentaldata paralleled the condition index data by showing gradients along the length of the sounds,but large anomalies from regional patterns resulted from differing localised environmentalconditions, arising in embayments away from the main channel. Very little variation in
Fisheries Research Report [Western Australia] No. 132, 2002 5
6 Fisheries Research Report [Western Australia] No. 132, 2002
CI occurred between exposed and sheltered sites and the exposure ratings did not prove anadequate predictor of mussel condition, when compared with salinity, Chl a or particulatecarbon. Over the whole area, temperature and salinity were more strongly correlated with CI than food availability (Chl a, carbon and particulates). However, at lower ambient foodlevels, changes in CI strongly correlated with changes in particulate carbon, and slightly lessstrongly with Chl a. Above a food (particulate carbon) threshold of 200 mg C/m3, CI became more affected by temperature and salinity variations than by availability of food.
Figure 1. Mean monthly readings of condition index, salinity, temperature, Chl a, particulatecarbon (PC) and PC/Chl a ratio from an inner (I) and outer (O) mussel site of theMarlborough sounds in New Zealand, from Hickman et al. (1991).
0
100
200
300
400
PC
/Ch
la
Apr
83
May
83
Jun
83
Jul 8
3
Aug
83
Sep
83
Oct
83
Nov
83
Dec
83
Jan
84
Feb
84
Mar
84
Apr
84
May
84
Jun
84
Jul 8
4
Aug
84
Sep
84
Oct
84
Nov
84
Dec
84
Jan
85
Feb
85
Mar
85
Apr
85
Month
PC/Chla OuterPC/Chla Inner
0.1
1
10
100
1000
Ch
l a
&
Su
sp
en
so
ids
(mg
/m3 )
PC OuterPC Inner
Chlorophyll OuterChlorophyll Inner
20
30
40
50
60
70
CI
CI OuterCI Inner
29
30
31
32
33
34
35
Sal
init
y (‰
)
Salinity OuterSalinity Inner
10
12.5
15
17.5
20
Tem
p (
°C)
Temp OuterTemp Inner
Individually, none of the environmental variables correlated strongly with CI, and Chl ashowed the poorest correlation of all (Table 1). Stepwise discriminant analysis, however,suggested that changes in salinity and available food (as particulate carbon) were primaryfactors controlling high and low CI of the mussels. Analysis of monthly data revealed that88% of the low CI observations were associated with high salinity, while 54% of the high CI observations were associated with low salinity. If Chl a concentration was included, 82% of the low CI group was associated with a high salinity : low chlorophyll regime, while 62% of the high CI group were associated with a low salinity : high chlorophyllregime. There were marked cross-correlations between temperature, salinity and foodresource indicators which prevented a clear identification of a single environmental factordetermining CI. There was a relatively strong correlation between particulate organic carbonand Chl a (= 0.521).
Table 1. Correlation matrix (r values) for environmental variables and two mussel variables at 12 locations in the Marlborough Sounds (from Hickman et al., 1991).
While phytoplankton has been identified elsewhere as the principal food source of farmedmussels (Smaal and van Stralen, 1990; Heasman et al., 1998), supplementation by detritalorganic matter appears to be very important in the Marlborough sounds, as evidenced by thebetter correlation in this study of CI to particulate carbon than to Chl a. This study,however, was limited in its suitability for analysing the causes of variation in CI. Conditionindex provides an integrated measure of feeding and associated metabolic activity ofmussels, over a long period of time, while the environmental data represent short-term orinstantaneous measurements of several factors, each showing a different degree of temporalvariability. The authors pointed to the need to increase the frequency of site sampling, andto determine the degree of on-site variability in abiotic and food factors, includingdeterminations of current flow and phytoplankton availability around ropes, in order to moreclearly define the causes of variation in condition index in the Marlborough Sounds.
A later study (Gibbs et al., 1992) determined the availability of chlorophyll a and nutrientsin the same region, by examining on-site nutrient and Chl a flux from surface to bottom, andbetween sites in the sounds. Large nutrient and Chl a variability was evident in PelorusSound, resulting from the complex hydrodynamic regime operating on three major nutrientsources: sediment remineralisation, advection from the ocean and river inflows. Shorttemporal changes (minutes to hours) in nutrient and Chl a were caused by tides, while long-term changes (days to months) were associated with floodwater, retention times in thesystem and oceanic exchange. High nitrogen concentrations and Chl a abundance in theinner sounds were associated with rainfall, while the highest levels in the seaward (outer)region were associated with sediment remineralisation, oceanic exchange and seasonalvariations in oceanic waters in Cook Strait. Some flushing effects were evident with high
Fisheries Research Report [Western Australia] No. 132, 2002 7
8 Fisheries Research Report [Western Australia] No. 132, 2002
rainfall events, where nutrients and phytoplankton were almost completely removed from thesystem. Lowest nutrient and Chl a levels occurred in summer, associated with the lowestrainfall, and low nutrient levels evident in Cook Strait sea water. In localised embayments,separated from the main water flow, accumulation of N in the bottom water layers resultedin high concentrations of Chl a, coinciding with the halocline, which was below the levels ofmussel farms. However, periodic internal waves of the halocline may have moved thephytoplankton-rich high salinity water up to the levels of the mussel farms on occasion.Table 2 presents mean suspensoid and Chl a levels over the study period.
Table 2. Means and ranges (in parentheses) of suspensoids(in mg/m3) measured in PelorusSound, Jan. 1984 - Apr. 1985 (from Gibbs et al., 1992).
Growth, condition indices and survival of Pacific oysters (Crassostrea gigas) at 10 locationswere determined over a 14 month period (Brown and Hartwick, 1988a, 1988b). Locationswere selected along the coastline of mainland British Columbia and Vancouver Island, inexisting oyster culture areas as well as areas where environmental conditions or conflictingcoastal developments restricted commercial bivalve culture. Monthly monitoring ofexperimental sites occurred between June, 1984 and August, 1985, except in January, 1985.At each site, two age classes of cultchless oysters from the same seedstock were placed inseparate 5-tier lantern nets. Age classes (Year 0 and Year 1) had initial shell heights of 21.6mm and 45.2 mm. Approximately 165 oysters were spread evenly among the lantern tiers.Nets were submerged continuously at a depth of 1 m, extending down to 5 m.
Growth was highly variable between sites for both year classes. Final mean shell heightranged from 57 mm to 100 mm for year 0, and 69 mm to 109 mm for year 1 oysters. Siteswere divided into low, medium and high growth groups on the basis of shell height growthcurves. Measurements of growth in dry meat weight followed the same growth grouppattern. When allometric growth regressions were fitted to shell height and dry meat weightdata, oysters from the high growth sites had allometry not significantly different from thoseat low growth sites.
Between sites, water temperatures ranged from summer maxima of 17 to 21.6°C, to winterminima between 2.5 and 7°C. Salinity fluctuated seasonally, as well as varying greatlybetween sites. Sites adjacent to local rivers had reduced salinity, and prolonged periods ofsalinity below 20 ‰, especially in the spring-summer period (April - August 1985).Compared with the other bivalve sites in this report, salinities across all sites were low(usually 20 - 30 ‰). Phytoplankton blooms occurred in autumn and spring at most sites,with highest mean monthly Chl a readings around September and October. Peak monthlyChl a levels coincided with low salinity readings, indicating higher nutrient input fromincreased spring and autumn runoff. Temperature, salinity and Chl a monthly means were
Table 3. Environmental cumulative day-data and means, with summary of comparisons ofregressions of fitted to site-specific absolute and allometric growth data for Pacificoysters Crassostrea gigas at ten sites in British Columbia, Canada between July, 1984and August, 1985 (from Brown and Hartwick, 1988a).
Environmental Data Growth DataDD DS DC SH WW SW DMW DMW SWvsDMWMd Ms Mc (1984) (1985)
Trevenen Bay 5101 11735 1990 H H H H H H (1)13.1 30.2 5.12
Okover Inlet 5550 10810 1464 H H H (1) H(1,2) H H(2)14.3 27.7 3.76
Lemmens Inlet 1 5192 9063 2910 H H H(1,2) H(1,2) H H13.3 23.3 7.48
Lemmens Inlet 2 5066 9205 3645 H H H(1,2) H(1,2) H H13.0 23.6 9.37
Departure Bay 5029 8872 1273 M H H(2) H(2) M M12.9 22.8 3.27
Saanich (1 m) 5263 9919 1243 M M H(2) M M M(2)13.5 25.4 3.19
Saanich (5 m) 5073 10498 1353 M M H(2) H(2) M M(1,2)13.0 26.98 3.47
Bowen Island 4710 6841 2224 M M M H(2) M M(2)12.1 17.6 5.72
West Vancouver 4742 7502 3088 L L L L L H12.2 19.3 7.94
Keats Island 5411 6802 1329 L L L L L H13.9 17.5 3.41
High (H), medium (M) and low (L) growth groups indicate sites with significantly different growth (p<0.05). Numbers in parentheses indicate significant growth differences between some sites within growth groups. For example,shell weight growth for Departure Bay was significantly different from Trevenen Bay and Okeover Inlet but not LemmonsInlet sites, while Trevenen Bay, Okeover inlet and Lemmens Inlet sites had similar growth. DD day.degrees DS day.salinity DC day.Chl a SH Shell height WW whole weight SW shell weightDMW (1984),(1985) dry meat weight in summer (1984) and winter sections(1985) of the growth period SWvsDMW Allometric growth, shell weight vs dry meat weightMd mean temperature °C Ms mean salinity (‰) Mc mean Chl a (mg/m3)
converted to cumulative day.degrees, day.salinity and day.Chl a values, by multiplyingaverage readings between two visits, or two monthly means, by the number of daysseparating the visits. Table 3 summarises growth and environmental data from the ten sites.In high growth sites, oysters had greatest increases in shell heights and whole weights,attributed to high phytoplankton availability and suitable salinity and temperature regimes.At medium growth sites, shell height and dry meat weight was less than at high growth sites,but whole weight and shell weight was not restricted. Temperature and salinity weresuitable, but food availability may have been restricted. Growth in all body variables wasreduced at low growth sites, because periods of high food availability coincided withprolonged, sub-optimal salinity conditions (< 20 ‰). Prolonged exposure to low salinitymay have depressed both shell and meat growth in oysters through reduced mineralavailability and stress-induced depressions of metabolic activity.
Volumetric condition index (dry meat weight/internal volume, VCI) and dry weight (drymeat weight/dry shell weight, DWCI) condition indices were regarded as within the normal
Fisheries Research Report [Western Australia] No. 132, 2002 9
10 Fisheries Research Report [Western Australia] No. 132, 2002
range for Pacific oysters in this region, and higher overall than oysters cultured elsewhere.Volumetric condition index correlation coefficients ranked monthly whole weight, watertemperature, salinity and Chl a in decreasing order as factors contributing to variance in VCIdata. Variables significantly correlated with DWCI, in decreasing order of importance were:water temperature, salinity and Chl a concentration. Salinity was negatively correlated withDWCI and VCI (Table 4). The authors concluded that DWCI was a better index forevaluating the physiological status of oysters, with seasonal fluctuations of this indexfollowing trends in water temperature, salinity and food availability. A considerable amountof the total variance in both condition indices was not attributed to the environmental factorsmentioned, and the authors indicated that they may have been affected by gonadalmaturation and spawning.
Slow growing oysters from low salinity sites (<20 ‰) had DWCI equivalent to those offastest-growing oysters at high salinity sites with abundant food supply, illustrating thereduction in all growth parameters in low salinity water. Chl a levels at low salinity sitesfluctuated more than at high salinity sites, with average levels generally higher than the moresaline sites.
Table 4. Significant partial correlation coefficients of volumetric condition index and dry weightcondition index against environmental factors and monthly Pacific oyster (Crassostreagigas) weight (from Brown and Hartwick, 1988b)
Most oyster mortalities occurred in the initial 2-3 months, with year 0 oysters showing lowersurvival rates. Differences in survival between sites were not significant. Inner-facingsurfaces of dead oysters from low salinity sites had patches of extreme shell thinness andblistering, thought to be due to lack of minerals and environmental stress.
Growth rates of Pacific oysters at the better British Columbia commercial sites (80 mm/yr)are equivalent to oysters in Hinase waters, Tasmania, and Galician rias (Table 17). Incontrast, growth at the low-salinity trial sites was very slow (10 mm/yr). Althoughchlorophyll levels at the trial sites were comparable to other very productive sitesworldwide, prolonged exposure to low salinity (< 20 ‰) has restricted both shell and tissuegrowth of Pacific oysters.
4.0 Galicia, N.W. Spain
4.1 Ría de Arousa
Pérez-Camacho et al. (1995) investigated the influence of seed source, cultivation site andphytoplankton availability (measured as Chl a) upon the growth and CI of Mytilus edulisgalloprovincialis within the Ría de Arousa in Galicia, north western Spain. Mussel seed,obtained from the intertidal zone or from collector ropes, was cultivated for three months onropes suspended from three rafts located at three different sites within the estuary.
Phytoplankton availability at each of the sites was markedly different (Table 5). Seed stockoriginating from two intertidal zones (Stocks A and B) had lower growth rates than thecollector rope stock (C), probably because of the better initial condition and previousadaptation of the seed originating from the collector rope. Phytoplankton availability (asgrams Chl a/rope/hour) at the cultivation sites was measured by water Chl a content andcurrent flow:
F = Chl a x f ÷ N,
where F is grams of chlorophyll a per rope per hour, Chl a is grams of chlorophyll a percubic metre, and N is the number of ropes per metre, and f is the current flow in cubicmetres per hour.
Table 5. Current speed, water flow, chlorophyll a content, phytoplankton availability and musselgrowth of stocks derived from intertidal zones (A and B) and rope culture (C) at the threemussel sites (1, 2 and 3) within the Ría de Arousa, Spain (from Camacho et al., 1995).
Growth of stock from the two intertidal zones showed no significant differences across allsites. However, superior growth performance came from the collector rope seed (stock C) atall sites, with growth greatest at the oceanic site (site 3). This was directly related to thegreater availability of phytoplankton. Growth of collector rope seed at the other two siteswas not significantly different, despite almost 20% lower phytoplankton availability at site 1.Although particulate carbon was not measured in this study, the authors indicated thatpresence of detritus at site 1 may have been high, since it was the most landward station ofthe three, and thus a higher contribution to the food of the mussels may have been derivedfrom this source.
Fisheries Research Report [Western Australia] No. 132, 2002 11
12 Fisheries Research Report [Western Australia] No. 132, 2002
There were significant differences between the condition index of the seed stock collectedfrom each intertidal site (A and B) and the collector rope stock (C) at the beginning of theexperiment, with stock A having the lowest CI and stock C having the highest CI. At theend of three months, no significant differences in CI between stocks were evident, thereforethe readings of each stock type in each locality were pooled. However, the condition indexfor all mussels at each locality, which were not significantly different at the beginning of thetrial, showed significant improvement at sites 1 and 3, and remained the same at site 2.Once again, the authors pointed to greater availability of phytoplankton at site 3 and apossible supplementary food source from seston at site 1 for the improvements in conditionof the mussels at these sites. Over the ninety days of the experiment (April-July, spring-summer growing season), mussels grew at a rate of 6.3 - 11 mm/month, at an initial ropedensity of 2000/m. Water conditions at all sites were similar; mean temperature rangedbetween 13 and 17°C, while salinity remained at 34-35 ‰ (Table 17).
Figure 2. Mean monthly readings of Chl a in the Ria de Arousa (from Pazos et al., 1996).
Pazos et al. (1996) studied scallops (Pecten maximus), cultured by the ear-hangingtechnique, in the Ria de Arousa and examined their reproductive cycle, in relation to watertemperatures and Chl a readings. Temperatures ranged between 11 and 21°C, mean monthlyChl a values are shown in Fig 2. Spawning appeared to be stimulated by temperaturesabove 16°C in spring/summer (May-July) and the presence of a phytoplankton bloom inwinter (Feb - March), when temperatures were 12 - 13°C. Seston levels varied on a seasonalbasis, with high levels of PIM during winter, while POM remained relatively stable around 2 mg/m3.
0
2
4
6
8
Ch
l a (
mg
/m3 )
Apr
May Jun
Jul
Aug
Sep Oct
No
v
Dec
Jan
Fe
b
Mar
Apr
May Jun
Jul
Month 1990-1991
Figure 3. Mean monthly water temperatures and chlorophyll a readings, with oyster conditionindices in El Grove, Ría de Arousa, Galicia, in 1988-89 (from Ruiz et al., 1992).
Ruiz et al. (1992) examined the effect of temperature, salinity and Chl a upon the condition,reproductive activity and biochemical composition of Pacific oysters, C. gigas in suspendedculture in El Grove, Ria de Arousa, Galicia, over 16 months. Two spawning periods(June/July and October) were evident from histological studies. The first spawning eventtook place as a result of water temperatures, while the second appeared to coincide with amajor phytoplankton bloom. Data for temperature, Chl a variations and oyster condition forthe period Sept 1988 to Dec 1989 are presented in Figure 3. Condition index wasdetermined as [mean ash-free dry weight/mean dry shell weight] x 100
A Kendall matrix revealed that temperature correlated significantly with Chl a, meat dryweight, condition index and maturity index (arithmetic mean of individual gametogenicdevelopment) of oysters at this site. Chl a correlated significantly with the maturity index of
10
12
14
16
18
20
Tem
p
Sep Oct
No
v
Dec Jan
Fe
b
Mar
Apr
May Jun
Jul
Aug Sep Oct
No
v
Dec
Month
2
3
4
5
6
7
8
Co
nd
itio
n I
nd
ex
Sep Oct
No
v
Dec Jan
Fe
b
Mar
Apr
May Jun
Jul
Aug Sep Oct
No
v
Dec
0
1
2
3
4
5
6
Ch
la
(m
g/m
3 )
Sep Oct
Nov
Dec Jan
Feb
Mar
Apr
May
Jun
Jul
Aug
Sep Oct
Nov
Dec
Month 1988 - 1989
Fisheries Research Report [Western Australia] No. 132, 2002 13
14 Fisheries Research Report [Western Australia] No. 132, 2002
the oysters. The correlations and the spawning of oysters at temperatures below 16°Csupported the authors hypothesis that spawning in C. gigas may be induced byphytoplanktonic blooms as well as temperature.
4.2 Ria Sada
In a study of mussels (Mytilus edulis galloprovincialis ) cultured in two adjacent zones ofthe Ria Sada (Galicia), Fernandez-Reiriz et al. (1996) found a close correlation betweenchlorophyll a abundance and growth of mussels. Both mussel sites were on the seawardverge of the southern edge of the Ria Sada, and 3.2 km apart. Mussels were cultured fromseed size to “first split” (initial mean size 28 mm, reaching 42 mm at the inner site) over thewinter period, November 1992 to April 1993. Mussels exhibited faster growth in the innerzone site, which had consistently higher Chl a levels throughout the year. Mean annual Chl a values were 1.763 mg/m3 and 1.066 mg/m3 for each site, while the ranges were from0 to 2.5 mg/m3 at the outer site and 0 to 8 mg/m3 at the inner site. No measurements weremade of suspended particulates, salinity or current flow at the sites. Growth rates for themussels, measured as allometric growth rates (Y = dry meat weight, X = size) were:
Y = 0.00264 X3.062 (r = 0.996, p < 0.0001, n = 10) at the inner site
Y = 0.00668 X2.782 (r = 0.998, p < 0.0001, n = 10) at the outer site
5.0 Mediterranean Region
5.1 Gulf of Castellammare
Crassostrea gigas, cultured experimentally on longlines in the Gulf of Castellammare(Northern Sicily) at depths of 7 and 13 m, grew at similar allometric rates in almost identicalphytoplankton concentrations (Sarà and Mazzola, 1997). The lower oysters were slightlyfaster growing (not significantly), and the authors linked slightly better growth at greaterdepth to the greater abundance of particulate organic matter (POM) ≈ available (Table 6).The allometric growth rates§ were very similar at -7 and -13m:
Y = 7.54x10-6 X2.45 (r = 0.96, p < 0.01, n = 652) at -7 m
Y = 7.54x10-6 X2.48 (r = 0.96, p < 0.01, n = 692) at -13 m
≈ From the stated means and s.d. (Table 6), it is difficult to agree with the authors’calculations of a P (probability) of 0.005 that the two POM means are similar. Aswell, the significance levels of differences in pH, DO, temperature and Chl a /POMbetween -7m and -13m seem incorrect. However, the data were not normal, andmatrices of data were transformed using Spearman Ranks.
§ Published equations were DW = -11.80SL2.45, and DW = -11.80SL2.48, coefficients inthe text were derived from the published graph by interpolation.
The low chlorophyll values (0.04 and 0.05 mg/m3 at each depth) and small proportion of Chl a to POM (less than 3% over the year) of the area characterised the gulf as oligotrophic.Significant differences in POM and POM energy content between the two depths werereported to have reached their greatest magnitude during late summer and early autumn, but tabulated monthly values showed little consistent variation between the two depths. The authors reported visual sightings of a greater turbidity at -13 m, and an increase in water POM gross energy (GE) content at this level, which appear to indicate a greateravailability of non-phytoplanktonic POM at the -13 m level during the winter. Although theauthors have indicated that there were differences in the water parameters at the two levels,their tabulated data do not reflect this. Similarly, growth at the two levels appear almostidentical. Figure 4 displays the mean monthly Chl a , POM GE and temperature data for thetwo depths.
Table 6. Mean (± s.d.) physico-chemical and trophic parameters and the significance levels of U-tests between the means for each depth (from Sarà and Mazzola, 1997).
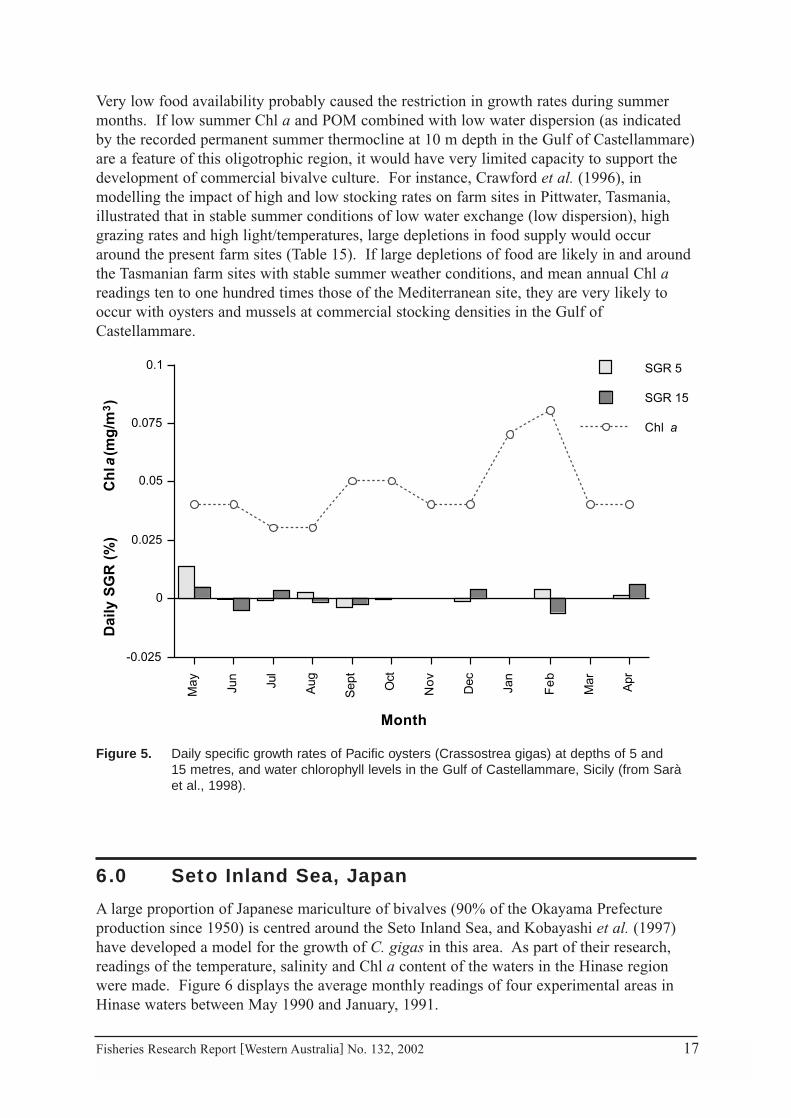
A subsequent study by Sarà et al. (1998) of mussels (Mytilus galloprovincialis) on longlinesin the same area was carried out over the period, May 1994 to April 1995. Juvenile musselsgrew approximately 30 mm in the year (11.2 to ~40 mm), while sub-adults in the sameculture conditions grew about 20 mm, to market size (~40 mm to ≥ 60 mm). Chl a rangedbetween 0.03 and 0.08 mg/m3, with a mean of 0.05 mg/m3 during the period. Daily specificgrowth rates were determined over periods of a month in summer and 2 months in winter.Many unpredictable daily specific growth rate fluctuations (in both length and weight) ofboth juvenile and sub-adult populations occurred over the trial period, but lowest overallgrowth rates were evident during the summer/autumn (Fig 5). Mussel flesh conditionreduced (and hence daily SGR’s, based on mean ash-free dry weight, were negative) duringthese periods where food availability, or proportion of food to suspended inorganic sedimentwere lowest, and may have been related on one occasion to a spawning event in the adultpopulation. The authors noted that this region may be able to support growth of mussels, butthat recruitment did not occur, probably because of the area’s oligotrophic nature. Theyproposed that the site could support longline culture of mussels, transferred from otherculture sites.
Fisheries Research Report [Western Australia] No. 132, 2002 15
16 Fisheries Research Report [Western Australia] No. 132, 2002
Figure 4. Mean monthly temperature, particulate organic matter gross energy (POM GE) andchlorophyll a readings at depths of 7 and 13 m in the Gulf of Castellammare (from Saràand Mazzola, 1997).
Physico-chemical conditions in the Gulf of Castellammare appear to be suitable for oystergrowth, but the limited availability of labile particulates and low Chl a, in comparison withother European, Japanese and New Zealand sites (which generally average above 1 mg/m3),do not indicate that this is a productive bivalve culture region. Oysters and mussels grew atotal of ~30 mm over a year, but with frequent losses in mussel flesh condition (Sarà et al.,1998) and very limited oyster growth (from 12 to 16 mm) in the autumn-summer period(May-Nov) (Sarà and Mazzola, 1997). Oysters grew from 16 to 42 mm, and mussels hadmore months of rapid growth and improving flesh condition, in the winter/spring months(Nov-Apr).
10
15
20
25
30
Tem
per
atu
re °
C
May Jun
Jul
Aug
Sep
t
Oct
No
v
Dec Jan
Fe
b
Mar
Apr
MONTH
Temp -13 mTemp -7 m
0
0.02
0.04
0.06
0.08
Ch
l a (
mg
/m3)
May Jun
Jul
Aug
Sep
t
Oct
No
v
Dec Jan
Fe
b
Mar
Apr
MONTH
Data #1
Chl a -13 m
Chl a -7 m
4
5
6
7
8
9
PO
M G
E
(kca
l/g
)
May
Jun
Jul
Aug
Sep
t
Oct
No
v
Dec
Jan
Fe
b
Mar
Apr
Month 1992-1993
Data #1
POM GE -13 m
POM GE -7 m
Very low food availability probably caused the restriction in growth rates during summermonths. If low summer Chl a and POM combined with low water dispersion (as indicatedby the recorded permanent summer thermocline at 10 m depth in the Gulf of Castellammare)are a feature of this oligotrophic region, it would have very limited capacity to support thedevelopment of commercial bivalve culture. For instance, Crawford et al. (1996), inmodelling the impact of high and low stocking rates on farm sites in Pittwater, Tasmania,illustrated that in stable summer conditions of low water exchange (low dispersion), highgrazing rates and high light/temperatures, large depletions in food supply would occuraround the present farm sites (Table 15). If large depletions of food are likely in and aroundthe Tasmanian farm sites with stable summer weather conditions, and mean annual Chl areadings ten to one hundred times those of the Mediterranean site, they are very likely tooccur with oysters and mussels at commercial stocking densities in the Gulf ofCastellammare.
Figure 5. Daily specific growth rates of Pacific oysters (Crassostrea gigas) at depths of 5 and 15 metres, and water chlorophyll levels in the Gulf of Castellammare, Sicily (from Sarà et al., 1998).
6.0 Seto Inland Sea, Japan
A large proportion of Japanese mariculture of bivalves (90% of the Okayama Prefectureproduction since 1950) is centred around the Seto Inland Sea, and Kobayashi et al. (1997)have developed a model for the growth of C. gigas in this area. As part of their research,readings of the temperature, salinity and Chl a content of the waters in the Hinase regionwere made. Figure 6 displays the average monthly readings of four experimental areas inHinase waters between May 1990 and January, 1991.
-0.025
0
0.025
0.05
0.075
0.1
Dai
ly S
GR
(%
)
C
hl a
(m
g/m
3)
May Jun
Jul
Aug
Sep
t
Oct
No
v
Dec
Jan
Fe
b
Mar
Apr
Month
Chl a
SGR 15
SGR 5
Fisheries Research Report [Western Australia] No. 132, 2002 17
18 Fisheries Research Report [Western Australia] No. 132, 2002
Figure 6. Mean (± s.d.) monthly readings of Chl a, temperature and salinity for Hinase waters inthe Seto Inland Sea, Japan (from Kobayashi et al., 1997).
Shell height and dry flesh weight of oysters were determined, giving an allometric growthrate of:
Y = 0.046 X2.65
Oysters grew from 27 mm to 93 mm between May 1990 and January 1991, with two thirdsof the growth occurring between June and September. Increase in live wet weight wasalmost linear over that period. Oysters were able to grow a total of 90 mm in an 18 monthperiod (Aug 1990 - Jan 1991), and growth appears to be faster than for C. gigas atTasmanian and Galician sites (Table 17).
While food availability of Hinase waters, as indicated by mean Chl a content, is similar to
5
10
15
20
25
30
Tem
per
atu
re °
C
May
June
July
Aug
Sep
t
Oct
No
v
Dec Jan
MONTH
0
5
10
15
Ch
loro
ph
yll a
(m
g/m
3)
May
June
July
Aug
Sep
t
Oct
No
v
Dec Jan
Month 1990-91
Data #1
27
28
29
30
31
32
33
Sal
init
y ‰
May
June
July
Aug
Sep
t
Oct
No
v
Dec Jan
MONTH
Fisheries Research Report [Western Australia] No. 132, 2002 19
the mussel and oyster sites in Tasmania, New Zealand and the Ria de Sada, higher summertemperatures, coupled with good summer phytoplankton availability may contributesubstantially to more rapid annual growth rates in the Seto Inland Sea.
7.0 Saldanha Bay, South West Africa
Most of the mussel (Mytilus galloprovincialis) culture in South Africa occurs in SaldanhaBay, a semi-enclosed embayment on the south west coast. Cold water, nutrients andphytoplankton periodically enter the bay from the highly-productive, wind-driven Banguelaupwelling system. Growth rates of mussels in this embayment are extremely rapid; shelllengths increase an average of 1.5 mm/week during autumn/winter, and 2.5 mm/week duringspring/summer growth. Rafts supporting ropes at 60-90 cm spacing (approx 1.5 - 2 ropes/m2)produce two harvests a year (Heasman et al., 1998), contributing to an overall annual marketproduction of more than 2500 tonnes from less than 3 ha of rafts (Boyd and Heasman,1998). In one spring-autumn growing period, mean single rope production from adjacentrafts, with rope spacings at 60 and 90 cm, were 252 kg and 307 kg, respectively, contributingto a small raft (15 x 11 m) marketable production of 26.1 to 28.6 t over the period (Heasmanet al., 1998).
Pitcher and Calder (1998) have determined phytoplankton availability throughout the bay, atdifferent depths, and over time. Monthly mean concentrations of Chl a were calculated fromdaily means, derived from water column integrals of Chl a at a monitoring buoy, stationedadjacent to mussel rafts (Fig 7). A mean water column Chl a reading over the samplingperiod (winter 1993 - autumn 1995) was determined as 8.62 mg/m3, with a mean daily rateof primary production of 3.4 g C/m2/d (Pitcher and Calder, 1998). A general increase inbiomass occurred during the upwelling season, with highest Chl a readings at the end of theseason. During the September to December period, mean Chl a concentrations variedbetween 4 and 8 mg/m3, and for the upwelling period between January and June,concentrations ranged between 10 and 14 mg/m3. Periodic incursions of nutrient-richsubsurface ocean water caused prominent thermoclines and phytoplanktonic biomassconcentrations in the zone of mixing, at depths between 3 and 10 metres (Pitcher and Calder,1998). High wind energy along the bay, diurnal tidal mixing and barotrophic shelf wavespassing along the coast, combined to produce highly dynamic water conditions in the bay.Short-term thermoclines were dissipated predominantly by wind, and some tide-forcedmixing. Mussels were cultured on a site which is sheltered from the ocean but exposed toprevailing longshore winds. Temperature conditions in the bay appeared ideal for musselculture. Embayment water (surface water) ranged between 14 and 19°C over the year, whilewind-forced oceanic upwellings periodically introduced subsurface water at 10 - 12°C(Pitcher and Calder, 1998).
Subsurface productivity determined from Chl a readings at depth often approached thetheoretical maximum of 25 mg C/m2 during periods of spring blooms of diatoms (Pitcherand Calder, 1998). A measure of the total productivity of the water column down to the 1%light level (photic depth) was made, using Secchi depths and Chl a readings. Productivityreadings were undertaken on three alternate days, in winter, spring/summer and autumn,between 1993 and 1995. Table 7 presents a set of Secchi disc depths, integral Chl areadings, measures of primary productivity and productivity normalised to biomass, of thewater column determined from a station adjacent to the mussel farm.
20 Fisheries Research Report [Western Australia] No. 132, 2002
Table 7. Productivity station photic depth and photic zone integrals of Chl a, primary productivityand productivity normalised to biomass, adjacent to a mussel farm in Saldanha Bay,South Africa (from Pitcher and Calder, 1998).
Date Photic Depth Integral Chl a Productivity Biomass Productivity(m) (mg/m2) (mg C/m2/h) (mg C/mg Chl a/h)
July 31, 1993 9.5 10.8 66.3 6.2
Aug 2, 1993 9.5 23.3 106.9 4.6
Aug 4, 1993 6.8 14.9 54.5 3.7
Dec 8, 1993 7.6 60.6 458.2 7.6
Dec 10 1993 7.0 22.0 339.1 15.4
Dec 13, 1993 9.8 38.0 343.7 9.0
Mar 13, 1994 6.2 77.1 427.6 5.6
Mar 15, 1994 8.1 65.7 495.1 7.5
Mar 17, 1994 7.5 104.1 626.6 6.0
Aug 6, 1994 9.2 48.1 183.5 3.8
Aug 8, 1994 12.1 83.2 259.6 3.1
Aug 10, 1994 9.2 161.0 495.9 3.1
Nov 23, 1994 5.4 45.2 285.5 6.3
Nov 28, 1994 6.8 48.4 404.2 8.4
Nov 30, 1994 6.0 60.4 492.8 8.2
Mar 17, 1995 7.5 109.9 237.6 2.2
Mar 19, 1995 7.5 123.5 670.7 5.4
Mar 22, 1995 7.5 94.8 603.9 6.4
Although the waters in Saldanha Bay are extremely productive, and Chl a contents arecommonly 5 to 10 times higher than other mussel sites around the world, research has shownthat the growth of mussels on longlines hung from floating rafts was still limited at high ropedensity . Wind-forced, variable, surface ambient water flow in the bay (~5 - 20 cm/s,alternating in opposite directions) was greatly reduced between the mussel ropes, particularlybetween ropes spaced at 60 cm. Simultaneous measurements of fastest ambient andthrough-rope flow revealed as much as 85% of the flow reduced by the presence of rafts andthe 60 cm-spaced ropes, while 90 cm-spaced ropes reduced flow by around 70% (Boyd andHeasman, 1998). Figure 8 shows the derived regressions of current flows through the tworope spaces, compared with the unrestricted ambient flow. Studies of food extraction ratesand growth rate of the mussels at the two rope spacings revealed increasing food depletionas mussels grew larger with both spacings, and progressively-greater depletions of food withreduced growth rates on the 60 cm-spaced ropes as the mussels aged, particularly in thecentre of the raft. Condition index of mussels in the centres of rafts with 60 cm-spacedropes was reduced, though not significantly, and mean large mussel (> 83 mm) productionon 90 cm-spaced ropes was more than double that of 60 cm-spaced ropes. Improvements ingrowth rates and medium-large mussel yields at the 90 cm spacing were sufficient toincrease production from the rafts by 9%, and to shorten the between-harvest growth periodsby 2-4 weeks (Heasman et al., 1998).
Figure 7. Mean monthly Chl a (1993-1994) calculated from daily means, derived from watercolumn integrals, at the monitoring station adjacent to the mussel farm, Saldanha Bay,South Africa (from Pitcher and Calder, 1998).
Figure 8. Regressions of current flow data between the 60 and 90 cm-spaced ropes of raft-cultured mussels in Saldanha Bay, South Africa (from Boyd and Heasman, 1998).
65432100
1
2
3
4
5
6
60 cm Rope Spacing
90 cm Rope Spacing
Ambient Water Speed (cm/s)
Sp
eed
in
Raf
t (c
m/s
) Ambient = no retardation
0
5
10
15
20
25
Ch
loro
ph
yll a
(m
g/m
3)
Jul
Aug
Sep Oct
Nov
Dec
Jan
Feb
Ma
r
Apr
Ma
y
Jun
Jul
Aug
Sep
Oct
Nov
Dec
Month 1993 -1994
Fisheries Research Report [Western Australia] No. 132, 2002 21
22 Fisheries Research Report [Western Australia] No. 132, 2002
8.0 Eastern Scheldt Estuary, SW Netherlands
The Eastern Schelt Estuary is a prolific mussel culture region, with a standing stock of about4000 t (ash-free d.w.), of which 95% are cultured. Mussels are cultured on bottom plots onthe slopes of tidal channels and on intertidal flats, over a total area of 1900 ha (Smaal andvan Stralen, 1990). Most of the culture plots are on the western and central parts of theestuary.
Research in the 4 years prior to construction of a storm-surge barrier at the mouth of theestuary showed that mussel condition correlated strongly with average annual primaryproduction, but not with Chl a concentrations (Smaal and van Stralen, 1990). Inflow ofwater from the North Sea appeared to provide additional food for mussels in the westernregion, contributing to their improved condition and growth, compared with central regionmussels. After the barrier was built, no differences were observed between mussels in thewestern or central part of the estuary. The authors suggested from preliminary evidence thata lack of water exchange between the western region and the North Sea after the barrier hadbeen built would reduce western mussel condition by reducing the import of food, andincreasing silt sedimentation.
As part of this study, annual means of Chl a, suspended particulate matter (SPM), particulateorganic carbon (POC) and primary production (PP) were determined weekly at positions 5 cm above mussel beds, for the western and central parts of the estuary, and they arepresented in Table 8.
Table 8. Mean annual suspensoid concentrations in the western (W) and central regions (C) ofthe Eastern Scheldt estuary, for the years 1981-1984, and 1987 (from Smaal and vanStralen, 1990).
Correlation coefficients of mussel condition with primary production and Chl aconcentration were determined and are presented in Table 9. There was little correlationbetween Chl a and mussel condition at any of the sites. However, the authors emphasisedthat in years with high primary production, rapid turnover of phytoplankton by filter feederswould make Chl a readings much lower than the productivity of the system would suggest.The Chl a readings may have reflected the dynamic equilibrium between production andconsumption in the areas tested. This view is supported by the evidence from Saldanha Bay,which revealed that Chl a concentrations in water passing through mussel rafts were reducedby an average of 80%, with greatest depletions of Chl a at positions nearest the ropes(Heasman et al., 1998). A strong correlation existed between the growth of mussels andtheir condition in both regions of the estuary (r = 0.89). Also, significant correlations existedbetween primary production of each region and mussel condition over the five years oftesting, indicating a direct link between primary production and growth.
Table 9. Correlation coefficients of mussel condition with primary production and Chl aconcentration, at stations in the two regions of the Eastern Scheldt estuary (from Smaaland van Stralen, 1990).
Region/Site Mussel Condition/ Mussel Condition/Primary Production Chlorophyll a
West 1/2 0.95* 0.24
West 3 0.36 0.002
Central 1 0.45 0.29
Central 2 0.91* 0.41
Central 3 0.74 0.27
* = p < 0.05
9.0 North Inlet, South Carolina, USA
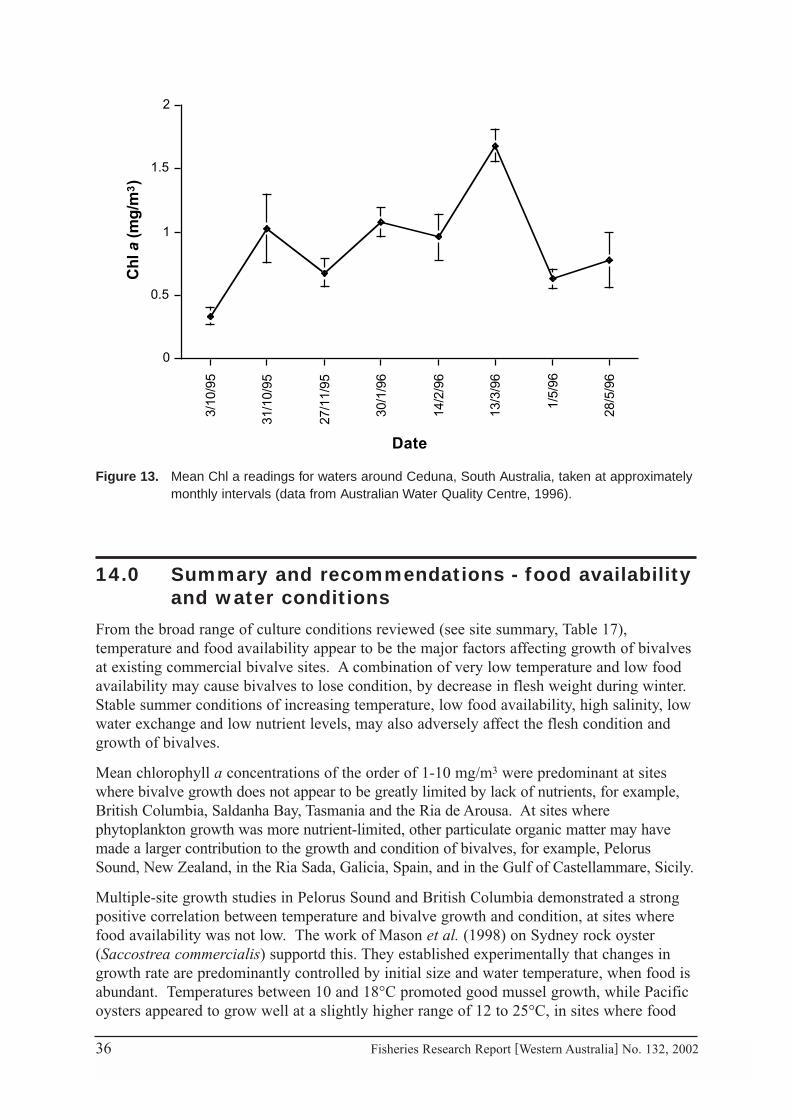
Dame and Libes (1993) determined the summer nutrient and Chl a levels in six tidal creeksdraining the same upland area and flowing into North Inlet, South Carolina, before and afterremoving oyster beds in three of them. Oyster (Crassostrea virginica) biomass wascalibrated to the volume of water in each creek. Oyster reefs were normalised with abiomass of 250 g dry body/m2. Analyses for 30 days prior to the removal of oysters showedthe creeks to be biogeochemically similar. Once oysters were removed, readings ofenvironmental parameters were taken daily for 60 consecutive days. After removal ofoysters, total nitrogen, ammonium, total phosphorus and total dissolved phosphorus weresignificantly different between the creeks, while concentrations of other parameters,including Chl a, were not. Mean concentrations of environmental parameters are presentedin Table 10.
Table 10. Mean concentrations of materials in tidal creeks during pretest (1 June - 30 June, 1989)and experimental manipulation (1 Jul- 30 Aug, 1989), for creeks with and without oysters(from Dame and Libes, 1993). Nutrient units are mg N/m3 and mg P/m3.
Fisheries Research Report [Western Australia] No. 132, 2002 23
24 Fisheries Research Report [Western Australia] No. 132, 2002
The significant differences between the creeks with respect to inorganic nitrogen andphosphorus were interpreted as demonstrating that oyster excretion can, and does, influencethe nutrient content of tidal creek water. Growth of phytoplankton in the creek was assumedto be nitrogen-limited, since the N:P ratio was much less than the Redfield-Richards ratio of16:1 (Howarth, 1988).
The authors postulated that the higher levels of inorganic nutrients in creeks with oysterswould have caused an increase in phytoplankton levels, which served as food for the oysters,thereby resulting in an increase in oyster biomass while phytoplankton levels did not change.Thus, the oysters may have acted to hold nutrients in the estuarine environment, by creatinga positive feedback loop, where nutrients are cycled between phytoplankton and oysters.Rapid flushing rates would otherwise remove dissolved nutrients from the system within afew days, resulting in nutrient limitations for bivalves in the area.
10.0 Marine Lochs, Scotland
The differences in water conditions and growth and production of mussels (Mytilus edulis)were examined over two years (May 1990 - May 1992) in Lochs Leven and Etive (Stirlingand Okumus, 1995). Mussels were suspended from longlines attached to rafts, and fromsalmon cages in each loch. Water temperatures showed a pronounced seasonal cycle, andgrowth was restricted to the months May to October. Reductions in wet meat weightoccurred in all localities during the winter. Mussels lost more weight at the mussel sites thanat the salmon farms. Particulate organic matter (POM) and Chl a were higher adjacent tosalmon farms, POM significantly so in Loch Etive. Slightly higher temperatures and greaterphytoplankton availability may have produced significantly greater annual length increasesin Loch Etive than for mussels cultured in Loch Leven. Growth at shellfish farms was notconsistently lower than growth at salmon farms. A multiple regression analysis of the effectsof environmental factors on shell length increment gave significant coefficients for watertemperature and Chl a, together accounting for 67-88% of the total variance. Non-algalPOM had a significant effect upon shell length increments in Loch Etive in 1990-91 only,accounting for 6% of the variance. The differences in performance between salmon andshellfish farms in Loch Etive may have resulted from the utilisation of higher organic matterconcentrations at salmon farms. Means for the different sites are presented in Table 11.
Table 11. Means of monthly values of environmental parameters at mussel (M) and salmon (S)sites in Loch Etive (E) and Loch Leven (L), May 1990 - 1992 (from Stirling and Okumus1995).
EM ES1 ES2 LS LM
Temperature (°C) 10.8 10.9 10.6 10.5 10.5
Salinity (‰) 22.2 22.5 30.8 25.7 28.8
Seston (mg/l) 5.0 6.6 6.9 7.1 7.6
POM (mg/l) 2.2 3.1 3.3 3.3 3.6
Chl a (mg/m3) 1.78 1.80 1.75 1.10 1.51
POM/Chla 1236 1722 1886 3000 2384
11.0 Hvalfjordur, Iceland
Thorarinsdottir (1996) examined the gonad development, larval settlement and growth of M. edulis in suspended culture in Hvalfjordur during 1986/87. The growth season extended from March to October, with spawnings coinciding with elevated June/Julytemperatures of 10 -12°C. Gonad redevelopment took place during the winter, under lowtemperature conditions and lack of phytoplanktonic food. Growth was ~25 mm/y over thetwo years required for mussels to reach market size. Growth of suspended mussels wasmore rapid than those in natural mussel beds. Fig 9 displays the temperature and Chl a datafor the location.
Figure 9. Mean monthly readings of temperature and Chl a in Hvalfjordur, south west Iceland(from Trorarinsdottir 1996).
12.0 Tasmania, Australia.
The rapid expansion of intertidal and subtidal Pacific oyster (C. gigas) farming in Tasmaniain the late 1980s raised concerns from the farming industry that too many oysters were beingplaced in the same growing areas, and that production levels were not sustainable. At thesame time, large numbers of requests for new leases were being submitted to the fisheries
0
2.5
5
7.5
10
12.5
Tem
p °
C
Jun
Jul
Aug Sep Oct
Nov Dec
Jan
Feb
Mar
Apr
May Jun
Jul
Aug Sep
0
1
2
3
Ch
l a
(mg
/m3)
Jun
Jul
Aug
Sep Oct
No
v
Dec
Jan
Fe
b
Mar
Apr
May Jun
Jul
Aug
Sep
Month
Fisheries Research Report [Western Australia] No. 132, 2002 25
26 Fisheries Research Report [Western Australia] No. 132, 2002
regulating authority. Consequently, there was need for information to determine themaximum sustainable number of farms, and densities of oysters that would maximisesustainable yields from each growing area. In response to this need, Crawford et al. (1995)sought to assess oyster production in relation to environmental conditions in five oystergrowing areas, Pittwater, Pipeclay Lagoon, Little Swanport, Georges Bay and Simpson’sBay. Some sites were studied in more detail and for longer periods than others.
The factors used in the predictive model to estimate carrying capacities of growing areas were:
• the amount of oyster food available,
• rate of replenishment of the food and
• the quantity of food consumed by the oysters.
Information on environmental parameters which affected the growth rates of oysters, thetransport of food and the regeneration rate of oyster food, such as light levels, temperatureand nutrient concentrations were also considered important. Data were collected monthly ontemperature, salinity, Chl a, nitrate/nitrite, silicate and phosphate concentrations at severalsites in the growing areas. Water movements were determined for each growing area toprovide information on the rate of replenishment of food supplies, and a model wasdeveloped to estimate the flow, velocity and flushing rate at different tidal heights. Oysterclearance rates (incorporating rate of food consumption and assimilation efficiency) wereinvestigated at Pipeclay Lagoon and Pittwater. Oysters were placed in grazing chambersadjacent to commercial racks, and feeding rates were determined by the difference betweenfood particles in the influent and the effluent water. Initially, direct cell counts were used,but later in the project, TPM, POM and PIM were determined and POM used to quantifyfeeding rate.
Formulae used to determine the feeding rate and assimilation efficiency were:
Feeding Rate from cell counts (0.2 - 20 µm)
FeR = V([No cells in - No cells out] ÷ No cells in),
where No cells in is the number of cells/l in the influent water, No cells out is thenumber of cells/l in the effluent water, V is the mean flow rate in l/hr and FeR is the feedingrate in cells/hr.
Feeding Rates using POM were calculated using a similar formula,
FR = V ([Pin-Pout] ÷ Pin)
where Pin is mean POM concentration (mg/l) of influent water, and Pout is the meanPOM concentration (mg/l) of the effluent water.
Assimilation efficiency (AE),
AE = 100([F - E] ÷ [1-E]F)
where F = weight POM ÷ weight TPM of food, E = weight POM÷ weight TPM of faeces.Any assimilation or release of dissolved organic matter was not included in the analysis.
12.1 Computer model
The EcoS Version 2 hydrodynamic simulation shell (Institute of Marine EnvironmentalResearch, Plymouth UK, and UK National Rivers Authority) was used as a basis to developthe computer model. It is a one-dimensional numerical model, where the body of waterunder study is divided into axial segments of equal length, up to a maximum of 50 segments.All quantities of interest are taken as cross-sectional averages for each segment. Variation ofthe quantity with depth (cross section of axial segment) is assumed to be non-significant, andmeasurement of temperature and salinity profiles with depth confirmed this at Pittwater.When the report was written, a preliminary model had only been developed for Pittwater,and data collection at the various sites was continuing. Tidal heights were not consistentlyrecorded due to unreliable data loggers, so the heights for Hobart (~20 km away) wereentered into the model.
12.2 Environmental variables
Temperatures showed a typical annual pattern (Fig 10), although summer temperatures in1993 were higher than the other two years. Salinities in Pittwater were higher than marinelevels, especially toward the upper reaches of the estuary, during most of the year.Occasional outflows of fresh water occurred during some winter and spring months over thestudy period, and salinities were then reduced at the inmost stations.
Chl a levels were generally between 1 and 4 mg/m3, apart from a peak in Feb 1992, andsummer to winter 1994. The upper reaches of Pittwater tended to have higher Chl a levelsthan the lower estuary and marine station. No trends were evident over time. Nitrate levelswere considered to be generally low, ranging below 10 mg/m3 except for peaks at somestations in Aug-Sept 1991 and Feb-Mar 1992. Phosphate levels were between the range 5-15 mg/m3, with no clear patterns or trends between the stations, except that the marinestation had higher phosphate readings than all estuarine stations in the first 12 months of thestudy. Silicate readings varied unpredictably between stations, apart from the fact that theestuarine readings were generally higher than at the marine station.
The other sites in Tasmania showed Chl a readings which were similar to Pittwater, with anoverall range between 1 and 4 mg/m3, and occasional peaks reaching 7 or 8 mg/m3, usuallyin the autumn months. No temporal or spatial trends were evident. Salinity at the varioussites generally ranged between 30 and 36 ‰, with some highly reduced readings at LittleSwanport showing outflows of fresh water over 1 - 3 monthly periods. Salinities in GeorgesBay and Little Swanport were greatest at the marine sampling stations and least in theinmost regions of the estuaries, reflecting fresh water inflow, while Pittwater and Pipeclaylagoon had elevated salinities at their inmost sites, indicating substantial water loss throughevaporation and low flushing rates. Seasonal trends in temperature in all the locations wereevident, ranging between summer-autumn highs of ~18 - 20°C and winter lows of ~6 - 7°C.Georges Bay had a smaller range in temperature (10.2 - 18.5°C) than the other sites, withPittwater and Pipeclay Lagoon having the greatest range (6.5 - 21°C). Georges Bay alsoshowed the greatest variation in temperatures between sample sites. Nitrate + nitriteconcentrations were generally around 10 mg/m3 at all sites, with some irregularly high peakscoinciding with, or immediately preceding high Chl a readings.
Fisheries Research Report [Western Australia] No. 132, 2002 27
28 Fisheries Research Report [Western Australia] No. 132, 2002
Figure 10. Mean monthly temperature, salinity and chlorophyll a readings from Pittwater (PW),Pipeclay Lagoon (PL), Little Swanport (LS), Georges Bay (GB) and Simpson’s Bay (SB).(Data from Crawford et al., 1996)
5
10152025
Temp (°C)
Sep 91
Oct 91
Nov 91
Dec 91
Jan 92
Feb 92
Mar 92
Apr 92
May 92
Jul 92
Aug 92
Aug 92
Sep 92
Nov 92
Dec 92
Dec 92
Jan 93
Feb 93
Mar 93
Apr 93
May 93
Jun 93
Jul 93
Aug 93
Sep 93
Oct 93
Nov 93
Dec 93
Jan 94
Feb 94
Mar 94
Apr 94
May 94
June 94
Aug 94
Sep 94
Oct 94
Dat
e
5
10152025303540
Salinity (‰)
SB
GB
LSPL
PW
02468
10
Chl a (mg/m3)
12.3 Primary productivity and production between sites
As part of the modelling study, measures of primary productivity were determined at twopositions (X and Y) in Pittwater and Pipeclay Lagoon, on 5 occasions. Estimations ofprimary production were made using a light/dark oxygen production method, with theassumption of vertical light and phytoplankton uniformity throughout the water column(maximum depth ~8 metres, oyster sites generally ~ 2 - 4 m). The results are presented inTable 12.
Table 12. Primary production at Pittwater and Pipeclay Lagoon (from Crawford et al., 1996)
Location Date Daylight Hours Daily Solar Radiation Primary Production*(sunrise-sunset) (W/m2) Site X Site Y
Pipeclay 30/1/95 14h 20 mins 25054 205.5 271.0
Lagoon 23/5/95 9 h 14589 136.5 676.7
Pittwater 4/4/95 11 h 19919 243.7 425.1
24/5/95 9 h 8258 309.8 506.2
22/6/95 9 h 10316 118.3 348.1
* mg C fixed/m3/day
The allometric relationship for oyster shell length and dry tissue weight for Pipeclay Lagoonoysters was determined as:
ln(L) = 0.39 x ln(TW) + 4.00, (r2 = 0.97), or, in the format of this report,
Y = 0.01832 X2.564
where L (X) is shell length in mm and TW (Y) is tissue dry weight in g.
This growth rate is slightly less than oysters in Hinase waters, and more rapid than theoysters cultured in the Gulf of Castellammare.
A comparison of the production of oysters from each of the growing areas shows thatPipeclay Lagoon is clearly the most productive of the four developed sites (Table 13), andthe authors pointed to its shallowness and rapid flushing rate (1.4 tidal cycles) as the reasonsfor its high productivity. No nutrient input reaches Pipeclay Lagoon from terrigenoussources, so the high productivity must be due to the rapid flushing rate, and consequentreplenishment of available food.
Table 13. Production of oysters from the five growing areas in Tasmania (from Crawford et al., 1996).
Pittwater Pipeclay Lagoon Georges Bay Little Swanport Simpson’s Bay
Production 52 170 108 43 (site not developed)(x1000 oysters/ha)
Fisheries Research Report [Western Australia] No. 132, 2002 29
30 Fisheries Research Report [Western Australia] No. 132, 2002
12.4 Predictive modelling
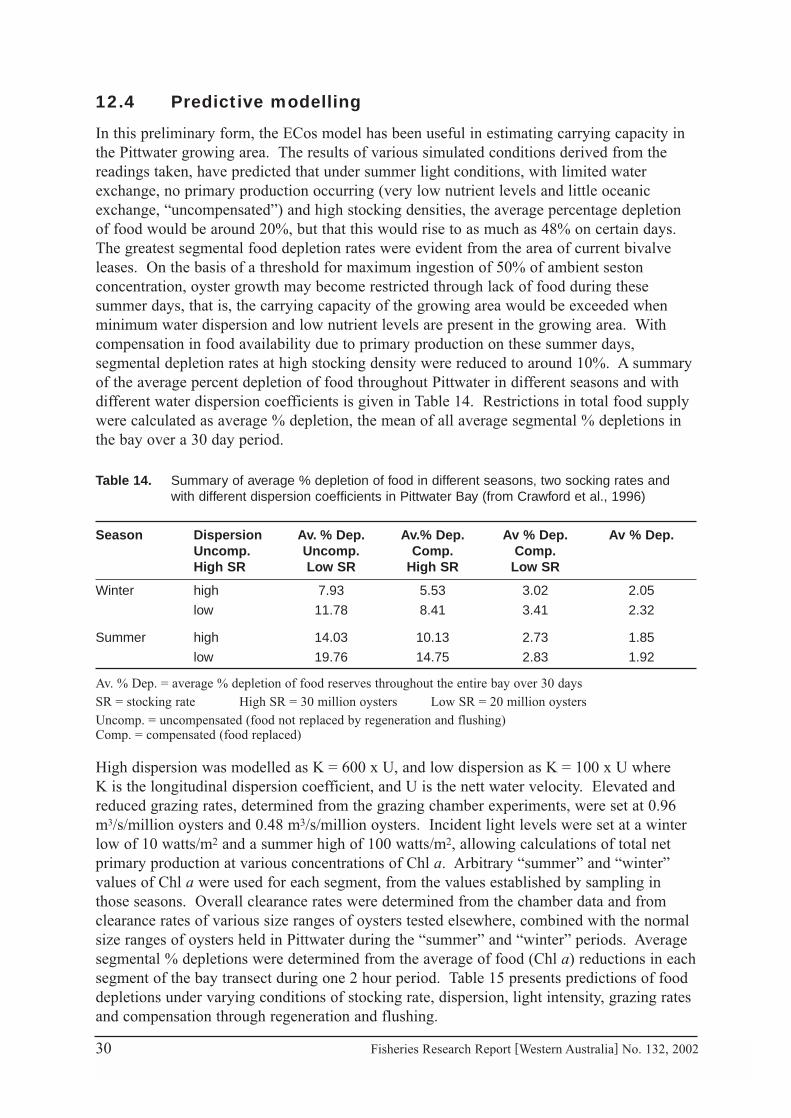
In this preliminary form, the ECos model has been useful in estimating carrying capacity inthe Pittwater growing area. The results of various simulated conditions derived from thereadings taken, have predicted that under summer light conditions, with limited waterexchange, no primary production occurring (very low nutrient levels and little oceanicexchange, “uncompensated”) and high stocking densities, the average percentage depletionof food would be around 20%, but that this would rise to as much as 48% on certain days.The greatest segmental food depletion rates were evident from the area of current bivalveleases. On the basis of a threshold for maximum ingestion of 50% of ambient sestonconcentration, oyster growth may become restricted through lack of food during thesesummer days, that is, the carrying capacity of the growing area would be exceeded whenminimum water dispersion and low nutrient levels are present in the growing area. Withcompensation in food availability due to primary production on these summer days,segmental depletion rates at high stocking density were reduced to around 10%. A summaryof the average percent depletion of food throughout Pittwater in different seasons and withdifferent water dispersion coefficients is given in Table 14. Restrictions in total food supplywere calculated as average % depletion, the mean of all average segmental % depletions inthe bay over a 30 day period.
Table 14. Summary of average % depletion of food in different seasons, two socking rates andwith different dispersion coefficients in Pittwater Bay (from Crawford et al., 1996)
Season Dispersion Av. % Dep. Av.% Dep. Av % Dep. Av % Dep.Uncomp. Uncomp. Comp. Comp.High SR Low SR High SR Low SR
Winter high 7.93 5.53 3.02 2.05
low 11.78 8.41 3.41 2.32
Summer high 14.03 10.13 2.73 1.85
low 19.76 14.75 2.83 1.92
Av. % Dep. = average % depletion of food reserves throughout the entire bay over 30 daysSR = stocking rate High SR = 30 million oysters Low SR = 20 million oystersUncomp. = uncompensated (food not replaced by regeneration and flushing) Comp. = compensated (food replaced)
High dispersion was modelled as K = 600 x U, and low dispersion as K = 100 x U where K is the longitudinal dispersion coefficient, and U is the nett water velocity. Elevated andreduced grazing rates, determined from the grazing chamber experiments, were set at 0.96m3/s/million oysters and 0.48 m3/s/million oysters. Incident light levels were set at a winterlow of 10 watts/m2 and a summer high of 100 watts/m2, allowing calculations of total netprimary production at various concentrations of Chl a. Arbitrary “summer” and “winter”values of Chl a were used for each segment, from the values established by sampling inthose seasons. Overall clearance rates were determined from the chamber data and fromclearance rates of various size ranges of oysters tested elsewhere, combined with the normalsize ranges of oysters held in Pittwater during the “summer” and “winter” periods. Averagesegmental % depletions were determined from the average of food (Chl a) reductions in eachsegment of the bay transect during one 2 hour period. Table 15 presents predictions of fooddepletions under varying conditions of stocking rate, dispersion, light intensity, grazing ratesand compensation through regeneration and flushing.
Table 15. Average % depletion and maximum segmental depletion of high and low stocking ratesat Pittwater under high and low conditions of light, grazing rates, and dispersion.
H= high light , high dispersion and high grazing rates WC = without compensationL= low light, low dispersion and low grazing rates C = with compensationS= summer conditions: high light, low dispersion and high grazing rates
The model has predicted the degree of local (maximum segmental depletion, adjacent tofarm) and regional food depletion (average depletion). Since the figures present possiblereductions in food availability which may occur over a quite short period of 2 hours, theimpact of a number of days of stable weather conditions, low flushing rates and low summernutrient levels, combined with high feeding levels, upon oyster condition at high stockingrates is likely to be very profound.
12.5 Summary outcomes
The success of the simple hydrodynamic model for the Pittwater growing area was largelydependent upon the vertical uniformity of water conditions in this locality. However, otherbivalve sites often have highly-stratified water conditions (Hickman et al., 1991; Gibbs et al., 1992; Boyd and Heasman, 1998) and may not be suitable for the one dimensionalECos model. It is likely that those growing areas in Tasmania which incorporate wide,shallow tidal flats and deeper water channels in estuaries, for example, Georges Bay andLittle Swanport, will not fit easily into the ECos model assumptions of vertical uniformity in measured parameters, and that a two-dimensional model may be necessary to moreaccurately predict carrying capacities in these areas.
The model continues to be refined, through gathering of data on oyster growth rates andstocking density from each of the growing areas. As well, measurements of foodavailability now include all components of seston. Nutrient levels and Chl a data are yet to be integrated into the model. The effects of temperature, food concentration and oysterbiomass upon oyster clearance rates need to be further investigated. Finally, account needs to be made of the impact of other filter feeders and zooplankton levels in the oystergrowing areas.
The research has shown that a generalised model of the carrying capacity of bivalve sites isfeasible, however, detailed site-specific data will be required for each growing area, if themodel is to reliably predict the carrying capacity of that area. This is due to the high degreeof inter-site variation in the parameters used to construct the model. In particular, detailed
Fisheries Research Report [Western Australia] No. 132, 2002 31
32 Fisheries Research Report [Western Australia] No. 132, 2002
studies of the hydrodynamics of each growing area, and bivalve food availability will berequired over a number of years.
The model predicted that average depletions of food available for oysters at high stockingdensity during summer months in Pittwater would be between 2 and 20%, while winterdepletions ranged between 2 and 12% (Table 14). It is likely that the extreme conditions offood depletion would exist for a number of days to weeks in Pittwater, which experiencesprolonged periods in late summer, of high light, low wind and low nutrient levels. At highstocking rates or with increases in number of oyster leases in Pittwater, oyster growth maybe restricted under these conditions, with consequent effects upon viability of existing andproposed future sites.
In common with other highly productive commercial bivalve sites around the world,Tasmanian sites show consistently good Chl a levels, greater than 1 mg/m3, throughout the year, combined with periodic blooms. While water temperatures and primaryproductivity appear to be lower than Spanish and Japanese sites, growth rates remainacceptable (50-60 mm/y), with harvests of oysters usually during, or after, the second warmseason of culture (12 - 18 months old) (Treadwell et al., 1991).
13.0 South Australia, Australia
13.1 Coffin Bay, Eyre Peninsula
The Coffin Bay region of the Eyre Peninsula, Australia, has supported Pacific oyster farmingsince the 1970’s. Intertidal culture methods are used. Polyethylene mesh bags for oystergrowout are suspended ~1 - 1.5 m above the substrate on wire longlines, which aresupported by a post and rail system. Under the normal tidal range of 0.5 m, oysters spendapproximately 2-3 h/d exposed to the air.
In a study by Bridger (unpublished honours thesis) of site-related differences in oystergrowth and water conditions at four locations, oysters were cultured experimentally for 5 months at two commercial sites (Kellidie and Dutton) and two other unused embaymentswithin Coffin Bay (Longnose and Central). Height and weight of shell, wet and dry meatweight were determined monthly using 60 oysters from each site, along with waterconditions and particulate food levels. Current flow at the sites was measured indirectlyusing rate of solution of calcium sulphate blocks (Table 16). Control blocks from twobatches produced for trials 1 and 2 dissolved at different rates in the laboratory. Hence,solution rates in this review have been standardised, as ratios of solution rates of batchcontrols. Food levels were determined as Chl a, direct cell counts, POM and PIM. Theauthor stated that measures of particulate food except for Chl a were not used in the analysisof growth, due to high variability. Of the environmental variables measured, Chl a, pH, andtemperature did not vary significantly between sites (Fig 11). In contrast, salinity values forthe four sites differed significantly. The experimental sites (Longnose and Central)experienced salinities predominantly below 40 ‰. The two commercial sites experiencedhigher salinities, generally above 40 ‰, throughout the sampling period (Fig 12).
Figure 11. Composite means (± sd) of sea water Chl a content and temperature taken half-monthlyat the four sites within Coffin Bay, Eyre Peninsula, South Australia. No significantdifferences were found between sites for these variables (Error bars are s.e., n = 12)(from Bridger, unpublished data).
Table 16. Standardised measures of dissolution of calcium sulphate blocks over 12 days, at eachof the oyster sites within Coffin Bay, South Australia. Rate of solution of blocks wasused as an indication of differences in current flow between sites. Standardised massloss = mass loss of site block/mass loss of laboratory control (adapted from Bridger,unpublished data).
Site Standardised Mass Loss (g /g control)Trial 1 Trial 2
Longnose 4.79 4.05
Central 5.04 4.50
Dutton 3.67 2.79
Kellidie 2.36 1.72
Reduced standardised rates of dissolution of blocks at Dutton and Kellidie may indicatelower current flows at these sites, especially at Kellidie. Since controls were tested in alaboratory aquarium, site water conditions without current flow were not used to gain ameasurement of control block dissolution rates. Therefore, statistical analyses of these dataare inappropriate. As well, current flow was not related to block dissolution rates, or used todetermine food availability in this study
Changes in dry meat weight and shell height differed significantly between sites. Oysters atKellidie did not increase in dry meat weight over the 5 months of the study. Kellidie oysters
0
0.5
1
1.5
Ch
l a
(mg/
m3)
Fe
b
Fe
b
Mar
Mar
Apr
Apr
May
May Ju
n
Jun
Month
10
15
20
25T
emp
(°C
)
Feb
Feb
Mar
Mar
Apr
Apr
May
May Jun
Jun
Fisheries Research Report [Western Australia] No. 132, 2002 33
34 Fisheries Research Report [Western Australia] No. 132, 2002
Figure 12. Mean sea water salinity, with oyster shell height and dry meat weight of 60 oysterssampled monthly at the four sites within Coffin Bay in 1996 (from Bridger, unpublished data).
70
80
90
100
110
Feb
Mar
Apr
May
Jun
Month
Longnose
Central
Dutton
Kellidie
Sh
ell H
eig
ht
(mm
)
0.5
1
1.5
2
2.5
3
Dry
Mea
t W
eig
ht
(g)
Fe
b
Mar
Apr
May Jun
Month
Longnose
Central
Dutton
Kellidie
35
37.5
40
42.5
45
Sal
init
y (‰
)
Fe
b
Fe
b
Mar
Mar
Apr
Apr
May
May Ju
n
Jun
Month
Longnose
Central
Dutton
Kellidie
were smaller than oysters at other sites at the beginning of the study. Both Kellidie andDutton oysters exhibited minimal shell growth, while at the two experimental sites, oystersgrew steadily. From March to June, Dutton oysters improved in meat weight but shell lengthdid not increase. During February-March, oysters at Dutton and Kellidie lost condition.Environmental conditions, other than temperature, pH and phytoplankton levels, appeared toseverely hinder shell growth at both commercial sites during the majority of the trial period.Differences in salinity and perhaps current flow (Fig 12, Table 16) between sites weredetected, and salinity was shown by partial correlation analysis to be the dominant parameterwhen correlated with dry meat weight (r = -0.863, p < 0.001). The indication of negativeinfluence of increasing salinity upon oyster growth needs to be further examined, since foodavailability for oysters (a function of particulate food levels, stocking density and currentflow) was not directly measured. The limited data may indicate that oysters at Kellidie andDutton had restricted growth because of physiological stress, due to salinities whichsurpassed the animals’ ability to acclimate, or some other undetected factor. Additionally,this physiological stress may have been size-related, since Kellidie oysters were mostaffected. The limit of salinity tolerance for Pacific oysters in this region may have beenexceeded, but this inference needs to be supported either by the use of trials of salinitytolerance, or laboratory growth at a range of high salinities.
In conclusion, the data from Coffin Bay do indicate arrested growth in the presence ofadequate phytoplankton and high salinity, but the range of site-related environmental andbiological factors associated with oyster growth, for example, current flow, food depletionrates in oyster leases (measures of food availability) and oyster size, remain to be evaluated.
13.2 Ceduna
A phytoplankton survey, water Chl a, Chl b and total organic carbon values were determinedat various sampling sites at Ceduna in South Australia, around the localities whereCrassostrea gigas is farmed (Australian Water Quality Centre, 1996). No bivalve growthparameters were incorporated in this water sampling study. Samples were taken atapproximately monthly intervals between October 1995 and May 1996. The data presentedin Figure 13 are means (± s.e.) of the Chl a readings obtained for the six sampling sites ateach date.
Mean Chl a values ranged between 0.3 and 1.7 mg/m3, similar to Coffin Bay. Total organiccarbon levels ranged between 1.1 and 2.3 mg/l. Compared with the New Zealand sites,waters around Ceduna contain less phytoplankton and more organic carbon. This indicates asignificant source of particulate food other than phytoplankton at the South Australian site.At the low levels of Chl a indicated, this food resource may be very important to oysterproductivity.
Fisheries Research Report [Western Australia] No. 132, 2002 35
36 Fisheries Research Report [Western Australia] No. 132, 2002
Figure 13. Mean Chl a readings for waters around Ceduna, South Australia, taken at approximatelymonthly intervals (data from Australian Water Quality Centre, 1996).
14.0 Summary and recommendations - food availability and water conditions
From the broad range of culture conditions reviewed (see site summary, Table 17),temperature and food availability appear to be the major factors affecting growth of bivalvesat existing commercial bivalve sites. A combination of very low temperature and low foodavailability may cause bivalves to lose condition, by decrease in flesh weight during winter.Stable summer conditions of increasing temperature, low food availability, high salinity, lowwater exchange and low nutrient levels, may also adversely affect the flesh condition andgrowth of bivalves.
Mean chlorophyll a concentrations of the order of 1-10 mg/m3 were predominant at siteswhere bivalve growth does not appear to be greatly limited by lack of nutrients, for example,British Columbia, Saldanha Bay, Tasmania and the Ria de Arousa. At sites wherephytoplankton growth was more nutrient-limited, other particulate organic matter may havemade a larger contribution to the growth and condition of bivalves, for example, PelorusSound, New Zealand, in the Ria Sada, Galicia, Spain, and in the Gulf of Castellammare, Sicily.
Multiple-site growth studies in Pelorus Sound and British Columbia demonstrated a strongpositive correlation between temperature and bivalve growth and condition, at sites wherefood availability was not low. The work of Mason et al. (1998) on Sydney rock oyster(Saccostrea commercialis) supportd this. They established experimentally that changes ingrowth rate are predominantly controlled by initial size and water temperature, when food isabundant. Temperatures between 10 and 18°C promoted good mussel growth, while Pacificoysters appeared to grow well at a slightly higher range of 12 to 25°C, in sites where food
0
0.5
1
1.5
2
Ch
l a (
mg
/m3)
3/10
/95
31/1
0/95
27/1
1/95
30/1
/96
14/2
/96
13/3
/96
1/5/
96
28/5
/96
Date
levels are high. In contrast, the New Zealand studies revealed that mussel condition indexand shell length were negatively correlated with increasing temperature under conditions ofvery low food availability. This may have been due to reduction in rainfall with temperaturerise from spring to summer, more stable weather conditions, lower current flows andflushing rates. The reduced inputs of nutrients and particulates from terrigenous sources, aswell as lack of nutrients from oceanic upwelling and advection were seen as the causes oflow food levels and consequent loss of condition and reduced growth. As well, loss incondition through reproductive activity may have occurred with temperature rises.
Prolonged periods (3 to 4 months) during spring and autumn outflows of fresh water, wheresalinity levels were below 20 ‰ in British Columbian sites, resulted in severely-reducedshell and flesh growth, despite the presence of associated phytoplankton blooms andsatisfactory growth temperatures. Increases in shell height and meat weight may have beenrestricted by physiological stress in the prolonged low salinity periods, while shell thinningmay have resulted from a lack of available minerals. In contrast, salinity studies in PelorusSound, New Zealand, and in Tasmania, showed that reduced salinity was correlated withincreased growth, improved condition, higher nutrient levels, higher Chl a and largerquantities of particulates. These correlations reveal the input of nutrient- and organicparticulate-rich fresh water into the system. Salinities ranged from 10 - 38 ‰ in theTasmanian studies and 20-35 ‰ in the Marlborough Sounds, with no recorded adverseeffects upon growth. Rapid flushing rates following inputs of fresh water in both regionsrestricted the severe salinity reductions to a single monthly reading of 10 ‰ in Tasmania,and one monthly reading of 20 ‰ in the upper regions of Pelorus Sound. Clearly, the periodof time that bivalves were exposed to severely-reduced salinity (possibly below 20 ‰ for C.gigas) is the major difference between the British Columbian and the Australasian sites.Pacific oysters grown at Coffin Bay, South Australia, appeared to be severely restricted ingrowth in high salinity waters, above ~40‰, while oysters at sites within the bay which hadsalinity conditions below ~40 ‰ continued to grow. Phytoplankton levels at all sites werearound 0.5 - 1.0 mg/m3, probably sufficient when combined with adequate current flow.Further laboratory studies, and more accurate methods for determining food availability,were needed to confirm the correlation between high salinity and growth restriction seen atthese South Australian sites.
Subsurface inputs of nutrient-rich oceanic bottom water, arising from wind-driven upwelling,were also seen to stimulate dense concentrations of phytoplankton in close association withhaloclines and thermoclines, in the outer regions Pelorus Sound and in Saldanha Bay, whilethe very shallow Pipeclay Lagoon in Tasmania, derived its high productivity from dailyreplenishment arising from a rapid tidal flushing rate.
Adequate current flow was vital to promote food availability in hanging rope culture.Correct stocking densities were established, to avoid restricting growth of bivalves throughlack of available phytoplankton, especially in the centre of rafts. Oceanic bivalve culturesites needed protection from wave and wind, but also needed access to the nutrients derivedfrom upwelling on a high energy coastline, as well as a means of adequate exchange ofoceanic water. Sheltered, deep embayments which develop thermoclines from subsurfaceadvection, and which have adequate tidal and/or wind-forced mixing to dissipate them, wereshown to be ideal. Alternately, shallow oceanic embayments with a rapid tidal exchange ratealso proved to be highly productive when surface waters were phytoplankton-rich. Estuarinesites either had nutrients regularly replenished by input from terrestrial sources, or a strongtidal flow replenishing food from coastal oceanic waters.
Fisheries Research Report [Western Australia] No. 132, 2002 37
38Fisheries R
esearch Report [W
estern Australia ] N
o. 132, 2002
Table 17.
Sum
mary of m
eans (M) and ranges (R
) of monthly C
hlorophyll a, particulate organic
matter (P
OM
), salinity, temperature and annual bivalve grow
th at various sites aroundthe w
orld.Locality Species Chlorophyll a POM Salinity Temperature Growth Productivity Source
(mg/m3) (mg/l) (‰) (°C) (Shell) (g C/m2/year)M R M R M R M R
Locality Species Chlorophyll a POM Salinity Temperature Growth Productivity Source(mg/m3) (mg/l) (‰) (°C) (Shell) (g C/m2/year)
M R M R M R M R
Tasmania, AustraliaPittwater C. gigas 2.87 0.8-9.0 - - 34.48 31-37 12.88 7-20 50 mm/y 142a Crawford et al., 1995
Pipeclay Lagoon C. gigas 2.37 0.8-4.5 - - 34.28 33-36 15.5 7-21 50 mm/y 130a Crawford et al., 1995
South AustraliaCoffin Bay C. gigas - 0.5-1.3 - - 36-45 - 13-23 0 - 50 mm/y - Bridger, (unpublished data)
Ceduna C. gigas - 0.3-1.7 - - - - - - - - Australian Water Quality
Centre, 1996
* Mean winter/autumn value
** Highly stratified conditions; range derived from integrals of a series of depth readings.a based upon 10 readings throughout the year, 6 from Pittwater and 4 from Pipeclay Lagoon (Tasmania). Converted from volume productivity (Table 12) to
area productivity through division by approximate mean depth (1.5 m and 2.5 m, respectively).
40 Fisheries Research Report [Western Australia] No. 132, 2002
In common with other productive sites around the world, commercial sites in Australasiahave shown generally high phytoplankton levels combined with seasonal blooms, infavourable water conditions.
Using existing sites as a guide, a potential bivalve site in temperate or warm temperatewaters of coastal Western Australia will need:
• Monthly Chl a levels consistently in excess of 1 mg/m3,
• A mean annual Chl a level between 2 and 3 mg/m3,
• Temperatures ranging between 7 and 25°C,
• A salinity regime where long-term reductions above or below bivalve acclimatisationlimits do not occur,
• Adequate flow, water exchange and mixing rates,
• Sheltered conditions,
• A regular marine or terrestrial source of dissolved nutrient or particulate food.
Under such conditions, bivalve growth would be sufficient for commercial exploitation, anda viable, sustainable bivalve industry could be developed. Areas with more limited foodavailability may only sustain farming systems that involve relatively lower biomasses ofbivalves per unit volume of sea water.
15.0 Acknowledgments
We are particularly grateful to Iona Mitchell for supplying additional data to complementFRDC Final Report 92/54.
Flinders University is also acknowledged for supplying an unpublished honours thesis by L. Bridger.
The review was initiated by Dr. Greg Maguire who provided critical input on various drafts.Useful comments were also provided by Sandra Seidel.
16.0 References
Australian Water Quality Centre, 1996, Phytoplankton surveys of Denial Bay and SmokeyBay, Ceduna South Australia. October 1996 - June 1996.
Bode, A. and Varela, M. 1998, Primary production and phytoplankton in three Galician RiasAltas (NW Spain): seasonal and spatial variability. Scientia Marina, 62: 319-330.
Boyd, A.J., and Heasman, K.G. 1998, Shellfish mariculture in the Banguela system: waterflow patterns within a mussel farm in Saldanha Bay, South Africa. Journal of ShellfishResearch, 17: 25-32.
Bridger, L. (unpublished data). Investigation of site-related differences in oyster growth atfour locations within Coffin Bay. Honours thesis, School of Biological Sciences,Flinders University, South Australia, 1996.
Brown, J.R. and Hartwick, E.B. 1988a, Influences of temperature, salinity and available foodupon suspended culture of the Pacific oyster, Crassostrea gigas I. Absolute andallometric growth. Aquaculture, 70: 231-251.
Brown, J.R. and Hartwick, E.B. 1988b, Influences of temperature, salinity and available foodupon suspended culture of the Pacific oyster, Crassostrea gigas II. Condition indexand survival. Aquaculture, 70: 253-267.
Crawford, C., Mitchell, I. and Brown, A. 1996, Predictive modelling of carrying capacitiesof oyster (Crassostrea gigas) farming areas in Tasmania. Final Report to the FisheriesResearch and Development Corporation. FRDC Grant 92/54 .
Dame, R. and Libes, S. 1993, Oyster reefs and nutrient retention in tidal creeks. Journal ofExperimental Marine Biology and Ecology, 171: 251-258.
Fernandez-Reiriz, M.J., Labarta, U. and Babarro, J.M.F. 1996, Comparative allometries ingrowth and chemical composition of mussel (Mytilus galloprovincialis Lmk) culturedin two zones in the Ria Sada (Galacia, NW Spain). Journal of Shellfish Research, 15: 349-353.
Gibbs, M.M., Pickmere, S.E., Woods, P.H., Payne, G.W., James, M.R., Hickman, R.W. andIllingworth, J. 1992, Nutrient and chlorophyll a variability at six stations associatedwith mussel farming in Pelorus Sound, 1984-1985. New Zealand Journal of Marineand Freshwater Research, 26: 197-211
Heasman, K.G., Pitcher, G.C., McQuaid, C.D. and Hecht, T. 1998, Shellfish mariculture inthe Banguela system: raft culture of Mytilus galloprovincialis and the effect of ropespacing on food extraction, growth rate, production and condition of mussels. Journalof Shellfish Research, 17: 33-39.
Hickman, R.W., Waite, R.P., Illingworth, J., Meredyth-Young, J.L. and Payne, G. 1991, Therelationship between farmed mussels, Perna canaliculus, and available food inPelorus-Kenepuru Sound, New Zealand. Aquaculture, 99: 49-68.
Howarth, R. 1988, Nutrient limitation of net primary production in marine ecosystems.Annual Reviews of Ecological Systems, 19: 89-110.
Kobayashi, M. Hofmann, E., Powell, E., Klinck, J.M. and Kusaka, K. 1997, A populationdynamiics model for the Japanese oyster, Crassostrea gigas. Aquaculture, 149: 285-321.
Mason, C.J., Reid, D.D., and Nell, J.A. 1998, Growth characteristics of Sydney rock oystersSaccostrea commercialis in relation to size and temperature. Journal of ExperimentalMarine Biology and Ecology, 227: 155-168.
Pearce, A., Helleran, S. and Marinelli, M. 2000, Review of productivity levels of WesternAustralian coastal and estuarine waters for mariculture planning purposes. FisheriesResearch Report No. 123. Fisheries Research Division, Fisheries WA, WesternAustralian Marine Research Laboratories, North Beach, 6020 Western Australia.
Fisheries Research Report [Western Australia] No. 132, 2002 41
42 Fisheries Research Report [Western Australia] No. 132, 2002
Pérez Camacho, A., Labarta, U. and Beiras, R. 1995, Growth of mussels (Mytilus edulisgalloprovincialis) on cultivation rafts: influence of seed source, cultivation site andphytoplankton availability. Aquaculture, 138: 349-362.
Pazos, A.J., Roman, G., Acosta, C.P., Abad, M. and Sanchez, J.L. 1996, Stereological studieson the gametogenic cycle of the scallop, Pecten maximus, in suspended culture in Riade Arousa (Galicia, NW Spain). Aquaculture, 142: 119-135.
Pitcher, G.C. and Calder, D. 1998, Shellfish mariculture in the Banguela system:phytoplankton and the availability of food for commercial mussel farms in SaldanhaBay, South Africa. Journal of Shellfish Research, 17: 15-24.
Ruiz, C., Abad, M., Sedano, F., Garcia-Martin, L.O. and Sánchez López, J.L. 1992,Influence of seasonal environmental changes on the gamete production andbiochemical composition of Crassostrea gigas (Thunberg) in suspended culture in El Grove, Galicia, Spain. Journal of Experimental Marine Biology and Ecology, 155: 249-262.
Sara, G. and Mazzola, A. 1997, Effects of trophic and environmental conditions on thegrowth of Crassostrea gigas in culture. Aquaculture, 153: 81-91.
Sara, G., Manganaro, A., Cortese, G., Pusceddu, A. and Mazzola, A. 1998, The relationshipbetween food availability and growth in Mytilus galloprovincialis in the open sea(southern Mediterranean). Aquaculture, 167: 1-15.
Smaal, A.C. and van Stralen, M.R. 1990, Average annual growth and condition of mussels asa function of food source. Hydrobiologia, 195: 179-188.
Stirling, H.P. and Okumus, I. 1995, Growth and production of mussels (Mytilus edulis L.)suspended at salmon cages and shellfish farms in two Scottish sea lochs. Aquaculture,134: 193-210.
Thorarinsdottir, G.G. 1994, The Iceland scallop, Chlamys islandica (O. F. Mueller), inBreidafjoerdur, west Iceland. 3. Growth in suspended culture. Aquaculture: 120: 295-303.
Thorarinsdottir, G.G. 1996, Gonad development, larval settlement and growth of Mytilusedulis L. in a suspended population in Hvalfjordur, south west Iceland. AquacultureResearch, 27: 57-65.
Treadwell, R., McKelvie, L. and Maguire, G.B. 1991, Profitability of selected aquaculturalspecies. Australian Bureau of Agricultural and Research Economics.
Varela, M., Fuentes, J.M., Penas, E. and Cabanas, J.M. 1984, Producción primaria de lasRías Baixas de Galicia. Cuadernos da Area de Ciencas Mariñas. Seminario de EstudosGalegos, 1: 173-182.
List of Fisheries Research ReportsNot all have been listed here, a complete list is availableonline at http://www.wa.gov.au/westfish
83 The Western Rock Lobster fishery 1985/86. Brown, R.S.;Barker, E.H. (1990.)
84 The Marine open shelf environment: review of humaninfluences. Hancock, D.A. (1990.)
85 A Description of the British United Trawlers / SouthernOcean Trawlers operation in the Great Australian Bightduring the period 19.11.77 to 28.5.79. Walker, M.H.;Blight, S.J.; Clarke, D.P. (1989.)
86 The Demersal trawl resources of the Great AustralianBight as indicated by the fishing operations of the sterntrawlers Othello, Orsino and Cassio in the period19.11.77 to 28.5.79. Walker, M.H.; Clarke, D.P. (1990.)
87 The recreational marron fishery in Western Australiasummarised research statistics, 1971 - 1987. Morrissy,N.M.; Fellows, C.J. (1990.)
88 A synopsis of the biology and the exploitation of theAustralasian pilchard, Sardinops neopilchardus(Steindachner). Part 1: Biology. Fletcher, W.J. (1990.)
89 Relationships among partial and whole lengths andweights for Western Australian pink snapperChrysophrys auratus (Sparidae). Moran, M.J.; Burton, C.(1990.)
90 A Summary of projects financed by the FisheriesResearch and Development Fund 1965-1983. (1991.)
91 A synopsis of the biology and the exploitation of theAustralasian pilchard, Sardinops neopilchardus(Steindachner) Part II : History of stock assessment andexploitation. Fletcher, W.J. (1991.)
92 Spread of the introduced yabbie Cherax albidus Clark,1936 in Western Australia. Morrissy, N.M.; Cassells, G.(1992.)
93 Biological synopsis of the black bream, Acanthopagrusbutcheri (Munro) (Teleostei: Sparidae). Norriss, J. V.;Tregonning, J. E.; Lenanton, R. C. J.; Sarre, G. A. (2002.)
94 to 98 No reports were published under thesenumbers.
99 An Investigation of weight loss of marron (Cheraxtenuimanus) during live transport to market. Morrissy,N.; Walker, P.; Fellows, C.; Moore, W. (1993.)
100 The Impact of trawling for saucer scallops and westernking prawns on the benthic communities in coastalwaters off south-western Australia. (FRDC final report90/019 ) Laurenson, L.B.J.; Unsworth, P.; Penn, J.W.;Lenanton, R.C.J.; Fisheries Research and DevelopmentCorporation (1993.)
101 The Big Bank region of the limited entry fishery for thewestern rock lobster Panulirus cygnus. Chubb, C.F.;Barker, E.H.; Dibden, C.J. (1994.)
102 A Review of international aquaculture development andselected species in environments relevant to WesternAustralia. Lawrence, C. S. (1995.)
103 Identifying the developmental stages for eggs of theAustralian pilchard, Sardinops sagax. White, K.V.;Fletcher, W. J. (1998.)
104 Assessment of the effects of a trial period of unattended recreational netting in selected estuaries oftemperate Western Australia. Lenanton, R.C.; Allison, R.;Ayvazian,S.G.; Western Australia. Fisheries Dept. (1996.)
105 The western rock lobster fishery 1986/7 to 1990/91.Chubb, C.F.; Barker, E.H.; Brown, R.S.; Western Australia.Fisheries Dep. (1996.)
106 Environmental and biological aspects of the massmortality of pilchards (Autumn 1995) in WesternAustralia. Fletcher, W.J.; Jones, B; Pearce, A.F.; Hosja, W.;Western Australia. Fisheries Dept. (1997.)
107 Chemical composition of yabbies, Cherax albidus Clark1936 from Western Australian farm dams. Francesconi,Kevin A.; Morrissy, Noel M. (1996.)
108 Aspects of the biology and stock assessment of thewhitebait, Hyperlophus vittatus, in south westernAustralia. Gaughan, D.J.; Fletcher, W.J; Tregonning, R.J.;Goh, J. (1996.)
109 The western rock lobster fishery 1991/92 to 1992/93.Chubb, C.F.; Barker, E.H.; Fisheries Western Australia(1998.)
110 A Research vessel survey of bottom types in the area ofthe Abrolhos Islands and mid-west trawl fishery.Dibden, C.J.; Joll, L.M. (1998.)
111 Sea temperature variability off Western Australia 1990to 1994. Pearce, Alan; Rossbach, Mark; Tait, Marion;Brown, Rhys (1999.)
112 Final report, FRDC project 94/075: enhancement ofyabbie production from Western Australian farm dams.Lawrence, Craig; Morrissy, Noel; Bellanger, Justin;Cheng, Yuk Wing; Fisheries Research and DevelopmentCorporation (1998.)
113 Catch, effort and the conversion from gill nets to trapsin the Peel-Harvey and Cockburn Sound blue swimmercrab (Portunus pelagicus) fisheries. Melville-Smith, R.;Cliff, M.; Anderton, S.M. (1999.)
114 The Western Australian scallop industry. Harris, D.C.;Joll, L.M.; Watson, R.A. (1999.)
115 Statistical analysis of Gascoyne region recreationalfishing study July 1996. Sumner, N.R.; Steckis, R.A.(1999.)
116 The western rock lobster fishery 1993/94 to 1994/95.Chubb, C.F.; Barker, E.H.; Fisheries Western Australia(2000.)
117 A 12-month survey of coastal recreational boat fishingbetween Augusta and Kalbarri on the west coast ofWestern Australia during 1996-97. Sumner, N.R.;Williamson, P.C. (1999.)
118 A study into Western Australia's open access andwetline fisheries. Crowe, F.; Lehre, W.; Lenanton, R. J. C.(1999.)
119 Final report : FRDC project 95/037 : The biology andstock assessment of the tropical sardine, Sardinellalemuru, off the mid-west coast of Western Australia.Gaughan, D.J.; Mitchell, R.W.D.; Fisheries Research andDevelopment Corporation (Australia); WesternAustralian Marine Research Laboratories. (2000.)
120 A 12 month survey of recreational fishing in theLeschenault Estuary of Western Australia during 1998.Malseed, B. E.; Sumner, N.R.; Williamson, P.C. (2000.)
121 Synopsis of the biology and exploitation of the blueswimmer crab, Portunus pelagicus Linnaeus, in WesternAustralia. Kangas, M.I. (2000.)
122 Western rock lobster mail surveys of licensedrecreational fishers 1986/87 to 1998/99 Melville-Smith,R.; Anderton, S.M. (2000.)
Fisheries Research Reports cont’d.
123 Review of productivity levels of Western Australiancoastal and estuarine waters for mariculture planningpurposes. CDRom in back pocket has title “Chlorophyll-aconcentration in Western Australian coastal waters - asource document by S. Helleren and A. Pearce”(document in PDF format) Pearce, A.; Helleren, S.;Marinelli, M. (2000.)
124 The Evaluation of a recreational fishing stockenhancement trial of black bream (Acanthopagrusbutcheri) in the Swan River, Western Australia Dibden,C.J.; Jenkins, G.; Sarre, G.A.; Lenanton, R.C.J.; Ayvazian,S.G. (2000.)
125 A history of foreign fishing activities and fishery-independent surveys of the demersal finfish resourcesin the Kimberley region of Western Australia. [Partfunded by Fisheries Research and DevelopmentCorporation Project 94/026] Nowara, G.B.; Newman, S.J.(2001.)
126 A 12 month survey of recreational fishing in the Swan-Canning Estuary Basin of Western Australia during1998-99. Malseed, B. E.; Sumner, N.R. (2001.)
127 A 12 month survey of recreational fishing in the Peel-Harvey Estuary of Western Australia during 1998-99.Malseed, B. E.; Sumner, N.R. (2001.)
128 Aquaculture and related biological attributes of abalonespecies in Australia - a review Freeman, K.A. (2001.)
129 Morpholgy and incidence of yabby (Cherax albidus)burrows in Western Australia. Lawrence, C.S.; Brown,J.I.; Bellanger, J.E. (2001.)
130 Environmental requirements and tolerences of rainbowtrout (Oncorhynchus mykiss) and brown trout (Salmotrutta) with special reference to Western Australia : areview. Molony, B. (2001.)
131 Pilchard (Sardinops sagax) nursery areas and recruitmentprocess assessment between different regions insouthern Western Australia. Gaughan, D.J.; Baudains,G.A.; Mitchell, R.W.D.; Leary, T.I. (2002.)
133 Preliminary assessment and seasonal fluctuations in thefish biota inhabiting the concentrator ponds of DampierSalt, Port Hedland, with options for the potentialapplication of results. Molony, B.; Parry, G. (2002.)
134 Towards an assessment of the natural and human useimpacts on the marine environment of the AbrolhosIslands. Volume 1, Summary of existing information andcurrent levels of human use. CDRom in back pocket hastitle “Abrolhos Habitat Survey”. Webster, F.J; Dibden,C.J.; Weir, K.E.; Chubb, C.F. (2002.) Volume 2, Strategicresearch and develoment plan. Chubb, C.F.; Webster, F.J; Dibden, C.J.; Weir, K.E. (2002.)
135 The western rock lobster fishery 1995/96 to 1996/97.Chubb, C.F.; Barker, E.H. (2002.)
136 Assessment of gonad staging systems and othermethods used in the study of the reproductive biologyof narrow-barred Spanish mackerel , Scomberomoruscommerson, in Western Australia. Mackie, Michael;Lewis, Paul (2001.)
137 Annual report on the monitoring of the recreationalmarron fishery in 2000, with an analysis of long-termdata and changes within this fishery. Molony, B.; Bird, C.(2002.)
138 Historical diving profiles for pearl oyster divers inWestern Australia. Lulofs, H.M.A. and Sumner, N.R.(2002)
139 A 12-month survey of recreational fishing in theGascoyne bioregion of Western Australia during 1998-99.Sumner, N.R.; Willimson, P.C.; Malseed, B.E. (2002.)