[741] NUPIWorkingPaper Department of International Economics Fisheries Trade in India: Understanding Potentials and Barriers Meenakshi Rajeev Norsk Utenrikspolitisk Institutt Norwegian Institute of International Affairs
Any views expressed in this publication are those of the author. They should not be interpreted as reflecting the views of the Norwegian Institute of International Affairs. The text may not be printed in part or in full without the permission of the author.
ing local and processed fish trades – are informally organised and remain significant because
they provide employment to a large number of the poor, mainly women.
3.1 Export: Macro Trend
India has been exporting varieties of fisheries items for a long time now. India’s fish exports
even in real terms show an impressive growth from the decade of 1960s till about 1980–81.
Though a downward trend is visible thereafter, it picks up from 1999–’00 again. In Fig. 1 , we
have considered the real exports (deflated by fisheries sector export deflator, base 1978–79)
and the growth rates are presented in Fig. 2. Though as expected growth rates are fluctuating
showing even negative growths, a positive growth trend is visible for the recent years.
Fig.1 Fisheries exports from India in real terms (in $000)
Fig 1: Real Exports ($000)(1978-79=100)
0
50000
100000
150000
200000
250000
300000
1962
1964
1966
1968
1970
1972
1974
1976
1978
1980
1982
1984
1986
1988
1990
1992
1994
1996
1998
2000
2002
2004
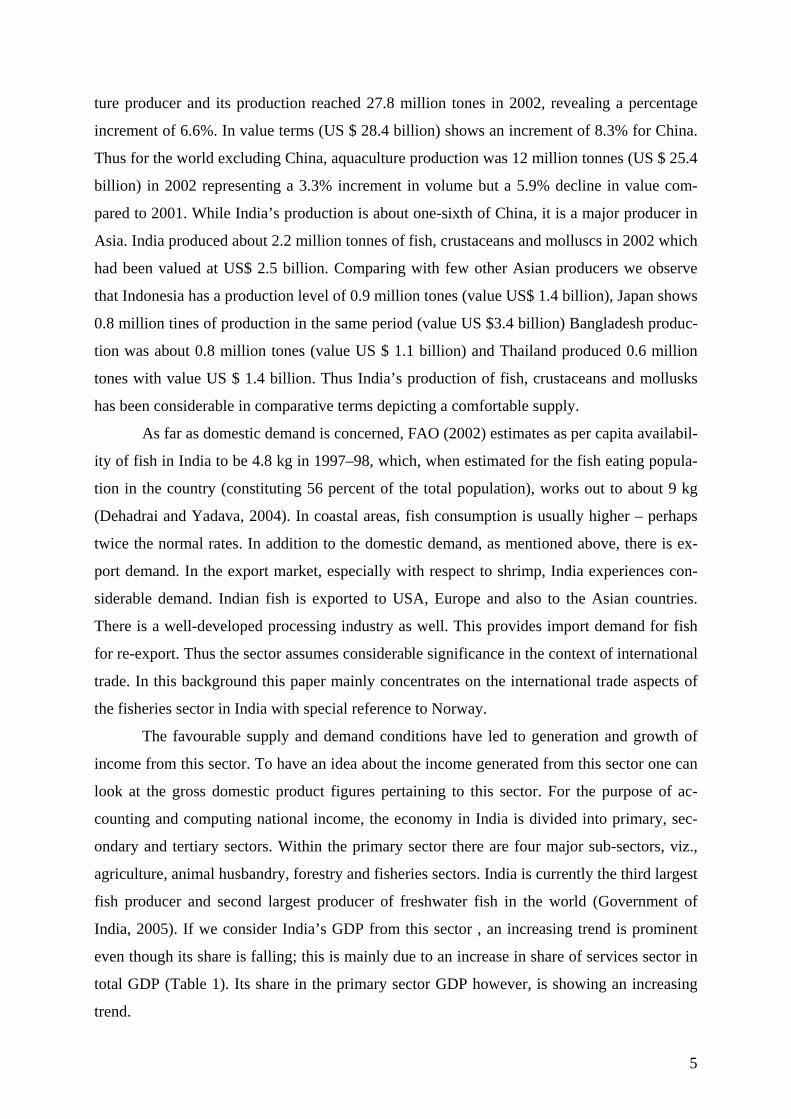
In terms of overall exports from the country, seafood stands at tenth place, accounting for 2.7
percent of total export earnings in 2001. Among seafood exporting countries, Indian exports
stood at 17th position in terms of quantity and 12th in terms of value (Mathew, 2003), its ex-
port share in the world seafood market is about 2.4 percent (Kulkarni, 2005). Shrimp is the
most important species in the export market chains and its contribution to overall exports
went up from a mere 13 MT in 1953 (Kurien, 1985) to 110,275 MT during 1999–2000
(MPEDA, 2001). Over time, finfish exports have shown rapid growth in the export basket,
accounting for nearly 35 percent of the volume of export trade in fisheries in 2004–5. Al-
7
though this means that the contribution of shrimp to overall exports declined from about 59%
in 1978–79 to a little under 30 percent in 2004–5 in terms of volume, it still accounts for
63.50 percent of the total value of the exports (MPEDA, 2006).
The growth rates of exports are explicitly depicted in Fig. 2. Though as expected
growth rates are fluctuating, it is interesting to note that growth rates are negative almost
about the same number of years as they are positive till 1998. Only in the current decade there
is a consistent trend of having positive growth. Non-tariff barriers, fluctuating productions are
some of the reasons for such trends.
Fig.2 Growth rate of fisheries exports in India (real terms)
Fig. 2: Growth of real exports
-30-20
-10
0
1020
30
40
50
6070
Growth ofrealexports
1962
1965
1968
1971
1974
1977
1980
1983
1986
1989
1992
1995
1998
2001
2004
Source: Compiled using Comtrade data
8
3.2 Import: Overall Trend In the Indian fisheries industry, the situation for imports is quite different from that of exports.
From being a country where no imports were allowed, imports quickly increased when the
borders were opened, though the level of imports is still very low (see Fig. 1 and 3). Unlike in
the case of exports , imports do show a rather haphazard trend. Our analysis of real imports3
data for a long period of 1962 to 2005 shows that though in the initial years imports were
high, it fell drastically later and remain low till now. From the year 2000, however, an in-
creasing trend is visible. Currently, India’s imports consist primarily of fishmeal. The one
other product India has been importing is hilsa from Bangladesh. In 1998, 97% of the imports
of fresh and frozen fish came from Bangladesh.
Fig. 3 Fisheries Trade: Real Imports ($000)
Trend of real imports
0
10000
20000
30000
40000
50000
60000
70000
1962
1965
1968
1971
1974
1977
1980
1983
1986
1989
1992
1995
1998
2001
2004
Year
Impo
rts
DeflatedIm ports
Source: Compiled using comtrade data
3.3 Projection of Exports and Imports4
We next tried to project future exports and imports of India using simple time trend to the
time series data available. Given the nature of import data , at this stage it is rather difficult to
bring in other variables that may significantly influence imports, in order to arrive at a more
meaningful projection5.
First using the exports data two types of models are explored, viz., an ARIMA fit and
a cubic fit. Using the cubic fit we next tried to forecast for the next 5 years . It must be noted
here is that since we only use the time trend these forecast would contain errors. Nonetheless 3 Import is deflated using import price index of food items as separate import price index for fisheries items does not exist. 4 I acknowledge help from my colleague B P Vani in carrying out this exercise. 5 We have made certain unsuccessful attempts in this regard and decided to restrict ourselves to the time trend alone for forecasting purposes.
9
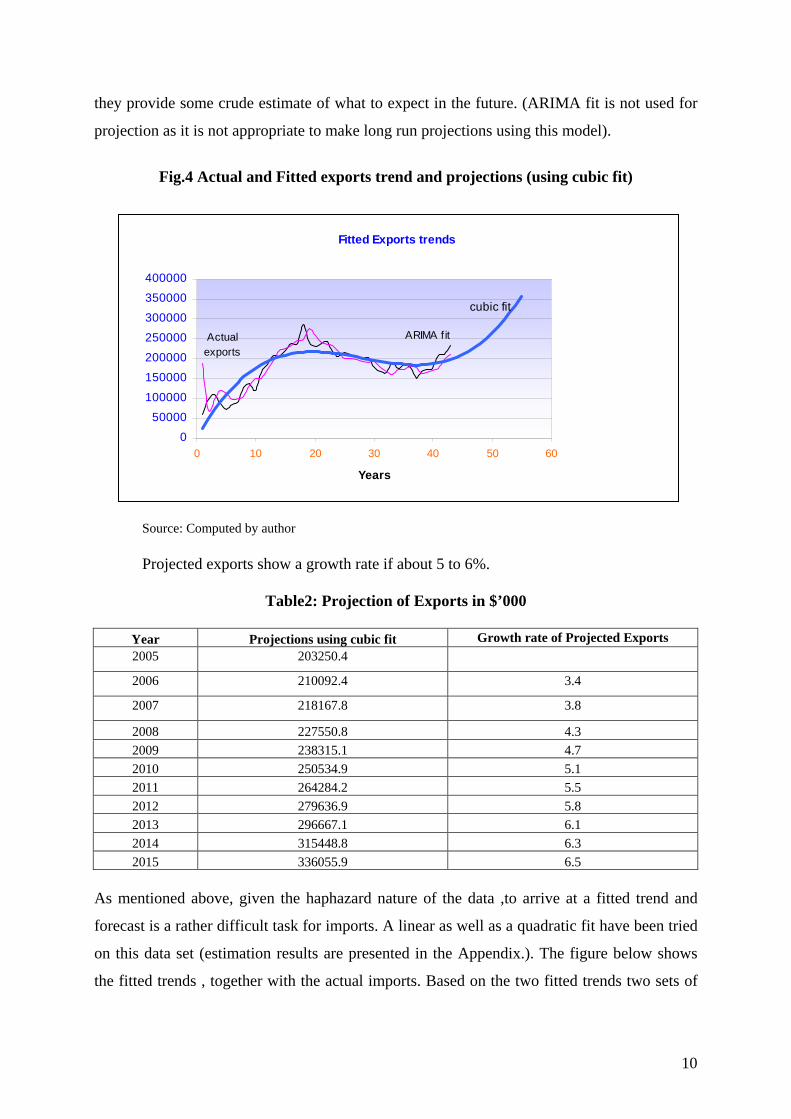
they provide some crude estimate of what to expect in the future. (ARIMA fit is not used for
projection as it is not appropriate to make long run projections using this model).
Fig.4 Actual and Fitted exports trend and projections (using cubic fit)
Fitted Exports trends
0
50000
100000
150000
200000
250000
300000
350000
400000
0 10 20 30 40 50 60
Years
cubic fit
Actual exports
ARIMA fit
Source: Computed by author
Projected exports show a growth rate if about 5 to 6%.
Table2: Projection of Exports in $’000
Year Projections using cubic fit Growth rate of Projected Exports 2005 203250.4
U.K 27,820.53 19,742.94 13,730.54 8,036.39 18,046.76China 52,895.48 37,922.50 21,663.03 42,686.23 26,235.42U.S.A 108,332.95 77,759.63 62,254.59 51,016.72 38,048.03Japan 231,203.54 209,988.21 205,304.57 207,645.20 168,889.20Total 628,780.38 504,355.50 432,966.45 445,291.78 396,129.07Source: Compiled using data from the Ministry of Commerce, Government of India (GoI).
Fig. 6 Share of different countries in India’s fish exports from major countries, 2006-07
Source: Compiled using data from the Ministry of Commerce, GoI.
To begin with Japan however had the highest share in India’s exports followed by USA (Ta-
ble 4). India’s export to USA over the years increased substantially by about 3 folds to have
the top position. Amongst the exporters Norway has the lowest share.
13
China, Thailand, Vietnam, Indonesia, Mexico, Greenland and Ecuador are the major
competitors of India in the main shrimp export markets. The relative compound growth rate of
shrimp export from India indicates that the country is lagging behind other shrimp exporting
countries both in terms of volume and value. Moreover, some of these countries import Indian
shrimp for reprocessing and, as Kulkarni (2005) notes, the final consumers of Indian fish in
the northern markets are not aware of the origin of their fish as ‘more than 60 percent of In-
dia’s export to south-east Asia are re-exported after processing’.
For the promotion of exports, marine products export development authority has been
constituted with its main office in Kochi (or, Cochin), Kerala, which takes various actions for
improving fish exports from India.
As mentioned above India is a net fish exporting country and imports have not been
very important to the economy. Though there was a small surge in imports in the mid-1990s
(which accounted for a little under 1 percent of the net exports), this was mainly to address
the under-utilisation of processing factories in some states (notably in Kerala), and when this
did not work out to be viable, the share of imports slid back once again. While India’s imports
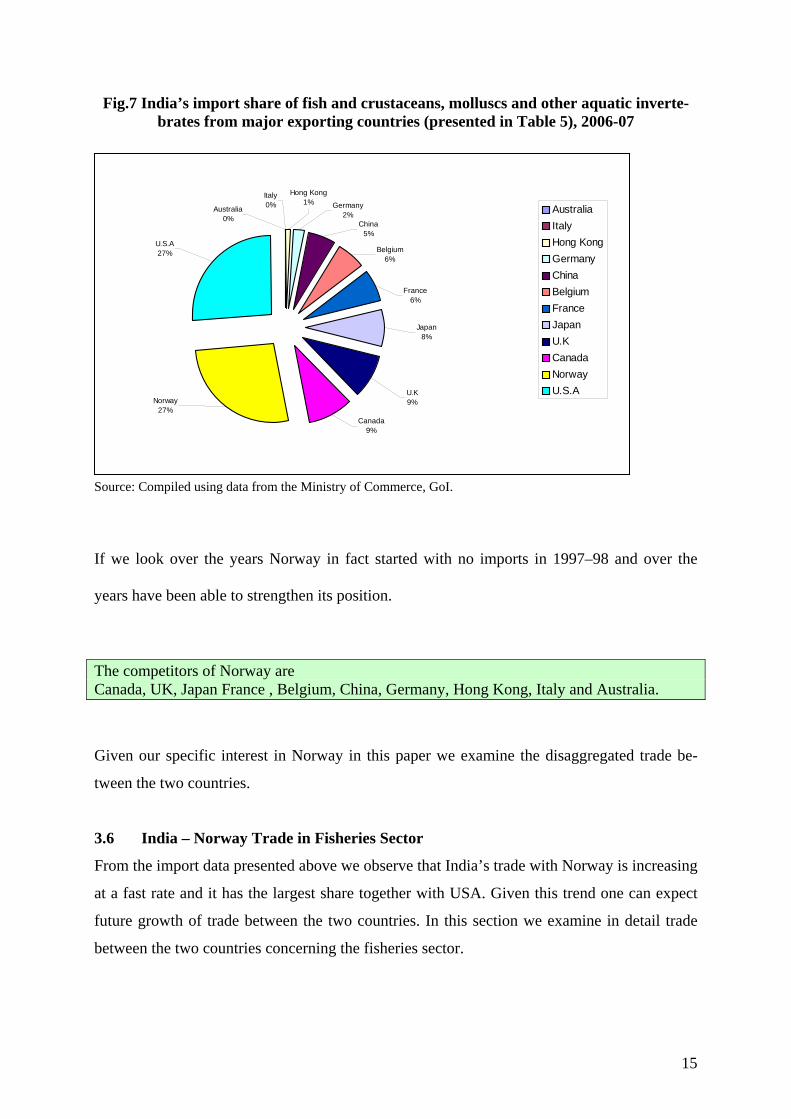
are much lower that exports highest share is that of USA closely followed by Norway. There
has been a significant jump in India’s import of fishery items from Norway (Table 5, Fig. 7).
Table 5: Total Import of Fish and Crustaceans, Molluscs and other Aquatic
Invertebrates, from some selected Countries including Norway (figure in Indian Rupee crores). Country 2001-02 2002-03 2003-04 2004-05 2005-06 2006-07
Australia 1.79 41.05 21.67 0
Italy 21.12 34.08 82.34 10.83 45.72 0.23
Hong Kong 51.44 0.22 12.99
Germany 0.29 148.68 0.42 23.22 27.28
China 3.37 9.33 129.66 44.51 1.41 64.07
Belgium 117.02 60.74 122.49 36.27 72.27
France 5.36 23.92 131.22 13.5 67.05 77.12
Japan 1.78 1.26 39.17 24.1 196.07 91.33
U.K 3.58 148.44 182.35 95.96 327.52 104.14
Canada 0.05 34.37 79.73 112.12
Norway 0.77 117.67 14.72 99.34 161.59 315.67
U.S.A 408.79 308.28 466.88 523.48 1,189.74 315.94
Source: Compiled using data from the Ministry of Commerce, GoI.
14
Fig.7 India’s import share of fish and crustaceans, molluscs and other aquatic inverte-brates from major exporting countries (presented in Table 5), 2006-07
Fig. India’s Import of fish fferent countries, 2006-07 from di
7 %Growth 32.37 1.47 34.11 23.59 43.93 8 %Share of items under code 03
to all commodities export tradewith Norway (1 of 6)
0.33 0.5 0.02 0.05 0 0.09
1 lakh = 10 million Source-Government of India (GoI), Ministry of Commerce & Industry, Department of commerce
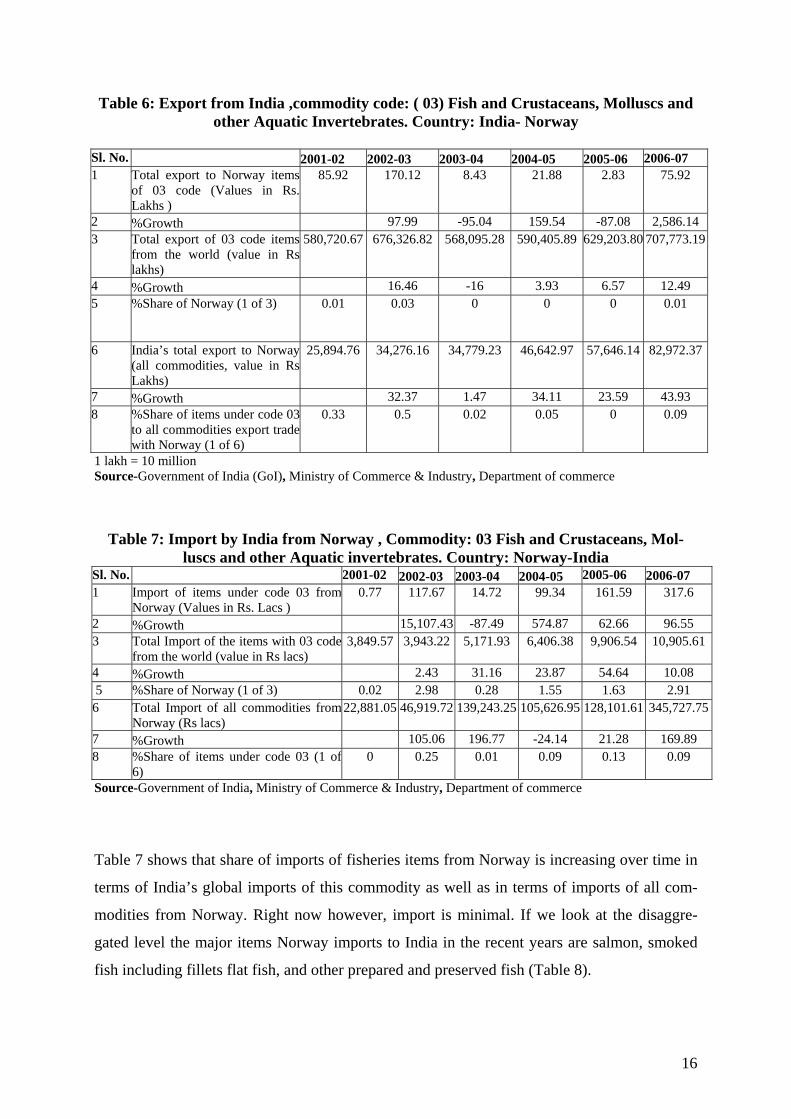
Table 7: Import by India from Norway , Commodity: 03 Fish and Crustaceans, Mol-
luscs and other Aquatic invertebrates. Country: Norway-India Sl. No. 2001-02 2002-03 2003-04 2004-05 2005-06 2006-07 1 Import of items under code 03 from
7 %Growth 105.06 196.77 -24.14 21.28 169.89 8 %Share of items under code 03 (1 of
6) 0 0.25 0.01 0.09 0.13 0.09
Source-Government of India, Ministry of Commerce & Industry, Department of commerce
Table 7 shows that share of imports of fisheries items from Norway is increasing over time in
terms of India’s global imports of this commodity as well as in terms of imports of all com-
modities from Norway. Right now however, import is minimal. If we look at the disaggre-
gated level the major items Norway imports to India in the recent years are salmon, smoked
fish including fillets flat fish, and other prepared and preserved fish (Table 8).
16
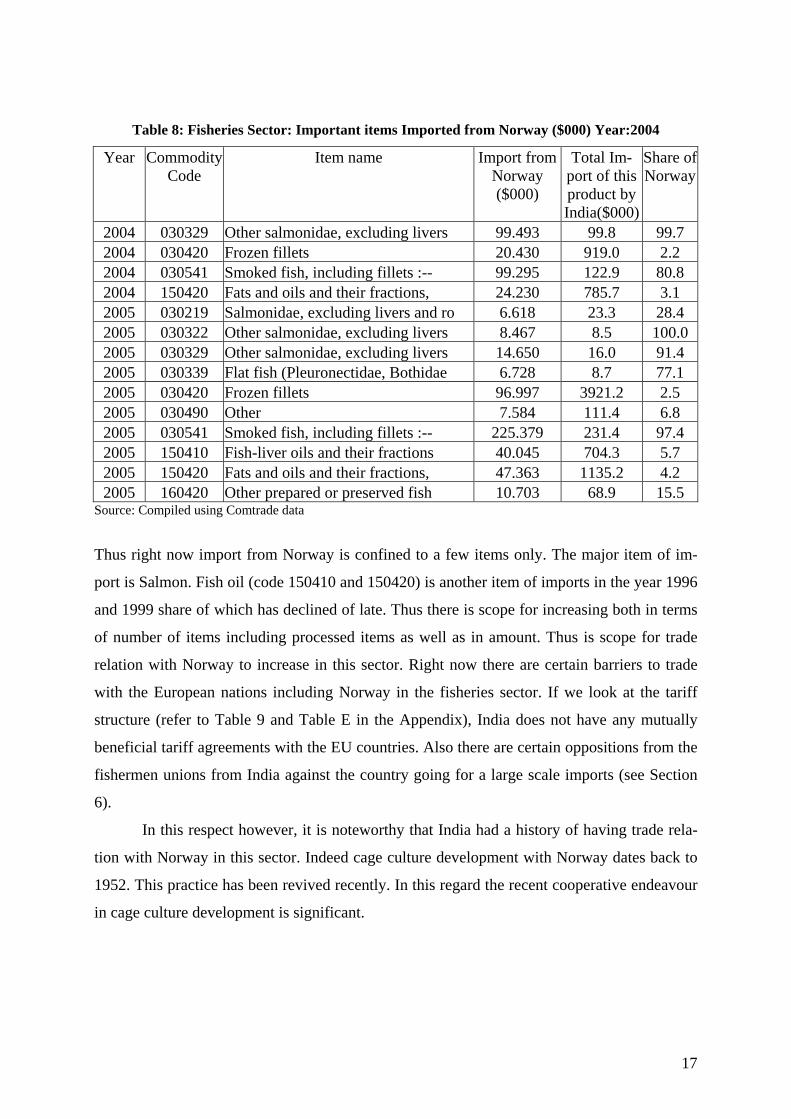
Table 8: Fisheries Sector: Important items Imported from Norway ($000) Year:2004
Year Commodity Code
Item name Import from Norway ($000)
Total Im-port of this product by India($000)
Share of Norway
2004 030329 Other salmonidae, excluding livers 99.493 99.8 99.7 2004 030420 Frozen fillets 20.430 919.0 2.2 2004 030541 Smoked fish, including fillets :-- 99.295 122.9 80.8 2004 150420 Fats and oils and their fractions, 24.230 785.7 3.1 2005 030219 Salmonidae, excluding livers and ro 6.618 23.3 28.4 2005 030322 Other salmonidae, excluding livers 8.467 8.5 100.0 2005 030329 Other salmonidae, excluding livers 14.650 16.0 91.4 2005 030339 Flat fish (Pleuronectidae, Bothidae 6.728 8.7 77.1 2005 030420 Frozen fillets 96.997 3921.2 2.5 2005 030490 Other 7.584 111.4 6.8 2005 030541 Smoked fish, including fillets :-- 225.379 231.4 97.4 2005 150410 Fish-liver oils and their fractions 40.045 704.3 5.7 2005 150420 Fats and oils and their fractions, 47.363 1135.2 4.2 2005 160420 Other prepared or preserved fish 10.703 68.9 15.5
Source: Compiled using Comtrade data
Thus right now import from Norway is confined to a few items only. The major item of im-
port is Salmon. Fish oil (code 150410 and 150420) is another item of imports in the year 1996
and 1999 share of which has declined of late. Thus there is scope for increasing both in terms
of number of items including processed items as well as in amount. Thus is scope for trade
relation with Norway to increase in this sector. Right now there are certain barriers to trade
with the European nations including Norway in the fisheries sector. If we look at the tariff
structure (refer to Table 9 and Table E in the Appendix), India does not have any mutually
beneficial tariff agreements with the EU countries. Also there are certain oppositions from the
fishermen unions from India against the country going for a large scale imports (see Section
6).
In this respect however, it is noteworthy that India had a history of having trade rela-
tion with Norway in this sector. Indeed cage culture development with Norway dates back to
1952. This practice has been revived recently. In this regard the recent cooperative endeavour
in cage culture development is significant.
17
4. Indo-Norwegian Cooperation in Fisheries Sector: Cage Culture Development6
Indo-Norwegian cooperation in the fisheries sector date back to 1952 when the first bilateral
fisheries development project in the world was initiated by Norway in Kerala. Since then
Norway has supported a number of fisheries related projects especially by providing techno-
logical inputs (Maritime, 2007). Recently on 14th August, 2007, Sri Mohan Kumar, Chairman,
MPEDA, has signed a memorandum of Understanding with M/s Innovation Norway, a com-
pany owned by the Norwegian Government for developing cage culture in India .
The project is supposed to carry out a detailed survey of the potential sites in India,
short list sites along the inshore regions and establish pilot-scale projects for commercial
demonstration, after examining the techno-economic feasibility under Indian conditions, on a
turnkey basis. In addition to the development of off-shore cage culture, the project also plans
to examine the possibility of development of suitable health management packages for the
cultured species.
After the EU-India trade agreements take definite shape trade relation with Norway
pertaining to this sector is expected to increase. However, it must be kept in mind that trade in
all varieties of fishes may not get boosted even after an agreement comes to force. Given the
dependency of the poor population on this sector and the demands of the trade unions, India
would try to reserve certain items in its negative list. Both countries need to sit and explore
what items can be traded in a mutually beneficial way. The current status of the agreement
and certain aspects of resistance have been discussed below.
5. Further Trade Potential in Fisheries Sector: India-EU Trade agreement7 In the India –EU summit at Helsinki on 13 October, 2006, political leaders of both regions felt
the need for a broad based trade and investment agreement. There has already been significant
preparatory work. The India-EU High Level Trade Group has been preparing the ground for
these negotiations since October 2005 and its report will form the basis for further delibera-
tion. Subsequently, on 28th June 2007, India and the EU began negotiations on a broad-based
bilateral trade and investment agreement in Brussels, Belgium8. Both parties believe that a
comprehensive and ambitious agreement that is consistent with WTO rules and principles 6 Information collected from MPEDA office, Cochin, Kerala. 7 Benefited from discussions with the Ministry of Commerce and MPEDA officials. 8 Source: ministry of Commerce http://commerce.nic.in/trade/India_EU_Joint_Stat.asp).
Import Tariff in the year 2005 of Selected 03 code items Code Item Country Tariff Rate 03011000 Ornamental Fish 0.00 Preferential tariff for Bangkok agreement 03011000 Ornamental Fish Sri Lanka 0.00 Preferential tariff for Sri Lanka
03011000 Ornamental Fish 15.00Preferential tariff for SAPTA (LDC) coun-tries
03011000 Ornamental Fish World 30.00 Basic customs duty (MFN rate)
03032200 Atlantic salmon (Salmo salar) and Danube salmon (Hucho hucho) 0.00 Preferential tariff for Bangkok agreement
03032200 Atlantic salmon (Salmo salar) and Danube salmon (Hucho hucho) World 30.00 Basic customs duty (MFN rate)
03032200 Atlantic salmon (Salmo salar) and Danube salmon (Hucho hucho) Sri Lanka 0.00 Preferential tariff for Sri Lanka
A careful examination of Table 9 and Table D and E in the Appendix reveals that tariff
under Bangkok agreement and Sri Lanka agreement are nil. Under Sapta LDC regional
agreement incorporating countries such as Bangladesh tariff rate is 15%. Rest of the World
attracts MFN rate of 30%.
When we talk about India’s tariff on fisheries items, the muddle over duty free im-
ports of fish come to the fore. Observing the importance of this issue we tried to gather first
hand knowledge on this issue by discussing with the stakeholders. We held discussions
with the fishermen’s association, boat owner association, fish exporters association and the
MPEDA officials. The following section provides the highlights.
6. Muddle over duty-free import of Fish: Field Experiences The main views put forward by the fishermen and boat owners’ association presidents
during our field visits are as follows.
First concern is that of price dampening. Some of the common varieties such as cuttle
fish, pomphret, anchovy, ribbon fish are caught in China and Thailand as well. Import-
ing these items to India will dampen Indian price and adversely affect fishermen for
whom this is the sole source of livelihood.
Once Indian fishermen find it unprofitable to catch these fisheries items , the conse-
quences are significant. This then becomes a problem of survival of the small fisher-
men. May be for the boat owners this is a question of profit margin, but it is not so for
the poor fishermen.
It is not only the fishermen whose livelihood depends on this industry but a whole
chain of jobs is associated with the industry. They include boat workers, loading
unloading persons and so on. This employment and livelihood angle is very crucial.
Government organization such as MPEDA is propagating import of fish in order to
process and re-export. This will however benefit the large entrepreneurs who own
these processing units. It is difficult to check supply of such imported items to the do-
mestic market once imports take place. Thus in a sense there is a conflict between
capitalist and labour class.
Another interesting argument is that fish imported from China or Thailand may not be
of quality comparable to the Indian fish. Once they are processed and re-exported and
there is some complain, that will impact indigenous fish exporters as well.
26
Our interviews with the export association however, reveal an opposite view.
They are of the view that the concerns of the fishermen are genuine. However, the
vested interest political groups for their own benefit exaggerate them out of propor-
tion. Quoting the figures from the Ministry of Commerce, Government of India, asso-
ciation remarks that India imported fish worth Rs 890 million during the financial year
2006–07. Out of this, Hilsa alone worth of Rs 516.90 million is imported from Bang-
ladesh for the consumption of the people of West Bengal in India and to export for the
use of Bengali community abroad. Fish worth Rs 50 million was imported for the use
of Foreign Embassy’s and five-star hotels. Raw fish products worth Rs 110 million
was taken outside India, converted to AFD products and brought back to India for ex-
ports. Thus at the end raw fish worth only Rs 215 million was imported by the proc-
essing establishments for processing and re-export. The association feels that the pos-
sibility that fishermen’s livelihood will parish even if fish is imported for processing
and re-export is a remote one.
The Association strongly argues in favour of Government of India signing a free trade
agreement with European Union. They have given a memorandum to this effect. They
consider that this will benefit the fish processing industry and other industries of India.
Association further argues that about 10 lakh workers are engaged in the sea food
processing industry in India. Studies conducted in this area show that additional 5 mil-
lion job opportunities can be created by importing fish for processing in India for ex-
port.
MPEDA officials also echoed same views during our interview. These views are summarized
below.
India has a very well developed processing industry. These units are following strict
quality control norms that are EU certified. Indeed entrepreneurs of this sector have
upgraded their facilities by investing heavily.
Ironically however, 80% of their capacity has remained unutilized. This is a big loss to
the industry.
This is due to the fact that there is substantial scarcity of raw fish. Sea has been ex-
ploited sufficiently and the domestic production of cultured fish is also not been able
to meet the demand of this sector.
27
Under such circumstances if fish is imported from other countries and processed for
re-export, that can only benefit the economy without hampering the business of the
poor fishermen.
Thus we observe that while Government bodies and export associations are on one side , fish-
ermen’s unions are on the other. In India this is not a problem unique to the fisheries sector.
Ever since India embarked upon its liberalization program from 1990–91 onwards, each drive
to open up of the markets is looked either with skepticism or faced with protests. After open-
ing up of a sector however, Indian side has most often gained than lost. A classic example is
that of the telecom sector. With much hesitancy Government opened up this sector to end
public monopoly. Today we observe unprecedented growth of this sector, decline of prices,
and no loss of jobs and furthermore growth of secondary sectors like Business Process Out-
sourcing (BPO) Industry that depends on telecom sector.
Currently however, from the intensity of protests it appears that certain items may not
be allowed for imports in the very near future. Nonetheless, within the fisheries sector, there
are definitely items, import of which possibly will not attract much resistance from the trade
unions. Processed and ready to eat fisheries products , marketed for the higher-end customers
through super markets is a possibility. In order to understand the potentials for this segment of
products we have carried out a small survey in certain metropolitan cities of India, concentrat-
ing on the fish eating population.
7. Potentials Demand for Processed Fish: A Survey Based Analysis
Indian has a well developed processed fish industry that is capable of processing and packag-
ing fish for export. The industry indeed is under utilized. However, this industry does not
generally produce finished and semi-finished products which are either ready to eat or can be
consumed with minimal cooking. This may be due to the presumption that there is no demand
for such products in India. While this was the case may be about ten years back, the situation
is fast changing. With current 8%– 9% GDP growth, a robust manufacturing growth and an
impressively growing services sector , there are a large number of professionals in the high
income category who possess considerable disposable income and always hard pressed for
time. Indian IT/BPO industry alone employs above 16,00,0000 professionals. The profes-
sional group though currently may not have high demand for such ready to eat products but
are definitely potential customers in the long run. To understand the market potentials we
28
have carried out a survey of 100 such customers in Karnataka and Kerala. Though the survey
is confined to these two states , Bangalore being a cosmopolitan city and an IT hub, we could
get people from different parts of the country.
Survey Methodology
A structured questionnaire has been administered on the potential customers. The two stage
sampling technique is used. First a shopping mall or a company is selected and then a number
of visitors or employees are selected at random and if they are found to be consumers of fish
the interview proceeded further. The survey is conducted in Bangalore in Karnataka and
Cochin in Kerala. Sample size is 10012.
Sample Profile
Most of our respondents are from the corporate sector (71%) and another 10% are having
small and medium size business (Fig. 8). Professionals are not necessarily from the IT sector
alone. Thus 80% of the respondents are in the higher middle income category who can afford
to purchase processed, semi-cooked or ready to eat items.
Fig.8 Occupation of the respondents
percentage of people in different occupation
10.2 18.3871.42
01020304050607080
Business CorporateService
GovtService
occupation
perc
enta
ge
.
Source: Field Survey
There are also a few respondents from (18%) engaged in Government sector jobs such as aca-
demic professions etc. Income-wise 80% of them earn Rs 0.3 million yearly or more. 25% of
12 Survey Questionnaire has been provided in the Appendix. Due to the reservations of the respondents, personal details (identifications) of the respondents have not been demanded in the survey. Survey has been conducted mainly in different malls and public places during the month Dec, 2007 and Jan, 2008 for about 10 days.
29
the respondents take fish almost every day while 53% take at least once a week. Thus in the
respondent group we have are regular fish eaters.
Age profile-wise (Fig 9) most of our respondents are young professionals who are as-
sumed to be more open to experimenting with new food items.
Out of these respondents 60% are mar-
ried and 40% are unmarried; though
the unmarried ones, usually from an-
other state like Kerala or Bengal , too
prepare their food on their own.
Fig. 9 Age profile of the respondents
Percentage of people in different Age group
50-above4%40-50
17%
30-4038%
Below 30 yrs41%
Below 30 yrs30-4040-5050-above
Source: Field Survey
Findings
Though this sample is statistically not a representation of the population as the sample size is
not considerably large, nonetheless some of the findings from the survey do provide indica-
tions about the market potentials.
If we look at the current fish consumption habits even amongst this comparatively
richer section, one can find that (Fig.10) only 12 % of the consumers buy fish from big gro-
cery shops which keep packed frozen fish. A large percentage of buyers purchase fish either
from a fish vendor who comes door to door or sits in the road side (Fig 1).
Figure 10: Percentage of people Buying fish from Fish vendor/market and Biggest Grocery shop Source: Survey
30
Fish vendor62%
Both (Fish Vendor & grocery Shop)
18%
Market8%
Biggest grocery shop12%
A close examination of these respondents reveals that the consumers who buy fish items from
big grocery shops are mostly in the highest income category within our sample (that is, yearly
income Rs 0.5 million or more). However, it is also interesting to note that a large percentage
of respondents (62%) within this income group purchase fish from vendor or market.
About 93% of the respondents reveal that they prefer either live or frozen fish that are
caught and locally sold. Only 7% of the respondents show their affinity towards packed fro-
zen fish items (Fig. 11). Most of them however, are seen to be aware of the tinned or ready to
eat type of items. About 93% of our respondents are aware of processed and packed food (fig
2) and 77% are aware of the presence of tinned fish items such as tuna etc.
Fig.11 Percentage of people aware about processed and packed items
91.83
8.17
0102030405060708090
100
Yes No
Aware about processed and packed items
Perc
enta
ge
Source: survey
While they are aware of the presence of such items in the market about 46% have never tasted
them (Fig.12) . Thus their awareness is found to be very limited.
31
Fig.12 Preference for processed fish items (percentage of respondents)
Source: Survey
Amongst another 44% who tasted, 14% do not like the products very much. This may be due
to the fact that Indian packed and ready to eat fish market is not well developed at this stage.
There are not many choices for the consumers. In particular, 10% of the respondents are
averse to the idea and do not like to even taste. Those who consume such items also have
them at most once is a month while they eat fresh fish from vendors at least twice a week.
The reasons for not preferring such items are stated as they are not as tasty as the fresh
fish and often too costly. 67% of the respondents feel that that not easy availability, , taste and
price are the main reason for not preferring to each these items. About 20% of the respondents
specifically talks about price being too high.
Yes, don’t like14%
Not eaten46%
Yes (like)30%
Not eaten, don’t like
10%
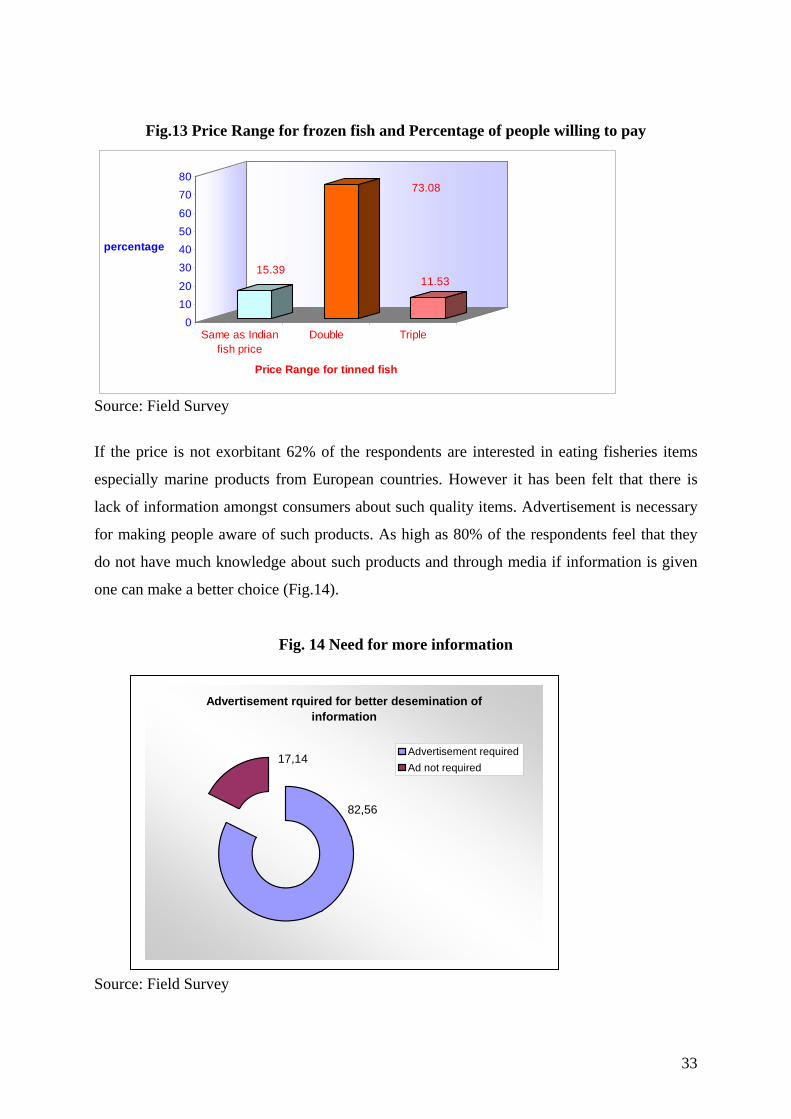
When we examined the possibility that if quality of such products is ensured and more
interesting products are brought to the market what should be the price they would be ready to
pay, it is observed that 73 % of the respondents are ready to pay double the price of what they
on an average pay for the Indian fish. Another 15 % can pay only as much as the Indian fish.
(Fig. 13).
32
Fig.13 Price Range for frozen fish and Percentage of people willing to pay
01020
30405060
7080
percentage
15.39
73.08
11.53
Same as Indian
fish priceDouble Triple
Price Range for tinned fish Source: Field Survey
If the price is not exorbitant 62% of the respondents are interested in eating fisheries items
especially marine products from European countries. However it has been felt that there is
lack of information amongst consumers about such quality items. Advertisement is necessary
for making people aware of such products. As high as 80% of the respondents feel that they
do not have much knowledge about such products and through media if information is given
one can make a better choice (Fig.14).
Fig. 14 Need for more information
Advertisement rquired for better desemination of information
82,56
17,14 Advertisement requiredAd not required
Source: Field Survey
33
Summary Observations
During our survey we have observed that the Indian customers currently are somewhat hesi-
tant to purchase processed fish products which may be semi-cooked or ready to eat. Most of
them ascribe it to their likings for fresh fish rather than packed and imported. Some respon-
dents also showed concern about quality. Especially the Muslim respondents are hesitant to
eat non-vegetarian products from the Western countries as they fear it may contain pork.
However, we strongly felt from our interactions that general hesitancy about quality, fresh-
ness etc. are stemming from lack of information. All these respondent consumers eat many
other Indian products that may not be free from all impurities.
With the growth of the services as well as manufacturing sector there is a large profes-
sional group that has sufficient income. With nuclear family structure and both spouses work-
ing, time has become the most valuable commodity. Under such circumstances potentially
there is a big market for fisheries and marine products that are processed, may be ready to eat,
which has remain almost unexplored.
However, demand for such products needs to be developed through proper informa-
tion dissemination showing the utility of the products. Advertisement in popular media there-
fore is a must to capture this market. Another important aspect however, is the price. As our
survey shows if the prices are more than three times higher than the average Indian fish price,
it is not acceptable to the Indian customers. Thus to begin with those products which can be
exported by Norway to India at a reasonable price may be attempted. Efforts to popularize
such products also have to be made side by side- as from our survey we observe that currently
knowledge about processed fisheries products appears to be very limited.
Our survey has covered only individual respondents. There is also demand for fish
from the hotels and restaurants. Hotel business at present is thriving in India and the Gov-
ernment has increased foreign direct investment limit in this segment to 100%. As a result
many foreign-based hotels are already there is in the major metros of India. US-based HVS
International has firmed up plans to enter India, and industry players believe others like Ash-
ford Hospitality Trust and IFA Hotels & Resorts among others are likely to follow suit. The
government forecasts an additional requirement of 200,000 rooms by the turn of the century.
A rapidly growing middle class, the advent of corporate incentive travel and multinational
companies presence in India have boosted prospects for tourism. India’s easy visa rules,
public freedoms and its many attractions as an ancient civilisation makes tourism develop-
ment easier than in many other countries. It is important to note that the luxury hotels will
have demand for any exotic marine products regardless of price. This segment of the market
34
can also be tapped for the export of Norwegian Salmon and other such expensive varieties of
fish.
8. Conclusion
After observing the positive effects of trade India is currently making extensive efforts to en-
hance the trade opportunities to improve it competitiveness in the world trade scenario. Con-
sequently, a comprehensive Foreign Trade Policy (2004–2009) has been developed to im-
prove the trading system. The objective of the new Foreign Trade Policy is the overall devel-
opment of India’s foreign trade.
Two major objectives of the foreign trade policy 2004–2009 are (1) to double India’s
percentage share of global merchandise trade by 2009 and (2) to act as an effective instrument
of economic growth by giving a thrust to employment generation, especially in semi-urban
and rural areas. To enhance growth in trade, India is taking various pro-active measures such
as reduction of controls, bringing in transparency and simplifications in bureaucratic proce-
dures, and reducing duties. Special attention is given to attract foreign direct investment. Sec-
tors with significant export prospects and potential for employment generation in semi-urban
and rural areas have been identified as thrust sectors, and specific sectoral strategies have
been prepared.
In her effort to enhance export India also realizes the need to open up her economy for
imports. Thus unilaterally India has been relaxing several of her earlier import restrictions.
Amongst various sectors opened up agriculture and animal husbandry sector is slow to open
up. This is mainly because still a large proportion of rural poor population (above 60%) de-
pends on this sector. Prices of these essential commodities are also a major concern.
However, the scenario is changing even for these sectors if not as fast as the manufac-
turing and services sectors. Concentrating on the fisheries sector we observe from the above
analysis that in India import of fish is still minimal. Currently Norway is one of the major
exporters to India and import from Norway as well as total imports in fisheries sector is stead-
ily rising from last 5 years or so. .
Since fishing is the occupation of a large number of poor households especially in the
coastal region, import is always considered as a threat to their livelihood. This however, need
not be always true. While a rapid growth may not take place immediately, situation is ex-
pected to change over time. This can be also seen from our field level experiences with the
exporters associations and MPEDA officials who are strongly in favour of certain imports. At
35
this hour therefore, it is necessary to identify products, trade of which are not going to have
detrimental effect on the business of the poor fishermen. Collaboration in technology concern-
ing the fisheries sector can be an area of interest for both Norway and India. Similarly equip-
ments and peripherals for ornamental fish is another area. India in fact has a good demand for
ornamental fish but due to strict restrictions, importers find tremendous difficulty to import
(as revealed by importers during our survey). This is one area which during EU negotiation
one may highlight.
With liberalization and opening up of the market, the economy is undergoing signifi-
cant changes. There is now a large group of population that can afford exotic seafood and
other marine items, which India does not produce. There is substantial demand for these items
from hotel industry as well. Processed semi-cooked product market is also not yet developed
fully in India. These are certain product groups that may be explored initially. As our survey
shows current knowledge of the consumers is very limited. Thus information needs to be en-
hanced. However, to reach a sizeable population, price has to be competitive as the purchas-
ing power of the mass is still not high in India. Thus, though trade in this sector is not ex-
pected to increase manifolds in the near future, there are definite chances of new opportunities
of trade to come up.
36
References
AAI. (2002). Aquaculture Authority News. 1(1), Chennai: Aquaculture Authority of India.
Dehadrai, P V., & Yadava, Y S. (2004). State of the Indian Farmer: A Millennium Stud. 13.
Kurien, J. (1985). Technical Assistance Projects and Socio-Economic Change: Norwegian
Intervention in Kerala’s Fisheries Development. Review of Agriculture, Economic and
Political Weekly, XX (25 and 26), 22–29.
Mathew, S. (2003). Trade in Fisheries and Human Development: Country Case Study– India.
Asia Pacific Regional Initiative on Trade, Economic Governance and Human Devel-
opment.
MPEDA. (2001). MPEDA: An Overview. The Marine Products Export Development Author-
ity.
MPEDA. (2006). Export Performance, 2004–05. Retrieved on September 2007, from website
http://www.mpeda.com.
Salagrama, V. (2004a). A study of market supply chains in fisheries in the southern districts of
Orissa. Study done for Oxfam (GB), Bhubaneswar. Integrated Coastal Management,
Kakinada. Retrieved September 2007, from website
http://www.onefish.org/id/243733.
38
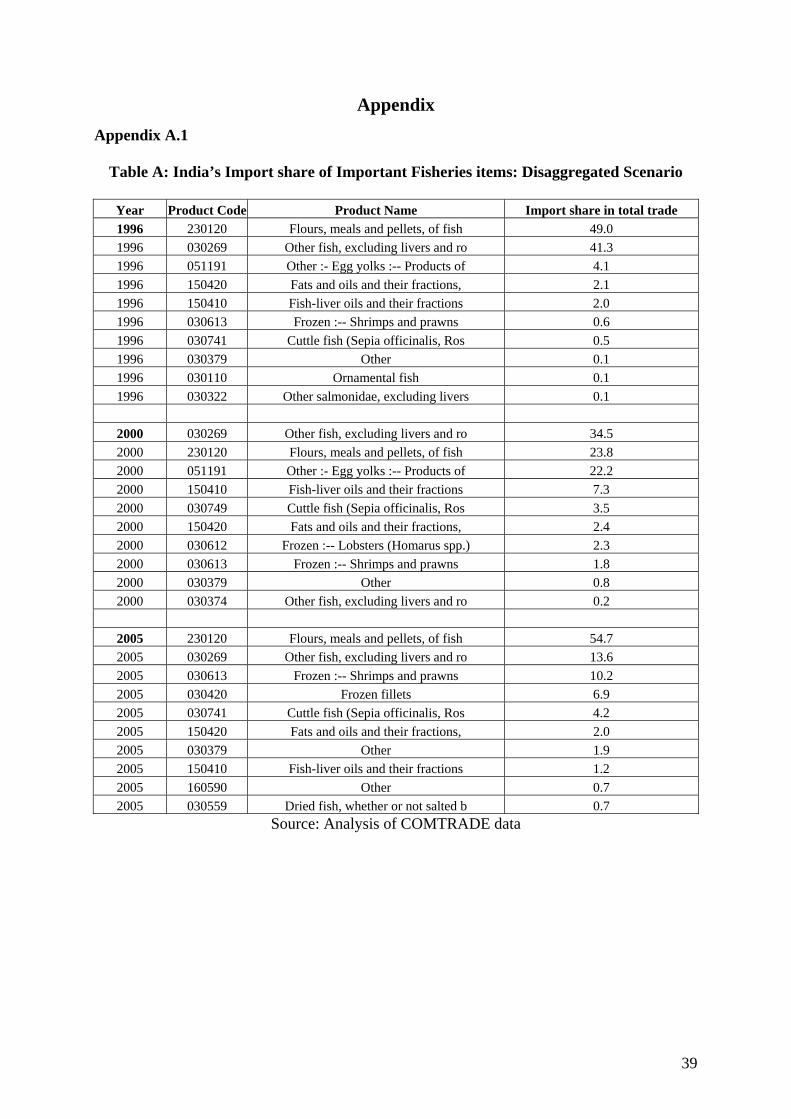
Appendix Appendix A.1
Table A: India’s Import share of Important Fisheries items: Disaggregated Scenario
Year Product Code Product Name Import share in total trade 1996 230120 Flours, meals and pellets, of fish 49.0 1996 030269 Other fish, excluding livers and ro 41.3 1996 051191 Other :- Egg yolks :-- Products of 4.1 1996 150420 Fats and oils and their fractions, 2.1 1996 150410 Fish-liver oils and their fractions 2.0 1996 030613 Frozen :-- Shrimps and prawns 0.6 1996 030741 Cuttle fish (Sepia officinalis, Ros 0.5 1996 030379 Other 0.1 1996 030110 Ornamental fish 0.1 1996 030322 Other salmonidae, excluding livers 0.1
2000 030269 Other fish, excluding livers and ro 34.5 2000 230120 Flours, meals and pellets, of fish 23.8 2000 051191 Other :- Egg yolks :-- Products of 22.2 2000 150410 Fish-liver oils and their fractions 7.3 2000 030749 Cuttle fish (Sepia officinalis, Ros 3.5 2000 150420 Fats and oils and their fractions, 2.4 2000 030612 Frozen :-- Lobsters (Homarus spp.) 2.3 2000 030613 Frozen :-- Shrimps and prawns 1.8 2000 030379 Other 0.8 2000 030374 Other fish, excluding livers and ro 0.2
2005 230120 Flours, meals and pellets, of fish 54.7 2005 030269 Other fish, excluding livers and ro 13.6 2005 030613 Frozen :-- Shrimps and prawns 10.2 2005 030420 Frozen fillets 6.9 2005 030741 Cuttle fish (Sepia officinalis, Ros 4.2 2005 150420 Fats and oils and their fractions, 2.0 2005 030379 Other 1.9 2005 150410 Fish-liver oils and their fractions 1.2 2005 160590 Other 0.7 2005 030559 Dried fish, whether or not salted b 0.7
Source: Analysis of COMTRADE data
39
Table B: India’s Export share of Important Fisheries items: Disaggregated Scenario Year Product Product Name Export share in total trade 1996 030613 Frozen :-- Shrimps and prawns 64.28 1996 030379 Other 18.18 1996 030749 Cuttle fish (Sepia officinalis, Ros 5.03 1996 030741 Cuttle fish (Sepia officinalis, Ros 4.22 1996 030420 Frozen fillets 1.66 1996 030612 Frozen :-- Lobsters (Homarus spp.) 1.09 1996 030269 Other fish, excluding livers and ro 0.80 1996 030624 Not frozen :-- Crabs 0.65 1996 030374 Other fish, excluding livers and ro 0.51 1996 051191 Other :- Egg yolks :-- Products of 0.51
2000 030613 Frozen :-- Shrimps and prawns 63.25 2000 030379 Other 19.87 2000 030749 Cuttle fish (Sepia officinalis, Ros 3.50 2000 030612 Frozen :-- Lobsters (Homarus spp.) 3.22 2000 030741 Cuttle fish (Sepia officinalis, Ros 3.12 2000 051191 Other :- Egg yolks :-- Products of 0.84 2000 030624 Not frozen :-- Crabs 0.78 2000 030420 Frozen fillets 0.58 2000 030614 Frozen :-- Crabs 0.53 2000 030490 Other 0.45
2005 030613 Frozen :-- Shrimps and prawns 53.51 2005 030379 Other 13.95 2005 160520 Shrimps and prawns 7.70 2005 030741 Cuttle fish (Sepia officinalis, Ros 7.01 2005 030749 Cuttle fish (Sepia officinalis, Ros 5.29 2005 160420 Other prepared or preserved fish 1.71 2005 030614 Frozen :-- Crabs 1.37 2005 030420 Frozen fillets 1.26 2005 030269 Other fish, excluding livers and ro 1.10 2005 030624 Not frozen :-- Crabs 0.78
Source: Analysis of COMTRADE data
40
Table C :Selected Fisheries Products (especially that are Imported from Norway) and the Import Tariff Structure, 2005
Product Code Product Description Name AdValorem Measure Name
03032200 Atlantic salmon (Salmo salar) and
Danube salmon (Hucho hucho) 0.00 Preferential tariff for Bangkok agreement
Danube salmon (Hucho hucho) Sri Lanka 0.00 Preferential tariff for Sri Lanka
03032200 Atlantic salmon (Salmo salar) and
Danube salmon (Hucho hucho) 15.00 Preferential tariff for SAPTA (LDC) countries15041010 Cod liver oil World 30.00 Basic customs duty (MFN rate) 15041010 Cod liver oil Sri Lanka 0.00 Preferential tariff for Sri Lanka 15041010 Cod liver oil 15.00 Preferential tariff for SAPTA (LDC) countries15042010 Fish body oil Sri Lanka 0.00 Preferential tariff for Sri Lanka 15042010 Fish body oil 15.00 Preferential tariff for SAPTA (LDC) countries15042010 Fish body oil World 30.00 Basic customs duty (MFN rate) 15042020 Fish lipid oil World 30.00 Basic customs duty (MFN rate) 15042020 Fish lipid oil Sri Lanka 0.00 Preferential tariff for Sri Lanka 15042020 Fish lipid oil 15.00 Preferential tariff for SAPTA (LDC) countries16042000 Other prepared or preserved fish World 30.00 Basic customs duty (MFN rate) 16042000 Other prepared or preserved fish Sri Lanka 0.00 Preferential tariff for Sri Lanka 16042000 Other prepared or preserved fish 15.00 Preferential tariff for SAPTA (LDC) countries03042030 Seer World 30.00 Basic customs duty (MFN rate) 03042030 Seer Sri Lanka 0.00 Preferential tariff for Sri Lanka 03042030 Seer 15.00 Preferential tariff for SAPTA (LDC) countries03042040 Tuna Sri Lanka 0.00 Preferential tariff for Sri Lanka 03042040 Tuna 0.00 Preferential tariff for Bangkok agreement 03042040 Tuna 15.00 Preferential tariff for SAPTA (LDC) countries03042040 Tuna World 30.00 Basic customs duty (MFN rate) 03042050 Cuttlefish World 30.00 Basic customs duty (MFN rate) 03042050 Cuttlefish 15.00 Preferential tariff for SAPTA (LDC) countries03042050 Cuttlefish Sri Lanka 0.00 Preferential tariff for Sri Lanka 03042050 Cuttlefish 0.00 Preferential tariff for Bangkok agreement
Source: Analysis of TRAINS data
41
Table D: Trade agreements
42
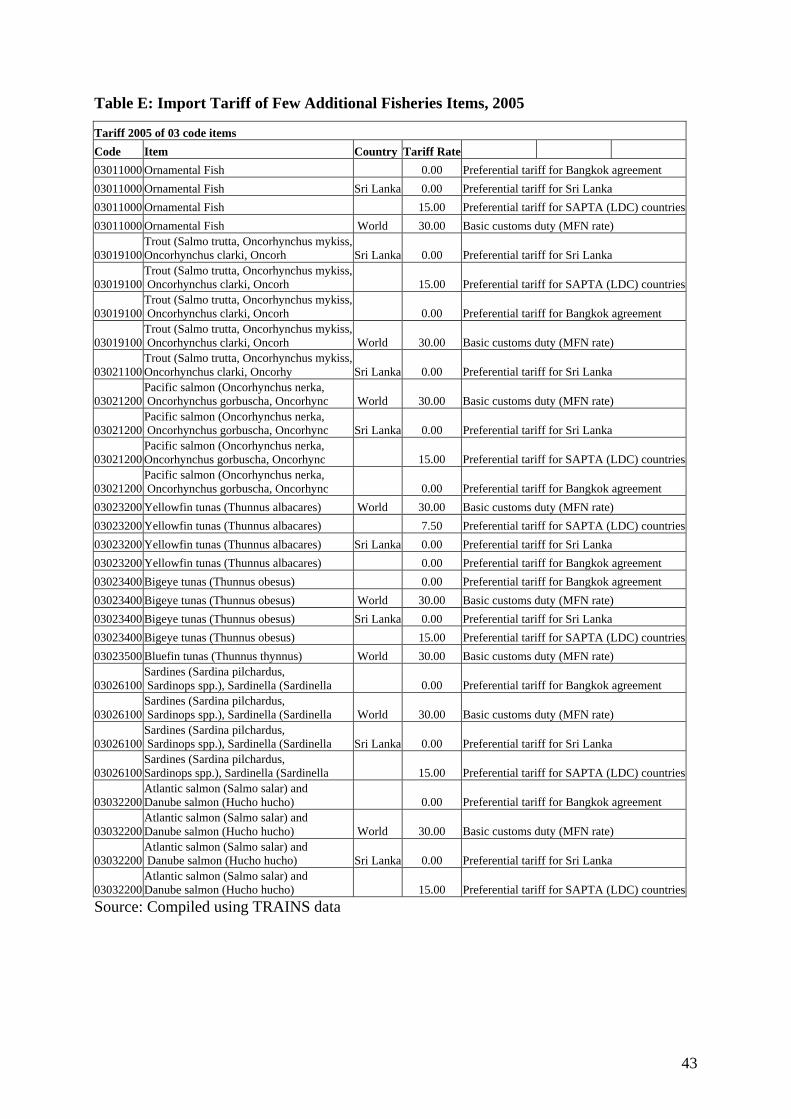
Table E: Import Tariff of Few Additional Fisheries Items, 2005
Tariff 2005 of 03 code items Code Item Country Tariff Rate 03011000 Ornamental Fish 0.00 Preferential tariff for Bangkok agreement 03011000 Ornamental Fish Sri Lanka 0.00 Preferential tariff for Sri Lanka 03011000 Ornamental Fish 15.00 Preferential tariff for SAPTA (LDC) countries03011000 Ornamental Fish World 30.00 Basic customs duty (MFN rate)
03019100 Trout (Salmo trutta, Oncorhynchus mykiss, Oncorhynchus clarki, Oncorh Sri Lanka 0.00 Preferential tariff for Sri Lanka
03019100 Trout (Salmo trutta, Oncorhynchus mykiss, Oncorhynchus clarki, Oncorh 15.00 Preferential tariff for SAPTA (LDC) countries
03026100 Sardines (Sardina pilchardus, Sardinops spp.), Sardinella (Sardinella Sri Lanka 0.00 Preferential tariff for Sri Lanka
03026100 Sardines (Sardina pilchardus, Sardinops spp.), Sardinella (Sardinella 15.00 Preferential tariff for SAPTA (LDC) countries
03032200 Atlantic salmon (Salmo salar) and Danube salmon (Hucho hucho) 0.00 Preferential tariff for Bangkok agreement
03032200 Atlantic salmon (Salmo salar) and Danube salmon (Hucho hucho) World 30.00 Basic customs duty (MFN rate)
03032200 Atlantic salmon (Salmo salar) and Danube salmon (Hucho hucho) Sri Lanka 0.00 Preferential tariff for Sri Lanka
03032200 Atlantic salmon (Salmo salar) and Danube salmon (Hucho hucho) 15.00 Preferential tariff for SAPTA (LDC) countries
Source: Compiled using TRAINS data
43
Appendix A.2
Survey Questionnaire
Survey of the Potential Customers for Fish Related Products
1. Name : (optional) 2. Male/Female 3. Married: yes, No 4. Age: below 30 yrs, 30—40, 40—50, 50 and above. 5. Occupation 6. Family Income (husband + wife) Annual : a) Below 2 lakhs b) 2-3.5 lakh c) 3.5-5 lakhs d) 5 lakhs and above 7. Original state 8. Apart from fish what other non-veg item you consume? 9. What item you eat most frequently ?
10. How frequently you eat this item?
11. How frequently you eat fish
12. Are you buying fish from a fish vendor or bigger grocery shop like food world?
13. If both what are the frequencies : vendor: super market/Store:
14. What kind of fish item you like (indicate preferences): fresh water live: frozen: Proc-
essed Items:
15. Are you aware that there are tinned fish item (like tinned tuna): Yes/No
16. Are you aware that there are processed and packed fish items(like fish cutlets):
Yes/No
If you are aware 17. Have you eaten and Do you like tinned fish? (specify variety)
18. Do you have demand for frozen/processed fish items (cutlets etc.) (specify item-wise
details)
44
45
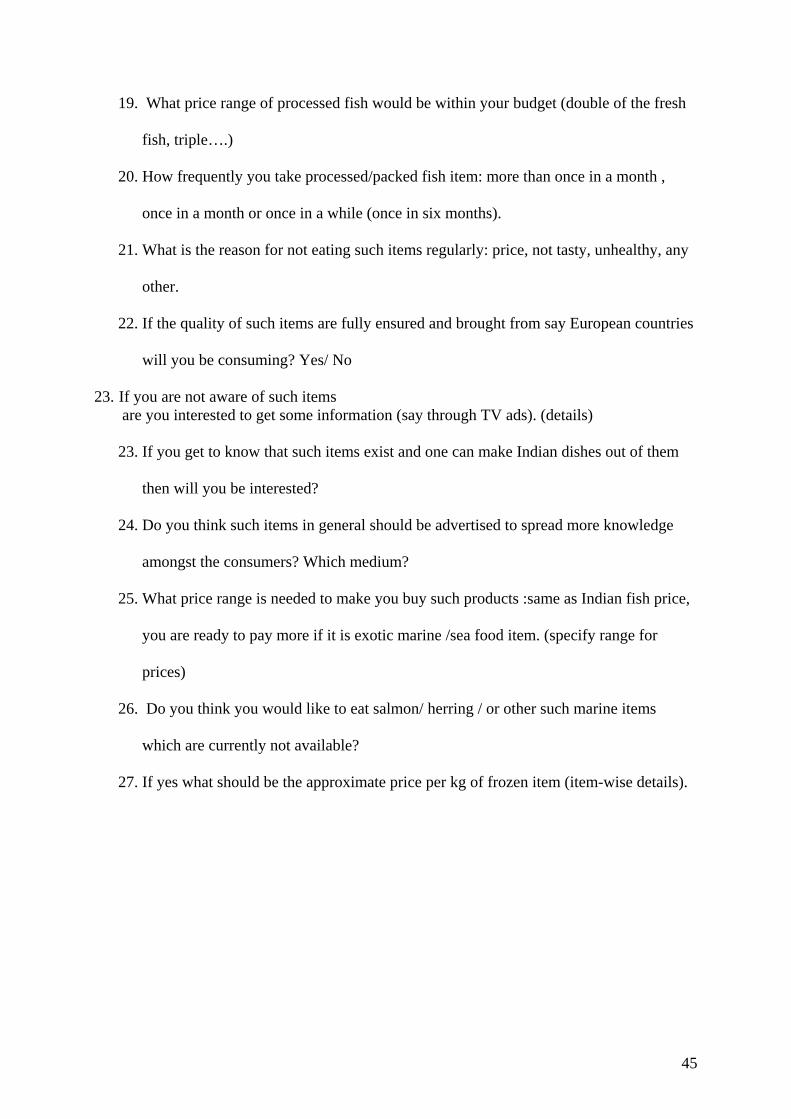
19. What price range of processed fish would be within your budget (double of the fresh
fish, triple….)
20. How frequently you take processed/packed fish item: more than once in a month ,
once in a month or once in a while (once in six months).
21. What is the reason for not eating such items regularly: price, not tasty, unhealthy, any
other.
22. If the quality of such items are fully ensured and brought from say European countries
will you be consuming? Yes/ No
23. If you are not aware of such items are you interested to get some information (say through TV ads). (details)
23. If you get to know that such items exist and one can make Indian dishes out of them
then will you be interested?
24. Do you think such items in general should be advertised to spread more knowledge
amongst the consumers? Which medium?
25. What price range is needed to make you buy such products :same as Indian fish price,
you are ready to pay more if it is exotic marine /sea food item. (specify range for
prices)
26. Do you think you would like to eat salmon/ herring / or other such marine items
which are currently not available?
27. If yes what should be the approximate price per kg of frozen item (item-wise details).