YOUNG-LAPLACE EQUATION IN CONVENIENT POLAR COORDINATES AND ITS IMPLEMENTATION IN MATLAB ® ECUACIÓN DE YOUNG-LAPLACE EN COORDENADAS POLARES CONVENIENTES Y SU IMPLEMENTACIÓN EN MATLAB ® EQUAÇÃO DE YOUNG-LAPLACE EM COORDENADAS POLARES ADEQUADAS E SUA PROGRAMAÇÃO EM MATLAB ® Alberto R. Albis 1,2 , Adriana F. Rincón 1 Recibido: 18/06/10 – Aceptado: 12/11/10 A new form of expression for the Young-Laplace equation is proposed. The Young-Laplace equation is develo- ped in a convenient polar coordinate system and programmed in MatLab®. The profile generated showed to be in agreement with those reported in literatu- re. An algorithm that avoids profile inter- polation was developed and tested for the measurement of surface tension from profiles of pendant drops. : drop profile, polar coor- dinates, Young-Laplace equation, Mat- Lab®. Se propone una nueva forma para expre- sar la ecuación de Young-Laplace. Se de- sarrolló la ecuación de Young-Laplace en un sistema de coordenadas tipo polar con- veniente, y su solución se programó en el software MatLab®. Los perfiles que se generaron mostraron una excelente coin- cidencia con los reportados en la literatu- ra. Se desarrolló un algoritmo que evita la interpolación en los perfiles, el cual se evaluó para la determinación de la tensión superficial a partir de perfiles de gotas pendientes. : perfil de gota, coor- denadas polares, ecuación de Young-La- place, MatLab. Propõe-se uma nova forma para expres- sar a equação de Young-Laplace. Desen- volveu-se a equação de Young-Laplace em um sistema de coordenadas tipo polar adequado e sua solução programou-se no software MatLab®. Os perfis gerados mostraram uma excelente coincidência com os reportados na literatura. Desen- volveu-se um algoritmo que evita a inter- 413 REVISTA COLOMBIANA DE QUÍMICA, VOLUMEN 39, nro. 3 DE 2010 Fisicoquímica e Inorgánica 1 Facultad de Ingeniería, Universidad del Atlántico, Km. 7 antigua vía a Puerto Colombia, Barranquilla, Colombia. 2 [email protected]
Transcript
YOUNG-LAPLACE EQUATION IN CONVENIENT POLAR COORDINATESAND ITS IMPLEMENTATION IN MATLAB®
ECUACIÓN DE YOUNG-LAPLACE EN COORDENADAS POLARESCONVENIENTES Y SU IMPLEMENTACIÓN EN MATLAB®
EQUAÇÃO DE YOUNG-LAPLACE EM COORDENADAS POLARESADEQUADAS E SUA PROGRAMAÇÃO EM MATLAB®
Alberto R. Albis1,2, Adriana F. Rincón1
Recibido: 18/06/10 – Aceptado: 12/11/10
A new form of expression for theYoung-Laplace equation is proposed.The Young-Laplace equation is develo-ped in a convenient polar coordinatesystem and programmed in MatLab®.The profile generated showed to be inagreement with those reported in literatu-re. An algorithm that avoids profile inter-polation was developed and tested for themeasurement of surface tension fromprofiles of pendant drops.
: drop profile, polar coor-dinates, Young-Laplace equation, Mat-Lab®.
Se propone una nueva forma para expre-sar la ecuación de Young-Laplace. Se de-sarrolló la ecuación de Young-Laplace enun sistema de coordenadas tipo polar con-veniente, y su solución se programó en el
software MatLab®. Los perfiles que segeneraron mostraron una excelente coin-cidencia con los reportados en la literatu-ra. Se desarrolló un algoritmo que evita lainterpolación en los perfiles, el cual seevaluó para la determinación de la tensiónsuperficial a partir de perfiles de gotaspendientes.
: perfil de gota, coor-denadas polares, ecuación de Young-La-place, MatLab.
Propõe-se uma nova forma para expres-sar a equação de Young-Laplace. Desen-volveu-se a equação de Young-Laplaceem um sistema de coordenadas tipo polaradequado e sua solução programou-se nosoftware MatLab®. Os perfis geradosmostraram uma excelente coincidênciacom os reportados na literatura. Desen-volveu-se um algoritmo que evita a inter-
413
REVISTA COLOMBIANA DE QUÍMICA, VOLUMEN 39, nro. 3 DE 2010
Fis
ico
quím
ica
eIn
org
ánic
a
1 Facultad de Ingeniería, Universidad del Atlántico, Km. 7 antigua vía a Puerto Colombia, Barranquilla, Colombia.
polação nos perfis, o qual foi avaliadopara a determinação da tensão superficiala partir de perfis de gotas pingentes.
: perfil de gota, coor-denadas polares, equação de Young-La-place, MatLab.
Surface and interfacial tension are veryimportant properties in science and engi-neering due to the role they play in seve-ral processes such as emulsification andfoaming. Besides, this property is verysensitive to the presence of contaminantsand gives insight about the behavior of in-termolecular forces at interfaces. Relia-ble values for this property are often re-quired and trustfully techniques areneeded to measure it.
Many techniques have been developedto measure surface tension (1). Amongthe commonly used methods, drop shapemethods based on the analysis of the sha-pe and size of a pendant drop has severaladvantages: They are absolute methodsand do not depend on the contact anglebetween the liquid and the solid surface.Besides, the amount of sample is small;they have excellent precision, are appli-cable to both air-liquid and liquid–liquidinterfaces, and are versatile, simple andappropriated in several situations, inclu-ding extreme temperature and pressure.They have also been used to determinatethe adsorption properties of biologicalsystems, including protein adsorption atinterfaces (2, 3).
The method is based on the Young-La-place equation for capillarity. It comparesthe generated profile obtained by using a
set of initial parameters that include thesurface tension, with the experimentalprofile. The procedure is repeated for se-veral values of surface tension until agood agreement between theoreticallycalculated and experimental profile isfound (4-6).
Several changes on the original met-hod have been introduced after its appea-rance in the 90’s (5, 6). The modifica-tions include improvements in thehardware (7), lens, CCD camera, lightsource, etc., changes in the algorithms toincluded new numerical methods (8-10),edge detection algorithms (11), and theapplication of the method to turbid sam-ples (7, 12).
One of the disadvantages of using theCartesian form of the Young-Laplaceequation is that–for the process of profilecomparison–is necessary to interpolatethe generated profile (13). In this work,the Young-Laplace equation–describingthe profile of pendant drops–is expressedin a convenient polar-like coordinatesystem to avoid interpolation. The resul-ting equations are solved in MatLab®software (2009, The MathWorks), andthe obtained profiles are compared withdata reported in the literature and with re-sults obtained solving the Cartesian formof the equation using MatLab®.
The Young-Laplace equation for capilla-rity was expressed in a convenient coor-dinate system, as suggested by Zholob etal. (13), and further developed by us.The dimensionless form of the equationwas obtained dividing the radii length bythe radii of curvature at the apex. The re-
414
REVISTA COLOMBIANA DE QUÍMICA, VOLUMEN 39, nro. 3 DE 2010
sulting differential equation was numeri-cally solved using MatLab® software fordifferent Bond numbers, and the resultsare compared with literature data. An al-gorithm was also written to obtain theBond number from experimental profi-les. The software was tested using experi-mental-like profiles. The experimen-tal-like profiles were generated solvingnumerically the Young-Laplace equationand adding random noise to simulate realexperimental profiles.
The Young-Laplace equation [1] was de-veloped to describe the profile of a menis-cus inside a capillary, but the subjacentphenomena is the same that gives dropstheir characteristic shapes, therefore itcan be used to described the profile ofpendant and sessile drops (1). In thisequation, the pressure difference, �P, isdescribed by the two radii of curvature,R1 and R2, and the surface tension, �. Thepressure difference can be given in termsof the height, z, and the density differen-ce, ��, and b is the radii of curvature atthe drop apex as shown in equation [2].
�PR R
� �
�
�
��
���
1 1
1 2
[1]
� ��1 1 2
1 2R Rgz
b�
�
�
��
��� �� [2]
For symmetric shapes, the radii of curva-ture R1 and R2 can be expressed as a func-tion of the arc length and the angle formedbetween the x-axis and the tangent line tothe point considered, as presented inequation [3]:
�
d
d sb
xb
z
b
� ��� � �
sin2 [3]
where � is the Bond number defined byequation [4]:
��
�� �
� gb b
a
2 2
2
2[4]
The Bond number is positive for oblaterevolution figures, i.e., bubbles below asurface and meniscus in a capillary, andnegative for prolate revolution figures aspendant drops and pendant bubbles (5,14). The dimensionless lengths are defi-ned as shown in the following equations:
x x b
z z b
s s b
�
�
�
,, [5]
Taking into account geometric considera-tions, the following set of equations is ob-tained:
d
ds xz
� ��� � �
sin2 [6]
d x
ds�cos � [7]
dz
ds�sin � [8]
The initial conditions are described byequation [9]:
� � �x z s0 0 0 0� � � [9]
Equations [6], [7] and [8] have to be sol-ved simultaneously to obtain the calcula-ted profile. No analytical solution hasbeen discovered; therefore, the equationshave to be solved numerically. The algo-rithm to solve this equation was program-med in MatLab® using buildup functionsas ODE45. It is noteworthy that the inte-
415
REVISTA COLOMBIANA DE QUÍMICA, VOLUMEN 39, nro. 3 DE 2010
Fis
ico
quím
ica
eIn
org
ánic
a
gration variable in this case is the dimen-sionless arc length, whereas in experi-mental profiles the coordinates are x andz. This situation force the necessity of in-terpolating values in the calculated profilewhen we try to compare it with experi-mental ones, increasing the computationtime and decreasing the precision of theadjustment (13).
These difficulties can be avoided byusing a polar-like coordinate system asproposed by Zholob et al. (13), as shownin Figure 1.
The experimental coordinates are ea-sily converted to this coordinate systemand the Young-Laplace equation is trans-formed by using � as the integration va-riable, making the comparison betweenexperimental and calculated profilesstraightforward. However, some difficul-ties arise when implementing this coordi-nate system: The position of the drop cen-ter depends on the assignment of the splitline; when trying to define dimensionlessmagnitudes the zc unavoidably appears inthe equations; and when zc is used to defi-ne dimensionless magnitudes, the length
of the profile is immediately determinedby choosing the magnitude of zc. Thesedifficulties make this coordinate systemvery awkward to be implemented. In thiswork, a more natural polar-like system isproposed, as shown in Figure 2.
If dimensionless variables defined byequation [10] are used, the curvature andthe second derivate of radii can be relatedby equation [11] (15):
r r b� [10]
d r
dr
r
dr
dkQ
2
23 21
2� �
� �
�
�
��
���
�
�
��
�� [11]
Where k is the curvature given by theYoung-Laplace equation and can be ex-pressed in the previously defined coordi-nate system by equations [11-14]:
� �
k rP r
� � ��
�
� �
�
11
1 2 1 2cossin
[12]
P
dr
dr
rdr
d
�
�
�
�� �
��
�
sin cos
sin cos[13]
416
REVISTA COLOMBIANA DE QUÍMICA, VOLUMEN 39, nro. 3 DE 2010
Split Line z( ; )x zm m
(0; )zc
r
x
(0;0)
. Coordinate System proposed by Zholob etal. to avoid data interpolation in Drop Profile Met-hods to measure surface tension.
z
r
(0;b)
(x;z)
(0;0) x
q
. Coordinate System proposed in this work.
Q rdr
d� �
�
�
��
��
22
�[14]
With initial conditions:
�
�
r
dr
d
0 1
0 0
�
�
,
�
[15]
Where the boundary condition for theapex symmetry, must be satisfied:
�d r
d
2
2 0 0�
� [16]
The solution of equation [11] to equation[16] was implemented in MatLab® andthe comparison of the results with the datareported by Bashforth and Adams (14) isshown in Figure 3. Experimental and cal-culated profiles are superimposed. Thiscan be seen more explicitly in Figure 4,where the differences between the radiifor the Bashforth and Adams data and theresults of obtained by using the equationsproposed in this work are plotted. As itcan be seen, the error is in the experimen-tal uncertainty for most of the devices em-
ployed for these determinations(micrometer level).
Experimental-like profiles were simula-ted by generating theoretical profiles withthe Young-Laplace equation expressed inthe Cartesian system and introducing ran-dom noise to the generated profile, asequation [17]:
x x x
z z zdist gen error
dist gen error
� �
� �
,[17]
Where the subscripts exp and gen refer tothe distorted and generated profile, res-pectively, and xerror and zerror correspondto the random distortion added to the ge-nerated profile. The magnitude of the in-troduced error was selected to be appro-ximately equivalent to one pixel in a600x400 picture and it can be positive,negative or zero for each generated point(xgen, zgen). The apex position was alsorandomly translated from the (0, 0) posi-tion, and a random inclination of the pro-file was introduced as well (15):
417
REVISTA COLOMBIANA DE QUÍMICA, VOLUMEN 39, nro. 3 DE 2010
Fis
ico
quím
ica
eIn
org
ánic
a4.0
3.5
3.0
2.5
2.0
1.5
1.0
0.5
0.0
-0.50.0 0.20.40.6 0.81.0 1.2 2.01.4 1.81.6 2.22.4
X
z
-0.9-0.2
-2.5-4
Brashford
Comparison between literature data (solid lines) and the results obtained in this work (symbols).
� �x x x z zgen ap gen apexp cos sin� � � �� �
� �z x x z zgen ap gen apexp sin cos� � � �� � [18]
Where the subscript exp refers to thecoordinates of the experimental-like pro-file, and (xap, zap) are the new coordinatesof the apex and the inclination angle of thecamera is �.
An algorithm was written to evaluate thesurface tension by using the method des-cribed previously. Experimental-likeprofiles were generated and the perfor-mance of the algorithm was then tested: arough approximation of the apex coordi-nates and Bond number, �, must be sup-plied by the user. Using the adequateform of equation [18] the coordinates arecorrected respect the apex position andcamera inclination (the supposed initialvalue for � is 0), and the experimental va-lues for � and r are calculated. The algo-rithm initializes the radii of curvature atthe apex by adjusting several pointsaround the apex to a circle. With these va-lues for apex position, camera angle incli-
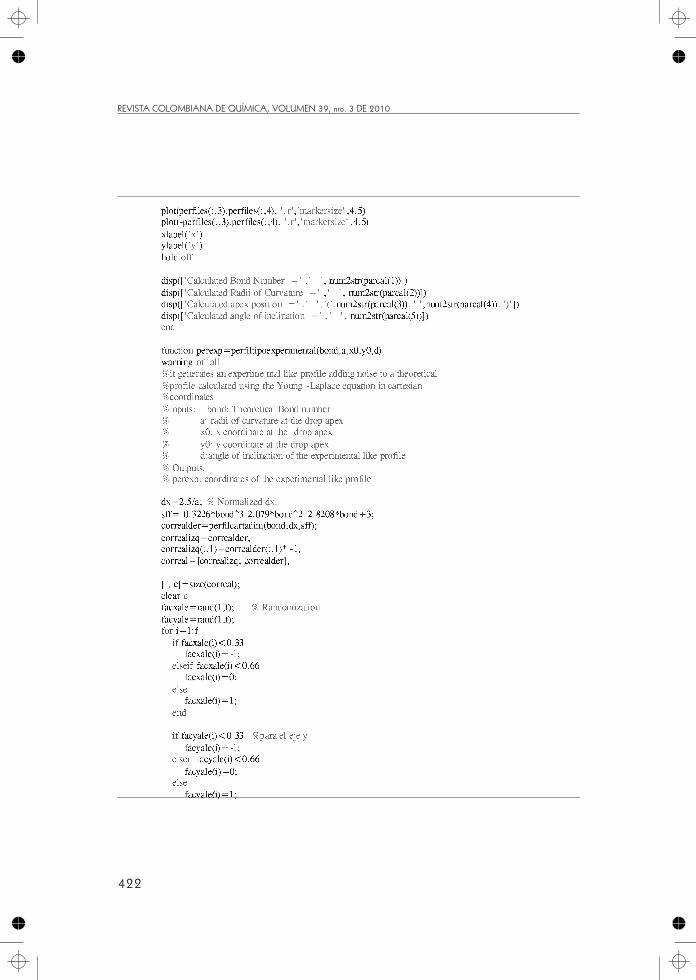
nation and the parameters b and � thebuilt in MatLab® Levenberg-Mardquardtmethod is initialized using as minimiza-tion function de difference between thecalculated and experimental r, for eachvalue of the experimental �. No interpola-tion is necessary in this method becausethe calculated r can be obtained at the ex-perimental � values. The performance ofthe algorithm–by using the generated ex-perimental-like profiles–is showed in Ta-ble 1. An excellent agreement is foundbetween theoretical values and the valuesfound by the algorithm written in thiswork. The written algorithm is presentedas an m-file in Appendix.
418
REVISTA COLOMBIANA DE QUÍMICA, VOLUMEN 39, nro. 3 DE 2010
0.0002
0.0004
0.0000
-0.0002
-0.0004
0.50.0 1.0 1.5 2.0 2.5 3.0
-0.2-0.5-0.9-2.5-4
r erro
r
Absolute error in the dimensionless radii obtained by using the method proposed in this work.
-4.0 -3.995 -0.12
-2.5 -2.504 0.18
-0.9 -0.898 -0.20
-0.5 -0.502 0.31
-0.2 -0.199 -0.67
. Performance of the written algorithm
Another algorithm is being written toevaluate the surface tension of solutionsfrom taken pictures or video of pendantdrops. These algorithms have been wi-dely described, but our algorithm uses theform of the Young-Laplace equation pro-posed here.
A new form of the Young-Laplace equa-tion in polar-like coordinates was propo-sed. By using this method, interpolationis avoided in the calculation of the surfacetension from experimental drop profiles.The implementation of the algorithm inMatLab® showed an excellent agreementbetween the results obtained and the re-sults reported in the literature. Moreover,the test of the algorithm showed that theimplementation in MatLab® can be usedto calculate the surface tension of solu-tions from drop profiles.
1. Adamson, A. W. and Gast, A. P.Physical Chemistry of Surfaces.New York: John Wiley & Sons, Inc.1996. pp. 784.
2. Chen, P.; Policova, Z.;Pace-Asciak, C. R. and Neumann,A. W. Study of molecular interac-tions between lipids and proteinsusing dynamic surface tension mea-surements: a review. Coll. Surf. B.
1999. : 313-324.
3. Makievski, A. V.; R.Wästneck, R.;Grigoriev, D. O.; Krägel, J. andTrukhin, D. V. Protein adsorptionisotherms studied by axisymmetric
drop shape analysis. Coll. Surf. A.
1998. : 461-6.
4. Song, B.; Springer, J. Determina-tion of interfacial tension from theprofile of a pendant drop using com-puter-aided image processing: 2. ex-perimental. J. Coll. Interface Sci.
1996. : 77-91.
5. Río, O. I. d.; Neumann, A. W.axisymmetric drop shape analysis:computational methods for the mea-surement of interfacial propertiesfrom the shape and dimensions ofpendant and sessile drops. J. Coll.
Interfac. Sci. 1997. : 136-47.
6. Song, B.; Springer, J. Determina-tion of interfacial tension from theprofile of a pendant drop using com-puter-aided image processing: 1.theoretical. J. Coll. Interface Sci.
1996. : 64-76.
7. Hoorfar, M.; Neumann, A. W. Re-cent progress in axisymmetric dropshape analysis (ADSA). Adv. Coll.
Interfac. Sci. 2006. : 25-49.
8. Dingle, N. M.; Tjiptowidjojo, K.;Basaran, O. A.; Harris, M. T. A fi-nite element based algorithm for de-termining interfacial tension (ã)from pendant drop profiles. J. Coll.
Interface Sci. 2005. : 647-60.
9. Álvarez, N. J.; Walker, L. M.;Anna, S. L. A non-gradient based al-gorithm for the determination of sur-face tension from a pendant drop: ap-plication to low Bond number dropshapes. J. Coll. Interfac. Sci. 2009.
: 557-62.
419
REVISTA COLOMBIANA DE QUÍMICA, VOLUMEN 39, nro. 3 DE 2010
Fis
ico
quím
ica
eIn
org
ánic
a
10. Thiessen, D. B.; Chione, D. J.;McCreary, C. B.; Krantz, W. B. Ro-bust digital image analysis of pendantdrop shapes. J. Coll. Interface Sci.
1996. : 658-65.
11. Holgado-Terriza, J. A.; Gómez-Lo-pera, J. F.; Luque-Escamilla, P. L.;Atae-Allah, C.; Cabrerizo-Vílchez,M. A. Measurement of ultralow in-terfacial tension with ADSA using anentropic edge-detector. Coll. Surf.
A. 1999. : 579-86.
12. Zuo, Y. Y.; Ding, M.; Li, D. andNeumann, A. W. Further develop-ment of axisymmetric drop shapeanalysis-captive bubble for pulmo-nary surfactant related studies. Bio-
chem. Biophys. Acta. 2004. :12-20.
13. Zholob, S. A.; Makievski, A. V.;Miller, R.; Fainerman, V. B. Opti-misation of calculation methods fordetermination of surface tensions bydrop profile analysis tensiometry.Adv. Coll. Interface Sci. 2007.
: 322-9.
14. Bashforth, F.; Adams, J. C. An at-tempt to test the theories of capillaryact by comparing the theoretical andmeasured form of drops of fluid.Cambridge, Cambridge UniversityPress. 1883. pp. 140.
15. Polyanin, A. D.; Manzhirov, A. V.Handbook of mathematics for engi-neers and scientists. Boca Ratón,Chapman and Hall/CRC. 2007. pp.1509.
420
REVISTA COLOMBIANA DE QUÍMICA, VOLUMEN 39, nro. 3 DE 2010
APPENDIX
421
REVISTA COLOMBIANA DE QUÍMICA, VOLUMEN 39, nro. 3 DE 2010
Fis
ico
quím
ica
eIn
org
ánic
a
422
REVISTA COLOMBIANA DE QUÍMICA, VOLUMEN 39, nro. 3 DE 2010
423
REVISTA COLOMBIANA DE QUÍMICA, VOLUMEN 39, nro. 3 DE 2010
Fis
ico
quím
ica
eIn
org
ánic
a
424
REVISTA COLOMBIANA DE QUÍMICA, VOLUMEN 39, nro. 3 DE 2010
425
REVISTA COLOMBIANA DE QUÍMICA, VOLUMEN 39, nro. 3 DE 2010