41
2011-12 Annual Accountability Report STATE UNIVERSITY SYSTEM of FLORIDA Board of Governors FLORIDA INTERNATIONAL UNIVERSITY

2011-12 Annual Accountability Report
STATE UNIVERSITY SYSTEM of FLORIDA Board of Governors
FLORIDA INTERNATIONAL
UNIVERSITY
1
Annual Accountability Report 2011-2012
FLORIDA INTERNATIONAL UNIVERSITY
TABLE OF CONTENTS EXECUTIVE SUMMARY DASHBOARD p. 2 KEY ACHIEVEMENTS p. 4 NARRATIVE p. 5
DATA TABLES SECTION 1. FINANCIAL RESOURCES p. 14 SECTION 2. PERSONNEL p. 18 SECTION 3. ENROLLMENT p. 19 SECTION 4. UNDERGRADUATE EDUCATION p. 22 SECTION 5. GRADUATE EDUCATION p. 32 SECTION 6. RESEARCH & ECONOMIC DEVELOPMENT p. 35
2
Annual Accountability Report 2011-2012
FLORIDA INTERNATIONAL UNIVERSITY
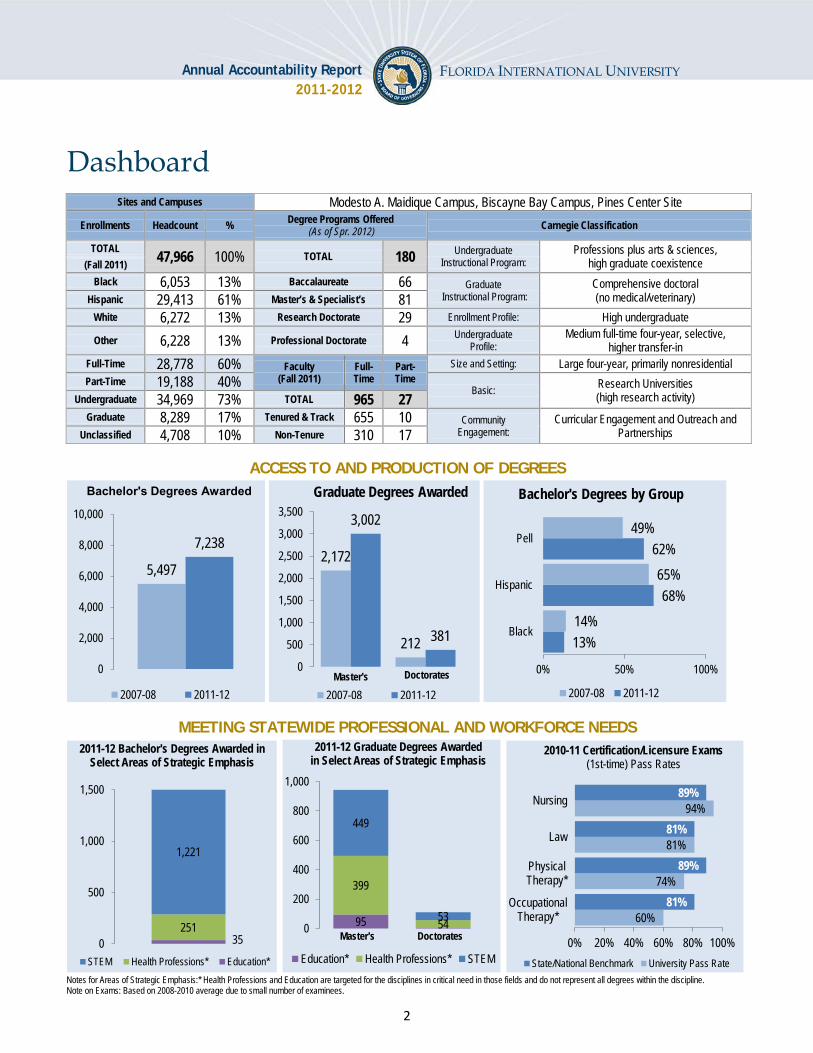
Dashboard Sites and Campuses Modesto A. Maidique Campus, Biscayne Bay Campus, Pines Center Site
Enrollments Headcount % Degree Programs Offered (As of Spr. 2012) Carnegie Classification
TOTAL 47,966 100% TOTAL 180 Undergraduate Instructional Program:
Professions plus arts & sciences, high graduate coexistence (Fall 2011)
Black 6,053 13% Baccalaureate 66 Graduate Instructional Program:
Comprehensive doctoral (no medical/veterinary) Hispanic 29,413 61% Master’s & Specialist’s 81
White 6,272 13% Research Doctorate 29 Enrollment Profile: High undergraduate
Other 6,228 13% Professional Doctorate 4 Undergraduate Profile:
Medium full-time four-year, selective, higher transfer-in
Full-Time 28,778 60% Faculty (Fall 2011)
Full- Time
Part- Time
Size and Setting: Large four-year, primarily nonresidential Part-Time 19,188 40% Basic: Research Universities
(high research activity) Undergraduate 34,969 73% TOTAL 965 27 Graduate 8,289 17% Tenured & Track 655 10 Community
Engagement: Curricular Engagement and Outreach and
Partnerships Unclassified 4,708 10% Non-Tenure 310 17
ACCESS TO AND PRODUCTION OF DEGREES
MEETING STATEWIDE PROFESSIONAL AND WORKFORCE NEEDS
5,497
7,238
0
2,000
4,000
6,000
8,000
10,000
2007-08 2011-12
Bachelor's Degrees Awarded
2,172
212
3,002
381
0
500
1,000
1,500
2,000
2,500
3,000
3,500 Graduate Degrees Awarded
2007-08 2011-12 Master's Doctorates
13%
68%
62%
14%
65%
49%
0% 50% 100%
Black
Hispanic
Pell
Bachelor's Degrees by Group
2007-08 2011-12
35 251
1,221
0
500
1,000
1,500
STEM Health Professions* Education*
2011-12 Bachelor's Degrees Awarded in Select Areas of Strategic Emphasis
95
399
54
449
53 0
200
400
600
800
1,000
Education* Health Professions* STEM
Master's Doctorates
2011-12 Graduate Degrees Awarded in Select Areas of Strategic Emphasis
60%
74%
81%
94%
81%
89%
81%
89%
0% 20% 40% 60% 80% 100%
Occupational Therapy*
Physical Therapy*
Law
Nursing
2010-11 Certification/Licensure Exams (1st-time) Pass Rates
State/National Benchmark University Pass Rate Notes for Areas of Strategic Emphasis:* Health Professions and Education are targeted for the disciplines in critical need in those fields and do not represent all degrees within the discipline. Note on Exams: Based on 2008-2010 average due to small number of examinees.

3
Annual Accountability Report 2011-2012
FLORIDA INTERNATIONAL UNIVERSITY
Dashboard BUILDING WORLD-CLASS ACADEMIC PROGRAMS AND RESEARCH CAPACITY
RESOURCES, EFFICIENCIES, AND EFFECTIVENESS
$62.4
$108.0
$65.4
$110.0
$0 $20 $40 $60 $80
$100 $120 $140
FEDERAL TOTAL
Millions Academic Research and Development Expenditures
2006-07 2010-11
$6 $9
$40
$25
$12
0
1
2
3
4
5
$0
$10
$20
$30
$40
$50
2006 2007 2008 2009 2010
Licen
ses &
Opti
ons E
xecu
ted
Licen
sing I
ncom
e
Thousands
Technology Transfer: Licenses and Licensing Revenue
Licensing Income Licenses & Options Executed
51% 62%
61% 62%
47% 47%
10%
8%
15%
13%
15%
13%
0% 20% 40% 60% 80% 100%
2003-2008
2007-2012*
2004-2008
2008-2012*
2002-2008
2006-2012*
Undergraduate Retention and Graduation Rates First-time in College (FT & PT) - Six Year
n = 4,271
n = 3,082
n = 1,975
n = 1,317
AA Transfers - Four Year
Other Transfers - Five Year
n = 1,150
n = 2,016
DARK BARS represent Graduation Rates LIGHT BARS represent those Still Enrolled
26 27 27 28 27
0
5
10
15
20
25
30
35
2007-08 2008-09 2009-10 2010-11 2011-12
Student-to-Faculty Ratio
$6,358 $5,772 $5,566 $4,373 $3,589
$3,885 $4,291 $4,449 $4,699 $5,710
$0 $2,000 $4,000 $6,000 $8,000
$10,000 $12,000 $14,000
2008-09 2009-10 2010-11 2011-12 2012-13 Estimate
Appropriated Funding Per Actual US FTE
STATE TUITION not inflation-adjusted
* Indicates most recent data are still preliminary rates.
Note: Tuition is the appropriated budget authority, not the amount actually collected. This tuition data does not include non-instructional local fees. State includes General Revenues, Lottery and Other Trust funds (i.e., Federal Stimulus for 2009-10 and 2010-11 only). Student FTE are actual (not funded) and based on the national definition.

4
Annual Accountability Report 2011-2012
FLORIDA INTERNATIONAL UNIVERSITY
Key Achievements Selected Accomplishments for Florida International University (July 2011 – June 2012) STUDENT AWARDS/ACHIEVEMENTS
1. The FIU Model United Nations team earned the Outstanding Delegation award (1st place) for the seventh straight year at the National Model United Nations Conference. FIU’s team is the top performer among all public universities in the country.
2. A team of students from FIU’s School of Construction won the Associated Builders and Contractors (ABC) 2012 Student Chapter Construction Management Competition.
3. A doctoral student from FIU’s College of Education was recognized as Florida’s Teacher of the Year. The M-DCPS Principal of the Year was a College of Education graduate.
FACULTY AWARDS/ACHIEVEMENTS 1. Dr. William Pelham, professor at FIU’s Department of Psychology, received the Distinguished
Scientist Award from the Society for a Science of Clinical Psychology. 2. John Dufresne, professor at FIU’s Creative Writing program, was named a 2012 Guggenheim
fellow. 3. Dr. Meredith Newman, chair of FIU’s Department of Public Administration, received the Lifetime
Achievement in Public Human Resources Scholarship Award from the American Society for Public Administration.
PROGRAM AWARDS/ACHIEVEMENTS 1. FIU leads the nation in granting bachelor’s degrees to underrepresented minorities, including in
STEM fields. 2. FIU’s College of Law jumped from 132 to 113 in the U.S. News and World Report’s 2013 edition
of Best Law Schools. 3. FIU’s Undergraduate International Business program ranked 8th in the nation in the 2012
Bloomberg Businessweek specialty list.
RESEARCH AWARDS/ACHIEVEMENTS 1. Dr. Alexander Agoulnik, professor at FIU’s Herbert Wertheim College of Medicine, in collaboration
with scientists from the National Institutes of Health, developed selective and potent modulators of the relaxin receptor for potential treatment of cardiovascular and reproductive disorders.
2. FIU’s Wall of Wind facility reached its final phase of development with a powerful 12-fan system that is the only one in the world capable of simulating up to Category 5 hurricane wind speeds accompanied by wind-driven-rain. The Wall of Wind is a State of Florida Center of Excellence.
3. FIU’s chemistry professor Bruce McCord and doctoral candidate Jennifer Greaux discovered a new technique that identifies the chemical signature of the powder inside a bullet. This unique process can potentially link a suspect to the ammunition fired even if the weapon is not found.
INSTITUTIONAL AWARDS/ACHIEVEMENTS 1. FIU continues to lead the State in energy conservation for the fourth consecutive year based on
the 2011 State University System Energy Conservation Report 2. FIU was named one of the world’s best new universities according to Times Higher Education
(THE) magazine 2012 rankings of top 100 universities under 50 years old. FIU is one of only nine U.S. universities, and the only university in Florida, to make the list.
3. FIU received the U.S. Department of Agriculture’s newly implemented Hispanic-Serving Agricultural Colleges and Universities (HSACU) designation.

5
Annual Accountability Report 2011-2012
FLORIDA INTERNATIONAL UNIVERSITY
Narrative INTRODUCTION
FIU continues to work toward the goals outlined in the 2010-2015 Worlds Ahead Strategic Plan. FIU is the only public research university in South Florida and is dedicated to the social and economic welfare of our community. We see ourselves as a solutions center for our communities. FIU is committed to increasing access to higher education and successful degree completion for our population of students who are typically underrepresented in degrees at all levels of higher education. Since 2007, the number of applications has increased by 47 percent testifying to FIU’s continued presence as an integral choice for families in south Florida. Enrollment at FIU accounts for 15 percent of the total enrollment in the State University System (SUS).
FIU is the national leader in awarding STEM bachelor’s degrees to underrepresented minorities. Seventy-seven percent of our students are from minority backgrounds, giving FIU a unique position as a national laboratory for the development of creative teaching and learning programs targeting student academic success. Our research initiatives continue to provide both social and economic impact to South Florida and the Nation. The University is focused on driving business and cost efficiencies through expanded use of on- and off-campus weekend classes (FIU has the highest classroom space utilization rate in the SUS at 176 percent of statutory requirements), reduced energy costs (FIU led the SUS in energy conservation for four consecutive years, 2007-2011), and new revenue sources.
Mission Statement
Florida International University is an urban, multi-campus, public research university serving its students and the diverse population of South Florida. We are committed to high-quality teaching, state-of-the-art research and creative activity, and collaborative engagement with our local and global communities.
Vision Statement
Florida International University will be a leading urban public research university focused on student learning, innovation, and collaboration. ACCESS TO AND PRODUCTION OF DEGREES
During the academic year 2011-12, FIU enrolled almost 48,000 students from 148 countries. Last year, the University awarded over 11,000 total degrees, an 11 percent increase over 2010-11. Of those, over 7,700 were at the baccalaureate level and 92 percent of those were awarded to residents of the state of Florida, Seventy-three percent of our total degrees were awarded to minority students. During the 2011-12 year, FIU also continued to serve first-generation students with 11,118 of such students receiving financial aid. FIU continues to maintain its commitment to access and diversity. In May 2012, The Hispanic Outlook in Higher Education ranked FIU first in awarding bachelor’s and master’s degrees and fourth in awarding doctoral degrees to Hispanics. Also, in the latest Engineering College Profile and Statistics report, the American Society for Engineering Education (ASEE) ranked FIU’s College of Engineering and Computing (CEC) first in awarding bachelor’s degrees to Hispanics in the Continental US. ASEE also ranked CEC eighth in awarding bachelor’s degrees to African American students.

6
Annual Accountability Report 2011-2012
FLORIDA INTERNATIONAL UNIVERSITY
FIU’s commitment to production of degrees is also demonstrated through its initiatives to increase the retention and graduation rate of first-time-in-college (FTIC) students. In 2011-12, the Graduation Success Initiative (GSI) continued to be implemented. The second phase of GSI was to provide undergraduate students with tools to select “the right major.” FIU developed Major Maps for each undergraduate major. The Major Maps provide in-depth information on all FIU undergraduate programs including: 1) program description, 2) admission criteria, 3) career opportunities, and 4) wages and employment trends for related occupations. The link for Major Maps is http://mymajor.fiu.edu. FIU also launched MyMajorMatch, a tool that matches the applicants’ interests with FIU majors and allows them to explore career paths that they might not have considered. Finally, Exploratory Majors were developed to offer guidance to students who are unclear about their major, even after using MyMajorMatch. MyMajorMatch was made available through FIU’s undergraduate admissions application to summer 2012 applicants and forward. Over 90% of entering students identified a major during the admissions process. The remainder entered FIU in one of six exploratory areas where they can remain for no more than 45 credits. Advisors work with these students to get them into majors as soon as possible. FIU’s continuous efforts to improve the graduation rate for our first-time-in-college students are already proving successful. We are very proud to report that the 6-year graduation rate for our FTICs increased by six percent, from 41% (2005 cohort) to 47% (2006 cohort). MEETING STATEWIDE PROFESSIONAL AND WORKFORCE NEEDS
FIU continues its efforts to increase production of STEM degrees and to improve recruitment efforts to attract students who are usually underrepresented in these fields. In 2011-12, FIU awarded 1,221 STEM bachelor’s degrees. Of those, 75 percent were earned by underrepresented minorities. At the graduate level, 43 percent of the 501 STEM degrees were awarded to underrepresented minorities. Also, in 2011-12, 24 percent of FIU’s students were pursuing a STEM related degree. FIU continues to enhance the variety of STEM program offerings. In September 2011, our Board of Trustees approved a new Doctor of Philosophy in Basic Biomedical Sciences to be offered through FIU’s Herbert Wertheim College of Medicine (HWCOM). After obtaining the approval of the Board of Governors in January 2012, new applicants were accepted for a fall 2012 implementation. A distinctive feature of the Ph.D. program in Biomedical Sciences is that graduate students and medical students sit side-by-side in the introductory basic sciences portion of the medical curriculum. This provides graduate students with an appreciation of the medical aspects of modern biosciences. HWCOM faculty will train biomedical scientists, preparing them for academic careers in medical research and for the flourishing biotechnology industry of the Miami-Dade region and the State of Florida. FIU is a State of Florida and national leader in the production of professionals in the health fields. In a recent article, based on 2009-10 data, Diverse: Issues in Higher Education ranked FIU first in the nation in the production of Hispanic graduates in the health professions and second for undergraduates. For production of graduate African American health professionals, FIU is ranked fifth, right behind the University of Medicine and Dentistry of New Jersey. In 2011-12, FIU awarded 876 degrees in health professions and related sciences. Of those, 704 degrees were in disciplines designated as areas of strategic emphasis. In spring 2012, the new Doctor of Nursing Practice (DNP) admitted its first class. FIU has also increased the degree production in other disciplines designated as “critical strategic areas.” In the strategic area of “Security and Emergency Services,” the University awarded 540 degrees in the academic year 2011-12, an increase of 33 percent from the previous year. An increase of 7 percent was

7
Annual Accountability Report 2011-2012
FLORIDA INTERNATIONAL UNIVERSITY
achieved in the area of “Globalization” wherein FIU awarded 1,276 degrees in 2011-12 compared with 1,196 in 2010-11.
Mastery Mathematics Lab
An internal statistical analysis had confirmed that success in math is critical to student retention and graduation. Freshmen who fail College Algebra are 75 percent less likely to graduate in a timely manner than students who pass the course. To improve success in College Algebra, FIU established a Modified Mathematics Emporium Initiative that consists of a “High Tech/High Touch” approach to teaching College Algebra using faculty development, peer tutoring, and a computer-based mastery program. The redesigned College Algebra course combines the use of the Emporium Model, a widely used computer-assisted method for teaching algebra as the high tech component, and individualized instruction using Learning Assistants as the high touch component. Students take Mastery program with 5 hours of instruction per week, consisting of some combination of Lecture and Math Lab/Math Gym.
One Community One Goal
In fall 2011, the Beacon Council, Miami-Dade County’s economic development council, created a Targeted Industry Strategic Plan for the county. The plan, titled One Community One Goal (OCOG), outlined seven key target industry clusters and skills that will help south Florida’s economic growth. OCOG pivots around education as the foundation for Miami-Dade County’s economic development and calls for a new ecosystem of growth. In collaboration with the Beacon Council, FIU developed a detailed response highlighting the areas of curricular strength that match the OCOG Strategic Plan. FIU’s president Mark Rosenberg was tapped to lead the Academic Leaders Council, an implementation team of Miami Dade County educators—including all area university presidents and the Superintendent of the Miami Dade County Public Schools. FIU is in a unique position to continue preparing Miami-Dade County’s workforce. Our Worlds Ahead Strategic Plan focuses on globalization, health, the environment and the arts. FIU’s strategic plan is supported by world-class faculty engaged in research, teaching and creative endeavors in the industries and sectors the Beacon Council has targeted for Miami-Dade’s future economic growth efforts. We have positioned FIU to make immediate and significant contributions to six of the seven industry clusters: Creative Design; Hospitality and Leisure; Information Technology; Life Sciences; International Banking and Finance; and Trade and Logistics. We are particularly proud of our STEM-related teaching and research initiatives. They will be key to 21st Century competitiveness and the university’s current and future activities in support of them. BUILDING WORLD-CLASS ACADEMIC PROGRAMS AND RESEARCH CAPACITY
Research Capacity
FIU is proud of the continued growth in research initiatives focusing on expanding knowledge discovery and our unique response to the social and economic needs of south Florida. Even with tightening Federal spending, the 2011-2012 fiscal year represents the third consecutive year that research expenditures exceeded 100 million dollars. A major effort focused on increasing the number of faculty receiving external research funding resulted in increasing the proportion of faculty with funding from 36 percent (FY 2009) to 43 percent (FY 2012). The proportion of assistant professors with external funding increased from 15.8 percent in FY 2009 to 22 percent in FY 2012.
Below is a summary of several key FY 2011-2012 initiatives that represent ongoing efforts aimed at improving research support for faculty.
8
Annual Accountability Report 2011-2012
FLORIDA INTERNATIONAL UNIVERSITY
Mentors-in-Residence Program: This program links experienced researchers and junior faculty members interested in submitting proposals to federal agencies. The Division of Research (DoR) also offers grant-writing tutorials and other types of support to assist junior and mid-level faculty interested in applying for funding.
• Interdisciplinary Research Networks: This initiative joins faculty with common interests in specific research areas so they are better prepared to respond to external research funding opportunities. This past year, an Interdisciplinary Nuclear Research Network was formed and it already received a Science Technology and Mathematics (STEM) grant from the U.S. Nuclear Security Agency.
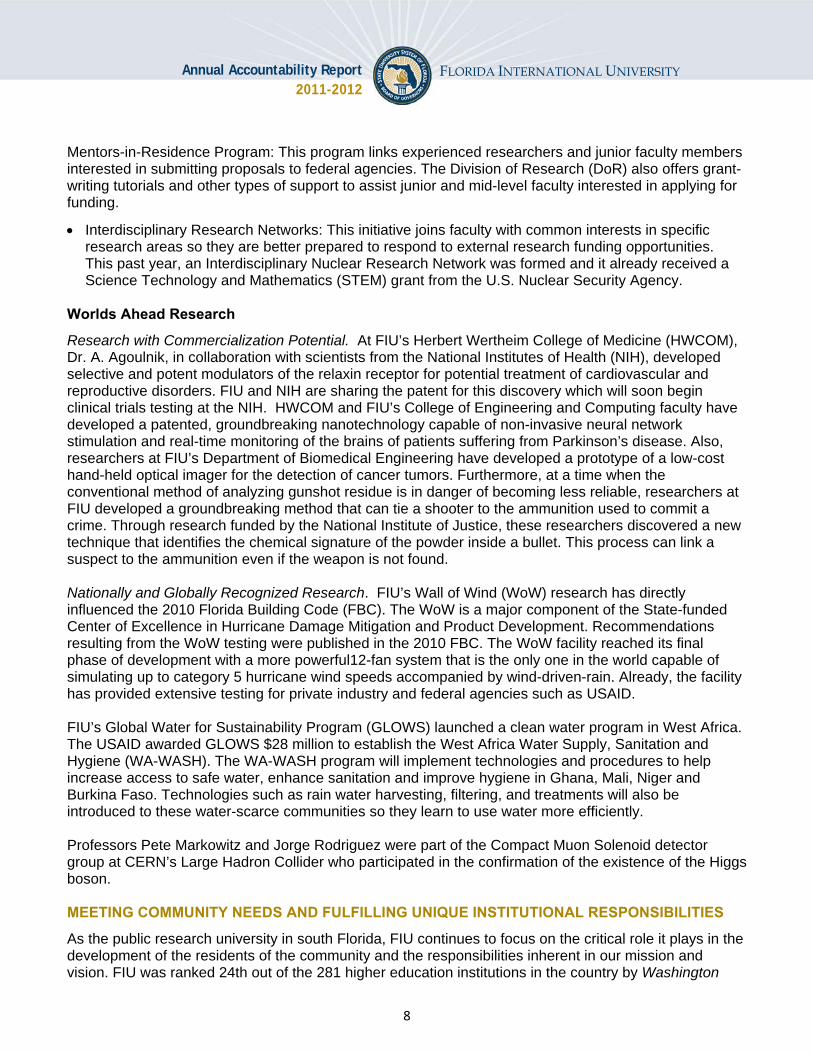
Worlds Ahead Research
Research with Commercialization Potential. At FIU’s Herbert Wertheim College of Medicine (HWCOM), Dr. A. Agoulnik, in collaboration with scientists from the National Institutes of Health (NIH), developed selective and potent modulators of the relaxin receptor for potential treatment of cardiovascular and reproductive disorders. FIU and NIH are sharing the patent for this discovery which will soon begin clinical trials testing at the NIH. HWCOM and FIU’s College of Engineering and Computing faculty have developed a patented, groundbreaking nanotechnology capable of non-invasive neural network stimulation and real-time monitoring of the brains of patients suffering from Parkinson’s disease. Also, researchers at FIU’s Department of Biomedical Engineering have developed a prototype of a low-cost hand-held optical imager for the detection of cancer tumors. Furthermore, at a time when the conventional method of analyzing gunshot residue is in danger of becoming less reliable, researchers at FIU developed a groundbreaking method that can tie a shooter to the ammunition used to commit a crime. Through research funded by the National Institute of Justice, these researchers discovered a new technique that identifies the chemical signature of the powder inside a bullet. This process can link a suspect to the ammunition even if the weapon is not found. Nationally and Globally Recognized Research. FIU’s Wall of Wind (WoW) research has directly influenced the 2010 Florida Building Code (FBC). The WoW is a major component of the State-funded Center of Excellence in Hurricane Damage Mitigation and Product Development. Recommendations resulting from the WoW testing were published in the 2010 FBC. The WoW facility reached its final phase of development with a more powerful12-fan system that is the only one in the world capable of simulating up to category 5 hurricane wind speeds accompanied by wind-driven-rain. Already, the facility has provided extensive testing for private industry and federal agencies such as USAID. FIU’s Global Water for Sustainability Program (GLOWS) launched a clean water program in West Africa. The USAID awarded GLOWS $28 million to establish the West Africa Water Supply, Sanitation and Hygiene (WA-WASH). The WA-WASH program will implement technologies and procedures to help increase access to safe water, enhance sanitation and improve hygiene in Ghana, Mali, Niger and Burkina Faso. Technologies such as rain water harvesting, filtering, and treatments will also be introduced to these water-scarce communities so they learn to use water more efficiently. Professors Pete Markowitz and Jorge Rodriguez were part of the Compact Muon Solenoid detector group at CERN’s Large Hadron Collider who participated in the confirmation of the existence of the Higgs boson. MEETING COMMUNITY NEEDS AND FULFILLING UNIQUE INSTITUTIONAL RESPONSIBILITIES
As the public research university in south Florida, FIU continues to focus on the critical role it plays in the development of the residents of the community and the responsibilities inherent in our mission and vision. FIU was ranked 24th out of the 281 higher education institutions in the country by Washington
9
Annual Accountability Report 2011-2012
FLORIDA INTERNATIONAL UNIVERSITY
Monthly for engagement and contributions to its community. During the last year we have made significant progress in the areas of community engagement – with an eye towards building a sustainable framework for economic development through various initiatives
Life Sciences South Florida
Life Sciences South Florida (LSSF) is a partnership led by FIU and the Beacon Council with the collaboration of Florida Atlantic University, the University of Miami, Florida Gulf Coast University, state colleges, bioscience research centers (Scripps Florida and Max Planck Florida), and economic development agencies. This partnership is focused on expanding life sciences related jobs, research, workforce training and investment opportunities. FIU has taken the lead in establishing a Shared Communication Portal through which member institutions can share life sciences equipment and services across the region. Regional webinars are conducted monthly to educate faculty, graduate students, and entrepreneurs, venture capital and other companies about scientific breakthroughs and potential commercial applications and spin-off companies. In addition, as a means of better understanding local workforce and training needs, a meeting of ten CEOs and C-level executives for local life sciences industries was convened at FIU’s Reagan House. The discussion focused on ensuring access to the talent needed to drive continued local business success by a) determining current and future workforce needs, b) identifying critical occupations and skill sets, c) reviewing data that state policy makers will examine when making workforce training decisions, and d) advising on how to more closely align education/workforce training programs to meet the needs of the research and development arm of the life sciences cluster in Florida. With all institutional members of LSSF, including Miami Dade College, FGCU and FAU, FIU is now planning a STEM research conference for the spring of 2013 that will feature student research in this critical area of job creation and global competitiveness. Internships
Through internships, students gain real-world experience and a first-hand opportunity to try out their chosen career and build their resume with actual work experience. Internships can provide a bridge to employment. Survey data from the National Association of Colleges and Employers reveals that, on average, nearly 65 percent of paid internships turn into full-time positions. Furthermore, research shows that while engagement benefits students from all racial and ethnic backgrounds, historically underserved students benefit most in terms of grades and persistence. During the 2011-2012 academic year, the number of students participating in academic or non-academic internships increased from 1,774 to 3,341, an increase of 88 percent from the previous year. Currently, FIU has established internship positions for our students with Miami Dade County Mayor’s Office, Florida Power and Light (FPL), Carnival Cruise lines, Sotheby’s, Catalyst Miami, Brightstar, and Perry Ellis, among others. ACCESS
We have developed a nationally recognized partnership with Miami-Dade County Public Schools (M-DCPS). Our partnership, ACCESS (Achieving Community Collaboration in Education and Student Success), was hailed by the M-DCPS School Board for its leading role in helping the schools to enhance student achievement, particularly through our dual enrollment initiative. FIU has played a notable role in the nationally acclaimed success of the M-DCPS, most recently through the Broad Prize. Through our partnership with M-DCPS, we have achieved the following milestones:
10
Annual Accountability Report 2011-2012
FLORIDA INTERNATIONAL UNIVERSITY
From fall 2009 to fall 2012, dual enrollment at FIU has expanded from 884 to 4,196 students (5,579 instances of registrations), from 16 to 109 courses, and from 6 to 33 schools.
• FIU’s College of Education developed a STEM certificate program (Mathematics Education and Science Education) that was implemented for K-8 in-service teachers; 85 teachers enrolled.
• FIU’s Master of Science in Speech Language Pathology has four student teams supervised by Speech Language Pathology faculty who perform speech and hearing assessments and institute early interventions in M-DCPS.
• FIU’s Department of English offered two professional development workshops on conduct speech and hearing assessments and instituted early interventions in M-DCPS writing and rhetoric for 40 high schools teachers.
• FIU’s College of Education has secured federal grants to provide 90 M-DCPS teachers and administrators with direct tuition support in the amount of $450,000 to pursue master’s and doctoral degrees.
Education Effect Project
With a $90K planning grant awarded in December 2010 and a $1 million philanthropic grant received in September 2011 from the JPMorgan Chase Foundation, FIU launched the Education Effect Project, a university-assisted community school initiative in collaboration with Miami-Dade County Public Schools (M-DCPS). Centered in Liberty City, an economically disadvantaged and predominantly African American community in Miami, the project’s focus is Miami Northwestern Senior High School and the middle and elementary schools in its feeder pattern, all of which are designated as underperforming by Department of Education criteria. The University just completed the first year of the Education Effect Project. This exciting work has strengthened FIU’s commitment to collaborate with the Education Transformation Office (ETO), which oversees persistently low performing schools. The partnership with M-DCPS is positioning Miami Northwestern as a district model for school transformation. The following results demonstrate the community-wide impact of the partnership in its first year:
• The number of students from Miami Northwestern High School (MNW) admitted to FIU quadrupled from 8 in fall 2011 to 34 students in fall 2012.
• Seventeen MNW students participated in the first Golden Scholars Summer Bridge Program. • Forty-nine students attended a Financial Literacy Program at FIU’s State Farm Lab in the College
of Business Administration. • FIU received a $19,000 grant from The Miami Foundation to support Science Education. • After considerable planning, the Aquaponics lab at MNW is expected to break ground in spring
2013 (the 4x4 Aquaponics unit has been delivered and installed at the school). This is the first facility of its kind at M-DCPS where students will be able to learn science using experiential learning techniques.
• Twenty-three faculty/staff mentors are paired with MNW students. • The Education Effect Project and its director, Dr. Maria Lovett, College of Education faculty
member, was a finalist for Florida Campus Compact Campus-Community Partnership of the Year.
• FIU leveraged the partnership to serve 30 Liberty City Elementary school students with the FIU College of Law and College of Education Math and Civics Summer Institute and it is now serving 38 in-coming 9th graders at Miami Northwestern through the Algebra Project. Although some of these efforts are not funded through the seed funding from the JPMorgan Chase foundation, we are vetting the ability of the partnership to build capacity and serve students on multiple fronts.
11
Annual Accountability Report 2011-2012
FLORIDA INTERNATIONAL UNIVERSITY
While the final school data is forthcoming, Miami Northwestern has seen significant gains in its graduation rates, attendance, reading, writing and science proficiency scores. Additionally, we expect increases in the number of students applying and entering into higher education institutions. Center for Children and Families
FIU’s Center for Children and Families is now offering a summer pre-K to K Transition Program for behaviorally and academically at-risk children. This program is funded by the U.S. Department of Education’s Institute of Education Sciences. To date, close to 500 children have participated in the on-campus summer camp while another 500 successfully completed the program throughout the school year. Green Family Foundation NeighborhoodHELPTM Program
Green Family Foundation NeighborhoodHELP™ at FIU’s Herbert Wertheim College of Medicine (HWCM) is a community-engaged, inter-professional service-learning program. Students from HWCM, Robert Stempel College of Public Health and Social Work, College of Nursing and Health Sciences, and the College of Law form inter-professional teams. In 2013, biomedical engineering and journalism students will join the teams. NeighborhoodHELP™ challenges students to address the complex medical, social, and ethical issues experienced by medically underserved families in South Florida. They engage households that benefit from regular home visits, comprehensive health and social histories, and the development of a comprehensive plan to improve health and quality of life. Supervised by FIU faculty, students assess, respond to, and monitor the health of families. Since the program’s launch in September 2010, students have assisted household members with a broad array of health and social issues, including diabetes, hypertension, breast cancer, dementia, coronary heart disease, mental health illness, barriers to health care and social services, unemployment, and legal issues. Following are a few 2011-12 highlights of the program.
• 648 FIU medical, nursing, social work, and law students conducted 572 visits to 154 households with a total of 1,318 household members.
• Purchased a 38-foot, fully-equipped, ADA compliant mobile unit with two examination rooms and a laboratory to address the critical health care needs of household members.
• Strengthened and expanded the NeighborhoodHELP™ university-community partnership: o 160 elementary and high school students from NeighborhoodHELP™ communities
participated in a successful Health Professions Fair to introduce them to health careers; o Increased NeighborhoodHELP™ geographic reach to Little Haiti and Hialeah; o Expanded community partnerships from 83 to 97 with a wide spectrum of organizations,
including schools, places of worship, and health and social service agencies.
PROGRESS ON PRIMARY INSTITUTIONAL GOALS AND METRICS (as outlined in University Work Plan)
The University continues to make progress on the goals identified in the work plan.
Support strategic priorities in teaching and research
The University hired 64 new faculty for 2011-2012. The new hires allowed the University to meet its goal of maintaining the 27:1 student to faculty ratio in fall 2011. The University has also hired 76 new faculty for the 2012-2013 year exceeding the goal established in 2010. In 2011-2012, the University again
12
Annual Accountability Report 2011-2012
FLORIDA INTERNATIONAL UNIVERSITY
exceeded $100 million in external funding and awarded 151 research doctorates and 230 professional doctorates.
Improve Academic Success
The University was able to complete the three metrics in this goal. In 2011-12, FIU hired 12 new advisors and converted five adjuncts into full-time lecturers. Thirteen additional advisors have been hired for 2012-13. Also in 2011-12, the University renovated three classrooms, painted 16 classrooms, re-carpeted 15 classrooms, replaced the seating in two classrooms, and renovated various student study spaces including study areas in the Engineering Center. These renovations add to 17 classrooms previously modernized during the 2010-11 year.
Expand Community Partnerships
FIU’s Herbert Wertheim College of Medicine (HWCM) established a residency program at the West Kendall Baptist Hospital (WKBH) and is currently recruiting the interns. FIU’s HWCM Faculty Group Practice continues to expand, adding convenience and benefits for our university community. In August 2011, the Faculty Practice opened its new 6,100-square foot facility at the Modesto Maidique Campus providing state-of-the-art, comprehensive care to their patients.
ADDITIONAL INFORMATION ON QUALITY, RESOURCES, EFFICIENCIES AND EFFECTIVENESS
FIU has continued to be successful through teamwork, innovation, efficiencies and dedication. In the past year we have provided access to an additional 9,352 qualified students and increased need-based financial aid by $9 million. We have continued to improve services through provision of ample support services and increasing stipends for graduate students. The University continues to achieve additional efficiencies with respect to energy conservation. Through various initiatives from converting to natural gas from liquid propane gas to implementing energy management performance contracts, FIU has been able to achieve annual utility savings of approximately $1.1 million. FIU continues to lead the State in energy conservation for the fourth consecutive year based on the 2011 State University System Energy Conservation Report. The University has also invested time in renegotiating various services contracts which has achieved estimated savings in excess of $3.3 million. The University has also been at the forefront of consolidating and restructuring units and service models to deliver additional necessary savings. During the 2011-2012 fiscal year, the University delivered several technological enhancements for students, faculty, and staff. The University completed the implementation of a new human resources and payroll system to fully integrate with our core databases of financials, campus solutions, and contract and grants. This application will enable improved reporting capabilities and increase the business process flows for both the academic and administrative areas. Our mobile technologies have delivered many functional features such as mobile enrollment which allows students to enroll in any course via a mobile device. Other features include reviewing student financial aid and account status along with checking for grades posted online. Our mobile application has experienced increased usage every semester and we anticipate close to 50 percent of all student transactions within our databases will occur via a mobile device over the next two years. These enhancements have increased organizational efficiencies and served to help the University reach its goals in accordance with our Worlds Ahead Strategic Plan.
13
Annual Accountability Report 2011-2012
FLORIDA INTERNATIONAL UNIVERSITY
Data Tables
FINANCIAL RESOURCES Table 1A. Education and General Revenues Table 1B. Education and General Expenditures Table 1C. Funding per Student FTE Table 1D. Other Budget Entities Table 1E. Voluntary Support of Higher Education
PERSONNEL Table 2A. Personnel Headcount
ENROLLMENT AND SPACE Table 3A. Full-time Equivalent (FTE) Enrollment Table 3B. Enrollment by Location Table 3C. Enrollment by Method of Instruction
UNDERGRADUATE EDUCATION Table 4A. Baccalaureate Degree Program Changes in AY 2011-2012 Table 4B. Retention Rates Table 4C. FTIC Graduation Rates (Full-time) Table 4D. FTIC Graduation Rates (Full- and Part-time) Table 4E. AA Transfers Graduation Rates Table 4F. Other Transfers Graduation Rates Table 4G. Baccalaureate Degrees Awarded Table 4H. Baccalaureate Degrees Awarded in Areas of Strategic Emphasis Table 4I. Baccalaureate Degrees Awarded to Underrepresented Groups Table 4J. Baccalaureate Degrees Without Excess Credit Hours Table 4K. Undergraduate Course Offerings Table 4L. Faculty Teaching Undergraduates Table 4M. Undergraduate Instructional Faculty Compensation Table 4N. Student/Faculty Ratio Table 4O. Licensure/Certification Exam: Nursing (NCLEX) Table 4P. Tuition Differential Fee
GRADUATE EDUCATION Table 5A. Graduate Degree Program Changes in AY 2011-2012 Table 5B. Graduate Degrees Awarded Table 5C. Graduate Degrees Awarded in Areas of Strategic Emphasis Table 5D. Licensure/Certification Exams for Graduate Programs
RESEARCH & ECONOMIC DEVELOPMENT Table 6A. Research and Development Expenditures Table 6B. Centers of Excellence Table 6C. State University Research Commercialization Assistance Grants Table 6D. 21st Century World Class Scholars Program

14
Annual Accountability Report 2011-2012
FLORIDA INTERNATIONAL UNIVERSITY
Section 1 – Financial Resources
TABLE 1A. University Education and General Revenues
2008-09 Actual
2009-10 Actual
2010-11 Actual
2011-12 Actual
2012-13 Estimates
MAIN OPERATIONS Recurring State Funds $206,029,070 $180,520,031 $185,414,169 $166,562,455 $141,444,735 Non-Recurring State Funds $9,587,997 $1,202,411 $3,456,924 $2,242,351 $1,250,000 Tuition $128,413,296 $128,089,012 $146,292,913 $155,824,885 $161,784,110 Tuition Differential Fee $2,566,323 $7,428,377 $15,411,111 $25,308,323 $40,888,078 Misc. Fees & Fines $2,640,819 $2,914,805 $3,456,746 $3,845,967 $3,684,943 Phosphate Research TF $0 $0 $0 $0 $0 Federal Stimulus Funds $0 $14,250,535 $13,635,669 $0 $0 SUBTOTAL $349,237,505 $334,405,171 $367,667,532 $353,783,981 $349,051,866
HEALTH SCIENCE CENTER / MEDICAL SCHOOL Recurring State Funds $11,465,084 $21,410,785 $24,210,077 $26,293,035 $26,907,537 Non-Recurring State Funds $0 $0 $1,000,000 $0 $0 Tuition $0 $1,162,500 $2,427,750 $5,375,235 $10,215,192 Tuition Differential Fee $0 $0 $0 $0 $0 Misc. Fees & Fines $42,350 $58,424 $62,695 $57,900 $59,190 Phosphate Research TF $0 $0 $0 $0 $0 Federal Stimulus Funds $0 $866,405 $859,244 $0 $0 SUBTOTAL $11,507,434 $23,498,114 $28,559,766 $31,726,170 $37,181,919
INSTITUTE OF FOOD & AGRICULTURAL SCIENCES (IFAS) SUBTOTAL $0 $0 $0 $0 $0
TOTAL $360,744,939 $357,903,285 $396,227,298 $385,510,151 $386,233,785 Recurring State Funds: State recurring funds include general revenue and lottery education & general (E&G) appropriations and any administered funds provided by the state, including annual adjustments of risk management insurance premiums for the estimated year. This does not include technical adjustments or transfers made by universities after the appropriation. Please note: for estimated 2012-13 this figure includes the non-recurring $300 M system budget reduction. - Source: For actual years, SUS Final Amendment Packages; for estimated year the 2012-13 Allocation Summary and Workpapers (Total E&G general revenue & lottery minus non-recurring) and Board of Governors staff calculations for risk management insurance adjustments. Non-Recurring State Funds: State non-recurring funds include general revenue and lottery education & general appropriations and any administered funds provided by the state. This does not include technical adjustments or transfers made by Universities after the appropriation - Source: non-recurring appropriations section of the annual Allocation Summary and Workpapers document and all other non-recurring budget amendments allocated later in the fiscal year. Tuition: Actual resident & non-resident tuition revenues collected from students, net of fee waivers. - Source: Operating Budget, Report 625 – Schedule I-A. Tuition Differential Fee: Actual tuition differential revenues collected from undergraduate students - Source: Operating Budget, Report 625 – Schedule I-A. Miscellaneous Fees & Fines: Other revenue collections include items such as application fees, late registration fees, library fines, miscellaneous revenues. This is the total revenue from Report 625 minus tuition and tuition differential fee revenues. This does not include local fees - Source: Operating Budget, Report 625 – Schedule I-A. Phosphate Research Trust Fund: State appropriation for the Florida Industrial and Phosphate Research Institute at the University of South Florida (for history years through 2011-12); beginning 2012-13 the Phosphate Research Trust Fund is appropriated through Florida Polytechnic University. Other Operating Trust Funds- For UF-IFAS and UF-HSC, actual revenues from the Incidental Trust Funds and Operations & Maintenance Trust Fund are provided by the University of Florida. Source: Final Amendment Package. Federal Stimulus Funds: Non-recurring American Recovery and Reinvestment Act funds appropriated by the state - Source: SUS Final Amendment Package.
15
Annual Accountability Report 2011-2012
FLORIDA INTERNATIONAL UNIVERSITY
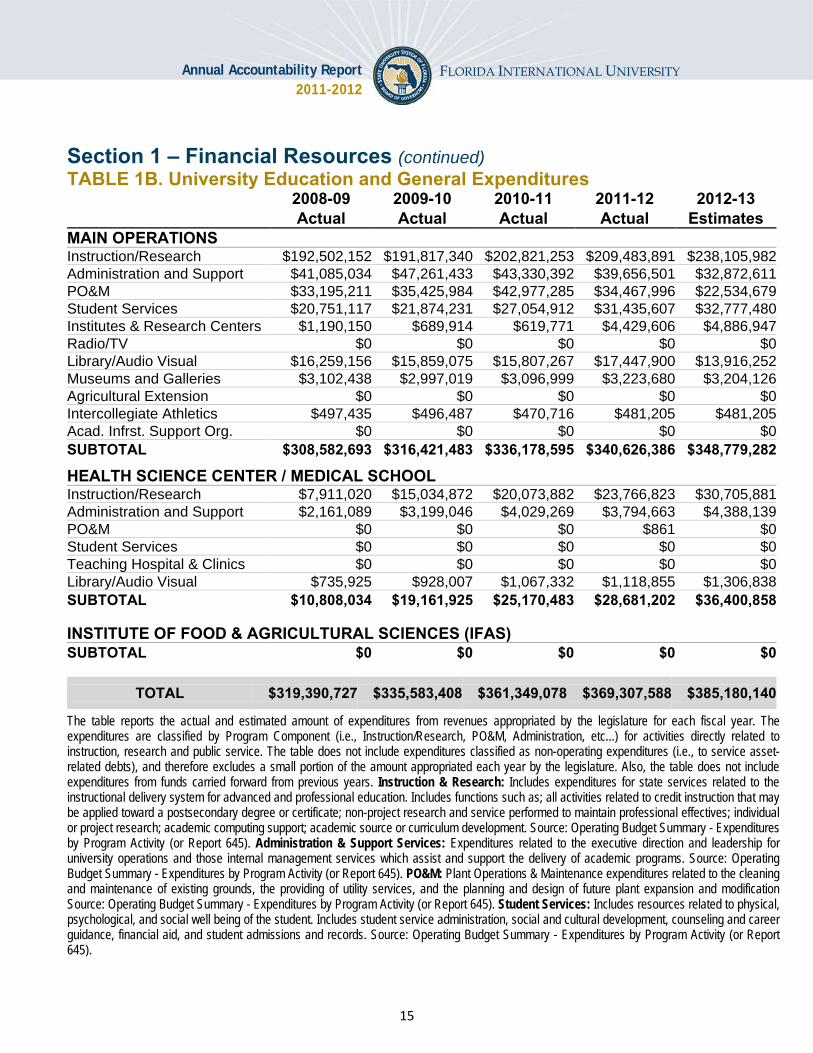
Section 1 – Financial Resources (continued) TABLE 1B. University Education and General Expenditures 2008-09 2009-10 2010-11 2011-12 2012-13
Actual Actual Actual Actual Estimates MAIN OPERATIONS Instruction/Research $192,502,152 $191,817,340 $202,821,253 $209,483,891 $238,105,982 Administration and Support $41,085,034 $47,261,433 $43,330,392 $39,656,501 $32,872,611 PO&M $33,195,211 $35,425,984 $42,977,285 $34,467,996 $22,534,679 Student Services $20,751,117 $21,874,231 $27,054,912 $31,435,607 $32,777,480 Institutes & Research Centers $1,190,150 $689,914 $619,771 $4,429,606 $4,886,947 Radio/TV $0 $0 $0 $0 $0 Library/Audio Visual $16,259,156 $15,859,075 $15,807,267 $17,447,900 $13,916,252 Museums and Galleries $3,102,438 $2,997,019 $3,096,999 $3,223,680 $3,204,126 Agricultural Extension $0 $0 $0 $0 $0 Intercollegiate Athletics $497,435 $496,487 $470,716 $481,205 $481,205 Acad. Infrst. Support Org. $0 $0 $0 $0 $0 SUBTOTAL $308,582,693 $316,421,483 $336,178,595 $340,626,386 $348,779,282
HEALTH SCIENCE CENTER / MEDICAL SCHOOL Instruction/Research $7,911,020 $15,034,872 $20,073,882 $23,766,823 $30,705,881 Administration and Support $2,161,089 $3,199,046 $4,029,269 $3,794,663 $4,388,139 PO&M $0 $0 $0 $861 $0 Student Services $0 $0 $0 $0 $0 Teaching Hospital & Clinics $0 $0 $0 $0 $0 Library/Audio Visual $735,925 $928,007 $1,067,332 $1,118,855 $1,306,838 SUBTOTAL $10,808,034 $19,161,925 $25,170,483 $28,681,202 $36,400,858
INSTITUTE OF FOOD & AGRICULTURAL SCIENCES (IFAS) SUBTOTAL $0 $0 $0 $0 $0
TOTAL $319,390,727 $335,583,408 $361,349,078 $369,307,588 $385,180,140
The table reports the actual and estimated amount of expenditures from revenues appropriated by the legislature for each fiscal year. The expenditures are classified by Program Component (i.e., Instruction/Research, PO&M, Administration, etc...) for activities directly related to instruction, research and public service. The table does not include expenditures classified as non-operating expenditures (i.e., to service asset-related debts), and therefore excludes a small portion of the amount appropriated each year by the legislature. Also, the table does not include expenditures from funds carried forward from previous years. Instruction & Research: Includes expenditures for state services related to the instructional delivery system for advanced and professional education. Includes functions such as; all activities related to credit instruction that may be applied toward a postsecondary degree or certificate; non-project research and service performed to maintain professional effectives; individual or project research; academic computing support; academic source or curriculum development. Source: Operating Budget Summary - Expenditures by Program Activity (or Report 645). Administration & Support Services: Expenditures related to the executive direction and leadership for university operations and those internal management services which assist and support the delivery of academic programs. Source: Operating Budget Summary - Expenditures by Program Activity (or Report 645). PO&M: Plant Operations & Maintenance expenditures related to the cleaning and maintenance of existing grounds, the providing of utility services, and the planning and design of future plant expansion and modification Source: Operating Budget Summary - Expenditures by Program Activity (or Report 645). Student Services: Includes resources related to physical, psychological, and social well being of the student. Includes student service administration, social and cultural development, counseling and career guidance, financial aid, and student admissions and records. Source: Operating Budget Summary - Expenditures by Program Activity (or Report 645).

16
Annual Accountability Report 2011-2012
FLORIDA INTERNATIONAL UNIVERSITY
Section 1 – Financial Resources (continued) TABLE 1C. State Funding per Full-Time Equivalent (FTE) Student
2008-09
Actual 2009-10 Actual
2010-11 Actual
2011-12 Actual
2012-13
Estimates
Appropriated Funding per FTE General Revenue $5,638 $4,731 $4,526 $3,675 $3,073 Lottery Funds $720 $621 $665 $698 $516 Tuition & Fees $3,885 $4,291 $4,449 $4,699 $5,710 Other Trust Funds $0 $420 $375 $0 $0 TOTAL $10,243 $10,063 $10,015 $9,073 $9,299 Actual Funding per FTE Tuition & Fees $4,082 $4,077 $4,539 $4,793 $5,190 TOTAL $10,439 $9,848 $10,105 $9,166 $8,778 Notes: (1) FTE is based on actual FTE, not funded FTE; (2) does not include Health-Science Center funds or FTE; (3) FTE for these metrics uses the standard IPEDS definition of FTE, equal to 30 credit hours for undergraduates and 24 for graduates; and (4) actual funding per student is based on actual tuition and E&G fees (does not include local fees) collected. Sources: Appropriated totals from the annual Final Amendment Package data. Estimated year data from the Allocation Summary document (and does not include annual adjustments of risk management insurance premiums). Actual Student Fees from the Operating Budget 625 reports. This does not include appropriations for special units (i.e., IFAS, Health Science Centers, and Medical Schools). Tuition and fee revenues include tuition and tuition differential fee and E&G fees (i.e., application, late registration, and library fees/fines). Other local fees that do not support E&G activities are not included here (see Board of Governors Regulation 7.003). This data is not adjusted for inflation.
TABLE 1D. University Other Budget Entities 2008-09
Actual 2009-10 Actual
2010-11 Actual
2011-12 Actual
2012-13
Estimates
Auxiliary Enterprises Revenues $108,899,206 $148,386,976 $163,393,424 $171,560,027 $202,699,058 Expenditures $103,433,291 $114,372,229 $127,641,069 $156,387,266 $183,478,576 Contracts & Grants Revenues $80,759,342 $88,864,089 $91,229,784 $94,226,072 $94,773,486 Expenditures $82,736,070 $83,468,637 $86,572,638 $87,518,180 $94,683,008 Local Funds Revenues $108,121,083 $135,314,838 $175,793,527 $186,396,046 $205,224,993 Expenditures $105,405,591 $134,813,829 $175,001,783 $179,767,448 $204,959,621 Faculty Practice Plans Revenues $0 $9,922 $19,789 $321,537 $1,753,716 Expenditures $0 $39,848 $236,450 $3,900,452 $3,474,440 Notes: Revenues do not include transfers. Expenditures do not include non-operating expenditures. Auxiliary Enterprises are self supported through fees, payments and charges. Examples include housing, food services, bookstores, parking services, health centers. Contract & Grants resources are received from federal, state or private sources for the purposes of conducting research and public service activities. Local Funds are associated with student activity (supported by the student activity fee), student financial aid, concessions, intercollegiate athletics, technology fee, green fee, and student life & services fee. Faculty Practice Plan revenues/receipts are funds generated from faculty practice plan activities. Faculty Practice Plan expenditures include all expenditures relating to the faculty practice plans, including transfers between other funds and/or entities. This may result in double counting in information presented within the annual report. Source: Operating Budget, Report 615.
17
Annual Accountability Report 2011-2012
FLORIDA INTERNATIONAL UNIVERSITY
Section 1 – Financial Resources (continued)
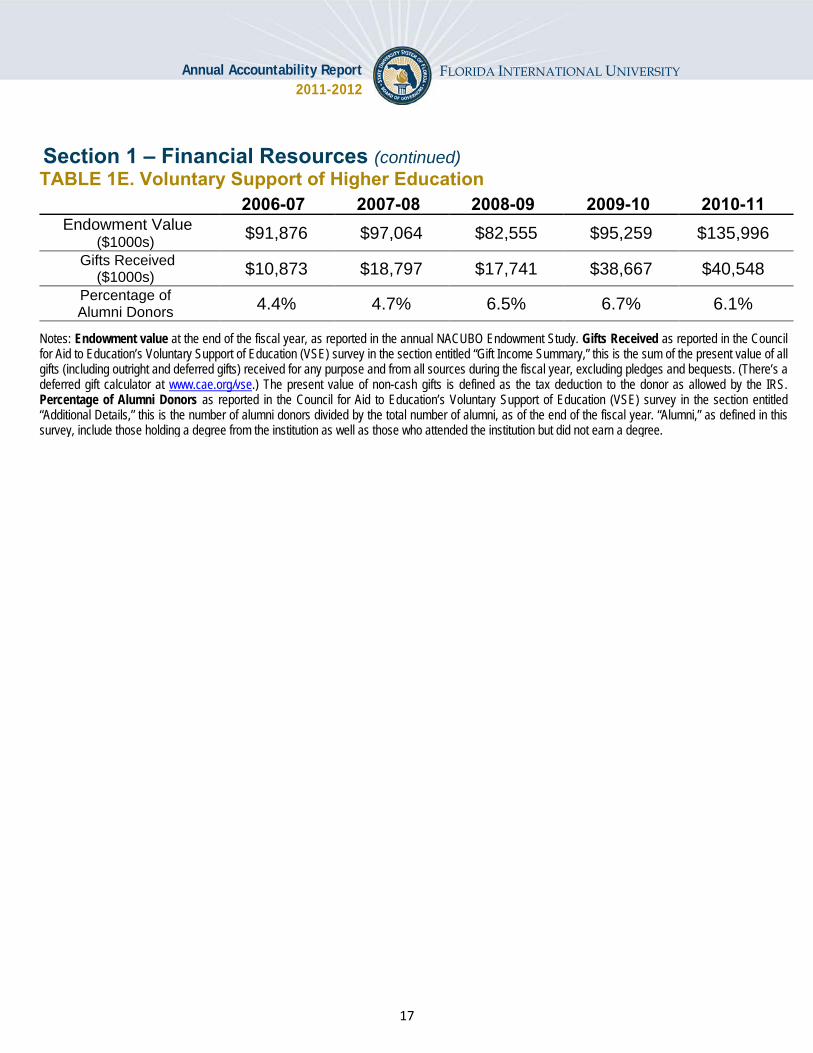
TABLE 1E. Voluntary Support of Higher Education
2006-07 2007-08 2008-09 2009-10 2010-11
Endowment Value ($1000s) $91,876 $97,064 $82,555 $95,259 $135,996
Gifts Received ($1000s) $10,873 $18,797 $17,741 $38,667 $40,548
Percentage of Alumni Donors 4.4% 4.7% 6.5% 6.7% 6.1%
Notes: Endowment value at the end of the fiscal year, as reported in the annual NACUBO Endowment Study. Gifts Received as reported in the Council for Aid to Education’s Voluntary Support of Education (VSE) survey in the section entitled “Gift Income Summary,” this is the sum of the present value of all gifts (including outright and deferred gifts) received for any purpose and from all sources during the fiscal year, excluding pledges and bequests. (There’s a deferred gift calculator at www.cae.org/vse.) The present value of non-cash gifts is defined as the tax deduction to the donor as allowed by the IRS. Percentage of Alumni Donors as reported in the Council for Aid to Education’s Voluntary Support of Education (VSE) survey in the section entitled “Additional Details,” this is the number of alumni donors divided by the total number of alumni, as of the end of the fiscal year. “Alumni,” as defined in this survey, include those holding a degree from the institution as well as those who attended the institution but did not earn a degree.

18
Annual Accountability Report 2011-2012
FLORIDA INTERNATIONAL UNIVERSITY
Section 2 – Personnel
TABLE 2A. Personnel Headcount (in Fall term only)
2007 2008 2009 2010 2011 Full-time
Tenured Faculty 461 436 432 438 435
Tenure-track Faculty 195 210 201 196 220
Non-Tenure Track Faculty 172 171 191 210 310
Instructors Without Faculty Status 24 37 47 47 47
Graduate Assistants/Associates 0 0 0 0 0
Executive/Administrative 517 571 608 642 715
Other Professional 960 1,028 1,072 1,163 1,389
Non-Professional 962 954 965 958 992
FULL-TIME SUBTOTAL 3,291 3,407 3,516 3,654 4,108
Part-time Tenured Faculty 1 7 15 6 10
Tenure-track Faculty 2 1 3 0 0
Non-Tenure Track Faculty 6 5 9 9 17
Instructors Without Faculty Status 680 685 656 664 665
Graduate Assistants/Associates 1,036 985 990 1,038 1,071
Executive/Administrative 3 6 7 12 12
Other Professional 35 32 30 30 42
Non-Professional 32 29 25 21 29
PART-TIME SUBTOTAL 1,795 1,750 1,735 1,780 1,846
TOTAL 5,086 5,157 5,251 5,434 5,954 Note: This table is based on the annual IPEDS Human Resources Survey, and provides full- and part-time medical and non-medical staff by faculty status and primary function/occupational activity. Tenured and Tenure-Track Faculty include those categorized within instruction, research, or public service. Non-Tenure Track Faculty includes adjunct faculty and faculty on multi-year contracts categorized within instruction, research, or public service. Instructors Without Faculty Status includes postdoctoral research associates, and individuals hired as a staff member primarily to do research on a 3-year contract without tenure eligibility categorized within instruction, research, or public service. Executive/Administrative refers to all executive, administrative and managerial positions regardless of faculty status. Other Professional refers to support and service positions regardless of faculty status.

19
Annual Accountability Report 2011-2012
FLORIDA INTERNATIONAL UNIVERSITY
Section 3 – Enrollment
TABLE 3A. Full-Time Equivalent (FTE) Enrollment
2010-11 2011-12 2012-13 Funded Actual Funded Actual Funded Estimated
FLORIDA RESIDENTS
Lower 7,860 8,260 7,860 9,084 7,860 9,884 Upper 11,682 12,937 11,682 13,883 11,682 13,953 Grad I 2,588 2,960 2,588 2,712 2,588 2,613 Grad II 818 951 818 945 818 1,052 Total 22,948 25,108 22,948 26,625 22,948 27,502
NON-FLORIDA RESIDENTS
Lower . 491 . 563 . 596 Upper . 692 . 756 . 745 Grad I . 597 . 579 . 546 Grad II . 399 . 424 . 434 Total 2,138 2,180 2,138 2,322 2,138 2,321
TOTAL FTE
Lower . 8,751 . 9,647 . 10,480 Upper . 13,630 . 14,639 . 14,698 Grad I . 3,558 . 3,291 . 3,159 Grad II . 1,350 . 1,370 . 1,486 Total FTE 25,086 27,289 25,086 28,947 25,086 29,823 Total FTE (US Definition) 33,448 36,384 33,448 38,596 33,448 39,764
Headcount for Medical Doctorates
Residents 80 71 144 141 248 250 Non-Residents 0 14 16 26 32 30 Total 80 85 160 167 280 280 Notes: Full-time Equivalent (FTE) student is a measure of instructional effort (and student activity) that is based on the number of credit hours that students enroll. FTE is based on the Florida definition, which divides undergraduate credit hours by 40 and graduate credit hours by 32 (US definition based on Undergraduate FTE = 30 and Graduate FTE = 24 credit hours). Funded enrollment as reported in the General Appropriations Act and set by the legislature. Actual enrollment only reports ‘state-fundable’ FTE as reported by Universities to the Board of Governors in the Student Instruction File (SIF). Estimated enrollment as reported by Universities to the Board of Governors in their Enrollment Plans. Totals are actual and may not equal sum of reported student levels due to rounding of student level FTE. Actual Medical headcounts (includes Medicine, Dentistry, and Veterinary programs) are based on Fall enrollment data.

20
Annual Accountability Report 2011-2012
FLORIDA INTERNATIONAL UNIVERSITY
Section 3 – Enrollment (continued)
TABLE 3B. Full-Time Equivalent (FTE) Enrollment by Location
2010-11
Actual 2011-12
Actual 2012-13
Estimated
MAIN CAMPUS
LOWER-DIVISION 6,442 6,937 7,536 UPPER-DIVISION 8,530 8,873 8,980 MASTER’S (GRAD I) 2,441 2,322 2,255 DOCTORAL (GRAD II) 1,296 1,308 1,428 TOTAL 18,708 19,440 20,199
SITE: BISCAYNE BAY CAMPUS LOWER-DIVISION 845 791 859 UPPER-DIVISION 1,808 1,751 1,766 MASTER’S (GRAD I) 268 272 261 DOCTORAL (GRAD II) 16 16 18 TOTAL 2,937 2,830 2,904
SITE: PINES CENTER SITE LOWER-DIVISION 34 23 25 UPPER-DIVISION 239 204 205 MASTER’S (GRAD I) 233 172 165 DOCTORAL (GRAD II) 15 13 14 TOTAL 521 412 409
OTHER PHYSICAL LOCATIONS LOWER-DIVISION 1,431 1,895 2,059 UPPER-DIVISION 3,053 3,811 3,747 MASTER’S (GRAD I) 616 526 478 DOCTORAL (GRAD II) 22 33 26 TOTAL 5,122 6,265 6,310
TOTAL LOWER-DIVISION 8,751 9,647 10,480 UPPER-DIVISION 13,630 14,639 14,698 MASTER’S (GRAD I) 3,558 3,291 3,159 DOCTORAL (GRAD II) 1,350 1,370 1,486 TOTAL 27,289 28,947 29,823
Notes: “Site” refers to each distinct physical location that has or is planned to have more than 150 State-fundable FTE enrollments. Totals are actual and may not equal sum of reported student levels due to rounding of student level FTE. Total FTE are equal in tables 3A, 3B, and 3C. See table 3C for details on Distance Learning.

21
Annual Accountability Report 2011-2012
FLORIDA INTERNATIONAL UNIVERSITY
Section 3 – Enrollment (continued) TABLE 3C. Full-Time Equivalent (FTE) Enrollment by Method of Instruction
2010-11 2011-12
TRADITIONAL LOWER-DIVISION 7,678 8,091 UPPER-DIVISION 10,707 10,922 MASTER’S (GRAD I) 3,123 2,840 DOCTORAL (GRAD II) 1,319 1,330 TOTAL 22,827 23,184
HYBRID LOWER-DIVISION 56 282 UPPER-DIVISION 52 67 MASTER’S (GRAD I) 12 17 DOCTORAL (GRAD II) 24 26 TOTAL 145 391
DISTANCE LEARNING LOWER-DIVISION 1,017 1,274 UPPER-DIVISION 2,871 3,650 MASTER’S (GRAD I) 423 434 DOCTORAL (GRAD II) 6 14 TOTAL 4,317 5,371
TOTAL LOWER-DIVISION 8,751 9,647 UPPER-DIVISION 13,630 14,639 MASTER’S (GRAD I) 3,558 3,291 DOCTORAL (GRAD II) 1,350 1,370 TOTAL 27,289 28,947
Note: Full-time Equivalent (FTE) student is a measure of instructional effort (and student activity) that is based on the number of credit hours that students enroll. FTE is based on the Florida definition, which divides undergraduate credit hours by 40 and graduate credit hours by 32. Distance Learning is a course in which at least 80 percent of the direct instruction of the course is delivered using some form of technology when the student and instructor are separated by time or space, or both (per 1009.24(17), F.S.). Hybrid is a course where 50% to 79% of the instruction is delivered using some form of technology, when the student and instructor are separated by time or space, or both (per SUDS data element 2052). Traditional (and Technology Enhanced) refers to primarily face to face instruction utilizing some form of technology for delivery of supplemental course materials for no more than 49% of instruction (per SUDS data element 2052). Totals are actual and may not equal sum of reported student levels due to rounding of student level FTE. Total FTE are equal in tables 3A, 3B, and 3C.

22
Annual Accountability Report 2011-2012
FLORIDA INTERNATIONAL UNIVERSITY
Section 4 – Undergraduate Education
TABLE 4A. Baccalaureate Degree Program Changes in AY 2011-12
Title of Program Six-digit
CIP Code
Degree Level
Date of UBOT Action
Starting or Ending
Term Comments
New Programs
Communication Arts 09.0101 Bachelor June 2011 Spring 2012
Terminated Programs
None
Inactive Programs None
New Programs Considered By University But Not Approved
None
Note: This table does not include new majors or concentrations added under an existing degree program CIP Code. This table reports the new and terminated program changes based on Board action dates between May 5, 2011 and May 4, 2012. New Programs are proposed new degree programs that have been completely through the approval process at the university and, if appropriate, the Board of Governors. Does not include new majors or concentrations added under an existing degree program CIP Code. Terminated Programs are degree programs for which the entire CIP Code has been terminated and removed from the university’s inventory of degree programs. Does not include majors or concentrations terminated under an existing degree program CIP Code if the code is to remain active on the academic degree inventory. Inactive Programs are degree programs for which enrollments have been temporarily suspended for the entire CIP Code, but the program CIP Code has not been terminated. Does not include majors or concentrations suspended under an existing degree program CIP Code if the code is to remain active on the academic degree inventory and new enrollments in any active major will be reported. New Programs Considered by University But Not Approved includes any programs considered by the university board of trustees, or any committee of the board, but not approved for implementation. Also include any programs that were returned prior to board consideration by the university administration for additional development, significant revisions, or re-conceptualization; regardless of whether the proposal was eventually taken to the university board for approval. Count the returns once per program, not multiple times the proposal was returned for revisions, unless there is a total re-conceptualization that brings forward a substantially different program in a different CIP Code.
23
Annual Accountability Report 2011-2012
FLORIDA INTERNATIONAL UNIVERSITY
Section 4 – Undergraduate Education (continued)
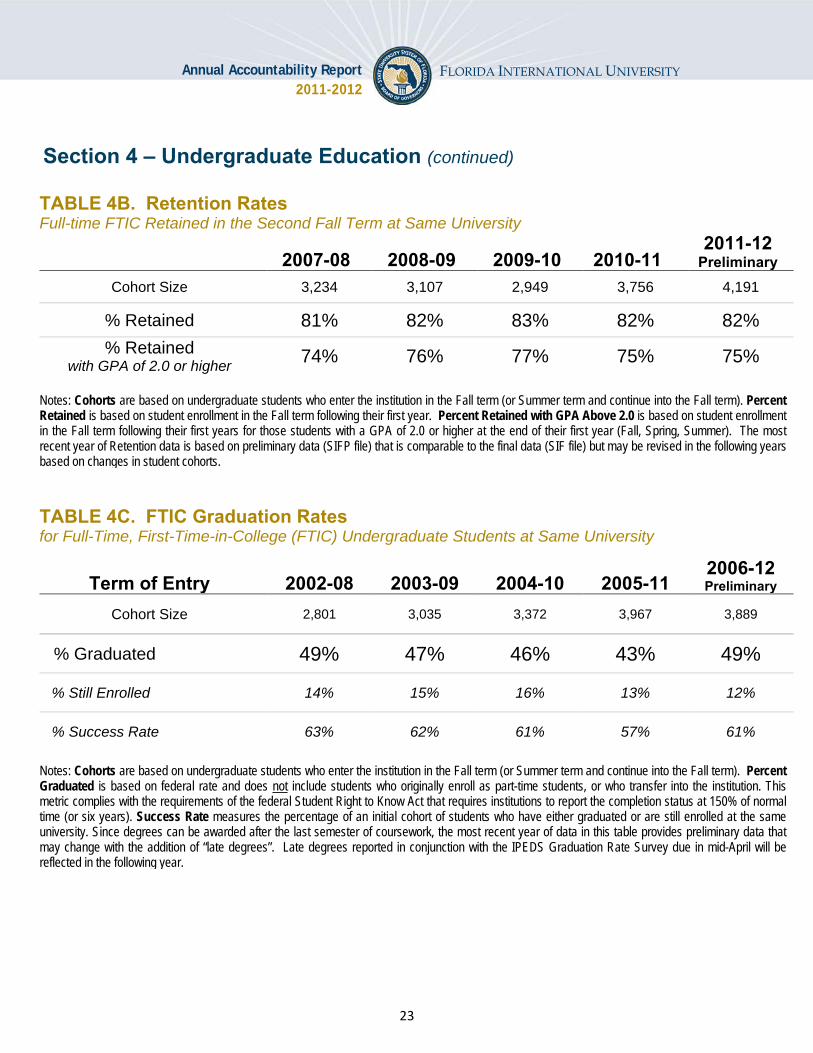
TABLE 4B. Retention Rates Full-time FTIC Retained in the Second Fall Term at Same University
2007-08 2008-09 2009-10 2010-11 2011-12
Preliminary Cohort Size 3,234 3,107 2,949 3,756 4,191
% Retained 81% 82% 83% 82% 82% % Retained
with GPA of 2.0 or higher 74% 76% 77% 75% 75% Notes: Cohorts are based on undergraduate students who enter the institution in the Fall term (or Summer term and continue into the Fall term). Percent Retained is based on student enrollment in the Fall term following their first year. Percent Retained with GPA Above 2.0 is based on student enrollment in the Fall term following their first years for those students with a GPA of 2.0 or higher at the end of their first year (Fall, Spring, Summer). The most recent year of Retention data is based on preliminary data (SIFP file) that is comparable to the final data (SIF file) but may be revised in the following years based on changes in student cohorts.
TABLE 4C. FTIC Graduation Rates for Full-Time, First-Time-in-College (FTIC) Undergraduate Students at Same University
Term of Entry 2002-08 2003-09 2004-10 2005-11 2006-12 Preliminary
Cohort Size 2,801 3,035 3,372 3,967 3,889
% Graduated 49% 47% 46% 43% 49%
% Still Enrolled 14% 15% 16% 13% 12%
% Success Rate 63% 62% 61% 57% 61% Notes: Cohorts are based on undergraduate students who enter the institution in the Fall term (or Summer term and continue into the Fall term). Percent Graduated is based on federal rate and does not include students who originally enroll as part-time students, or who transfer into the institution. This metric complies with the requirements of the federal Student Right to Know Act that requires institutions to report the completion status at 150% of normal time (or six years). Success Rate measures the percentage of an initial cohort of students who have either graduated or are still enrolled at the same university. Since degrees can be awarded after the last semester of coursework, the most recent year of data in this table provides preliminary data that may change with the addition of “late degrees”. Late degrees reported in conjunction with the IPEDS Graduation Rate Survey due in mid-April will be reflected in the following year.

24
Annual Accountability Report 2011-2012
FLORIDA INTERNATIONAL UNIVERSITY
Section 4 – Undergraduate Education (continued) TABLE 4D. FTIC Progression and Graduation Rates
4 – Year Rates 2004-08 2005-09 2006-10 2007-11 2008-12
Preliminary Full- & Part-time Cohort 3,788 4,550 4,271 3,508 3,347
From Same University
% Graduated 18% 15% 18% 19% 23% % Still Enrolled 48% 46% 47% 45% 46%
From Other SUS University
% Graduated 1% 1% 1% 1% 1% % Still Enrolled 3% 3% 3% 4% 3%
From State University System
% Graduated 19% 16% 19% 21% 24% % Still Enrolled 51% 48% 50% 49% 49% % Success Rate 70% 64% 69% 69% 73%
6 – Year Rates 2002-08 2003-09 2004-10 2005-11 2006-12
Preliminary Full- & Part-time Cohort 3,082 3,275 3,788 4,550 4,271
From Same University
% Graduated 47% 45% 44% 41% 47% % Still Enrolled 15% 16% 16% 14% 13%
From Other SUS University
% Graduated 3% 4% 3% 3% 4% % Still Enrolled 1% 2% 1% 1% 1%
From State University System
% Graduated 50% 49% 47% 44% 51% % Still Enrolled 16% 17% 17% 15% 14% % Success Rate 66% 67% 64% 60% 65% Notes: First-time-in-college (FTIC) cohort is defined as undergraduates entering in fall term (or summer continuing to fall) with fewer than 12 hours earned since high school graduation. (1) Cohorts are based on undergraduate students who enter the institution in the Fall term (or Summer term and continue into the Fall term). Students of degree programs longer than four years (eg, PharmD) are included in the cohorts. The initial cohorts are revised to remove students, who have allowable exclusions as defined by IPEDS, from the cohort. (2) Success Rate measures the percentage of an initial cohort of students who have either graduated or are still enrolled. (3) Since degrees can be awarded after the last semester of coursework, the most recent year of data in this table provides preliminary graduation rate data that may change with the addition of “late degrees”. Late degrees reported in conjunction with the IPEDS Graduation Rate Survey due in mid-April will be reflected in the following year.

25
Annual Accountability Report 2011-2012
FLORIDA INTERNATIONAL UNIVERSITY
Section 4 – Undergraduate Education (continued)
TABLE 4E. AA Transfer Progression and Graduation Rates
2 – Year Rates 2006-08 2007-09 2008-10 2009-11 2010-12
Preliminary Cohort
1,439 1,247 1,975 2,705 3,072
From Same University
% Graduated 20% 18% 20% 20% 22% % Still Enrolled 66% 65% 64% 64% 63%
From Other SUS University
% Graduated 0% 0% 0% 0% 0% % Still Enrolled 1% 2% 1% 1% 1%
From State University System
% Graduated 20% 18% 20% 20% 22% % Still Enrolled 67% 67% 66% 66% 63% % Success Rate 87% 85% 86% 86% 86%
4 – Year Rates 2004-08 2005-09 2006-10 2007-11 2008-12
Preliminary Cohort 1,317 1,231 1,439 1,247 1,975
From Same University
% Graduated 61% 61% 61% 59% 62% % Still Enrolled 15% 13% 15% 14% 13%
From Other SUS University
% Graduated 2% 2% 1% 2% 1% % Still Enrolled 1% 1% 1% 1% 1%
From State University System
% Graduated 63% 62% 62% 61% 63% % Still Enrolled 16% 14% 16% 15% 14% % Success Rate 79% 76% 78% 76% 77% Notes: AA Transfer cohort is defined as undergraduates entering in the fall term (or summer continuing to fall) and having earned an AA degree from an institution in the Florida College System. (1) Cohorts are based on undergraduate students who enter the institution in the Fall term (or Summer term and continue into the Fall term); (2) Success Rate measures the percentage of an initial cohort of students who have either graduated or are still enrolled; (3) since degrees can be awarded after the last semester of coursework, the most recent year of data in this table provides preliminary graduation rate data that may change with the addition of “late degrees”. Late degrees reported in conjunction with the IPEDS Graduation Rate Survey due in mid-April will be reflected in the following year.

26
Annual Accountability Report 2011-2012
FLORIDA INTERNATIONAL UNIVERSITY
Section 4 – Undergraduate Education (continued) TABLE 4F. Other Transfer Progression and Graduation Rates
5 – Year Rates 2003-08 2004-09 2005-10 2006-11 2007- 12 Preliminary
Cohort Size 2,016* 1,621 1,511 1,490 1,150
From Same University
% Graduated 51%* 54% 51% 55% 62% % Still Enrolled 10% 9% 9% 9% 8%
From Other SUS University
% Graduated 2% 2% 2% 2% 2% % Still Enrolled 1% 1% 1% 1% 1%
From State University System
% Graduated 52%* 56% 53% 57% 64% % Still Enrolled 11% 10% 10% 9% 8% % Success Rate 63% 66% 62% 66% 72% Notes: (1) Cohorts are based on undergraduate students who enter the institution in the Fall term (or Summer term and continue into the Fall term); (2) Success Rate measures the percentage of an initial cohort of students who have either graduated or are still enrolled; (3) since degrees can be awarded after the last semester of coursework, the most recent year of data in this table provides preliminary graduation rate data that may change with the addition of “late degrees”. Late degrees reported in conjunction with the IPEDS Graduation Rate Survey due in mid-April will be reflected in the following year. Note: * These data are under review by University and Board of Governors staff.
27
Annual Accountability Report 2011-2012
FLORIDA INTERNATIONAL UNIVERSITY
Section 4 – Undergraduate Education (continued)
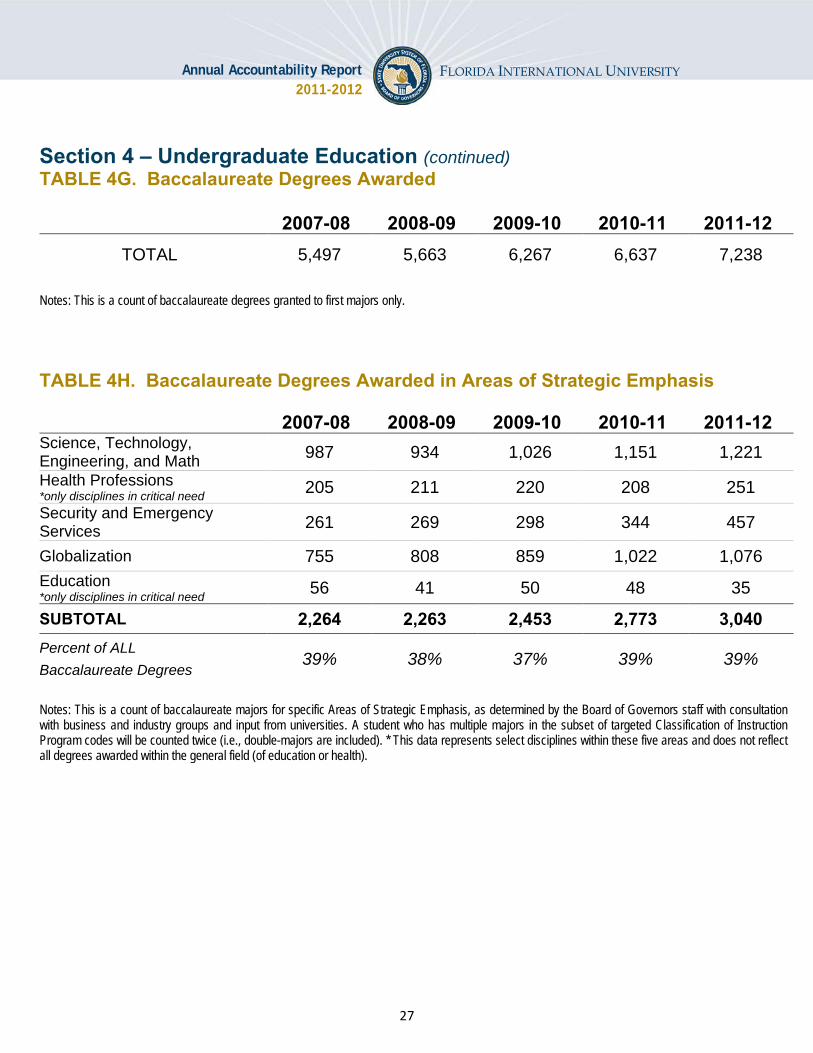
TABLE 4G. Baccalaureate Degrees Awarded
2007-08 2008-09 2009-10 2010-11 2011-12
TOTAL 5,497 5,663 6,267 6,637 7,238 Notes: This is a count of baccalaureate degrees granted to first majors only.
TABLE 4H. Baccalaureate Degrees Awarded in Areas of Strategic Emphasis
2007-08 2008-09 2009-10 2010-11 2011-12
Science, Technology, Engineering, and Math 987 934 1,026 1,151 1,221 Health Professions *only disciplines in critical need 205 211 220 208 251 Security and Emergency Services 261 269 298 344 457
Globalization 755 808 859 1,022 1,076 Education *only disciplines in critical need 56 41 50 48 35
SUBTOTAL 2,264 2,263 2,453 2,773 3,040 Percent of ALL Baccalaureate Degrees
39% 38% 37% 39% 39%
Notes: This is a count of baccalaureate majors for specific Areas of Strategic Emphasis, as determined by the Board of Governors staff with consultation with business and industry groups and input from universities. A student who has multiple majors in the subset of targeted Classification of Instruction Program codes will be counted twice (i.e., double-majors are included). * This data represents select disciplines within these five areas and does not reflect all degrees awarded within the general field (of education or health).
28
Annual Accountability Report 2011-2012
FLORIDA INTERNATIONAL UNIVERSITY
Section 4 – Undergraduate Education (continued)
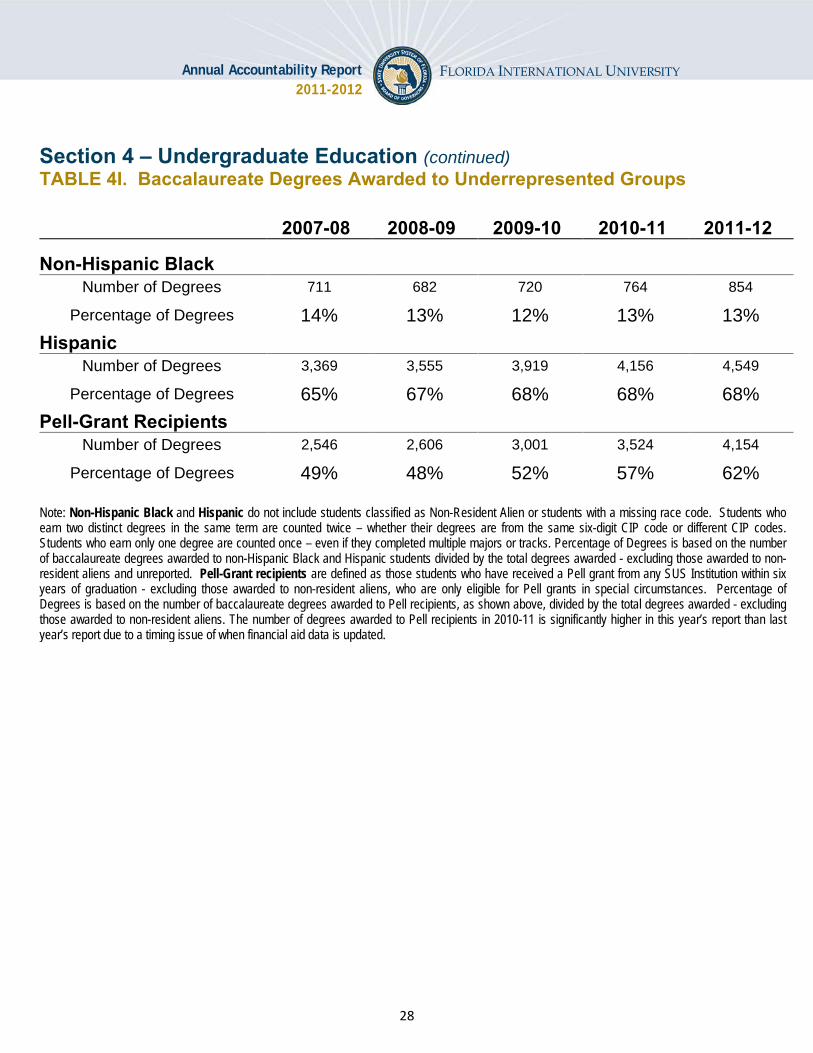
TABLE 4I. Baccalaureate Degrees Awarded to Underrepresented Groups
2007-08 2008-09 2009-10 2010-11 2011-12
Non-Hispanic Black
Number of Degrees 711 682 720 764 854
Percentage of Degrees 14% 13% 12% 13% 13% Hispanic
Number of Degrees 3,369 3,555 3,919 4,156 4,549
Percentage of Degrees 65% 67% 68% 68% 68% Pell-Grant Recipients
Number of Degrees 2,546 2,606 3,001 3,524 4,154
Percentage of Degrees 49% 48% 52% 57% 62% Note: Non-Hispanic Black and Hispanic do not include students classified as Non-Resident Alien or students with a missing race code. Students who earn two distinct degrees in the same term are counted twice – whether their degrees are from the same six-digit CIP code or different CIP codes. Students who earn only one degree are counted once – even if they completed multiple majors or tracks. Percentage of Degrees is based on the number of baccalaureate degrees awarded to non-Hispanic Black and Hispanic students divided by the total degrees awarded - excluding those awarded to non-resident aliens and unreported. Pell-Grant recipients are defined as those students who have received a Pell grant from any SUS Institution within six years of graduation - excluding those awarded to non-resident aliens, who are only eligible for Pell grants in special circumstances. Percentage of Degrees is based on the number of baccalaureate degrees awarded to Pell recipients, as shown above, divided by the total degrees awarded - excluding those awarded to non-resident aliens. The number of degrees awarded to Pell recipients in 2010-11 is significantly higher in this year’s report than last year’s report due to a timing issue of when financial aid data is updated.
29
Annual Accountability Report 2011-2012
FLORIDA INTERNATIONAL UNIVERSITY
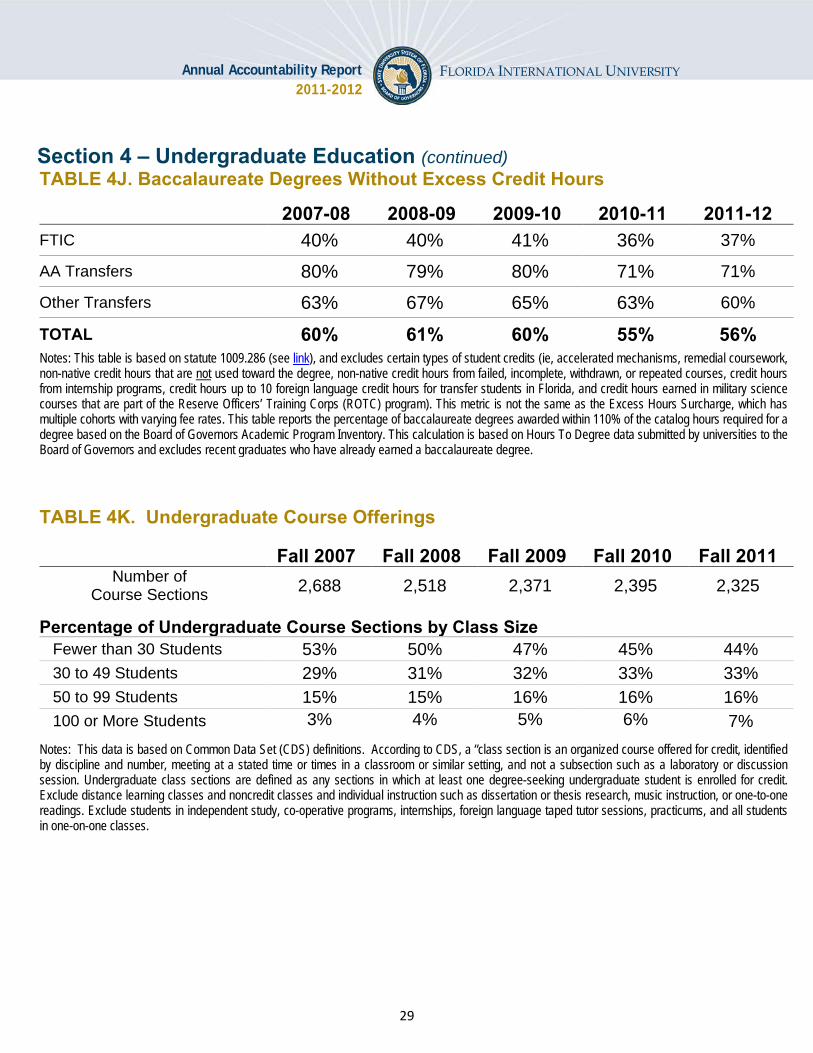
Section 4 – Undergraduate Education (continued) TABLE 4J. Baccalaureate Degrees Without Excess Credit Hours
2007-08 2008-09 2009-10 2010-11 2011-12
FTIC 40% 40% 41% 36% 37%
AA Transfers 80% 79% 80% 71% 71%
Other Transfers 63% 67% 65% 63% 60%
TOTAL 60% 61% 60% 55% 56% Notes: This table is based on statute 1009.286 (see link), and excludes certain types of student credits (ie, accelerated mechanisms, remedial coursework, non-native credit hours that are not used toward the degree, non-native credit hours from failed, incomplete, withdrawn, or repeated courses, credit hours from internship programs, credit hours up to 10 foreign language credit hours for transfer students in Florida, and credit hours earned in military science courses that are part of the Reserve Officers’ Training Corps (ROTC) program). This metric is not the same as the Excess Hours Surcharge, which has multiple cohorts with varying fee rates. This table reports the percentage of baccalaureate degrees awarded within 110% of the catalog hours required for a degree based on the Board of Governors Academic Program Inventory. This calculation is based on Hours To Degree data submitted by universities to the Board of Governors and excludes recent graduates who have already earned a baccalaureate degree.
TABLE 4K. Undergraduate Course Offerings
Fall 2007 Fall 2008 Fall 2009 Fall 2010 Fall 2011
Number of Course Sections
2,688 2,518 2,371 2,395 2,325
Percentage of Undergraduate Course Sections by Class Size Fewer than 30 Students 53% 50% 47% 45% 44% 30 to 49 Students 29% 31% 32% 33% 33% 50 to 99 Students 15% 15% 16% 16% 16% 100 or More Students 3% 4% 5% 6% 7%
Notes: This data is based on Common Data Set (CDS) definitions. According to CDS, a “class section is an organized course offered for credit, identified by discipline and number, meeting at a stated time or times in a classroom or similar setting, and not a subsection such as a laboratory or discussion session. Undergraduate class sections are defined as any sections in which at least one degree-seeking undergraduate student is enrolled for credit. Exclude distance learning classes and noncredit classes and individual instruction such as dissertation or thesis research, music instruction, or one-to-one readings. Exclude students in independent study, co-operative programs, internships, foreign language taped tutor sessions, practicums, and all students in one-on-one classes.
30
Annual Accountability Report 2011-2012
FLORIDA INTERNATIONAL UNIVERSITY
Section 4 – Undergraduate Education (continued)
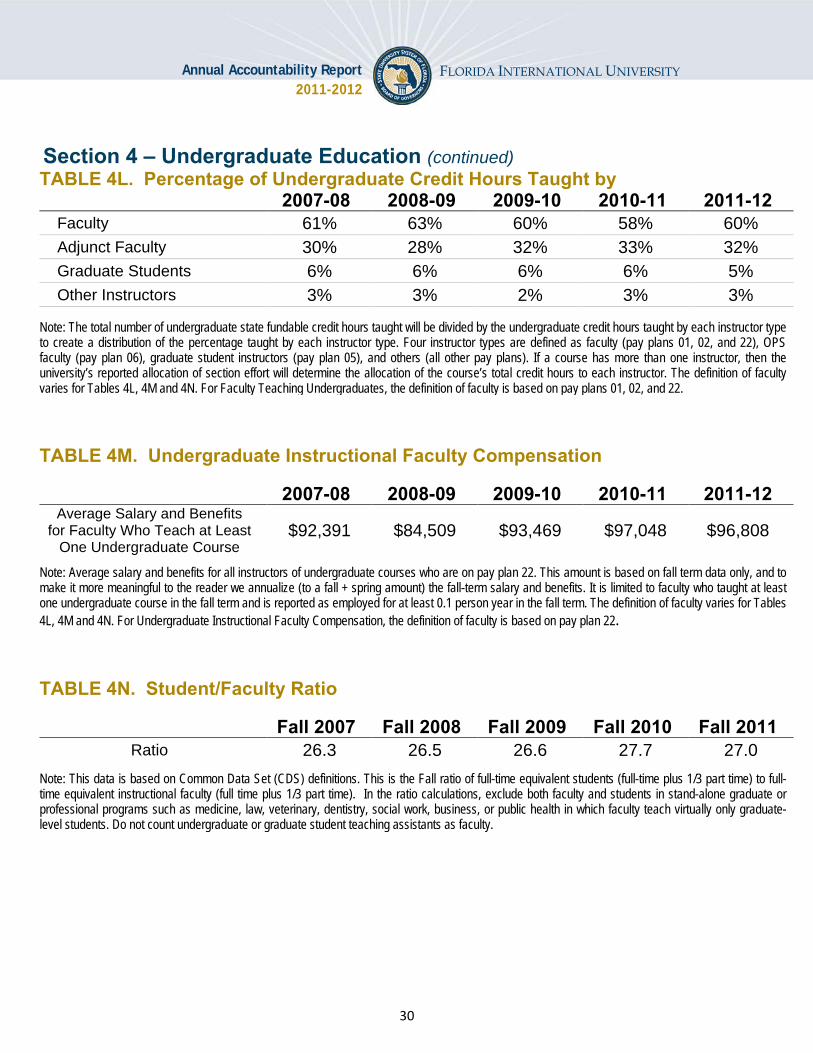
TABLE 4L. Percentage of Undergraduate Credit Hours Taught by 2007-08 2008-09 2009-10 2010-11 2011-12
Faculty 61% 63% 60% 58% 60% Adjunct Faculty 30% 28% 32% 33% 32% Graduate Students 6% 6% 6% 6% 5% Other Instructors 3% 3% 2% 3% 3% Note: The total number of undergraduate state fundable credit hours taught will be divided by the undergraduate credit hours taught by each instructor type to create a distribution of the percentage taught by each instructor type. Four instructor types are defined as faculty (pay plans 01, 02, and 22), OPS faculty (pay plan 06), graduate student instructors (pay plan 05), and others (all other pay plans). If a course has more than one instructor, then the university’s reported allocation of section effort will determine the allocation of the course’s total credit hours to each instructor. The definition of faculty varies for Tables 4L, 4M and 4N. For Faculty Teaching Undergraduates, the definition of faculty is based on pay plans 01, 02, and 22.
TABLE 4M. Undergraduate Instructional Faculty Compensation
2007-08 2008-09 2009-10 2010-11 2011-12
Average Salary and Benefits for Faculty Who Teach at Least
One Undergraduate Course $92,391 $84,509 $93,469 $97,048 $96,808
Note: Average salary and benefits for all instructors of undergraduate courses who are on pay plan 22. This amount is based on fall term data only, and to make it more meaningful to the reader we annualize (to a fall + spring amount) the fall-term salary and benefits. It is limited to faculty who taught at least one undergraduate course in the fall term and is reported as employed for at least 0.1 person year in the fall term. The definition of faculty varies for Tables 4L, 4M and 4N. For Undergraduate Instructional Faculty Compensation, the definition of faculty is based on pay plan 22.
TABLE 4N. Student/Faculty Ratio
Fall 2007 Fall 2008 Fall 2009 Fall 2010 Fall 2011
Ratio 26.3 26.5 26.6 27.7 27.0
Note: This data is based on Common Data Set (CDS) definitions. This is the Fall ratio of full-time equivalent students (full-time plus 1/3 part time) to full-time equivalent instructional faculty (full time plus 1/3 part time). In the ratio calculations, exclude both faculty and students in stand-alone graduate or professional programs such as medicine, law, veterinary, dentistry, social work, business, or public health in which faculty teach virtually only graduate-level students. Do not count undergraduate or graduate student teaching assistants as faculty.

31
Annual Accountability Report 2011-2012
FLORIDA INTERNATIONAL UNIVERSITY
Section 4 – Undergraduate Education (continued) TABLE 4O. Professional Licensure/Certification Exams
Nursing: National Council Licensure Examination for Registered Nurses
2007-08 2008-09 2009-10 2010-11 2011-12
Examinees 176 181 165 192 149 Pass Rate 85% 89% 94% 90% 94% National Benchmark 86% 88% 90% 89% 89% Note: Pass rate for first-time examinees for the National Council Licensure Examination for Registered Nurses (NCLEX-RN) are based on the performance of graduates of baccalaureate nursing programs. National benchmark data is based on Jan-Dec NCLEX-RN results for first-time examinees from students in US-educated baccalaureate degree programs as published by the National Council of State Boards of Nursing.
TABLE 4P. Tuition Differential Fee (TDF)
2010-11 2011-12 2012-13
Projected TDF Revenues Generated $15,411,111 $25,308,323 $40,888,078 Students Receiving TDF Funded Award 5,202 5,735 n/a Value of TDF Funded Award $639 $636 n/a
Florida Student Assistance Grant (FSAG) Eligible Students Number of Eligible Students 12,982 12,238 n/a Number Receiving a TDF Waiver 0 0 n/a Value of TDF Waivers $0 $0 n/a
Note: TDF Revenues Generated refers to actual tuition differential revenues collected from undergraduate students as reported on the Operating Budget, Report 625 – Schedule I-A. Students Receiving TDF Funded Award reports the number of unduplicated students who have received a financial aid award that was funded by tuition differential revenues. Value of TDF Funded Award refers to the average value of financial aid awards funded by the Tuition Differential Fee funds. Florida Student Assistance Grant (FSAG) Eligible Students: Number of Eligible Students refers to total annual unduplicated count of undergraduates at the institution who are eligible for FSAG in the academic year, whether or not they received FSAG awards. Number Receiving a TDF Waiver refers to annual unduplicated count of FSAG-eligible students receiving a waiver, partial or full, of the tuition differential fees at the institution during the academic year, regardless of the reason for the waiver. Value of TDF Waivers refers to the average value of waivers provided to FSAG-eligible undergraduates at the institution during the academic year, regardless of the reason for the waiver.

32
Annual Accountability Report 2011-2012
FLORIDA INTERNATIONAL UNIVERSITY
Section 5 – Graduate Education
TABLE 5A. Graduate Degree Program Changes in AY 2011-12
Title of Program Six-digit
CIP Code
Degree Level
Date of UBOT Action
Starting or Ending
Term
Date of Board of
Governors Action
Comments
New Programs
Biomedical Sciences, General 26.0102 Research Doctorate Sept. 2011 Fall 2012 Jan. 2012
Terminated Programs None
Inactive Programs None
New Programs Considered By University But Not Approved
None
Note: This table does not include new majors or concentrations added under an existing degree program CIP Code. This table reports the new and terminated program changes based on Board action dates between May 5, 2011 and May 4, 2012. New Programs are proposed new degree programs that have been completely through the approval process at the university and, if appropriate, the Board of Governors. Does not include new majors or concentrations added under an existing degree program CIP Code. Terminated Programs are degree programs for which the entire CIP Code has been terminated and removed from the university’s inventory of degree programs. Does not include majors or concentrations terminated under an existing degree program CIP Code if the code is to remain active on the academic degree inventory. Inactive Programs are degree programs for which enrollments have been temporarily suspended for the entire CIP Code, but the program CIP Code has not been terminated. Does not include majors or concentrations suspended under an existing degree program CIP Code if the code is to remain active on the academic degree inventory and new enrollments in any active major will be reported. New Programs Considered by University But Not Approved includes any programs considered by the university board of trustees, or any committee of the board, but not approved for implementation. Also include any programs that were returned prior to board consideration by the university administration for additional development, significant revisions, or re-conceptualization; regardless of whether the proposal was eventually taken to the university board for approval. Count the returns once per program, not multiple times the proposal was returned for revisions, unless there is a total re-conceptualization that brings forward a substantially different program in a different CIP Code.
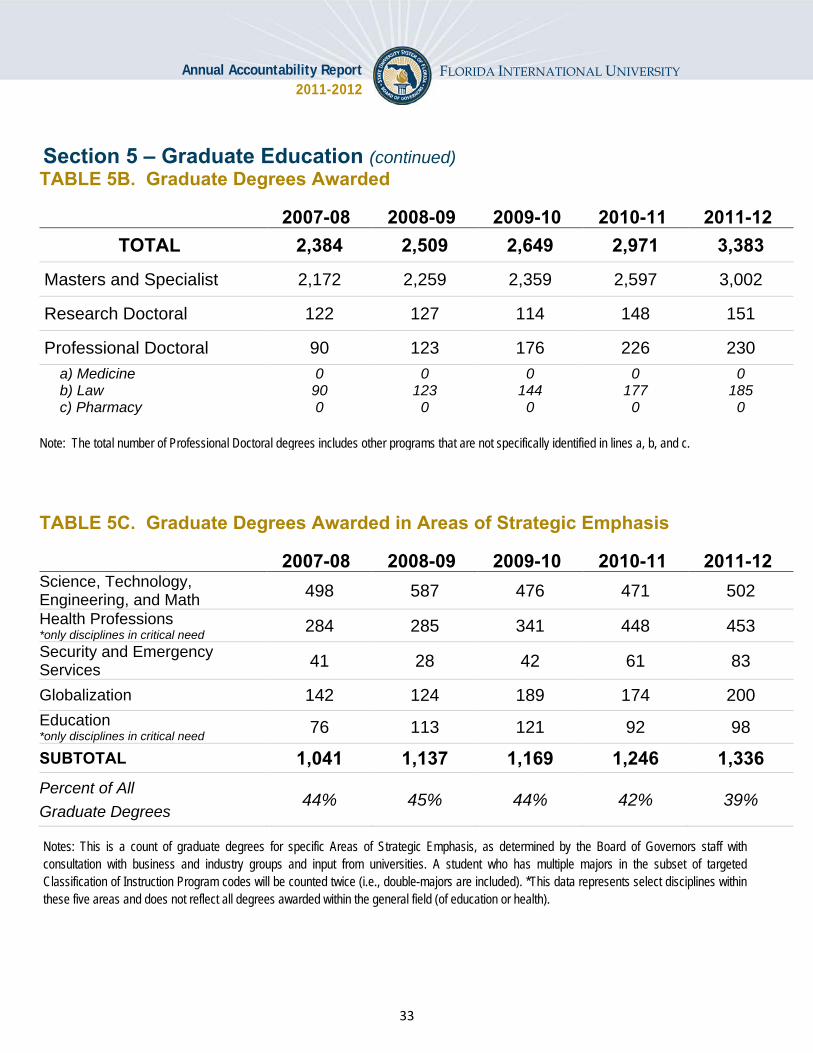
33
Annual Accountability Report 2011-2012
FLORIDA INTERNATIONAL UNIVERSITY
Section 5 – Graduate Education (continued) TABLE 5B. Graduate Degrees Awarded
2007-08 2008-09 2009-10 2010-11 2011-12
TOTAL 2,384 2,509 2,649 2,971 3,383
Masters and Specialist 2,172 2,259 2,359 2,597 3,002
Research Doctoral 122 127 114 148 151
Professional Doctoral 90 123 176 226 230 a) Medicine 0 0 0 0 0 b) Law 90 123 144 177 185 c) Pharmacy 0 0 0 0 0 Note: The total number of Professional Doctoral degrees includes other programs that are not specifically identified in lines a, b, and c.
TABLE 5C. Graduate Degrees Awarded in Areas of Strategic Emphasis
2007-08 2008-09 2009-10 2010-11 2011-12
Science, Technology, Engineering, and Math 498 587 476 471 502 Health Professions *only disciplines in critical need 284 285 341 448 453 Security and Emergency Services 41 28 42 61 83
Globalization 142 124 189 174 200 Education *only disciplines in critical need 76 113 121 92 98
SUBTOTAL 1,041 1,137 1,169 1,246 1,336 Percent of All Graduate Degrees
44% 45% 44% 42% 39%
Notes: This is a count of graduate degrees for specific Areas of Strategic Emphasis, as determined by the Board of Governors staff with consultation with business and industry groups and input from universities. A student who has multiple majors in the subset of targeted Classification of Instruction Program codes will be counted twice (i.e., double-majors are included). *This data represents select disciplines within these five areas and does not reflect all degrees awarded within the general field (of education or health).

34
Annual Accountability Report 2011-2012
FLORIDA INTERNATIONAL UNIVERSITY
Section 5 – Graduate Education (continued) TABLE 5D. Professional Licensure Exams for Graduate Programs
Law: Florida Bar Exam
2007 2008 2009 2010 2011
Examinees 83 116 136 168 172 Pass Rate 88% 81% 81% 89% 81% State Benchmark 84% 79% 79% 82% 81%
Medicine: US Medical Licensing Exam - Step 1
2008 2009 2010 2011 2012
Examinees . . . 2 36 Pass Rate . . . * 97% National Benchmark 93% 93% 91% 94% 96% Note: To protect the privacy of educational records of university students, data for cohort counts 10 or less are not reported. Physical Therapy: National Physical Therapy Examinations
2005-07 2006-08 2007-09 2008-10 2009-11
Examinees 128 99 89 91 125 Pass Rate 69% 65% 64% 75% 74% National Benchmark 86% 86% 87% 87% 89% Occupational Therapy: National Board for Certification in Occupational Therapy Exam
2005-07 2006-08 2007-09 2008-10 2009-11
Examinees 120 113 103 142 163 Pass Rate 77% 82% 74% 65% 60% National Benchmark 87% 86% 83% 82% 81% Note: We have chosen to compute a three-year average pass rate for first-time examinees on the National Board for Certification in Occupational Therapy (OTR) Examinations and the National Physical Therapy Examinations by exam year, rather than report the annual averages, because of the relatively small cohort sizes compared to other licensed professional programs. The Dental Board and Occupational Therapy exams are national standardized examinations not licensure examinations. Students who wish to practice in Florida must also take a licensure exam. Please note that 2007 was the first year the NDBE was administered after significant revisions to the test.

35
Annual Accountability Report 2011-2012
FLORIDA INTERNATIONAL UNIVERSITY
Section 6 – Research and Economic Development
TABLE 6A. Research and Development
2006-07 2007-08 2008-09 2009-10 2010-11
R&D Expenditures Total ($ 1,000s)
$108,015 $107,025 $101,322 $110,271 $110,006
Federally Funded ($ 1,000s)
$62,366 $60,045 $57,371 $62,580 $65,446
Percent Funded From External Sources 63% 61% 63% 64% 69%
Total R&D Expenditures Per Full-Time, Tenured, Tenure-Earning Faculty Member ($)
$178,243 $163,148 $160,066 $174,204 $173,511
Technology Transfer
Invention Disclosures 13 18 16 24 15
U.S. Patents Issued 0 0 1 1 3 Patents Issued Per 1,000 Full-Time, Tenured and Tenure-Earning Faculty
0 0 1.6 1.5 4.7
Licenses/ Options Executed 0 0 1 1 0
Licensing Income Received ($) $6,166 $9,423 $39,819 $24,942 $12,000
Number of Start-Up Companies 0 0 0 0 0 Note: R&D Expenditures are based on the National Science Foundation’s annual Survey of R&D Expenditures at Universities and Colleges (data include Science & Engineering and non-Science & Engineering awards). Percent Funded from External Sources is defined as funds from federal, private industry and other sources (non-state and non-institutional funds). Total R&D expenditures are divided by fall, full-time tenured/tenure-track faculty as reported to IPEDS (FGCU includes both tenured/tenure-track and non-tenure/track faculty). The fall faculty year used will align with the beginning of the fiscal year, so that (e.g.) 2007 FY R&D expenditures are divided by fall 2006 faculty. Technology Transfer data are based on the Association of University Technology Managers Annual Licensing Survey. Licensing Income Received refers to license issue fees, payments under options, annual minimums, running royalties, termination payments, amount of equity received when cashed-in, and software and biological material end-user license fees of $1,000 or more, but not research funding, patent expense reimbursement, valuation of equity not cashed-in, software and biological material end-user license fees of less than $1,000, or trademark licensing royalties from university insignia. Number of Start-up Companies that were dependent upon the licensing of University technology for initiation.

36
Annual Accountability Report 2011-2012
FLORIDA INTERNATIONAL UNIVERSITY
Section 6 – Research and Economic Development (continued) TABLE 6B. Centers of Excellence
Name of Center: Center of Excellence for Hurricane Damage Mitigation and Product Development Cumulative
(since inception to June 2012)
Fiscal Year
2011-12 Year Created: 2008
Research Effectiveness Only includes data for activities directly associated with the Center. Does not include the non-Center activities for faculty who are associated with the Center.
Number of Competitive Grants Applied For 39 7
Value of Competitive Grants Applied For ($) $13,862,166 $2,074,913
Number of Competitive Grants Received 30 4
Value of Competitive Grants Received ($) $10,392,151 $1,759,908
Total Research Expenditures ($) $8,566,421 $999,341 Number of Publications in Refereed Journals From Center Research
52 28
Number of Invention Disclosures 1 1
Number of Licenses/Options Executed 0 0
Licensing Income Received ($) 0 $0 Collaboration Effectiveness
Only reports on relationships that include financial or in-kind support.
Collaborations with Other Postsecondary Institutions 19 13
Collaborations with Private Industry 42 14
Collaborations with K-12 Education Systems/Schools 0 0 Undergraduate and Graduate Students Supported with Center Funds
47 10
Economic Development Effectiveness
Number of Start-Up companies with a physical presence, or employees, in Florida
0 0
Jobs Created By Start-Up Companies Associated with the Center
5 0
Specialized Industry Training and Education 0 0 Private-sector Resources Used to Support the Center's Operations
0 0
Narrative Comments on next page.

37
Annual Accountability Report 2011-2012
FLORIDA INTERNATIONAL UNIVERSITY
Section 6 – Research and Economic Development (continued) TABLE 6B. Centers of Excellence (continued)
Name of Center Center of Excellence for Hurricane Damage Mitigation and Product Development
Narrative Comments [Most Recent Year]: 2011-12
In addition to regular activities such as publishing papers, attending professional conferences, training undergraduate and graduate students, IHRC faculty and staff members have also been involved in the following research and service activities: 1. Working with the Florida Division of Emergency Management, IHRC has completed 6 projects including (a) Development of hurricane resilient composite structural insulated wall systems for residential buildings, (b) Computational evaluation of wind load on residential roofs with complex shapes, (c) Investigating household perceptions of coastal vulnerability and preferences for risk mitigation, (d) Estimation of surface roughness using airborne LiDAR data, and (e) Education and Outreach Programs to Convey the Benefits of Various Hurricane Loss Mitigation Devices and Techniques. 2. IHRC has updated the Public Hurricane Loss model for the State of Florida and successfully passed the rigorous review of the state committee. 3. IHRC continues to work with the National Hurricane Center and the National Ocean Service of NOAA to convert the Coastal and Estuarine Storm Tide model for operational real-time forecast of storm surges. 4. The “Wall of Wind” (WoW) facility is capable of performing controlled and repeatable testing in flows that adequately and economically replicate hurricane winds accompanied by wind-driven rain. The development of the Wall of Wind has been completed in stages, an incremental strategy that has enabled FIU researchers to gain experience in the development, testing, and operation of the facility, and helped reduce cost. Research collaboration has encompassed various engineering fields including wind, civil, mechanical and structural engineering in addition to architecture. The IHRC has partnered with Miami-Dade County Emergency Management, the National Hurricane Center, NOAA’s Atlantic Oceanographic and Meteorological Laboratory (AOML), the Miami Office of the National Weather Service and the City of Homestead in planning Hurricane Andrew 20th Anniversary Event and Grand Opening of the 12-Fan Wall of Wind. This official South Florida community event to commemorate the 20-year anniversary of Hurricane Andrew’s landfall is scheduled for August 2012. After remembering the past, the event will look ahead with the Grand Opening of the new 12-Fan Wall of Wind facility.

38
Annual Accountability Report 2011-2012
FLORIDA INTERNATIONAL UNIVERSITY
Section 6 – Research and Economic Development (continued) TABLE 6C. State University Research Commercialization Assistance Grants
Project Name by Type of Grant
Year Grant
Awarded
Cumulative
Awards Expenditures
Phase I Grants
None Phase II Grants
Bio Innovations 2010 $30,000 $24,656 Forensic Technologies 2010 $30,000 $10,525 Phase III Grants
None
Total for all SURCAG Grants $60,000 $35,181
Narrative Comments: For each project, provide a brief update on (1) the project’s progress towards completing its key milestones/deliverables; and (2) the project’s return on investment for the university and state.
1. Bio Innovations Progress towards completing its key milestones/deliverables a. Consultancy, relevant staffing and advisory organized and/or contracted b. Business plan strategy narrowed down for both technologies--a determination was made c. regarding the specific types of markets to target d. Marketing materials were developed to assist with presentations and meetings at the 2011 Bio International e. International Convention f. AccuDx (our industry partner on the grant) garnered significant market research g. Market assessment completed, addressing target markets h. Marketed materials regarding Algal Library to several companies. Received feedback from pharmaceutical companies. Feedback informed us about viability regarding algae startups and provided insight into target markets (e.g., which may be most appropriate at this stage). i. For the (Algal Library) PI and scientist were selected to present on technology and plan at an Algae BioMass Summit (slated for September 2012). The conference will provide an opportunity for exposure to potential collaborators (e.g. investors, entrepreneurs, and other partners). j. Initial drafts of business plan completed for Algal Library and Magnetic Nanodelivery Technology completed Return on investment for the Florida International University and the State of Florida Significant accomplishments: a. We marketed and promoted technology developed in the State of Florida at partnering events and to companies. b. Drafts of business plans for both technologies completed.

39
Annual Accountability Report 2011-2012
FLORIDA INTERNATIONAL UNIVERSITY
2. Forensic Technologies Progress towards completing its key milestones/deliverables a. Very detailed market research completed b. Business plan information collected, including regulatory information and information on models for similar types of university spin-outs Advisory Board meeting occurred c. Feedback from Board and potential customers compiled and assisted in reassessing business model and target customers d. Logo designed e. Web name and site secured f. Company name filed with the State g. Incubator space for company identified Return on investment for the Florida International University and the State of Florida Significant accomplishments: a. Forensic market consultant prepared and presented a very comprehensive market analysis b. The proposed spin-out (International Forensic Services) presented at a Florida angel investor event c. Initial business plan writing and business development started d. Company/name filed with the State e. Incubator space for company identified and assigned to proposed company f. Significant real world input/assessment provided valuable insight regarding direction and business model

40
Annual Accountability Report 2011-2012
FLORIDA INTERNATIONAL UNIVERSITY
Section 6 – Research and Economic Development (continued) TABLE 6D. 21st Century World Class Scholars Program
World Class Scholar(s)
Scholar’s Field
Grant State Dollars Only
Report the cumulative activity since each scholar's award.
Amount Awarded
Cumulative Expended
External Research Awards
(Thousand $)
Patent Filed / Issued
Licensing Revenues Generated
($)
Joe Leigh Simpson, M.D. Medical Genetics $1M $0.76M $1,636 0 $ 0
TOTAL $1M $0.76M $1,636 0 $ 0
For the most recent year of reporting, please provide a brief paragraph on the teaching, research, and service activities of each 21st Century World Class Scholar. Dr. Simpson oversaw substantial progress in bringing goals of our $1.6M award to fruition, thus placing us in position for additional extramural funding. Progress was made by Dr. Tempest in validating cytogenetic assays, Dr. McGoron on his whole cell biosensor prototype based on Raman spectroscopy and nanotechnology, and Dr. Li's nanoscale detection of reactive oxidative species based on 8-deoxyguanasine. Currently there is no practical or rapid method to monitor exposure to genotoxic agents of unknown nature. We have made significant progress toward development of two prototype biosensors to detect non‐specific DNA damage: (i) EIST biosensor measuring reactive oxygen species specifically 8‐OHdG; and (ii) SERS biosensor measuring several stress proteins. Success of one or both of the biosensor devices compared to that of standard genotoxic assays will be established using standard statistical methodology, and judged by the ability of the devices to achieve equal or increased sensitivity of the gold‐standard assays. Specifically, do the biosensors produce a measurable response at the same genotoxic concentration as in cytogenetic assays, and do the biosensor devices produce a dose related response as seen in the cytogenetic assays? We will then be able to determine whether one or more biosensor has the ability to detect the presence of toxicants more rapidly and sensitively than conventional cytogenetics assays. In addition, Dr. Simpson continued his collaborative work with Professor Zi-Jiang Chen (Shandong U, Jinan and Shanghai J.T. University). Their GWAS study reported a highly significant regulatory region on 8q22, based on a study of 800 premature ovarian failure (POF) cases and a like number of controls 1. Work in progress involves elucidating the role of CGG repeats in Han Chinese, specifically prevalence which appears lower than in Occidentals. This successful collaboration places the FIU imprint internationally. Furthermore, Dr. Simpson continues to serve advisory roles for several biotech companies using cell free fetal DNA for noninvasive prenatal diagnosis 2. When, coupled with microfluidics and targeted DNA sequencing, this technology promises to be adaptable to multiple needs. These include our work in biosensor detection of toxicants. Dr. Simpson continued to promulgate the FIU "brand" in multiple national and international forums. Venues have included Colombia, Brazil, Switzerland (WHO), UK, Iran, Turkey, and multiple U.S. institutions. His service as President, International Federation of Fertility Societies, will continue through 2016. Finally, Dr. Simpson has been actively involved in teaching medical genetics to medical students at the Herbert Wertheim College of Medicine.


