ORIGINAL RESEARCH EXTRACRANIAL VASCULAR Five-Year Longitudinal Study of Neck Vessel Cross-Sectional Area in Multiple Sclerosis X L. Pelizzari, X D. Jakimovski, X M.M. Lagana `, X N. Bergsland, X J. Hagemeier, X G. Baselli, X B. Weinstock-Guttman, and X R. Zivadinov ABSTRACT BACKGROUND AND PURPOSE: Alterations of neck vessel cross-sectional area in multiple sclerosis have been reported. Our aim was to investigate the evolution of the neck vessel cross-sectional area in patients with MS and healthy controls during 5 years. MATERIALS AND METHODS: Sixty-nine patients with MS (44 relapsing-remitting MS, 25 progressive MS) and 22 age- and sex-matched healthy controls were examined twice, 5 years apart, on a 3T MR imaging scanner using 2D neck MR angiography. Cross-sectional areas were computed for the common carotid/internal carotid arteries, vertebral arteries, and internal jugular veins for all slices between the C3 and C7 cervical levels. Longitudinal cross-sectional area differences at each cervical level and the whole-vessel course were tested within study groups and between patients with MS with and without cardiovascular disease using mixed-model analysis and the related-samples Wilcoxon singed rank test. The Benjamini-Hochberg procedure was performed to correct for multiple comparisons. RESULTS: No significant cross-sectional area differences were seen between patients with MS and healthy controls at baseline or at follow-up. During the follow-up, significant cross-sectional area decrease was found in patients with MS for the common carotid artery– ICAs (C4: P .048; C7: P .005; whole vessel: P .012), for vertebral arteries (C3: P .028; C4: P .028; C7: P .028; whole vessel: P .012), and for the internal jugular veins (C3: P .014; C4: P .008; C5: P .010; C6: P .010; C7: P .008; whole vessel: P .002). Patients with MS without cardiovascular disease had significantly greater change than patients with MS with cardiovascular disease for internal jugular veins at all levels. CONCLUSIONS: For 5 years, patients with MS showed significant cross-sectional area decrease of all major neck vessels, regardless of the disease course and cardiovascular status. ABBREVIATIONS: CCA common carotid artery; CSA cross-sectional area; CVD cardiovascular disease; EDSS Expanded Disability Status Scale; HC healthy controls; HC CVD healthy controls with cardiovascular disease; HC noCVD healthy controls without no cardiovascular disease; IJV internal jugular vein; IQR interquartile range; MS CVD patients with MS with cardiovascular disease; MS noCVD patients with MS without cardiovascular disease; RRMS relapsing- remitting MS; PMS progressive MS; VA vertebral artery WV whole vessel; MS multiple sclerosis; ICA internal carotid artery M ultiple sclerosis is a chronic immune-mediated inflamma- tory disease of the central nervous system characterized by demyelination and neurodegeneration. MS does not seem to be triggered by a single specific factor, and there is mounting evi- dence that genetic, environmental, and cardiovascular risk factors play an important role in the development of the disease. 1 Although still elusive, the involvement of the vascular compo- nent in MS has been investigated across time from different points of view. 2-5 The disruption of the blood-brain barrier and the perivenular topography of MS lesions are recognized as well-es- tablished features of MS pathology. 2 Furthermore, MS lesions Received April 19, 2018; accepted after revision June 6. From the Department of Electronics Information and Bioengineering (L.P., G.B.), Politecnico di Milano, Milan, Italy; Istituto di Ricovero e Cura a Carattere Scienti- fico (L.P., M.M.L.), Fondazione Don Carlo Gnocchi ONLUS, Milan, Italy; and Buffalo Neuroimaging Analysis Center (D.J., N.B., J.H., R.Z.), Department of Neurology, Ja- cobs School of Medicine and Biomedical Sciences; Jacobs Multiple Sclerosis Cen- ter (B.W.-G.), Department of Neurology, School of Medicine and Biomedical Sci- ences; and Center for Biomedical Imaging at Clinical Translational Science Institute (R.Z.), University at Buffalo, State University of New York, Buffalo, New York. Research reported in this publication was funded in part by the National Center for Advancing Translational Sciences of the National Institutes of Health under award Number UL1TR001412 and, in part, by the Annette Funicello Research Fund for Neurological Diseases and internal resources of the Buffalo Neuroimaging Analysis Center. In addition, we received support from the Jacquemin Family Foundation. The content is solely the responsibility of the authors and does not necessarily represent the official views of the National Institutes of Health. Please address correspondence to Robert Zivadinov, MD, PhD, University of Buf- falo, Department of Neurology, Jacobs School of Medicine and Biomedical Sci- ences, University at Buffalo, 100 High St, Buffalo, NY 14203; e-mail: [email protected]Indicates open access to non-subscribers at www.ajnr.org Indicates article with supplemental on-line tables and appendix. Indicates article with supplemental on-line photo. http://dx.doi.org/10.3174/ajnr.A5738 AJNR Am J Neuroradiol 39:1703– 09 Sep 2018 www.ajnr.org 1703
Transcript
ORIGINAL RESEARCHEXTRACRANIAL VASCULAR
Five-Year Longitudinal Study of Neck Vessel Cross-SectionalArea in Multiple Sclerosis
X L. Pelizzari, X D. Jakimovski, X M.M. Lagana, X N. Bergsland, X J. Hagemeier, X G. Baselli, X B. Weinstock-Guttman, andX R. Zivadinov
ABSTRACT
BACKGROUND AND PURPOSE: Alterations of neck vessel cross-sectional area in multiple sclerosis have been reported. Our aim was toinvestigate the evolution of the neck vessel cross-sectional area in patients with MS and healthy controls during 5 years.
MATERIALS AND METHODS: Sixty-nine patients with MS (44 relapsing-remitting MS, 25 progressive MS) and 22 age- and sex-matchedhealthy controls were examined twice, 5 years apart, on a 3T MR imaging scanner using 2D neck MR angiography. Cross-sectional areas werecomputed for the common carotid/internal carotid arteries, vertebral arteries, and internal jugular veins for all slices between the C3 andC7 cervical levels. Longitudinal cross-sectional area differences at each cervical level and the whole-vessel course were tested within studygroups and between patients with MS with and without cardiovascular disease using mixed-model analysis and the related-samplesWilcoxon singed rank test. The Benjamini-Hochberg procedure was performed to correct for multiple comparisons.
RESULTS: No significant cross-sectional area differences were seen between patients with MS and healthy controls at baseline or atfollow-up. During the follow-up, significant cross-sectional area decrease was found in patients with MS for the common carotid artery–ICAs (C4: P � .048; C7: P � .005; whole vessel: P � .012), for vertebral arteries (C3: P � .028; C4: P � .028; C7: P � .028; whole vessel: P �
.012), and for the internal jugular veins (C3: P � .014; C4: P � .008; C5: P � .010; C6: P � .010; C7: P � .008; whole vessel: P � .002). Patientswith MS without cardiovascular disease had significantly greater change than patients with MS with cardiovascular disease for internaljugular veins at all levels.
CONCLUSIONS: For 5 years, patients with MS showed significant cross-sectional area decrease of all major neck vessels, regardless of thedisease course and cardiovascular status.
ABBREVIATIONS: CCA � common carotid artery; CSA � cross-sectional area; CVD � cardiovascular disease; EDSS � Expanded Disability Status Scale; HC �healthy controls; HCCVD � healthy controls with cardiovascular disease; HCnoCVD � healthy controls without no cardiovascular disease; IJV � internal jugular vein;IQR � interquartile range; MSCVD � patients with MS with cardiovascular disease; MSnoCVD � patients with MS without cardiovascular disease; RRMS � relapsing-remitting MS; PMS � progressive MS; VA � vertebral artery WV � whole vessel; MS � multiple sclerosis; ICA � internal carotid artery
Multiple sclerosis is a chronic immune-mediated inflamma-
tory disease of the central nervous system characterized by
demyelination and neurodegeneration. MS does not seem to be
triggered by a single specific factor, and there is mounting evi-
dence that genetic, environmental, and cardiovascular risk factors
play an important role in the development of the disease.1
Although still elusive, the involvement of the vascular compo-
nent in MS has been investigated across time from different points
of view.2-5 The disruption of the blood-brain barrier and the
perivenular topography of MS lesions are recognized as well-es-
tablished features of MS pathology.2 Furthermore, MS lesions
Received April 19, 2018; accepted after revision June 6.
From the Department of Electronics Information and Bioengineering (L.P., G.B.),Politecnico di Milano, Milan, Italy; Istituto di Ricovero e Cura a Carattere Scienti-fico (L.P., M.M.L.), Fondazione Don Carlo Gnocchi ONLUS, Milan, Italy; and BuffaloNeuroimaging Analysis Center (D.J., N.B., J.H., R.Z.), Department of Neurology, Ja-cobs School of Medicine and Biomedical Sciences; Jacobs Multiple Sclerosis Cen-ter (B.W.-G.), Department of Neurology, School of Medicine and Biomedical Sci-ences; and Center for Biomedical Imaging at Clinical Translational Science Institute(R.Z.), University at Buffalo, State University of New York, Buffalo, New York.
Research reported in this publication was funded in part by the National Centerfor Advancing Translational Sciences of the National Institutes of Health underaward Number UL1TR001412 and, in part, by the Annette Funicello Research Fundfor Neurological Diseases and internal resources of the Buffalo NeuroimagingAnalysis Center. In addition, we received support from the Jacquemin FamilyFoundation.
The content is solely the responsibility of the authors and does not necessarilyrepresent the official views of the National Institutes of Health.
Please address correspondence to Robert Zivadinov, MD, PhD, University of Buf-falo, Department of Neurology, Jacobs School of Medicine and Biomedical Sci-ences, University at Buffalo, 100 High St, Buffalo, NY 14203; e-mail:[email protected]
Indicates open access to non-subscribers at www.ajnr.org
Indicates article with supplemental on-line tables and appendix.
Indicates article with supplemental on-line photo.
http://dx.doi.org/10.3174/ajnr.A5738
AJNR Am J Neuroradiol 39:1703– 09 Sep 2018 www.ajnr.org 1703
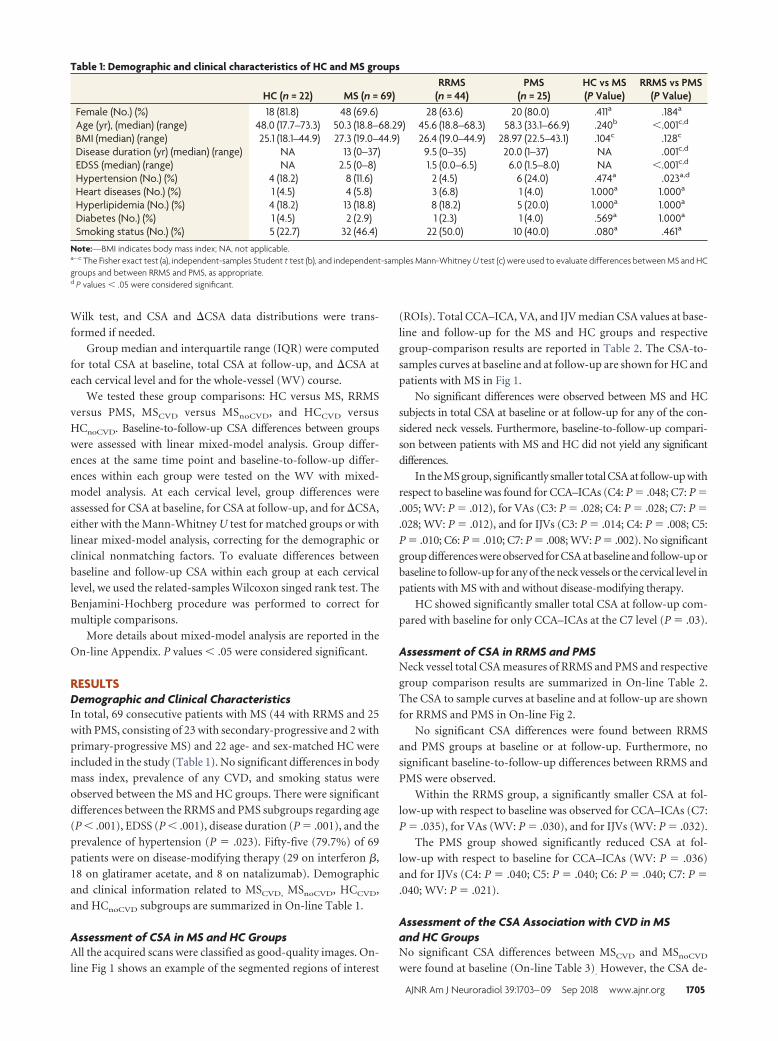
Note:—BMI indicates body mass index; NA, not applicable.a– c The Fisher exact test (a), independent-samples Student t test (b), and independent-samples Mann-Whitney U test (c) were used to evaluate differences between MS and HCgroups and between RRMS and PMS, as appropriate.d P values � .05 were considered significant.
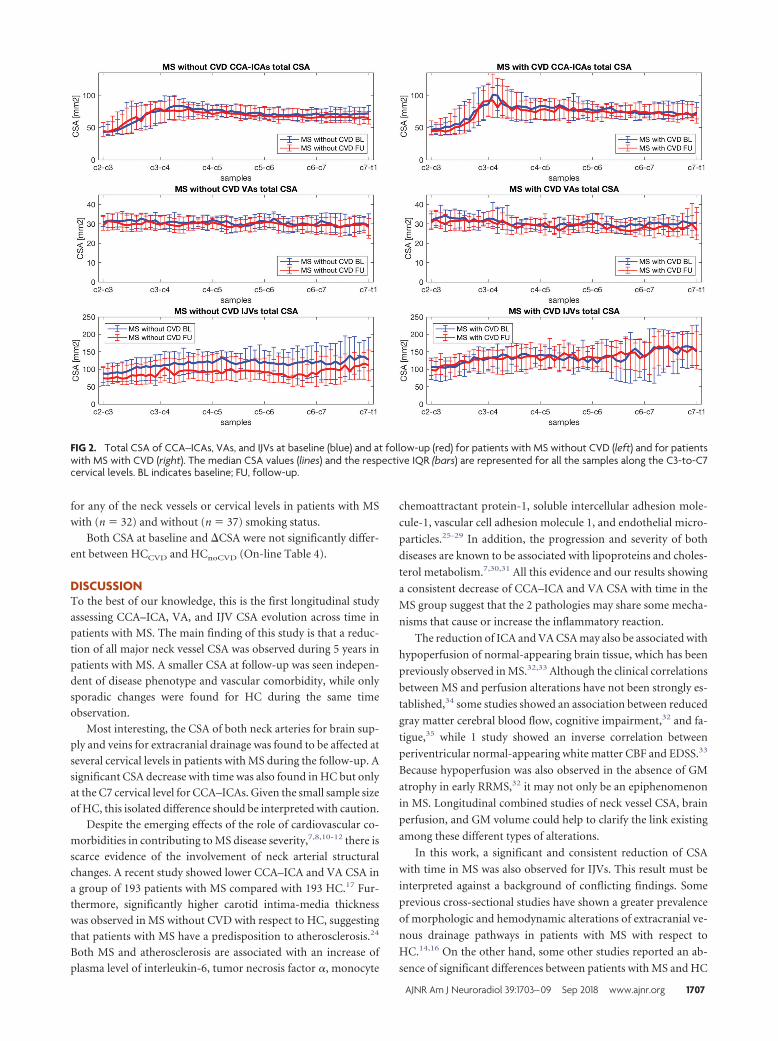
AJNR Am J Neuroradiol 39:1703– 09 Sep 2018 www.ajnr.org 1705
creased with time, and �CSA was significantly larger in MSnoCVD
with respect to MSCVD for IJVs (C3: P � .018; C4: P � .018; C5:
P � .010; C6: P � .015; C7: P � .018; WV: P � .003). The CSA-
to-samples curves at baseline and follow-up are shown for both
subgroups in Fig 2. No significant group differences were ob-
served for CSA at baseline and follow-up or baseline to follow-up
Table 2: Group medians and IQRs of neck vessel total cross-sectional area at baseline, and follow-up in HC (n � 22) and MS (n � 69) groups
Note:—BL indicates baseline; FU, follow-up.a–f Group medians and IQR of neck vessel total CSA at baseline and follow-up are reported for HC and MS at each cervical level and for the WV course. To evaluate CSAdifferences between HC and MS groups at baseline and at follow-up, an independent-samples Mann-Whitney U test (a) was used at each cervical level, while linear mixedmodels were used for the WV (b). To evaluate differences between baseline and follow-up within each group, the Wilcoxon signed-rank test (c) was used at each cervical level,while linear mixed models were used for the WV (d). To perform baseline-to-follow-up CSA comparison between groups, linear mixed models were used at each cervical level(e) and for the WV (f). The Benjamini-Hochberg procedure was performed to correct for multiple comparisons.g An � level of .05 was considered significant.
FIG 1. Total CSA of CCA–ICAs, VAs, and IJVs at baseline (blue) and at follow-up (red) for HC (left) and patients with MS (right). The median CSA values(lines) and the respective IQR (bars) are represented for all the samples along the C3-to-C7 cervical levels. BL indicates baseline; FU, follow-up.
1706 Pelizzari Sep 2018 www.ajnr.org
for any of the neck vessels or cervical levels in patients with MS
with (n � 32) and without (n � 37) smoking status.
Both CSA at baseline and �CSA were not significantly differ-
ent between HCCVD and HCnoCVD (On-line Table 4).
DISCUSSIONTo the best of our knowledge, this is the first longitudinal study
assessing CCA–ICA, VA, and IJV CSA evolution across time in
patients with MS. The main finding of this study is that a reduc-
tion of all major neck vessel CSA was observed during 5 years in
patients with MS. A smaller CSA at follow-up was seen indepen-
dent of disease phenotype and vascular comorbidity, while only
sporadic changes were found for HC during the same time
observation.
Most interesting, the CSA of both neck arteries for brain sup-
ply and veins for extracranial drainage was found to be affected at
several cervical levels in patients with MS during the follow-up. A
significant CSA decrease with time was also found in HC but only
at the C7 cervical level for CCA–ICAs. Given the small sample size
of HC, this isolated difference should be interpreted with caution.
Despite the emerging effects of the role of cardiovascular co-
morbidities in contributing to MS disease severity,7,8,10-12 there is
scarce evidence of the involvement of neck arterial structural
changes. A recent study showed lower CCA–ICA and VA CSA in
a group of 193 patients with MS compared with 193 HC.17 Fur-
cule-1, vascular cell adhesion molecule 1, and endothelial micro-
particles.25-29 In addition, the progression and severity of both
diseases are known to be associated with lipoproteins and choles-
terol metabolism.7,30,31 All this evidence and our results showing
a consistent decrease of CCA–ICA and VA CSA with time in the
MS group suggest that the 2 pathologies may share some mecha-
nisms that cause or increase the inflammatory reaction.
The reduction of ICA and VA CSA may also be associated with
hypoperfusion of normal-appearing brain tissue, which has been
previously observed in MS.32,33 Although the clinical correlations
between MS and perfusion alterations have not been strongly es-
tablished,34 some studies showed an association between reduced
gray matter cerebral blood flow, cognitive impairment,32 and fa-
tigue,35 while 1 study showed an inverse correlation between
periventricular normal-appearing white matter CBF and EDSS.33
Because hypoperfusion was also observed in the absence of GM
atrophy in early RRMS,32 it may not only be an epiphenomenon
in MS. Longitudinal combined studies of neck vessel CSA, brain
perfusion, and GM volume could help to clarify the link existing
among these different types of alterations.
In this work, a significant and consistent reduction of CSA
with time in MS was also observed for IJVs. This result must be
interpreted against a background of conflicting findings. Some
previous cross-sectional studies have shown a greater prevalence
of morphologic and hemodynamic alterations of extracranial ve-
nous drainage pathways in patients with MS with respect to
HC.14,16 On the other hand, some other studies reported an ab-
sence of significant differences between patients with MS and HC
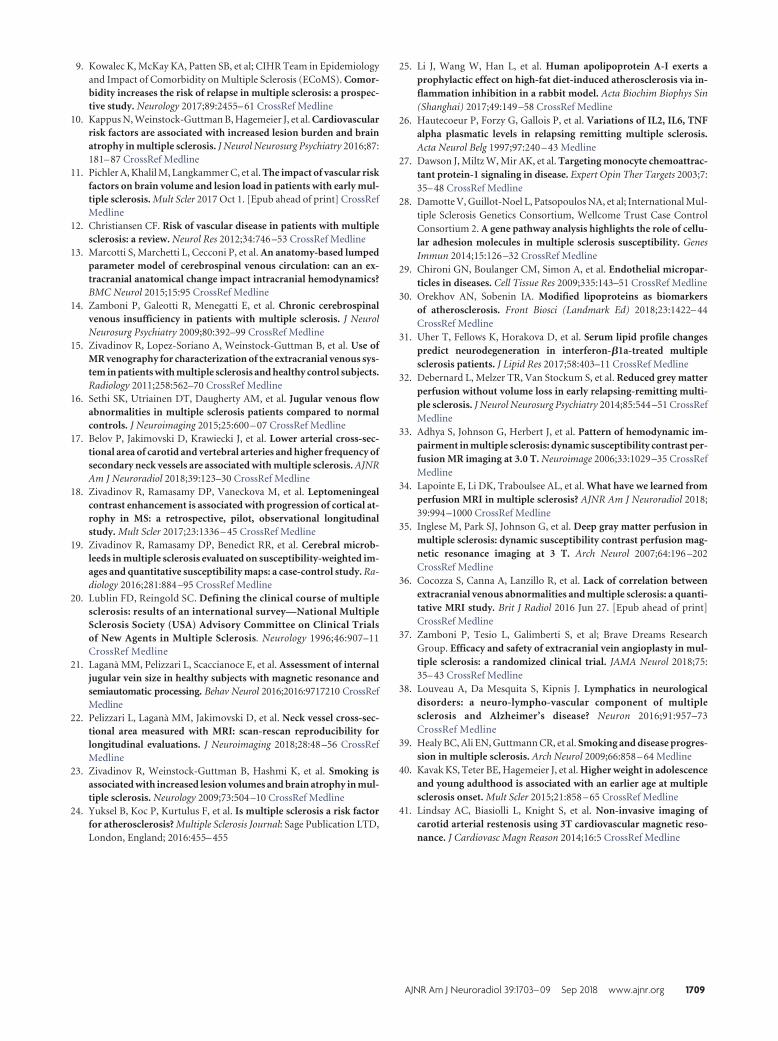
FIG 2. Total CSA of CCA–ICAs, VAs, and IJVs at baseline (blue) and at follow-up (red) for patients with MS without CVD (left) and for patientswith MS with CVD (right). The median CSA values (lines) and the respective IQR (bars) are represented for all the samples along the C3-to-C7cervical levels. BL indicates baseline; FU, follow-up.
AJNR Am J Neuroradiol 39:1703– 09 Sep 2018 www.ajnr.org 1707
regarding IJV CSA and flow rates.15,36 Our results at baseline are
in line with the latter group of findings. However, the IJV CSA
changes that we observed longitudinally in this study in patients
with MS may suggest a potential link between IJV CSA and the
disease course. The clinical relevance of these observations re-
mains elusive. Recently, extracranial venous angioplasty has been
reported to be largely ineffective at impacting the course of MS37;
therefore, caution should be used when drawing final conclu-
sions. The investigation of fluid dynamics of the brain, including
the recently discovered sinus-associated lymphatic vessels and the
glymphatic pathways, may shed more light on the relation be-
tween vascular and immune/inflammatory factors in MS.38 By
interpreting the obtained IJV CSA reduction together with the
CSA decrease of neck arteries with time in MS, one could also
explain a decrease in IJV CSA because of a potential flow reduc-
tion in CCA–ICA and VA pathways.
Cardiovascular risk factors and CVD are well-known to ad-
versely affect the course of MS.1 Specifically, smoking was re-
ported to be associated with increased BBB disruption, higher
lesion volumes, greater brain atrophy,23 and more rapid conver-
sion from RRMS to a PMS disease course.39 Obesity was shown to
be linked with increased MS risk and higher disability.40 Also
diabetes, hypertension, dyslipidemia, and ischemic heart disease
are associated with worse disability and a more severe disease
course,6,7 increased lesion burden, and more advanced brain at-
rophy.10,11 Nevertheless, in the present study, greater change of
IJV CSA at all cervical levels was observed for MSnoCVD compared
with MSCVD. The limited sample size and the group inhomoge-
neity may have prevented us from highlighting CVD as an exac-
erbating factor for neck vessel CSA decrease. However, because
CSA changes were also found in MSnoCVD, neck vessel CSA reduc-
tion with time in MS might not be necessarily driven by CVD
only. Investigating the effect of CVD and other potential MS-
related factors on CCA–ICA, VA, and IJV CSA in a larger cohort
of subjects is warranted to make clearer speculations.
The relatively small sample size, especially of the HC group, is
the main limit of this study, and it must be considered when
interpreting our findings. Indeed, the comparison of neck vessel
CSA between patients with MS and HC at baseline did not lead to
any significant results, while a much larger recent study has re-
ported a significantly lower CCA–ICA and VA CSA in patients
with MS with respect to HC.17 Furthermore, no significant CSA
differences were found between MS and HC subjects at follow-up
as well as in baseline-to-follow-up comparisons, probably due to
the discrepancies in sample size between patients with MS and HC
groups. Nevertheless, the extensive longitudinal CSA change that
we observed in the MS group for all the neck vessels indirectly
corroborates the previous findings of neck vessel CSA alterations
in MS.14,16
Other limitations are that TOF MR imaging signal depends on
flow velocity and that by measuring CSA on TOF MRA axial
slices, vessels are assumed to be perpendicular to the axial plane.
Slow flow and the presence of blood refluxes might produce in-
accurate CSA estimation; however, as opposed to contrast-en-
hanced MRA, TOF MR imaging has the advantage of imaging
neck vessels in a noninvasive way.41 Furthermore, the assumption
of the perpendicularity of the vessels to the axial plane was made
for all vessels within the considered cervical levels; nevertheless, in
future studies, CSA measures could be improved by considering
the angle between the vessel longitudinal axis and the z-axis. De-
spite these limitations, the reliability and repeatability of the ac-
quisition and segmentation methods used in this study were as-
sessed and confirmed previously.22
To the best of our knowledge, this is the first longitudinal
study assessing CCA–ICA, VA, and IJV CSA evolution with time
in MS. The dependence of neck vessel CSA measures on many
factors such as positioning, hydration, body mass index, and res-
piration have probably discouraged longitudinal evaluations so
far. However, recent reports demonstrated the repeatability of
neck vessel semiautomatic segmentation on TOF MRA im-
ages,21,22 making longitudinal studies feasible.
Future studies, involving larger groups of subjects and the ac-
quisition of more data such as intima-media thickness measures,
perfusion MR imaging, and GM volume should be performed to
better understand these preliminary findings.
CONCLUSIONSPatients with MS showed a decrease of CCA–ICA, VA, and IJV
CSA during 5 years, regardless of the disease phenotype. Because
neck vessel CSA evolution with time was found to be altered in MS
even in the absence of CVD, CSA reduction might also be influ-
enced by MS-related factors.
Disclosures: Giuseppe Baselli—UNRELATED: Employment: Politecnico di Milano,Comments: This work is part of my research duties as Full Professor of the Politec-nico di Milano. Bianca Weinstock-Guttman—UNRELATED: Consultancy: BiogenIdec, Teva Pharmaceutical Industries, Novartis, Genentech, Celgene, EMD Serono;Grants/Grants Pending: Biogen, Teva Pharmaceutical Industries, Novartis, Genen-tech*; Payment for Lectures Including Service on Speakers Bureaus: Biogen, TevaPharmaceutical Industries, Genentech. Robert Zivadinov—UNRELATED: Consul-tancy: Sanofi Genzyme, Novartis, Celgene, EMD Serono; Grants/Grants Pending:Biogen, Sanofi Genzyme, Novartis, Celgene, EMD Serono, Protembis*; Payment forLectures Including Service on Speakers Bureaus: Sanofi Genzyme, Novartis, Celgene,EMD Serono. *Money paid to the institution.
REFERENCES1. Spencer JI, Bell JS, DeLuca GC. Vascular pathology in multiple
sclerosis: reframing pathogenesis around the blood-brain barrier.J Neurol Neurosurg Psychiatry 2018;89:42–52 CrossRef Medline
2. Rae-Grant AD, Wong C, Bernatowicz R, et al. Observations on thebrain vasculature in multiple sclerosis: a historical perspective.Mult Scler Relat Disord 2014;3:156 – 62 CrossRef Medline
3. Haider L, Zrzavy T, Hametner S, et al. The topography of demyeli-nation and neurodegeneration in the multiple sclerosis brain. Brain2016;139:807–15 CrossRef Medline
4. Desai RA, Davies AL, Tachrount M, et al. Cause and prevention ofdemyelination in a model multiple sclerosis lesion. Ann Neurol2016;79:591– 604 CrossRef Medline
5. Marshall O, Lu H, Brisset JC, et al. Impaired cerebrovascular reac-tivity in multiple sclerosis. JAMA Neurol 2014;71:1275– 81 CrossRefMedline
6. Marrie RA, Rudick R, Horwitz R, et al. Vascular comorbidity is as-sociated with more rapid disability progression in multiple sclero-sis. Neurology 2010;74:1041– 47 CrossRef Medline
7. Weinstock-Guttman B, Zivadinov R, Mahfooz N, et al. Serum lipidprofiles are associated with disability and MRI outcomes in multi-ple sclerosis. J Neuroinflammation 2011;8:127 CrossRef Medline
8. Weinstock-Guttman B, Zivadinov R, Horakova D, et al. Lipid pro-files are associated with lesion formation over 24 months in inter-feron-� treated patients following the first demyelinating event.J Neurol Neurosurg Psychiatry 2013;84:1186 –91 CrossRef Medline
9. Kowalec K, McKay KA, Patten SB, et al; CIHR Team in Epidemiologyand Impact of Comorbidity on Multiple Sclerosis (ECoMS). Comor-bidity increases the risk of relapse in multiple sclerosis: a prospec-tive study. Neurology 2017;89:2455– 61 CrossRef Medline
10. Kappus N, Weinstock-Guttman B, Hagemeier J, et al. Cardiovascularrisk factors are associated with increased lesion burden and brainatrophy in multiple sclerosis. J Neurol Neurosurg Psychiatry 2016;87:181– 87 CrossRef Medline
11. Pichler A, Khalil M, Langkammer C, et al. The impact of vascular riskfactors on brain volume and lesion load in patients with early mul-tiple sclerosis. Mult Scler 2017 Oct 1. [Epub ahead of print] CrossRefMedline
12. Christiansen CF. Risk of vascular disease in patients with multiplesclerosis: a review. Neurol Res 2012;34:746 –53 CrossRef Medline
13. Marcotti S, Marchetti L, Cecconi P, et al. An anatomy-based lumpedparameter model of cerebrospinal venous circulation: can an ex-tracranial anatomical change impact intracranial hemodynamics?BMC Neurol 2015;15:95 CrossRef Medline
14. Zamboni P, Galeotti R, Menegatti E, et al. Chronic cerebrospinalvenous insufficiency in patients with multiple sclerosis. J NeurolNeurosurg Psychiatry 2009;80:392–99 CrossRef Medline
15. Zivadinov R, Lopez-Soriano A, Weinstock-Guttman B, et al. Use ofMR venography for characterization of the extracranial venous sys-tem in patients with multiple sclerosis and healthy control subjects.Radiology 2011;258:562–70 CrossRef Medline
16. Sethi SK, Utriainen DT, Daugherty AM, et al. Jugular venous flowabnormalities in multiple sclerosis patients compared to normalcontrols. J Neuroimaging 2015;25:600 – 07 CrossRef Medline
17. Belov P, Jakimovski D, Krawiecki J, et al. Lower arterial cross-sec-tional area of carotid and vertebral arteries and higher frequency ofsecondary neck vessels are associated with multiple sclerosis. AJNRAm J Neuroradiol 2018;39:123–30 CrossRef Medline
18. Zivadinov R, Ramasamy DP, Vaneckova M, et al. Leptomeningealcontrast enhancement is associated with progression of cortical at-rophy in MS: a retrospective, pilot, observational longitudinalstudy. Mult Scler 2017;23:1336 – 45 CrossRef Medline
19. Zivadinov R, Ramasamy DP, Benedict RR, et al. Cerebral microb-leeds in multiple sclerosis evaluated on susceptibility-weighted im-ages and quantitative susceptibility maps: a case-control study. Ra-diology 2016;281:884 –95 CrossRef Medline
20. Lublin FD, Reingold SC. Defining the clinical course of multiplesclerosis: results of an international survey—National MultipleSclerosis Society (USA) Advisory Committee on Clinical Trialsof New Agents in Multiple Sclerosis. Neurology 1996;46:907–11CrossRef Medline
21. Lagana MM, Pelizzari L, Scaccianoce E, et al. Assessment of internaljugular vein size in healthy subjects with magnetic resonance andsemiautomatic processing. Behav Neurol 2016;2016:9717210 CrossRefMedline
22. Pelizzari L, Lagana MM, Jakimovski D, et al. Neck vessel cross-sec-tional area measured with MRI: scan-rescan reproducibility forlongitudinal evaluations. J Neuroimaging 2018;28:48 –56 CrossRefMedline
23. Zivadinov R, Weinstock-Guttman B, Hashmi K, et al. Smoking isassociated with increased lesion volumes and brain atrophy in mul-tiple sclerosis. Neurology 2009;73:504 –10 CrossRef Medline
24. Yuksel B, Koc P, Kurtulus F, et al. Is multiple sclerosis a risk factorfor atherosclerosis? Multiple Sclerosis Journal: Sage Publication LTD,London, England; 2016:455– 455
25. Li J, Wang W, Han L, et al. Human apolipoprotein A-I exerts aprophylactic effect on high-fat diet-induced atherosclerosis via in-flammation inhibition in a rabbit model. Acta Biochim Biophys Sin(Shanghai) 2017;49:149 –58 CrossRef Medline
26. Hautecoeur P, Forzy G, Gallois P, et al. Variations of IL2, IL6, TNFalpha plasmatic levels in relapsing remitting multiple sclerosis.Acta Neurol Belg 1997;97:240 – 43 Medline
27. Dawson J, Miltz W, Mir AK, et al. Targeting monocyte chemoattrac-tant protein-1 signaling in disease. Expert Opin Ther Targets 2003;7:35– 48 CrossRef Medline
28. Damotte V, Guillot-Noel L, Patsopoulos NA, et al; International Mul-tiple Sclerosis Genetics Consortium, Wellcome Trust Case ControlConsortium 2. A gene pathway analysis highlights the role of cellu-lar adhesion molecules in multiple sclerosis susceptibility. GenesImmun 2014;15:126 –32 CrossRef Medline
29. Chironi GN, Boulanger CM, Simon A, et al. Endothelial micropar-ticles in diseases. Cell Tissue Res 2009;335:143–51 CrossRef Medline
30. Orekhov AN, Sobenin IA. Modified lipoproteins as biomarkersof atherosclerosis. Front Biosci (Landmark Ed) 2018;23:1422– 44CrossRef Medline
31. Uher T, Fellows K, Horakova D, et al. Serum lipid profile changespredict neurodegeneration in interferon-�1a-treated multiplesclerosis patients. J Lipid Res 2017;58:403–11 CrossRef Medline
32. Debernard L, Melzer TR, Van Stockum S, et al. Reduced grey matterperfusion without volume loss in early relapsing-remitting multi-ple sclerosis. J Neurol Neurosurg Psychiatry 2014;85:544 –51 CrossRefMedline
33. Adhya S, Johnson G, Herbert J, et al. Pattern of hemodynamic im-pairment in multiple sclerosis: dynamic susceptibility contrast per-fusion MR imaging at 3.0 T. Neuroimage 2006;33:1029 –35 CrossRefMedline
34. Lapointe E, Li DK, Traboulsee AL, et al. What have we learned fromperfusion MRI in multiple sclerosis? AJNR Am J Neuroradiol 2018;39:994 –1000 CrossRef Medline
35. Inglese M, Park SJ, Johnson G, et al. Deep gray matter perfusion inmultiple sclerosis: dynamic susceptibility contrast perfusion mag-netic resonance imaging at 3 T. Arch Neurol 2007;64:196 –202CrossRef Medline
36. Cocozza S, Canna A, Lanzillo R, et al. Lack of correlation betweenextracranial venous abnormalities and multiple sclerosis: a quanti-tative MRI study. Brit J Radiol 2016 Jun 27. [Epub ahead of print]CrossRef Medline
37. Zamboni P, Tesio L, Galimberti S, et al; Brave Dreams ResearchGroup. Efficacy and safety of extracranial vein angioplasty in mul-tiple sclerosis: a randomized clinical trial. JAMA Neurol 2018;75:35– 43 CrossRef Medline
38. Louveau A, Da Mesquita S, Kipnis J. Lymphatics in neurologicaldisorders: a neuro-lympho-vascular component of multiplesclerosis and Alzheimer’s disease? Neuron 2016;91:957–73CrossRef Medline
39. Healy BC, Ali EN, Guttmann CR, et al. Smoking and disease progres-sion in multiple sclerosis. Arch Neurol 2009;66:858 – 64 Medline
40. Kavak KS, Teter BE, Hagemeier J, et al. Higher weight in adolescenceand young adulthood is associated with an earlier age at multiplesclerosis onset. Mult Scler 2015;21:858 – 65 CrossRef Medline
41. Lindsay AC, Biasiolli L, Knight S, et al. Non-invasive imaging ofcarotid arterial restenosis using 3T cardiovascular magnetic reso-nance. J Cardiovasc Magn Reason 2014;16:5 CrossRef Medline
AJNR Am J Neuroradiol 39:1703– 09 Sep 2018 www.ajnr.org 1709