Fixed Income Management Quarter Ended June 30, 2017 5 Houston Center 1401 McKinney, Suite 1600 Houston, TX 77010 Tel: (713) 853-2359 Fax: (713) 853-2300 [email protected]www.GarciaHamiltonAssociates.com Awards/rankings may not represent client experiences and are not indicative of future performance. Go to www.garciahamiltonassociates.com/awards/ for additional information on each award. Presented By: Gilbert A. Garcia, CFA Managing Partner Ruby Muñoz Dang Partner
RubyGarciaHamiltonAssociatescomwwwGarciaHamiltonAssociatescom Awardsrankings may not represent client experiences and are not indicative of future performance Go to wwwgarciahamiltonassociatescomawards for additional information on each award
Presented By
Gilbert A Garcia CFAManaging Partner
Ruby Muntildeoz DangPartner
Organization
1
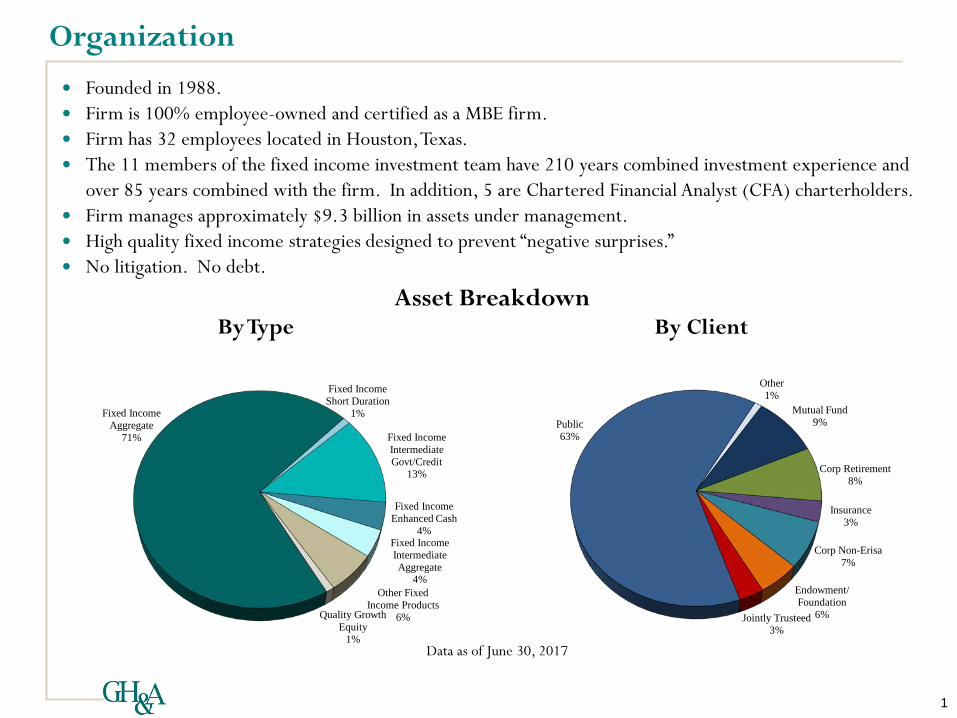
Asset Breakdown
Founded in 1988 Firm is 100 employee-owned and certified as a MBE firm Firm has 32 employees located in Houston Texas The 11 members of the fixed income investment team have 210 years combined investment experience and
over 85 years combined with the firm In addition 5 are Chartered Financial Analyst (CFA) charterholders Firm manages approximately $93 billion in assets under management High quality fixed income strategies designed to prevent ldquonegative surprisesrdquo No litigation No debt
Data as of June 30 2017
Other1
Mutual Fund9
Corp Retirement8
Insurance3
Corp Non-Erisa7
EndowmentFoundation
6Jointly Trusteed3
Public63
By Client
Fixed Income Aggregate
71
Fixed Income Short Duration
1
Fixed Income Intermediate GovtCredit
13
Fixed Income Enhanced Cash
4Fixed Income Intermediate Aggregate
4Other Fixed
Income Products 6Quality Growth
Equity 1
By Type
Partners
2
RUBY MUNtildeOZ DANGPartnerDirector of Marketing and Client ServicesBA University of HoustonYear Hired 1995Industry Experience 23 yrsOwnership 55
JEFFREY D DETWILERCFA AAMSPartnerPortfolio ManagerBS University of South FloridaMS University of HoustonYear Hired 2007Industry Experience 20 yrsOwnership 1
NANCY RODRIGUEZPartnerPortfolio ManagerBS University of HoustonYear Hired 1998Industry Experience 30 yrsOwnership 45
KAREN H TASS CFAPartnerPortfolio ManagerBA Texas AampM UniversityMBA University of HoustonYear Hired 2010Industry Experience 12 yrsCoverage Corporates
JEFFREY D DETWILER CFA AAMSPartnerPortfolio ManagerBS University of South FloridaMS University of HoustonYear Hired 2007Industry Experience 20 yrsCoverage Short Term
BENJAMIN D MONKIEWICZPortfolio ManagerBA Sam Houston State UniversityYear Hired 2010Industry Experience 6 yrsCoverage MBSAgencies
REESE WELLERInvestment AnalystBA Texas Tech University Year Hired 2017Industry Experience 17 yrs
KELLY NILAND CFA CPAInvestment AnalystBBA Texas AampM UniversityYear Hired 2015Industry Experience 33 yrsCoverage Analytics
YVETTE M DUENtildeASInvestment Analyst BBA University of Incarnate Word MBA Our Lady of the Lake University Year Hired 2016Industry Experience 10 yrs
CONNIE FALCON DAVISInvestment AssociateBS University of HoustonYear Hired 2012Industry Experience 4 yrsCoverage Analytics
DON ELSENBROCKPortfolio Manager StrategistBS University of HoustonMA University of HoustonYear Hired 2014Industry Experience 25 yrsCoverage Strategist Short Term
NANCY RODRIGUEZPartnerPortfolio ManagerBS University of HoustonYear Hired 1998Industry Experience 30 yrsCoverage Team Oversight
Public Funds City of Lakeland Employeesrsquo Pension amp RS FL City of Sebring Police FL Maryland Insurance Trust MD E Rhodes and Leona B Carpenter Foundation PA
City of Annapolis Police and Fire MD Lantana FF FL City of St Cloud GE FL The Medical Foundation of North Carolina Inc NC Embry Riddle Aeronautical University FL
Addison Police IL Lantana Police Relief FL City of St Cloud Police FL Micronesia Conservation Trust FM Florida AampM University Foundation FL
Arkansas State Highway Employees AR Lemont Police IL City of St Louis FF MO Oregon Climate Trust OR Fort Hays State University KS
Arkansas Local Police amp Fire AR Marianas Public Land Trust MP St Petersburg Police FL Pacific Indemnity Insurance Company GU Greater Milwaukee Foundation MI
Buffalo Grove Police IL Metropolitan Water Reclamation District IL South Walton Fire Control District FF FL Rock Holdings Inc MI Guam Community College Foundation GU
City of Atlanta GE GA City of Melbourne Police amp FF FL State Universities RS IL Rollins Inc GA Hartford Foundation for Public Giving CT
City of Atlanta Police GA City of Miramar Police FL City of Sunrise Police FL Roman Catholic Archdiocese of Atlanta GA Heartspring Methodist Foundation TX
City of Atlanta Fire GA NC Association of County Commissioners NC City of Tamarac FF FL Russell Hill Rogers Fund for the Arts TX International Retinal Research Foundation Inc AL
Town of Bay Harbor Islands GE FL NC League of Municipalities NC City of Tarpon Springs Police FL Specialty Equipment Market Association CA Louisiana Baptist Foundation LA
City of Bloomington Police IL City of New Port Richey Police FL Teachersrsquo Retirement System IL Stetson University Inc FL Marin Community Foundation CA
City of Boynton Beach GE FL City of North Miami Beach GE FL City of Temple Terrace Police amp FF FL St Ignatius College Prep IL Medical University of South Carolina Foundation SC
City of Cape Coral Municipal Firefighters FL City of North Miami Beach Police amp FF FL Village of Tequesta Public Safety Officers FL Takecare Insurance Risk Management Services GU Midwestern State University Foundation TX
City of Cape Coral Police FL City of North Miami GE FL City of Titusville Police amp FF FL Terrapin Insurance Company CI Rio Grande Cancer Foundation TX
Chicago Public Schools IL City of North Miami Police FL Utrik Atoll Marshall Islands (MH) The Walters Art Gallery MD Sarah Campbell Blaffer Foundation TX
Chicago Transit Authority IL City of North Port Police FL City of Venice FF FL University Athletic Association Inc GA Shelby County Community Health Foundation AL
College of Micronesia Land Grant FM Northern Marianas College MP City of Venice Police FL United Regional Health Care System TX Silicon Valley Community Foundation CA
City of Coral Springs FF FL City of Oakland Park Police amp FF FL City of Vero Beach Police FL Southern Baptist Foundation TN
City of Coral Springs Police FL City of Ocoee Police amp FF FL City of West Melbourne Police FL Corporate ERISA Tallahassee Memorial HealthCare Foundation FL
City of Corpus Christi FF TX Oklahoma FF OK City of West Palm Beach Police FL AGL Resources GA Trinity Episcopal Church LA
Dallas Area Rapid Transit TX Town of Orange Park Police FL City of West Palm Beach GE FL Baptist Health Retirement Plan AR United Methodist Foundation NC
City of DeLand Police FL City of Ormond Beach Police GE amp FF FL City of West Palm Beach FF FL DW McMillan Hospital Escambia County University of Guam Endowment GU
Town of Davie Police FL City of Palm Beach Gardens FF FL City of Wilton Manors Police amp GE FL Healthcare AL Whitersquos Residential amp Family Services IN
Town of Davie FF FL Palm Beach County FF FL City of Winston-Salem NC Flowers Foods Inc GA Wichita Falls Area Community Foundation TX
City of Deerfield Beach Police FL Village of Palm Springs GE FL City of Winter Garden GE FL Integris Health Inc OK
Dukes County MA Village of Palm Springs Police FL City of Winter Garden Police amp FF FL International-Matex Tank Terminals LA Taft ndash Hartley amp UnionEl Paso County Retirement TX City of Pembroke Pines OPEB Trust FL City of Winter Haven Police FL Millers Group TX Bricklayers Gulf Coast TX Employees of HNS Management CO Inc CT City of Pensacola FF FL Yap State Trust Fund FM Nissan Motor Co Ltd TN Bricklayers of Indiana IN
Employees Retirement System of City of Pensacola GE FL Yorktown Independent School District TX Operators Reinsurance Company KY District 1199J New Jersey Healthcare Employers NJ
Baltimore County MD City of Pinellas Park GE FL Roman Catholic Archdiocese of Atlanta GA IBEW Local Union 129 OH
Employeersquos Retirement Fund of the City of Dallas TX City of Pinellas Park Police FL Corporate Non-ERISA RPC Inc GA IBEW Local Union 351 NJ
Englewood FF FL City of Philadelphia GE PA American Baptist Home Mission Society PA STP Nuclear Operation Company TX MARTAATU Local 732 GA
City of Evanston Police IL Philadelphia Gas Works PA American Speech-Language-Hearing Association MD Sulzer Pumps (US) Inc TX Plumbers Local 68 TX
Fairfax County Uniformed Retirement System VA City of Plantation Police FL American Quarter Horse Association TX University Athletic Association Inc Employees GA Sacramento Area Electrical Workers CA
FSM Social Security Administration FM City of Pontiac Police amp FF MI Archdiocese of Portland OR Woodlands Family Practice TX San Mateo HERE CA
City of Ft Lauderdale GE FL Prince Georgersquos County FF MD Attorneyrsquos Liability Assurance Society IL Southern California Sheet Metal Workers CA
City of Ft Lauderdale FL Prince Georgersquos County Police MD Baptist Health Assets AR EndowmentsFoundations Teamsters Union Local NO 35 NJ
City of Ft Walton Beach GE FL Prince William County Police VA Bethesda Inc OH Arkansas State University Foundation AR WMATA Local 922 Retirement Plan DC
City of Ft Walton Beach Police FL City of Punta Gorda GE FL Brazosport Regional Health System TX Arkansas Tech University Foundation AR
City of Ft Walton Beach Firefighters FL City of Punta Gorda Police FL Center for Hearing and Speech Foundation TX Baptist Health Foundation of San Antonio TX OtherGovernment of Guam GU Republic of Palau Civil Service Century Insurance Company Ltd GU Board of Higher Education and Ministry Monteagle Quality Growth Fund
City of Hialeah FF FL Republic of Palau COFA Trust Fund CPS Energy TX The United Methodist Church TN Progress Investment Management CA
City of Hollywood FF FL City of Riviera Beach Police FL City Public Service Decommissioning Energy Trust TX The Boyd and Joan Kelley Charitable Foundation TX
City of Hollywood Police FL Road Commission for Oakland County City Public Service Decommissioning TCC Trust TX Briarwood-Brookwood Inc TX
Illinois State Board of Investments IL Retiree Health Care Trust MI Crime Stoppers of Houston TX Caribbean Biodiversity Fund UK
Illinois Student Assistance Commission IL City of Roanoke VA District of Columbia Bar DC Catholic Community Foundation of Minnesota MN
Jackson County GE MI City of Rockledge FF FL FSM Development Bank FM Childrens Home Foundation TX
City of Jacksonville Beach Employee RS FL City of Rockledge GE FL John P McGovern Museum of Health amp Childrenrsquos Home Society of Florida FLCity of Lake Worth FF FL City of Sanford FF FL Medical Science TX Coast Guard Foundation CT
City of Sanford Police FL KEW Management Investor NY Dogwood Foundation TX
4
Representative Client List
Clients who have retained GHampA for 10 years or more are noted in green This representative client list is provided for informational purposes only and should not be construed as an endorsement of ourservices These clients were chosen for name recognition and may be invested in products other than those included in the presentation
Investment Goal
Investment Goal
Our goal is to outperform the benchmark net of fees over a full market cycle using a high quality strategy with less risk lower volatility and low turnover By setting realistic expectations we avoid taking unnecessary risks
Achieving our goal is centered around several core principles
Preserve Principal
Maintain Liquidity
Provide High Current Income
Key Tools
Sector Rotation
Controlled Interest Rate Anticipation
Yield Curve Positioning
5
Investment Style
High QualityPortfolio Dominated by US Treasuries Agency Debentures and Agency15-Year MBS
Corporate Securities Rated A or BetterSpread Product Exclusively in the Short to Intermediate Maturities to Reduce Volatility
No Big SurprisesNo Foreign BondsYankees
No BBB Rated SecuritiesNo Derivatives
No Leverage Dollar Rolls No Pricing Overrides
Maintain a Manageable Number of Securities No Soft Dollars
Additional information is in the performance disclosure at the end of this presentation
Comparative Annualized Rates of Return ndash Gross of FeesFor periods ending June 30 2017
Inception December 31 1991 Periods longer than 12 months are annualized
Preliminary
8Awardsrankings may not represent client experiences and are not indicative of future performance Go to wwwgarciahamiltonassociatescomawards for additional information on each award
Fixed Income Aggregate Portfolio Characteristics
PortfolioBloomberg Barclays Aggregate
June 30 2017
9
Treasuries20
Corporates28
Agencies36
Mortgages16
Cashlt1
Average YTM Average Coupon Average Duration
Portfolio 18 25 47
Bloomberg Barclays Aggregate 26 31 59
00
10
20
30
40
50
60
70
Treasuries37
Corporates26
Agencies7
Mortgages28
Asset-Backed
2
The characteristics shown are those of an actual portfolio that is representative of this strategy at a particular point in time Individual portfolio characteristics may vary depending on the date shown as well as client-imposed restrictions cash flows etc This information is supplemental to the Fixed Income Aggregate Composite Disclosure Statement in the Appendix
Fixed Income Intermediate GovtCredit Composite Returns
Inception June 30 1988 Periods longer than 12 months are annualized
Preliminary
10Awardsrankings may not represent client experiences and are not indicative of future performance Go to wwwgarciahamiltonassociatescomawards for additional information on each award
Comparative Annualized Rates of Return ndash Gross of FeesFor periods ending June 30 2017
Additional information is in the performance disclosure at the end of this presentation
Average YTM Average Coupon Average Duration
Portfolio 17 23 32
Bloomberg Barclays Int GovtCredit 21 24 40
00
05
10
15
20
25
30
35
40
45
Fixed Income Intermediate GovtCredit Portfolio Characteristics
Treasuries57Corporates
32
Agencies11 Treasuries
28
Corporates17
Agencies39
Mortgages16
Cashlt1
Bloomberg Barclays Int GovtCredit Portfolio
11
June 30 2017
The characteristics shown are those of an actual portfolio that is representative of this strategy at a particular point in time Individual portfolio characteristics may vary depending on the date shown as well as client-imposed restrictions cash flows etc This information is supplemental to the Fixed Income Intermediate Composite Disclosure Statement in the Appendix
Fixed Income Short Duration Oppt Composite Returns
Inception March 31 2009 Periods longer than 12 months are annualized
Preliminary
12Awardsrankings may not represent client experiences and are not indicative of future performance Go to wwwgarciahamiltonassociatescomawards for additional information on each award
Comparative Annualized Rates of Return ndash Gross of FeesFor periods ending June 30 2017
Additional information is in the performance disclosure at the end of this presentation
Fixed Income Short Duration Oppt Portfolio Characteristics
Treasuries92
Agencies8 Treasuries
35
Corporates11
Agencies47
Mortgages4
Cash3
Bloomberg Barclays 1-3 Year Govt
Portfolio
13
Average YTM Average Coupon Average Duration
Portfolio 13 26 12
Bloomberg Barclays 1-3 Year Govt 14 16 19
00
05
10
15
20
25
30
June 30 2017
The characteristics shown are those of an actual portfolio that is representative of this strategy at a particular point in time Individual portfolio characteristics may vary depending on the date shown as well as client-imposed restrictions cash flows etc This information is supplemental to the Fixed Income Short Duration Opportunistic Composite Disclosure Statement in the Appendix
14
QTD YTD 1 Year 2 Years 3 Years 5 Years 7 Years 10 Years Inception to Date
Portfolios
Assets in Millions
Short Duration GovernmentInception December 2003
047 100 080 161 151 126 155 277 296 1 57
Bloomberg Barclays 1-3 Year Govt 020 048 -007 061 071 065 078 201 216 NA NA
Intermediate AggregateInception December 2007
088 169 062 297 280 343 408 NA 522 19 277
Bloomberg Barclays IntermediateAggregate
092 161 -016 207 201 187 265 NA 364 NA NA
Government Credit Inception December 2004
155 261 -052 368 331 397 493 627 565 4 140
Bloomberg Barclays GovtCredit 169 266 -041 308 261 229 339 457 422 NA NA
Short Duration GovernmentCreditInception September 2013 051 113 137 207 185 NA NA NA 200 1 167
Bloomberg Barclays 1-3 Year GovtCredit 031 072 035 096 095 NA NA NA 096 NA NA
Unconstrained BondInception March 2009 048 103 130 242 205 318 432 NA 576 2 6
Bloomberg Barclays US Treasury Bellwether 3-Month
021 031 050 036 025 019 017 NA 017 NA NA
Comparative Annualized Rates of Return ndash Gross of Fees For periods ending June 30 2017
Preliminary
Periods longer than 12 months are annualized
Fixed Income Composite Performance Summary
Additional information is in the performance disclosure at the end of this presentation
15
Diversity
Our firm directly supports numerous minority organizations in the community
bullOur Managing Partner Gilbert Garcia served as Chairman of the Board for six yearsbullOur Partner and Director of Marketing and Client Services Ruby Muntildeoz Dang served as Trustee for the METRO Texas Non-Union Pension
Plan
Metropolitan Transit Authority of Harris County
bullNational Association of Securities Professionals is a non-profit association of professionals that brings together minorities and women in the fields of asset management public finance investment banking and other finance professions
bullOur Partner Stephanie Roberts is highly involved with the organization and recently started the Texas chapter
NASP
bullSponsors for Educational Opportunity is a non-profit organization that mentors young women and minority individuals in the development of careers in investment banking corporate law and other leading global companies
bullMr Garcia is the longest serving board member (since 1988) and conducts interviews for candidates in our offices for placement within investment companies in New York
bullMr Garcia was awarded the SEO Alumni Leadership Award at the 2015 Awards Dinner in New York City Other honorees included Michael R Bloomberg three-term Mayor of New York City and Founder of Bloomberg LP amp Bloomberg Philanthropies and David M Rubenstein Co-Founder amp Co-CEO of The Carlyle Group
SEO
bullThe League of United Latin American Citizens is a non-profit organization created to advance the economic condition educational attainment political influence housing health and civil rights of the Hispanic population of the United States
LULAC
Diversity is a central theme throughout the entire firm bullCertified as a MBE in several states bullAlmost 91 of the firm owned by minority and female partnersbull59 owned by minority partners and 55 owned by Hispanic partnersbull86 of employees are ethnic minorities and womenbullExecuted over 60 of brokerage volume with MBEMWBEveteran firms over the past several yearsbullWe also work with many minority and women-owned vendors in the areas ofbullOffice Supplies Temporary Staffing Services Travel Accounting Auditors
bullThe firm has a summer internship program for minority undergraduate and high school students bullMr Garcia was the 2012 Houston Area Urban League Gala Honorary Chair amp a Co-Chair of the 103rd NAACP National Convention bullMr Garcia served as a trustee on the Houston Municipal Employees Pension System Board of Trustees
GHampA Giving Back
We support several community education veteran and other programs throughout the country Over the last three years we have donated over $57500 to these programs as well as many more not listed below
16
$575000Donated
Over
Why Hire Garcia Hamilton amp Associates
100 Employee Owned
High Quality Focus
No Big Surprises
Flexibility
Proven Investment Process Over Time
Risk Controls
Strong Focus on Client Service
17
Performance DisclosureFIXED INCOME ndash AGGREGATE COMPOSITE (Disclosure Presentation as of December 31 2016) Garcia Hamilton amp Associates LP
Historical information not required prior to 2011 NM = Not statistically meaningful due to an insufficient number of portfolios in the composite for the entire year
The GHampA Fixed Income-Aggregate Composite is comprised only of fully discretionary fee paying institutional portfolios including those portfolios no longer with the firm The Fixed Income-Aggregate investment philosophy utilizes high-quality US investment grade fixed income securities To help control risk the portfolios purchase spread product (non-Treasuries) with less than 10-year maturities 15-year Agency Guaranteed Mortgage-Backed securities and Corporate Bonds rated a minimum of single ldquoArdquo The portfolios do not contain derivatives and do not employ leverage The duration exposure is generally managed within a +- 10 band around the Barclays Capital Aggregate Index
The composite benchmark is the Barclays Capital Aggregate Index The benchmark is used for comparative purposes only and generally reflects the risk or investment style of the product For the period of January 1 1992 through June 30 1996 the minimum portfolio size for inclusion in the composite was $10 million Effective July 1 1996 the minimum for inclusion in the composite was increased to $20 million The composite creation date is October 1 1999
Garcia Hamilton amp Associates LP (GHampA) claims compliance with the Global Investment Performance Standards (GIPSreg) and has prepared and presented this report in compliance with the GIPS standards GHampA has been independently verified for the periods January 1 1993 through December 31 2016 by Ashland Partners amp Company LLP The verification reports are available upon request Verification assesses whether (1) the firm has complied with all the composite construction requirements of the GIPS standards on a firm-wide basis and (2) the firmrsquos policies and procedures are designed to calculate and present performance in compliance with the GIPS standards Verification does not ensure the accuracy of any specific composite presentation
GHampA is defined as an independent investment management firm registered under the Investment Advisers Act of 1940 and prior to June 30 2010 was known as Davis Hamilton Jackson amp Associates GHampA has chosen not to claim compliance prior January 1 1993 A complete list and description of firm composites is available upon request Past performance is no guarantee of future results
The US dollar is the currency used to express performance Returns presented above are gross and net of management fees and include the reinvestment of all income Net of fee results are calculated for the period of December 31 1991 through December 31 1994 by deducting the highest fee of 0375 from the monthly gross composite returns Since January 1 1995 the net of fees performance results are calculated based on actual fees The management fee schedule for this composite is as follows 30 of the first $10 million and 25 of the balance Actual investment advisory fees incurred by clients may vary
The following disclosures are applicable to gross performance returns presented in one-on-one presentations Gross performance results are presented before management fees The deduction of such fees or other expenses will reduce a clientrsquos return The net effect of the deduction of fees on annualized performance including the compounded effect over time is determined by the relative size of the fee and the accountrsquos investment performance For example a $10000000 account with an assumed annualized rate of return of 10 over a 10-year period would grow to $2685063838 before fees and to $2490875121 after standard fees of 075 paid quarterly in advance
Additional information regarding policies for valuing portfolios calculating performance and preparing compliant presentations are available upon request Composite dispersion since January 1 1993 is calculated using an asset value-weighted standard deviation of annual gross returns of those portfolios included in the composite the entire year Standard deviation is presented as a 3-year annualized standard deviation measure of risk using monthly gross returns as of each annual period end
FIXED INCOME ndash AGGREGATE COMPOSITE ( Disclosure Presentation as of December 31 2016) Garcia Hamilton amp Associates LP
Historical information not required prior to 2011NM = Not statistically meaningful due to an insufficient number of portfolios in the composite for the entire year
The GHampA Fixed Income-Aggregate Composite is comprised only of fully discretionary fee paying institutional portfolios including those portfolios no longer with the firm The Fixed Income-Aggregate investment philosophy utilizes high-quality US investment grade fixed income securities To help control risk the portfolios purchase spread product (non-Treasuries) with less than 10-year maturities 15-year Agency Guaranteed Mortgage-Backed securities and Corporate Bonds rated a minimum of single ldquoArdquo The portfolios do not contain derivatives and do not employ leverage The duration exposure is generally managed within a +- 10 band around the Barclays Capital Aggregate Index
The composite benchmark is the Barclays Capital Aggregate Index The benchmark is used for comparative purposes only and generally reflects the risk or investment style of the product For the period of January 1 1992 through June 30 1996 the minimum portfolio size for inclusion in the composite was $10 million Effective July 1 1996 the minimum for inclusion in the composite was increased to $20 million The composite creation date is October 1 1999
Garcia Hamilton amp Associates LP (GHampA) claims compliance with the Global Investment Performance Standards (GIPSreg) and has prepared and presented this report in compliance with the GIPS standards GHampA has been independently verified for the periods January 1 1993 through December 31 2016 by Ashland Partners amp Company LLP The verification reports are available upon request Verification assesses whether (1) the firm has complied with all the composite construction requirements of the GIPS standards on a firm-wide basis and (2) the firmrsquos policies and procedures are designed to calculate and present performance in compliance with the GIPS standards Verification does not ensure the accuracy of any specific composite presentation
GHampA is defined as an independent investment management firm registered under the Investment Advisers Act of 1940 and prior to June 30 2010 was known as Davis Hamilton Jackson amp Associates GHampA has chosen not to claim compliance prior January 1 1993 A complete list and description of firm composites is available upon request Past performance is no guarantee of future results
The US dollar is the currency used to express performance Returns presented above are gross and net of management fees and include the reinvestment of all income Net of fee results are calculated for the period of December 31 1991 through December 31 1994 by deducting the highest fee of 0375 from the monthly gross composite returns Since January 1 1995 the net of fees performance results are calculated based on actual fees The management fee schedule for this composite is as follows 30 of the first $10 million and 25 of the balance Actual investment advisory fees incurred by clients may vary
The following disclosures are applicable to gross performance returns presented in one-on-one presentations Gross performance results are presented before management fees The deduction of such fees or other expenses will reduce a clientrsquos return The net effect of the deduction of fees on annualized performance including the compounded effect over time is determined by the relative size of the fee and the accountrsquos investment performance For example a $10000000 account with an assumed annualized rate of return of 10 over a 10-year period would grow to $2685063838 before fees and to $2490875121 after standard fees of 075 paid quarterly in advance
Additional information regarding policies for valuing portfolios calculating performance and preparing compliant presentations are available upon request Composite dispersion since January 1 1993 is calculated using an asset value-weighted standard deviation of annual gross returns of those portfolios included in the composite the entire year Standard deviation is presented as a 3-year annualized standard deviation measure of risk using monthly gross returns as of each annual period end
Performance DisclosureFIXED INCOME ndash INTERMEDIATE GOVERNMENT CREDIT COMPOSITE (Disclosure Presentation as of December 31 2016) Garcia Hamilton amp Associates LP
Inception (7188) through 123188 Historical information not required prior to 2011 NM = Not statistically meaningful due to an insufficient number of portfolios in the composite for the entire year
The GHampA Fixed Income-Intermediate Composite is comprised only of fully discretionary fee paying institutional portfolios including those portfolios no longer with the firm The Fixed Income-Intermediate investment philosophy utilizes high-quality US investment grade fixed income securities To help control risk the portfolios purchase spread product (non-Treasuries) with less than 10-year maturities 15-year Agency Guaranteed Mortgage-Backed securities and Corporate Bonds rated a minimum of single ldquoArdquo The portfolios do not contain derivatives and do not employ leverage The duration exposure is generally managed within a +- 10 band around the Barclays Capital Intermediate GovernmentCredit Index
The composite benchmark is the Barclays Capital Intermediate GovernmentCredit Index The benchmark is used for comparative purposes only and generally reflects the risk or investment style of the product For the period of July 1 1988 through June 30 1996 the minimum portfolio size for inclusion in the composite was $10 million Effective July 1 1996 the minimum for inclusion in the composite was increased to $20 million The composite creation date is July 1 1988
Garcia Hamilton amp Associates LP (GHampA) claims compliance with the Global Investment Performance Standards (GIPSreg) and has prepared and presented this report in compliance with the GIPS standards GHampA has been independently verified for the periods January 1 1993 through December 31 2016 by Ashland Partners amp Company LLP The verification reports are available upon request Verification assesses whether (1) the firm has complied with all the composite construction requirements of the GIPS standards on a firm-wide basis and (2) the firmrsquos policies and procedures are designed to calculate and present performance in compliance with the GIPS standards Verification does not ensure the accuracy of any specific composite presentation
GHampA is defined as an independent investment management firm registered under the Investment Advisers Act of 1940 and prior to June 30 2010 was known as Davis Hamilton Jackson amp Associates GHampA has chosen not to claim compliance prior January 1 1993 A complete list and description of firm composites is available upon request Past performance is no guarantee of future results
The US dollar is the currency used to express performance Returns presented above are gross and net of management fees and include the reinvestment of all income For the period of July 1 1988 through December 31 2005 net of fees results are calculated by deducting the highest fee of 012 on a quarterly basis from the monthly gross composite returns and for the period of December 31 2005 through December 31 2016 by deducting the highest fee of 007 on a quarterly basis from the monthly gross composite returns Since January 1 2010 the net of fees performance results are calculated based on actual fees The management fee schedule for this composite is as follows 30 of the first $10 million and 25 of the balance Actual investment advisory fees incurred by clients may vary
The following disclosures are applicable to gross performance returns presented in one-on-one presentations Gross performance results are presented before management fees The deduction of such fees or other expenses will reduce a clientrsquos return The net effect of the deduction of fees on annualized performance including the compounded effect over time is determined by the relative size of the fee and the accountrsquos investment performance For example a $10000000 account with an assumed annualized rate of return of 10 over a 10-year period would grow to $2685063838 before fees and to $2490875121 after standard fees of 075 paid quarterly in advance
Additional information regarding policies for valuing portfolios calculating performance and preparing compliance presentations are available upon request Composite dispersion for the period of July 1 1988 through December 31 1992 was an equal-weighted standard deviation Composite dispersion since January 1 1993 is calculated using an asset value-weighted standard deviation of annual gross returns of those portfolios included in the composite the entire year Standard deviation is presented as a 3-year annualized standard deviation measure of risk using monthly gross returns as of each annual period end
FIXED INCOME ndash INTERMEDIATE GOVERNMENT CREDIT COMPOSITE ( Disclosure Presentation as of December 31 2016) Garcia Hamilton amp Associates LP
Inception (7188) through 123188 Historical information not required prior to 2011 NM = Not statistically meaningful due to an insufficient number of portfolios in the composite for the entire year
The GHampA Fixed Income-Intermediate Composite is comprised only of fully discretionary fee paying institutional portfolios including those portfolios no longer with the firm The Fixed Income-Intermediate investment philosophy utilizes high-quality US investment grade fixed income securities To help control risk the portfolios purchase spread product (non-Treasuries) with less than 10-year maturities 15-year Agency Guaranteed Mortgage-Backed securities and Corporate Bonds rated a minimum of single ldquoArdquo The portfolios do not contain derivatives and do not employ leverage The duration exposure is generally managed within a +- 10 band around the Barclays Capital Intermediate GovernmentCredit Index
The composite benchmark is the Barclays Capital Intermediate GovernmentCredit Index The benchmark is used for comparative purposes only and generally reflects the risk or investment style of the product For the period of July 1 1988 through June 30 1996 the minimum portfolio size for inclusion in the composite was $10 million Effective July 1 1996 the minimum for inclusion in the composite was increased to $20 million The composite creation date is July 1 1988
Garcia Hamilton amp Associates LP (GHampA) claims compliance with the Global Investment Performance Standards (GIPSreg) and has prepared and presented this report in compliance with the GIPS
standards GHampA has been independently verified for the periods January 1 1993 through December 31 2016 by Ashland Partners amp Company LLP The verification reports are available upon request Verification assesses whether (1) the firm has complied with all the composite construction requirements of the GIPS standards on a firm-wide basis and (2) the firmrsquos policies and procedures are designed to calculate and present performance in compliance with the GIPS standards Verification does not ensure the accuracy of any specific composite presentation
GHampA is defined as an independent investment management firm registered under the Investment Advisers Act of 1940 and prior to June 30 2010 was known as Davis Hamilton Jackson amp Associates GHampA has chosen not to claim compliance prior January 1 1993 A complete list and description of firm composites is available upon request Past performance is no guarantee of future results
The US dollar is the currency used to express performance Returns presented above are gross and net of management fees and include the reinvestment of all income For the period of July 1 1988 through December 31 2005 net of fees results are calculated by deducting the highest fee of 012 on a quarterly basis from the monthly gross composite returns and for the period of December 31 2005 through December 31 2016 by deducting the highest fee of 007 on a quarterly basis from the monthly gross composite returns Since January 1 2010 the net of fees performance results are calculated based on actual fees The management fee schedule for this composite is as follows 30 of the first $10 million and 25 of the balance Actual investment advisory fees incurred by clients may vary
The following disclosures are applicable to gross performance returns presented in one-on-one presentations Gross performance results are presented before management fees The deduction of such fees or other expenses will reduce a clientrsquos return The net effect of the deduction of fees on annualized performance including the compounded effect over time is determined by the relative size of the fee and the accountrsquos investment performance For example a $10000000 account with an assumed annualized rate of return of 10 over a 10-year period would grow to $2685063838 before fees and to $2490875121 after standard fees of 075 paid quarterly in advance
Additional information regarding policies for valuing portfolios calculating performance and preparing compliance presentations are available upon request Composite dispersion for the period of July 1 1988 through December 31 1992 was an equal-weighted standard deviation Composite dispersion since January 1 1993 is calculated using an asset value-weighted standard deviation of annual gross returns of those portfolios included in the composite the entire year Standard deviation is presented as a 3-year annualized standard deviation measure of risk using monthly gross returns as of each annual period end
Performance DisclosureFIXED INCOME ndash SHORT DURATION OPPORTUNISTIC COMPOSITE (Disclosure Presentation as of December 31 2016) Garcia Hamilton amp Associates LP
Inception (4109) through 123109 Historical information not required prior to 2011 NM = Not statistically meaningful due to an insufficient number of portfolios in the composite for the entire year
The GHampA Fixed Income-Short Duration Opportunistic Composite is comprised only of fully discretionary fee paying institutional portfolios including those portfolios no longer with the firm The Fixed Income-Short Duration Opportunistic investment product utilizes high-quality securities managed with an overall duration exposure roughly equal to the duration of the Barclays Capital 1-3 Year Government Index The portfolios generally utilize Treasuries Federal Agency debentures and Agency-Guaranteed 15-year Mortgage-Backed securities The portfolios may invest opportunistically in high quality domestic Corporate Bonds rated a minimum of single ldquoArdquo The portfolios do not contain derivatives and do not employ leverage
The composite benchmark is the Barclays Capital 1-3 Year Government Index The benchmark is used for comparative purposes only and generally reflects the risk or investment style of the product For the period of April 1 2009 to date the minimum portfolio size for inclusion in the composite was $10 million The composite creation date is January 1 2010
Garcia Hamilton amp Associates LP (GHampA) claims compliance with the Global Investment Performance Standards (GIPSreg) and has prepared and presented this report in compliance with the GIPS standards GHampA has been independently verified for the periods January 1 1993 through December 31 2016 by Ashland Partners amp Company LLP The verification reports are available upon request Verification assesses whether (1) the firm has complied with all the composite construction requirements of the GIPS standards on a firm-wide basis and (2) the firmrsquos policies and procedures are designed to calculate and present performance in compliance with the GIPS standards Verification does not ensure the accuracy of any specific composite presentation
GHampA is defined as an independent investment management firm registered under the Investment Advisers Act of 1940 and prior to June 30 2010 was known as Davis Hamilton Jackson amp Associates LP GHampA has chosen not to claim compliance prior to January 1 1993 A complete list and description of firm composites is available upon request Past performance is no guarantee of future results
The US dollar is the currency used to express performance Returns presented above are gross and net of management fees and include the reinvestment of all income The net of fees performance results are calculated based on actual fees and include incentive fees that are entered when earned The management fee schedule for this composite is as follows 30 of the first $10 million and 25 of the balance In addition some clients pay a percentage of annual outperformance of the portfolio versus the benchmark as agreed in the client specific fee schedule Actual investment advisory fees incurred by clients may vary
The following disclosures are applicable to gross performance returns presented in one-on-one presentations Gross performance results are presented before management fees The deduction of such fees or other expenses will reduce a clientrsquos return The net effect of the deduction of fees on annualized performance including the compounded effect over time is determined by the relative size of the fee and the accountrsquos investment performance For example a $10000000 account with an assumed annualized rate of return of 10 over a 10-year period would grow to $2685063838 before fees and to $2490875121 after standard fees of 075 paid quarterly in advance
Additional information regarding policies for valuing portfolios calculating performance and preparing compliant presentations are available upon request Composite dispersion is calculated using an asset value-weighted standard deviation of annual gross returns of those portfolios included in the composite the entire year Standard deviation is presented as a 3-year annualized standard deviation measure of risk using monthly gross returns as of each annual period end
FIXED INCOME ndash SHORT DURATION OPPORTUNISTIC COMPOSITE ( Disclosure Presentation as of December 31 2016) Garcia Hamilton amp Associates LP
Inception (4109) through 123109 Historical information not required prior to 2011 NM = Not statistically meaningful due to an insufficient number of portfolios in the composite for the entire year
The GHampA Fixed Income-Short Duration Opportunistic Composite is comprised only of fully discretionary fee paying institutional portfolios including those portfolios no longer with the firm The Fixed Income-Short Duration Opportunistic investment product utilizes high-quality securities managed with an overall duration exposure roughly equal to the duration of the Barclays Capital 1-3 Year Government Index The portfolios generally utilize Treasuries Federal Agency debentures and Agency-Guaranteed 15-year Mortgage-Backed securities The portfolios may invest opportunistically in high quality domestic Corporate Bonds rated a minimum of single ldquoArdquo The portfolios do not contain derivatives and do not employ leverage
The composite benchmark is the Barclays Capital 1-3 Year Government Index The benchmark is used for comparative purposes only and generally reflects the risk or investment style of the product For the period of April 1 2009 to date the minimum portfolio size for inclusion in the composite was $10 million The composite creation date is January 1 2010
Garcia Hamilton amp Associates LP (GHampA) claims compliance with the Global Investment Performance Standards (GIPSreg) and has prepared and presented this report in compliance with the GIPS standards GHampA has been independently verified for the periods January 1 1993 through December 31 2016 by Ashland Partners amp Company LLP The verification reports are available upon request Verification assesses whether (1) the firm has complied with all the composite construction requirements of the GIPS standards on a firm-wide basis and (2) the firmrsquos policies and procedures are designed to calculate and present performance in compliance with the GIPS standards Verification does not ensure the accuracy of any specific composite presentation
GHampA is defined as an independent investment management firm registered under the Investment Advisers Act of 1940 and prior to June 30 2010 was known as Davis Hamilton Jackson amp Associates LP GHampA has chosen not to claim compliance prior to January 1 1993 A complete list and description of firm composites is available upon request Past performance is no guarantee of future results
The US dollar is the currency used to express performance Returns presented above are gross and net of management fees and include the reinvestment of all income The net of fees performance results are calculated based on actual fees and include incentive fees that are entered when earned The management fee schedule for this composite is as follows 30 of the first $10 million and 25 of the balance In addition some clients pay a percentage of annual outperformance of the portfolio versus the benchmark as agreed in the client specific fee schedule Actual investment advisory fees incurred by clients may vary
The following disclosures are applicable to gross performance returns presented in one-on-one presentations Gross performance results are presented before management fees The deduction of such fees or other expenses will reduce a clientrsquos return The net effect of the deduction of fees on annualized performance including the compounded effect over time is determined by the relative size of the fee and the accountrsquos investment performance For example a $10000000 account with an assumed annualized rate of return of 10 over a 10-year period would grow to $2685063838 before fees and to $2490875121 after standard fees of 075 paid quarterly in advance
Additional information regarding policies for valuing portfolios calculating performance and preparing compliant presentations are available upon request Composite dispersion is calculated using an asset value-weighted standard deviation of annual gross returns of those portfolios included in the composite the entire year Standard deviation is presented as a 3-year annualized standard deviation measure of risk using monthly gross returns as of each annual period end
Performance DisclosureFIXED INCOME ndash SHORT DURATION GOVERNMENT COMPOSITE (Disclosure Presentation as of December 31 2016) Garcia Hamilton amp Associates LP
Historical information not required prior to 2011 NM = Not statistically meaningful due to an insufficient number of portfolios in the composite for the entire year
The GHampA Fixed Income-Short Duration Government Composite is comprised only of fully discretionary fee paying institutional portfolios including those portfolios no longer with the firm The Fixed Income-Short Duration Government investment philosophy utilizes high-quality US investment grade fixed income securities To help control risk the portfolios purchase Treasuries Federal Agency debentures and Agency-Guaranteed Mortgage-Backed securities The portfolios do not contain derivatives and do not employ leverage The duration exposure is generally managed equal to the duration of the Barclays Capital 1-3 Year Government Index
The composite benchmark is the Barclays Capital 1-3 Year Government Index The benchmark is used for comparative purposes only and generally reflects the risk or investment style of the product For the period of January 1 2004 to date the minimum portfolio size for inclusion in the composite was $20 million The composite creation date is October 1 2004
Garcia Hamilton amp Associates LP (GHampA) claims compliance with the Global Investment Performance Standards (GIPSreg) and has prepared and presented this report in compliance with the GIPS standards GHampA has been independently verified for the periods January 1 1993 through December 31 2016 by Ashland Partners amp Company LLP The verification reports are available upon request Verification assesses whether (1) the firm has complied with all the composite construction requirements of the GIPS standards on a firm-wide basis and (2) the firmrsquos policies and procedures are designed to calculate and present performance in compliance with the GIPS standards Verification does not ensure the accuracy of any specific composite presentation
GHampA is defined as an independent investment management firm registered under the Investment Advisers Act of 1940 and prior to June 30 2010 was known as Davis Hamilton Jackson amp Associates GHampA has chosen not to claim compliance prior January 1 1993 A complete list and description of firm composites is available upon request Past performance is no guarantee of future results
The US dollar is the currency used to express performance Returns presented above are gross and net of management fees and include the reinvestment of all income Net of fees performance results are calculated based on actual fees The management fee schedule for this composite is as follows 30 of the first $10 million and 25 of the balance Actual investment advisory fees incurred by clients may vary
The following disclosures are applicable to gross performance returns presented in one-on-one presentations Gross performance results are presented before management fees The deduction of such fees or other expenses will reduce a clientrsquos return The net effect of the deduction of fees on annualized performance including the compounded effect over time is determined by the relative size of the fee and the accountrsquos investment performance For example a $10000000 account with an assumed annualized rate of return of 10 over a 10-year period would grow to $2685063838 before fees and to $2490875121 after standard fees of 075 paid quarterly in advance
Additional information regarding policies for valuing portfolios calculating performance and preparing compliant presentations are available upon request Composite dispersion is calculated using an asset value-weighted standard deviation of annual gross returns of those portfolios included in the composite the entire year Standard deviation is presented as a 3-year annualized standard deviation measure of risk using monthly gross returns as of each annual period end
FIXED INCOME ndash SHORT DURATION GOVERNMENT COMPOSITE ( Disclosure Presentation as of December 31 2016) Garcia Hamilton amp Associates LP
Historical information not required prior to 2011 NM = Not statistically meaningful due to an insufficient number of portfolios in the composite for the entire year
The GHampA Fixed Income-Short Duration Government Composite is comprised only of fully discretionary fee paying institutional portfolios including those portfolios no longer with the firm The Fixed Income-Short Duration Government investment philosophy utilizes high-quality US investment grade fixed income securities To help control risk the portfolios purchase Treasuries Federal Agency debentures and Agency-Guaranteed Mortgage-Backed securities The portfolios do not contain derivatives and do not employ leverage The duration exposure is generally managed equal to the duration of the Barclays Capital 1-3 Year Government Index
The composite benchmark is the Barclays Capital 1-3 Year Government Index The benchmark is used for comparative purposes only and generally reflects the risk or investment style of the product For the period of January 1 2004 to date the minimum portfolio size for inclusion in the composite was $20 million The composite creation date is October 1 2004
Garcia Hamilton amp Associates LP (GHampA) claims compliance with the Global Investment Performance Standards (GIPSreg) and has prepared and presented this report in compliance with the GIPS standards GHampA has been independently verified for the periods January 1 1993 through December 31 2016 by Ashland Partners amp Company LLP The verification reports are available upon request Verification assesses whether (1) the firm has complied with all the composite construction requirements of the GIPS standards on a firm-wide basis and (2) the firmrsquos policies and procedures are designed to calculate and present performance in compliance with the GIPS standards Verification does not ensure the accuracy of any specific composite presentation
GHampA is defined as an independent investment management firm registered under the Investment Advisers Act of 1940 and prior to June 30 2010 was known as Davis Hamilton Jackson amp Associates GHampA has chosen not to claim compliance prior January 1 1993 A complete list and description of firm composites is available upon request Past performance is no guarantee of future results
The US dollar is the currency used to express performance Returns presented above are gross and net of management fees and include the reinvestment of all income Net of fees performance results are calculated based on actual fees The management fee schedule for this composite is as follows 30 of the first $10 million and 25 of the balance Actual investment advisory fees incurred by clients may vary
The following disclosures are applicable to gross performance returns presented in one-on-one presentations Gross performance results are presented before management fees The deduction of such fees or other expenses will reduce a clientrsquos return The net effect of the deduction of fees on annualized performance including the compounded effect over time is determined by the relative size of the fee and the accountrsquos investment performance For example a $10000000 account with an assumed annualized rate of return of 10 over a 10-year period would grow to $2685063838 before fees and to $2490875121 after standard fees of 075 paid quarterly in advance
Additional information regarding policies for valuing portfolios calculating performance and preparing compliant presentations are available upon request Composite dispersion is calculated using an asset value-weighted standard deviation of annual gross returns of those portfolios included in the composite the entire year Standard deviation is presented as a 3-year annualized standard deviation measure of risk using monthly gross returns as of each annual period end
Performance DisclosureFIXED INCOME - INTERMEDIATE AGGREGATE COMPOSITE (Disclosure Presentation as of December 31 2016) Garcia Hamilton amp Associates LP
Historical information not required prior to 2011 NM = Not statistically meaningful due to an insufficient number of portfolios in the composite for the entire year
The GHampA Fixed Income-Intermediate Aggregate Composite is comprised only of fully discretionary fee paying institutional portfolios including those portfolios no longer with the firm The Fixed Income-Intermediate Aggregate investment philosophy utilizes high-quality US investment grade fixed income securities To help control risk the portfolios purchase spread product (non-Treasuries) with less than 10-year maturities 15-year Agency Guaranteed Mortgage-Backed securities and Corporate Bonds rated a minimum of single ldquoArdquo The portfolios do not contain derivatives and do not employ leverage The duration exposure is generally managed within a +- 10 band around the Barclays Capital Intermediate Aggregate Index
The composite benchmark is the Barclays Capital Intermediate Aggregate Index The benchmark is used for comparative purposes only and generally reflects the risk or investment style of the product For the period of January 1 2008 to date the minimum portfolio size for inclusion in the composite was $20 million The composite creation date is April 1 2008
Garcia Hamilton amp Associates LP (GHampA) claims compliance with the Global Investment Performance Standards (GIPSreg) and has prepared and presented this report in compliance with the GIPS standards GHampA has been independently verified for the periods January 1 1993 through December 31 2016 by Ashland Partners amp Company LLP The verification reports are available upon request Verification assesses whether (1) the firm has complied with all the composite construction requirements of the GIPS standards on a firm-wide basis and (2) the firmrsquos policies and procedures are designed to calculate and present performance in compliance with the GIPS standards Verification does not ensure the accuracy of any specific composite presentation
GHampA is defined as an independent investment management firm registered under the Investment Advisers Act of 1940 and prior to June 30 2010 was known as Davis Hamilton Jackson amp Associates GHampA has chosen not to claim compliance prior January 1 1993 A complete list and description of firm composites is available upon request Past performance is no guarantee of future results
The US dollar is the currency used to express performance Returns presented above are gross and net of management fees and include the reinvestment of all income Net of fees performance results are calculated based on actual fees The management fee schedule for this composite is as follows 30 of the first $10 million and 25 of the balance Actual investment advisory fees incurred by clients may vary
The following disclosures are applicable to gross performance returns presented in one-on-one presentations Gross performance results are presented before management fees The deduction of such fees or other expenses will reduce a clientrsquos return The net effect of the deduction of fees on annualized performance including the compounded effect over time is determined by the relative size of the fee and the accountrsquos investment performance For example a $10000000 account with an assumed annualized rate of return of 10 over a 10-year period would grow to $2685063838 before fees and to $2490875121 after standard fees of 075 paid quarterly in advance
Additional information regarding policies for valuing portfolios calculating performance and preparing compliant presentations are available upon request Composite dispersion is calculated using an asset value-weighted standard deviation of annual gross returns of those portfolios included in the composite the entire year Standard deviation is presented as a 3-year annualized standard deviation measure of risk using monthly gross returns as of each annual period end
FIXED INCOME - INTERMEDIATE AGGREGATE COMPOSITE ( Disclosure Presentation as of December 31 2016) Garcia Hamilton amp Associates LP
Historical information not required prior to 2011 NM = Not statistically meaningful due to an insufficient number of portfolios in the composite for the entire year
The GHampA Fixed Income-Intermediate Aggregate Composite is comprised only of fully discretionary fee paying institutional portfolios including those portfolios no longer with the firm The Fixed Income-Intermediate Aggregate investment philosophy utilizes high-quality US investment grade fixed income securities To help control risk the portfolios purchase spread product (non-Treasuries) with less than 10-year maturities 15-year Agency Guaranteed Mortgage-Backed securities and Corporate Bonds rated a minimum of single ldquoArdquo The portfolios do not contain derivatives and do not employ leverage The duration exposure is generally managed within a +- 10 band around the Barclays Capital Intermediate Aggregate Index
The composite benchmark is the Barclays Capital Intermediate Aggregate Index The benchmark is used for comparative purposes only and generally reflects the risk or investment style of the product For the period of January 1 2008 to date the minimum portfolio size for inclusion in the composite was $20 million The composite creation date is April 1 2008
Garcia Hamilton amp Associates LP (GHampA) claims compliance with the Global Investment Performance Standards (GIPSreg) and has prepared and presented this report in compliance with the GIPS standards GHampA has been independently verified for the periods January 1 1993 through December 31 2016 by Ashland Partners amp Company LLP The verification reports are available upon request Verification assesses whether (1) the firm has complied with all the composite construction requirements of the GIPS standards on a firm-wide basis and (2) the firmrsquos policies and procedures are designed to calculate and present performance in compliance with the GIPS standards Verification does not ensure the accuracy of any specific composite presentation
GHampA is defined as an independent investment management firm registered under the Investment Advisers Act of 1940 and prior to June 30 2010 was known as Davis Hamilton Jackson amp Associates GHampA has chosen not to claim compliance prior January 1 1993 A complete list and description of firm composites is available upon request Past performance is no guarantee of future results
The US dollar is the currency used to express performance Returns presented above are gross and net of management fees and include the reinvestment of all income Net of fees performance results are calculated based on actual fees The management fee schedule for this composite is as follows 30 of the first $10 million and 25 of the balance Actual investment advisory fees incurred by clients may vary
The following disclosures are applicable to gross performance returns presented in one-on-one presentations Gross performance results are presented before management fees The deduction of such fees or other expenses will reduce a clientrsquos return The net effect of the deduction of fees on annualized performance including the compounded effect over time is determined by the relative size of the fee and the accountrsquos investment performance For example a $10000000 account with an assumed annualized rate of return of 10 over a 10-year period would grow to $2685063838 before fees and to $2490875121 after standard fees of 075 paid quarterly in advance
Additional information regarding policies for valuing portfolios calculating performance and preparing compliant presentations are available upon request Composite dispersion is calculated using an asset value-weighted standard deviation of annual gross returns of those portfolios included in the composite the entire year Standard deviation is presented as a 3-year annualized standard deviation measure of risk using monthly gross returns as of each annual period end
Performance DisclosureFIXED INCOME ndash GOVERNMENTCREDIT COMPOSITE (Disclosure Presentation as of December 31 2016) Garcia Hamilton amp Associates LP
Historical information not required prior to 2011 NM = Not statistically meaningful due to an insufficient number of portfolios in the composite for the entire year
The GHampA Fixed Income-GovernmentCredit Composite is comprised only of fully discretionary fee paying institutional portfolios including those portfolios no longer with the firm The Fixed Income- GovernmentCredit investment philosophy utilizes high-quality US investment grade fixed income securities To help control risk the portfolios purchase spread product (non-Treasuries) with less than 10-year maturities 15-year Agency Guaranteed Mortgage-Backed securities and Corporate Bonds rated a minimum of single ldquoArdquo The portfolios do not contain derivatives and do not employ leverage The duration exposure is generally managed within a +- 10 band around the Barclays Capital GovernmentCredit Index
The composite benchmark is the Barclays Capital GovernmentCredit Index The benchmark is used for comparative purposes only and generally reflects the risk or investment style of the product For the period of January 1 2005 to date the minimum portfolio size for inclusion in the composite was $20 million The composite creation date is April 1 2006
Garcia Hamilton amp Associates LP (GHampA) claims compliance with the Global Investment Performance Standards (GIPSreg) and has prepared and presented this report in compliance with the GIPS standards GHampA has been independently verified for the periods January 1 1993 through December 31 2016 by Ashland Partners amp Company LLP The verification reports are available upon request Verification assesses whether (1) the firm has complied with all the composite construction requirements of the GIPS standards on a firm-wide basis and (2) the firmrsquos policies and procedures are designed to calculate and present performance in compliance with the GIPS standards Verification does not ensure the accuracy of any specific composite presentation
GHampA is defined as an independent investment management firm registered under the Investment Advisers Act of 1940 and prior to June 30 2010 was known as Davis Hamilton Jackson amp Associates LP GHampA has chosen not to claim compliance prior to January 1 1993 A complete list and description of firm composites is available upon request Past performance is no guarantee of future results
The US dollar is the currency used to express performance Returns presented above are gross and net of management fees and include the reinvestment of all income The net of fees performance results are calculated based on actual fees The management fee schedule for this composite is as follows 30 of the first $10 million and 25 of the balance Actual investment advisory fees incurred by clients may vary
The following disclosures are applicable to gross performance returns presented in one-on-one presentations Gross performance results are presented before management fees The deduction of such fees or other expenses will reduce a clientrsquos return The net effect of the deduction of fees on annualized performance including the compounded effect over time is determined by the relative size of the fee and the accountrsquos investment performance For example a $10000000 account with an assumed annualized rate of return of 10 over a 10-year period would grow to $2685063838 before fees and to $2490875121 after standard fees of 075 paid quarterly in advance
Additional information regarding policies for valuing portfolios calculating performance and preparing compliant presentations are available upon request Composite dispersion is calculated using an asset value-weighted standard deviation of annual gross returns of those portfolios included in the composite the entire year Standard deviation is presented as a 3-year annualized standard deviation measure of risk using monthly gross returns as of each annual period end
FIXED INCOME ndash GOVERNMENTCREDIT COMPOSITE ( Disclosure Presentation as of December 31 2016) Garcia Hamilton amp Associates LP
Historical information not required prior to 2011 NM = Not statistically meaningful due to an insufficient number of portfolios in the composite for the entire year
The GHampA Fixed Income-GovernmentCredit Composite is comprised only of fully discretionary fee paying institutional portfolios including those portfolios no longer with the firm The Fixed Income- GovernmentCredit investment philosophy utilizes high-quality US investment grade fixed income securities To help control risk the portfolios purchase spread product (non-Treasuries) with less than 10-year maturities 15-year Agency Guaranteed Mortgage-Backed securities and Corporate Bonds rated a minimum of single ldquoArdquo The portfolios do not contain derivatives and do not employ leverage The duration exposure is generally managed within a +- 10 band around the Barclays Capital GovernmentCredit Index
The composite benchmark is the Barclays Capital GovernmentCredit Index The benchmark is used for comparative purposes only and generally reflects the risk or investment style of the product For the period of January 1 2005 to date the minimum portfolio size for inclusion in the composite was $20 million The composite creation date is April 1 2006
Garcia Hamilton amp Associates LP (GHampA) claims compliance with the Global Investment Performance Standards (GIPSreg) and has prepared and presented this report in compliance with the GIPS standards GHampA has been independently verified for the periods January 1 1993 through December 31 2016 by Ashland Partners amp Company LLP The verification reports are available upon request Verification assesses whether (1) the firm has complied with all the composite construction requirements of the GIPS standards on a firm-wide basis and (2) the firmrsquos policies and procedures are designed to calculate and present performance in compliance with the GIPS standards Verification does not ensure the accuracy of any specific composite presentation
GHampA is defined as an independent investment management firm registered under the Investment Advisers Act of 1940 and prior to June 30 2010 was known as Davis Hamilton Jackson amp Associates LP GHampA has chosen not to claim compliance prior to January 1 1993 A complete list and description of firm composites is available upon request Past performance is no guarantee of future results
The US dollar is the currency used to express performance Returns presented above are gross and net of management fees and include the reinvestment of all income The net of fees performance results are calculated based on actual fees The management fee schedule for this composite is as follows 30 of the first $10 million and 25 of the balance Actual investment advisory fees incurred by clients may vary
The following disclosures are applicable to gross performance returns presented in one-on-one presentations Gross performance results are presented before management fees The deduction of such fees or other expenses will reduce a clientrsquos return The net effect of the deduction of fees on annualized performance including the compounded effect over time is determined by the relative size of the fee and the accountrsquos investment performance For example a $10000000 account with an assumed annualized rate of return of 10 over a 10-year period would grow to $2685063838 before fees and to $2490875121 after standard fees of 075 paid quarterly in advance
Additional information regarding policies for valuing portfolios calculating performance and preparing compliant presentations are available upon request Composite dispersion is calculated using an asset value-weighted standard deviation of annual gross returns of those portfolios included in the composite the entire year Standard deviation is presented as a 3-year annualized standard deviation measure of risk using monthly gross returns as of each annual period end
Performance DisclosureFIXED INCOME ndash SHORT DURATION GOVERNMENTCREDIT COMPOSITE (Disclosure Presentation as of December 31 2016) Garcia Hamilton amp Associates LP
Inception (10113) through 123113 NM = Not statistically meaningful due to an insufficient number of portfolios in the composite for the entire year
The GHampA Fixed Income-Short Duration GovernmentCredit Composite is comprised only of fully discretionary fee paying institutional portfolios including those portfolios no longer with the firm The Fixed Income- Short Duration GovernmentCredit investment product will generally invest in high quality securities such as US Treasuries Agency debentures 15-year Agency Guaranteed Mortgage-Backed securities and Corporate Bonds rated a minimum of single ldquoArdquo The portfolios will generally operate within a duration range of 175 to 225 years The portfolios do not contain derivatives and do not employ leverage
The composite benchmark is the Barclays Capital 1-3 Year GovernmentCredit Index The benchmark is used for comparative purposes only and generally reflects the risk or investment style of the product The minimum portfolio size for inclusion in the composite is $20 million The composite creation date is January 1 2014
Garcia Hamilton amp Associates LP (GHampA) claims compliance with the Global Investment Performance Standards (GIPSreg) and has prepared and presented this report in compliance with the GIPS standards GHampA has been independently verified for the periods January 1 1993 through December 31 2016 by Ashland Partners amp Company LLP The verification reports are available upon request Verification assesses whether (1) the firm has complied with all the composite construction requirements of the GIPS standards on a firm-wide basis and (2) the firmrsquos policies and procedures are designed to calculate and present performance in compliance with the GIPS standards Verification does not ensure the accuracy of any specific composite presentation
GHampA is defined as an independent investment management firm registered under the Investment Advisers Act of 1940 and prior to June 30 2010 was known as Davis Hamilton Jackson amp Associates LP GHampA has chosen not to claim compliance prior to January 1 1993 A complete list and description of firm composites is available upon request Past performance is no guarantee of future results
The US dollar is the currency used to express performance Returns presented above are gross and net of management fees and include the reinvestment of all income The net of fees performance results are calculated based on actual fees The management fee schedule for this composite is as follows 30 of the first $10 million and 25 of the balance Actual investment advisory fees incurred by clients may vary
The following disclosures are applicable to gross performance returns presented in one-on-one presentations Gross performance results are presented before management fees The deduction of such fees or other expenses will reduce a clientrsquos return The net effect of the deduction of fees on annualized performance including the compounded effect over time is determined by the relative size of the fee and the accountrsquos investment performance For example a $10000000 account with an assumed annualized rate of return of 10 over a 10-year period would grow to $2685063838 before fees and to $2490875121 after standard fees of 075 paid quarterly in advance
Additional information regarding policies for valuing portfolios calculating performance and preparing compliant presentations are available upon request Composite dispersion is calculated using an asset value-weighted standard deviation of annual gross returns of those portfolios included in the composite the entire year The 3 year annualized standard deviation will be shown beginning December 31 2016 when 36 months of composite performance is available
FIXED INCOME ndash SHORT DURATION GOVERNMENTCREDIT COMPOSITE ( Disclosure Presentation as of December 31 2016) Garcia Hamilton amp Associates LP
Inception (10113) through 123113 NM = Not statistically meaningful due to an insufficient number of portfolios in the composite for the entire year
The GHampA Fixed Income-Short Duration GovernmentCredit Composite is comprised only of fully discretionary fee paying institutional portfolios including those portfolios no longer with the firm The Fixed Income- Short Duration GovernmentCredit investment product will generally invest in high quality securities such as US Treasuries Agency debentures 15-year Agency Guaranteed Mortgage-Backed securities and Corporate Bonds rated a minimum of single ldquoArdquo The portfolios will generally operate within a duration range of 175 to 225 years The portfolios do not contain derivatives and do not employ leverage
The composite benchmark is the Barclays Capital 1-3 Year GovernmentCredit Index The benchmark is used for comparative purposes only and generally reflects the risk or investment style of the product The minimum portfolio size for inclusion in the composite is $20 million The composite creation date is January 1 2014
Garcia Hamilton amp Associates LP (GHampA) claims compliance with the Global Investment Performance Standards (GIPSreg) and has prepared and presented this report in compliance with the GIPS standards GHampA has been independently verified for the periods January 1 1993 through December 31 2016 by Ashland Partners amp Company LLP The verification reports are available upon request Verification assesses whether (1) the firm has complied with all the composite construction requirements of the GIPS standards on a firm-wide basis and (2) the firmrsquos policies and procedures are designed to calculate and present performance in compliance with the GIPS standards Verification does not ensure the accuracy of any specific composite presentation
GHampA is defined as an independent investment management firm registered under the Investment Advisers Act of 1940 and prior to June 30 2010 was known as Davis Hamilton Jackson amp Associates LP GHampA has chosen not to claim compliance prior to January 1 1993 A complete list and description of firm composites is available upon request Past performance is no guarantee of future results
The US dollar is the currency used to express performance Returns presented above are gross and net of management fees and include the reinvestment of all income The net of fees performance results are calculated based on actual fees The management fee schedule for this composite is as follows 30 of the first $10 million and 25 of the balance Actual investment advisory fees incurred by clients may vary
The following disclosures are applicable to gross performance returns presented in one-on-one presentations Gross performance results are presented before management fees The deduction of such fees or other expenses will reduce a clientrsquos return The net effect of the deduction of fees on annualized performance including the compounded effect over time is determined by the relative size of the fee and the accountrsquos investment performance For example a $10000000 account with an assumed annualized rate of return of 10 over a 10-year period would grow to $2685063838 before fees and to $2490875121 after standard fees of 075 paid quarterly in advance
Additional information regarding policies for valuing portfolios calculating performance and preparing compliant presentations are available upon request Composite dispersion is calculated using an asset value-weighted standard deviation of annual gross returns of those portfolios included in the composite the entire year The 3 year annualized standard deviation will be shown beginning December 31 2016 when 36 months of composite performance is available
Performance DisclosureFIXED INCOME ndash UNCONSTRAINED BOND COMPOSITE (Disclosure Presentation as of December 31 2016) Garcia Hamilton amp Associates LP
Inception (4109) through 43009 NM = Not statistically meaningful due to an insufficient number of portfolios in the composite for the entire year
The GHampA Fixed Income Unconstrained Bond Composite is comprised only of fully discretionary fee paying portfolios including those portfolios no longer with the firm The Fixed Income Unconstrained Bond investment philosophy will generally invest in high quality securities such as US Treasuries Agency Debentures Agency Guaranteed Mortgage-Backed securities and Investment Grade Corporate Bonds The Unconstrained Bond product utilizes a domestic fixed income strategy that has the flexibility to adapt to changing markets without sector or duration constraints while maintaining a high quality focus The flexibility to adapt to changing market conditions without limitation to the constraints of a specific index may result from time to time in the concentration of one or more sectors The portfolios do not contain derivatives and do not employ leverage
The Barclays Capital US Treasury Bellwether 3-Month Index a cash proxy is provided for comparison purposes The composite is not managed against an Index The minimum portfolio size for inclusion in the composite is $500 thousand The composite creation date is January 1 2014
Garcia Hamilton amp Associates LP (GHampA) claims compliance with the Global Investment Performance Standards (GIPSreg) and has prepared and presented this report in compliance with the GIPS standards GHampA has been independently verified for the periods January 1 1993 through December 31 2016 by Ashland Partners amp Company LLP The verification reports are available upon request Verification assesses whether (1) the firm has complied with all the composite construction requirements of the GIPS standards on a firm-wide basis and (2) the firmrsquos policies and procedures are designed to calculate and present performance in compliance with the GIPS standards Verification does not ensure the accuracy of any specific composite presentation
GHampA is defined as an independent investment management firm registered under the Investment Advisers Act of 1940 and prior to June 30 2010 was known as Davis Hamilton Jackson amp Associates LP GHampA has chosen not to claim compliance prior to January 1 1993 A complete list and description of firm composites is available upon request Past performance is no guarantee of future results
The US dollar is the currency used to express performance Returns presented above are gross and net of management fees and include the reinvestment of all income The net of fees performance results are calculated based on actual fees The management fee schedule for this composite is as follows 30 of the first $10 million and 25 of the balance Actual investment advisory fees incurred by clients may vary
The following disclosures are applicable to gross performance returns presented in one-on-one presentations Gross performance results are presented before management fees The deduction of such fees or other expenses will reduce a clientrsquos return The net effect of the deduction of fees on annualized performance including the compounded effect over time is determined by the relative size of the fee and the accountrsquos investment performance For example a $10000000 account with an assumed annualized rate of return of 10 over a 10-year period would grow to $2685063838 before fees and to $2490875121 after standard fees of 075 paid quarterly in advance
Additional information regarding policies for valuing portfolios calculating performance and preparing compliant presentations are available upon request Composite dispersion is calculated using an asset value-weighted standard deviation of annual gross returns of those portfolios included in the composite the entire year Standard deviation is presented as a 3-year annualized standard deviation measure of risk using monthly gross returns as of each annual period end
Additional information is in the performance disclosure at the end of this presentation
Comparative Annualized Rates of Return ndash Gross of FeesFor periods ending June 30 2017
Inception December 31 1991 Periods longer than 12 months are annualized
Preliminary
8Awardsrankings may not represent client experiences and are not indicative of future performance Go to wwwgarciahamiltonassociatescomawards for additional information on each award
Fixed Income Aggregate Portfolio Characteristics
PortfolioBloomberg Barclays Aggregate
June 30 2017
9
Treasuries20
Corporates28
Agencies36
Mortgages16
Cashlt1
Average YTM Average Coupon Average Duration
Portfolio 18 25 47
Bloomberg Barclays Aggregate 26 31 59
00
10
20
30
40
50
60
70
Treasuries37
Corporates26
Agencies7
Mortgages28
Asset-Backed
2
The characteristics shown are those of an actual portfolio that is representative of this strategy at a particular point in time Individual portfolio characteristics may vary depending on the date shown as well as client-imposed restrictions cash flows etc This information is supplemental to the Fixed Income Aggregate Composite Disclosure Statement in the Appendix
Fixed Income Intermediate GovtCredit Composite Returns
Inception June 30 1988 Periods longer than 12 months are annualized
Preliminary
10Awardsrankings may not represent client experiences and are not indicative of future performance Go to wwwgarciahamiltonassociatescomawards for additional information on each award
Comparative Annualized Rates of Return ndash Gross of FeesFor periods ending June 30 2017
Additional information is in the performance disclosure at the end of this presentation
Average YTM Average Coupon Average Duration
Portfolio 17 23 32
Bloomberg Barclays Int GovtCredit 21 24 40
00
05
10
15
20
25
30
35
40
45
Fixed Income Intermediate GovtCredit Portfolio Characteristics
Treasuries57Corporates
32
Agencies11 Treasuries
28
Corporates17
Agencies39
Mortgages16
Cashlt1
Bloomberg Barclays Int GovtCredit Portfolio
11
June 30 2017
The characteristics shown are those of an actual portfolio that is representative of this strategy at a particular point in time Individual portfolio characteristics may vary depending on the date shown as well as client-imposed restrictions cash flows etc This information is supplemental to the Fixed Income Intermediate Composite Disclosure Statement in the Appendix
Fixed Income Short Duration Oppt Composite Returns
Inception March 31 2009 Periods longer than 12 months are annualized
Preliminary
12Awardsrankings may not represent client experiences and are not indicative of future performance Go to wwwgarciahamiltonassociatescomawards for additional information on each award
Comparative Annualized Rates of Return ndash Gross of FeesFor periods ending June 30 2017
Additional information is in the performance disclosure at the end of this presentation
Fixed Income Short Duration Oppt Portfolio Characteristics
Treasuries92
Agencies8 Treasuries
35
Corporates11
Agencies47
Mortgages4
Cash3
Bloomberg Barclays 1-3 Year Govt
Portfolio
13
Average YTM Average Coupon Average Duration
Portfolio 13 26 12
Bloomberg Barclays 1-3 Year Govt 14 16 19
00
05
10
15
20
25
30
June 30 2017
The characteristics shown are those of an actual portfolio that is representative of this strategy at a particular point in time Individual portfolio characteristics may vary depending on the date shown as well as client-imposed restrictions cash flows etc This information is supplemental to the Fixed Income Short Duration Opportunistic Composite Disclosure Statement in the Appendix
14
QTD YTD 1 Year 2 Years 3 Years 5 Years 7 Years 10 Years Inception to Date
Portfolios
Assets in Millions
Short Duration GovernmentInception December 2003
047 100 080 161 151 126 155 277 296 1 57
Bloomberg Barclays 1-3 Year Govt 020 048 -007 061 071 065 078 201 216 NA NA
Intermediate AggregateInception December 2007
088 169 062 297 280 343 408 NA 522 19 277
Bloomberg Barclays IntermediateAggregate
092 161 -016 207 201 187 265 NA 364 NA NA
Government Credit Inception December 2004
155 261 -052 368 331 397 493 627 565 4 140
Bloomberg Barclays GovtCredit 169 266 -041 308 261 229 339 457 422 NA NA
Short Duration GovernmentCreditInception September 2013 051 113 137 207 185 NA NA NA 200 1 167
Bloomberg Barclays 1-3 Year GovtCredit 031 072 035 096 095 NA NA NA 096 NA NA
Unconstrained BondInception March 2009 048 103 130 242 205 318 432 NA 576 2 6
Bloomberg Barclays US Treasury Bellwether 3-Month
021 031 050 036 025 019 017 NA 017 NA NA
Comparative Annualized Rates of Return ndash Gross of Fees For periods ending June 30 2017
Preliminary
Periods longer than 12 months are annualized
Fixed Income Composite Performance Summary
Additional information is in the performance disclosure at the end of this presentation
15
Diversity
Our firm directly supports numerous minority organizations in the community
bullOur Managing Partner Gilbert Garcia served as Chairman of the Board for six yearsbullOur Partner and Director of Marketing and Client Services Ruby Muntildeoz Dang served as Trustee for the METRO Texas Non-Union Pension
Plan
Metropolitan Transit Authority of Harris County
bullNational Association of Securities Professionals is a non-profit association of professionals that brings together minorities and women in the fields of asset management public finance investment banking and other finance professions
bullOur Partner Stephanie Roberts is highly involved with the organization and recently started the Texas chapter
NASP
bullSponsors for Educational Opportunity is a non-profit organization that mentors young women and minority individuals in the development of careers in investment banking corporate law and other leading global companies
bullMr Garcia is the longest serving board member (since 1988) and conducts interviews for candidates in our offices for placement within investment companies in New York
bullMr Garcia was awarded the SEO Alumni Leadership Award at the 2015 Awards Dinner in New York City Other honorees included Michael R Bloomberg three-term Mayor of New York City and Founder of Bloomberg LP amp Bloomberg Philanthropies and David M Rubenstein Co-Founder amp Co-CEO of The Carlyle Group
SEO
bullThe League of United Latin American Citizens is a non-profit organization created to advance the economic condition educational attainment political influence housing health and civil rights of the Hispanic population of the United States
LULAC
Diversity is a central theme throughout the entire firm bullCertified as a MBE in several states bullAlmost 91 of the firm owned by minority and female partnersbull59 owned by minority partners and 55 owned by Hispanic partnersbull86 of employees are ethnic minorities and womenbullExecuted over 60 of brokerage volume with MBEMWBEveteran firms over the past several yearsbullWe also work with many minority and women-owned vendors in the areas ofbullOffice Supplies Temporary Staffing Services Travel Accounting Auditors
bullThe firm has a summer internship program for minority undergraduate and high school students bullMr Garcia was the 2012 Houston Area Urban League Gala Honorary Chair amp a Co-Chair of the 103rd NAACP National Convention bullMr Garcia served as a trustee on the Houston Municipal Employees Pension System Board of Trustees
GHampA Giving Back
We support several community education veteran and other programs throughout the country Over the last three years we have donated over $57500 to these programs as well as many more not listed below
16
$575000Donated
Over
Why Hire Garcia Hamilton amp Associates
100 Employee Owned
High Quality Focus
No Big Surprises
Flexibility
Proven Investment Process Over Time
Risk Controls
Strong Focus on Client Service
17
Performance DisclosureFIXED INCOME ndash AGGREGATE COMPOSITE (Disclosure Presentation as of December 31 2016) Garcia Hamilton amp Associates LP
Historical information not required prior to 2011 NM = Not statistically meaningful due to an insufficient number of portfolios in the composite for the entire year
The GHampA Fixed Income-Aggregate Composite is comprised only of fully discretionary fee paying institutional portfolios including those portfolios no longer with the firm The Fixed Income-Aggregate investment philosophy utilizes high-quality US investment grade fixed income securities To help control risk the portfolios purchase spread product (non-Treasuries) with less than 10-year maturities 15-year Agency Guaranteed Mortgage-Backed securities and Corporate Bonds rated a minimum of single ldquoArdquo The portfolios do not contain derivatives and do not employ leverage The duration exposure is generally managed within a +- 10 band around the Barclays Capital Aggregate Index
The composite benchmark is the Barclays Capital Aggregate Index The benchmark is used for comparative purposes only and generally reflects the risk or investment style of the product For the period of January 1 1992 through June 30 1996 the minimum portfolio size for inclusion in the composite was $10 million Effective July 1 1996 the minimum for inclusion in the composite was increased to $20 million The composite creation date is October 1 1999
Garcia Hamilton amp Associates LP (GHampA) claims compliance with the Global Investment Performance Standards (GIPSreg) and has prepared and presented this report in compliance with the GIPS standards GHampA has been independently verified for the periods January 1 1993 through December 31 2016 by Ashland Partners amp Company LLP The verification reports are available upon request Verification assesses whether (1) the firm has complied with all the composite construction requirements of the GIPS standards on a firm-wide basis and (2) the firmrsquos policies and procedures are designed to calculate and present performance in compliance with the GIPS standards Verification does not ensure the accuracy of any specific composite presentation
GHampA is defined as an independent investment management firm registered under the Investment Advisers Act of 1940 and prior to June 30 2010 was known as Davis Hamilton Jackson amp Associates GHampA has chosen not to claim compliance prior January 1 1993 A complete list and description of firm composites is available upon request Past performance is no guarantee of future results
The US dollar is the currency used to express performance Returns presented above are gross and net of management fees and include the reinvestment of all income Net of fee results are calculated for the period of December 31 1991 through December 31 1994 by deducting the highest fee of 0375 from the monthly gross composite returns Since January 1 1995 the net of fees performance results are calculated based on actual fees The management fee schedule for this composite is as follows 30 of the first $10 million and 25 of the balance Actual investment advisory fees incurred by clients may vary
The following disclosures are applicable to gross performance returns presented in one-on-one presentations Gross performance results are presented before management fees The deduction of such fees or other expenses will reduce a clientrsquos return The net effect of the deduction of fees on annualized performance including the compounded effect over time is determined by the relative size of the fee and the accountrsquos investment performance For example a $10000000 account with an assumed annualized rate of return of 10 over a 10-year period would grow to $2685063838 before fees and to $2490875121 after standard fees of 075 paid quarterly in advance
Additional information regarding policies for valuing portfolios calculating performance and preparing compliant presentations are available upon request Composite dispersion since January 1 1993 is calculated using an asset value-weighted standard deviation of annual gross returns of those portfolios included in the composite the entire year Standard deviation is presented as a 3-year annualized standard deviation measure of risk using monthly gross returns as of each annual period end
FIXED INCOME ndash AGGREGATE COMPOSITE ( Disclosure Presentation as of December 31 2016) Garcia Hamilton amp Associates LP
Historical information not required prior to 2011NM = Not statistically meaningful due to an insufficient number of portfolios in the composite for the entire year
The GHampA Fixed Income-Aggregate Composite is comprised only of fully discretionary fee paying institutional portfolios including those portfolios no longer with the firm The Fixed Income-Aggregate investment philosophy utilizes high-quality US investment grade fixed income securities To help control risk the portfolios purchase spread product (non-Treasuries) with less than 10-year maturities 15-year Agency Guaranteed Mortgage-Backed securities and Corporate Bonds rated a minimum of single ldquoArdquo The portfolios do not contain derivatives and do not employ leverage The duration exposure is generally managed within a +- 10 band around the Barclays Capital Aggregate Index
The composite benchmark is the Barclays Capital Aggregate Index The benchmark is used for comparative purposes only and generally reflects the risk or investment style of the product For the period of January 1 1992 through June 30 1996 the minimum portfolio size for inclusion in the composite was $10 million Effective July 1 1996 the minimum for inclusion in the composite was increased to $20 million The composite creation date is October 1 1999
Garcia Hamilton amp Associates LP (GHampA) claims compliance with the Global Investment Performance Standards (GIPSreg) and has prepared and presented this report in compliance with the GIPS standards GHampA has been independently verified for the periods January 1 1993 through December 31 2016 by Ashland Partners amp Company LLP The verification reports are available upon request Verification assesses whether (1) the firm has complied with all the composite construction requirements of the GIPS standards on a firm-wide basis and (2) the firmrsquos policies and procedures are designed to calculate and present performance in compliance with the GIPS standards Verification does not ensure the accuracy of any specific composite presentation
GHampA is defined as an independent investment management firm registered under the Investment Advisers Act of 1940 and prior to June 30 2010 was known as Davis Hamilton Jackson amp Associates GHampA has chosen not to claim compliance prior January 1 1993 A complete list and description of firm composites is available upon request Past performance is no guarantee of future results
The US dollar is the currency used to express performance Returns presented above are gross and net of management fees and include the reinvestment of all income Net of fee results are calculated for the period of December 31 1991 through December 31 1994 by deducting the highest fee of 0375 from the monthly gross composite returns Since January 1 1995 the net of fees performance results are calculated based on actual fees The management fee schedule for this composite is as follows 30 of the first $10 million and 25 of the balance Actual investment advisory fees incurred by clients may vary
The following disclosures are applicable to gross performance returns presented in one-on-one presentations Gross performance results are presented before management fees The deduction of such fees or other expenses will reduce a clientrsquos return The net effect of the deduction of fees on annualized performance including the compounded effect over time is determined by the relative size of the fee and the accountrsquos investment performance For example a $10000000 account with an assumed annualized rate of return of 10 over a 10-year period would grow to $2685063838 before fees and to $2490875121 after standard fees of 075 paid quarterly in advance
Additional information regarding policies for valuing portfolios calculating performance and preparing compliant presentations are available upon request Composite dispersion since January 1 1993 is calculated using an asset value-weighted standard deviation of annual gross returns of those portfolios included in the composite the entire year Standard deviation is presented as a 3-year annualized standard deviation measure of risk using monthly gross returns as of each annual period end
Performance DisclosureFIXED INCOME ndash INTERMEDIATE GOVERNMENT CREDIT COMPOSITE (Disclosure Presentation as of December 31 2016) Garcia Hamilton amp Associates LP
Inception (7188) through 123188 Historical information not required prior to 2011 NM = Not statistically meaningful due to an insufficient number of portfolios in the composite for the entire year
The GHampA Fixed Income-Intermediate Composite is comprised only of fully discretionary fee paying institutional portfolios including those portfolios no longer with the firm The Fixed Income-Intermediate investment philosophy utilizes high-quality US investment grade fixed income securities To help control risk the portfolios purchase spread product (non-Treasuries) with less than 10-year maturities 15-year Agency Guaranteed Mortgage-Backed securities and Corporate Bonds rated a minimum of single ldquoArdquo The portfolios do not contain derivatives and do not employ leverage The duration exposure is generally managed within a +- 10 band around the Barclays Capital Intermediate GovernmentCredit Index
The composite benchmark is the Barclays Capital Intermediate GovernmentCredit Index The benchmark is used for comparative purposes only and generally reflects the risk or investment style of the product For the period of July 1 1988 through June 30 1996 the minimum portfolio size for inclusion in the composite was $10 million Effective July 1 1996 the minimum for inclusion in the composite was increased to $20 million The composite creation date is July 1 1988
Garcia Hamilton amp Associates LP (GHampA) claims compliance with the Global Investment Performance Standards (GIPSreg) and has prepared and presented this report in compliance with the GIPS standards GHampA has been independently verified for the periods January 1 1993 through December 31 2016 by Ashland Partners amp Company LLP The verification reports are available upon request Verification assesses whether (1) the firm has complied with all the composite construction requirements of the GIPS standards on a firm-wide basis and (2) the firmrsquos policies and procedures are designed to calculate and present performance in compliance with the GIPS standards Verification does not ensure the accuracy of any specific composite presentation
GHampA is defined as an independent investment management firm registered under the Investment Advisers Act of 1940 and prior to June 30 2010 was known as Davis Hamilton Jackson amp Associates GHampA has chosen not to claim compliance prior January 1 1993 A complete list and description of firm composites is available upon request Past performance is no guarantee of future results
The US dollar is the currency used to express performance Returns presented above are gross and net of management fees and include the reinvestment of all income For the period of July 1 1988 through December 31 2005 net of fees results are calculated by deducting the highest fee of 012 on a quarterly basis from the monthly gross composite returns and for the period of December 31 2005 through December 31 2016 by deducting the highest fee of 007 on a quarterly basis from the monthly gross composite returns Since January 1 2010 the net of fees performance results are calculated based on actual fees The management fee schedule for this composite is as follows 30 of the first $10 million and 25 of the balance Actual investment advisory fees incurred by clients may vary
The following disclosures are applicable to gross performance returns presented in one-on-one presentations Gross performance results are presented before management fees The deduction of such fees or other expenses will reduce a clientrsquos return The net effect of the deduction of fees on annualized performance including the compounded effect over time is determined by the relative size of the fee and the accountrsquos investment performance For example a $10000000 account with an assumed annualized rate of return of 10 over a 10-year period would grow to $2685063838 before fees and to $2490875121 after standard fees of 075 paid quarterly in advance
Additional information regarding policies for valuing portfolios calculating performance and preparing compliance presentations are available upon request Composite dispersion for the period of July 1 1988 through December 31 1992 was an equal-weighted standard deviation Composite dispersion since January 1 1993 is calculated using an asset value-weighted standard deviation of annual gross returns of those portfolios included in the composite the entire year Standard deviation is presented as a 3-year annualized standard deviation measure of risk using monthly gross returns as of each annual period end
FIXED INCOME ndash INTERMEDIATE GOVERNMENT CREDIT COMPOSITE ( Disclosure Presentation as of December 31 2016) Garcia Hamilton amp Associates LP
Inception (7188) through 123188 Historical information not required prior to 2011 NM = Not statistically meaningful due to an insufficient number of portfolios in the composite for the entire year
The GHampA Fixed Income-Intermediate Composite is comprised only of fully discretionary fee paying institutional portfolios including those portfolios no longer with the firm The Fixed Income-Intermediate investment philosophy utilizes high-quality US investment grade fixed income securities To help control risk the portfolios purchase spread product (non-Treasuries) with less than 10-year maturities 15-year Agency Guaranteed Mortgage-Backed securities and Corporate Bonds rated a minimum of single ldquoArdquo The portfolios do not contain derivatives and do not employ leverage The duration exposure is generally managed within a +- 10 band around the Barclays Capital Intermediate GovernmentCredit Index
The composite benchmark is the Barclays Capital Intermediate GovernmentCredit Index The benchmark is used for comparative purposes only and generally reflects the risk or investment style of the product For the period of July 1 1988 through June 30 1996 the minimum portfolio size for inclusion in the composite was $10 million Effective July 1 1996 the minimum for inclusion in the composite was increased to $20 million The composite creation date is July 1 1988
Garcia Hamilton amp Associates LP (GHampA) claims compliance with the Global Investment Performance Standards (GIPSreg) and has prepared and presented this report in compliance with the GIPS
standards GHampA has been independently verified for the periods January 1 1993 through December 31 2016 by Ashland Partners amp Company LLP The verification reports are available upon request Verification assesses whether (1) the firm has complied with all the composite construction requirements of the GIPS standards on a firm-wide basis and (2) the firmrsquos policies and procedures are designed to calculate and present performance in compliance with the GIPS standards Verification does not ensure the accuracy of any specific composite presentation
GHampA is defined as an independent investment management firm registered under the Investment Advisers Act of 1940 and prior to June 30 2010 was known as Davis Hamilton Jackson amp Associates GHampA has chosen not to claim compliance prior January 1 1993 A complete list and description of firm composites is available upon request Past performance is no guarantee of future results
The US dollar is the currency used to express performance Returns presented above are gross and net of management fees and include the reinvestment of all income For the period of July 1 1988 through December 31 2005 net of fees results are calculated by deducting the highest fee of 012 on a quarterly basis from the monthly gross composite returns and for the period of December 31 2005 through December 31 2016 by deducting the highest fee of 007 on a quarterly basis from the monthly gross composite returns Since January 1 2010 the net of fees performance results are calculated based on actual fees The management fee schedule for this composite is as follows 30 of the first $10 million and 25 of the balance Actual investment advisory fees incurred by clients may vary
The following disclosures are applicable to gross performance returns presented in one-on-one presentations Gross performance results are presented before management fees The deduction of such fees or other expenses will reduce a clientrsquos return The net effect of the deduction of fees on annualized performance including the compounded effect over time is determined by the relative size of the fee and the accountrsquos investment performance For example a $10000000 account with an assumed annualized rate of return of 10 over a 10-year period would grow to $2685063838 before fees and to $2490875121 after standard fees of 075 paid quarterly in advance
Additional information regarding policies for valuing portfolios calculating performance and preparing compliance presentations are available upon request Composite dispersion for the period of July 1 1988 through December 31 1992 was an equal-weighted standard deviation Composite dispersion since January 1 1993 is calculated using an asset value-weighted standard deviation of annual gross returns of those portfolios included in the composite the entire year Standard deviation is presented as a 3-year annualized standard deviation measure of risk using monthly gross returns as of each annual period end
Performance DisclosureFIXED INCOME ndash SHORT DURATION OPPORTUNISTIC COMPOSITE (Disclosure Presentation as of December 31 2016) Garcia Hamilton amp Associates LP
Inception (4109) through 123109 Historical information not required prior to 2011 NM = Not statistically meaningful due to an insufficient number of portfolios in the composite for the entire year
The GHampA Fixed Income-Short Duration Opportunistic Composite is comprised only of fully discretionary fee paying institutional portfolios including those portfolios no longer with the firm The Fixed Income-Short Duration Opportunistic investment product utilizes high-quality securities managed with an overall duration exposure roughly equal to the duration of the Barclays Capital 1-3 Year Government Index The portfolios generally utilize Treasuries Federal Agency debentures and Agency-Guaranteed 15-year Mortgage-Backed securities The portfolios may invest opportunistically in high quality domestic Corporate Bonds rated a minimum of single ldquoArdquo The portfolios do not contain derivatives and do not employ leverage
The composite benchmark is the Barclays Capital 1-3 Year Government Index The benchmark is used for comparative purposes only and generally reflects the risk or investment style of the product For the period of April 1 2009 to date the minimum portfolio size for inclusion in the composite was $10 million The composite creation date is January 1 2010
Garcia Hamilton amp Associates LP (GHampA) claims compliance with the Global Investment Performance Standards (GIPSreg) and has prepared and presented this report in compliance with the GIPS standards GHampA has been independently verified for the periods January 1 1993 through December 31 2016 by Ashland Partners amp Company LLP The verification reports are available upon request Verification assesses whether (1) the firm has complied with all the composite construction requirements of the GIPS standards on a firm-wide basis and (2) the firmrsquos policies and procedures are designed to calculate and present performance in compliance with the GIPS standards Verification does not ensure the accuracy of any specific composite presentation
GHampA is defined as an independent investment management firm registered under the Investment Advisers Act of 1940 and prior to June 30 2010 was known as Davis Hamilton Jackson amp Associates LP GHampA has chosen not to claim compliance prior to January 1 1993 A complete list and description of firm composites is available upon request Past performance is no guarantee of future results
The US dollar is the currency used to express performance Returns presented above are gross and net of management fees and include the reinvestment of all income The net of fees performance results are calculated based on actual fees and include incentive fees that are entered when earned The management fee schedule for this composite is as follows 30 of the first $10 million and 25 of the balance In addition some clients pay a percentage of annual outperformance of the portfolio versus the benchmark as agreed in the client specific fee schedule Actual investment advisory fees incurred by clients may vary
The following disclosures are applicable to gross performance returns presented in one-on-one presentations Gross performance results are presented before management fees The deduction of such fees or other expenses will reduce a clientrsquos return The net effect of the deduction of fees on annualized performance including the compounded effect over time is determined by the relative size of the fee and the accountrsquos investment performance For example a $10000000 account with an assumed annualized rate of return of 10 over a 10-year period would grow to $2685063838 before fees and to $2490875121 after standard fees of 075 paid quarterly in advance
Additional information regarding policies for valuing portfolios calculating performance and preparing compliant presentations are available upon request Composite dispersion is calculated using an asset value-weighted standard deviation of annual gross returns of those portfolios included in the composite the entire year Standard deviation is presented as a 3-year annualized standard deviation measure of risk using monthly gross returns as of each annual period end
FIXED INCOME ndash SHORT DURATION OPPORTUNISTIC COMPOSITE ( Disclosure Presentation as of December 31 2016) Garcia Hamilton amp Associates LP
Inception (4109) through 123109 Historical information not required prior to 2011 NM = Not statistically meaningful due to an insufficient number of portfolios in the composite for the entire year
The GHampA Fixed Income-Short Duration Opportunistic Composite is comprised only of fully discretionary fee paying institutional portfolios including those portfolios no longer with the firm The Fixed Income-Short Duration Opportunistic investment product utilizes high-quality securities managed with an overall duration exposure roughly equal to the duration of the Barclays Capital 1-3 Year Government Index The portfolios generally utilize Treasuries Federal Agency debentures and Agency-Guaranteed 15-year Mortgage-Backed securities The portfolios may invest opportunistically in high quality domestic Corporate Bonds rated a minimum of single ldquoArdquo The portfolios do not contain derivatives and do not employ leverage
The composite benchmark is the Barclays Capital 1-3 Year Government Index The benchmark is used for comparative purposes only and generally reflects the risk or investment style of the product For the period of April 1 2009 to date the minimum portfolio size for inclusion in the composite was $10 million The composite creation date is January 1 2010
Garcia Hamilton amp Associates LP (GHampA) claims compliance with the Global Investment Performance Standards (GIPSreg) and has prepared and presented this report in compliance with the GIPS standards GHampA has been independently verified for the periods January 1 1993 through December 31 2016 by Ashland Partners amp Company LLP The verification reports are available upon request Verification assesses whether (1) the firm has complied with all the composite construction requirements of the GIPS standards on a firm-wide basis and (2) the firmrsquos policies and procedures are designed to calculate and present performance in compliance with the GIPS standards Verification does not ensure the accuracy of any specific composite presentation
GHampA is defined as an independent investment management firm registered under the Investment Advisers Act of 1940 and prior to June 30 2010 was known as Davis Hamilton Jackson amp Associates LP GHampA has chosen not to claim compliance prior to January 1 1993 A complete list and description of firm composites is available upon request Past performance is no guarantee of future results
The US dollar is the currency used to express performance Returns presented above are gross and net of management fees and include the reinvestment of all income The net of fees performance results are calculated based on actual fees and include incentive fees that are entered when earned The management fee schedule for this composite is as follows 30 of the first $10 million and 25 of the balance In addition some clients pay a percentage of annual outperformance of the portfolio versus the benchmark as agreed in the client specific fee schedule Actual investment advisory fees incurred by clients may vary
The following disclosures are applicable to gross performance returns presented in one-on-one presentations Gross performance results are presented before management fees The deduction of such fees or other expenses will reduce a clientrsquos return The net effect of the deduction of fees on annualized performance including the compounded effect over time is determined by the relative size of the fee and the accountrsquos investment performance For example a $10000000 account with an assumed annualized rate of return of 10 over a 10-year period would grow to $2685063838 before fees and to $2490875121 after standard fees of 075 paid quarterly in advance
Additional information regarding policies for valuing portfolios calculating performance and preparing compliant presentations are available upon request Composite dispersion is calculated using an asset value-weighted standard deviation of annual gross returns of those portfolios included in the composite the entire year Standard deviation is presented as a 3-year annualized standard deviation measure of risk using monthly gross returns as of each annual period end
Performance DisclosureFIXED INCOME ndash SHORT DURATION GOVERNMENT COMPOSITE (Disclosure Presentation as of December 31 2016) Garcia Hamilton amp Associates LP
Historical information not required prior to 2011 NM = Not statistically meaningful due to an insufficient number of portfolios in the composite for the entire year
The GHampA Fixed Income-Short Duration Government Composite is comprised only of fully discretionary fee paying institutional portfolios including those portfolios no longer with the firm The Fixed Income-Short Duration Government investment philosophy utilizes high-quality US investment grade fixed income securities To help control risk the portfolios purchase Treasuries Federal Agency debentures and Agency-Guaranteed Mortgage-Backed securities The portfolios do not contain derivatives and do not employ leverage The duration exposure is generally managed equal to the duration of the Barclays Capital 1-3 Year Government Index
The composite benchmark is the Barclays Capital 1-3 Year Government Index The benchmark is used for comparative purposes only and generally reflects the risk or investment style of the product For the period of January 1 2004 to date the minimum portfolio size for inclusion in the composite was $20 million The composite creation date is October 1 2004
Garcia Hamilton amp Associates LP (GHampA) claims compliance with the Global Investment Performance Standards (GIPSreg) and has prepared and presented this report in compliance with the GIPS standards GHampA has been independently verified for the periods January 1 1993 through December 31 2016 by Ashland Partners amp Company LLP The verification reports are available upon request Verification assesses whether (1) the firm has complied with all the composite construction requirements of the GIPS standards on a firm-wide basis and (2) the firmrsquos policies and procedures are designed to calculate and present performance in compliance with the GIPS standards Verification does not ensure the accuracy of any specific composite presentation
GHampA is defined as an independent investment management firm registered under the Investment Advisers Act of 1940 and prior to June 30 2010 was known as Davis Hamilton Jackson amp Associates GHampA has chosen not to claim compliance prior January 1 1993 A complete list and description of firm composites is available upon request Past performance is no guarantee of future results
The US dollar is the currency used to express performance Returns presented above are gross and net of management fees and include the reinvestment of all income Net of fees performance results are calculated based on actual fees The management fee schedule for this composite is as follows 30 of the first $10 million and 25 of the balance Actual investment advisory fees incurred by clients may vary
The following disclosures are applicable to gross performance returns presented in one-on-one presentations Gross performance results are presented before management fees The deduction of such fees or other expenses will reduce a clientrsquos return The net effect of the deduction of fees on annualized performance including the compounded effect over time is determined by the relative size of the fee and the accountrsquos investment performance For example a $10000000 account with an assumed annualized rate of return of 10 over a 10-year period would grow to $2685063838 before fees and to $2490875121 after standard fees of 075 paid quarterly in advance
Additional information regarding policies for valuing portfolios calculating performance and preparing compliant presentations are available upon request Composite dispersion is calculated using an asset value-weighted standard deviation of annual gross returns of those portfolios included in the composite the entire year Standard deviation is presented as a 3-year annualized standard deviation measure of risk using monthly gross returns as of each annual period end
FIXED INCOME ndash SHORT DURATION GOVERNMENT COMPOSITE ( Disclosure Presentation as of December 31 2016) Garcia Hamilton amp Associates LP
Historical information not required prior to 2011 NM = Not statistically meaningful due to an insufficient number of portfolios in the composite for the entire year
The GHampA Fixed Income-Short Duration Government Composite is comprised only of fully discretionary fee paying institutional portfolios including those portfolios no longer with the firm The Fixed Income-Short Duration Government investment philosophy utilizes high-quality US investment grade fixed income securities To help control risk the portfolios purchase Treasuries Federal Agency debentures and Agency-Guaranteed Mortgage-Backed securities The portfolios do not contain derivatives and do not employ leverage The duration exposure is generally managed equal to the duration of the Barclays Capital 1-3 Year Government Index
The composite benchmark is the Barclays Capital 1-3 Year Government Index The benchmark is used for comparative purposes only and generally reflects the risk or investment style of the product For the period of January 1 2004 to date the minimum portfolio size for inclusion in the composite was $20 million The composite creation date is October 1 2004
Garcia Hamilton amp Associates LP (GHampA) claims compliance with the Global Investment Performance Standards (GIPSreg) and has prepared and presented this report in compliance with the GIPS standards GHampA has been independently verified for the periods January 1 1993 through December 31 2016 by Ashland Partners amp Company LLP The verification reports are available upon request Verification assesses whether (1) the firm has complied with all the composite construction requirements of the GIPS standards on a firm-wide basis and (2) the firmrsquos policies and procedures are designed to calculate and present performance in compliance with the GIPS standards Verification does not ensure the accuracy of any specific composite presentation
GHampA is defined as an independent investment management firm registered under the Investment Advisers Act of 1940 and prior to June 30 2010 was known as Davis Hamilton Jackson amp Associates GHampA has chosen not to claim compliance prior January 1 1993 A complete list and description of firm composites is available upon request Past performance is no guarantee of future results
The US dollar is the currency used to express performance Returns presented above are gross and net of management fees and include the reinvestment of all income Net of fees performance results are calculated based on actual fees The management fee schedule for this composite is as follows 30 of the first $10 million and 25 of the balance Actual investment advisory fees incurred by clients may vary
The following disclosures are applicable to gross performance returns presented in one-on-one presentations Gross performance results are presented before management fees The deduction of such fees or other expenses will reduce a clientrsquos return The net effect of the deduction of fees on annualized performance including the compounded effect over time is determined by the relative size of the fee and the accountrsquos investment performance For example a $10000000 account with an assumed annualized rate of return of 10 over a 10-year period would grow to $2685063838 before fees and to $2490875121 after standard fees of 075 paid quarterly in advance
Additional information regarding policies for valuing portfolios calculating performance and preparing compliant presentations are available upon request Composite dispersion is calculated using an asset value-weighted standard deviation of annual gross returns of those portfolios included in the composite the entire year Standard deviation is presented as a 3-year annualized standard deviation measure of risk using monthly gross returns as of each annual period end
Performance DisclosureFIXED INCOME - INTERMEDIATE AGGREGATE COMPOSITE (Disclosure Presentation as of December 31 2016) Garcia Hamilton amp Associates LP
Historical information not required prior to 2011 NM = Not statistically meaningful due to an insufficient number of portfolios in the composite for the entire year
The GHampA Fixed Income-Intermediate Aggregate Composite is comprised only of fully discretionary fee paying institutional portfolios including those portfolios no longer with the firm The Fixed Income-Intermediate Aggregate investment philosophy utilizes high-quality US investment grade fixed income securities To help control risk the portfolios purchase spread product (non-Treasuries) with less than 10-year maturities 15-year Agency Guaranteed Mortgage-Backed securities and Corporate Bonds rated a minimum of single ldquoArdquo The portfolios do not contain derivatives and do not employ leverage The duration exposure is generally managed within a +- 10 band around the Barclays Capital Intermediate Aggregate Index
The composite benchmark is the Barclays Capital Intermediate Aggregate Index The benchmark is used for comparative purposes only and generally reflects the risk or investment style of the product For the period of January 1 2008 to date the minimum portfolio size for inclusion in the composite was $20 million The composite creation date is April 1 2008
Garcia Hamilton amp Associates LP (GHampA) claims compliance with the Global Investment Performance Standards (GIPSreg) and has prepared and presented this report in compliance with the GIPS standards GHampA has been independently verified for the periods January 1 1993 through December 31 2016 by Ashland Partners amp Company LLP The verification reports are available upon request Verification assesses whether (1) the firm has complied with all the composite construction requirements of the GIPS standards on a firm-wide basis and (2) the firmrsquos policies and procedures are designed to calculate and present performance in compliance with the GIPS standards Verification does not ensure the accuracy of any specific composite presentation
GHampA is defined as an independent investment management firm registered under the Investment Advisers Act of 1940 and prior to June 30 2010 was known as Davis Hamilton Jackson amp Associates GHampA has chosen not to claim compliance prior January 1 1993 A complete list and description of firm composites is available upon request Past performance is no guarantee of future results
The US dollar is the currency used to express performance Returns presented above are gross and net of management fees and include the reinvestment of all income Net of fees performance results are calculated based on actual fees The management fee schedule for this composite is as follows 30 of the first $10 million and 25 of the balance Actual investment advisory fees incurred by clients may vary
The following disclosures are applicable to gross performance returns presented in one-on-one presentations Gross performance results are presented before management fees The deduction of such fees or other expenses will reduce a clientrsquos return The net effect of the deduction of fees on annualized performance including the compounded effect over time is determined by the relative size of the fee and the accountrsquos investment performance For example a $10000000 account with an assumed annualized rate of return of 10 over a 10-year period would grow to $2685063838 before fees and to $2490875121 after standard fees of 075 paid quarterly in advance
Additional information regarding policies for valuing portfolios calculating performance and preparing compliant presentations are available upon request Composite dispersion is calculated using an asset value-weighted standard deviation of annual gross returns of those portfolios included in the composite the entire year Standard deviation is presented as a 3-year annualized standard deviation measure of risk using monthly gross returns as of each annual period end
FIXED INCOME - INTERMEDIATE AGGREGATE COMPOSITE ( Disclosure Presentation as of December 31 2016) Garcia Hamilton amp Associates LP
Historical information not required prior to 2011 NM = Not statistically meaningful due to an insufficient number of portfolios in the composite for the entire year
The GHampA Fixed Income-Intermediate Aggregate Composite is comprised only of fully discretionary fee paying institutional portfolios including those portfolios no longer with the firm The Fixed Income-Intermediate Aggregate investment philosophy utilizes high-quality US investment grade fixed income securities To help control risk the portfolios purchase spread product (non-Treasuries) with less than 10-year maturities 15-year Agency Guaranteed Mortgage-Backed securities and Corporate Bonds rated a minimum of single ldquoArdquo The portfolios do not contain derivatives and do not employ leverage The duration exposure is generally managed within a +- 10 band around the Barclays Capital Intermediate Aggregate Index
The composite benchmark is the Barclays Capital Intermediate Aggregate Index The benchmark is used for comparative purposes only and generally reflects the risk or investment style of the product For the period of January 1 2008 to date the minimum portfolio size for inclusion in the composite was $20 million The composite creation date is April 1 2008
Garcia Hamilton amp Associates LP (GHampA) claims compliance with the Global Investment Performance Standards (GIPSreg) and has prepared and presented this report in compliance with the GIPS standards GHampA has been independently verified for the periods January 1 1993 through December 31 2016 by Ashland Partners amp Company LLP The verification reports are available upon request Verification assesses whether (1) the firm has complied with all the composite construction requirements of the GIPS standards on a firm-wide basis and (2) the firmrsquos policies and procedures are designed to calculate and present performance in compliance with the GIPS standards Verification does not ensure the accuracy of any specific composite presentation
GHampA is defined as an independent investment management firm registered under the Investment Advisers Act of 1940 and prior to June 30 2010 was known as Davis Hamilton Jackson amp Associates GHampA has chosen not to claim compliance prior January 1 1993 A complete list and description of firm composites is available upon request Past performance is no guarantee of future results
The US dollar is the currency used to express performance Returns presented above are gross and net of management fees and include the reinvestment of all income Net of fees performance results are calculated based on actual fees The management fee schedule for this composite is as follows 30 of the first $10 million and 25 of the balance Actual investment advisory fees incurred by clients may vary
The following disclosures are applicable to gross performance returns presented in one-on-one presentations Gross performance results are presented before management fees The deduction of such fees or other expenses will reduce a clientrsquos return The net effect of the deduction of fees on annualized performance including the compounded effect over time is determined by the relative size of the fee and the accountrsquos investment performance For example a $10000000 account with an assumed annualized rate of return of 10 over a 10-year period would grow to $2685063838 before fees and to $2490875121 after standard fees of 075 paid quarterly in advance
Additional information regarding policies for valuing portfolios calculating performance and preparing compliant presentations are available upon request Composite dispersion is calculated using an asset value-weighted standard deviation of annual gross returns of those portfolios included in the composite the entire year Standard deviation is presented as a 3-year annualized standard deviation measure of risk using monthly gross returns as of each annual period end
Performance DisclosureFIXED INCOME ndash GOVERNMENTCREDIT COMPOSITE (Disclosure Presentation as of December 31 2016) Garcia Hamilton amp Associates LP
Historical information not required prior to 2011 NM = Not statistically meaningful due to an insufficient number of portfolios in the composite for the entire year
The GHampA Fixed Income-GovernmentCredit Composite is comprised only of fully discretionary fee paying institutional portfolios including those portfolios no longer with the firm The Fixed Income- GovernmentCredit investment philosophy utilizes high-quality US investment grade fixed income securities To help control risk the portfolios purchase spread product (non-Treasuries) with less than 10-year maturities 15-year Agency Guaranteed Mortgage-Backed securities and Corporate Bonds rated a minimum of single ldquoArdquo The portfolios do not contain derivatives and do not employ leverage The duration exposure is generally managed within a +- 10 band around the Barclays Capital GovernmentCredit Index
The composite benchmark is the Barclays Capital GovernmentCredit Index The benchmark is used for comparative purposes only and generally reflects the risk or investment style of the product For the period of January 1 2005 to date the minimum portfolio size for inclusion in the composite was $20 million The composite creation date is April 1 2006
Garcia Hamilton amp Associates LP (GHampA) claims compliance with the Global Investment Performance Standards (GIPSreg) and has prepared and presented this report in compliance with the GIPS standards GHampA has been independently verified for the periods January 1 1993 through December 31 2016 by Ashland Partners amp Company LLP The verification reports are available upon request Verification assesses whether (1) the firm has complied with all the composite construction requirements of the GIPS standards on a firm-wide basis and (2) the firmrsquos policies and procedures are designed to calculate and present performance in compliance with the GIPS standards Verification does not ensure the accuracy of any specific composite presentation
GHampA is defined as an independent investment management firm registered under the Investment Advisers Act of 1940 and prior to June 30 2010 was known as Davis Hamilton Jackson amp Associates LP GHampA has chosen not to claim compliance prior to January 1 1993 A complete list and description of firm composites is available upon request Past performance is no guarantee of future results
The US dollar is the currency used to express performance Returns presented above are gross and net of management fees and include the reinvestment of all income The net of fees performance results are calculated based on actual fees The management fee schedule for this composite is as follows 30 of the first $10 million and 25 of the balance Actual investment advisory fees incurred by clients may vary
The following disclosures are applicable to gross performance returns presented in one-on-one presentations Gross performance results are presented before management fees The deduction of such fees or other expenses will reduce a clientrsquos return The net effect of the deduction of fees on annualized performance including the compounded effect over time is determined by the relative size of the fee and the accountrsquos investment performance For example a $10000000 account with an assumed annualized rate of return of 10 over a 10-year period would grow to $2685063838 before fees and to $2490875121 after standard fees of 075 paid quarterly in advance
Additional information regarding policies for valuing portfolios calculating performance and preparing compliant presentations are available upon request Composite dispersion is calculated using an asset value-weighted standard deviation of annual gross returns of those portfolios included in the composite the entire year Standard deviation is presented as a 3-year annualized standard deviation measure of risk using monthly gross returns as of each annual period end
FIXED INCOME ndash GOVERNMENTCREDIT COMPOSITE ( Disclosure Presentation as of December 31 2016) Garcia Hamilton amp Associates LP
Historical information not required prior to 2011 NM = Not statistically meaningful due to an insufficient number of portfolios in the composite for the entire year
The GHampA Fixed Income-GovernmentCredit Composite is comprised only of fully discretionary fee paying institutional portfolios including those portfolios no longer with the firm The Fixed Income- GovernmentCredit investment philosophy utilizes high-quality US investment grade fixed income securities To help control risk the portfolios purchase spread product (non-Treasuries) with less than 10-year maturities 15-year Agency Guaranteed Mortgage-Backed securities and Corporate Bonds rated a minimum of single ldquoArdquo The portfolios do not contain derivatives and do not employ leverage The duration exposure is generally managed within a +- 10 band around the Barclays Capital GovernmentCredit Index
The composite benchmark is the Barclays Capital GovernmentCredit Index The benchmark is used for comparative purposes only and generally reflects the risk or investment style of the product For the period of January 1 2005 to date the minimum portfolio size for inclusion in the composite was $20 million The composite creation date is April 1 2006
Garcia Hamilton amp Associates LP (GHampA) claims compliance with the Global Investment Performance Standards (GIPSreg) and has prepared and presented this report in compliance with the GIPS standards GHampA has been independently verified for the periods January 1 1993 through December 31 2016 by Ashland Partners amp Company LLP The verification reports are available upon request Verification assesses whether (1) the firm has complied with all the composite construction requirements of the GIPS standards on a firm-wide basis and (2) the firmrsquos policies and procedures are designed to calculate and present performance in compliance with the GIPS standards Verification does not ensure the accuracy of any specific composite presentation
GHampA is defined as an independent investment management firm registered under the Investment Advisers Act of 1940 and prior to June 30 2010 was known as Davis Hamilton Jackson amp Associates LP GHampA has chosen not to claim compliance prior to January 1 1993 A complete list and description of firm composites is available upon request Past performance is no guarantee of future results
The US dollar is the currency used to express performance Returns presented above are gross and net of management fees and include the reinvestment of all income The net of fees performance results are calculated based on actual fees The management fee schedule for this composite is as follows 30 of the first $10 million and 25 of the balance Actual investment advisory fees incurred by clients may vary
The following disclosures are applicable to gross performance returns presented in one-on-one presentations Gross performance results are presented before management fees The deduction of such fees or other expenses will reduce a clientrsquos return The net effect of the deduction of fees on annualized performance including the compounded effect over time is determined by the relative size of the fee and the accountrsquos investment performance For example a $10000000 account with an assumed annualized rate of return of 10 over a 10-year period would grow to $2685063838 before fees and to $2490875121 after standard fees of 075 paid quarterly in advance
Additional information regarding policies for valuing portfolios calculating performance and preparing compliant presentations are available upon request Composite dispersion is calculated using an asset value-weighted standard deviation of annual gross returns of those portfolios included in the composite the entire year Standard deviation is presented as a 3-year annualized standard deviation measure of risk using monthly gross returns as of each annual period end
Performance DisclosureFIXED INCOME ndash SHORT DURATION GOVERNMENTCREDIT COMPOSITE (Disclosure Presentation as of December 31 2016) Garcia Hamilton amp Associates LP
Inception (10113) through 123113 NM = Not statistically meaningful due to an insufficient number of portfolios in the composite for the entire year
The GHampA Fixed Income-Short Duration GovernmentCredit Composite is comprised only of fully discretionary fee paying institutional portfolios including those portfolios no longer with the firm The Fixed Income- Short Duration GovernmentCredit investment product will generally invest in high quality securities such as US Treasuries Agency debentures 15-year Agency Guaranteed Mortgage-Backed securities and Corporate Bonds rated a minimum of single ldquoArdquo The portfolios will generally operate within a duration range of 175 to 225 years The portfolios do not contain derivatives and do not employ leverage
The composite benchmark is the Barclays Capital 1-3 Year GovernmentCredit Index The benchmark is used for comparative purposes only and generally reflects the risk or investment style of the product The minimum portfolio size for inclusion in the composite is $20 million The composite creation date is January 1 2014
Garcia Hamilton amp Associates LP (GHampA) claims compliance with the Global Investment Performance Standards (GIPSreg) and has prepared and presented this report in compliance with the GIPS standards GHampA has been independently verified for the periods January 1 1993 through December 31 2016 by Ashland Partners amp Company LLP The verification reports are available upon request Verification assesses whether (1) the firm has complied with all the composite construction requirements of the GIPS standards on a firm-wide basis and (2) the firmrsquos policies and procedures are designed to calculate and present performance in compliance with the GIPS standards Verification does not ensure the accuracy of any specific composite presentation
GHampA is defined as an independent investment management firm registered under the Investment Advisers Act of 1940 and prior to June 30 2010 was known as Davis Hamilton Jackson amp Associates LP GHampA has chosen not to claim compliance prior to January 1 1993 A complete list and description of firm composites is available upon request Past performance is no guarantee of future results
The US dollar is the currency used to express performance Returns presented above are gross and net of management fees and include the reinvestment of all income The net of fees performance results are calculated based on actual fees The management fee schedule for this composite is as follows 30 of the first $10 million and 25 of the balance Actual investment advisory fees incurred by clients may vary
The following disclosures are applicable to gross performance returns presented in one-on-one presentations Gross performance results are presented before management fees The deduction of such fees or other expenses will reduce a clientrsquos return The net effect of the deduction of fees on annualized performance including the compounded effect over time is determined by the relative size of the fee and the accountrsquos investment performance For example a $10000000 account with an assumed annualized rate of return of 10 over a 10-year period would grow to $2685063838 before fees and to $2490875121 after standard fees of 075 paid quarterly in advance
Additional information regarding policies for valuing portfolios calculating performance and preparing compliant presentations are available upon request Composite dispersion is calculated using an asset value-weighted standard deviation of annual gross returns of those portfolios included in the composite the entire year The 3 year annualized standard deviation will be shown beginning December 31 2016 when 36 months of composite performance is available
FIXED INCOME ndash SHORT DURATION GOVERNMENTCREDIT COMPOSITE ( Disclosure Presentation as of December 31 2016) Garcia Hamilton amp Associates LP
Inception (10113) through 123113 NM = Not statistically meaningful due to an insufficient number of portfolios in the composite for the entire year
The GHampA Fixed Income-Short Duration GovernmentCredit Composite is comprised only of fully discretionary fee paying institutional portfolios including those portfolios no longer with the firm The Fixed Income- Short Duration GovernmentCredit investment product will generally invest in high quality securities such as US Treasuries Agency debentures 15-year Agency Guaranteed Mortgage-Backed securities and Corporate Bonds rated a minimum of single ldquoArdquo The portfolios will generally operate within a duration range of 175 to 225 years The portfolios do not contain derivatives and do not employ leverage
The composite benchmark is the Barclays Capital 1-3 Year GovernmentCredit Index The benchmark is used for comparative purposes only and generally reflects the risk or investment style of the product The minimum portfolio size for inclusion in the composite is $20 million The composite creation date is January 1 2014
Garcia Hamilton amp Associates LP (GHampA) claims compliance with the Global Investment Performance Standards (GIPSreg) and has prepared and presented this report in compliance with the GIPS standards GHampA has been independently verified for the periods January 1 1993 through December 31 2016 by Ashland Partners amp Company LLP The verification reports are available upon request Verification assesses whether (1) the firm has complied with all the composite construction requirements of the GIPS standards on a firm-wide basis and (2) the firmrsquos policies and procedures are designed to calculate and present performance in compliance with the GIPS standards Verification does not ensure the accuracy of any specific composite presentation
GHampA is defined as an independent investment management firm registered under the Investment Advisers Act of 1940 and prior to June 30 2010 was known as Davis Hamilton Jackson amp Associates LP GHampA has chosen not to claim compliance prior to January 1 1993 A complete list and description of firm composites is available upon request Past performance is no guarantee of future results
The US dollar is the currency used to express performance Returns presented above are gross and net of management fees and include the reinvestment of all income The net of fees performance results are calculated based on actual fees The management fee schedule for this composite is as follows 30 of the first $10 million and 25 of the balance Actual investment advisory fees incurred by clients may vary
The following disclosures are applicable to gross performance returns presented in one-on-one presentations Gross performance results are presented before management fees The deduction of such fees or other expenses will reduce a clientrsquos return The net effect of the deduction of fees on annualized performance including the compounded effect over time is determined by the relative size of the fee and the accountrsquos investment performance For example a $10000000 account with an assumed annualized rate of return of 10 over a 10-year period would grow to $2685063838 before fees and to $2490875121 after standard fees of 075 paid quarterly in advance
Additional information regarding policies for valuing portfolios calculating performance and preparing compliant presentations are available upon request Composite dispersion is calculated using an asset value-weighted standard deviation of annual gross returns of those portfolios included in the composite the entire year The 3 year annualized standard deviation will be shown beginning December 31 2016 when 36 months of composite performance is available
Performance DisclosureFIXED INCOME ndash UNCONSTRAINED BOND COMPOSITE (Disclosure Presentation as of December 31 2016) Garcia Hamilton amp Associates LP
Inception (4109) through 43009 NM = Not statistically meaningful due to an insufficient number of portfolios in the composite for the entire year
The GHampA Fixed Income Unconstrained Bond Composite is comprised only of fully discretionary fee paying portfolios including those portfolios no longer with the firm The Fixed Income Unconstrained Bond investment philosophy will generally invest in high quality securities such as US Treasuries Agency Debentures Agency Guaranteed Mortgage-Backed securities and Investment Grade Corporate Bonds The Unconstrained Bond product utilizes a domestic fixed income strategy that has the flexibility to adapt to changing markets without sector or duration constraints while maintaining a high quality focus The flexibility to adapt to changing market conditions without limitation to the constraints of a specific index may result from time to time in the concentration of one or more sectors The portfolios do not contain derivatives and do not employ leverage
The Barclays Capital US Treasury Bellwether 3-Month Index a cash proxy is provided for comparison purposes The composite is not managed against an Index The minimum portfolio size for inclusion in the composite is $500 thousand The composite creation date is January 1 2014
Garcia Hamilton amp Associates LP (GHampA) claims compliance with the Global Investment Performance Standards (GIPSreg) and has prepared and presented this report in compliance with the GIPS standards GHampA has been independently verified for the periods January 1 1993 through December 31 2016 by Ashland Partners amp Company LLP The verification reports are available upon request Verification assesses whether (1) the firm has complied with all the composite construction requirements of the GIPS standards on a firm-wide basis and (2) the firmrsquos policies and procedures are designed to calculate and present performance in compliance with the GIPS standards Verification does not ensure the accuracy of any specific composite presentation
GHampA is defined as an independent investment management firm registered under the Investment Advisers Act of 1940 and prior to June 30 2010 was known as Davis Hamilton Jackson amp Associates LP GHampA has chosen not to claim compliance prior to January 1 1993 A complete list and description of firm composites is available upon request Past performance is no guarantee of future results
The US dollar is the currency used to express performance Returns presented above are gross and net of management fees and include the reinvestment of all income The net of fees performance results are calculated based on actual fees The management fee schedule for this composite is as follows 30 of the first $10 million and 25 of the balance Actual investment advisory fees incurred by clients may vary
The following disclosures are applicable to gross performance returns presented in one-on-one presentations Gross performance results are presented before management fees The deduction of such fees or other expenses will reduce a clientrsquos return The net effect of the deduction of fees on annualized performance including the compounded effect over time is determined by the relative size of the fee and the accountrsquos investment performance For example a $10000000 account with an assumed annualized rate of return of 10 over a 10-year period would grow to $2685063838 before fees and to $2490875121 after standard fees of 075 paid quarterly in advance
Additional information regarding policies for valuing portfolios calculating performance and preparing compliant presentations are available upon request Composite dispersion is calculated using an asset value-weighted standard deviation of annual gross returns of those portfolios included in the composite the entire year Standard deviation is presented as a 3-year annualized standard deviation measure of risk using monthly gross returns as of each annual period end