Flagellin:allergen fusion proteins as novel vaccines for the treatment of severe type I allergies Dissertation zur Erlangung des Grades ʺDoktor der Naturwissenschaftenʺ am Fachbereich Biologie der Johannes Gutenberg‐Universität in Mainz Stefan Schülke geb. in Bad Kreuznach Mainz, 2010
Transcript
Flagellin:allergen fusion proteins as novel
vaccines for the treatment of
severe type I allergies
D i s s e r t a t i o n
zur Erlangung des Grades
ʺDoktor der
Naturwissenschaftenʺ
am Fachbereich Biologie
der Johannes Gutenberg‐Universität
in Mainz
Stefan Schülke
geb. in Bad Kreuznach
Mainz, 2010
II
Tag der mündlichen Prüfung: 25.05.2011
III
Content 1 Introduction ..........................................................................................................1 1.1 Pathomechanism of type I allergic diseases..............................................................1 1.2 Current strategies of allergen specific immunotherapy..............................................4 1.3 The mode of action of SIT is poorly understood but includes several mechanisms of action .........................................................................................................................6 1.3.1 SIT influences many clinical parameters ...................................................................6 1.3.2 Modulation of immune responses is tightly controlled by highly specialized cells .....6 1.3.3 DC are promising target cells for immunotherapy .....................................................8 1.4 New strategies for the treatment of allergies .............................................................9 1.4.1 Recombinant allergens, hypoallergens and peptides................................................9 1.4.1.1 Recombinant allergens may be used to improve therapeutic efficacy and safety .....9 1.4.1.2 Hypoallergenic variants hold potential to improve SIT.............................................10 1.4.1.3 Peptide based vaccines have a high risk of adverse reactions ...............................12 1.4.2 Bacterial extracts .....................................................................................................12 1.4.2.1 Heat killed Listeria are potent immune modulators .................................................13 1.4.2.2 HKL activate the innate immune system .................................................................14 1.4.3 TLR-ligands .............................................................................................................15 1.4.3.1 TLR-ligands are promising tools to modulate allergic immune responses ..............15 1.4.3.2 TLR5-ligand flagellin is an interesting adjuvant candidate for allergen specific ..........
immunotherapy........................................................................................................16 1.4.3.3 Flagellin based vaccines .........................................................................................17 1.4.3.4 TLR5 is expressed on many different cell types......................................................18 1.4.3.5 Flagellin has potent adjuvant activities ....................................................................19 2. Aim.........................................................................................................................20 2.1 Working hypothesis .................................................................................................20 2.2 Working program .....................................................................................................20 3. Material and methods .....................................................................................22 3.1 Cloning, expression and purification of flagellin, allergens and flagellin:allergen fusion proteins .........................................................................................................22 3.1.1 Cloning of flagellin A, rOva, and rflaA-Ova fusion protein .......................................22 3.1.2 Expression and purification of flagellin A, rOva, and rflaA-Ova fusion protein ........24 3.1.3 cDNA-cloning of rflaA:Pru p 3 and rflaA:Ara h 2 fusion proteins .............................26 3.1.4 Expression and purification of recombinant allergens and fusion proteins..............28 3.1.5 Determination of protein concentration....................................................................29 3.1.6 Sodium dodecyl sulphate polyacrylamide gel electrophoresis ................................29 3.1.7 Reduction and alkylation .........................................................................................29 3.1.8 Limulus amebocyte lysate test ................................................................................29 3.1.9 Circular dichroism spectroscopy..............................................................................30 3.2 In vitro assays..........................................................................................................31 3.2.1 TLR5-activation assay .............................................................................................31 3.2.2 Mice .........................................................................................................................31 3.2.3 In vitro generation of bone marrow derived murine dendritic cells ..........................31 3.2.4 In vitro stimulation of bone marrow derived murine dendritic cells ..........................32 3.2.5 Flow cytometry and intracellular cytokine staining...................................................33 3.2.6 Cytokine ELISAs......................................................................................................34 3.2.7 Blocking of endocytosis ...........................................................................................34 3.2.8 Preparation of CD4 T cells ......................................................................................34 3.2.9 Neutralisation assay ................................................................................................35 3.3 Prophylactic and therapeutic intervention in the Ova-induced intestinal allergy model.......................................................................................................................36 3.3.1 The model of Ova-induced intestinal allergy............................................................36 3.3.2 Prophylactic vaccination ..........................................................................................36 3.3.3 Therapeutic vaccination...........................................................................................37
IV
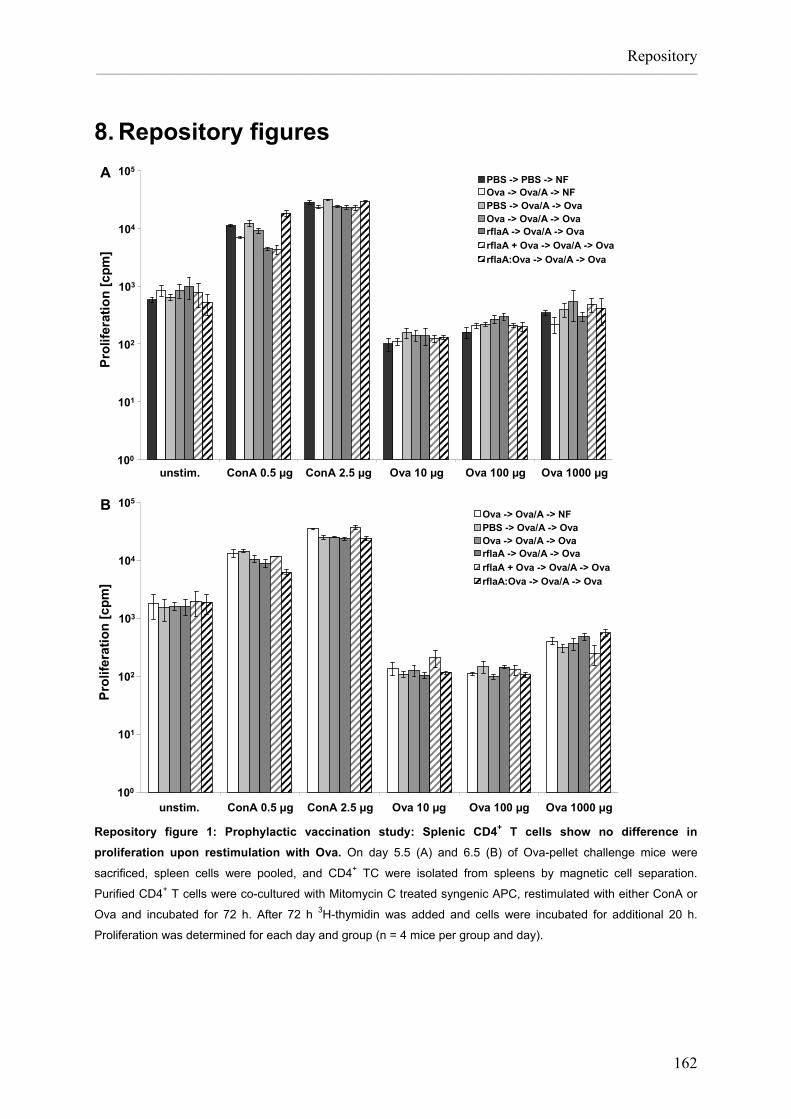
3.3.4 Proliferation assay ...................................................................................................38 3.3.4.1 Preparation of antigen presenting cells ...................................................................38 3.3.4.2 Preparation of CD4 T cells from spleens and mesenterial lymph nodes .................39 3.3.4.3 CD4 T cell proliferation assay..................................................................................39 3.3.5 Staining of regulatory T cells ...................................................................................40 3.3.6 Determination of Ova-specific IgG1, IgG2a and IgE titers.......................................40 3.3.7 Quantification of Ova-specific IgG1, IgG2a and IgE levels in mouse sera ..............41 3.3.8 Multiplex analysis of cytokine level in sera ..............................................................41 3.3.9 Determination of cytokine levels in intestinal homogenates ....................................42 3.4 Statistical analysis ...................................................................................................42 3.5 Oligonucleotides ......................................................................................................43 3.6 Chemicals................................................................................................................44 3.7 Consumables and Equipment .................................................................................46 3.8 Antibodies................................................................................................................50 3.9 Buffers .....................................................................................................................51 3.10 Culture media, cell lines, and animals .....................................................................52 4. Results .................................................................................................................54 4.1 Generation and quality assessment of recombinant proteins..................................54 4.1.1 cDNA-cloning and protein expression of rOva and rflaA:Ova..................................54 4.1.2 cDNA-cloning and protein expression of rflaA:Ara h 2 ............................................55 4.1.3 Generation of rflaA, rflaA:Pru p 3, rPru p 3 and rAra h 2 .........................................56 4.1.4 Recombinant proteins can be produced with high yield and purity using E. coli .....56 4.1.5 Flagellin fusion proteins aggregate due to intermolecular disulfide bonds ..............58 4.1.6 Recombinantly expressed proteins show a considerable amount of secondary structure...................................................................................................................59 4.1.7 rflaA and rflaA:Ova are able to bind and activate TLR5 ..........................................61 4.2 Immune modulating properties of rflaA and rflaA fusion proteins in vitro ................66 4.2.1 Generation and characterization of murine DC subsets..........................................66 4.2.2 rflaA:Ova potently activates dendritic cells ..............................................................68 4.2.3 ICS confirms mDC as the source of the secreted cytokines....................................73 4.2.4 rflaA:Ova mediated cell activation and cytokine secretion is independent of LPS ..75 4.2.5 mDC are activated by high doses of rflaA ...............................................................76 4.2.6 rflaA:Ova rapidly incduces long lasting cytokine secretion......................................77 4.2.7 rflaA:Ova induces a strong upregulation of TLR5....................................................79 4.2.8 rflaA:Ova mediated DC activation is similar to other TLR-ligands...........................80 4.2.9 rflaA:Ova represses IL-4 and IFN-γ secretion by Ova-specific T cells ....................84 4.2.10 rflaA:Ova does not induce Th17 development ........................................................86 4.2.11 rflaA:Ova-induced IL-10 secretion modulates T cell-dependent cytokine prod. ......88 4.2.12 rflaA:Ova mediated immune modulation is mouse strain independent....................89 4.2.13 flaA:Ova-induced cytokine secretion depends on TLR-signalling............................93 4.2.14 rflaA:Ova is also able to suppress Th1 and Th2 cytokine secretion from Th2- ........... biased T cells...........................................................................................................95 4.2.15 Blocking of endocytosis prevents rflaA:Ova-induced cytokine secretion.................96 4.2.16 Activation of mDC by flagellin:allergen fusion proteins............................................99 4.3 rflaA:Ova prevents intestinal allergy in mice..........................................................103 4.3.1 rflaA and rflaA:Ova activate DC and induce cytokine secretion in vivo .................103 4.3.2 Evaluation of rflaA and rflaA:Ova as prophylactic vaccines in the in vivo model ........ of Ova-induced intestinal allergy ...........................................................................106 4.3.2.1 Prophylactic vaccination with rflaA:Ova protects against intestinal allergy............106 4.3.2.2 rflaA:Ova-vaccination protects against weight loss and drop in body temperature110 4.3.2.3 Vaccination does not affect T cell-proliferation upon re-stimulation ......................112 4.3.2.4 Prophylactic vaccination does not influence Treg frequency...................................112 4.3.2.5 Flow cytometric analyses reveal a reduced T cell activation upon rflaA:Ova vaccination.............................................................................................................114 4.3.2.6 Prophylactic vaccination with rflaA:Ova suppresses Th2 cytokines in intestinal homogenates.........................................................................................................118
V
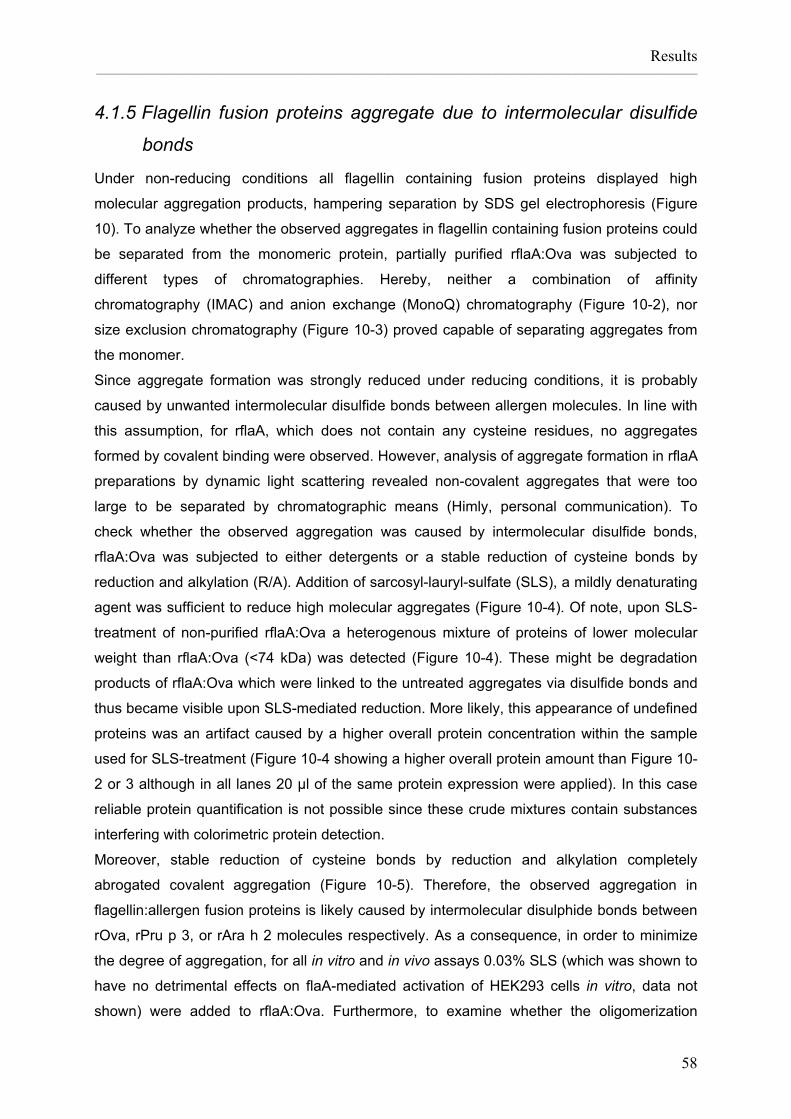
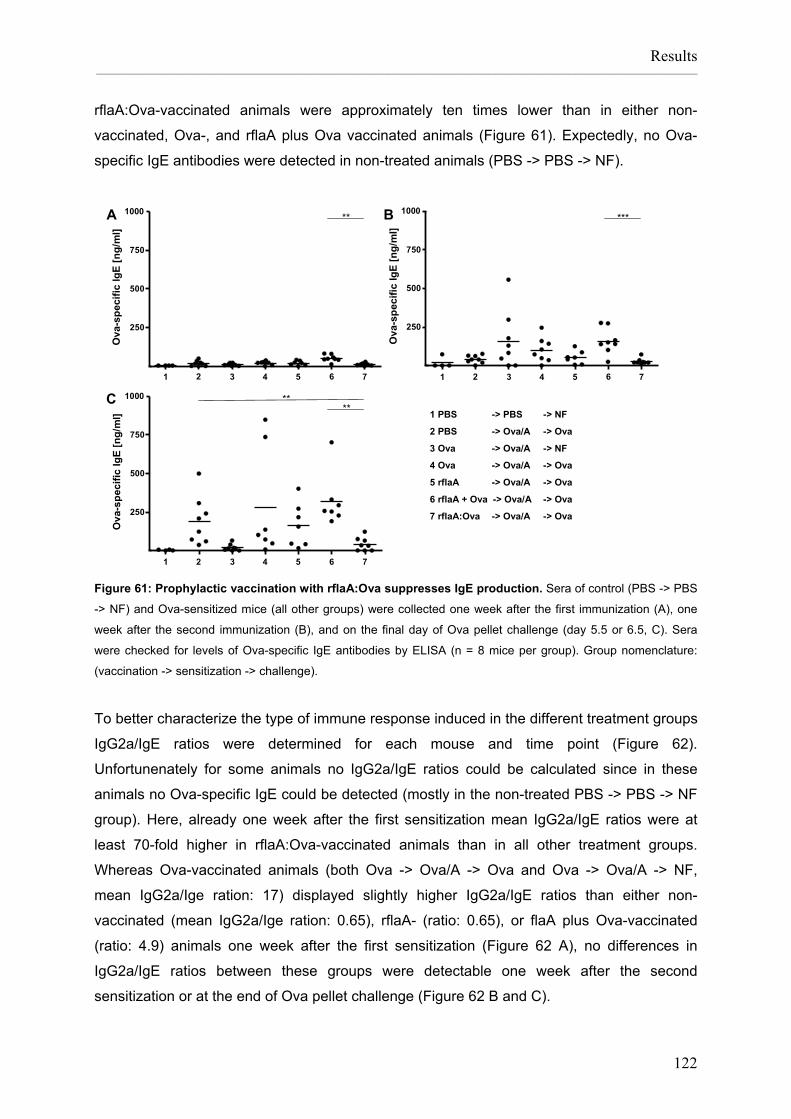
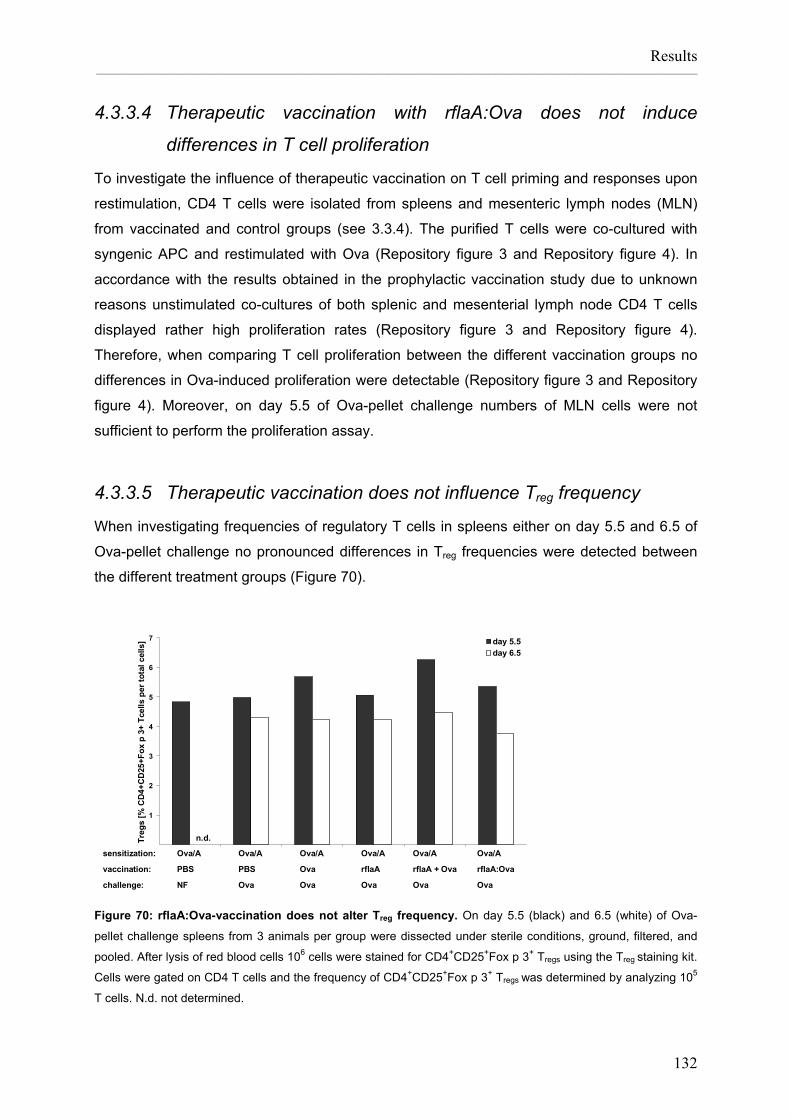
4.3.2.7 Prophylactic vaccination with rflaA:Ova induces Ova-specific IgG2a- and suppresses IgE production ....................................................................................120 4.3.2.8 Intranasal vaccination with rflaA:Ova protects against allergy...............................123 4.3.3 Evaluation of rflaA and rflaA:Ova in a therapeutic in vivo model of Ova-induced intestinal allergy.....................................................................................................127 4.3.3.1 Therapeutic vaccination with rflaA:Ova slightly reduces disease symptoms.........128 4.3.3.2 rflaA:Ova-vaccinated mice show a higher food uptake..........................................129 4.3.3.3 Therapeutic application of rflaA:Ova does not prevent weight loss or temperature drop .......................................................................................................................130 4.3.3.4 Therapeutic vaccination with rflaA:Ova does not influence T cell proliferation......132 4.3.3.5 Therapeutic vaccination does not influence Treg frequency ...................................132 4.3.3.6 Therapeutic vaccination with rflaA:Ova reduces T cell activation..........................134 4.3.3.7 Therapeutic vaccination is not sufficient to alter established Ova-specific ................. antibody responses ...............................................................................................136 5. Discussion ........................................................................................137 5.1 Flagellin-containing fusion proteins are potent immune modulators......................137 5.2 rflaA:Ova has potent immune modulating properties in vitro .................................138 5.2.1 In vitro rflaA:Ova suppresses Th1 and Th2 cytokine secretion while preserving ....... IL-2 production.......................................................................................................138 5.2.2 rflaA:Ova strongly induces IL-10 secretion from mDC...........................................138 5.2.3 Flagellin fusion proteins do not induce Th17 biased immune responses ..............140 5.2.4 Flagellin fusion proteins strongly activate murine mDC.........................................140 5.2.5 The immune modulating effects are independent of LPS contaminations.............142 5.2.6 Different flagellin fusion proteins display strong immunogenicity through .................. TLR-mediated signaling.........................................................................................143 5.2.7 Co-application of TLR-ligands and antigen results in altered protein processing ....... and presentation....................................................................................................144 5.2.8 Aggregation of flagellin fusion proteins likely influences immunogenicity..............145 5.2.9 Partially defolded rflaA:Ova also is a potent immune modulator ...........................146 5.2.10 The immune modulating properties of rflaA:Ova are probably mediated by a ........... four step mechanism .............................................................................................147 5.3 Evaluation of rflaA:Ova in vivo...............................................................................148 5.3.1 The model of Ova-induced intestinal allergy is suitable for vaccine testing...........148 5.3.2 Prophylactic vaccination with rflaA:Ova protects against intestinal allergy............149 5.3.3 Prophylactic vaccination prevents T cell activation ...............................................150 5.3.4 Prophylactic vaccination with rflaA:Ova enhances IgG2a and suppresses ................ IgE production .......................................................................................................151 5.3.5 Therapeutic vaccination with the different constructs is not able to reverse ............... an established allergic response ...........................................................................154 5.4 Flagellin-containing fusion proteins are promising vaccine candiddates for ............... the prevention of allergies .....................................................................................155 6. Summary ...........................................................................................................157 7. Outlook...............................................................................................................159 8. Repository figures .........................................................................................162 9. Curriculum vitae .............................................................................................176 10. Project related publication list........................................................179 11. References........................................................................................................181
VI
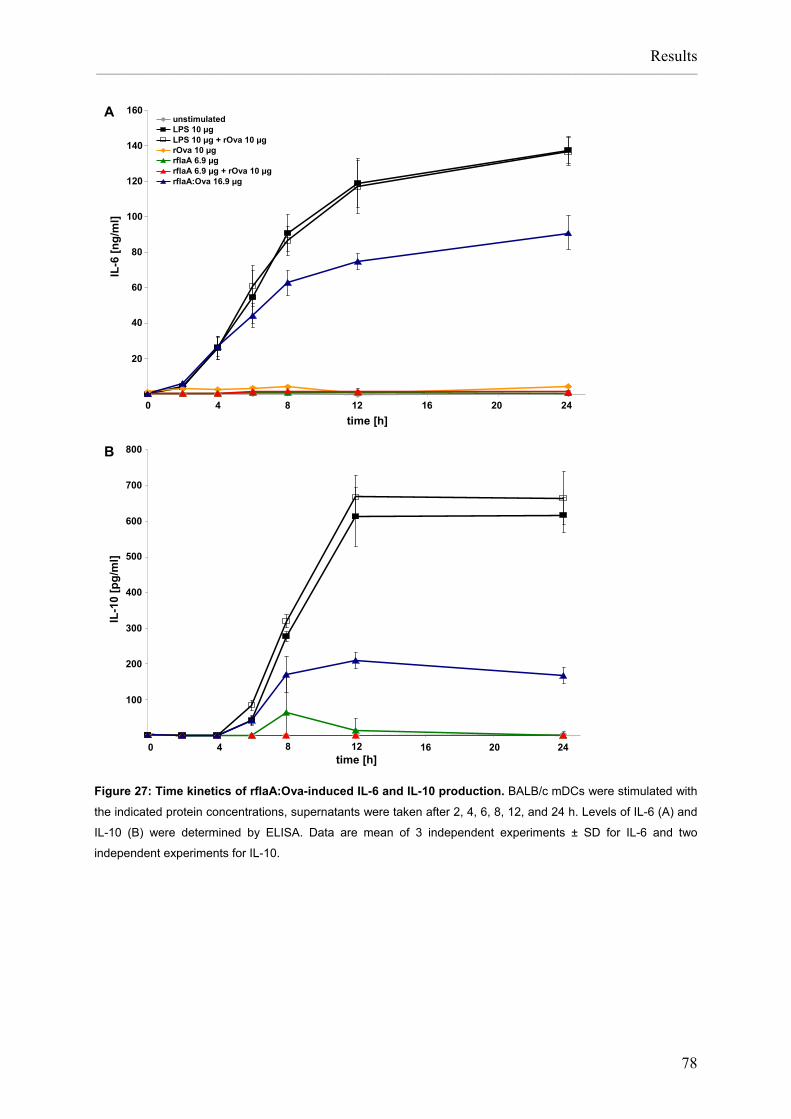
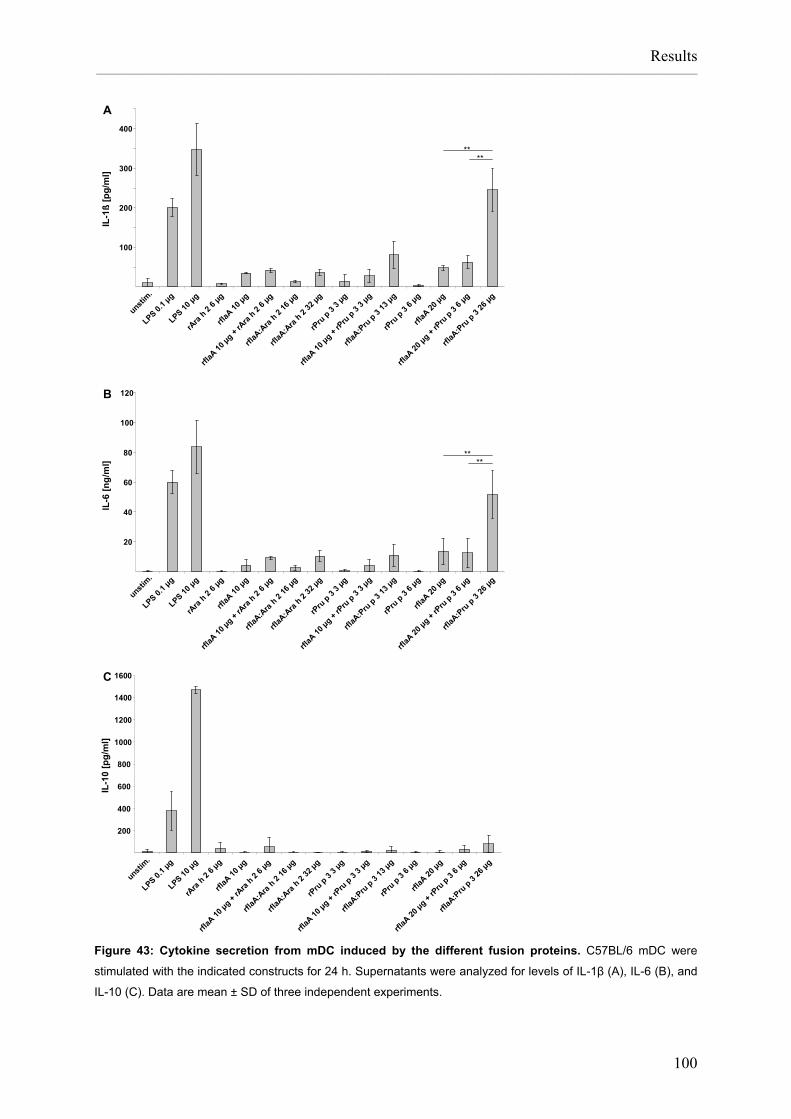
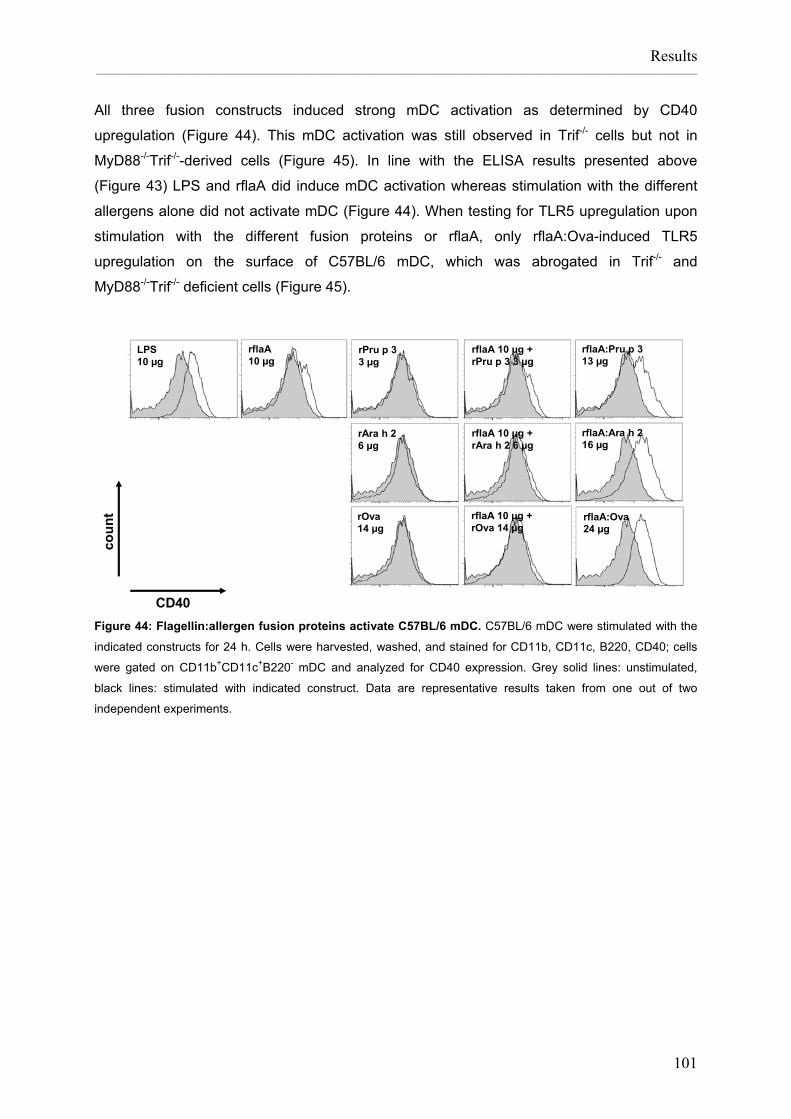
List of figures Figure 1: APC induce and control immune responses. ............................................................2 Figure 2: Pathomechanism of type I allergy. ............................................................................3 Figure 3: TLR-ligands in L. monocytogenes...........................................................................15 Figure 4: Preparation of Listeria monocytogenes flagellin A, control allergens and chimeric flagellin:allergen constructs......................................................................26 Figure 5: Vaccination scheme: prophylactic vaccination with rflaA:Ova. ...............................37 Figure 6: Vaccination protocol: therapeutic vaccination with rflaA:Ova..................................38 Figure 7: Cloning of Ova and flaA:Ova cDNA. .......................................................................55 Figure 8: Cloning of rflaA:Ara h 2 into pET15b.......................................................................56 Figure 9: Recombinant proteins are produced with high purity. .............................................57 Figure 10: Recombinant rflaA:Ova fusion protein shows high molecular aggregates ............... that can not be removed by chromatography but resolved by detergents .............. and reduction and alkylation.................................................................................59 Figure 11: Recombinant allergens, flagellin A and flagellin fusion proteins display a considerable amount of secondary structure. ......................................................60 Figure 12: Recombinant flagellin A and flaA:Ova fusion proteins are able to activate .............. murine and human TLR5......................................................................................62 Figure 13: Recombinant flagellin A, rflaA:Pru p 3, and rflaA:Ara h 2 are able to activate .......... murine and human TLR5......................................................................................63 Figure 14: Reduction and alkylation of flagellin A does not influence binding to TLR5..........64 Figure 15: Quality assessment of in vitro differentiated mDC. ...............................................66 Figure 16: Quality assessment of in vitro differentiated pDC. ................................................67 Figure 17: mDC preparations do not contain B and T cells....................................................68 Figure 18: rflaA:Ova fusion proteins strongly activate in vitro generated mDC......................69 Figure 19: rflaA:Ova fusion proteins activate in vitro generated pDC. ...................................70 Figure 20: rflaA:Ova induces IL-1β, IL-6, and IL-10 secretion from mDC. .............................72 Figure 21: rflaA:Ova and rflaA do not induce significant IL-12 production from mDC............73 Figure 22: Intracellular cytokine staining confirms mDC but not pDC as producers of ............. IL-10 upon stimulation with rflaA:Ova...................................................................74 Figure 23: mDC produce IL-6 upon stimulation with rflaA:Ova. .............................................74 Figure 24: LPS and rflaA-induced cytokine secretion. ...........................................................75 Figure 25: rflaA:Ova-induced IL-10 secretion is independent of LPS. ...................................76 Figure 26: High concentrations of rflaA induce cytokine secretion from mDC. ......................77 Figure 27: Time kinetics of rflaA:Ova-induced IL-6 and IL-10 production.. ............................78 Figure 28: rflaA:Ova induces TLR5 expression on in vitro generated mDC but not on pDC. 79 Figure 29: High concentrations of rflaA induce TLR5 upregulation on mDC..........................80 Figure 30: rflaA:Ova-induced cytokine secretion is similar to other TLR-ligands.. .................82 Figure 31: mDC activation capacitiy of rflaA:Ova is similar to other TLR-ligands. .................83 Figure 32: CD4 T cell purification by magnetic cell sorting. ...................................................84 Figure 33: rflaA:Ova fusion proteins induce IL-2 production and repress IL-4 and ................... IFN-γ production from naïve Ova-specific T cells.................................................86 Figure 34: rflaA:Ova stimulation does not induce Th17-biased immune responses in vitro...87 Figure 35: rflaA:Ova-induced IL-4 and IFN-γ is diminished by mDC-derived IL-10. ..............88 Figure 36: rflaA:Ova induces IL-6 and IL-10 secretion from C57BL/6 mDC.. ........................90 Figure 37: rflaA:Ova modulates OT-II T cell differentiation.. ..................................................91 Figure 38: Neutralization of rflaA:Ova-induced IL-10 secretion restores IFN-γ secretion ......... but does not affect IL-6 secretion. ........................................................................92 Figure 39: The immune modulating properties of rflaA:Ova dependent on TLR-signalling....94 Figure 40: rflaA:Ova suppresses cytokine secretion from in vivo primed TH2-biased T cells.96 Figure 41: rflaA:Ova-induced IL-6 secretion is dependent on endocytosis.. ..........................97 Figure 42: Chloroquine suppresses rflaA:Ova-induced IL-6 secretion from C57BL/6 mDC. .98 Figure 43: Cytokine secretion from mDC induced by the different fusion proteins.. ............100 Figure 44: Flagellin:allergen fusion proteins activate C57BL/6 mDC. ..................................101 Figure 45: Flagellin A and flagellin:allergen fusion proteins mediated activation of ..................
VII
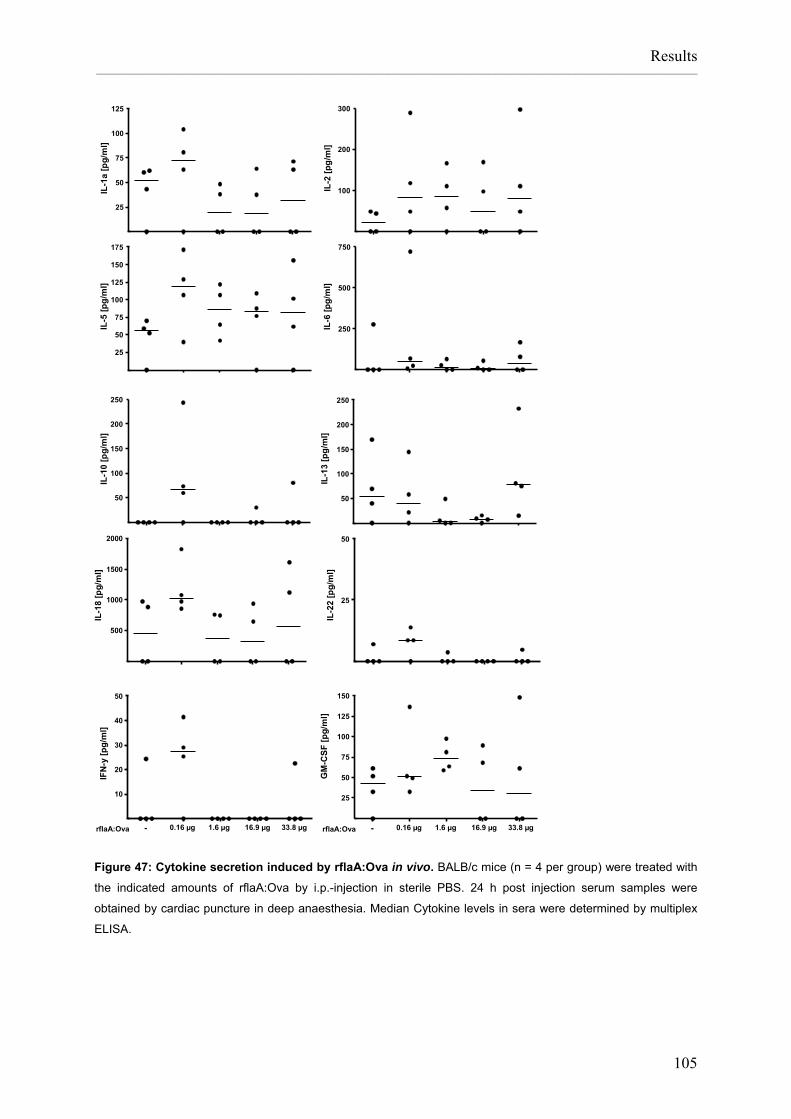
C57BL/6 mDC depends on TLR signalling.........................................................102 Figure 46: rflaA and rflaA:Ova induce splenic DC activation................................................104 Figure 47: Cytokine secretion induced by rflaA:Ova in vivo. ................................................105 Figure 48: rflaA:Ova-vaccinated animals show no signs of illness.......................................107 Figure 49: Symptom score used for evaluation of mouse disease symptoms. ....................107 Figure 50: Prophylactic vaccination with rflaA:Ova strongly reduces disease symptoms. ...108 Figure 51: rflaA:Ova-vaccinated mice show a higher food uptake than control groups.. .....109 Figure 52: Prophylactic vaccination with rflaA:Ova protects against weight loss. ................110 Figure 53: Prophylactic vaccination with rflaA:Ova protects against drop in ............................. core body temperature. ......................................................................................111 Figure 54: Prophylactic rflaA:Ova-vaccination does not increase MLN Treg frequencies. ....113 Figure 55: Prophylactic rflaA:Ova-vaccination does not increase splenic Treg frequencies..113 Figure 56: Prophylactic vaccination with rflaA:Ova prevents splenic TC activation. ............115 Figure 57: Vaccination with rflaA:Ova and rflaA + Ova prevents MLN TC activation...........117 Figure 58: Determination of cytokines in intestinal homogenates. .......................................119 Figure 59: Prophylactic vaccination with rflaA:Ova does not induce IgG1 production. ........120 Figure 60: Prophylactic vaccination with rflaA:Ova induces IgG2a production. ...................121 Figure 61: Prophylactic vaccination with rflaA:Ova suppresses IgE production...................122 Figure 62: Prophylactic vaccination with rflaA:Ova leads to an increased IgG2a/IgE ratio..123 Figure 63: Intranasal administration of rflaA:Ova prevents intestinal allergy. ......................125 Figure 64: Intranasal administration of rflaA:Ova induces Ova-specific IgG2a production.. 126 Figure 65: Intranasal administration of rflaA:Ova suppresses Ova-specific IgE production.127 Figure 66: rflaA:Ova vaccinated mice show a slightly reduced symptom score...................129 Figure 67: rflaA:Ova vaccinated mice show a constant food uptake....................................130 Figure 68: All therapeutic treatment groups display a similar weight loss............................131 Figure 69: rflaA:Ova vaccination does not protect against temperature drop. .....................131 Figure 70: rflaA:Ova-vaccination does not alter Treg frequency. ...........................................132 Figure 71: Vaccination reduces Treg frequency on day 5.5...................................................133 Figure 72: Therapeutic rflaA:Ova vaccination reduces splenic TC activation on day 5.5.. ..135 Figure 73: Therapeutic application of rflaA:Ova reduces TC activation in MLN...................136 Figure 74: The immune modulating properties of rflaA:Ova may be mediated by a ................. four step mechanism.. ........................................................................................148 Figure 75: Prophylactic vaccination with rflaA:Ova but not with rflaA, Ova, or .......................... rflaA + Ova prevents allergic sensitization. ........................................................153
VIII
List of abbreviations and acronyms abbreviation/acronym explanation ADAM33 disintegrin and metalloproteinase domain-containing protein 33 AHR airway hyperreactivity APC antigen presenting cell Ara h 2 Arachis hypogaea allergen number 2 B220 protein tyrosine phosphatase, receptor type, C bp base pair Baf A1 bafilomycin A1 Bet v 1 Betula verrucosa allergen number 1 BMDC bone marrow derived denditic cells CAPS N-cyclohexyl-3-aminopropanesulfonic acid cDNA complementary DNA CD cluster of differentiation CD-spectroscopy circular dichroism spectroscopy Ci curie CpG oligodeoxynucleotides containing CpG sequence motifs Cyt D cytochalasin D dATP deoxyadenosine triphosphate DC dendritic cell DMEM Dulbecco/Vogt modified Eagle's minimal essential medium DMSO dimethyl sulfoxide DNA deoxyribonucleic acid dNTP deoxyribonucleotide DTT dithiotreitol EAE experimental autoimmune encephalomyelitis ED50 half maximal release EDTA ethylenediaminetetraacetic acid EGFP enhanced green fluorescent protein ELISA enzyme-linked immunosorbent assay FACS fluorescence-activated cell sorting FceRI high-affinity IgE receptor, Fc epsilon RI FCS fetal calf serum Fel d 1 Felis domesticus allergen number 1 FITC fluorescein isothiocyanate flaA Listeria monocytogenes flagellin A fliC Salmonella typhimurium flagellin C Flt-3L Fms-related tyrosine kinase 3 ligand Fox p 3 forkhead box protein P3 GM-CSF granulocyte-macrophage colony-stimulating factor HEK293 human embryonic kidney cells 293 HEPES 4-(2-hydroxyethyl)-1-piperazineethanesulfonic acid HKL(M) heat killed Listeria monocytogenes IAA iodacetamide IFN-γ interferon gamma IgE immunoglobulin E IgG immunoglobulin G IL interleukin IL-4Ra interleukin 4 receptor antagonist IMAC immobilized metal ion affinity chromatography IPAF ICE protease-activating factor IPEX immunodysregulation polyendocrinopathy enteropathy X-linked
syndrome
IX
IPTG isopropyl β-D-1-thiogalactopyranoside ISS-ODN CpG-containing oligodeoxynucleotides ITIM immunoreceptor tyrosine-based inhibition motif KLH keyhole limpet hemocyanin L.m. Listeria monocytogenes LB-medium lysogeny broth medium LCMV lymphocytic choriomeningitis virus LPS lipopolysaccharides LRR leucin rich repeat mDC myeloid dendritic cell M2e ectodomain of the influenza matrix protein 2 MACS magnetic cell separation MHC major histocompatibility complex MLN mesenteric lymph nodes MOPS 3-(N-morpholino)propanesulfonic acid MPL® monophosphoryl lilpid A MVA modified vaccinia virus ankara MVA-Ova modified vaccinia virus Ankara expressing Ova MyD88 myeloid differentiation primary response gene (88) Naip5/Birc1e neuronal apoptose inhibitory protein NF normal food Ni-NTA nickel nitrilotriacetic acid NK cell natural killer cell NO nitric oxide NOD nucleotide-binding domain NP nuclear protein OD optical density OprI outer membrane lipoprotein from Pseudomonas sp. Ova ovalbumin PAMP pathogen associated molecular pattern PBS phosphate bufferd saline PBST PBS Tween PCR polymerase chain reaction pDC plasmacytoid dendritic cell PE phycoerythrin PLA2 phospholipases A2 PLP-1 encephalitogenic proteolipid protein 1 poly I:C polyinosinic:polycytidylic acid PRR pattern recognition receptor Pru p 3 Prunus persica allergen number 3 R848 resiquimod rflaA recombinant L. monocytogenes flagellin A rflaA:Ara h 2 fusion protein containing flaA and Ara h 2 rflaA:Ova fusion protein containing flaA and Ova rflaA:Pru p 3 fusion protein containing flaA and Pru p 3 RNA ribonucleic acid RPMI Roswell Park Memorial Institute medium SDS sodium dodecyl sulfate SDS-PAGE sodium dodecyl sulphate polyacrylamide gel electrophoresis SEC size exclusion chromatography SipC Salmonella enterica pathogenicity island 1 effector protein SIT specific immunotherapy S-layer surface layer SLS sarcosyl lauryl sulfate
X
STFΔ2 Salmonella typhimurium flagellin C without hypervariable region
ß-ME beta mercapto ethanol STAT6 signal transducer and activator of transcription 6 TGF-ß transforming growth factor beta Th (1/2/17) helper (1/2/17) T cell TIR toll/IL-1 receptor TLR toll-like receptor TMB 3,3’,5,5’-tetramethylbenzidine TNF-α Tumor necrosis factor alpha Tr1 regulatory T cell subset 1 Treg regulatory T cell Trif TIR-domain-containing adapter-inducing interferon-β V Volt
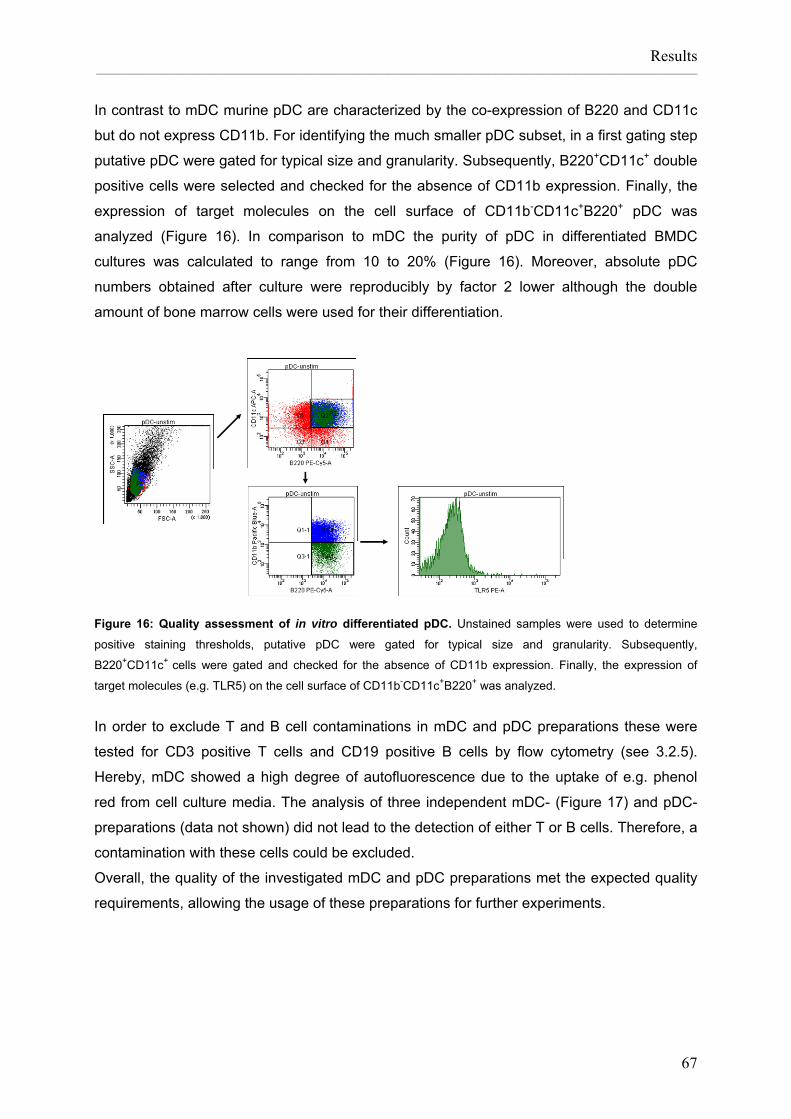
Heidelberg) and phycoerythrin-Cy5 conjugated anti-mouse B220 (BD Biosciences) mAbs to
gate mDC and pDC populations. Appropriate isotype controls for all antibodies were
performed. FITC or PE intensity of CD11b+CD11c+B220- cells (mDC), or CD11b-
CD11c+B220+ (pDC) was measured by flow cytometry, using a BD LSR II cytometer (BD
Biosciences). Data were analysed using FlowJo V.7.2.4 (Treestar Inc., USA). For staining of
cell surface markers approximately 6.4x10⁵ cells were stained in a volume of 50 µl FACS-
buffer (see table 9) with the indicated amount of antibodies (see table 8) for 20 minutes at
4°C in the dark, washed with 1 ml FACS-buffer, taken up in 250 to 400 µl FACS-buffer, and
fixed using 50 µl 4% paraformaldehyde (Sigma). For determination of DC purity mDC and
pDC preparations were stained with FITC-conjugated anti-mouse CD3 and CD19 mAbs
(both Southern Biotech, USA, see table 8). Stained cells were stored in the fridge until
measurement.
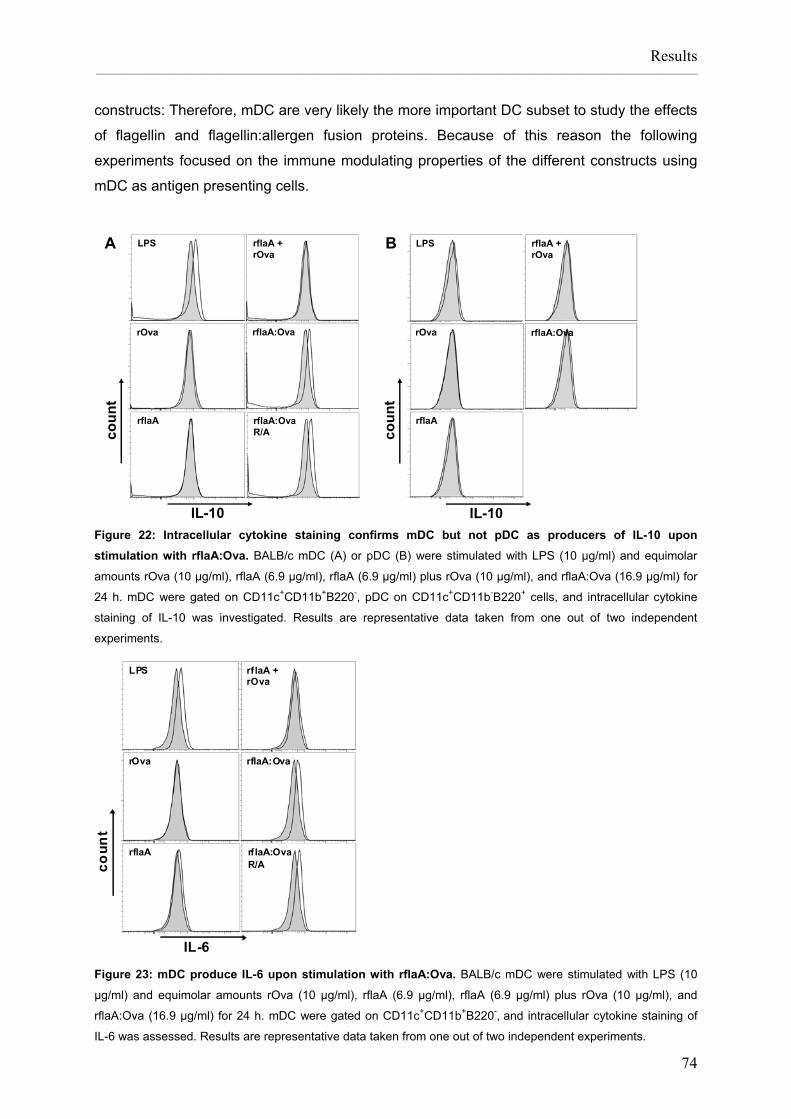
For intracellular cytokine staining mDC or pDC were stimulated with the different constructs
for 22 h and subsequently 4 h in the presence of 1 µl/ml Golgi Plug (BD Biosciences). Cells
were harvested, washed in FACS-buffer and incubated with 1 µg Fc-block (CD16/CD32, Fcγ
III/II receptor, BD Biosciences) for 15 minutes at 4°C. In order to gate for mDC and pDC
populations, cells were stained for Pacific Blue-conjugated anti-mouse CD11b (Invitrogen),
allophycocyanin-conjugated anti-mouse CD11c (BD Biosciences) and phycoerythrin-Cy5
conjugated anti-mouse B220 (BD Biosciences) mAbs. Subsequently, cells were fixed and
permeabilized in 250 µl fixation/permeabilization solution (BD Biosciences) at 4°C in the dark
over night. Cells were washed once using 1 ml perm/wash solution (BD Biosciences).
Intercellular cytokines IL-6 and IL-10 were stained using PE-conjugated antibodies (both
eBioscience) in volume of 50 µl perm/wash solution. The staining was performed for 1.5 to 2
h at 4°C in the dark. Subsequently, cells were washed in perm/wash solution and taken und
in 300 µl FACS-buffer. PE-intensity of CD11b+CD11c+B220- cells (mDC), or CD11b-
CD11c+B220+ (pDC) was measured by flow cytometry, using a BD LSR II cytometer (BD
Bioscience). Data were analysed using FlowJo V.7.2.4 (Treestar Inc.).
For analysis of CD4+ T cell purity 0.5x10⁵ total cells were stained using 5 µl FITC-conjugated
anti mouse CD4 antibody (Miltenyi Biotech, Bergisch-Gladbach), according to the procedure
described above. Used amounts for all antibodies are indicated in table 8.
Material and methods _________________________________________________________________________________________________________________
34
3.2.6 Cytokine ELISAs
Cytokines levels in the culture supernatant were measured by ELISA. The levels of human
IL-8, and murine cytokines IL-1β, IL-2, IL-4, IL-5, IL-6, IL-10, IL-12p70, and IFN-γ were
determined using the BD OptEIA™ ELISA Sets (BD Biosciences) according to the
manufacturers’ recommendations. The levels of murine IL-2 were measured using an anti-
mouse IL-2 antibody (clone JES6-1A12) in combination with a biotin anti-mouse IL-2
antibody (clone JES6-5H4), both used at a concentration of 0.5 µg/ml (both Biolegend, The
Netherlands). The levels of murine TGF-ß, IL-17A, and IL-23 were measured using Ready-
SET-GO! ELISA kits (eBiosciences) following the manufacturers recommendations. Cytokine
concentrations in supernatants were either measured undiluted (for determination of TGF-β,
IL-1β, IL-4, IL-10, IL-12p70, IL-17, and IL-23), diluted 1:80 to 1:200 (IL-6 and IL-8), 1:5 to
1:35 (IFN-γ), and 1:2 to 1:4 (IL-2). For dilution PBS with 10% FCS (Biochrom) was used.
Absorbance (A =450 nm) was analyzed using a SpectraMAX340PC (Molecular Devices,
USA) and data were processed using Excel (Microsoft, USA).
3.2.7 Blocking of endocytosis
To investigate the influence of endocytosis on cytokine secretion, BALB/c mDC (3.2x10⁵
mDC/ml) in 24-well plates (Nunc) were preincubated for one hour with the inhibitor of actin
polymerization cytochalasin D (5 µg/ml) and the inhibitor of lysosmal acidification bafilomycin
A1 (100 ng/ml) either provided separate or together (both Sigma), both dissolved in DSMO
(Fluka, Neu-Ulm). Appropriate amounts of DMSO were used as controls. Subsequently, cells
were stimulated with LPS (10 µg/ml), rflaA (6.9 µg/ml and 17.25 µg/ml), rflaA (6.9 µg/ml and
17.25 µg/ml) plus rOva (10 µg/ml and 25 µg/ml), and rflaA:Ova (16.9 µg/ml). Supernatants
were collected 24 h post stimulation, stored at -20°C, and checked for the production of IL-6
and IL-10 by ELISA (see 3.2.6).
Experiments were repeated using C57BL/6 mDC (3.2x10⁵ mDC/ml), additionally using the
inhibitor of endocytosis chloroquine (Sigma) in the concentrations 0.01, 0.1 and 1 mM.
3.2.8 Preparation of CD4 T cells
Splenic CD4+ T cells were isolated from Ova-immunized BALB/c, DO11.10 (BALB/c) and
OT-II (C57BL/6) mice using the CD4 T Cell Isolation Kit from Miltenyi Biotec. CD4 T cell
purity was checked by FITC-conjugated anti mouse CD4 antibody (Miltenyi Biotech, see
3.2.5) and routinely exceeded 95% (see 4.2.9). T cells (8x10⁵ cells/ml) were co-cultured with
BALB/c, C57BL/6, MyD88-/- (C57BL/6), Trif-/- (C57BL/6), and MyD88-/-Trif-/- (C57BL/6)
(3.2x10⁵ cells/ml) in 24-well plates (Nunc), and stimulated with equimolar amounts of rOva,
Material and methods _________________________________________________________________________________________________________________
35
rflaA, rflaA plus rOva, rflaA:Ova, rflaA:Ova (R/A), and LPS for 24 to 72 h. Supernatants were
stored at -20°C and concentrations of IL-2, IL-4, IL-5, IL-6, IL-10, IL-12, IL-17A, IL-23, and
IFN-γ in the culture supernatants were determined by ELISA (see 3.2.6).
3.2.9 Neutralisation assay
In order to neutralize rflaA:Ova-induced IL-10 production by BALB/c and C57BL/6 mDC
3.2x10⁵ cells/ml were seeded in 24-well plates (Nunc), stimulated with rflaA:Ova (16.9 µg/ml),
and co-cultured with 8x10⁵ DO11.10 or OT-II CD4+ T cells/ml, respectively in the presence of
either recombinant mIL-10 (2 ng/ml) or blocking anti-mIL-10 antibody (0.1 to 10 µg/ml, both
eBiosciences) for 72 h. Supernatants were stored at -20°C, and checked for the induction of
IL-4, IL-10, and IFN-γ by ELISA (see 3.2.6).
Material and methods _________________________________________________________________________________________________________________
36
3.3 Prophylactic and therapeutic intervention in the Ova-
induced intestinal allergy model
3.3.1 The model of Ova-induced intestinal allergy
To investigate the immune modulating properties of the different constructs in vivo a model of
severe Ova-induced intestinal allergy was used. In this model BALB/c mice are sensitized
with Ova (50 µg Ova, Grade V, Sigma) adsorbed to aluminium hydroxide (1 mg, Pierce,
absorbed for 30 minutes, RT, on a rollshaker at medium speed) by two i.p.-injections two
weeks apart. Subsequently mice are continuously challenged for 5.5 to 8 days with Ova-
containing food pellets (Ssniff, Soest, according to Burggraf, in revision). In Ova-sensitized
mice Ova-pellet challenge results in disease symptoms such as ruffed fur, reduced mobility,
a drop in core body temperature, soft faeces, and a distinct weight loss (Burggraf et al., in
revision). These symptoms are most pronounced on days 4.5 to 7 of Ova-pellet challenge
which characterize the most acute phase of the disease.
This model was applied to test whether prophylactic and therapeutic vaccination with either
Ova, rflaA, flaA plus Ova, or the rflaA:Ova fusion protein was sufficient to prevent or treat the
allergic response, respectively.
3.3.2 Prophylactic vaccination
For prophylactic vaccination, BALB/c mice were treated with equimolar amounts of rflaA (6.9
µg), Ova (10 µg, Grade V, Sigma), rflaA (6.9 µg) plus Ova (10 µg), rflaA:Ova (16.9 µg), or
PBS applied twice by i.p.-injection in 1 week intervals, or with 16.9 µg rflaA:Ova applied three
times i.n. under ketamin/rompun anaesthesia in 3 days intervals. All i.p.-injections were
performed in a total volume of 200 µl sterile PBS, i.n.-application in a total volume of 30 µl
sterile PBS (Figure 5).
The model of Ova-induced intestinal allergy was used according to Burggraf et al. (see
3.3.1). One week after the last vaccination, mice were sensitized to Ova twice in two week
intervals by i.p.-injection of 50 µg Ova (Grade V, Sigma) absorbed in 1 mg aluminium-
hydroxide (Pierce) in 200 µl sterile PBS (30 minutes incubation, RT, on a rollshaker at
medium speed). Two weeks after the second sensitization all animals underwent continuous
challenge for 5.5 to 8 days with either Ova-containing food pellets (Ssniff) or normal food for
control groups (see table 1). Blood samples were collected 1 week after each sensitization
(days 7 and 21) from the tail vein and after Ova-pellet challenge by cardiac puncture under
deep ketamin/rompun anaesthesia.
Material and methods _________________________________________________________________________________________________________________
37
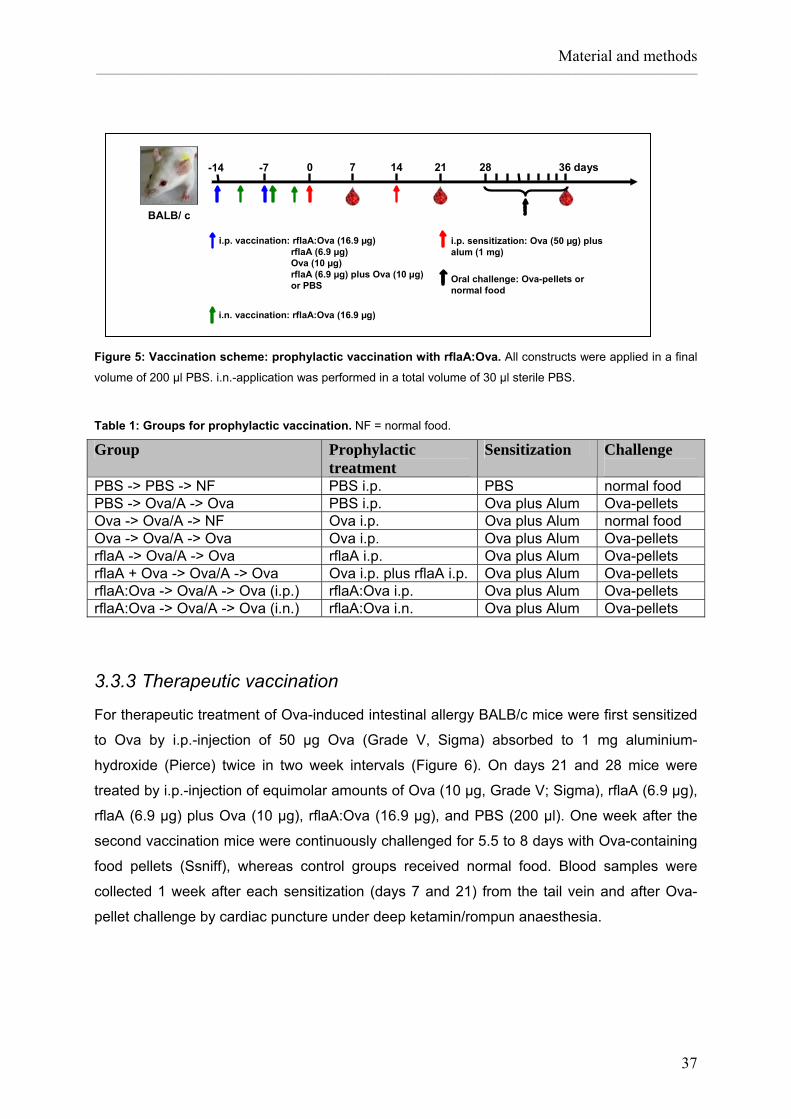
i.p. vaccination: rflaA:Ova (16.9 µg)rflaA (6.9 µg)Ova (10 µg)rflaA (6.9 µg) plus Ova (10 µg) or PBS
i.p. sensitization: Ova (50 µg) plus alum (1 mg)
Oral challenge: Ova-pellets ornormal food
BALB/ c
-7 -14 0 7 14 21 28 36 days
i.n. vaccination: rflaA:Ova (16.9 µg)
Figure 5: Vaccination scheme: prophylactic vaccination with rflaA:Ova. All constructs were applied in a final
volume of 200 µl PBS. i.n.-application was performed in a total volume of 30 µl sterile PBS.
Table 1: Groups for prophylactic vaccination. NF = normal food.
Group Prophylactic treatment
Sensitization Challenge
PBS -> PBS -> NF PBS i.p. PBS normal food PBS -> Ova/A -> Ova PBS i.p. Ova plus Alum Ova-pellets Ova -> Ova/A -> NF Ova i.p. Ova plus Alum normal food Ova -> Ova/A -> Ova Ova i.p. Ova plus Alum Ova-pellets rflaA -> Ova/A -> Ova rflaA i.p. Ova plus Alum Ova-pellets rflaA + Ova -> Ova/A -> Ova Ova i.p. plus rflaA i.p. Ova plus Alum Ova-pellets rflaA:Ova -> Ova/A -> Ova (i.p.) rflaA:Ova i.p. Ova plus Alum Ova-pellets rflaA:Ova -> Ova/A -> Ova (i.n.) rflaA:Ova i.n. Ova plus Alum Ova-pellets
3.3.3 Therapeutic vaccination
For therapeutic treatment of Ova-induced intestinal allergy BALB/c mice were first sensitized
to Ova by i.p.-injection of 50 µg Ova (Grade V, Sigma) absorbed to 1 mg aluminium-
hydroxide (Pierce) twice in two week intervals (Figure 6). On days 21 and 28 mice were
treated by i.p.-injection of equimolar amounts of Ova (10 µg, Grade V; Sigma), rflaA (6.9 µg),
rflaA (6.9 µg) plus Ova (10 µg), rflaA:Ova (16.9 µg), and PBS (200 µl). One week after the
second vaccination mice were continuously challenged for 5.5 to 8 days with Ova-containing
food pellets (Ssniff), whereas control groups received normal food. Blood samples were
collected 1 week after each sensitization (days 7 and 21) from the tail vein and after Ova-
pellet challenge by cardiac puncture under deep ketamin/rompun anaesthesia.
Material and methods _________________________________________________________________________________________________________________
38
i.p. vaccination: rflaA:Ova (16.9 µg), rflaA (6.9 µg), Ova (10 µg), rflaA (6.9 µg) plus Ova (10 µg) or PBS
i.p. sensitization: Ova (50 µg) plus alum (1 mg)
Oral challenge: Ova-pellets ornormal food
BALB/ c
7 0 14 21 28 35 43 days
Figure 6: Vaccination protocol: therapeutic vaccination with rflaA:Ova. All constructs were applied in a total
volume of 200 µl sterile PBS.
Table 2: Groups for therapeutic vaccination. NF = normal food.
Group Sensitization Therapeutic treatment
Challenge
PBS -> PBS -> NF PBS PBS i.p. normal food PBS -> Ova/A -> Ova Ova plus Alum PBS i.p. Ova-pellets Ova -> Ova/A -> Ova Ova plus Alum Ova i.p. Ova-pellets rflaA -> Ova/A -> Ova Ova plus Alum rflaA i.p. Ova-pellets rflaA + rOva -> Ova/A -> Ova Ova plus Alum Ova i.p. plus rflaA i.p. Ova-pellets rflaA:Ova i.p. -> Ova/A -> Ova Ova plus Alum rflaA:Ova i.p. Ova-pellets
3.3.4 Proliferation assay
3.3.4.1 Preparation of antigen presenting cells
Antigen presenting cells were prepared from untreated BALB/c mice. Therefore, spleens
were removed under sterile conditions and placed in 5 ml washing buffer (see table 10) in a 6
cm petri dish. Spleens were milled with the plunger of a syringe to disrupt spleens.
Subsequently, 5 ml washing buffer containing the cells was filtered through a 70 µm cell
strainer (BD Biosciences,) into a 50 ml falcon tube (BD Biosciences). Cells were collected by
centrifugation (5 minutes, 226 g, 4°C) and transferred to a 15 ml Falcon tube (BD
Biosciences), washed twice by adding 12 ml washing medium and centrifugation (RT, 5
minutes, 226 g), taken up in 5 ml washing medium, and the cell number was determined. To
disrupt APC-proliferation, 1x10⁸ cells/ml were treated for 30 minutes with 50 µg/ml
mytomycin C (Sigma) at 37°C. Subsequently, mitomycin C treated cells were washed three
times with 10 ml washing medium (5 minutes, 226 g, 4°C), the cell pellet was resuspended in
5 ml proliferation medium (see tabe 10), cell number was determined, and adjusted to 8*106
cells/ml. APC were kept on ice until needed.
Material and methods _________________________________________________________________________________________________________________
39
3.3.4.2 Preparation of CD4 T cells from spleens and mesenterial lymph
nodes
Spleens and mesenterial lymph nodes (MLN) were removed under sterile conditions and
treated as described in 2.3.4.1. Red blood cells were lysed by adding 5 ml red blood cell lysis
buffer (Invitrogen) and incubation for 1 to 2 minutes at room temperature. The reaction was
stopped by adding 10 ml washing buffer (see table 10) and cells were washed twice by
adding 12 ml washing buffer and centrifugation (226 g, 5 minutes, RT). For magnetic cell
sorting cells were resuspended in 5 ml MACS-buffer (see table 10) and cell number was
determined. Briefly, CD4+ T cells were isolated from 4x10⁷ spleen/MLN cells using the CD4 T
Cell Isolation Kit according to the manufacturers’ recommendations (Miltenyi Biotec). CD4+ T
cell purity was checked by flow cytometry (see 3.2.5), and routinely exceeded 95%. MACS-
sorted CD4+ T cells were collected by centrifugation and taken up in proliferation medium
(see table 10). CD4 T cell concentration was adjusted to 2x10⁶ cells/ml using proliferation
medium.
3.3.4.3 CD4 T cell proliferation assay
For proliferation assays 1x10⁵ CD4+ T cells and 4x10⁵ APCs were co-cultured in 96-well
plates (Nunc) in a volume of 100 µl proliferation medium (containing 10% FCS) and
stimulated with 100 µl of the appropriate antigen (diluted in proliferation medium without
FCS) in triplicates. Concanavalin A (Sigma) was applied as positive control. After cultivating
cells for 72 h (37°C, 5% CO2, 95% humidity) 100 µl of the supernatant from each well were
transferred to a fresh 96-well plate (Nunc) and stored at -20°C for cytokine measurements by
ELISA (see 3.2.6). To the remaining cells 0.5 µCi of 3[H]-thymidine (10 µl of a 50 µCi/ml 3[H]-
thymidine solution in proliferation medium without FCS, GE Healthcare) were added and
cells were incubated for another 20 h (37°C, 5% CO2, 95% humidity). Plates were stored at
-20°C until measurement of 3[H]-thymidine incorporation. Therefore, plates containing 3[H]-
thymidine labelled cells were thawed and cells were transferred to “printed filtermats”
(Wallac, Finland) using a harvester (Innotech, Switzerland). Medium was discarded.
Membranes were washed with water, followed by ethanol and subsequently dried at room
temperature for 8 h. Membranes were covered with “melt-on wax scintillator sheets” (Wallac)
and “heat sealing paper” (Wallac) and shrink-wrapped in sample bags (Wallac).
Measurement of thymidine uptake was performed using a 1450 Microbeta Liquid Scintillation
and Luminescence counter (Perkin Elmer, Rodgau). Data were analyzed using Excel
(Microsoft).
Material and methods _________________________________________________________________________________________________________________
40
Levels of IL-4, IL-10, and IFN-γ in the supernatants were determined using the BD
Biosciences ELISA kits (BD Biosciences).
3.3.5 Staining of regulatory T cells
For staining of regulatory T cells in spleens and MLN of vaccinated and control mice the
Mouse Regulatory T Cell Staining Kit was used according to the manufacturers’
recommendations (eBiosciences). 1x10⁶ Splenocytes or MLN cells were stained using FITC-
conjugated anti-mouse CD4, APC-conjugated anti-mouse CD25, and PE-conjugated anti-
mouse Fox p 3 mAbs (antibody amounts used are indicated in table 8). 105 CD4 positive T
cells were recorded, and the number of CD4+CD25+Fox p 3+ Treg cells was compared
between the different treatment groups and untreated mice as control.
3.3.6 Determination of Ova-specific IgG1, IgG2a and IgE titers
For determination of Ova-specific IgE, IgG1 and IgG2a titers 96-well Maxisorp plates (Nunc)
were coated with 50 µl per well of a 100 µg/ml Ova (Grade V, Sigma) in coating buffer (50
mM Na2Co3, pH 9.6) over night at 4°C. Subsequently, plates were washed three times with
200 µl/well PBST 0.05% and blocked with 200 µl/well 2% BSA in PBS for 1 h at room
temperature. After another washing step (three times with 200 µl/well PBST 0.05%), 50 µl of
the diluted serum samples were added. For determination of IgG1 and IgG2a levels serum
samples (1:100) were used for seven serial 1:10 dilutions (1:103 – 1:109). For measuring
Ova-specific IgE-levels sera were diluted (1:10 and 1:50) and used for six serial 1:10
dilutions (1:5x10² – 1:5x10⁷). After incubation over night at 4°C plates were washed and
incubated for 1 h with 50 µl/well of the respective Ig-isotype specific antibody (IgG1: rabbit
anti mouse IgG1-HRP, IgG2a: rabbit anti mouse IgG2a-HRP, both Zytomed, Berlin, diluted
1:4000 in PBST 0.05% plus 1% BSA; IgE: biotin anti mouse IgE, BD Biosciences, diluted
1:1000 in PBST 0.05% plus 1% BSA). For determination of IgE titers plates were washed
once more and incubated with 50 µl/well streptavidin-HRP (BD Biosciences, diluted 1:2000 in
PBST 0.05% plus 1% BSA) for 30 minutes at room temperature. Subsequently, plates were
washed six times with 200 µl/well PBST 0.05% and 100 µl/well TMB substrate solution
(0.525 mM TMB, 0.01% H2O2 dissolved in 0.21 M potassium citrate buffer pH 3.95) were
added and incubated for up to 30 minutes. The reaction was stopped by addition of 50 µl/well
25% hydrogen peroxide and absorbance (A=450 nm) was analyzed using a
SpectraMAX340PC (Molecular Devices). Data were analyzed using Excel (Microsoft).
Material and methods _________________________________________________________________________________________________________________
41
3.3.7 Quantification of Ova-specific IgG1, IgG2a and IgE levels in mouse
sera
For absolute quantification of IgG1, IgG2a and IgE in mouse sera ELISA plates (Greiner Bio-
One, Solingen-Wald) were coated with 5 µg/well Ova (Ova Grade V, Sigma,) in coating
buffer (50 mM NaCO3, pH 9.6) over night at 4°C. For IgE-plates standards were coated with
50 µl purified rat anti mouse IgE (clone: R35-72, BD Biosciences) diluted 1:1000 in coating
buffer over night at 4°C. On the next day plates were washed three times with 200 µl/well
PBST 0.05% and blocked for at least 1 h using 130 µl PBS 2% BSA (Sigma). For preparation
of IgE-standards monoclonal anti-dinitrophenyl antibody (clone: SPE-7, Sigma) was diluted
1:1000 in PBS 10% FCS and subsequently nine serial 1:2 dilutions were performed. For
IgG1 and IgG2a standards monoclonal anti-Ova (clone: A6075, conc: 1mg/ml, Sigma) was
first diluted 1:250.000 before nine serial 1:2 dilutions were performed. Serum samples were
diluted 1:200 to 1:800 (IgE, IgG2a) or 1:24.000 to 1:32.000 (IgG1) in PBS 10% FCS. 50 µl of
sample and standards were incubated at 4°C over night (IgE) or for 2 h at room temperature
(IgG1, IgG2a). Subsequently, plates were washed three times with 200 µl/well PBST 0.05%
and detected with 50 µl secondary antibody diluted in PBS 10% FCS (IgE: biotin rat anti
protease inhibitor Roche, Grenzach-Wyhlen proteinase K Sigma‐Aldrich recombinant mouse IL-10 (rmIL-10) eBiosciences, USA Roswell Park Memorial Institute medium 1640 (RPMI 1640)
PCR Purification Kit Roche, Mannheim PCR®4 TOPO cloning kit Invitrogen, Darmstadt pET15b Novagen, Darmstadt pET32a Novagen, Darmstadt pGEM® T easy Promega, Mannheim quick ligation kit New England Biolabs, Frankfurt plasmid Maxi / Mini Kit Quiagen, Hilden Platinum Taq Polymerase Invitrogen, Darmstadt Ponceau S staining Fluka, Neu‐Ulm Protein Refolding Kit Novagen, Darmstadt protein Marker: SeaBlue Plus 2, prestained
Invitrogen, Darmstadt
red blood cell lysis buffer Sigma‐Aldrich, Steinheim Invitrogen, Darmstadt
restriction enzyme sets New England Biolabs, Frankfurt spin-X zentrifugation system Vitaris, Baar T4‐DNA‐ligase set New England Biolabs, Frankfurt
TMB substrat reagent set BD Biosciences, Heidelberg
Material and methods _________________________________________________________________________________________________________________
50
3.8 Antibodies
Table 8: Antibodies used for flow cytometry and ELISA. A.H. = armeniam hamster.
antibody isotype label µg/staining or µg/ml
distributor
rat anti mouse B220 IgG2a, κ PeCy5 0.1 BD Biosciences rat anti mouse CD3 IgG2b κ FITC 0.1 Southern Biotech rat anti mouse CD4 IgG2a κ APC 0.2 eBioscience rat anti mouse CD4 IgG2a κ FITC 0.25 eBioscience rat anti mouse CD4 IgG2b FITC 5 µl (conc.
unknown) Miltenyi Biotech
hamster anti mouse CD11c IgG1 λ2 APC 0.02 BD Biosciences rat anti mouse CD11b IgG2b PB 0.1 Invitrogen rat anti mouse CD16/32 IgG2b κ none 1 BD Biosciences rat anti mouse CD19 IgG2a κ FITC 0.1 Southern Biotech rat anti mouse CD25 IgG1, λ APC 0.12 eBioscience rat anti mouse CD40 IgG2a, κ PE 0.5 eBioscience A.H. anti mouse CD40 IgM, κ FITC 0.25 eBioscience A.H. anti mouse CD69 IgG PE 0.06 eBioscience A.H. anti mouse CD80 IgG FITC 0.25 eBioscience A.H. anti mouse CD80 IgG PE 0.25 eBioscience A.H. anti mouse CD86 IgG FITC 0.25 eBioscience rat anti mouse Fox p 3 IgG2a κ PE 0.5 eBioscience rat anti mouse IgE IgE κ
IgE Biotin purified
0.5 µg/ml 0.5 µg/ml
BD Biosciences BD Biosciences
anti mouse dinitrophenyl (IgE standard)
IgE purified 1 µg/ml Sigma
rabbit anti mouse Ova goat anti mouse Ova
IgG1 IgG1
HRP HRP
0.25 µg/ml 0.5 µg/ml
Zytomed Invitrogen
anti chicken Ova IgG1 HRP 4 ng/ml Sigma rabbit anti mouse Ova rabbit anti mouse Ova
IgG2a IgG2a
HRP HRP
0.25 µg/ml 1 µg/ml
Zytomed Invitrogen
rat anti mouse IL-2 rat anti-mouse IL-2
IgG2a κ IgG2b κ
none Biotin
1 µg/ml 1 µg/ml
Biolegend Biolegend
rat anti mouse IL-6 IgG1 κ PE 0.4 eBioscience rat anti mouse IL-10 IgG2b κ PE 0.4 eBioscience rat anti mouse IL-10 IgG2b κ none 0.1 - 10 eBioscience isotype controls rat IgG1
mouse IgG2a rat IgG2a rat IgG2b A.H. IgG rat IgG1 rat IgG2a A.H. IgG
mouse anti mouse MHC I IgG2a κ PE 0.1 eBioscience rat anti mouse MHC II IgG2b FITC 0.25 eBioscience mouse anti mouse TLR5 IgG2a PE 0.5 Abcam streptavidin-HRP HRP 1:2T to 1:4T BD Biosciences
Material and methods _________________________________________________________________________________________________________________
51
3.9 Buffers
Table 9: Buffer and solutions
description composition CAPS-buffer 20 mM CAPS
pH 11.0 DNA-sample buffer (5x) 5 ml glycerin
4.5 ml H2Ozyclodest. 0.5 ml TAE (1x) 1.4 mM bromo-chloro-phenol blue 1.9 mM xylencyanol
ELISA-HRP substrate solution 20 ml potassium citrate buffer 1 ml TMB‐solution 6.6 μl 30% H2O2
potassium citrate buffer 229 mM citric acid 303 mM KOH ad 500 ml H2Ozyclodest. pH 3.95
MACS-buffer PBS 0.5% BSA 2 mM EDTA pH 7.2
MOPS-buffer 40 mM MOPS 10 mM NaAc 1 mM EDTA 0.5 M NaCl pH 7.4
paraformaldehyde 4% paraformaldehyde in PBS
PBS 1.5 mM KH2PO4 0.8 mM Na2HPO4 137 mM NaCl 3 mM KCl pH 7.1
PCR-buffer 100 mM Tris-HCl 500 mM KCl pH 8.3
proteinase K solution 1 mg proteinase K/ml
Material and methods _________________________________________________________________________________________________________________
52
description composition SDS running buffer 19.2 M glycine
5 M Tris (pH 6.8) 10% SDS
SDS staking gel buffer (4x) 0.5 M Tris pH 6.8 (adjusted with HCl)
SDS separating gel buffer (4x) 1. M Tris pH 8.0 (adjusted with HCl)
TMB-solution 20.9 mM TMB 2.5 ml acetone ad 25 ml methanol
tris-HCl 200 mM Tris HCl pH 8.5 / pH 7.5
3.10 Culture media, cell lines, and animals
Table 10: Culture media
description composition comment bacterial growth medium LB‐medium
50 μg/ml ampicillin for agar plates: 15 g/l agar‐agar 100 μg/ml ampicillin
HEK cell medium DMEM 500 ml 10% FCS 2 mM L‐glutamine 180 mM penicillin 172 mM streptomycin +/- 10 µg/ml blasticidine
for assays: 2% FCS no blasticidine
DC-medium RPMI 1640 500 ml 10% FCS for DC 2 mM L‐glutamine 180 mM penicillin 172 mM streptomycin 100 mM HEPES 1 mM sodium pyruvate 0.1 mM β-mercapto-ethanol
FCS lot has to be tested carefully!
proliferation medium RPMI 1640 500 ml 2 mM L‐glutamine 180 mM penicillin 172 mM streptomycin 0.1 mM β-mercapto-ethanol
FCS is added seperately FCS lot has to be tested carefully!
washing medium RPMI 1640 500 ml 5% FCS for BMMC 2 mM L‐glutamine 180 mM penicillin 172 mM streptomycin 0.1 mM β-mercapto-ethanol
FCS lot has to be tested carefully!
Material and methods _________________________________________________________________________________________________________________
53
Table 11: E. coli cloning and expression cells
description genotype distributor BL21 Star DE3 chemocompetent cells
Whereas symptom scores for non-vaccinated positive control (PBS -> Ova/A -> Ova), Ova-
(Ova -> Ova/A -> Ova), rflaA- (rflaA -> Ova/A -> Ova), and rflaA plus Ova- (rflaA + Ova ->
Ova/A -> Ova) vaccinated groups steadily increased with each day of Ova-pellet challenge
(resulting in a mean score of 4 on day 6.5 of Ova-pellet challenge), symptom scores for
rflaA:Ova-vaccinated animals remained constant at a score of about 1 during the whole time
of challenge (Figure 50). Therefore, on day 4.5 to 6.5 of Ova-pellet challenge during the most
acute phase of the disease, fusion protein vaccinated mice displayed a mean symptom score
that was 4-times lower than either non-vaccinated (PBS -> Ova/A -> Ova) or Ova-, rflaA-, or
rflaA plus Ova- vaccinated mice (Figure 50). No significant signs of disease were observed
for non-challenged groups receiving normal food (PBS -> PBS -> NF, Ova -> Ova/A -> NF,
Figure 50).
1
2
3
4
5
-0.5 0.5 1.5 2.5 3.5 4.5 5.5 6.5
challenge duration [d]
sym
pto
msc
ore
PBS -> PBS -> NF Ova -> Ova/A -> NF PBS -> Ova/A -> Ova Ova -> Ova/A -> Ova rflaA -> Ova/A -> Ova rflaA + Ova -> Ova/A -> Ova rflaA:Ova -> Ova/A -> Ova
****
****
****
Figure 50: Prophylactic vaccination with rflaA:Ova strongly reduces disease symptoms. Control (PBS ->
PBS -> NF) and Ova-sensitized mice (all other groups) were continuously challenged with either Ova-containing
pellets (Ova) or normal pellets (NF) for 6.5 days. Disease symptoms were evaluated for each mouse on a daily
base. Mean symptom scores were calculated for each group (n = 8 mice per group). Group nomenclature:
(vaccination -> sensitization -> challenge). Statisical comparison was performed using the Wilcoxon signed-rank
test.
To investigate the influence of vaccination and Ova-pellet challenge on food uptake, mean
Ova-pellet uptake values per cage (4 mice per cage) were determined for the different
treatment groups. In allergic mice (PBS -> Ova/A -> Ova) and Ova- (Ova -> Ova/A -> Ova),
rflaA- (rflaA -> Ova/A -> Ova), and rflaA plus Ova- (rflaA + Ova -> Ova/A -> Ova) vaccinated
groups Ova-pellet challenge resulted in a drop of mean Ova-pellet uptake from 2.5 to 3 g per
mouse (at the beginning of challenge) to a minimum of about 1.0 g observed on days 4.5 and
5.5 of Ova-pellet challenge (Figure 51). For rflaA:Ova-vaccinated animals this drop in pellet
uptake was less pronounced, with a mean food uptake of 3 to 3.5 g per mouse (at the
beginning of challenge) which was reduced to approximately 2 g per mouse on days 4.5 and
5.5 of Ova-pellet challenge. Nevertheless, food uptake for each day of challenge was higher
for rflaA:Ova-vaccinated mice than for the respective control groups (PBS -> Ova/A -> Ova,
Ova -> Ova/A -> Ova, rflaA -> Ova/A -> Ova, and rflaA + Ova -> Ova/A -> Ova, respectively
Figure 51). Non-challenged groups receiving normal food (PBS -> PBS -> NF, Ova -> Ova/A
-> NF) displayed a mean pellet uptake between 2.5 and 3.7 g per mouse and day (Figure
51). In these groups no minima of food uptake on day 4.5 and 5.5 of Ova-pellet challenge
were detected. Since the Ova-pellets used contained approximately 30% ovalbumin it was
possible to calculate the amount of allergen taken up. Daily Ova-uptake ranged from 1 g per
mouse and day on day 0.5 to approximately 0.3 g on days 4.5 and 5.5 of Ova-pellet
challenge (Figure 51).
1
2
3
4
5
0.5 1.5 2.5 3.5 4.5 5.5 6.5
challenge duration [d]
mea
np
elle
t u
pta
ke[g
]
PBS -> PBS -> NF Ova -> Ova/A -> NF PBS -> Ova/A -> Ova Ova -> Ova/A -> Ova rflaA -> Ova/A -> Ova rflaA + Ova -> Ova/A -> Ova rflaA:Ova -> Ova/A -> Ova
**
Figure 51: rflaA:Ova-vaccinated mice show a higher food uptake than control groups. Control (PBS -> PBS
-> NF) and Ova-sensitized mice (all other groups) were continuously challenged with either Ova-containing pellets
(Ova) or normal pellets (NF) for 6.5 days. Pellets were weighted every day and mean pellet uptake values per
mouse and day were calculated for each group (n = 8 mice per group, 2 cages with 4 mice each). Group
for mouse body weights (Figure 52) the observed drop in core body temperature was most
pronounced for mice vaccinated with a mixture of rflaA and rOva (rflaA + Ova -> Ova/A ->
Ova, Figure 53). In contrast to this, both rflaA:Ova-vaccinated mice and control groups
receiving normal food (PBS -> PBS -> NF, Ova -> Ova/A -> NF) displayed stable core body
temperatures ranging from 37 to 38°C (Figure 53).
Taken together these results clearly show that prophylactic vaccination with rflaA:Ova, but
not rflaA and rOva either provided alone or as a mixture was sufficient to prevent the
establishment of intestinal allergy in the used mouse model.
39
32
33
34
35
36
37
38
-1 0 1 2 3 4 5 6 7
challenge duration [d]
core
bo
dy
tem
per
atu
re[°
C]
PBS -> PBS -> NF Ova -> Ova/A -> NF PBS -> Ova/A -> Ova Ova -> Ova/A -> Ova rflaA -> Ova/A -> Ova rflaA + Ova -> Ova/A -> Ova rflaA:Ova -> Ova/A -> Ova
**
Figure 53: Prophylactic vaccination with rflaA:Ova protects against drop in core body temperature.
Control (PBS -> PBS -> NF) and Ova-sensitized mice (all other groups) were continuously challenged with either
Ova-containing pellets (Ova) or normal pellets (NF) for 6.5 days. Core body temperatures for every mouse were
determined rectally and mean body temperatures were calculated for each day and group (n = 8 mice per group).
Group nomenclature: (vaccination -> sensitization -> challenge).
Repository figure 16: Therapeutic vaccination study: rflaA:Ova-vaccinated animals show a reduced TC
activation in MLN. On day 6.5 of Ova-pellet challenge animals were sacrificed, mesenteric lymph nodes were
prepared, and three animals per group were pooled. Subsequently, red blood cells were lysed and expression
levels of the indicated lineage and cell surface markers were determined by flow cytometry, and compared to the
PBS -> Ova (allergy positive control, grey) group, Abbreviations: No diff.: no difference to PBS -> Ova group, n.
det.: no expression detectable, +: up-regulation, –: down-regulation, (+) / (-): weak up- or down-regulation.
pET15b containingtarget gene
6842 bp
Amp-resistence
ORI
pET15b containingtarget gene
6842 bp
Amp-resistence
target gene
His-Tag
T7 promotor
ORI
T7 terminator
NdeI
XhoI
Repository figure 17: Vector chart for expression of the different constructs using pET15b. All target genes
were cloned into the depicted pET15b plasmid using NdeI and XhoI restriction sites. Amp-resistance = Ampicilling
resitance gene; ORI = origin of replication.
Curriculum vitae _________________________________________________________________________________________________________________
176
9. Curriculum vitae
Personal data
Studies and graduation
Name Schülke First name Stefan Address Brucknerstraße 35, 64291 Darmstadt
Date of birth Place of birth
29.01.1983 Bad Kreuznach
since 11/2007 PhD-thesis at the Paul-Ehrlich-Institut in Langen
Division of Allergology Title of dissertation: „Flagellin:allergen fusion proteins as novel vaccines for the treatment of severe type I allergies “ Supervisor: Prof. Dr. Stefan Vieths Degree: Dr. rer. nat. Mark: result pending
04/03 to 10/07 Studies of biology at the Johannes Gutenberg-Universität in Mainz
Main focus: immunology, molecular genetics, zoology and biophysics Diploma thesis at the institute of molecular genetics Title of thesis: „Molecular analysis of genes involved in ROS defence in the hypoxia-tolerant blind mole rat Spalax“ Supervisor: Prof. Dr. Thomas Hankeln Degree: diplome biologist Mark: excellent
Curriculum vitae _________________________________________________________________________________________________________________
177
Advanced training
Further work experience
Scholarships and awards
Military service
Education
09/09 Successful participation in advanced training: „Gentechnik-
Projektleiter und Beauftragten für biologische Sicherheit“, Johannes Gutenberg-Universität in Mainz
07/08 Laboratory animal science - FELASA category B course, Johannes
Gutenberg-Universität in Mainz
10/07 Practical course in the institute for Neurochirurgische
Pathophysiologie, Johannes Gutenberg-Universität medical clinic in Mainz
05 to 07 Work as research assistant for the institutes of genetics and
molecular genetics, Johannes Gutenberg-Universität in Mainz
01/11
Scholarship of the 9th EAACI-GA2LEN-Immunology Winter School
10/10 02/10
Poster prize 4th International Symposium on Molecular Allergology Scholarship of the 8th EAACI-GA2LEN-Immunology Winter School
04/07 to 09/07 Scholarship of the Johannes Gutenberg-Universität in Mainz
07/02 to 03/03 For the Fernmeldebataillon 282, Hunsrückkaserne Kastellaun
08/93 to 03/02 Gymnasium am Römerkastell, Bad Kreuznach degree: Abitur
Mark: 1,3
Curriculum vitae _________________________________________________________________________________________________________________
178
Voluntary work
Further qualifications
Hobbies
Langen, 25.01.11
(Stefan Schülke)
04/96 to 12/01
Work for the „Katholisch-Öffentliche “ library in Guldental. Fields of activity: stockpiling, portfolio maintenance, customer service, planning, organization, and execution of book exhibitions
Foreign languages
German: mother tongue English: very good skills French: good skills
Computer literacy Profound knowledge of all Microsoft office applications (Word, Outlook, Powerpoint, Excel), as well as multiple graphics-, analysis-, and bioinformatic programs
literature (science-fiction) sports (running, boxing) films
Curriculum vitae _________________________________________________________________________________________________________________
1. Kay, A. B. 2001. Allergy and allergic diseases. First of two parts. N. Engl. J. Med. 344: 30-37.
2. Kay, A. B. 2001. Allergy and allergic diseases. Second of two parts. N. Engl. J. Med. 344: 109-113.
3. Gupta, R., A. Sheikh, D. P. Strachan, and H. R. Anderson. 2004. Burden of allergic disease in the UK: secondary analyses of national databases. Clin. Exp. Allergy 34: 520-526.
4. Lee, L. A., and A. W. Burks. 2009. New insights into diagnosis and treatment of peanut food allergy. Front Biosci. 14: 3361-3371.
5. Rona, R. J., T. Keil, C. Summers, D. Gislason, L. Zuidmeer, E. Sodergren, S. T. Sigurdardottir, T. Lindner, K. Goldhahn, J. Dahlstrom, D. McBride, and C. Madsen. 2007. The prevalence of food allergy: a meta-analysis. J. Allergy Clin. Immunol. 120: 638-646.
6. Larche, M., C. A. Akdis, and R. Valenta. 2006. Immunological mechanisms of allergen-specific immunotherapy. Nat. Rev. Immunol. 6: 761-771.
7. Floistrup, H., J. Swartz, A. Bergstrom, J. S. Alm, A. Scheynius, M. van Hage, M. Waser, C. Braun-Fahrlander, D. Schram-Bijkerk, M. Huber, A. Zutavern, E. von Mutius, E. Ublagger, J. Riedler, K. B. Michaels, and G. Pershagen. 2006. Allergic disease and sensitization in Steiner school children. J. Allergy Clin. Immunol. 117: 59-66.
8. Janeway C A, T. P. W. M. S. M. 2004. Immunobiology, 6th ed. Garland Science publlishing.
9. Xiao, B. G., Y. M. Huang, and H. Link. 2003. Dendritic cell vaccine design: strategies for eliciting peripheral tolerance as therapy of autoimmune diseases. BioDrugs. 17: 103-111.
10. Banchereau, J., S. Paczesny, P. Blanco, L. Bennett, V. Pascual, J. Fay, and A. K. Palucka. 2003. Dendritic cells: controllers of the immune system and a new promise for immunotherapy. Ann. N. Y. Acad. Sci. 987: 180-187.
11. Banchereau, J., F. Briere, C. Caux, J. Davoust, S. Lebecque, Y. J. Liu, B. Pulendran, and K. Palucka. 2000. Immunobiology of dendritic cells. Annu. Rev. Immunol. 18: 767-811.
12. Mahnke, K., T. S. Johnson, S. Ring, and A. H. Enk. 2007. Tolerogenic dendritic cells and regulatory T cells: a two-way relationship. J. Dermatol. Sci. 46: 159-167.
13. Awasthi, A., and V. K. Kuchroo. 2009. Th17 cells: from precursors to players in inflammation and infection. Int. Immunol. 21: 489-498.
14. Mills, K. H. 2008. Induction, function and regulation of IL-17-producing T cells. Eur. J. Immunol. 38: 2636-2649.
15. Perona-Wright, G., S. J. Jenkins, R. A. O'Connor, D. Zienkiewicz, H. J. McSorley, R. M. Maizels, S. M. Anderton, and A. S. MacDonald. 2009. A pivotal role for CD40-mediated IL-6 production by dendritic cells during IL-17 induction in vivo. J. Immunol. 182: 2808-2815.
16. Fletcher, J. M., S. J. Lalor, C. M. Sweeney, N. Tubridy, and K. H. Mills. 2010. T cells in multiple sclerosis and experimental autoimmune encephalomyelitis. Clin. Exp. Immunol. 162: 1-11.
17. Kimura, A., and T. Kishimoto. 2010. Th17 cells in inflammation. Int. Immunopharmacol.
18. DeKruyff, R. H., T. Turner, J. S. Abrams, M. A. Palladino, Jr., and D. T. Umetsu. 1989. Induction of human IgE synthesis by CD4+ T cell clones. Requirement for interleukin 4 and low molecular weight B cell growth factor. J. Exp. Med. 170: 1477-1493.
19. Paul, W. E., and R. A. Seder. 1994. Lymphocyte responses and cytokines. Cell 76: 241-251.
20. Holloway, J. W., I. A. Yang, and S. T. Holgate. 2010. Genetics of allergic disease. J. Allergy Clin. Immunol. 125: S81-S94.
21. Higgins, P. S., D. Wakefield, and M. M. Cloutier. 2005. Risk factors for asthma and asthma severity in nonurban children in Connecticut. Chest 128: 3846-3853.
22. Baye, T. M., L. J. Martin, and G. K. Khurana Hershey. 2010. Application of genetic/genomic approaches to allergic disorders. J. Allergy Clin. Immunol. 126: 425-436.
23. Henderson, J., K. Northstone, S. P. Lee, H. Liao, Y. Zhao, M. Pembrey, S. Mukhopadhyay, G. D. Smith, C. N. Palmer, W. H. McLean, and A. D. Irvine. 2008. The burden of disease associated with filaggrin mutations: a population-based, longitudinal birth cohort study. J. Allergy Clin. Immunol. 121: 872-877.
24. O'Regan, G. M., A. Sandilands, W. H. McLean, and A. D. Irvine. 2008. Filaggrin in atopic dermatitis. J. Allergy Clin. Immunol. 122: 689-693.
25. Palmer, C. N., A. D. Irvine, A. Terron-Kwiatkowski, Y. Zhao, H. Liao, S. P. Lee, D. R. Goudie, A. Sandilands, L. E. Campbell, F. J. Smith, G. M. O'Regan, R. M. Watson, J. E. Cecil, S. J. Bale, J. G. Compton, J. J. DiGiovanna, P. Fleckman, S. Lewis-Jones, G. Arseculeratne, A. Sergeant, C. S. Munro, H. B. El, K. McElreavey, L. B. Halkjaer, H. Bisgaard, S. Mukhopadhyay, and W. H. McLean. 2006. Common loss-of-function variants of the epidermal barrier protein filaggrin are a major predisposing factor for atopic dermatitis. Nat. Genet. 38: 441-446.
26. Weidinger, S., M. O'Sullivan, T. Illig, H. Baurecht, M. Depner, E. Rodriguez, A. Ruether, N. Klopp, C. Vogelberg, S. K. Weiland, W. H. McLean, M. E. von, A. D. Irvine, and M. Kabesch. 2008. Filaggrin mutations, atopic eczema, hay fever, and asthma in children. J. Allergy Clin. Immunol. 121: 1203-1209.
27. Weidinger, S., C. Gieger, E. Rodriguez, H. Baurecht, M. Mempel, N. Klopp, H. Gohlke, S. Wagenpfeil, M. Ollert, J. Ring, H. Behrendt, J. Heinrich, N. Novak, T. Bieber, U. Kramer, D. Berdel, B. A. von, C. P. Bauer, O. Herbarth, S. Koletzko, H. Prokisch, D. Mehta, T. Meitinger, M. Depner, M. E. von, L. Liang, M. Moffatt, W. Cookson, M. Kabesch, H. E. Wichmann, and T. Illig. 2008. Genome-wide scan on total serum IgE levels identifies FCER1A as novel susceptibility locus. PLoS. Genet. 4: e1000166.
28. Maher, B. 2008. Personal genomes: The case of the missing heritability. Nature 456: 18-21.
29. Manolio, T. A., F. S. Collins, N. J. Cox, D. B. Goldstein, L. A. Hindorff, D. J. Hunter, M. I. McCarthy, E. M. Ramos, L. R. Cardon, A. Chakravarti, J. H. Cho, A. E. Guttmacher, A. Kong, L. Kruglyak, E. Mardis, C. N. Rotimi, M. Slatkin, D. Valle, A. S. Whittemore, M. Boehnke, A. G. Clark, E. E. Eichler, G. Gibson, J. L. Haines, T. F. Mackay, S. A. McCarroll, and P. M. Visscher. 2009. Finding the missing heritability of complex diseases. Nature 461: 747-753.
30. Li, X., A. Yang, H. Huang, X. Zhang, J. Town, B. Davis, D. W. Cockcroft, and J. R. Gordon. 2010. Induction of type 2 T helper cell allergen tolerance by IL-10-differentiated regulatory dendritic cells. Am. J. Respir. Cell Mol. Biol. 42: 190-199.
31. Hanson, B., M. McGue, B. Roitman-Johnson, N. L. Segal, T. J. Bouchard, Jr., and M. N. Blumenthal. 1991. Atopic disease and immunoglobulin E in twins reared apart and together. Am. J. Hum. Genet. 48: 873-879.
32. Breiteneder, H., and E. N. Mills. 2005. Molecular properties of food allergens. J. Allergy Clin. Immunol. 115: 14-23.
33. Bush, A., and S. Saglani. 2010. Management of severe asthma in children. Lancet 376: 814-825.
34. Johansen, P., G. Senti, J. M. Martinez Gomez, T. Storni, B. R. von Beust, B. Wuthrich, A. Bot, and T. M. Kundig. 2005. Toll-like receptor ligands as adjuvants in allergen-specific immunotherapy. Clin. Exp. Allergy 35: 1591-1598.
35. NOON, L. 1960. Prophylactic inoculation against hay fever. Historical document. Ann. Allergy 18: 287-291.
36. Bhalla, P. L., and M. B. Singh. 2004. Engineered allergens for immunotherapy. Curr. Opin. Allergy Clin. Immunol. 4: 569-573.
37. Akdis, C. A., K. Blaser, and M. Akdis. 2006. Mechanisms of allergen-specific immunotherapy. Chem. Immunol. Allergy 91: 195-203.
38. Lehmann, K., S. Hoffmann, P. Neudecker, M. Suhr, W. M. Becker, and P. Rosch. 2003. High-yield expression in Escherichia coli, purification, and characterization of properly folded major peanut allergen Ara h 2. Protein Expr. Purif. 31: 250-259.
39. Valenta, R., and V. Niederberger. 2007. Recombinant allergens for immunotherapy. J. Allergy Clin. Immunol. 119: 826-830.
40. Becker, W. M., L. Vogel, and S. Vieths. 2006. Standardization of allergen extracts for immunotherapy: where do we stand? Curr. Opin. Allergy Clin. Immunol. 6: 470-475.
41. Lorenz, A. R., S. Scheurer, D. Haustein, and S. Vieths. 2001. Recombinant food allergens. J. Chromatogr. B Biomed. Sci. Appl. 756: 255-279.
42. van der Veen, M. J., M. Mulder, A. M. Witteman, R. van Ree, R. C. Aalberse, H. M. Jansen, and J. S. van der Zee. 1996. False-positive skin prick test responses to commercially available dog dander extracts caused by contamination with house dust mite (Dermatophagoides pteronyssinus) allergens. J. Allergy Clin. Immunol. 98: 1028-1034.
43. Rolland, J. M., L. M. Gardner, and R. E. O'Hehir. 2009. Allergen-related approaches to immunotherapy. Pharmacol. Ther. 121: 273-284.
44. Demoly, P., A. Didier, P. Mathelier-Fusade, M. Drouet, M. David, G. Bonnelye, J. Blic, and J. M. Klossek. 2008. Physician and patient survey of allergic rhinitis in France: perceptions on prevalence, severity of symptoms, care management and specific immunotherapy. Allergy 63: 1008-1014.
45. Campbell, D., R. H. DeKruyff, and D. T. Umetsu. 2000. Allergen immunotherapy: novel approaches in the management of allergic diseases and asthma. Clin. Immunol. 97: 193-202.
46. Devey, M. E., D. V. Wilson, and A. W. Wheeler. 1976. The IgG subclasses of antibodies to grass pollen allergens produced in hay fever patients during hyposensitization. Clin. Allergy 6: 227-236.
47. Aalberse, R. C., G. R. van der, and J. van Leeuwen. 1983. Serologic aspects of IgG4 antibodies. I. Prolonged immunization results in an IgG4-restricted response. J. Immunol. 130: 722-726.
48. Gehlhar, K., M. Schlaak, W. Becker, and A. Bufe. 1999. Monitoring allergen immunotherapy of pollen-allergic patients: the ratio of allergen-specific IgG4 to IgG1 correlates with clinical outcome. Clin. Exp. Allergy 29: 497-506.
49. Wilson, D. R., A. M. Irani, S. M. Walker, M. R. Jacobson, I. S. Mackay, L. B. Schwartz, and S. R. Durham. 2001. Grass pollen immunotherapy inhibits seasonal increases in basophils and eosinophils in the nasal epithelium. Clin. Exp. Allergy 31: 1705-1713.
50. Durham, S. R., V. A. Varney, M. Gaga, M. R. Jacobson, E. M. Varga, A. J. Frew, and A. B. Kay. 1999. Grass pollen immunotherapy decreases the number of mast cells in the skin. Clin. Exp. Allergy 29: 1490-1496.
51. Francis, J. N., and M. Larche. 2005. Peptide-based vaccination: where do we stand? Curr. Opin. Allergy Clin. Immunol. 5: 537-543.
52. Hamid, Q. A., E. Schotman, M. R. Jacobson, S. M. Walker, and S. R. Durham. 1997. Increases in IL-12 messenger RNA+ cells accompany inhibition of allergen-induced late skin responses after successful grass pollen immunotherapy. J. Allergy Clin. Immunol. 99: 254-260.
53. Ebner, C., U. Siemann, B. Bohle, M. Willheim, U. Wiedermann, S. Schenk, F. Klotz, H. Ebner, D. Kraft, and O. Scheiner. 1997. Immunological changes during specific immunotherapy of grass pollen allergy: reduced lymphoproliferative responses to allergen and shift from TH2 to TH1 in T-cell clones specific for Phl p 1, a major grass pollen allergen. Clin. Exp. Allergy 27: 1007-1015.
54. Mavroleon, G. 1998. Restoration of cytokine imbalance by immunotherapy. Clin. Exp. Allergy 28: 917-920.
55. Li, X. M., K. Srivastava, J. W. Huleatt, K. Bottomly, A. W. Burks, and H. A. Sampson. 2003. Engineered recombinant peanut protein and heat-killed Listeria monocytogenes coadministration protects against peanut-induced anaphylaxis in a murine model. J. Immunol. 170: 3289-3295.
56. Shaw, M. H., T. Reimer, Y. G. Kim, and G. Nunez. 2008. NOD-like receptors (NLRs): bona fide intracellular microbial sensors. Curr. Opin. Immunol. 20: 377-382.
57. Rietdijk, S. T., T. Burwell, J. Bertin, and A. J. Coyle. 2008. Sensing intracellular pathogens-NOD-like receptors. Curr. Opin. Pharmacol. 8: 261-266.
58. Franchi, L., J. H. Park, M. H. Shaw, N. Marina-Garcia, G. Chen, Y. G. Kim, and G. Nunez. 2008. Intracellular NOD-like receptors in innate immunity, infection and disease. Cell Microbiol. 10: 1-8.
59. Brikos, C., and L. A. O'Neill. 2008. Signalling of toll-like receptors. Handb. Exp. Pharmacol. 21-50.
60. Jenkins, K. A., and A. Mansell. 2010. TIR-containing adaptors in Toll-like receptor signalling. Cytokine 49: 237-244.
61. Yarovinsky, F., D. Zhang, J. F. Andersen, G. L. Bannenberg, C. N. Serhan, M. S. Hayden, S. Hieny, F. S. Sutterwala, R. A. Flavell, S. Ghosh, and A. Sher. 2005. TLR11 activation of dendritic cells by a protozoan profilin-like protein. Science 308: 1626-1629.
62. Akira, S., K. Takeda, and T. Kaisho. 2001. Toll-like receptors: critical proteins linking innate and acquired immunity. Nat. Immunol. 2: 675-680.
63. Datta, S. K., V. Redecke, K. R. Prilliman, K. Takabayashi, M. Corr, T. Tallant, J. DiDonato, R. Dziarski, S. Akira, S. P. Schoenberger, and E. Raz. 2003. A subset of Toll-like receptor ligands induces cross-presentation by bone marrow-derived dendritic cells. J. Immunol. 170: 4102-4110.
64. Kumar, H., T. Kawai, and S. Akira. 2009. Toll-like receptors and innate immunity. Biochem. Biophys. Res. Commun. 388: 621-625.
65. Kumar, H., T. Kawai, and S. Akira. 2009. Toll-like receptors and innate immunity. Biochem. Biophys. Res. Commun. 388: 621-625.
66. Akira, S., K. Takeda, and T. Kaisho. 2001. Toll-like receptors: critical proteins linking innate and acquired immunity. Nat. Immunol. 2: 675-680.
67. Warshakoon, H. J., J. D. Hood, M. R. Kimbrell, S. Malladi, W. Y. Wu, N. M. Shukla, G. Agnihotri, D. Sil, and S. A. David. 2009. Potential adjuvantic properties of innate immune stimuli. Hum. Vaccin. 5: 381-394.
68. Wakkach, A., N. Fournier, V. Brun, J. P. Breittmayer, F. Cottrez, and H. Groux. 2003. Characterization of dendritic cells that induce tolerance and T regulatory 1 cell differentiation in vivo. Immunity. 18: 605-617.
69. Morelli, A. E., and A. W. Thomson. 2003. Dendritic cells: regulators of alloimmunity and opportunities for tolerance induction. Immunol. Rev. 196: 125-146.
70. Jonuleit, H., E. Schmitt, G. Schuler, J. Knop, and A. H. Enk. 2000. Induction of interleukin 10-producing, nonproliferating CD4(+) T cells with regulatory properties by repetitive stimulation with allogeneic immature human dendritic cells. J. Exp. Med. 192: 1213-1222.
71. Roncarolo, M. G., M. K. Levings, and C. Traversari. 2001. Differentiation of T regulatory cells by immature dendritic cells. J. Exp. Med. 193: F5-F9.
72. Dhodapkar, M. V., R. M. Steinman, J. Krasovsky, C. Munz, and N. Bhardwaj. 2001. Antigen-specific inhibition of effector T cell function in humans after injection of immature dendritic cells. J. Exp. Med. 193: 233-238.
73. Allan, S. E., R. Broady, S. Gregori, M. E. Himmel, N. Locke, M. G. Roncarolo, R. Bacchetta, and M. K. Levings. 2008. CD4+ T-regulatory cells: toward therapy for human diseases. Immunol. Rev. 223: 391-421.
74. Holmen, N., A. Lundgren, S. Lundin, A. M. Bergin, A. Rudin, H. Sjovall, and L. Ohman. 2006. Functional CD4+CD25high regulatory T cells are enriched in the colonic mucosa of patients with active ulcerative colitis and increase with disease activity. Inflamm. Bowel. Dis. 12: 447-456.
75. Jonuleit, H., E. Schmitt, H. Kakirman, M. Stassen, J. Knop, and A. H. Enk. 2002. Infectious tolerance: human CD25(+) regulatory T cells convey suppressor activity to conventional CD4(+) T helper cells. J. Exp. Med. 196: 255-260.
76. Sakaguchi, S., N. Sakaguchi, M. Asano, M. Itoh, and M. Toda. 1995. Immunologic self-tolerance maintained by activated T cells expressing IL-2 receptor alpha-chains (CD25). Breakdown of a single mechanism of self-tolerance causes various autoimmune diseases. J. Immunol. 155: 1151-1164.
77. Lindley, S., C. M. Dayan, A. Bishop, B. O. Roep, M. Peakman, and T. I. Tree. 2005. Defective suppressor function in CD4(+)CD25(+) T-cells from patients with type 1 diabetes. Diabetes 54: 92-99.
78. Bacchetta, R., L. Passerini, E. Gambineri, M. Dai, S. E. Allan, L. Perroni, F. Dagna-Bricarelli, C. Sartirana, S. Matthes-Martin, A. Lawitschka, C. Azzari, S. F. Ziegler, M. K. Levings, and M. G. Roncarolo. 2006. Defective regulatory and effector T cell functions in patients with FOXP3 mutations. J. Clin. Invest 116: 1713-1722.
79. Van Overtvelt, L., V. Lombardi, A. Razafindratsita, N. Saint-Lu, S. Horiot, H. Moussu, L. Mascarell, and P. Moingeon. 2008. IL-10-inducing adjuvants enhance sublingual immunotherapy efficacy in a murine asthma model. Int. Arch. Allergy Immunol. 145: 152-162.
80. Akbari, O., R. H. DeKruyff, and D. T. Umetsu. 2001. Pulmonary dendritic cells producing IL-10 mediate tolerance induced by respiratory exposure to antigen. Nat. Immunol. 2: 725-731.
81. Moingeon, P. 2006. Sublingual immunotherapy: from biological extracts to recombinant allergens. Allergy 61 Suppl 81: 15-19.
82. Novak, N., J. P. Allam, and T. Bieber. 2003. Allergic hyperreactivity to microbial components: a trigger factor of "intrinsic" atopic dermatitis? J. Allergy Clin. Immunol. 112: 215-216.
83. Bellinghausen, I., B. Konig, I. Bottcher, J. Knop, and J. Saloga. 2006. Inhibition of human allergic T-helper type 2 immune responses by induced regulatory T cells requires the combination of interleukin-10-treated dendritic cells and transforming growth factor-beta for their induction. Clin. Exp. Allergy 36: 1546-1555.
84. Bellinghausen, I., S. Sudowe, B. Konig, A. B. Reske-Kunz, J. Knop, and J. Saloga. 2006. Interleukin-10-treated dendritic cells do not inhibit Th2 immune responses in ovalbumin/alum-sensitized mice. Int. Arch. Allergy Immunol. 141: 61-69.
85. Steinbrink, K., E. Graulich, S. Kubsch, J. Knop, and A. H. Enk. 2002. CD4(+) and CD8(+) anergic T cells induced by interleukin-10-treated human dendritic cells display antigen-specific suppressor activity. Blood 99: 2468-2476.
86. Steinbrink, K., M. Wolfl, H. Jonuleit, J. Knop, and A. H. Enk. 1997. Induction of tolerance by IL-10-treated dendritic cells. J. Immunol. 159: 4772-4780.
87. Bellinghausen, I., U. Brand, K. Steinbrink, A. H. Enk, J. Knop, and J. Saloga. 2001. Inhibition of human allergic T-cell responses by IL-10-treated dendritic cells: differences from hydrocortisone-treated dendritic cells. J. Allergy Clin. Immunol. 108: 242-249.
88. Egger, M., M. Hauser, M. Himly, N. Wopfner, M. Wallner, and F. Ferreira. 2009. Development of recombinant allergens for diagnosis and therapy. Front Biosci. (Elite. Ed) 1: 77-90.
89. Lucas, J. M. 2010. Microarrays: molecular allergology and nanotechnology for personalised medicine (I). Allergol. Immunopathol. (Madr. ) 38: 153-161.
90. Linhart, B., and R. Valenta. 2005. Molecular design of allergy vaccines. Curr. Opin. Immunol. 17: 646-655.
91. Ferreira, F., K. Hirtenlehner, A. Jilek, J. Godnik-Cvar, H. Breiteneder, R. Grimm, K. Hoffmann-Sommergruber, O. Scheiner, D. Kraft, M. Breitenbach, H. J. Rheinberger, and C. Ebner. 1996. Dissection of immunoglobulin E and T lymphocyte reactivity of isoforms of the major birch pollen allergen Bet v 1: potential use of hypoallergenic isoforms for immunotherapy. J. Exp. Med. 183: 599-609.
92. Jutel, M., L. Jaeger, R. Suck, H. Meyer, H. Fiebig, and O. Cromwell. 2005. Allergen-specific immunotherapy with recombinant grass pollen allergens. J. Allergy Clin. Immunol. 116: 608-613.
93. Pauli, G., T. H. Larsen, S. Rak, F. Horak, E. Pastorello, R. Valenta, A. Purohit, M. Arvidsson, A. Kavina, J. W. Schroeder, N. Mothes, S. Spitzauer, A. Montagut, S. Galvain, M. Melac, C. Andre, L. K. Poulsen, and H. J. Malling. 2008. Efficacy of recombinant birch pollen vaccine for the treatment of birch-allergic rhinoconjunctivitis. J. Allergy Clin. Immunol. 122: 951-960.
94. Valenta, R. 2002. The future of antigen-specific immunotherapy of allergy. Nat. Rev. Immunol. 2: 446-453.
95. Kraft, D., F. Ferreira, S. Vrtala, H. Breiteneder, C. Ebner, R. Valenta, M. Susani, M. Breitenbach, and O. Scheiner. 1999. The importance of recombinant allergens for diagnosis and therapy of IgE-mediated allergies. Int. Arch. Allergy Immunol. 118: 171-176.
96. Ferreira, F., C. Ebner, B. Kramer, G. Casari, P. Briza, A. J. Kungl, R. Grimm, B. Jahn-Schmid, H. Breiteneder, D. Kraft, M. Breitenbach, H. J. Rheinberger, and O. Scheiner. 1998. Modulation of IgE reactivity of allergens by site-directed mutagenesis: potential use of hypoallergenic variants for immunotherapy. FASEB J. 12: 231-242.
97. Hage-Hamsten, M., M. Kronqvist, O. Zetterstrom, E. Johansson, V. Niederberger, S. Vrtala, H. Gronlund, R. Gronneberg, and R. Valenta. 1999. Skin test evaluation of genetically engineered hypoallergenic derivatives of the major birch pollen allergen, Bet v 1: results obtained with a mix of two recombinant Bet v 1 fragments and recombinant Bet v 1 trimer in a Swedish population before the birch pollen season. J. Allergy Clin. Immunol. 104: 969-977.
98. Pauli, G., A. Purohit, J. P. Oster, F. de Blay, S. Vrtala, V. Niederberger, D. Kraft, and R. Valenta. 2000. Comparison of genetically engineered hypoallergenic rBet v 1 derivatives with rBet v 1 wild-type by skin prick and intradermal testing: results obtained in a French population. Clin. Exp. Allergy 30: 1076-1084.
99. Pauli, G., A. Purohit, J. P. Oster, F. de Blay, S. Vrtala, V. Niederberger, D. Kraft, and R. Valenta. 1999. Clinical evaluation of genetically engineered hypoallergenic rBet v 1 derivatives. Int. Arch. Allergy Immunol. 118: 216-217.
100. Vrtala, S., M. Focke, J. Kopec, P. Verdino, A. Hartl, W. R. Sperr, A. A. Fedorov, T. Ball, S. Almo, P. Valent, J. Thalhamer, W. Keller, and R. Valenta. 2007. Genetic engineering of the major timothy grass pollen allergen, Phl p 6, to reduce allergenic activity and preserve immunogenicity. J. Immunol. 179: 1730-1739.
101. Vrtala, S., K. Hirtenlehner, M. Susani, P. Hufnagl, B. R. Binder, L. Vangelista, A. Pastore, W. R. Sperr, P. Valent, C. Ebner, D. Kraft, and R. Valenta. 1999. Genetic engineering of recombinant hypoallergenic oligomers of the major birch pollen allergen, Bet v 1: candidates for specific immunotherapy. Int. Arch. Allergy Immunol. 118: 218-219.
102. Gafvelin, G., S. Thunberg, M. Kronqvist, H. Gronlund, R. Gronneberg, M. Troye-Blomberg, M. Akdis, H. Fiebig, A. Purohit, F. Horak, J. Reisinger, V. Niederberger, C. A. Akdis, O. Cromwell, G. Pauli, R. Valenta, and M. van Hage. 2005. Cytokine and antibody responses in birch-pollen-allergic patients treated with genetically modified derivatives of the major birch pollen allergen Bet v 1. Int. Arch. Allergy Immunol. 138: 59-66.
103. Mahler, V., S. Vrtala, O. Kuss, T. L. Diepgen, R. Suck, O. Cromwell, H. Fiebig, A. Hartl, J. Thalhamer, G. Schuler, D. Kraft, and R. Valenta. 2004. Vaccines for birch pollen allergy based on genetically engineered hypoallergenic derivatives of the major birch pollen allergen, Bet v 1. Clin. Exp. Allergy 34: 115-122.
104. Ma, Y., G. Gadermaier, B. Bohle, S. Bolhaar, A. Knulst, Z. Markovic-Housley, H. Breiteneder, P. Briza, K. Hoffmann-Sommergruber, and F. Ferreira. 2006. Mutational analysis of amino acid positions crucial for IgE-binding epitopes of the major apple (Malus domestica) allergen, Mal d 1. Int. Arch. Allergy Immunol. 139: 53-62.
105. Swoboda, I., N. De Weerd, P. L. Bhalla, V. Niederberger, W. R. Sperr, P. Valent, H. Kahlert, H. Fiebig, P. Verdino, W. Keller, C. Ebner, S. Spitzauer, R. Valenta, and M. B. Singh. 2002. Mutants of the major ryegrass pollen allergen, Lol p 5, with reduced IgE-binding capacity: candidates for grass pollen-specific immunotherapy. Eur. J. Immunol. 32: 270-280.
106. Bannon, G. A., G. Cockrell, C. Connaughton, C. M. West, R. Helm, J. S. Stanley, N. King, P. Rabjohn, H. A. Sampson, and A. W. Burks. 2001. Engineering, characterization and in vitro efficacy of the major peanut allergens for use in immunotherapy. Int. Arch. Allergy Immunol. 124: 70-72.
107. Reese, G., J. Viebranz, S. M. Leong-Kee, M. Plante, I. Lauer, S. Randow, M. S. Moncin, R. Ayuso, S. B. Lehrer, and S. Vieths. 2005. Reduced allergenic potency of VR9-1, a mutant of the major shrimp allergen Pen a 1 (tropomyosin). J. Immunol. 175: 8354-8364.
108. Scheurer, S., D. Y. Son, M. Boehm, F. Karamloo, S. Franke, A. Hoffmann, D. Haustein, and S. Vieths. 1999. Cross-reactivity and epitope analysis of Pru a 1, the major cherry allergen. Mol. Immunol. 36: 155-167.
109. Son, D. Y., S. Scheurer, A. Hoffmann, D. Haustein, and S. Vieths. 1999. Pollen-related food allergy: cloning and immunological analysis of isoforms and mutants of Mal d 1, the major apple allergen, and Bet v 1, the major birch pollen allergen. Eur. J. Nutr. 38: 201-215.
110. Pauli, G., A. Purohit, J. P. Oster, F. de Blay, S. Vrtala, V. Niederberger, D. Kraft, and R. Valenta. 2000. Comparison of genetically engineered hypoallergenic rBet v 1 derivatives with rBet v 1 wild-type by skin prick and intradermal testing: results obtained in a French population. Clin. Exp. Allergy 30: 1076-1084.
111. Marcotte, G. V., C. M. Braun, P. S. Norman, C. F. Nicodemus, A. Kagey-Sobotka, L. M. Lichtenstein, and D. M. Essayan. 1998. Effects of peptide therapy on ex vivo T-cell responses. J. Allergy Clin. Immunol. 101: 506-513.
112. Oldfield, W. L., M. Larche, and A. B. Kay. 2002. Effect of T-cell peptides derived from Fel d 1 on allergic reactions and cytokine production in patients sensitive to cats: a randomised controlled trial. Lancet 360: 47-53.
113. Strachan, D. P. 1989. Hay fever, hygiene, and household size. BMJ 299: 1259-1260.
114. Wills-Karp, M., J. Santeliz, and C. L. Karp. 2001. The germless theory of allergic disease: revisiting the hygiene hypothesis. Nat. Rev. Immunol. 1: 69-75.
115. Francis, J. N., and S. R. Durham. 2004. Adjuvants for allergen immunotherapy: experimental results and clinical perspectives. Curr. Opin. Allergy Clin. Immunol. 4: 543-548.
116. Renz, H., N. Blumer, S. Virna, S. Sel, and H. Garn. 2006. The immunological basis of the hygiene hypothesis. Chem. Immunol. Allergy 91: 30-48.
117. Li, X. M., K. Srivastava, A. Grishin, C. K. Huang, B. Schofield, W. Burks, and H. A. Sampson. 2003. Persistent protective effect of heat-killed Escherichia coli producing "engineered," recombinant peanut proteins in a murine model of peanut allergy. J. Allergy Clin. Immunol. 112: 159-167.
118. Bigot, A., H. Pagniez, E. Botton, C. Frehel, I. Dubail, C. Jacquet, A. Charbit, and C. Raynaud. 2005. Role of FliF and FliI of Listeria monocytogenes in flagellar assembly and pathogenicity. Infect. Immun. 73: 5530-5539.
119. Hof, H., R. Lampidis, and J. Bensch. 2000. Nosocomial listeria gastroenteritis in a newborn, confirmed by random amplification of polymorphic DNA. Clin. Microbiol. Infect. 6: 683-686.
120. Paterson, Y., and P. C. Maciag. 2005. Listeria-based vaccines for cancer treatment. Curr. Opin. Mol. Ther. 7: 454-460.
121. Yeung, V. P., R. S. Gieni, D. T. Umetsu, and R. H. DeKruyff. 1998. Heat-killed Listeria monocytogenes as an adjuvant converts established murine Th2-dominated immune responses into Th1-dominated responses. J. Immunol. 161: 4146-4152.
122. Hansen, G., V. P. Yeung, G. Berry, D. T. Umetsu, and R. H. DeKruyff. 2000. Vaccination with heat-killed Listeria as adjuvant reverses established allergen-induced airway hyperreactivity and inflammation: role of CD8+ T cells and IL-18. J. Immunol. 164: 223-230.
123. Frick, O. L., S. S. Teuber, B. B. Buchanan, S. Morigasaki, and D. T. Umetsu. 2005. Allergen immunotherapy with heat-killed Listeria monocytogenes alleviates peanut and food-induced anaphylaxis in dogs. Allergy 60: 243-250.
124. Stock, P., O. Akbari, G. Berry, G. J. Freeman, R. H. DeKruyff, and D. T. Umetsu. 2004. Induction of T helper type 1-like regulatory cells that express Foxp3 and protect against airway hyper-reactivity. Nat. Immunol. 5: 1149-1156.
125. Seki, E., H. Tsutsui, N. M. Tsuji, N. Hayashi, K. Adachi, H. Nakano, S. Futatsugi-Yumikura, O. Takeuchi, K. Hoshino, S. Akira, J. Fujimoto, and K. Nakanishi. 2002. Critical roles of myeloid differentiation factor 88-dependent proinflammatory cytokine release in early phase clearance of Listeria monocytogenes in mice. J. Immunol. 169: 3863-3868.
126. Flo, T. H., O. Halaas, E. Lien, L. Ryan, G. Teti, D. T. Golenbock, A. Sundan, and T. Espevik. 2000. Human toll-like receptor 2 mediates monocyte activation by Listeria monocytogenes, but not by group B streptococci or lipopolysaccharide. J. Immunol. 164: 2064-2069.
127. Hemmi, H., O. Takeuchi, T. Kawai, T. Kaisho, S. Sato, H. Sanjo, M. Matsumoto, K. Hoshino, H. Wagner, K. Takeda, and S. Akira. 2000. A Toll-like receptor recognizes bacterial DNA. Nature 408: 740-745.
128. Hayashi, F., K. D. Smith, A. Ozinsky, T. R. Hawn, E. C. Yi, D. R. Goodlett, J. K. Eng, S. Akira, D. M. Underhill, and A. Aderem. 2001. The innate immune response to bacterial flagellin is mediated by Toll-like receptor 5. Nature 410: 1099-1103.
129. Gewirtz, A. T., T. A. Navas, S. Lyons, P. J. Godowski, and J. L. Madara. 2001. Cutting edge: bacterial flagellin activates basolaterally expressed TLR5 to induce epithelial proinflammatory gene expression. J. Immunol. 167: 1882-1885.
130. Lee, S. Y., S. Oh, K. Lee, Y. J. Jang, M. H. Sohn, K. E. Lee, and K. E. Kim. 2005. Murine model of buckwheat allergy by intragastric sensitization with fresh buckwheat flour extract. J. Korean Med. Sci. 20: 566-572.
131. Bohle, B., A. Breitwieser, B. Zwolfer, B. Jahn-Schmid, M. Sara, U. B. Sleytr, and C. Ebner. 2004. A novel approach to specific allergy treatment: the recombinant fusion protein of a bacterial cell surface (S-layer) protein and the major birch pollen allergen Bet v 1 (rSbsC-Bet v 1) combines reduced allergenicity with immunomodulating capacity. J. Immunol. 172: 6642-6648.
132. Levine, M. M., and M. B. Sztein. 2004. Vaccine development strategies for improving immunization: the role of modern immunology. Nat. Immunol. 5: 460-464.
133. Puggioni, F., S. R. Durham, and J. N. Francis. 2005. Monophosphoryl lipid A (MPL) promotes allergen-induced immune deviation in favour of Th1 responses. Allergy 60: 678-684.
134. Bohle, B., B. Jahn-Schmid, D. Maurer, D. Kraft, and C. Ebner. 1999. Oligodeoxynucleotides containing CpG motifs induce IL-12, IL-18 and IFN-gamma production in cells from allergic individuals and inhibit IgE synthesis in vitro. Eur. J. Immunol. 29: 2344-2353.
135. Horner, A. A., J. H. Van Uden, J. M. Zubeldia, D. Broide, and E. Raz. 2001. DNA-based immunotherapeutics for the treatment of allergic disease. Immunol. Rev. 179: 102-118.
136. Creticos, P. S., J. T. Schroeder, R. G. Hamilton, S. L. Balcer-Whaley, A. P. Khattignavong, R. Lindblad, H. Li, R. Coffman, V. Seyfert, J. J. Eiden, and D. Broide. 2006. Immunotherapy with a ragweed-toll-like receptor 9 agonist vaccine for allergic rhinitis. N. Engl. J. Med. 355: 1445-1455.
137. Baldrick, P., D. Richardson, S. R. Woroniecki, and B. Lees. 2007. Pollinex Quattro Ragweed: safety evaluation of a new allergy vaccine adjuvanted with monophosphoryl lipid A (MPL) for the treatment of ragweed pollen allergy. J. Appl. Toxicol. 27: 399-409.
138. Wheeler, A. 2006. A novel adjuvant complex, tyrosine-MPL, for prophylactic and therapeutic vaccines. Vaccine 24 Suppl 2: S2-1.
139. McCormack, P. L., and A. J. Wagstaff. 2006. Ultra-short-course seasonal allergy vaccine (Pollinex Quattro). Drugs 66: 931-938.
140. Lee, S. E., Y. I. Koh, M. K. Kim, Y. R. Kim, S. Y. Kim, J. H. Nam, Y. D. Choi, S. J. Bae, Y. J. Ko, H. J. Ryu, J. T. Koh, H. E. Choy, and J. H. Rhee. 2008. Inhibition of airway allergic disease by co-administration of flagellin with allergen. J. Clin. Immunol. 28: 157-165.
141. Sierro, F., B. Dubois, A. Coste, D. Kaiserlian, J. P. Kraehenbuhl, and J. C. Sirard. 2001. Flagellin stimulation of intestinal epithelial cells triggers CCL20-mediated migration of dendritic cells. Proc. Natl. Acad. Sci. U. S. A 98: 13722-13727.
142. McDonald, W. F., J. W. Huleatt, H. G. Foellmer, D. Hewitt, J. Tang, P. Desai, A. Price, A. Jacobs, V. N. Takahashi, Y. Huang, V. Nakaar, L. Alexopoulou, E. Fikrig, and T. J. Powell. 2007. A West Nile virus recombinant protein vaccine that coactivates innate and adaptive immunity. J. Infect. Dis. 195: 1607-1617.
143. Way, S. S., L. J. Thompson, J. E. Lopes, A. M. Hajjar, T. R. Kollmann, N. E. Freitag, and C. B. Wilson. 2004. Characterization of flagellin expression and its role in Listeria monocytogenes infection and immunity. Cell Microbiol. 6: 235-242.
144. Huleatt, J. W., V. Nakaar, P. Desai, Y. Huang, D. Hewitt, A. Jacobs, J. Tang, W. McDonald, L. Song, R. K. Evans, S. Umlauf, L. Tussey, and T. J. Powell. 2008. Potent immunogenicity and efficacy of a universal influenza vaccine candidate comprising a recombinant fusion protein linking influenza M2e to the TLR5 ligand flagellin. Vaccine 26: 201-214.
145. Huleatt, J. W., A. R. Jacobs, J. Tang, P. Desai, E. B. Kopp, Y. Huang, L. Song, V. Nakaar, and T. J. Powell. 2007. Vaccination with recombinant fusion proteins incorporating Toll-like receptor ligands induces rapid cellular and humoral immunity. Vaccine 25: 763-775.
146. Macnab, R. M. 1992. Genetics and biogenesis of bacterial flagella. Annu. Rev. Genet. 26: 131-158.
147. Salazar-Gonzalez, R. M., and S. J. McSorley. 2005. Salmonella flagellin, a microbial target of the innate and adaptive immune system. Immunol. Lett. 101: 117-122.
148. Dons, L., O. F. Rasmussen, and J. E. Olsen. 1992. Cloning and characterization of a gene encoding flagellin of Listeria monocytogenes. Mol. Microbiol. 6: 2919-2929.
149. Popowska, M., and Z. Markiewicz. 2004. Murein-hydrolyzing activity of flagellin FlaA of Listeria monocytogenes. Pol. J. Microbiol. 53: 237-241.
150. Murthy, K. G., A. Deb, S. Goonesekera, C. Szabo, and A. L. Salzman. 2004. Identification of conserved domains in Salmonella muenchen flagellin that are essential for its ability to activate TLR5 and to induce an inflammatory response in vitro. J. Biol. Chem. 279: 5667-5675.
151. Yonekura, K., S. Maki-Yonekura, and K. Namba. 2003. Complete atomic model of the bacterial flagellar filament by electron cryomicroscopy. Nature 424: 643-650.
152. Samatey, F. A., K. Imada, S. Nagashima, F. Vonderviszt, T. Kumasaka, M. Yamamoto, and K. Namba. 2001. Structure of the bacterial flagellar protofilament and implications for a switch for supercoiling. Nature 410: 331-337.
153. Ben Yedidia, T., and R. Arnon. 2006. Flagella as a platform for epitope-based vaccines. Isr. Med. Assoc. J. 8: 316-318.
154. Westerlund-Wikstrom, B. 2000. Peptide display on bacterial flagella: principles and applications. Int. J. Med. Microbiol. 290: 223-230.
155. Stocker, B. A., and S. M. Newton. 1994. Immune responses to epitopes inserted in Salmonella flagellin. Int. Rev. Immunol. 11: 167-178.
156. Ben Yedidia, T., and R. Arnon. 2005. Towards an epitope-based human vaccine for influenza. Hum. Vaccin. 1: 95-101.
157. Ben Yedidia, T., and R. Arnon. 2007. Epitope-based vaccine against influenza. Expert. Rev. Vaccines. 6: 939-948.
158. Ben Yedidia, T., and R. Arnon. 1998. Effect of pre-existing carrier immunity on the efficacy of synthetic influenza vaccine. Immunol. Lett. 64: 9-15.
159. Kajikawa, A., and S. Igimi. 2010. Innate and acquired immune responses induced by recombinant Lactobacillus casei displaying flagellin-fusion antigen on the cell-surface. Vaccine 28: 3409-3415.
160. Carsiotis, M., D. L. Weinstein, H. Karch, I. A. Holder, and A. D. O'Brien. 1984. Flagella of Salmonella typhimurium are a virulence factor in infected C57BL/6J mice. Infect. Immun. 46: 814-818.
161. Novak, N., E. Gros, T. Bieber, and J. P. Allam. 2010. Human skin and oral mucosal dendritic cells as 'good guys' and 'bad guys' in allergic immune responses. Clin. Exp. Immunol.
162. Novak, N., S. Koch, J. P. Allam, and T. Bieber. 2010. Dendritic cells: bridging innate and adaptive immunity in atopic dermatitis. J. Allergy Clin. Immunol. 125: 50-59.
163. Uematsu, S., M. H. Jang, N. Chevrier, Z. Guo, Y. Kumagai, M. Yamamoto, H. Kato, N. Sougawa, H. Matsui, H. Kuwata, H. Hemmi, C. Coban, T. Kawai, K. J. Ishii, O. Takeuchi, M. Miyasaka, K. Takeda, and S. Akira. 2006. Detection of pathogenic intestinal bacteria by Toll-like receptor 5 on intestinal CD11c+ lamina propria cells. Nat. Immunol. 7: 868-874.
164. Uematsu, S., and S. Akira. 2009. Immune responses of TLR5(+) lamina propria dendritic cells in enterobacterial infection. J. Gastroenterol.
165. Smith, K. D., and A. Ozinsky. 2002. Toll-like receptor-5 and the innate immune response to bacterial flagellin. Curr. Top. Microbiol. Immunol. 270: 93-108.
166. Prince, A. 2006. Flagellar activation of epithelial signaling. Am. J. Respir. Cell Mol. Biol. 34: 548-551.
167. Crellin, N. K., R. V. Garcia, O. Hadisfar, S. E. Allan, T. S. Steiner, and M. K. Levings. 2005. Human CD4+ T cells express TLR5 and its ligand flagellin enhances the suppressive capacity and expression of FOXP3 in CD4+CD25+ T regulatory cells. J. Immunol. 175: 8051-8059.
168. Caron, G., D. Duluc, I. Fremaux, P. Jeannin, C. David, H. Gascan, and Y. Delneste. 2005. Direct stimulation of human T cells via TLR5 and TLR7/8: flagellin and R-848 up-regulate proliferation and IFN-gamma production by memory CD4+ T cells. J. Immunol. 175: 1551-1557.
169. Tallant, T., A. Deb, N. Kar, J. Lupica, M. J. de Veer, and J. A. DiDonato. 2004. Flagellin acting via TLR5 is the major activator of key signaling pathways leading to NF-kappa B and proinflammatory gene program activation in intestinal epithelial cells. BMC. Microbiol. 4: 33.
170. Zeng, H., A. Q. Carlson, Y. Guo, Y. Yu, L. S. Collier-Hyams, J. L. Madara, A. T. Gewirtz, and A. S. Neish. 2003. Flagellin is the major proinflammatory determinant of enteropathogenic Salmonella. J. Immunol. 171: 3668-3674.
171. Sanders, C. J., D. A. Moore, III, I. R. Williams, and A. T. Gewirtz. 2008. Both radioresistant and hemopoietic cells promote innate and adaptive immune responses to flagellin. J. Immunol. 180: 7184-7192.
172. Abreu, M. T., P. Vora, E. Faure, L. S. Thomas, E. T. Arnold, and M. Arditi. 2001. Decreased expression of Toll-like receptor-4 and MD-2 correlates with intestinal epithelial cell protection against dysregulated proinflammatory gene expression in response to bacterial lipopolysaccharide. J. Immunol. 167: 1609-1616.
173. Pedersen, G., L. Andresen, M. W. Matthiessen, J. Rask-Madsen, and J. Brynskov. 2005. Expression of Toll-like receptor 9 and response to bacterial CpG oligodeoxynucleotides in human intestinal epithelium. Clin. Exp. Immunol. 141: 298-306.
174. Pokoj, S., I. Lauer, K. Fotisch, M. Himly, A. Mari, E. Enrique, M. M. Miguel-Moncin, J. Lidholm, S. Vieths, and S. Scheurer. 2010. Pichia pastoris is superior to E. coli for the production of recombinant allergenic non-specific lipid-transfer proteins. Protein Expr. Purif. 69: 68-75.
175. Laemmli, U. K. 1970. Cleavage of structural proteins during the assembly of the head of bacteriophage T4. Nature 227: 680-685.
176. Adachi, O., T. Kawai, K. Takeda, M. Matsumoto, H. Tsutsui, M. Sakagami, K. Nakanishi, and S. Akira. 1998. Targeted disruption of the MyD88 gene results in loss of IL-1- and IL-18-mediated function. Immunity. 9: 143-150.
177. Mende Stefan. 2008. Herstellung und Charakterisierung eines potentiellen Impfstoffs zur spezifischen Immuntherapie von schweren Lebensmittelallergien (Bachelor Thesis, Furtwangen University).
178. Waibler, Z., C. N. Detje, J. C. Bell, and U. Kalinke. 2007. Matrix protein mediated shutdown of host cell metabolism limits vesicular stomatitis virus-induced interferon-alpha responses to plasmacytoid dendritic cells. Immunobiology 212: 887-894.
179. Huang, H., G. R. Ostroff, C. K. Lee, C. A. Specht, and S. M. Levitz. 2010. Robust Stimulation of Humoral and Cellular Immune Responses following Vaccination with Antigen-Loaded beta-Glucan Particles. MBio. 1.
180. Ben Yedidia, T., and R. Arnon. 2006. Flagella as a platform for epitope-based vaccines. Isr. Med. Assoc. J. 8: 316-318.
181. Ben Yedidia, T., and R. Arnon. 2005. Towards an epitope-based human vaccine for influenza. Hum. Vaccin. 1: 95-101.
182. Bates, J. T., S. Uematsu, S. Akira, and S. B. Mizel. 2009. Direct stimulation of tlr5+/+ CD11c+ cells is necessary for the adjuvant activity of flagellin. J. Immunol. 182: 7539-7547.
183. Didierlaurent, A., I. Ferrero, L. A. Otten, B. Dubois, M. Reinhardt, H. Carlsen, R. Blomhoff, S. Akira, J. P. Kraehenbuhl, and J. C. Sirard. 2004. Flagellin promotes myeloid differentiation factor 88-dependent development of Th2-type response. J. Immunol. 172: 6922-6930.
184. Jutel, M., M. Akdis, F. Budak, C. Aebischer-Casaulta, M. Wrzyszcz, K. Blaser, and C. A. Akdis. 2003. IL-10 and TGF-beta cooperate in the regulatory T cell response to mucosal allergens in normal immunity and specific immunotherapy. Eur. J. Immunol. 33: 1205-1214.
185. Akdis, M., K. Blaser, and C. A. Akdis. 2006. T regulatory cells in allergy. Chem. Immunol. Allergy 91: 159-173.
186. Boonstra, A., R. Rajsbaum, M. Holman, R. Marques, C. Asselin-Paturel, J. P. Pereira, E. E. Bates, S. Akira, P. Vieira, Y. J. Liu, G. Trinchieri, and A. O'Garra. 2006. Macrophages and myeloid dendritic cells, but not plasmacytoid dendritic cells, produce IL-10 in response to MyD88- and TRIF-dependent TLR signals, and TLR-independent signals. J. Immunol. 177: 7551-7558.
187. Edwards, A. D., S. P. Manickasingham, R. Sporri, S. S. Diebold, O. Schulz, A. Sher, T. Kaisho, S. Akira, and Reis e Sousa. 2002. Microbial recognition via Toll-like receptor-
dependent and -independent pathways determines the cytokine response of murine dendritic cell subsets to CD40 triggering. J. Immunol. 169: 3652-3660.
188. Agrawal, S., A. Agrawal, B. Doughty, A. Gerwitz, J. Blenis, T. Van Dyke, and B. Pulendran. 2003. Cutting edge: different Toll-like receptor agonists instruct dendritic cells to induce distinct Th responses via differential modulation of extracellular signal-regulated kinase-mitogen-activated protein kinase and c-Fos. J. Immunol. 171: 4984-4989.
189. Moore, K. W., M. R. de Waal, R. L. Coffman, and A. O'Garra. 2001. Interleukin-10 and the interleukin-10 receptor. Annu. Rev. Immunol. 19: 683-765.
190. Ureta, G., F. Osorio, J. Morales, M. Rosemblatt, M. R. Bono, and J. A. Fierro. 2007. Generation of dendritic cells with regulatory properties. Transplant. Proc. 39: 633-637.
191. Kwan, W. H., C. Boix, N. Gougelet, W. H. Fridman, and C. G. Mueller. 2007. LPS induces rapid IL-10 release by M-CSF-conditioned tolerogenic dendritic cell precursors. J. Leukoc. Biol. 82: 133-141.
192. Zindler, E., N. Gehrke, C. Luft, S. Reuter, C. Taube, S. Finotto, A. B. Reske-Kunz, and S. Sudowe. 2008. Divergent effects of biolistic gene transfer in a mouse model of allergic airway inflammation. Am. J. Respir. Cell Mol. Biol. 38: 38-46.
193. Uematsu, S., and S. Akira. 2009. Immune responses of TLR5(+) lamina propria dendritic cells in enterobacterial infection. J. Gastroenterol.
194. Means, T. K., F. Hayashi, K. D. Smith, A. Aderem, and A. D. Luster. 2003. The Toll-like receptor 5 stimulus bacterial flagellin induces maturation and chemokine production in human dendritic cells. J. Immunol. 170: 5165-5175.
195. Cuadros, C., F. J. Lopez-Hernandez, A. L. Dominguez, M. McClelland, and J. Lustgarten. 2004. Flagellin fusion proteins as adjuvants or vaccines induce specific immune responses. Infect. Immun. 72: 2810-2816.
196. Song, L., V. Nakaar, U. Kavita, A. Price, J. Huleatt, J. Tang, A. Jacobs, G. Liu, Y. Huang, P. Desai, G. Maksymiuk, V. Takahashi, S. Umlauf, L. Reiserova, R. Bell, H. Li, Y. Zhang, W. F. McDonald, T. J. Powell, and L. Tussey. 2008. Efficacious recombinant influenza vaccines produced by high yield bacterial expression: a solution to global pandemic and seasonal needs. PLoS. ONE. 3: e2257.
197. Weimer, E. T., S. E. Ervin, D. J. Wozniak, and S. B. Mizel. 2009. Immunization of young African green monkeys with OprF epitope 8-OprI-type A- and B-flagellin fusion proteins promotes the production of protective antibodies against nonmucoid Pseudomonas aeruginosa. Vaccine 27: 6762-6769.
198. Salman, H. H., J. M. Irache, and C. Gamazo. 2009. Immunoadjuvant capacity of flagellin and mannosamine-coated poly(anhydride) nanoparticles in oral vaccination. Vaccine.
199. Smith, K. D., E. Andersen-Nissen, F. Hayashi, K. Strobe, M. A. Bergman, S. L. Barrett, B. T. Cookson, and A. Aderem. 2003. Toll-like receptor 5 recognizes a conserved site on flagellin required for protofilament formation and bacterial motility. Nat. Immunol. 4: 1247-1253.
200. Miao, E. A., C. M. Alpuche-Aranda, M. Dors, A. E. Clark, M. W. Bader, S. I. Miller, and A. Aderem. 2006. Cytoplasmic flagellin activates caspase-1 and secretion of interleukin 1beta via Ipaf. Nat. Immunol. 7: 569-575.
201. Franchi, L., A. Amer, M. Body-Malapel, T. D. Kanneganti, N. Ozoren, R. Jagirdar, N. Inohara, P. Vandenabeele, J. Bertin, A. Coyle, E. P. Grant, and G. Nunez. 2006. Cytosolic flagellin requires Ipaf for activation of caspase-1 and interleukin 1beta in salmonella-infected macrophages. Nat. Immunol. 7: 576-582.
202. Ren, T., D. S. Zamboni, C. R. Roy, W. F. Dietrich, and R. E. Vance. 2006. Flagellin-deficient Legionella mutants evade caspase-1- and Naip5-mediated macrophage immunity. PLoS. Pathog. 2: e18.
203. Zamboni, D. S., K. S. Kobayashi, T. Kohlsdorf, Y. Ogura, E. M. Long, R. E. Vance, K. Kuida, S. Mariathasan, V. M. Dixit, R. A. Flavell, W. F. Dietrich, and C. R. Roy. 2006. The Birc1e cytosolic pattern-recognition receptor contributes to the detection and control of Legionella pneumophila infection. Nat. Immunol. 7: 318-325.
204. Khan, S., M. S. Bijker, J. J. Weterings, H. J. Tanke, G. J. Adema, T. van Hall, J. W. Drijfhout, C. J. Melief, H. S. Overkleeft, G. A. van der Marel, D. V. Filippov, S. H. van der Burg, and F. Ossendorp. 2007. Distinct uptake mechanisms but similar intracellular processing of two different toll-like receptor ligand-peptide conjugates in dendritic cells. J. Biol. Chem. 282: 21145-21159.
205. Blander, J. M., and R. Medzhitov. 2006. Toll-dependent selection of microbial antigens for presentation by dendritic cells. Nature 440: 808-812.
206. Mizel, S. B., and J. T. Bates. 2010. Flagellin as an adjuvant: cellular mechanisms and potential. J. Immunol. 185: 5677-5682.
207. Sewell, D. A., V. Shahabi, G. R. Gunn, III, Z. K. Pan, M. E. Dominiecki, and Y. Paterson. 2004. Recombinant Listeria vaccines containing PEST sequences are potent immune adjuvants for the tumor-associated antigen human papillomavirus-16 E7. Cancer Res. 64: 8821-8825.
208. Zaborsky, N., M. Brunner, M. Wallner, M. Himly, T. Karl, R. Schwarzenbacher, F. Ferreira, and G. Achatz. 2010. Antigen aggregation decides the fate of the allergic immune response. J. Immunol. 184: 725-735.
209. Legge, K. L., B. Min, J. J. Bell, J. C. Caprio, L. Li, R. K. Gregg, and H. Zaghouani. 2000. Coupling of peripheral tolerance to endogenous interleukin 10 promotes effective modulation of myelin-activated T cells and ameliorates experimental allergic encephalomyelitis. J. Exp. Med. 191: 2039-2052.
210. Wiedermann, U. 2005. Prophylaxis and therapy of allergy by mucosal tolerance induction with recombinant allergens or allergen constructs. Curr. Drug Targets. Inflamm. Allergy 4: 577-583.
211. de Leon, M. P., J. M. Rolland, and R. E. O'Hehir. 2007. The peanut allergy epidemic: allergen molecular characterisation and prospects for specific therapy. Expert. Rev. Mol. Med. 9: 1-18.
212. Cromwell, O., R. Suck, H. Kahlert, A. Nandy, B. Weber, and H. Fiebig. 2004. Transition of recombinant allergens from bench to clinical application. Methods 32: 300-312.
213. Merlo, A., C. Calcaterra, S. Menard, and A. Balsari. 2007. Cross-talk between toll-like receptors 5 and 9 on activation of human immune responses. J. Leukoc. Biol. 82: 509-518.
214. Kabelitz, D. 2007. Expression and function of Toll-like receptors in T lymphocytes. Curr. Opin. Immunol. 19: 39-45.
215. Jeannin, P., S. Lecoanet, Y. Delneste, J. F. Gauchat, and J. Y. Bonnefoy. 1998. IgE versus IgG4 production can be differentially regulated by IL-10. J. Immunol. 160: 3555-3561.
216. Braga, C. J., L. M. Massis, M. E. Sbrogio-Almeida, B. C. Alencar, D. Y. Bargieri, S. B. Boscardin, M. M. Rodrigues, and L. C. Ferreira. 2010. CD8+ T cell adjuvant effects of Salmonella FliCd flagellin in live vaccine vectors or as purified protein. Vaccine 28: 1373-1382.
217. Rothman, P., S. Lutzker, W. Cook, R. Coffman, and F. W. Alt. 1988. Mitogen plus interleukin 4 induction of C epsilon transcripts in B lymphoid cells. J. Exp. Med. 168: 2385-2389.
218. Snapper, C. M., L. M. Pecanha, A. D. Levine, and J. J. Mond. 1991. IgE class switching is critically dependent upon the nature of the B cell activator, in addition to the presence of IL-4. J. Immunol. 147: 1163-1170.
219. Kawano, Y., T. Noma, and J. Yata. 1994. Regulation of human IgG subclass production by cytokines. IFN-gamma and IL-6 act antagonistically in the induction of human IgG1 but additively in the induction of IgG2. J. Immunol. 153: 4948-4958.
220. Albrecht, M., Y. Suezer, C. Staib, G. Sutter, S. Vieths, and G. Reese. 2008. Vaccination with a Modified Vaccinia Virus Ankara-based vaccine protects mice from allergic sensitization. J. Gene Med. 10: 1324-1333.
221. Wachholz, P. A., and S. R. Durham. 2004. Mechanisms of immunotherapy: IgG revisited. Curr. Opin. Allergy Clin. Immunol. 4: 313-318.
222. Schmitz, N., K. Dietmeier, M. Bauer, M. Maudrich, S. Utzinger, S. Muntwiler, P. Saudan, and M. F. Bachmann. 2009. Displaying Fel d1 on virus-like particles prevents reactogenicity despite greatly enhanced immunogenicity: a novel therapy for cat allergy. J. Exp. Med. 206: 1941-1955.
223. Reisinger, J., F. Horak, G. Pauli, M. van Hage, O. Cromwell, F. Konig, R. Valenta, and V. Niederberger. 2005. Allergen-specific nasal IgG antibodies induced by vaccination with genetically modified allergens are associated with reduced nasal allergen sensitivity. J. Allergy Clin. Immunol. 116: 347-354.
224. Bargieri, D. Y., J. A. Leite, S. C. Lopes, M. E. Sbrogio-Almeida, C. J. Braga, L. C. Ferreira, I. S. Soares, F. T. Costa, and M. M. Rodrigues. 2010. Immunogenic properties of a recombinant fusion protein containing the C-terminal 19 kDa of Plasmodium falciparum merozoite surface protein-1 and the innate immunity agonist FliC flagellin of Salmonella typhimurium. Vaccine 28: 2818-2826.
225. Weimer, E. T., H. Lu, N. D. Kock, D. J. Wozniak, and S. B. Mizel. 2009. A fusion protein vaccine containing OprF epitope 8, OprI, and type A and B flagellins promotes enhanced clearance of nonmucoid Pseudomonas aeruginosa. Infect. Immun. 77: 2356-2366.
226. Daniel, C., A. Repa, C. Wild, A. Pollak, B. Pot, H. Breiteneder, U. Wiedermann, and A. Mercenier. 2006. Modulation of allergic immune responses by mucosal application of recombinant lactic acid bacteria producing the major birch pollen allergen Bet v 1. Allergy 61: 812-819.
227. Repa, A., C. Grangette, C. Daniel, R. Hochreiter, K. Hoffmann-Sommergruber, J. Thalhamer, D. Kraft, H. Breiteneder, A. Mercenier, and U. Wiedermann. 2003. Mucosal co-application of lactic acid bacteria and allergen induces counter-regulatory immune responses in a murine model of birch pollen allergy. Vaccine 22: 87-95.
228. Huang, C. F., C. C. Wang, T. C. Wu, C. H. Chu, and H. J. Peng. 2007. Effect of sublingual administration with a native or denatured protein allergen and adjuvant CpG oligodeoxynucleotides or cholera toxin on systemic T(H)2 immune responses and mucosal immunity in mice. Ann. Allergy Asthma Immunol. 99: 443-452.
229. Sun, J. B., C. Czerkinsky, and J. Holmgren. 2007. Sublingual 'oral tolerance' induction with antigen conjugated to cholera toxin B subunit generates regulatory T cells that induce apoptosis and depletion of effector T cells. Scand. J. Immunol. 66: 278-286.
230. De Almeida, M. E., S. M. Newton, and L. C. Ferreira. 1999. Antibody responses against flagellin in mice orally immunized with attenuated Salmonella vaccine strains. Arch. Microbiol. 172: 102-108.