1
Flash-Point Prediction for Binary Partially Miscible
Aqueous-Organic Mixtures
Horng-Jang Liaw a, Chien-Tsun Chen
a, Vincent Gerbaud
b
aDepartment of Occupational Safety and Health
China Medical University
Taichung, Taiwan, R.O.C.
bUniversité de Toulouse, LGC (Laboratoire de Génie Chimique), CNRS, INP, UPS
5 allées Emile Monso, F-31029 Toulouse cedex 4, France
Address correspondence to:
Dr. Horng-Jang Liaw
Department of Occupational Safety and Health
China Medical University
91 Hsueh-Shih Rd., Taichung, Taiwan
Tel: 886-4-22053366 ext. 6209
Fax: 886-4-22030418
E-mail: [email protected]
2
Flash-Point Prediction for Binary Partially Miscible
Aqueous-Organic Mixtures
aHorng-Jang Liaw,
aChien-Tsun Chen,
bVincent Gerbaud
aDepartment of Occupational Safety and Health, China Medical University
91 Hsueh-Shih Rd., Taichung, Taiwan
bUniversité de Toulouse, LGC (Laboratoire de Génie Chimique)
CNRS, INP, UPS
5 allée Emile Monso, F-31029 Toulouse Cedex 4, France
ABSTRACT
Flash point is the most important variable used to characterize fire and explosion
hazard of liquids. Herein, partially miscible mixtures are presented within the context
of liquid-liquid extraction processes and heterogeneous distillation processes. This
paper describes development of a model for predicting the flash point of binary
partially miscible mixtures of aqueous-organic system. To confirm the predictive
efficiency of the derived flash points, the model was verified by comparing the
predicted values with the experimental data for the studied mixtures: water +
1-butanol; water + 2-butanol; water + isobutanol; water + 1-pentanol; and, water +
octane. Results reveal that immiscibility in the two liquid phases should not be
ignored in the prediction of flash point. Overall, the predictive results of this proposed
model describe the experimental data well when using the LLE and VLE parameters
to estimate sequentially the span of two liquid phases and the flash point, respectively.
Potential application for the model concerns the assessment of fire and explosion
hazards, and the development of inherently safer designs for chemical processes
containing binary partially miscible mixtures of aqueous-organic system.
Keywords: Flash point; Prediction; Partially miscible mixtures; Aqueous-organic
solution; Vapor-liquid-liquid equilibrium
1
1. Introduction
In a given liquid, the flash point is the temperature determined experimentally at
which the substance emits sufficient vapor to form a combustible mixture with air
(CCPS/AIChE, 1993). The lower the flash-point value, the greater is the fire and
explosion hazard (Lees, 1996). Recently, the importance of flash point was
dramatically highlighted in Taiwan after a series of explosions of essential oils and
after the Shengli event. In the former series of accidents, six blasts occurring from
January through August of 2003, left eight people badly burnt. The fire and
explosion hazard of liquids, such as essential oils, is primarily characterized by their
flash point (Crowl and Louvar, 2002). During the Shengli event waste organic
solvents were illegally dumped into the Kaoping River (southern Taiwan), causing
serious water pollution in 2000, leading the government to require that large
quantities of waste organic solutions must be stored temporarily at various factory
sites or industrial park precincts (Liaw et al., 2002; Liaw and Chiu, 2003). Waste
solutions were also diluted with water to diminish hazard at plants located in the
Hsinchu Science-based Industrial Park (Taiwan) (Liaw and Chiu, 2003). However,
test results using the Flash Point Analyzer indicated that the flash points of such
waste solutions remain low despite dilution with large amounts of water. If detailed
flash point variation with composition data for the specified aqueous-organic
solution had been available at the time of the Shengli event, this attempted dilution
of waste solutions to reduce the associated hazard might not have occurred. Thus,
flash-point data knowledge for these mixtures has become increasingly important to
ensure the safety of this voluminous storage. In addition to the usage and
accumulation of flammable liquids, such as is outlined above, the transportation
requirements for these mixtures are primarily related to their flash-point values
(DOT, 2004).
In Taiwan, the GHS (Globally Harmonized System of Classification and
Labeling of Chemicals) will be implemented in 2008. In the implementation of
GHS, the flash point of mixtures is the critical property in the classification of
flammable liquids. Unfortunately, flash-point data for a variety of mixtures are
scarce in the literature, although composition ranges for specific mixtures used or
produced in an industrial process can vary quite substantially. Since the cost of
flash-point data derived from test instruments is very expensive in Taiwan
(NT$20,000/US$600 per sample), a model for predicting the flash point of a given
mixture is useful. Partially miscible mixtures are used in liquid-liquid extraction
processes (Kurihara, et al., 2002; Matsuda and Ochi, 2004) and heterogeneous
distillation processes (Kosuge and Iwakabe, 2005). The flash-point value for a
given substance is relative to its vapor pressure (Lees, 1996). As the estimation of
2
vapor pressure for partially miscible mixtures is different from that for miscible
analogues, we infer that flash point behavior for the two mixture types will be
different. Thus, a model that allows prediction of the flash point of partially
miscible mixtures is urgently required to facilitate evaluation of fire and explosion
hazard.
Crowl and Louvar (2002) have suggested a method for the estimation of the
flash point of a liquid solution with a single flammable component. However, it was
shown to be adequate only when the flammable component composition approaches
unity for binary aqueous-organic solutions (Liaw and Chiu, 2003), and it is not
applicable to solvent/salt systems, even in a similar composition range (Liaw and
Wang, 2007). Introducing activity coefficient models to model the non-ideal
behavior of liquids, various models have been proposed recently for predicting the
flash point of binary aqueous-organic and solvent/salt systems (Liaw and Chiu,
2003; Liaw and Wang, 2007), with successful verification based on comparison
with the experimental data. Previously, Affens and McLaren (1972) first developed
a predictive model to determine the flash points of binary hydrocarbon mixtures
based on Raoult’s law that assumes ideality of the liquid solution. White et al.,
(1997) reduced the Raoult’s law based model to a simpler equation by ignoring any
dependence of the lower flammable limit on temperature, with little practical
application. We have proposed recently a model for predicting the flash point of
multi-component mixtures of only flammable compounds (Liaw et al., 2004) and
verified its worth using experimental data for ternary solutions. This model can be
simplified for binary solutions, as proposed previously (Liaw et al., 2002), with
prediction of flash points verified for both ideal and non-ideal mixtures (Liaw et al.,
2002, 2003; Liaw and Lin, 2007). Garland and Malcolm (2002) developed a
statistical model to predict the flash point of organic acid-water solutions at an
Eastman Chemical facility: acetic acid + propionic acid + butyric acid + water.
However, it deviated significantly from the experimental measurements for multiple
organic-water solutions (Liaw and Chiu, 2006).
Overall, application of the former models (Affens and McLaren, 1972; Crowl
and Louvar, 2002; Garland and Malcolm, 2002; White et al., 1997) is limited to
solutions that can be assumed as ideal within the composition range considered. The
new models we have developed take into account the non-ideality of the solution
through liquid phase activity coefficients and have been used to predict efficiently
the flash point of several miscible mixtures (Liaw et al., 2002, 2004; Liaw and Chiu,
2003, 2006; Liaw and Wang, 2007). Non-ideality of the liquid phase is in particular
responsible to the occurrence of extreme flash-point behavior such as minimum and
maximum flash-point behavior (Catoire and Paulmier, 2006; Liaw et al., 2003,
3
2008; Liaw and Lin, 2007; Vidal et al., 2006). This is similar to minimum boiling
and maximum-boiling azeotropic behavior in vapor-liquid equilibrium. The
conditions for identifying whether a binary mixture is able to exhibit a minimum or
maximum flash point behavior were derived previously (Liaw et al., 2003; Liaw
and Lin, 2007). Vidal et al., (2006) used Liaw et al.’s model (2002) using
COSMO-RS instead of NRTL, Wilson or UNIQUAC equation to estimate the
activity coefficient at infinite dilution to predict the minimum flash-point behavior
for binary mixtures. For given pressure and temperature conditions at which
vapor-liquid equilibrium occur, stronger non-ideality within a mixture may often
lead to the partial miscibility of the liquid phase, eventually coupled with the
occurrence of a so-called heteroazeotrope. We suspect that similar behavior happens
for flash point. The model for predicting the flash point of partially miscible
mixtures of binary flammable solvents was proposed by Liaw et al. (2008).
However, to our knowledge no applicable model has been available for partially
miscible mixtures of aqueous-organic system where only one of the two
components of the mixture is flammable. In this manuscript, a model for such
mixtures is investigated for the partially miscible aqueous-organic solutions: water
+ 1-butanol, water + 2-butanol, water + isobutanol, water + 1-pentanol and water +
octane.
Based upon the definition of flash point (Lees, 1996), it is necessary to estimate
the vapor-phase composition of flammable substances from a vapor-liquid
equilibrium model in order to predict their flash point. Furthermore, it is
acknowledged that partial miscibility occurs because of significant interaction
within the non-ideal liquid solution. For such solutions, liquid-phase activity
coefficients must be taken into account in the vapor-liquid equilibrium equation by
means of thermodynamic models. Among common activity coefficient models, the
original Wilson thermodynamic model (Wilson, 1964) is not applicable for
evaluating the liquid-phase activity coefficients for mixtures that exhibit a
miscibility gap (Poling et al., 2001). On the other hand, the NRTL (Renon and
Prausnitz, 1968) and UNIQUAC thermodynamic models (Abrams and Prausnitz,
1975) are applicable to both vapor-liquid and liquid-liquid equilibria (Poling et al.,
2001).
2. Experimental protocol
An HFP 362-Tag Flash Point Analyzer (Walter Herzog GmbH, Germany),
which meets the requirement of ASTM D56 (ASTM, 1999) standard, was used to
measure the flash points for a variety of aqueous-organic solutions (water +
1-butanol, water + 2-butanol, water + isobutanol, water + 1-pentanol and water +
4
octane) at different compositions. The basic system configuration of the Tag close
cup tester is given in Fig. 1. The apparatus consists of an external cooling system,
test cup, heating block, electric igniter, measuring module, thermometer and
indicator/operating display. The apparatus incorporates control devices that
program the instrument to heat the sample at a specified heating rate within a
temperature range close to the expected flash point. The flash point is automatically
tested using an igniter at specified temperature test intervals. If the expected flash
point is lower than or equal to the change temperature, heating rate-1 is used and
the igniter is fired at test interval-1. If the expected flash point is higher, heating
rate-2 is adopted and the igniter is fired at test interval-2. The first flash-point test
series is initiated at a temperature equivalent to the expected flash point minus the
start-test value. If the flash point is not determined when the test temperature
exceeds the sum of the expected flash point plus the end-of-test value, the
experimental iteration is terminated. The instrument operation is conducted
according to the standard ASTM D56 test protocol (ASTM, 1999) using the
selected parameters: start test 5 ºC; end of test 20 ºC; heat rate-1 1 ºC/min; heat
rate-2 3 ºC/min; change temperature 60 ºC; test interval-1 0.5 ºC; and, test
interval-2 1.0 ºC. The liquid mole fraction is determined from mass measured using
a Setra digital balance (EL-410D: sensitivity 0.001 g, maximum load 100 g). A
magnetic stirrer provides sufficient agitation for the test samples. The prepared
mixtures were stirred for 30 minutes before the flash point test. A Milli-Q plus was
used for water purification. Isobutanol was HPLC/Spectro-grade reagent (Tedia Co.
Inc.; USA); 1-butanol, 1-pentanol and octane were also sourced from Tedia.
2-butanol was purchased from Fisher Scientific International Inc. (USA).
3. Mathematical formulation
3.1 The general model for predicting the flash point of miscible mixtures
The flash point of a flammable liquid is the temperature at which the vapor
pressure of the liquid is such that it produces a concentration of vapor in the air that
corresponds to its lower flammable limit (LFL) (Lees, 1996). Thus, at the flash
point of a liquid solution, Le Chatelier’s rule (1891) that describes the lower
flammable limit of a gas mixture, is followed:
)1( 1 LFL
y
lki i
i∑≠
=
where yi is the mole fraction of the flammable substance, i, in the vapor phase, LFLi
is its lower flammable limit, and kl is the non-flammable components of the
mixture.
From the definition of the flash point for a pure substance (Lees, 1996), the LFL
5
of component i, LFLi, is expressed in terms of its saturated vapor pressure evaluated
at the flash point temperature, sat
fpiP , :
)2( ,
P
PLFL
sat
fpi
i =
where P is the ambient pressure. The flash point for a substance is generally
measured at atmospheric pressure, which is low enough for the gas phase to behave
as a perfect gas. Thus, the vapor-phase composition, yi, can be derived from the
vapor-liquid equilibrium (VLE) between a non-ideal liquid and a perfect gas as:
(3) P
Pxy
sat
iiii
γ=
Substituting Eqs. (2) and (3) into Eq. (1):
)4( 1,
P
Px
lkisat
fpi
sat
iii∑≠
=γ
The saturated vapor pressure variation with temperature for a pure substance, i, can
be estimated using the Antoine equation:
(5) logi
i
i
sat
iCT
BAP
+−=
The vapor pressure of the pure substance, i, at its flash point, sat
fpiP , , as presented in
Eq. (4), can be estimated by substituting Ti,fp, the flash point of component i, into
the Antoine equation.
The activity coefficients γi in Eq. (4), can be estimated using the thermodynamic model, such as: Wilson (Wilson, 1964), NRTL (Renon and Prausnitz, 1968) or
UNIQUAC equations (Abrams and Prausnitz, 1975).
The general flash point prediction model developed for a miscible solution is
described using Eqs. (4), (5) and any equation for estimating activity coefficient.
The temperature that satisfies these equations is the flash point of a miscible
solution (Liaw and Chiu, 2006).
For a binary aqueous-organic solution, the water vapor is non-flammable, thus,
Eq. (4) is reduced to:
)6( 1,2
222
sat
fp
sat
P
Px γ=
with the flammable component denoted as component 2 and water denoted as
component 1.
3.2 The model for partially miscible mixtures of aqueous-organic system
Within the mutual-solubility region of a binary partially miscible
aqueous-organic mixture, only one liquid phase is present and the variation of the
vapor pressure with liquid-phase composition identical to that for a miscible
6
mixture. Thus, the flash point in such a region can be evaluated by the method for a
binary miscible analogue (Liaw and Chiu, 2003):
)6( 1,2
222
sat
fp
sat
P
Px γ=
(7) log2
222
CT
BAP sat
+−=
Liquid-phase activity coefficients γi enable to tackle the non-ideal behavior of the liquid phase that results in the partial-miscibility. Vapor phase is assumed to behave
as a perfect gas as is usual under low to moderate pressure condition (Van Ness and
Abbott, 1982).
Within the partially miscible region of a binary partially miscible mixture, two
liquid phases are in equilibrium with their compositions defining a so-called tie line.
Since any liquid composition located on this tie-line, in particular the overall
composition of both liquid phases in equilibrium, is in equilibrium with a single
vapor composition located on the so-called vapor line (Van Ness and Abbott, 1982;
Pham and Doherty, 1990), the flash point in this region should keep constant
whatever the liquid composition on the liquid-liquid equilibrium tie line.
The compositions between liquid phases in equilibrium can be estimated by the
equilibrium equality of the compound fugacities in each phase:
(8) 2,1 )()( == ixx iiii
βα γγ
where α and β designate the two coexisting liquid phases. The activity coefficients γi in Eqs. (6) and (8), should be estimated using thermodynamic activity coefficient models adequate for partially miscible mixtures, such as the NRTL (Renon and
Prausnitz, 1968) or UNIQUAC equations (Abrams and Prausnitz, 1975); both
models are employed in this study (Table 1).
The flash point temperature prediction model developed for a binary partially
miscible aqueous-organic solution is described using Eqs. (6) - (8), and any suitable
thermodynamic model for estimating liquid-phase activity coefficient. The
procedure for evaluating the flash point for binary partially miscible
aqueous-organic mixtures is depicted in Fig. 2. It requires knowledge of the pure
component flash point temperature and suitable binary interaction parameters used
in the activity coefficient model. The two liquid phases region and the flash point in
this region are first estimated by Eqs. (6) - (8). Then, the flash point in the
mutual-solubility region is calculated using Eqs. (6) - (7). The iterative procedure is
analogous to that used for calculating the boiling and dew points of mixtures (Smith
and Van Ness, 1975).
4. Results and discussion
7
4.1 Parameters used in this manuscript
The flash-point model for partially miscible mixtures of one flammable solvent
with water was used for water + 1-butanol, water + 2-butanol, water + isobutanol,
water + 1-pentanol, and water + octane mixtures. The prediction results were
compared with experimental data. The liquid-phase activity coefficients for these
five mixtures were estimated using the NRTL (Renon and Prausnitz, 1968) and/or
UNIQUAC equations (Abrams and Prausnitz, 1975). The binary interaction
parameters of the NRTL/UNIQUAC equations obtained from the LLE data and
VLE data were both used in this study, with parameters adopted from the literature
(Gmehling et al., 1981; Klauck et al., 2006; Kosuge and Iwakabe, 2005; Lu et al.,
2002; Resa et al., 2006; Tang et al., 1995) (Tables 2, 3). The parameters for relative
van der Waals volume (r) and the surface area (q) for the pure components needed
for the UNIQUAC equation were obtained from the literature (Poling et al., 2001)
and are listed in Table 4, along with the Antoine coefficients sourced from the
literature (Gmehling et al., 1980, 1981).
The flash points for the pure substances used in this study were measured using
the Flash Point Analyzer, with these values compared with their literature-derived
analogues (Bohnet et al., 2007; Fisher Scientific, 2008; Freepatentsonline, 2008;
Mallinckrodt Baker, 2008; Merck, 2008; NIOSH, 2008; Oxford University, 2008;
Tedia, 2008; Univar USA, 2008) (Table 5). There are between-source differences in
the flash-point data for 1-butanol, 2-butanol, isobutanol, 1-pentanol and octane.
However, the differences are acceptable except for the value of 1-butanol provided
by NIOSH (2008), 2-butanol by Tedia (2008) and 1-pentanol by Fisher (2008). Our
experimental flash points for those five substances are close to the literature-derived
values (Bohnet et al., 2007; Fisher Scientific, 2008; Freepatentsonline, 2008;
Mallinckrodt Baker, 2008; Merck, 2008; NIOSH, 2008; Oxford University, 2008;
Tedia, 2008; Univar USA, 2008), except for the ones mentioned above with greater
difference from other sources (Table 5).
4.2 Flash-point variation of partially miscible mixtures of aqueous-organic
system
The flash points of water + 1-butanol were tested over the entire flammable
range (Table 6). Fig. 3 indicates that the flash point of this mixture increases
smoothly along with the quantity of water in the alcohol-rich region, and increases
sharply in the water-rich region, with this observation being consistent with that of
miscible aqueous-organic solutions (Liaw and Chiu, 2003, 2006) and with the fact
that water is an inert non flammable component. The most significant feature is that
the measured value is almost constant in the two liquid phases region, where the
8
water mole fraction ranges between 0.54 and 0.983 (Table 6, Fig. 3). A constant
flash point behavior in the two liquid phase region was also observed in the binary
partially miscible mixtures of flammable solvents (Liaw et al., 2008). Both the flash
point variation behavior in two extreme regions and the constant flash point
behavior within the two liquid phases coexisting region were also observed in other
partially miscible mixtures of this study, water + 2-butanol, water + isobutanol and
water + 1-pentanol, which are displayed in Figs. 4-6.
The constant flash point behavior in the two liquid phases region arises because
of the particular behavior enounced above that any composition on a
liquid-liquid-vapor equilibrium tie line is in equilibrium with a single vapor
composition (Van Ness and Abbott, 1982; Pham and Doherty, 1990). The flash
point being a feature of the vapor, it is constant when the composition and
temperature of the vapor is also constant.
In contrast to the mixtures mentioned above, the flash points of water + octane
is almost constant over the whole test range from 0 to 0.99975 (Fig. 7). That the
flash point of water + octane doesn’t increase with addition of water is a behavior
quite different from that of other aqueous-organic solutions, including miscible
mixtures (Liaw and Chiu, 2003, 2006) and partially miscible ones mentioned above.
Over inspection of our experimental data (Table 7), octane is almost immiscible to
water, a behavior well acquainted in the literature (Mączyński et al., 2004). Since
water is too lean in the octane-rich region, the flash point value approaches that of
octane in such a region. The flash point in the two liquid phase region is constant,
and is equivalent to that in the span nearing octane-rich region, which value is close
to that of octane as mentioned above. In the water-rich region, the vapor
composition of octane is too lean, resulting in the mixture being non-flash. Thus, it
exhibits a constant flash point behavior over the entire observable flammable
region.
Concerning the two liquid phases region, the measured span of two liquid
phases region for water + 1-butanol, which are 0.54 and 0.983 in water mole
fraction and its average value of flash point is 43.5 oC, is close to that adopted from
the literature (Gόra et al., 2006), namely 0.528 and 0.983 at 40 oC, the literature
temperature closest to the average measured flash point value (Table 7). The
measured analogue of the other studied mixtures, water + 2-butanol, water +
isobutanol, water + 1-pentanol and water + octane, are also close to those adopted
from the literature (Gόra et al., 2006; Mączyński et al., 2004; Stephenson and Stuart,
1986) (Table 7).
Predictions using Eqs. (6) - (8) make uses of the binary interaction parameters
listed in Tables 2 and 3. Those have been regressed either on LLE data or on VLE
9
data. It is a common knowledge in thermodynamics that use of LLE parameter for
predicting VLE is usually not satisfactory (Vidal, 2003). However, partially
miscible aqueous-organic mixture flash point determination is a problem combining
LLE and VLE issues: the flash point definition of being “sufficient vapor to become
a combustible mixture” is related to VLE (Eqs. (6) and (7)), whereas partial
miscibility rather concerns LLE as stressed by Eq. (8).
As expected, the estimated result for the span of two liquid phases by the LLE
parameters (Table 2) is superior to that by the VLE parameters (Table 3) for all the
studied mixtures except for water + octane with only LLE parameters being
available. This occurs irrespective of whether the NRTL or UNIQUAC equation is
used to estimate the activity coefficients (Table 7). Table 7 also compares measured
invariant flash point average value in the two liquid phase region with the
prediction. There are some deviations between the prediction values and
measurements when using only LLE or only VLE parameters. Deviation when
using LLE parameters is attributed to the poor prediction in VLE related flash point
by LLE parameters (Figs. 3-5). The least deviation occurs for water + 1-pentanol
and water + octane. Deviation when using VLE parameters is attributed to the poor
estimation in the span of the two liquid phase region (Table 7).
Because of the excellent estimation in span of two liquid phases by the LLE
parameters and the good prediction of flash point by the VLE parameters, the
calculated flash points in the two liquid phases by the VLE parameters with the
span of two liquid phases estimated by the LLE parameters are also listed in Table 7
for comparison. The estimated flash point in the span nearing alcohol-rich region is
much closer to the measurement than that in the span nearing water-rich region for
the studied aqueous-alcohol mixtures. It is attributed to the fact that the slope of
flash points vs. composition in the water-rich region is much steeper than that in the
alcohol-rich region, with a small deviation in the span nearing former region causes
much more deviation in the flash point than that in the span nearing latter region.
Thus, the parameters obtained from LLE data (Table 2) and from VLE data
(Table 3) are used to estimate the span of two liquid phase region and the flash
point, respectively, if both parameters are available. The estimated span nearing
flammable-rich region is then used to calculate the constant flash point in the two
liquid phase region by the VLE parameters. Such a simulation is denoted as VLLE
in this study.
4.3 Comparison of predicted and measured flash points
The flash points predicted by the proposed model for water + 1-butanol and the
corresponding measured values are compared in Fig. 3. Predictions are in good
10
agreement with the experimental data over the entire flammable range (Fig. 3, lines
denoted as VLLE (red and blue lines)), when the NRTL or UNIQUAC is used in
conjunction with the equation describing the partial miscibility (Eq. (8)). The
predicted flash points without considering partial-miscibility behavior (Eq. (8) is
simply not used in this case), by using interaction parameters obtained from LLE or
from VLE data to estimate activity coefficients, are also plotted in Fig. 3 (black
lines). Such a pseudo-homogeneous liquid flash point curve, whose shape is smooth
convex then concave, is quite different from the corresponding experimental data in
the two liquid phases. Such shape is characteristic of pseudo-homogeneous model
prediction applied to composition span when two liquid phases equilibrium hold
(Van Dongen et al., 1983). The agreement of the predicted flash points by the
proposed model with the measurements and the analogous deviation for the
prediction when neglecting partial-miscibility behavior for water + 2-butanol, water
+ isobutanol, water + 1-pentanol and water + octane are also observed in Figs. 4-7.
Table 8 also demonstrates that, in terms of predictive efficiency, the model that
considers partial-miscibility behavior is superior to the model that doesn’t. Thus, it
can be concluded that the property of immiscibility should not be ignored to predict
the flash point of partially miscible aqueous-organic solutions.
Table 8 demonstrates that predictions are excellent in the entire flammable
range excluding the water-rich region for water + 1-butanol, with the deviations
being 0.5 oC and 0.4 oC by using NRTL or UNIQUAC equation, respectively, with
Kosuge and Iwakabe’s VLE parameters (2005). However, there are remarkable
deviations between the predictions and measurements in the water-rich region, with
deviation of flash point being 11.1 oC and 7.6 oC for NRTL and UNIQUAC
equation, respectively. This phenomenon of greater deviation in water-rich region
was also observed in other miscible aqueous-organic solutions (Liaw and Chiu,
2003, 2006) and other partially miscible aqueous-organic mixtures of this study,
water + 2-butanol, water + isobutanol and water + 1-pentanol (Table 8). In the
estimation of flash point for a mixture, the Le Chatelier’s rule was used to describe
the lower flammable limit of the gas phase. The Le Chatelier’s rule assumed that
the presence of inert has no effect on the lower flammable limit of a mixture.
However, the fact is that the presence of inert will affect the lower flammable limit,
especially in the high concentration of inert, where the lower flammable limit
varying significantly (Michael and Zabetakis, 1965). In the water-rich region, the
slope of the flash point vs. composition is the steepest, in accordance with the high
inert concentration. Indeed, high flash point temperature is connected to high
concentration of inert (water) vapor in the gas phase that in turn increases the
flammability limit. This deviation in the water-rich region is the most important for
11
water + 1-butanol and water + 2-butanol, when using Kosuge and Iwakabe’s VLE
parameters (2005). Moreover, the predicted flash points are discontinuous in the
span nearing water-rich region, and substantially lower than the measurements in
the water-rich region for water + 2-butanol (Fig. 4). That indicates that Kosuge and
Iwakabe’s VLE parameters (2005) cannot estimate the flash point satisfactorily in
the water-rich region (Fig. 3,4; Table 8), although their LLE parameters (Kosuge
and Iwakabe, 2005) estimate the span of two liquid phases well (Table 7).
Explanation of the large deviation in the water-rich region for the mixtures water +
1-butanol and water + 2-butanol lies in the fact that the VLE parameters of the two
mixtures used for calculating the activity coefficient were regressed over the
alcohol-rich region instead of water-rich region by Kosuge and Iwakabe (2005),
resulting in worse prediction in the water-rich region compared to other regions.
Predictions using VLE parameters from Gmehling et al., (1981) lead to much
smaller deviation in the water-rich region (Table 8). Thus, VLLE simulation were
performed by using Kosuge and Iwakabe’s LLE parameters (2005) and Gmehling et
al.’s VLE parameters (1981) for water + 1-butanol and water + 2-butanol (Figs. 3,4
and Table 8). They lead to the best agreement.
It is concluded that, in addition to the deviation induced by the Le Chatelier’s
rule based model when the inert vapor concentration is high, the predictive
efficiency of the proposed model, especially in the water-rich region, depends on
the accuracy of the binary interaction parameters. Evidently, a new regression of
binary interaction parameters over the entire range of a mixture flash point
temperature could reduce the discrepancy between the model and the measurements.
However, we intended to show that a model using literature VLE or LLE derived
binary interaction parameter could predict with good agreement complex flash point
behavior mixtures.
In deriving the flash point prediction model for binary aqueous-organic
mixtures with partial miscibility, it was assumed that the liquid phases are in
equilibrium. Underlined is the assumption of perfect mixing of the mixture. If that
is not the case in real tank conditions, further deviations between the model
predictions and the experimental flash point may occur.
5. Conclusion
The immiscible behavior in the two liquid phases should not be ignored in the
prediction of flash point for partially miscible mixtures of aqueous-organic system.
The model for the flash point prediction of binary partially miscible mixtures of one
flammable solvent with water is able to represent well the experimental data over
the entire composition range if the binary parameters used in the prediction of the
12
non-ideal liquid activity coefficients are accurate over the entire composition range.
Thus, it appears reasonable to propose that this model is potentially applicable for
assessment of fire and explosion hazards in real-world environments and producing
inherently safer designs for chemical processes. In application of this proposed
model, it is suggested to estimate the span of two liquid phase and the flash point by
the LLE and VLE parameters, respectively, and then further use the estimated span,
in particular the flammable-rich liquid phase composition, to calculate the constant
flash point of the two liquid phases in equilibrium.
Nomenclature
A, B, C =Antoine coefficients
Aij = binary parameter (K)
aij = parameter in Table 1 (J/mol)
bij = parameter in Table 1 (J/mol·K)
cij = parameter in Table 1 (J/mol·K2)
G = defined in Table 1
g = binary parameters of the NRTL equation, J/mol
l = UNIQUAC parameter, defined in Table 1
LFL = lower flammable limit
P = ambient pressure (kPa) sat
iP = saturated vapor pressure (kPa) sat
fpiP , = saturated vapor pressure of component, i, at flash point (kPa)
qi = measure of molecular surface areas
R = gas constant (8.314 J/mol·K)
ri = measure of molecular van der Waals volume
T = temperature (K)
Ti,fp = flash point temperature of pure component, i (K)
u = binary parameters of UNIQUAC equation, J/mol
x = liquid-phase composition
y = vapor-phase composition
z = coordination number
Greek letters
Φi = segment fraction
αij =NRTL parameter γ = activity coefficient Λ = defined in Table 1 θi = area fraction of component i τ = defined in Table 1
13
Subscripts
2LP = two liquid phases
exp. = experimental data
fp = flash point
i = species i
pred. = predictive value
Superscripts
α = α phase β = β phase
Acknowledgements
The authors would like to thank the National Science Council of the R.O.C. for
supporting this study financially under grant #NSC 96-2221-E-039-004-MY2.
References
Abrams, D.S., Prausnitz, J.M., 1975. Statistical thermodynamics of liquid mixtures:
new expression for the excess Gibbs energy of partly or completely miscible
systems. A.I.Ch.E Journal 21, 116-128.
Affens, W.A., McLaren, G.W., 1972. Flammability properties of hydrocarbon
solutions in air. Journal of Chemical and Engineering Data 17, 482-488.
ASTM D 56, 1999. Standard test method for flash point by Tag closed tester.
American Society for Testing and Materials, West Conshohocken, PA, USA.
Bohnet, M. et al., 2007. Ullmann's Encyclopedia of Industrial Chemistry. Wiley
InterScience (John Wiley & Sons), USA.
Catoire, L., Paulmier, S., 2006. Estimation of closed cup flash points of combustible
solvent blends. Journal of Physical and Chemical Reference Data 35, 9-14.
CCPS/AIChE, 1993. Guidelines for Engineering Design for Process Safety. American
Institute of Chemical Engineers, New York, USA.
Crowl, D.A., Louvar, J.F., 2002. Chemical Process Safety: Fundamentals with
Applications. Prentice Hall PTR, New Jersey, USA.
DOT, 2004. Shippers – General Requirements for Shipments and Packagings,
Class3 – Assignment of Packing Group, 49CFR173.121. National Archives and
Records Administration, USA.
Fisher Scientific, 2008.
⟨https://www.fishersci.com/wps/portal/CMSTATIC?pagename=msds⟩.
Freepatentsonline, 2008. ⟨http://www.freepatentsonline.com/6663723.html⟩.
Garland, R.W., Malcolm, M.O., 2002. Evaluating vent manifold inerting requirements:
flash point modeling for organic acid-water mixtures. Process Safety Progress
14
21, 254-260.
Gmehling, J., Onken, U., Arlt, W., 1980. Vapor-Liquid Equilibrium Data Collection,
Part 6a. DECHEMA, Frankfurt, Germany.
Gmehling, J., Onken, U., Arlt, W., 1981. Vapor-Liquid Equilibrium Data Collection,
Part 1a. DECHEMA, Frankfurt, Germany.
Gόra, M., Wiśniewska-Gocłowska, B., Mączyński, A., 2006. Recommended
liquid-liquid equilibrium data. part 4. 1-akanol-water systems. Journal of
Physical and Chemical Reference Data 35, 1391-1414.
Klauck, M., Grenner, A., Schmelzer, J., 2006. Liquid-liquid(-liquid) equilibria in
ternary systems of water + cyclohexylamine + aromatic hydrocarbon (toluene or
propylbenzene) or aliphatic hydrocarbon (heptane or octane). Journal of
Chemical and Engineering Data 51, 1043-1050.
Kosuge, H., Iwakabe, K., 2005. Estimation of isobaric vapor-liquid-liquid equilibria
for partially miscible mixture of ternary system. Fluid Phase Equilibria 233,
47-55.
Kurihara, K., Midorikawa, T., Hashimoto, T., Kojima, K., Ochi, K., 2002.
Liquid-Liquid solubilities for the binary system of methanol with octane and
2,2,4-trimethylpentane. Journal of Chemical Engineering of Japan 35, 360-364.
Le Chatelier, H., 1891. Estimation of firedamp by flammability limits. Ann. Mines 19,
388-395.
Lees, F.P., 1996. Loss Prevention in the Process Industries, Vol. 1.
Butterworth-Heinemann, Oxford, UK.
Liaw, H.-J., Lee, Y.-H., Tang, C.-L., Hsu, H.-H., Liu, J.-H., 2002. A mathematical
model for predicting the flash point of binary solutions. Journal of Loss
Prevention in the Process Industries 15, 429-438.
Liaw, H.-J., Chiu, Y.-Y., 2003. The prediction of the flash point for binary
aqueous-organic solutions. Journal of Hazardous Materials 101, 83-106.
Liaw, H.-J., Lee, T.-P., Tsai, J.-S., Hsiao, W.-H., Chen, M.-H., Hsu, T.-T., 2003.
Binary liquid solutions exhibiting minimum flash-point behavior. Journal of
Loss Prevention in the Process Industries 16, 173-186.
Liaw, H.-J., Tang, C.-L., Lai, J.-S., 2004. A model for predicting the flash point of
ternary flammable solutions of liquid. Combustion and Flame 138, 308-319.
Liaw, H.-J., Chiu, Y.-Y., 2006. A general model for predicting the flash point of
miscible mixture. Journal of Hazardous Materials 137, 38-46.
Liaw, H.-J., Lin, S.-C., 2007. Binary mixtures exhibiting maximum flash-point
behavior. Journal of Hazardous Materials 140, 155-164.
Liaw, H.-J., Lu, W.-H., Gerbaud, V., Chen, C.-C., 2008. Flash-point prediction for
binary partially miscible mixtures of flammable solvents. Journal of Hazardous
15
Materials 153, 1165-1175.
Liaw, H.-J., Wang, T.-A., 2007. A non-ideal model for predicting the effect of
dissolved salt on the flash point of solvent mixtures. Journal of Hazardous
Materials 141, 193-201.
Liaw, H.-J., Chen, C.-T., Cheng, C.-C., Yang, Y.-T., 2008. Elimination of minimum
flash-point behavior by addition of a specified third component. Journal of Loss
Prevention in the Process Industries 21, 82-100.
Lu, Y.L., Chiou, D.R., Chen, L.J., 2002. Liquid-liquid equilibria for the ternary
system water + octane + diethylene glycol monobutyl ether. Journal of
Chemical and Engineering Data 47, 310-312.
Mączyński, A., Wiśniewska-Gocłowska, B., Gόra, M., 2004. Recommended
liquid-liquid equilibrium data. part 1. binary akane-water systems. Journal of
Physical and Chemical Reference Data 33, 549-577.
Mallinckrodt Baker, 2008.
⟨http://www.mallbaker.com/Americas/catalog/default.asp?searchfor=msds⟩.
Matsuda, H., Ochi, K., 2004. Liquid-liquid equilibrium data for binary alcohol +
n-alkane (C10-C16) systems: methanol + decane, ethanol + tetradecane, and
ethanol + hexadecane. Fluid Phase Equilibria 224, 31-37.
Merck, 2008. ⟨http://www.chemdat.info/mda/int_en/index.html⟩.
Michael, G., Zabetakis, 1965. Flammability Characteristics of Combustible Gases and
Vapors. U.S. Dept of the Interior, Bureau of Mines, Washington, USA.
NIOSH Pocket Guide to Chemical Hazards, 2008.
⟨http://www.cdc.gov/noish/npg/npgname-o.html⟩.
Oxford University, The Physical and Theoretical Chemistry Laboratory, 2008.
⟨http://physchem.ox.ac.uk⟩.
Pham, H.N., Doherty, M.F., 1990. Design and synthesis of heterogeneous azeotropic
distillations-1. heterogeneous phase diagrams. Chemical Engineering Science
45, 1823-1836.
Poling, B.E., Prausnitz, J.M., O’Connell, J.P., 2001. The Properties of Gases and
Liquids. McGraw-Hill, New York, USA.
Renon, H., Prausnitz, J.M., 1968. Local compositions in thermodynamic excess
functions for liquid mixtures. A.I.Ch.E. Journal 14, 135-144.
Resa, J.M., Goenaga, J.M., Iglesias, M., Gonzalez-Olmos, R., Pozuelo, D., 2006.
Liquid-liquid equilibrium diagrams of ethanol + water + (ethyl acetate or
1-pentanol) at several temperatures. Journal of Chemical and Engineering Data
51, 1300-1305.
Smith, J.M., Van Ness, N.C., 1975. Introduction to Chemical Engineering
Thermodynamics. McGraw-Hill, New York, USA.
16
Stephenson, R., Stuart, J., 1986. Mutual binary solubilities: water-alcohols and
water-esters. Journal of Chemical and Engineering Data 31, 56-70.
Tang, Y., Li, Z., Li, Y., 1995. Salting effect in partially miscible systems of
n-butanol-water and butanone-water: 2. An extended Setschenow equation and
its application. Fluid Phase Equilibria 105, 241-258.
Tedia, 2008. ⟨http://www.tedia.com/products.php3⟩.
Univar USA, 2008. ⟨http://www.univarusa.com/assistmsds.htm⟩.
Van Dongen, D.B., Doherty, M.F., Haight, J.R., 1983. Material stability of
multicomponent mixtures and the multiplicity of solutions to phase-equilibrium
equations. 1. nonreacting mixtures. Industrial and Engineering Chemistry
Fundamental 22, 472-485.
Van Ness, H.C., Abbott, M.M., 1982. Classical Thermodynamics of Nonelectrolyte
Solutions: With Applications to Phase Equilibria. McGraw-Hill, New York,
USA.
Vidal, J., 2003. Thermodynamics: Applications in Chemical Engineering and the
Petroleum Industry. Technip Editions, Paris, France.
Vidal, M., Rogers, W.J., Mannan, M.S. 2006. Prediction of minimum flash point
behaviour for binary mixtures. Process Safety and Environmental Protection 84,
1-9.
White, D., Beyler, C.L., Fulper, C., Leonard, J., 1997. Flame spread on aviation fuels.
Fire Safety Journal 28, 1-31.
Wilson, G.M., 1964. Vapor liquid equilibrium. XI. A new expression for the excess
free energy of mixing. Journal of American Chemical Society 86, 127-130.
17
FIGURE LEGENDS
Fig. 1.
Fig. 2.
The basic system configuration of the Tag close cup tester.
Procedure for evaluation of flash point for partially miscible mixtures of
one flammable solvent with water.
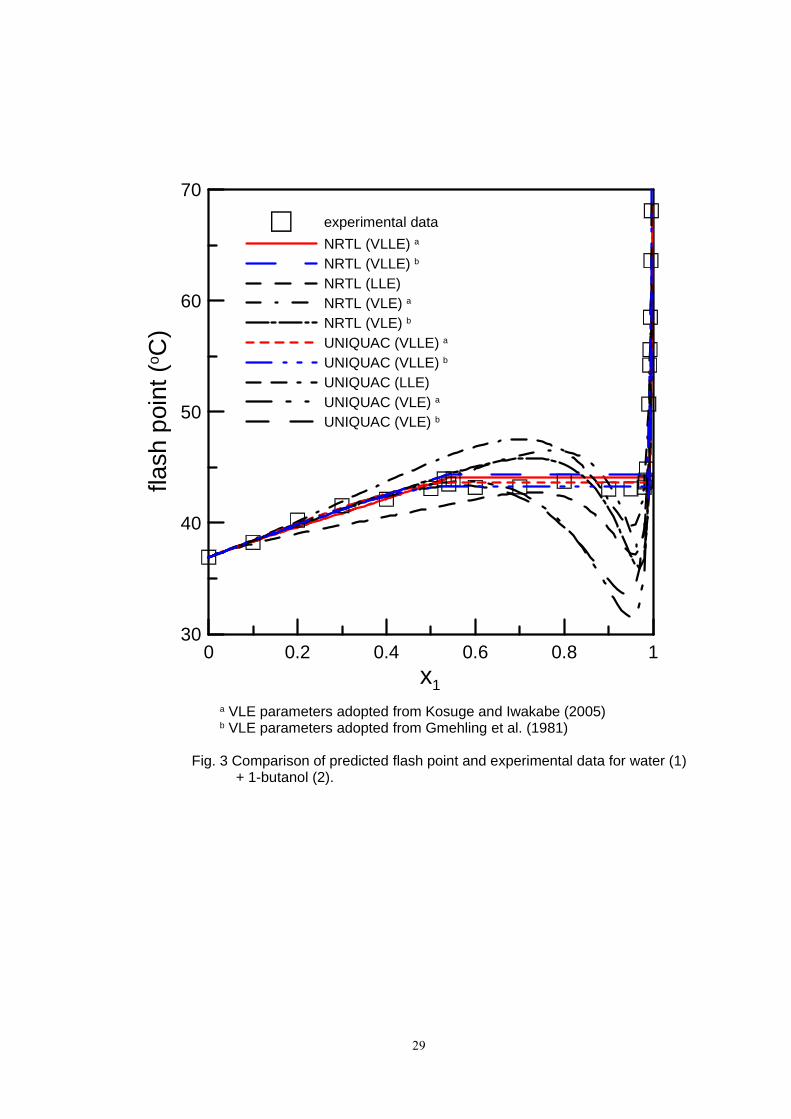
Fig. 3. Comparison of predicted flash point and experimental data for water (1) +
1-butanol (2).
Fig. 4. Comparison of predicted flash point and experimental data for water (1) +
2-butanol (2).
Fig. 5. Comparison of predicted flash point and experimental data for water (1) +
isobutanol (2).
Fig. 6. Comparison of predicted flash point and experimental data for water (1) +
1-pentanol (2).
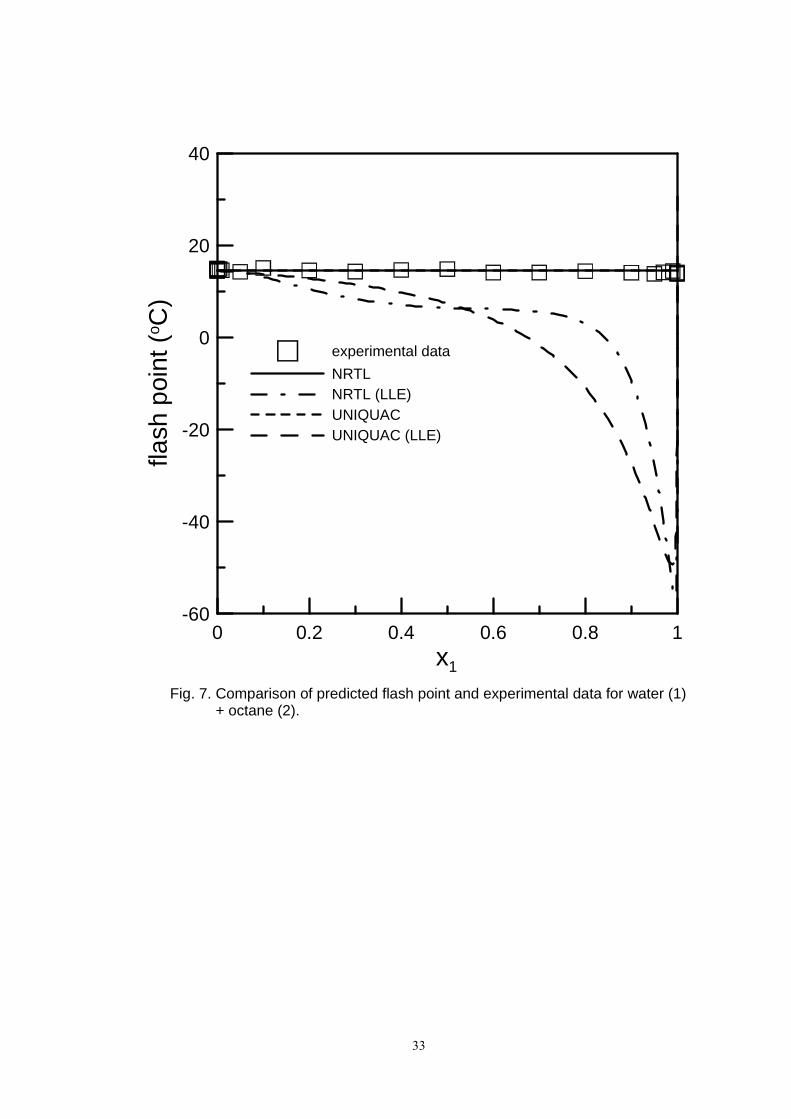
Fig. 7. Comparison of predicted flash point and experimental data for water (1) +
octane (2).
18
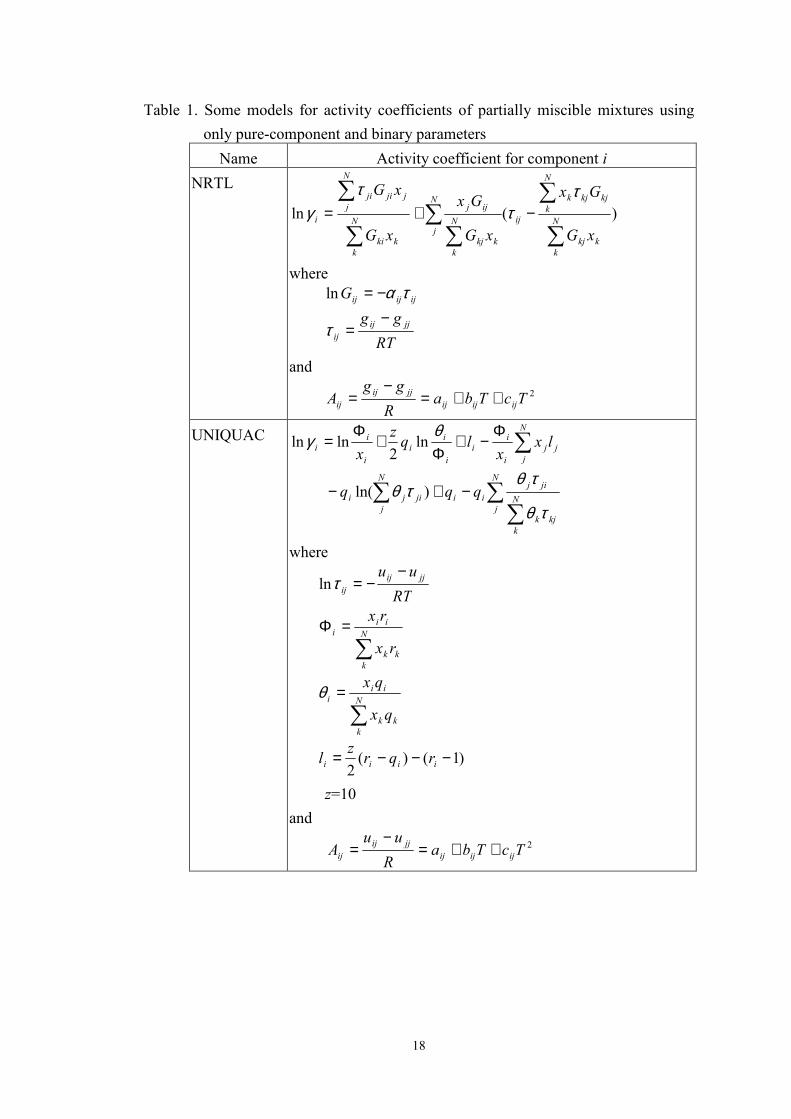
Table 1. Some models for activity coefficients of partially miscible mixtures using
only pure-component and binary parameters
Name Activity coefficient for component i
NRTL
)(ln
∑
∑∑∑∑
∑−+=
N
k
kkj
N
k
kjkjk
ij
N
jN
k
kkj
ijj
N
k
kki
N
j
jjiji
i
xG
Gx
xG
Gx
xG
xG ττ
τγ
where
ijijijG τα−=ln
RT
gg jjij
ij
−=τ
and
2TcTbaR
ggA ijijij
jjij
ij ++=−
=
UNIQUAC
∑∑
∑
∑
−+−
Φ−+
Φ+
Φ=
N
jN
k
kjk
jij
ii
N
j
jiji
j
N
j
j
i
i
i
i
i
i
i
i
i
qqq
lxx
lqz
x
τθ
τθτθ
θγ
)ln(
ln2
lnln
where
RT
uu jjij
ij
−−=τln
∑=Φ
N
k
kk
iii
rx
rx
∑=
N
k
kk
iii
qx
qxθ
)1()(2
−−−= iiii rqrz
l
z=10
and
2TcTbaR
uuA ijijij
jjij
ij ++=−
=
19
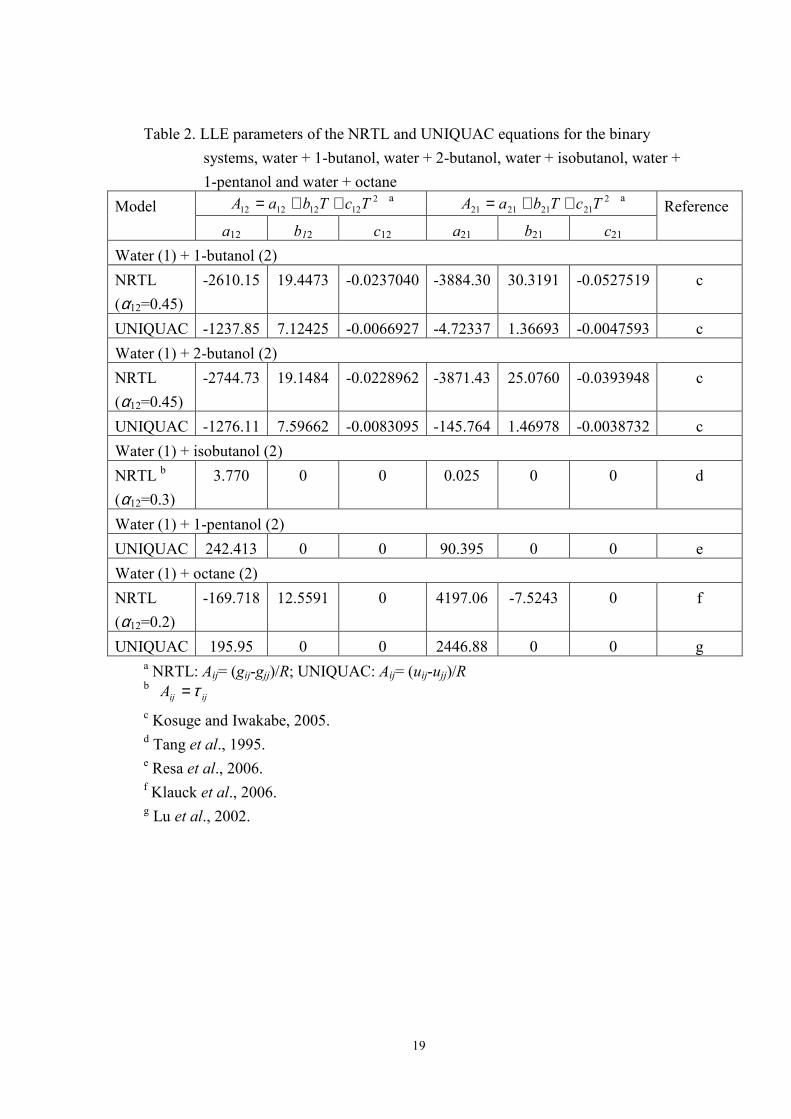
Table 2. LLE parameters of the NRTL and UNIQUAC equations for the binary
systems, water + 1-butanol, water + 2-butanol, water + isobutanol, water +
1-pentanol and water + octane 2
12121212 TcTbaA ++= a 2
21212121 TcTbaA ++= a Model
a12 b12 c12 a21 b21 c21
Reference
Water (1) + 1-butanol (2)
NRTL
(α12=0.45) -2610.15 19.4473 -0.0237040 -3884.30 30.3191 -0.0527519 c
UNIQUAC -1237.85 7.12425 -0.0066927 -4.72337 1.36693 -0.0047593 c
Water (1) + 2-butanol (2)
NRTL
(α12=0.45) -2744.73 19.1484 -0.0228962 -3871.43 25.0760 -0.0393948 c
UNIQUAC -1276.11 7.59662 -0.0083095 -145.764 1.46978 -0.0038732 c
Water (1) + isobutanol (2)
NRTL b
(α12=0.3) 3.770 0 0 0.025 0 0 d
Water (1) + 1-pentanol (2)
UNIQUAC 242.413 0 0 90.395 0 0 e
Water (1) + octane (2)
NRTL
(α12=0.2) -169.718 12.5591 0 4197.06 -7.5243 0 f
UNIQUAC 195.95 0 0 2446.88 0 0 g a NRTL: Aij= (gij-gjj)/R; UNIQUAC: Aij= (uij-ujj)/R b ijijA τ=
c Kosuge and Iwakabe, 2005. d Tang et al., 1995. e Resa et al., 2006. f Klauck et al., 2006. g Lu et al., 2002.
20
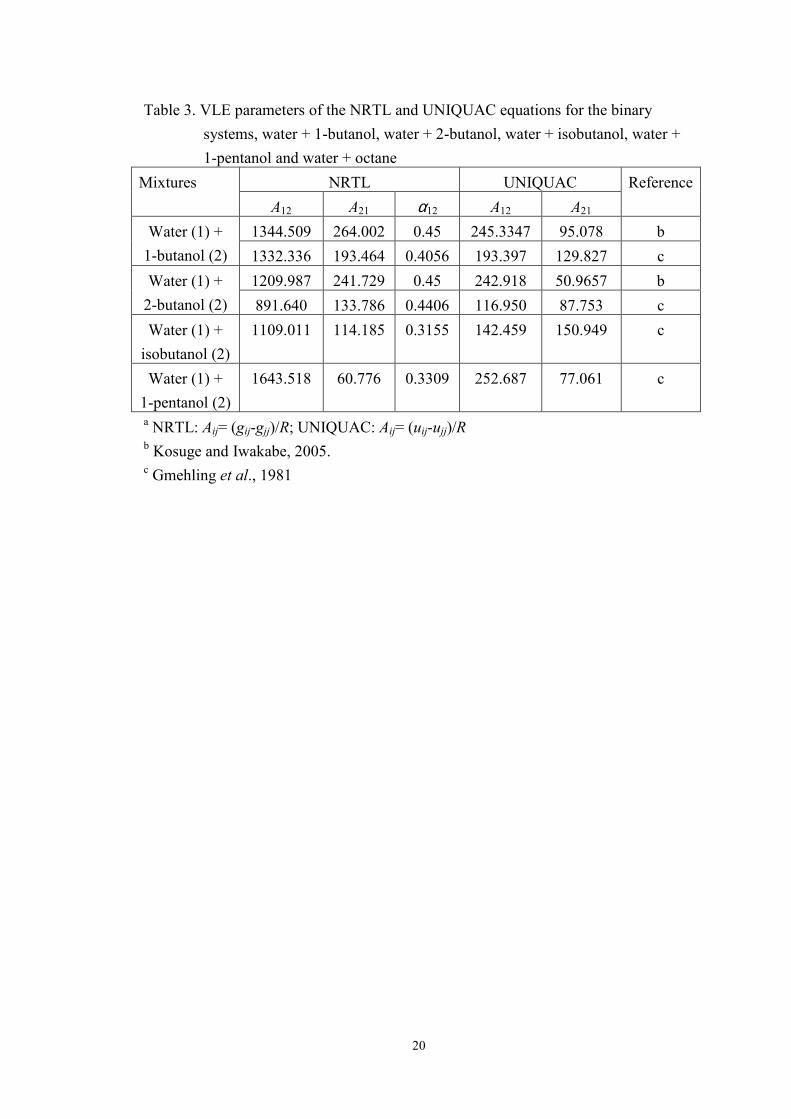
Table 3. VLE parameters of the NRTL and UNIQUAC equations for the binary
systems, water + 1-butanol, water + 2-butanol, water + isobutanol, water +
1-pentanol and water + octane
NRTL UNIQUAC Mixtures
A12 A21 α12 A12 A21
Reference
1344.509 264.002 0.45 245.3347 95.078 b Water (1) +
1-butanol (2) 1332.336 193.464 0.4056 193.397 129.827 c
1209.987 241.729 0.45 242.918 50.9657 b Water (1) +
2-butanol (2) 891.640 133.786 0.4406 116.950 87.753 c
Water (1) +
isobutanol (2)
1109.011 114.185 0.3155 142.459 150.949 c
Water (1) +
1-pentanol (2)
1643.518 60.776 0.3309 252.687 77.061 c
a NRTL: Aij= (gij-gjj)/R; UNIQUAC: Aij= (uij-ujj)/R b Kosuge and Iwakabe, 2005. c Gmehling et al., 1981
21
Table 4. Antoine coefficients for solution components, and relative van der Waals
volumes (r) and surface areas (q) for the pure components for the
UNIQUAC model
Antoine coefficients a Relative van der Waals
volumes (r) and surface
areas (q)
Material
A B C Reference r Q Reference
1-butanol 7.83800 1558.190 -76.119 b 3.4543 3.052 c
2-butanol 7.47429 1314.188 -86.500 b 3.4535 3.048 c
isobutanol 8.53516 1950.940 -35.853 b 3.4535 3.048 c
1-pentanol 7.39824 1435.570 -93.202 b 4.1287 3.592 c
Octane 6.93142 1358.800 -63.145 b 5.8486 4.936 c a log(P/mmHg)=A-B/[(T/K)+C] b Gmehling et al., 1981. c Poling et al., 2001
22
Table 5. Comparison of flash-point values adopted from the literature with
experimentally derived data for some alcohols
Component Experimental data (°C) Literature (°C) 1-butanol 36.9 ± 1.4 28.88 a
34 b
35 c,d,e
36 f
37 g
2-butanol 22.0 ± 1.2 23.88 a
24 b,c
26 e
28.88 d
Isobutanol 28.5 ± 0.5 27.77 a
28 b,c,e
29 d
1-pentanol 49.5 ± 0.6 38 c
48 h
48.33 d
49 b,e
50 i
Octane 14.5 ± 0.7 13 b,c
13.33 a,d
15 e a NIOSH, 2008. b Merck, 2008 c Fisher, 2008. d Tedia, 2008. e Oxford University, 2008. f Univar USA, 2008. g Mallinckrodt, 2008. h Freepatentsonline, 2008. i Bohnet et al., 2007.
23
Table 6. Measured flash point for partially miscible mixtures
x1 water (1) +
1-butanol (2)
(oC)
water (1) +
2-butanol (2)
(oC)
water (1) +
isobutanol (2)
(oC)
water (1) +
1-pentanol (2)
(oC)
water (1) +
octane (2)
(oC)
0 36.9 22.0 28.5 49.5 14.5
0.000002 - - - - 14.8
0.000004 - - - - 14.8
0.000005 - - - - 14.9
0.000008 - - - - 14.5
0.0005 - - - - 14.8
0.001 - - - - 14.6
0.005 - - - - 14.9
0.01 - - - - 14.6
0.05 - - - - 14.3
0.1 38.3 23.3 30.0 51.1 15.1
0.2 40.3 25.0 31.6 52.6 14.6
0.3 41.6 26.1 32.8 54.4 14.3
0.35 - - - 56.0 -
0.37 - - - 56.2 -
0.38 - - - 55.6 -
0.4 42.1 27.1 33.9 55.7 14.7
0.45 - - 34.45 - -
0.46 - - 34.4 - -
0.47 - - 34.9 - -
0.5 43.1 28.6 34.8 55.7 14.9
0.53 44.0 - - - -
0.54 43.5 - - - -
0.55 44.0 - - - -
0.6 43.2 29.0 33.9 55.8 14.1
0.65 - 29.9 - - -
0.67 - 29.4 - - -
0.68 - 30.1 - - -
0.69 - 30.0 - - -
0.7 43.3 29.6 34.5 55.9 14.1
0.8 43.8 29.7 34.0 55.6 14.4
0.9 43.0 29.4 34.0 55.7 14.1
0.95 43.1 29.8 33.9 56.0 13.9
24
0.97 - 31.9 33.9 56.0 14.2
0.98 43.2 36.1 35.4 55.7 -
0.982 43.7 - - - -
0.983 43.85 - - - -
0.985 44.9 - - - -
0.99 50.7 45.7 45.05 56.1 14.4
0.992 54.2 - - - -
0.993 55.6 51.6 - - -
0.994 58.5 - - - -
0.995 63.6 58.6 56.7 56.0 -
0.996 68.1 64.7 61.7 58.7 -
0.997 - - 66.5 65.5 -
0.998 - - - 74.4 -
0.999 - - - - 14.0
0.9995 - - - - 14.1
0.9997 - - - - 14.8
0.99975 - - - - 13.8
25
Table 7. Comparison of estimated values for equilibrium composition between
liquid phases, x1,2LP, and its flash point, T2LP, with corresponding
experimental data
Estimated value
NRTL UNIQUAC
Experimental
data
Mutual solubility System
x1,2LP T2LP
(°C) x1,2LP T2LP
(°C) x1,2LP T2LP
(°C) T
(°C) x1,2LP Lit
LLE 0.541
0.985
41.67 0.531
0.986
45.92
VLE a 0.603
0.993
44.93
44.08 c
38.53 d
0.346
0.989
41.97
43.68 c
39.31 d
water (1) +
1-butanol
(2)
VLE b 0.530
0.991
44.24
44.38 c
36.40 d
0.348
0.984
41.84
43.32 c
39.33 d
0.54
0.983
43.5 40 0.528
0.9830
g
LLE 0.673
0.957
31.17 0.666
0.959
32.80
VLE a 0.596
0.990
29.32
30.13 c
23.88 d
0.408
0.986
27.80
29.19 c
20.36 d
water (1) +
2-butanol
(2)
VLE b 0.665
0.939
30.12
30.17 c
31.69 d
0.575
0.934
29.68
30.14 c
31.47 d
0.67
0.95
29.7 29.9 0.684
0.953
h
LLE 0.463
0.975
35.50 - - water (1) +
isobutanol
(2) VLE 0.392
0.978
33.79
34.43 c
32.66 d
0.371
0.977
33.69
0.46
0.98
34.1 35.7
36.3
0.469 e
0.9807 f
g
LLE - - 0.374
0.994
55.69
water (1) +
1-pentanol
(2) VLE 0.473
0.996
57.6 0.210
0.993
53.0
55.78 c
56.20 d
0.37
0.995
55.8 50 0.384
0.9962
g
water (1) +
octane (2)
LLE 3.8×10⁻⁶ 0.999996
14.49 3.2×10⁻⁶ 0.99996
14.49 4×10⁻⁶ 0.999999
14.3 20 4.3×10⁻⁴ 0.9999999
i
a based on parameters adopted from Kosuge and Iwakabe, 2005 b based on parameters adopted from Gmehling et al., 1981 c based on the span nearing flammable-rich region estimated by the LLE parameters
26
d based on the span nearing water-rich region estimated by the LLE parameters e solubility data at 36.3 oC f solubility data at 35.7 oC g Gόra et al., 2006. h Stephenson and Stuart, 1986. i Mączyński et al,. 2004.)
27
Table 8. Average temperature deviation between calculated and experimental flash
points, fpT∆ a, for the studied ternary solutions comparing models
Model for partially
miscible mixtures
Model ignoring partial miscibility
NRTL b UNIQUAC b
Mixture
NRTL
(VLLE)
UNIQUAC
(VLLE) LLE VLE LLE VLE
3.2 bd
11.1 be
0.5 bf
2.2 bd
7.6 be
0.4 bf
3.3 d
2.0 f
4.3 bd
2.0 bf
1.8 d
1.7 f
4.1 bd
2.9 bf
water (1) +
1-butanol (2)
3.0 cd
9.8 ce
0.7 cf
1.0 cd
3.0 ce
0.4 cf
- 4.1 cd
2.3 cf
- 2.2 cd
2.0 cf
4.8 bd
16.0 be
0.3 bf
4.2 bd
13.9 be
0.4 bf
1.7 d
0.9 f
5.1 bd
0.8 bf
2.2 d
2.1 f
5.2 bd
1.7 bf
water (1) +
2-butanol (2)
1.3 cd
3.6 ce
0.3 cf
1.0 cd
2.5 ce
0.4 cf
- 1.3 cd
0.4 cf
- 1.0 cd
0.4 cf
water (1) +
isobutanol (2)
0.7 d
2.0 e
0.3 f
- 1.0 d
1.0 f
1.4 d
1.2 f
- 1.1 d
1.2 f
water (1) +
1-pentanol (2)
- 0.8 d
3.5 e
0.2 f
- 3.6 d
3.9 f
3.9 d
4.0 f
3.9 d
4.0 f
water (1) +
octane (2)
0.3 d 0.3 d 17.6 d - 15.4 d -
a deviation of flash point: NTTT
N
predfpfpfp /.,.exp,∑ −=∆
b based on VLE parameters adopted from Kosuge and Iwakabe (2005) c based on VLE parameters adopted from Gmehling et al. (1981)
d ∆Tfp over the entire flammable range e ∆Tfp for water-rich region f ∆Tfp over the entire flammable excluding water-rich region
28
Fig. 2. Procedure for evaluation of flash point for partially miscible mixtures of one
flammable solvent with water.
Flash points of flammable components, T2,fp
Estimate sat
fpP ,2
Assume flash point at two-liquid phases, T2LP
Calculate γ2
Print results: flash point of the mixture, T
Liquid composition of the mixture, x2
Yes
No
Calculate γ2
Assume phase composition of the liquid-liquid equilibrium, x2,2LP
Is Eq. (8) satisfied? Adjust x2,2LP
No
Calculate satP2
No
Print x2,2LP, T2LP
Assume flash point of the mixture, T
Estimation of flash point in mutual-solubility region
Estimation of equilibrium composition and flash point in two-liquid phases
Yes
Yes
Estimate T2LP
?2 ε<∆ LPT
Calculate satP2
Estimate T
?ε<∆T
29
0 0.2 0.4 0.6 0.8 1x1
30
40
50
60
70
flash
poi
nt (
o C)
a VLE parameters adopted from Kosuge and Iwakabe (2005) b VLE parameters adopted from Gmehling et al. (1981)
Fig. 3 Comparison of predicted flash point and experimental data for water (1) + 1-butanol (2).
experimental data
NRTL (VLLE) a
NRTL (VLLE) b
NRTL (LLE)NRTL (VLE) a
NRTL (VLE) b
UNIQUAC (VLLE) a
UNIQUAC (VLLE) b
UNIQUAC (LLE)UNIQUAC (VLE) a
UNIQUAC (VLE) b
30
0 0.2 0.4 0.6 0.8 1x1
20
30
40
50
60
70
flash
poi
nt (
o C)
a VLE parameters adopted from Kosuge and Iwakabe (2005) b VLE parameters adopted from Gmehling et al. (1981)
Fig. 4. Comparison of predicted flash point and experimental data for water (1) + 2-butanol (2).
experimental data
NRTL (VLLE) a
NRTL (VLLE) b
NRTL (LLE)NRTL (VLE) a
NRTL (VLE) b
UNIQUAC (VLLE) a
UNIQUAC (VLLE) b
UNIQUAC (LLE)UNIQUAC (VLE) a
UNIQUAC (VLE) b
31
0 0.2 0.4 0.6 0.8 1x1
20
30
40
50
60
70
flash
poi
nt (
o C)
experimental data
NRTL (VLLE)NRTL (LLE)NRTL (VLE)UNIQUAC (VLE)
Fig. 5. Comparison of the predicted flash point and experimental data for water (1) + isobutanol (2).
32
0 0.2 0.4 0.6 0.8 1x1
40
50
60
70
80fla
sh p
oint
(o C
)
experimental data
UNIQUAC (VLLE)UNIQUAC (LLE)UNIQUAC (VLE)NRTL (VLE)
Fig. 6. Comparison of predicted flash point and experimental data for water (1) + 1-pentanol (2).