1 Report of Earnings and Financial Statements for the Fiscal Year Ended March 31, 2012 (Consolidated) (Prepared pursuant to Japanese GAAP) April 26, 2012 Listed company’s name: Kawasaki Heavy Industries, Ltd. Listed on: 1st sections of the TSE, OSE, and NSE Stock code: 7012 URL: http://www.khi.co.jp/ Representative: Satoshi Hasegawa, President Contact: Hideyuki Matsubara, Senior Manager, Accounting Department Tel: +81 3-3435-2130 Scheduled dates: Ordinary general meeting of shareholders June 27, 2012 Commencement date of dividend payments June 28, 2012 Submission of financial statements: June 27, 2012 Supplementary materials to financial results Available Earnings presentation: Conducted (for institutional investors and analysts) 1. Consolidated Financial Results for the Fiscal Year Ended March 31, 2012 (April 1, 2011 – March 31, 2012) (Amounts in millions of yen rounded down to the nearest million yen) (1) Operating Results Years ended March 31 (Millions of yen ) (Percentage figures indicate change compared with the previous fiscal year ) Net sales Operating income Recurring profit Net income % % % % 2012 1,303,778 6.2 57,484 34.8 63,627 29.4 23,323 (10.1) 2011 1,226,949 4.5 42,628 - 49,136 243.7 25,965 - Note: Comprehensive income Fiscal year ended March 31, 2012: ¥ 24,569 million 34.6% Fiscal year ended March 31, 2011: ¥ 18,252 million (434.0%) Years ended March 31 Earnings per share Earnings per share – diluted Return on equity Return on assets Operating income to net sales Yen Yen % % % 2012 13.95 13.85 7.8 4.6 4.4 2011 15.55 15.32 9.1 3.6 3.4 For reference: Equity in income of non consolidated subsidiaries and affiliates Fiscal year ended March 31, 2012: ¥ 8,567 million Fiscal year ended March 31, 2011: ¥ 9,205 million (2) Financial Condition March 31 (Millions of yen ) Total assets Net assets Equity ratio Net assets per share % Yen 2012 1,362,139 315,922 22.4 183.06 2011 1,354,278 297,433 21.3 173.03 For reference: Shareholders’ equity March 31, 2012: ¥ 306,054 million March 31, 2011: ¥ 289,056 million
Transcript
1
Report of Earnings and Financial Statements for the Fiscal Year Ended March 31, 2012 (Consolidated)
(Prepared pursuant to Japanese GAAP) April 26, 2012
Listed company’s name: Kawasaki Heavy Industries, Ltd. Listed on: 1st sections of the TSE, OSE, and NSE Stock code: 7012 URL: http://www.khi.co.jp/ Representative: Satoshi Hasegawa, President Contact: Hideyuki Matsubara, Senior Manager, Accounting Department Tel: +81 3-3435-2130 Scheduled dates: Ordinary general meeting of shareholders June 27, 2012 Commencement date of dividend payments June 28, 2012 Submission of financial statements: June 27, 2012 Supplementary materials to financial results Available Earnings presentation: Conducted (for institutional investors and analysts) 1. Consolidated Financial Results for the Fiscal Year Ended March 31, 2012
(April 1, 2011 – March 31, 2012)
(Amounts in millions of yen rounded down to the nearest million yen) (1) Operating Results Years ended March 31 (Millions of yen ) (Percentage figures indicate change compared with the previous fiscal year )
Net sales Operating income Recurring profit Net income
% % % % 2012 1,303,778 6.2 57,484 34.8 63,627 29.4 23,323 (10.1) 2011 1,226,949 4.5 42,628 - 49,136 243.7 25,965 - Note: Comprehensive income Fiscal year ended March 31, 2012: ¥ 24,569 million 34.6%
Fiscal year ended March 31, 2011: ¥ 18,252 million (434.0%) Years ended March 31
Earnings per share Earnings per share
– diluted Return on equity Return on assets
Operating income to net sales
Yen Yen % % % 2012 13.95 13.85 7.8 4.6 4.4 2011 15.55 15.32 9.1 3.6 3.4
For reference: Equity in income of non consolidated subsidiaries and affiliates Fiscal year ended March 31, 2012: ¥ 8,567 million Fiscal year ended March 31, 2011: ¥ 9,205 million
(2) Financial Condition March 31 (Millions of yen )
Total assets Net assets Equity ratio Net assets per share
% Yen
2012 1,362,139 315,922 22.4 183.06
2011 1,354,278 297,433 21.3 173.03
For reference: Shareholders’ equity March 31, 2012: ¥ 306,054 million March 31, 2011: ¥ 289,056 million
2
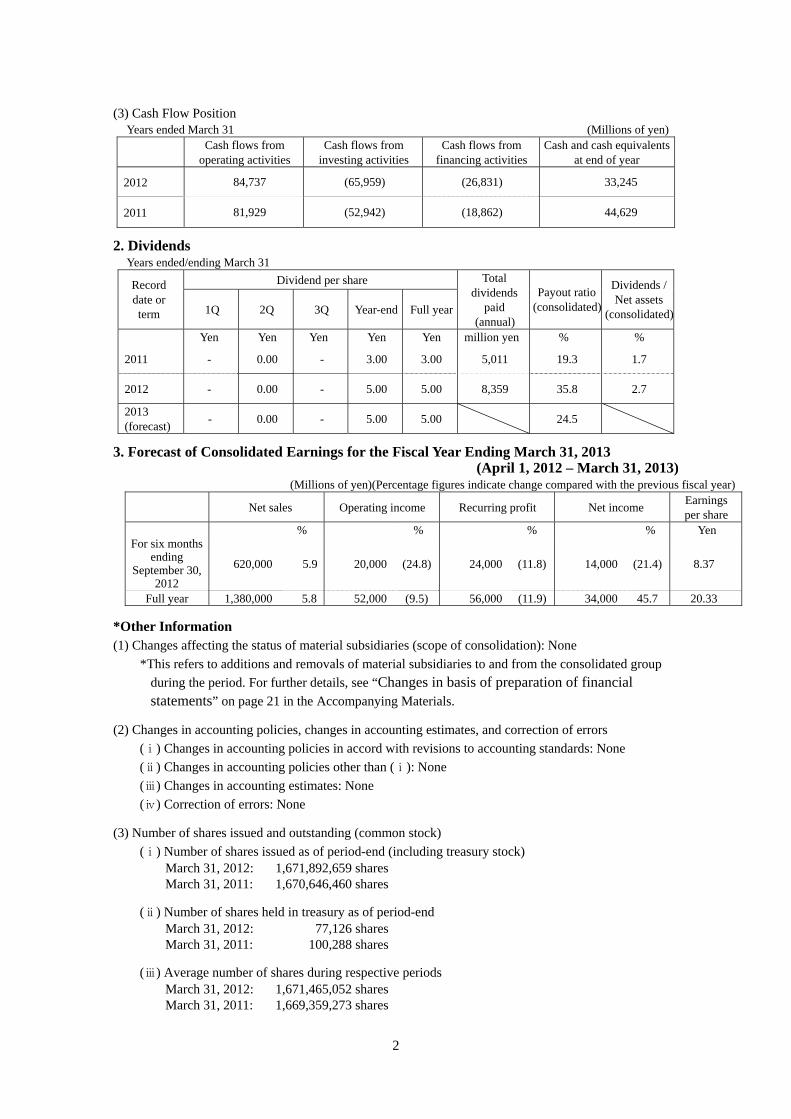
(3) Cash Flow Position Years ended March 31 (Millions of yen)
Cash flows from operating activities
Cash flows from investing activities
Cash flows from financing activities
Cash and cash equivalents at end of year
2012 84,737 (65,959) (26,831) 33,245
2011 81,929 (52,942) (18,862) 44,629 2. Dividends Years ended/ending March 31
Dividend per share Record date or term 1Q 2Q 3Q Year-end Full year
Total dividends
paid (annual)
Payout ratio (consolidated)
Dividends /Net assets
(consolidated)
Yen Yen Yen Yen Yen million yen % %
2011 - 0.00 - 3.00 3.00 5,011 19.3 1.7
2012 - 0.00 - 5.00 5.00 8,359 35.8 2.7
2013 (forecast) - 0.00 - 5.00 5.00 24.5
3. Forecast of Consolidated Earnings for the Fiscal Year Ending March 31, 2013
(April 1, 2012 – March 31, 2013) (Millions of yen)(Percentage figures indicate change compared with the previous fiscal year)
Net sales Operating income Recurring profit Net income Earnings per share
Full year 1,380,000 5.8 52,000 (9.5) 56,000 (11.9) 34,000 45.7 20.33 *Other Information (1) Changes affecting the status of material subsidiaries (scope of consolidation): None
*This refers to additions and removals of material subsidiaries to and from the consolidated group during the period. For further details, see “Changes in basis of preparation of financial statements” on page 21 in the Accompanying Materials.
(2) Changes in accounting policies, changes in accounting estimates, and correction of errors
(ⅰ) Changes in accounting policies in accord with revisions to accounting standards: None (ⅱ) Changes in accounting policies other than (ⅰ): None (ⅲ) Changes in accounting estimates: None (ⅳ) Correction of errors: None
(3) Number of shares issued and outstanding (common stock)
(ⅰ) Number of shares issued as of period-end (including treasury stock) March 31, 2012: 1,671,892,659 shares March 31, 2011: 1,670,646,460 shares
(ⅱ) Number of shares held in treasury as of period-end
March 31, 2012: 77,126 shares March 31, 2011: 100,288 shares
(ⅲ) Average number of shares during respective periods
March 31, 2012: 1,671,465,052 shares March 31, 2011: 1,669,359,273 shares
3
For reference: Overview of Non-Consolidated Financial Results
(1) Operating Results Years ended March 31 (Percentage figures indicate change compared with the previous fiscal year)
Net sales Operating income Recurring profit Net income
million yen % million yen % million yen % million yen % 2012 1,003,390 22.7 25,072 - 38,029 15.8 11,491 (65.5) 2011 817,455 26.9 1,731 - 32,837 280.6 33,341 -
Earnings per share Earnings per share
– diluted Yen Yen
2012 6.87 6.83 2011 19.97 19.66
(2) Financial Condition March 31 (Millions of yen)
Total assets Net assets Equity ratio Net assets per share
% Yen
2012 1,144,618 255,039 22.2 152.55
2011 1,116,076 246,888 22.1 147.78
Note: Shareholders’ equity March 31, 2012: ¥ 255,039 million March 31, 2011: ¥ 246,888 million * Review Status
This report is exempt from the review of accounts conducted pursuant to Japan’s Financial Instruments and Exchange Act. As of this report’s publication, the review of the financial results had not been completed. *Appropriate Use of Financial Forecasts and Other Important Matters Forward-Looking Statements These materials contain various forward-looking statements and other forecasts regarding performance and other matters. Such statements are based on information available at the time of preparation. Actual results may differ from those expressed or implied by forward-looking statements due to a range of factors. For assumptions underlying earnings forecasts and other information regarding the use of such forecasts, refer to “1. Qualitative Information and Financial Statements (1) Consolidated operating results (iii) Consolidated earnings outlook” on page 8 in the Accompanying Materials. How to Obtain Supplementary Briefing Material on Financial Results and Details of the Financial Results Briefing The Company plans to conduct a briefing for institutional investors and analysts on Thursday April 26, 2012, and to post the briefing material on financial results to be used for the briefing on TDnet and the Company’s website simultaneously with the announcement of financial results.
4
Accompanying Materials – Contents 1. Qualitative Information and Financial Statements 5
(1) Consolidated operating results 5
(2) Consolidated financial position 8
(3) Dividend policy and dividends for the fiscal years through March 31, 2012 and 2013 9
(4) Business and other risks 10
2. Status of Group 10
3. Management Strategy 10
(1) Basic management strategy 10
(2) Target management metrics 10
(3) Medium- to long-term management strategy 11
(4) Management priorities 11
4. Consolidated Financial Statements 14
(1) Consolidated balance sheets 14
(2) Consolidated statements of income and comprehensive income 16
Consolidated statements of income 16
Consolidated statements of comprehensive income 17
(3) Consolidated statement of changes in net assets 18
(4) Consolidated statements of cash flows 20
(5) Notes on the going-concern assumption 21
(6) Basis of preparation of financial statements 21
(7) Changes in basis of preparation of financial statements 21
(8) Notes on financial statements 21
5. Others 30
(1) Corporate officer changes 30
(2) Consolidated orders and sales 30
(3) Supplementary information on earnings forecasts for the fiscal year ending March 31, 2013 31
5
1. Qualitative Information and Financial Statements (1) Consolidated operating results (i) Overview of consolidated operating results
In the fiscal year ended March 31, 2012, the Japanese economy was initially forecast to remain
stagnant owing to such factors as disruption of supply chains after the Great East Japan Earthquake,
the historically high yen and adverse impacts from flooding in Thailand. However, signs of recovery
gradually emerged toward the end of the fiscal year. As reconstruction demand following the
earthquake moves into full swing and increasing attention becomes focused on Japan’s future energy
policy, the KHI Group role in society as an infrastructure manufactures continues to grow.
In the global economy, while the employment situation in the US showed a gradual improvement,
a number of concerns persist such as the lingering sovereign debt problem in Europe. Amid this
situation, China has maintained high economic growth albeit at a slower pace, and infrastructure
demand in emerging economies, including Asia and Brazil, remains firm, leading the overall global
economy toward a moderate growth track. In particular, rapid growth in emerging economies has
drawn attention to a number of pressing issues relating to energy, water and waste disposal. Hence,
business fields in which the KHI Group is able to contribute are expanding on a global scale.
In such an operating environment, the Group achieved growth in overall sales and earnings
despite declines in certain of its businesses. Orders received grew as a whole driven by large orders
booked by the Aerospace, Gas Turbine & Machinery and Precision Machinery segments, thereby
making up for decline in orders booked by the Rolling Stock, Ship & Offshore Structure and Plant &
Infrastructure segments. Overall sales increased compared with the previous fiscal year, driven by
sales growth in the Precision Machinery, Plant & Infrastructure and Aerospace segments, despite
sales decline in the Gas Turbine & Machinery and Ship & Offshore segments. Earnings declined in
the Rolling Stock and Gas Turbine & Machinery segments but increased as a whole, largely
attributable to improved operating performance in the Plant & Infrastructure and Ship & Offshore
segments.
The Group’s orders received totaled ¥1,311.8 billion, a ¥ 41.2 billion increase compared with the
previous fiscal year. Net sales increased 76.8 billion, to ¥1,303.7 billion. Operating income totaled
¥57.4 billion, a ¥14.8 billion improvement compared with the previous fiscal year. Although
recurring profit grew ¥14.4 billion to ¥63.6 billion, net income declined ¥2.6 billion, to ¥23.3 billion
owing to a reversal of deferred tax assets following changes to Japan’s tax system.
6
(ii) Segment information
Segment net sales, operating income, and orders received (billions of yen) Fiscal year ended March 31 Orders received
Note: Net sales include only sales to external customers. Ship & Offshore Structure Orders received totaled ¥39.9 billion, a ¥39.0 billion decrease compared with the previous fiscal year, despite the receipt of newbuild orders for eight bulk carriers and others.
Net sales totaled ¥113.5 billion, down ¥4.8 billion compared with the previous fiscal year, which was bolstered by large newbuild sales.
Operating income increased ¥4.9 billion , to ¥3.9 billion, mainly owing to a decline in provision for losses on construction contracts. Rolling Stock Orders received totaled ¥66.0 billion, down ¥121.0 billion compared with the previous fiscal year. This decrease was mainly due to booking of a large order in the previous fiscal year and delay in the project which was originally scheduled to be booked in the fiscal year under review.
Net sales totaled ¥132.6 billion, almost unchanged compared with the previous fiscal year, since a drop in domestic railway car sales was offset by an increase in overseas railway car sales.
Operating income was down ¥3.0 billion , to ¥5.1 billion, primarily owing to the impact of yen appreciation and provisioning of additional reserves against losses on construction contracts. Aerospace Orders received totaled ¥327.2 billion, up ¥120.5 billion compared with the previous fiscal year, largely by virtue of growth in orders from Japan Ministry of Defense.
Net sales totaled ¥206.5 billion, an increase of ¥9.7 billion compared with the previous fiscal year, thanks to growth in sales of component parts for Boeing 777 and 787.
Operating income increased ¥4.7 billion , to ¥7.8 billion, reflecting sales growth and cost reduction.
7
Gas Turbine & Machinery Orders received totaled ¥227.2 billion, up ¥39.6 billion compared with the previous fiscal year. This increase was largely attributable to larger orders for component parts of commercial aircraft jet engines and orders for construction of a gas engine power plant.
Net sales totaled ¥194.6 billion, down ¥8.0 billion compared with the previous fiscal year. The decrease was mainly due to a drop in sales of marine diesel engines and gas compressors.
Operating income decreased ¥1.7 billion compared with the previous fiscal year to ¥7.7 billion reflecting a drop in sales. Plant & Infrastructure Orders received totaled ¥119.2 billion, largely unchanged compared with the previous fiscal year, as a result of receiving an order for a refuse incineration plant in the domestic market.
Net sales totaled ¥122.8 billion, up ¥33.7 billion compared with the previous fiscal year, mainly due to higher sales from plant installations overseas.
Operating income was up ¥5.8 billion ,to ¥14.1 billion , reflecting sales growth. Motorcycle & Engine Net sales totaled ¥235.2 billion, largely unchanged compared with the previous fiscal year, mainly owing to sales growth of motorcycles for emerging markets despite a drop in sales of motorcycles to developed countries due to strong yen adverse impact.
Operating loss was reduced to ¥2.9 billion, a ¥2.0 billion improvement compared with the previous fiscal year despite the negative impact from the Thai floods and strong yen. The improvement was mainly attributable to sales growth of motorcycles for emerging markets and fixed-cost cutting. Precision Machinery Orders received totaled ¥174.5 billion, a ¥25.6 billion increase compared with the previous fiscal year. Order growth was driven mainly by demand for hydraulic components from construction machinery makers.
Net sales rose ¥34.7 billion, to ¥175.0 billion, buoyed by growth in hydraulic components sales to construction machinery makers and sales of paint robots.
Operating income was up ¥4.3 billion ,to ¥26.6 billion, by virtue of sales growth. Other Operations Net sales totaled ¥123.2 billion, a ¥9.1 billion increase compared with the previous fiscal year.
Operating income totaled ¥3.8 billion, a ¥1.2 billion improvement compared with the previous fiscal year.
8
(iii) Consolidated earnings outlook
The global economy is expected to show a gradual recovery as a whole, but the pace will likely
remain slow for the time being due to a sluggish improvement in the employment situation in the
United States and adverse impact from the financial crisis in Europe. The economic outlook remains
uncertain, as even newly industrialized countries such as China have started to show signs of being
badly affected by the adverse economic performance of developed countries. Foreign exchange rate
changes and hikes in the cost of raw materials are also concerns for the Company, and its operating
environment continues to be challenging.
Faced with such a highly uncertain operating environment, the Company will steadily and
vigorously push ahead with specific initiatives to rebuild its earnings structure and return to a
sustained growth path, as the current fiscal year marks the final year of the “Medium-Term Business
Plan 2010” (FY2010-FY2012).
For the fiscal year ending March 31, 2013, the Company forecasts consolidated net sales of
¥1,380 billion, an ¥80 billion increase compared with the fiscal year just ended. The Company plans
to derive the bulk of this sales growth from the Aerospace, Precision Machinery and Motorcycle &
Engine segments, and such growth is expected to offset the anticipated sales drop at the Ship &
Offshore Structure segment.
In terms of earnings, the Company forecasts consolidated operating income of ¥52 billion,
recurring profit of ¥56 billion, and net income of ¥34 billion. The Company plans to achieve these
forecasts by continuing to pursue ongoing initiatives to improve earnings across all operations
through such means as reducing fixed and overhead costs and boosting productivity.
The Company’s earnings forecasts assume exchange rates of ¥80 to the US dollar and ¥105 to the euro. (2) Consolidated financial position (i) Financial condition
(A) Assets
At March 31, 2012, consolidated assets totaled ¥1,362.1 billion, essentially unchanged from
March 31, 2011. Of this total, current assets accounted for ¥967.1 billion, a 1.6% increase from
March 31, 2011. This increase was mainly attributable to growth in trade receivables in
conjunction with sales activities and inventory growth reflecting progress toward completion of
construction jobs. Fixed assets totaled ¥394.9 billion on March 31, 2012, a 1.8% decrease from a
year earlier. This decrease was largely attributable to loss on impairment of fixed assets and
reversal of deferred tax assets.
(B) Liabilities
Consolidated liabilities on March 31, 2012 totaled ¥1,046.2 billion, down 1.0% compared with
March 31, 2011, largely as a result of a 5.1% decrease in interest-bearing debt to ¥407.1 billion.
(C) Net assets
Consolidated net assets at March 31, 2012 totaled ¥315.9 billion, a 6.2% increase compared with
March 31, 2011. This increase was mainly attributable to net income partially offset by dividend
payments.
9
(ii) Cash flows
(A) Cash flow from operating activities
Operating activities provided net cash of ¥84.7 billion, a ¥2.8 billion increase compared with the
previous fiscal year. Major sources of operating cash flow included depreciation and amortization
of ¥48.9 billion, loss on impairment of fixed assets of ¥14.9 billion, and ¥18.9 billion increase of
advances from customers. Major uses of operating cash flow included an ¥18.7 billion increase in
inventories and ¥18.2 billion in tax payments.
(B) Cash flow from investing activities
Investing activities used net cash of ¥65.9 billion, ¥13.0 billion more than in the previous fiscal
year, mainly to acquire property, plant and equipment.
(C) Cash flow from financing activities
Financing activities used net cash of ¥26.8 billion, a ¥7.9 billion increase compared with the
previous fiscal year, mainly to repay borrowings. (iii) Cash flow ratios Fiscal year ended March 31: 2008 2009 2010 2011 2012 Equity ratio (%) 22.7 20.7 20.4 21.3 22.4 Market-value equity ratio (%) 26.8 23.3 31.8 45.1 31.0 Debt-to-cash-flow ratio (%) 364.8 - 1,421.2 523.7 480.5 Interest-coverage ratio (times) 9.4 - 5.5 17.2 19.0
Notes: 1. Ratios are calculated as follows.
Ratio of shareholders’ equity to total assets: Shareholders’ equity / Total assets Market-value equity ratio: Market capitalization / Total assets Debt-to-cash-flow ratio: Interest-bearing debt / Cash flow from operating activities Interest-coverage ratio: Cash flow from operating activities / Interest paid
2. All ratios are calculated using consolidated-basis financial data. 3. Market capitalization is calculated by multiplying the closing price of the company’s stock by
the number of shares issued and outstanding (excluding treasury stock) at the end of the fiscal year.
4. The figure for cash flow from operating activities is taken from cash flow from operating activities on the consolidated statement of cash flows.
5. Interest-bearing debt is all interest-bearing debt listed under liabilities on the consolidated balance sheet. Interest paid is the figure for “Cash paid for interest” on the consolidated statement of cash flows.
6. The debt-to-cash-flow ratio and interest coverage ratio are omitted for the fiscal year ended March 31, 2009, because that fiscal year’s operating cash flow was negative.
(3) Dividend policy and dividends for the fiscal years 2012 and 2013
The Company’s basic policy is to pay shareholders stable dividends commensurate with earnings on
an ongoing basis while internally retaining sufficient funds to strengthen and expand its earnings
power and operating foundation in pursuit of future growth. After comprehensively considering its
earnings performance, the sufficiency of its retained earnings, and other relevant factors in light of
said policy, the Company intends to pay a dividend of ¥5 per share for the fiscal year ended March
31, 2012.
For the fiscal year ending March 31, 2013, the Company plans to pay a dividend of ¥5 per share.
10
(4) Business and other risks
No risks other than those disclosed under the heading “Business and Other Risks” in the Company’s
most recent full-year statutory financial report (filed June 28, 2011) have surfaced since said filing.
Updated risk disclosures are therefore omitted here.
2. Status of Group
There have been no material changes in the “Chart of Operations (Nature of Operations)” and the
“Status of Affiliated Companies” in the Company’s most recent full-year statutory financial report
(filed June 28, 2011). Updated disclosure of them is therefore omitted here.
The Group has amassed a broad range of technologies related to air, marine, and land transport
systems, energy, environmental engineering, and industrial machinery. In accord with its Group
Mission Statement, “Kawasaki, working as one for the good of the planet,” the Group has embraced
a mission of creating new value conducive to formation of an affluent, beautiful society in harmony
with the global environment through utilization of its broad array of sophisticated technological
capabilities.
In addition to providing products and services, the Group is committed to fulfilling its societal
responsibilities as a corporate citizen in all of its operations in accord with its Group Management
Principles. The Group aims to meet the expectations of its shareholders and other stakeholders by
developing human resources globally and continuously enhancing its earnings power and corporate
value.
The Group’s basic policy is to meet shareholders expectations by paying dividends commensurate
with earnings on an ongoing basis while internally retaining sufficient funds to strengthen and
expand its earnings power and operating foundation in pursuit of future growth.
(2) Target management metrics
In the aim of generating profits sufficient to meet investors’ expectations, the Group has adopted
ROIC (return on invested capital: earnings before interest and taxes ÷ invested capital), a measure of
capital efficiency, as its target metric of operating performance. While seeking to maximize ROIC,
the Group will also endeavor to strengthen its financial condition through earnings growth and
improvement in invested-capital efficiency.
11
(3) Medium- to long-term management strategy
In April 2010, the Company adopted a new three-year business plan, “Medium-Term Business Plan
2010” (FY2010-FY2012). The plan sets forth a detailed roadmap for re-embarking on a growth
trajectory based on core policies of “rebuilding the Group’s earnings structure” and “returning to a
sustained growth path”. At the same time, the Group has formulated Kawasaki Business Vision 2020,
which clarifies its businesses’ longer-term direction and strategies, in the aim of achieving sustained
growth into the future. Based on Kawasaki Business Vision 2020, the Group has incorporated
specific initiatives for developing new businesses and new products into its “Medium-Term Business
Plan 2010” (FY2010-FY2012).
(4) Management priorities In the fiscal year ended March 31, 2012, the Group’s business performance was adversely affected
by strong yen and slow operation of the Motorcycle & Engine segment due to the disruption in
supply chains after the floods in Thailand. But the Group achieved the earnings target (operating
income of ¥52 billion and ordinary income of ¥56 billion) set for the fiscal year ending in March 31,
2013, the final year of the “Medium-Term Business Plan 2010,” one year ahead of the plan. This was
largely by virtue of the Company’s relentless efforts to improve its productivity in each business area
and extensive risk management in large projects, in addition to its enhanced global production
system including the procurement of raw materials from overseas markets as well as growth in the
Precision Machinery segment on the back of steady expansion of the Chinese economy. We will
continue to thoroughly work on “selectively focusing resources on strategic businesses,”
“emphasizing quality over quantity,” and “employing prudent risk management,” satisfy demand
from emerging countries and enhance measures to respond to exchange fluctuations to reinforce our
revenue base. At the same time, to strengthen our financial and business position, we will focus on
enhancing financial strength and cutting fixed expenses. Particularly in the Ship & Offshore
Structure segment and motorcycle operations in developed countries that are seeing sluggish markets,
the Group will re-examine its global production and marketing system from the perspective of
selection and concentration, with a view to reallocating the management resources to more important
areas.
In addition, interest in independent and diversified energy systems and renewable energy has been
growing in Japan after the Great East Japan Earthquake, as the disaster raised concerns about the
ability of the nation to supply enough electricity. To respond to such growing interest, the Group can
use its gas engines with the highest efficiency in the world; gas turbines that work with Dual Fuel
(oil and gas) and boast an excellent track record; electricity generator using wind, solar light, micro
hydro sources and biomass; and rechargeable battery that contributes to smoothing the flow of
electricity. In the future, the Group is expected to systemize and develop those products at the
request of Japanese society.
In addition to establishing the Marketing Division in April 2012, the Group also plans to locate the
Plant & Infrastructure Company in the new Tokyo Head Office, scheduled to be transferred in
12
December 2012, so as to take further advantage of the Company’s intellectual assets and
strengthening its system solution business in the areas of transportation equipment, energy and
environment, and industrial equipment.
The initiatives to be undertaken by each business division are as follows.
(i) Ship & Offshore Structures: Expand business scale and enhance competitiveness in China,
reform the structure of the domestic segments by shifting its focus to strengthening
technological development and building up the mother-factory of the Group’s production
activities, and advance to marine development
(ii) Rolling Stock: Enhance competitiveness in the domestic and overseas markets through
standard rolling stock with high versatility, respond to demand for railroad construction and
railway car renewal in North America, and pursue new product development to respond to
overseas railroad system projects and strengthen project management capability
(iii) Aerospace: Move into mass production of the P-1 maritime patrol aircraft and C-2 transport
aircraft, promote development of the new multipurpose helicopter (UH-X), start mass
production of Boeing 787s and promote development of derivative aircraft
(iv) Gas Turbine & Machinery: Launch the energy solution business, promote development of new
products and models such as industrial gas turbines and high-efficiency gas-engines and
advance to overseas markets, and promote development of new models of jet engines for
commercial aircraft with greater production efficiency
(v) Plant & Infrastructure: Bolster research and development in order to expand in the fields of
energy and the environment, accelerate efforts to commercialize new products and new
business concepts, and expand the infrastructure business mainly in resource-rich countries
(vi) Motorcycle & Engine: Enhance cost competitiveness through optimal production on a global
basis and expansion of procurement from overseas, expand sales channels and develop new
markets in emerging countries we have already entered (Southeast Asia, Brazil, etc.), and
develop leading technologies to respond to environmental requirements
(vii) Precision Machinery: Bolster production system of hydraulic components for construction
machinery on a global scale and establish a differentiated production technology by
implementing a large number of robots, enhance cost competitiveness in the field of robotics,
and develop technology to expand the applicable areas
(viii) Others: Improve development and sales capabilities with respect to the construction
machinery division by deepening our alliance with Hitachi Construction Machinery Co., Ltd.
and enhance profitability by lowering break-even points
Compliance is a fundamental premise in carrying out business activities such as those above. The
Group strives to ensure that employees are made thoroughly aware of relevant laws and regulations .
We do this by implementing such measures as appointing Directors independent from executive
functions and electing outside auditors who have no conflict of interest with the Company and
corporate auditors who are highly experienced in the area of finance and accounting. In addition, we
13
establish internal regulations concerning corporate ethics, carry out staff training at each level,
distribute compliance handbooks, and set up CSR committees in each organization. Furthermore, we
have continued to take thoroughgoing organizational compliance initiatives by setting up a
department which oversees internal controls, compliance, and CSR promotion, and creating units in
charge of compliance within each business unit, while also striving to create a corporate culture that
places the highest priority at all times on information disclosure and transparency.
14
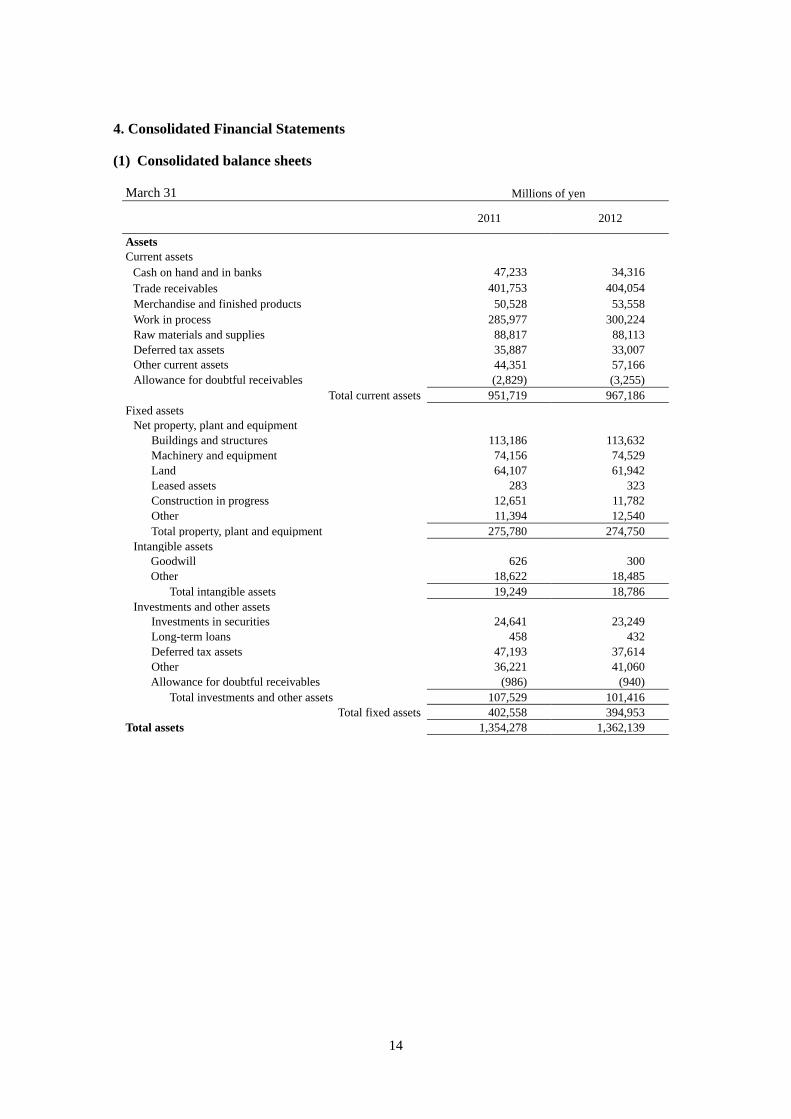
4. Consolidated Financial Statements
(1) Consolidated balance sheets
March 31 Millions of yen
2011 2012
Assets Current assets
Cash on hand and in banks 47,233 34,316 Trade receivables 401,753 404,054 Merchandise and finished products 50,528 53,558 Work in process 285,977 300,224 Raw materials and supplies 88,817 88,113 Deferred tax assets 35,887 33,007 Other current assets 44,351 57,166 Allowance for doubtful receivables (2,829) (3,255)
Total current assets 951,719 967,186 Fixed assets
Net property, plant and equipment Buildings and structures 113,186 113,632 Machinery and equipment 74,156 74,529 Land 64,107 61,942 Leased assets 283 323 Construction in progress 12,651 11,782 Other 11,394 12,540 Total property, plant and equipment 275,780 274,750
Intangible assets Goodwill 626 300 Other 18,622 18,485
Total intangible assets 19,249 18,786 Investments and other assets
Investments in securities 24,641 23,249 Long-term loans 458 432 Deferred tax assets 47,193 37,614 Other 36,221 41,060 Allowance for doubtful receivables (986) (940)
Total investments and other assets 107,529 101,416 Total fixed assets 402,558 394,953
Total assets 1,354,278 1,362,139
15
Liabilities Current liabilities
Trade payables 319,271 310,775 Short-term debt 143,972 137,568 Lease obligations, current 242 355 Income taxes payable 5,988 4,627 Deferred tax liabilities 765 1,465 Accrued bonuses 15,692 20,582 Provision for product warranties 7,288 7,128 Provision for losses on construction contracts 33,068 30,977 Provision for restructuring charges 1,077 - Provision for environmental measures 499 - Advances from customers 80,815 99,050 Current portion of bonds 30,483 10,000 Asset retirement obligations 10 150 Other 64,550 73,321
Total current liabilities 703,726 696,002
Long-term liabilities
Bonds payable 50,000 60,000 Long-term debt 203,801 198,737 Lease obligations 645 506 Deferred tax liabilities 3,990 4,060 Provision for loss on damages suit 5,868 910 Provision for environmental measures 3,333 3,282 Employees’ retirement and severance benefits 80,556 75,052 Asset retirement obligations 440 611 Other 4,480 7,053
Total long-term liabilities 353,117 350,214 Total liabilities 1,056,844 1,046,216 Net assets
Shareholders’ equity Common stock 104,340 104,484 Capital surplus 54,251 54,393 Retained earnings 158,615 176,414 Treasury stock (30) (22)
Total shareholders’ equity 317,176 335,270
Accumulated other comprehensive income Net unrealized gains (losses) on securities, net of tax 3,876 3,989 Deferred gains (losses) on hedges (990) 246 Foreign currency translation adjustments (31,006) (33,451)
Total accumulated other comprehensive income (28,119) (29,215) Minority interests 8,376 9,868
Total net assets 297,433 315,922 Total liabilities and net assets 1,354,278 1,362,139
16
(2) Consolidated statements of income and comprehensive income
Consolidated statements of income
Years ended March 31 Millions of yen
2011 2012 Net sales 1,226,949 1,303,778 Cost of sales 1,037,078 1,088,918 Gross profit 189,870 214,860 Selling, general and administrative expenses
Salaries and benefits 39,429 41,565 Advertising expenses 7,967 8,166 R&D expenses 37,090 39,940 Provision for doubtful accounts 282 796 Other 62,472 66,907
Total selling, general and administrative expenses 147,242 157,375 Operating income 42,628 57,484 Non-operating income
Interest income 1,779 1,672 Dividend income 527 658 Equity in income of non-consolidated subsidiaries and affiliates 9,205 8,567 Foreign exchange gain, net 1,491 206 Other 6,327 8,041
Total non-operating income 19,330 19,146 Non-operating expenses
Interest expense 4,677 4,282 Loss on valuation of securities 1,577 918 Other 6,567 7,802
Loss on impairment of fixed assets 9,923 14,921 Provision for doubtful accounts of affiliates 325 - Loss on adjustment for changes of accounting standard for asset retirement obligations 291 -
Total extraordinary losses 10,540 14,921 Income before income taxes and minority interests 38,595 48,706 Income taxes
Current 14,341 9,932 Deferred (3,503) 12,899 Total income taxes 10,837 22,831
Income before minority interests 27,758 25,875 Minority interests in net income of consolidated subsidiaries 1,792 2,551 Net income 25,965 23,323
17
Consolidated statements of comprehensive income
Years ended March 31 Millions of yen
2011 2012
Income before minority interests 27,758 25,875
Other comprehensive income
Net unrealized gains (losses) on securities, net of tax (1,437) 106
Share of other comprehensive income of associates accounted for using equity method (2,167) 231
Total other comprehensive income (9,505) (1,305)
Comprehensive Income attributable to: 18,252 24,569
Owners of the parent company 16,505 22,227
Minority interests 1,746 2,341
18
(3) Consolidated statements of changes in net assets Years ended March 31 Millions of yen 2011 2012
Shareholders’ equity Common stock
Balance at end of previous year 104,328 104,340 Changes during the period
Conversion of convertible bonds 11 144 Total changes during the period 11 144
Balance at end of year 104,340 104,484 Capital surplus
Balance at end of previous year 54,275 54,251 Changes during the period
Conversion of convertible bonds (24) 142 Treasury stock disposed (0) (0) Total changes during the period (24) 142
Balance at end of year 54,251 54,393 Retained earnings
Balance at end of previous year 137,689 158,615 Changes during the period
Conversion of convertible bonds (16) - Cash dividend (5,003) (5,011) Net income 25,965 23,323 Treasury stock disposed - (3) Increase (decrease) by change of consolidation period of subsidiaries - (509) Other (19) - Total changes during the period 20,926 17,798
Balance at end of year 158,615 176,414 Treasury stock
Balance at end of previous year (552) (30) Changes during the period
Conversion of convertible bonds 535 13 Treasury stock purchased (15) (6) Treasury stock disposed 1 1 Total changes during the period 521 7
Balance at end of year (30) (22) Total shareholders’ equity
Balance at end of previous year 295,741 317,176 Changes during the period
Conversion of convertible bonds 506 300 Cash dividend (5,003) (5,011) Net income 25,965 23,323 Treasury stock purchased (15) (6) Treasury stock disposed 1 (2) Increase (decrease) by change of consolidation period of subsidiaries - (509) Other (19) - Total changes during the period 21,435 18,093
Balance at end of year 317,176 335,270
19
Comprehensive income Net unrealized gain (loss) on securities
Balance at end of previous year 5,305 3,876 Changes during the period
Net changes in items other than shareholders’ equity (1,429) 112 Total changes during the period (1,429) 112
Balance at end of year 3,876 3,989 Deferred gains (losses) on hedges
Balance at end of previous year (162) (990)
Changes during the period Net changes in items other than shareholders’ equity (828) 1,236 Total changes during the period (828) 1,236
Balance at end of year (990) 246 Foreign currency translation adjustments
Balance at end of previous year (23,803) (31,006) Changes during the period
Net changes in items other than shareholders’ equity (7,202) (2,444) Total changes during the period (7,202) (2,444)
Balance at end of year (31,006) (33,451) Total comprehensive income
Balance at end of previous year (18,659) (28,119) Changes during the period
Net changes in items other than shareholders’ equity (9,460) (1,095) Total changes during the period (9,460) (1,095)
Balance at end of year (28,119) (29,215) Minority interests
Balance at end of previous year 5,972 8,376 Changes during the period
Net changes in items other than shareholders’ equity 2,404 1,491 Total changes during the period 2,404 1,491
Balance at end of year 8,376 9,868 Total net assets
Balance at end of previous year 283,053 297,433 Changes during the period
Conversion of convertible bonds 506 300 Cash dividend (5,003) (5,011) Net income for the year (loss) 25,965 23,323 Treasury stock purchased (15) (6) Treasury stock disposed 1 (2) Increase (decrease) by change of consolidation period of subsidiaries - (509) Other (19) - Net changes in items other than shareholders’ equity (7,055) 395 Total changes during the period 14,380 18,489
Balance at end of year 297,433 315,922
20
(4) Consolidated statements of cash flows
Years ended March 31 Millions of yen 2011 2012
Cash flows from operating activities Income before income taxes and minority interests 38,595 48,706 Depreciation and amortization 50,276 48,901 Loss on impairment of fixed assets 9,923 14,921 Increase (decrease) in employees’ retirement and severance benefits (8,159) (5,257) Increase (decrease) in accrued bonuses 1,489 4,885 Increase (decrease) in allowance for doubtful receivables 514 449 Increase (decrease) in provision for product warranties 794 (750) Increase (decrease) in provision for losses on construction contracts 15,349 (2,016) Increase (decrease) in provision for restructuring charges (5,249) (1,077) Increase (decrease) in provision for losses on damages suit (837) (4,957) Increase (decrease) in provision for environmental measures (658) (545) Loss on disposal of inventories 1,336 (70) (Gain) loss on sale of marketable and investment securities (0) (591) (Gain) loss on valuation of securities 1,577 918 (Gain) loss on sale of property, plant, and equipment 552 1,177 Equity in income non-consolidated subsidiaries and affiliates (9,205) (8,567) Interest and dividend income (2,306) (2,331) Interest expense 4,677 4,282 (Increase) decrease in trade receivables 14,910 (942) (Increase) decrease in inventories (17,775) (18,705) (Increase) decrease in other current assets 8,590 (2,139) Increase (decrease) in trade payables 25,114 (7,332) Increase (decrease) in advances from customers (15,552) 18,973 Increase (decrease) in other current liabilities (17,156) 8,708 Other 1,895 4,138
Subtotal 98,696 100,775 Cash received for interest and dividends 6,407 6,656 Cash paid for interest (4,762) (4,455) Cash paid for income taxes (13,245) (18,238) Payment of levies (5,165) - Net cash provided by operating activities 81,929 84,737
Cash flows from investing activities Decrease (increase) in time deposits with maturities over three months (2,138) 1,446 Acquisition of property, plant and equipment (47,408) (61,126) Proceeds from sale of property, plant and equipment 616 535 Acquisition of intangible assets (4,886) (4,921) Proceeds from sale of intangible assets 37 16 Acquisition of investments in securities (350) (47) Proceeds from sale of investments in securities 12 663 Acquisition of investments in subsidiaries of affiliate - (1,761) Decrease (increase) in short-term loans receivable 287 (11) Additions to long-term loans receivable (40) (70) Proceeds from collection of long-term loans receivable 102 89 Other 825 (771) Net cash used for investing activities (52,942) (65,959)
Cash flows from financing activities Increase (decrease) in short-term debt, net (53,670) (568) Proceeds from long-term debt 24,000 19,963 Repayment of long-term debt (4,836) (29,701) Proceeds from issuance of bonds 20,000 20,000 Redemption of bonds payable - (30,186) Acquisition of treasury stock (14) (8) Proceeds from stock issuance to minority shareholders 1,209 - Cash dividends paid (5,000) (5,014) Cash dividends paid to minority shareholders (476) (1,070) Other (72) (243) Net cash used for financing activities (18,862) (26,831)
Effect of exchange rate changes 367 (1,822) Net increase (decrease) in cash and cash equivalents 10,491 (9,875) Cash and cash equivalents at beginning of period 34,137 44,629 Increase (decrease) in cash and cash equivalents by change of consolidation period of subsidiaries - (1,508) Cash and cash equivalents at end of period 44,629 33,245
21
(5) Notes on the going-concern assumption Not applicable
(6) Basis of preparation of financial statements
Other than information disclosed under the heading “(7) Changes in basis of preparation of
financial statements” below, no material changes have been made from the information disclosed
in the Company’s most recent full-year statutory financial report (filed June 28, 2011). An
updated disclosure is therefore omitted here. (7) Changes in basis of preparation of financial statements 1. Change in the scope of consolidation (1) Change in the scope of consolidation
Four companies were added as consolidated subsidiaries because they were newly established by the Company. Three companies merged with another consolidated subsidiaries and were dissolved.
(2) Number of consolidated subsidiaries after change
97 companies 2. Change in application of the equity method (1) Non-consolidated subsidiaries which are accounted for under the equity method:
None (2) Associated companies which are accounted for under the equity method
(i) Change in associated companies which are accounted for under the equity method None
(ii) Number of associated companies accounted for under the equity method after change 14 companies
(8) Notes on financial statements Consolidated balance sheets Fiscal year ended March 31, 2012 (As of March 31, 2012)
Information is omitted here as its disclosure in this report is not of material importance. Consolidated Statements of Income Fiscal year ended March 31, 2011 (April 1, 2011 – March 31, 2012) 1. Loss on impairment of fixed assets (1) Outline asset groups in which loss on impairment of fixed assets was recognized Purpose Location Type
Assets held for business Sakaide-city, Kagawa Buildings and structures, Machinery and equipment, etc.
Assets held for business Minato-ku and Koto-ku, Tokyo Buildings and structures
Idle assets Kakamigahara-city, Gifu Buildings and structures, etc.
Idle assets Akashi-city, Hyogo Buildings and structures, etc.
Idle assets Taketa-city, Oita Land, etc.
22
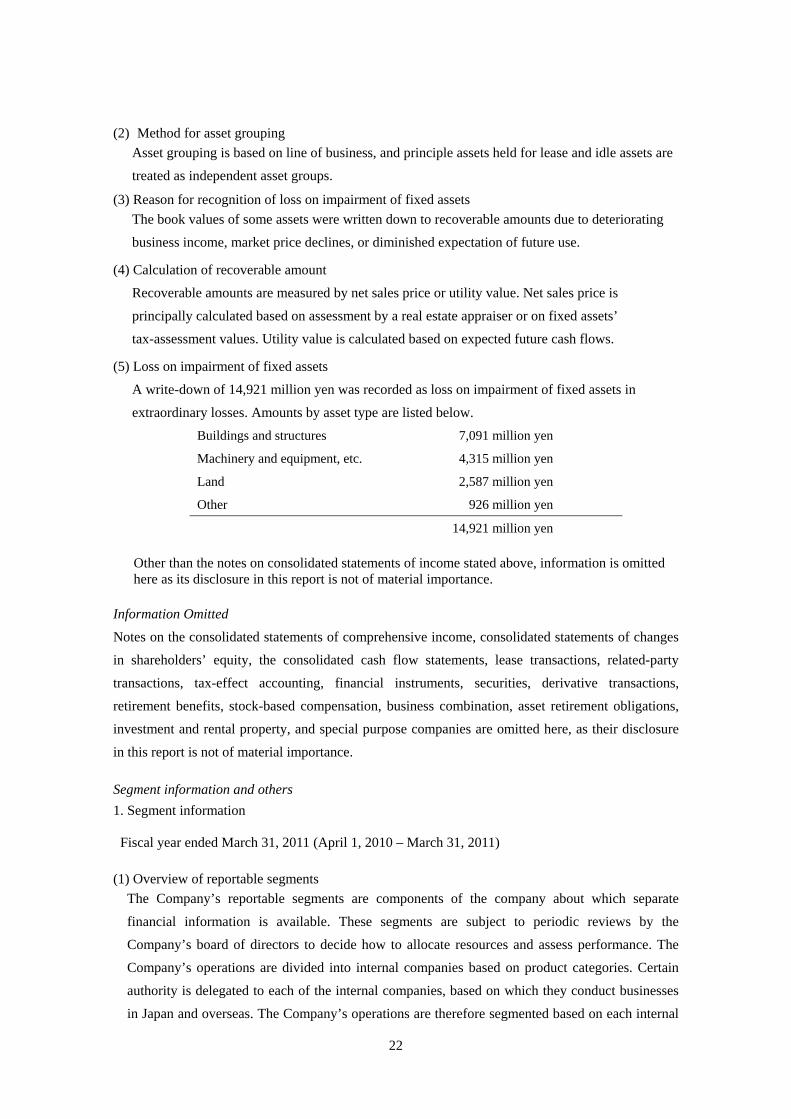
(2) Method for asset grouping
Asset grouping is based on line of business, and principle assets held for lease and idle assets are
treated as independent asset groups.
(3) Reason for recognition of loss on impairment of fixed assets The book values of some assets were written down to recoverable amounts due to deteriorating
business income, market price declines, or diminished expectation of future use.
(4) Calculation of recoverable amount
Recoverable amounts are measured by net sales price or utility value. Net sales price is
principally calculated based on assessment by a real estate appraiser or on fixed assets’
tax-assessment values. Utility value is calculated based on expected future cash flows.
(5) Loss on impairment of fixed assets
A write-down of 14,921 million yen was recorded as loss on impairment of fixed assets in
extraordinary losses. Amounts by asset type are listed below. Buildings and structures 7,091 million yen
Machinery and equipment, etc. 4,315 million yen
Land 2,587 million yen
Other 926 million yen
14,921 million yen
Other than the notes on consolidated statements of income stated above, information is omitted here as its disclosure in this report is not of material importance.
Information Omitted
Notes on the consolidated statements of comprehensive income, consolidated statements of changes
in shareholders’ equity, the consolidated cash flow statements, lease transactions, related-party
retirement benefits, stock-based compensation, business combination, asset retirement obligations,
investment and rental property, and special purpose companies are omitted here, as their disclosure
in this report is not of material importance. Segment information and others 1. Segment information
Fiscal year ended March 31, 2011 (April 1, 2010 – March 31, 2011) (1) Overview of reportable segments
The Company’s reportable segments are components of the company about which separate
financial information is available. These segments are subject to periodic reviews by the
Company’s board of directors to decide how to allocate resources and assess performance. The
Company’s operations are divided into internal companies based on product categories. Certain
authority is delegated to each of the internal companies, based on which they conduct businesses
in Japan and overseas. The Company’s operations are therefore segmented based on each internal
23
company’s product categories. The Company’s eight reportable segments are the Ship & Offshore
Structure segment, the Rolling Stock segment, the Aerospace segment, the Gas Turbine &
Machinery segment, the Plant & Infrastructure segment, the Motorcycle & Engine segment, the
Precision Machinery segment, and the Other segment.
In conjunction with its October 2010 organizational restructuring, the Group renamed its
Shipbuilding segment the Ship & Offshore Structure segment. Main segment businesses are listed below.
Industry segment Major products
Ship & Offshore Structure Construction and sale of ships and other vessels, etc.
Rolling Stock Production and sale of rolling stock, snow plows, etc. Aerospace Production and sale of aircraft, etc. Gas Turbines & Machinery
Production and sale of jet engines, general-purpose gas turbine generators, prime movers, etc.
Plant & Infrastructure Production and sale of industrial equipment, boilers, environmental equipment, steel structures, crushers, etc.
Motorcycle & Engine Production and sale of motorcycles, personal watercraft (“JET SKI”), all-terrain vehicles (ATV), utility vehicles, general-purpose gasoline engines, etc.
Precision Machinery Production and sale of industrial hydraulic products, industrial robots, etc.
Other Production and sale of construction machinery, commercial activities, sales/order agency and intermediary activities, administration of welfare facilities, etc.
(2) Calculation methods for sales, income (loss), assets, liabilities and other items by reportable segment
Accounting methods applied for calculation of sales, income (loss), assets, liabilities, and other
items by industry segment largely correspond to information presented under “(6) Basis of
preparation of financial statements”. Segment income is based on operating income. Intersegment
sales or transfers are based on market prices. (3) Sales, income (loss), assets, liabilities, and other items by reportable segment
(Millions of yen) Sales Other items
External sales Intersegment
sales or transfer
Total
Segment income (loss)
Segment assets Depreciation/
amortization
Loss on impairment
of fixed assets
Investment in equity- method affiliates
Increase in property, plant and equipment and intangibles
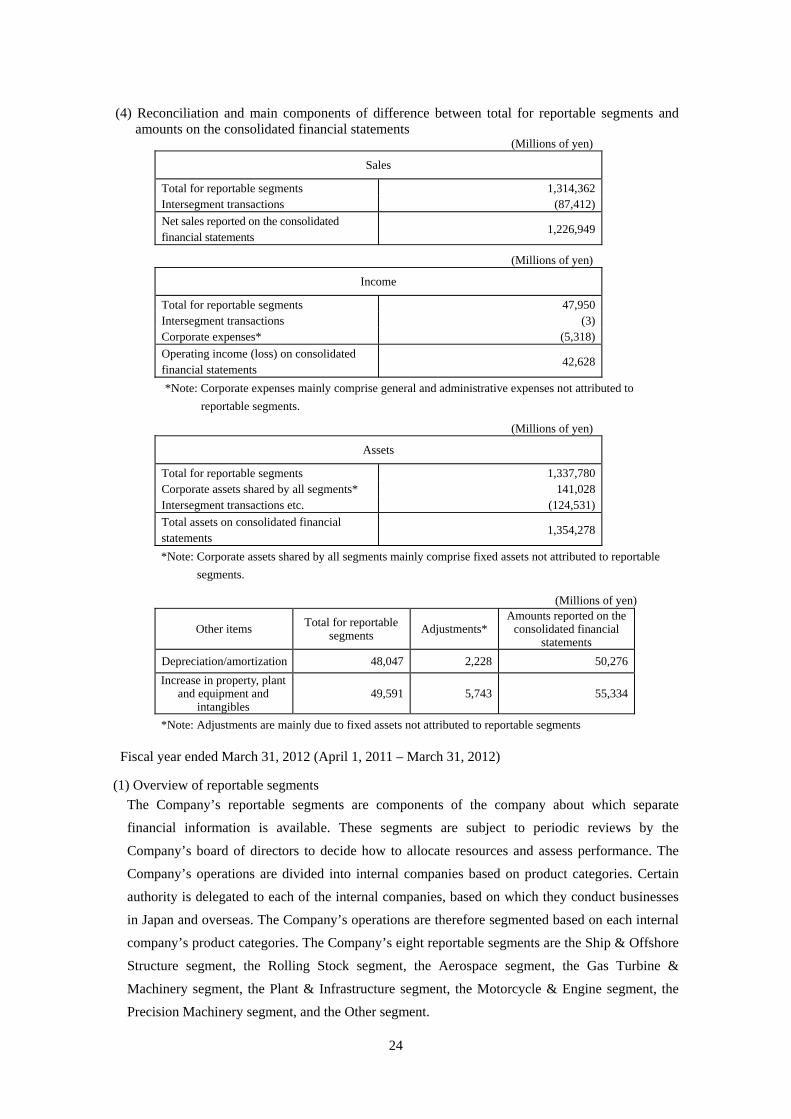
(4) Reconciliation and main components of difference between total for reportable segments and amounts on the consolidated financial statements
(Millions of yen)
Sales
Total for reportable segments 1,314,362 Intersegment transactions (87,412) Net sales reported on the consolidated financial statements
1,226,949
(Millions of yen)
Income
Total for reportable segments 47,950 Intersegment transactions (3) Corporate expenses* (5,318) Operating income (loss) on consolidated financial statements
42,628
*Note: Corporate expenses mainly comprise general and administrative expenses not attributed to reportable segments.
(Millions of yen)
Assets
Total for reportable segments 1,337,780 Corporate assets shared by all segments* 141,028 Intersegment transactions etc. (124,531) Total assets on consolidated financial statements
1,354,278
*Note: Corporate assets shared by all segments mainly comprise fixed assets not attributed to reportable segments.
(Millions of yen)
Other items Total for reportable segments Adjustments*
Amounts reported on the consolidated financial
statements Depreciation/amortization 48,047 2,228 50,276 Increase in property, plant
and equipment and intangibles
49,591 5,743 55,334
*Note: Adjustments are mainly due to fixed assets not attributed to reportable segments
Fiscal year ended March 31, 2012 (April 1, 2011 – March 31, 2012) (1) Overview of reportable segments
The Company’s reportable segments are components of the company about which separate
financial information is available. These segments are subject to periodic reviews by the
Company’s board of directors to decide how to allocate resources and assess performance. The
Company’s operations are divided into internal companies based on product categories. Certain
authority is delegated to each of the internal companies, based on which they conduct businesses
in Japan and overseas. The Company’s operations are therefore segmented based on each internal
company’s product categories. The Company’s eight reportable segments are the Ship & Offshore
Structure segment, the Rolling Stock segment, the Aerospace segment, the Gas Turbine &
Machinery segment, the Plant & Infrastructure segment, the Motorcycle & Engine segment, the
Precision Machinery segment, and the Other segment.
25
Main segment businesses are listed below.
Industry segment Major products Ship & Offshore Structure Construction and sale of ships and other vessels, etc.
Rolling Stock Production and sale of rolling stock, snow plows, etc. Aerospace Production and sale of aircraft, etc. Gas Turbines & Machinery
Production and sale of jet engines, industrial gas turbines, prime movers, etc.
Plant & Infrastructure Production and sale of industrial equipment, boilers, environmental equipment, steel structures, crushers, etc.
Motorcycle & Engine Production and sale of motorcycles, all-terrain vehicles (ATV), utility vehicles, personal watercraft (“JET SKI”), general-purpose gasoline engines, etc.
Precision Machinery Production and sale of industrial hydraulic products, industrial robots, etc.
Other Production and sale of construction machinery, commercial activities, sales/order agency and intermediary activities, administration of welfare facilities, etc.
(2) Calculation methods for sales, income (loss), assets, liabilities and other items by reportable segment
Accounting methods applied for calculation of sales, income (loss), assets, liabilities, and other
items by industry segment largely correspond to information presented under “(6) Basis of
preparation of financial statements”. Segment income is based on operating income. Intersegment
sales or transfers are based on market prices. (3) Sales, income (loss), assets, liabilities, and other items by reportable segment
(Millions of yen) Sales Other items
External sales Intersegment
sales or transfer
Total
Segment income (loss)
Segment assets Depreciation/
amortization
Loss on impairment
of fixed assets
Investment in equity- method affiliates
Increase in property, plant and equipment and intangibles
(4) Reconciliation and main components of difference between total for reportable segments and
amounts on the consolidated financial statements (Millions of yen)
Sales
Total for reportable segments 1,393,513 Intersegment transactions (89,734) Net sales reported on the consolidated financial statements
1,303,778
(Millions of yen)
Income
Total for reportable segments 66,327 Intersegment transactions (131) Corporate expenses* (8,711) Operating income (loss) on consolidated financial statements
57,484
*Note: Corporate expenses mainly comprise general and administrative expenses not attributed to reportable segments.
(Millions of yen)
Assets
Total for reportable segments 1,404,790 Corporate assets shared by all segments* 112,985 Intersegment transactions etc. (155,636) Total assets on consolidated financial statements
1,362,139
*Note: Corporate assets shared by all segments mainly comprise fixed assets not attributed to reportable segments.
(Millions of yen)
Other items Total for reportable segments Adjustments*
Amounts reported on the consolidated
financial statements Depreciation/amortization 45,865 3,035 48,901 Increase in property, plant
and equipment and intangibles
56,733 7,185 63,919
*Note: Adjustments are mainly due to fixed assets not attributed to reportable segments 2. Related information
Fiscal year ended March 31, 2011 (April 1, 2010 – March 31, 2011)
(1) Information by product and service
Information by product and service is omitted here as segmentation is equivalent to that used for reportable segments.
(2) Information by geographic area
(a) Net sales (Millions of yen)
Japan USA Europe Asia Other areas Total 558,126 236,572 87,162 224,685 120,402 1,226,949
27
(b) Property, plant and equipment
(Millions of yen) Japan North America Europe Asia Other areas Total 241,132 20,611 2,304 10,945 785 275,780
(3) Information by major clients
(Millions of yen) Clients Net sales Related segments
Ministry of Defense 182,633 Ship & Offshore Structure, Aerospace, Gas Turbines & Machinery
Fiscal year ended March 31, 2012 (April 1, 2011 – March 31, 2012)
(1) Information by product and service
Information by product and service is omitted here as segmentation is equivalent to that used for reportable segments.
(2) Information by geographic area
(a) Net sales (Millions of yen)
Japan USA Europe Asia Other areas Total 567,044 237,941 123,317 239,627 135,847 1,303,778
(b) Property, plant and equipment
(Millions of yen) Japan North America Europe Asia Other areas Total 238,733 19,450 2,104 13,610 852 274,750
(3) Information by major clients
(Millions of yen) Clients Net sales Related segments
Ministry of Defense 179,786 Ship & Offshore Structure, Aerospace, Gas Turbines & Machinery
3. Impairment loss on fixed assets by reportable segment
Fiscal year ended March 31, 2011 (April 1, 2010 – March 31, 2011) Information is omitted here as it is equivalent to that stated in “1. Segment information”.
Fiscal year ended March 31, 2012 (April 1, 2011 – March 31, 2012)
Information is omitted here as it is equivalent to that stated in “1. Segment information”. 4. Amortization amount for and unamortized balance of goodwill
Fiscal year ended March 31, 2011 (April 1, 2010 – March 31, 2011) Information is omitted here as it is not of material importance.
Fiscal year ended March 31, 2012 (April 1, 2011 – March 31, 2012)
Information is omitted here as it is not of material importance.
28
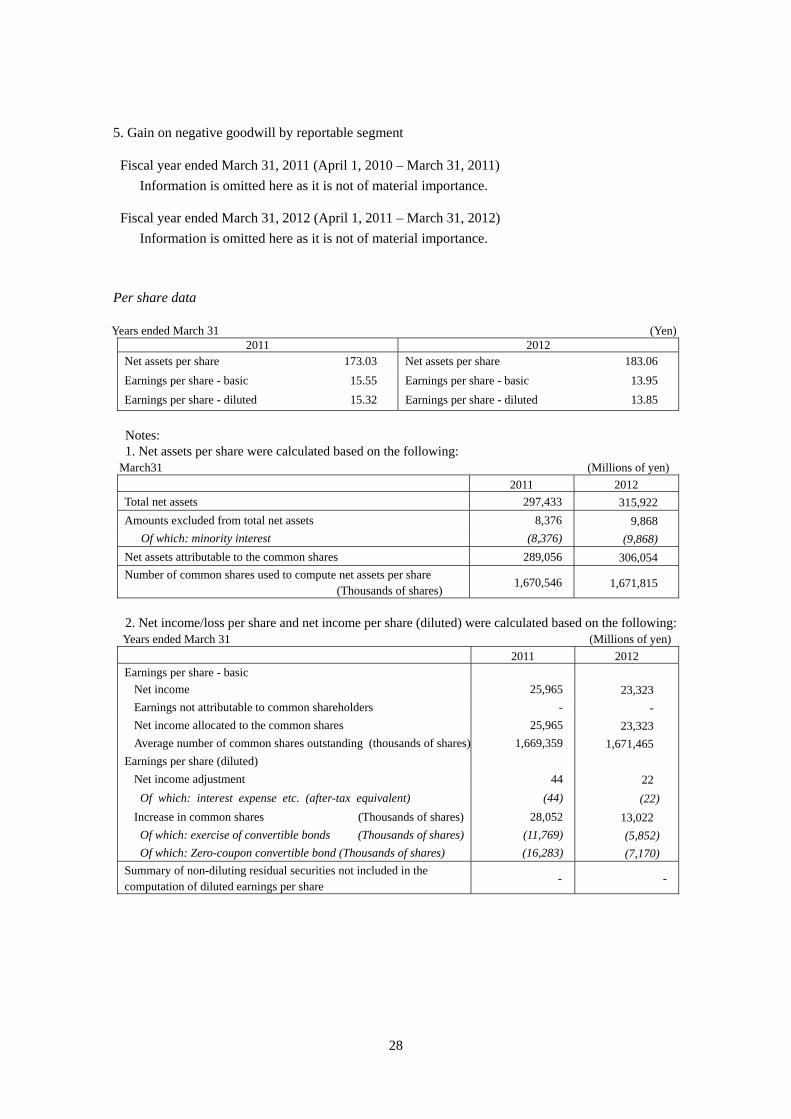
5. Gain on negative goodwill by reportable segment
Fiscal year ended March 31, 2011 (April 1, 2010 – March 31, 2011) Information is omitted here as it is not of material importance.
Fiscal year ended March 31, 2012 (April 1, 2011 – March 31, 2012)
Information is omitted here as it is not of material importance.
Per share data Years ended March 31 (Yen)
2011 2012 Net assets per share 173.03 Net assets per share 183.06 Earnings per share - basic 15.55 Earnings per share - basic 13.95 Earnings per share - diluted 15.32 Earnings per share - diluted 13.85
Notes: 1. Net assets per share were calculated based on the following:
March31 (Millions of yen) 2011 2012
Total net assets 297,433 315,922 Amounts excluded from total net assets 8,376 9,868
Of which: minority interest (8,376) (9,868) Net assets attributable to the common shares 289,056 306,054 Number of common shares used to compute net assets per share (Thousands of shares)
1,670,546 1,671,815
2. Net income/loss per share and net income per share (diluted) were calculated based on the following: Years ended March 31 (Millions of yen)
2011 2012 Earnings per share - basic
Net income 25,965 23,323 Earnings not attributable to common shareholders - - Net income allocated to the common shares 25,965 23,323 Average number of common shares outstanding (thousands of shares) 1,669,359 1,671,465
Earnings per share (diluted) Net income adjustment 44 22 Of which: interest expense etc. (after-tax equivalent) (44) (22) Increase in common shares (Thousands of shares) 28,052 13,022 Of which: exercise of convertible bonds (Thousands of shares) (11,769) (5,852) Of which: Zero-coupon convertible bond (Thousands of shares) (16,283) (7,170)
Summary of non-diluting residual securities not included in the computation of diluted earnings per share
- -
29
Material subsequent events
Fiscal year ended March 31, 2012 (April 1, 2012 – March 31, 2013)
Investment in Chinese shipbuilding company The Company resolved to acquire a stake in Dalian COSCO Shipbuilding Industry Co., Ltd. (DACOS), a shipbuilding company based in Dalian, China, and completed payment for this acquisition on April 12, 2012. 1. Purpose DACOS is a joint venture company established in the Lushun Economic Development Zone in Dalian. It was co-founded in 2007 by COSCO Shipbuilding Industry Company (COSIC)—a wholly owned subsidiary of the COSCO Group, which is one of the largest shipping companies in the world—and Nantong COSCO KHI Ship Engineering Co., Ltd. (NACKS), a 50-50 joint venture operated by the Company and COSIC. DACOS is 70% owned by COSIC and 30% by NACKS. DACOS owns a 1.8 million m2 shipyard complete with two building docks, and the ships built by DACOS have earned high marks from ship owners both in terms of timely delivery and quality. Through this transaction, the Company acquired a 34% stake in DACOS from COSIC, which has been searching for a new partner with more advanced shipbuilding technology to make DACOS more competitive and further expand its operations. After the share transfer, DACOS is 36% owned by COSIC, 34% by the Company and 30% by NACKS. By becoming a direct investor in DACOS, the Company will aim to build a stronger cooperative relationship based on the successes of NACKS, its first joint venture with COSIC. The Company will also work toward enhancing DACOS’ capacity to develop, design and build ships, while improving its production and management system, to lay a firm foundation for DACOS’ long-term growth. 2. Overview of Dalian COSCO Shipbuilding Industry Co., Ltd. (DACOS)
(1) Location: No. 1 Shunda Street, Lushun Economic Development Zone, Dalian, Liaoning, China
(2) Representative: Xu Kai (Chairman and COSIC General Manager) (3) Foundation date: July 18, 2007 (4) Operation: Design, manufacture, sales and maintenance of ships (5) Capital: 2,620 million yuan (6) Investment amount: 1,165 million yuan (7) Ownership after the
investment: COSCO Shipbuilding Industry Company (COSIC) 36% Kawasaki Heavy Industries, Ltd. 34% Nantong COSCO KHI Ship Engineering Co., Ltd. (NACKS) 30% *NACKS is a 50-50 joint venture co-founded by COSIC and the Company.
30
5. Others
(1) Corporate officer changes Refer to the Company’s press release on January 31, 2012, titled “Directors and Executive
Officers to Change.”
(2) Consolidated orders and sales
Orders received
Years ended March 31 (Millions of yen) 2011(A) 2012(B) Change(B-A)
Total 1,270,652 100.0 1,311,878 100.0 41,225 3.2 Note: The Motorcycle & Engine segment’s orders received are equal to its net sales as production is based mainly
on estimated demand.
Net sales
Years ended March 31 (Millions of yen) 2011(A) 2012(B) Change(B-A)
Total 1,495,349 100.0 1,494,116 100.0 (1,232) (0.0)
31
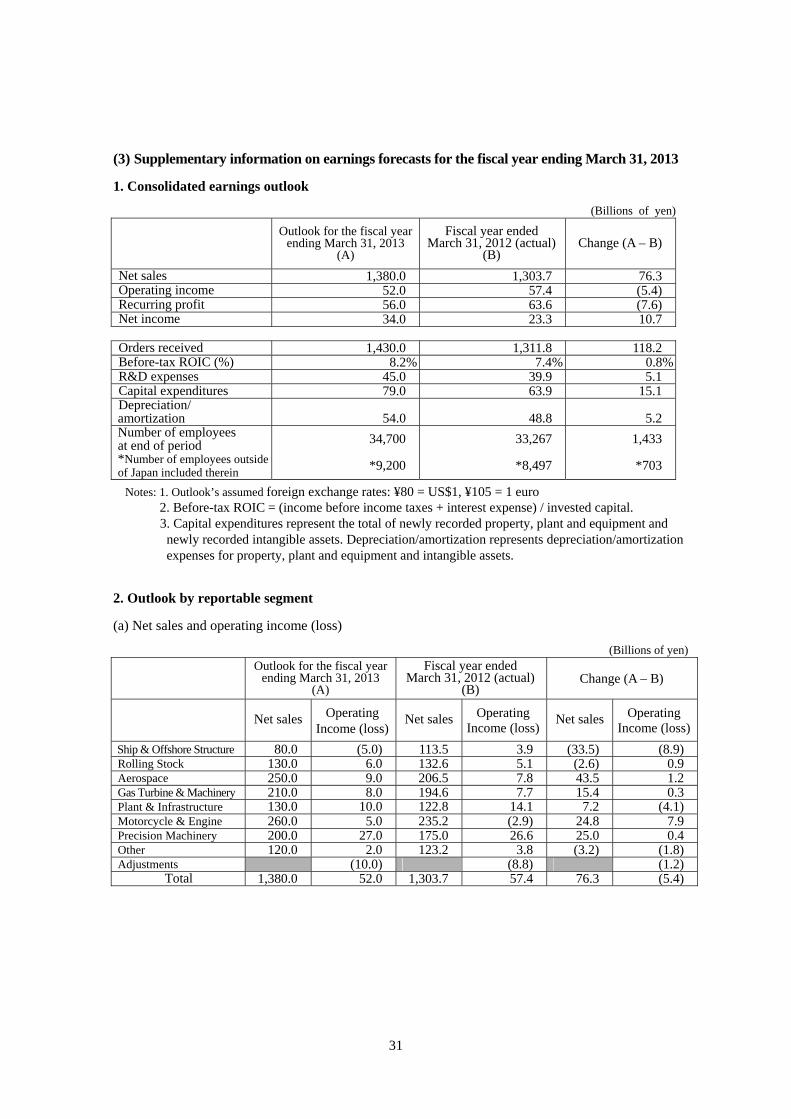
(3) Supplementary information on earnings forecasts for the fiscal year ending March 31, 2013
1. Consolidated earnings outlook
(Billions of yen) Outlook for the fiscal year
ending March 31, 2013 (A)
Fiscal year ended March 31, 2012 (actual)
(B) Change (A – B)
Net sales 1,380.0 1,303.7 76.3 Operating income 52.0 57.4 (5.4) Recurring profit 56.0 63.6 (7.6) Net income 34.0 23.3 10.7 Orders received 1,430.0 1,311.8 118.2 Before-tax ROIC (%) 8.2% 7.4% 0.8%R&D expenses 45.0 39.9 5.1 Capital expenditures 79.0 63.9 15.1 Depreciation/ amortization 54.0 48.8 5.2 Number of employees at end of period *Number of employees outside of Japan included therein
34,700
*9,200
33,267
*8,497
1,433
*703
Notes: 1. Outlook’s assumed foreign exchange rates: ¥80 = US$1, ¥105 = 1 euro 2. Before-tax ROIC = (income before income taxes + interest expense) / invested capital. 3. Capital expenditures represent the total of newly recorded property, plant and equipment and newly recorded intangible assets. Depreciation/amortization represents depreciation/amortization expenses for property, plant and equipment and intangible assets.


![Consolidated Financial Results for the Fiscal Year Ended ...Note: Comprehensive income Fiscal year ended March 31, 2019: ¥1,761 million [24.3%] Fiscal year ended March 31, 2018: ¥1,417](https://static.documents.pub/doc/80x56/5fe4d06806b4775830253106/consolidated-financial-results-for-the-fiscal-year-ended-note-comprehensive.jpg)

