56
Published in 2012 byNational University of Educational Planning and Administration(Declared by the Government of India under Section 3 of the UGC Act, 1956)
17-B, Sri Aurobindo MargNew Delhi – 110016, INDIA
&
Department of School Education and LiteracyMinistry of Human Resource DevelopmentGovernment of India
© NUEPA 2012
Design and Layout by Publication Unit, NUEPA
Printed at Bengal Offset Works335, Khajoor Road, Karol Bagh, New Delhi - 110045Phone: 011-23524200/23610455E-mail: [email protected]
Foreword
Development of a sound information system is critical for successful monitoring and implementation of any programme, particularly in social sectors. Strengthening theschool information system has, therefore, been accorded top priority from the very beginning of the Sarva Shiksha Abhiyan (SSA), as a result of which the coverageof DISE was extended to all states and districts of the country, and its scope extended to the entire elementary stage of education. I am confident that in the light ofthe recommendations of the Expert Group on Creation of Unified System of Data Collection for School Education Statistics, efforts for a unified school datacollection system across the country will soon bear print. This will help us in formulating not only plans for elementary education under SSA but also for secondaryeducation under Rashtriya Madhyamik Shiksha Abhiyan.
I am happy to note that DISE has become a regular source of information on all aspects of elementary education. NUEPA brings out annually a set of eightpublications including ‘District and State Report Cards’, web-enabled ‘Elementary Education in Rural and Urban India’, ‘DISE Flash Statistics including EducationalDevelopment Index’, and ‘Elementary Education in India: Progress towards UEE, Analytical Reports & Tables’, which data-users and researchers have found veryuseful. DISE will undoubtedly play an important role in monitoring the implementation of the Right of Children to Free and Compulsory Education Act, 2009 in yearsto come.
I congratulate all those involved in the process of strengthening the MIS for education (EMIS) through DISE across the country and for winning E-Governance andeINDIA, 2010 Awards, as also the Manthan Award, South Asia, 2010 and the EMPI-Indian Express Indian Innovation Award.
I thank NUEPA, especially Prof. R. Govinda, Vice-Chancellor, Dr. Arun C. Mehta, Professor and Head, Department of EMIS and the entire DISE team, for bringingout the present publication. I also thank UNICEF, Delhi, for consistently supporting EMIS activities at NUEPA.
New Delhi (Anshu Vaish)
ANSHU VAISHSECRETARY
va’kq oS’;lfpo
Hkkjr ljdkjekuo lalk/ku fodkl ea=ky;Ldwy f’k{kk vkSj lk{kjrk foHkkx
ubZ fnYyh & 110 001Government of India
Ministry of Human Resource DevelopmentDepartment of School Education & Literacy
124 ‘C’ Wing, Shastri Bhavan, New Delhi-110 001Tel.: 23382587, 23381104, Fax: 23387859
E-mail: [email protected]
From the Vice-Chancellor’s Desk
The country has witnessed phenomenal expansion of school education system in recent years. There are currently around 1.5 million schools in the country. Effectivemonitoring of such a vast system spread over diverse conditions that characterize different states and regions of the country demands a well organized and comprehensivedata base. NUEPA has been pursuing the goal of creating a reliable system of statistics on school education during the last two decades through the District InformationSystem for Education (DISE) which provides the basis for assessing the progress under SSA and on status of implementation of the Right to Education Act. Theimportance of this has further increased with efforts to extend the policy of universal education to cover secondary education stage of schooling also. Keeping this in viewDISE is making a concerted effort to provide a unified system of school education statistics for all levels of schooling from elementary to higher secondary education. Wehope to present such a unified system of data base for policy makers, planners, administrators, researchers and other users beginning from 2013-14.
It is, indeed, a great pleasure for me to present a summary data base on elementary education in India through present publication. Including this publication, NUEPAbrings out on annual basis 8 publications exclusively based on DISE data under the following titles: (a) DISE Flash Statistics: Elementary Education in India, Progresstowards UEE: (b) Elementary Education in India: Where Do We Stand; District & State Report Cards; (c) Analytical Report & Analytical Tables; and (d) ElementaryEducation in Rural & Urban India
DISE has been acclaimed by a number of national and international institutions as one of the most comprehensive and innovative initiative. It is gratifying to note thatDISE received the EMPI Indian-Express Indian Innovation Award for 2012. Earlier, it has received several other prestigious National Awards including e-Governance,eINDIA and Manthan Award South Asia. I take this opportunity to congratulate Prof. Arun C. Mehta and his team for their commitment and hard work in producingthe various publications and sustaining that effort over the years.
I hope that researchers, policy makers, administrators and planners will find the publication both informative and useful.
New DelhiJune, 2012 (R Govinda)
Prof. R. GovindaVice-Chancellor Telephone Off. 26515472, 26853038
Fax 91-011-26861882 E-mail [email protected] Website www.nuepa.org
Acknowledgements
For the last several years, NUEPA has been actively involved in strengthening the Educational Management Information System (EMIS) in the country. The FlashStatistics: Elementary Education in India: Progress towards UEE is based on the data received from all the States & UTs of the country for the year 2010-11. Thepublication presents not only state-specific indicators but also brings in many new dimensions of elementary education into focus. It incorporates key indicators on allaspects of universalisation of elementary education in case of all the States & UTs of the country.
The Flash Statistics: 2010-11 is based on the data received from as many as 1.36 million schools spread over 637 districts across 35 States & UTs. The study of thismagnitude cannot be completed without the active involvement and participation of the EMIS professionals at the national and sub-national levels. I am extremelythankful to all the State Project Directors, the state level EMIS coordinators and district level programmers and data entry operators for timely supply of data.
I take this opportunity to thank UNICEF, Delhi, in particular Ms Urmila Sarkar, Chief (Education) for consistently supporting EMIS activities ever since theinception of DISE and Ms Anita Kaul, Additonal Secretary and Mr P.K. Tiwari, Director, Department of School Education & Literacy, Government of India, whoplayed a crucial role in facilitating the implementation of DISE in various states.
I am thankful to Prof R Govinda, Vice-Chancellor, NUEPA, for his consistent encouragement and guidance. I take this opportunity and thank NUEPA faculty for theirsupport.
The contribution of Shri Naveen Bhatia, System Analyst, NUEPA and Shri Shalender Sharma, Chief Consultant, Technical Support Group, Ed. CIL, in databasemanagement, is gratefully acknowledged. I am thankful to Ms Shakun Sethi, Project Consultant (DISE Project) and Ms Aseela M for computing indicators that havebeen presented in the document.
I am also thankful to colleagues in the Publication Unit especially Shri Pramod Rawat, Deputy Publication Officer and Ms Sheeja Biju, Former Project PublicationOfficer (DISE Project) for timely bringing out the publication.
I hope that this publication will be of value to education planners, policy formulators and researchers. Suggestions for improvement are most welcome.
Arun C. [email protected]
CONTENTS
PAGE NO.
Foreword i i i
From the Vice-Chancellor’s Desk v
Acknowledgements vii
Disclaimer xi
School Indicators
1. Number of Districts covered under DISE 1
2. Number of Recognised Schools imparting Elementary Education 1
3. Number of Government Schools 1
4. Percentage Government Share to Total Schools 1
5. Percentage Government Schools by Type of Management 1
6. Number of Recognised Private Schools 2
7. Percentage Private Share to Total Schools 2
8. Percentage Private Schools by Type of Management 2
9. Number of Primary Schools covered under DISE 2
10. Number of Unrecognised Schools & Madarsas 2
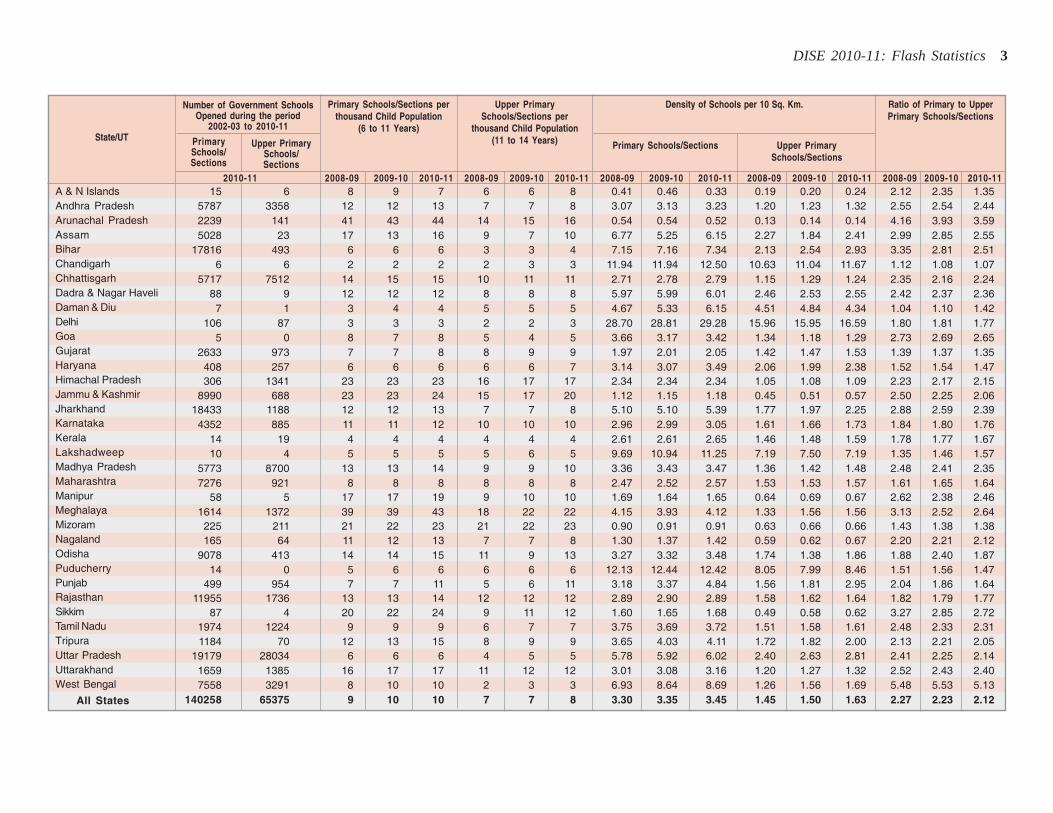
11. Number of New Government Schools Opened 3
12. Primary Schools/Sections per thousand Child Population(6 to 11 Years) 3
13. Upper Primary Schools/Sections per thousand Child Population 3
14. Density of Schools per 10 Sq. Km. 3
15. Ratio of Primary to Upper Primary Schools/Sections 3
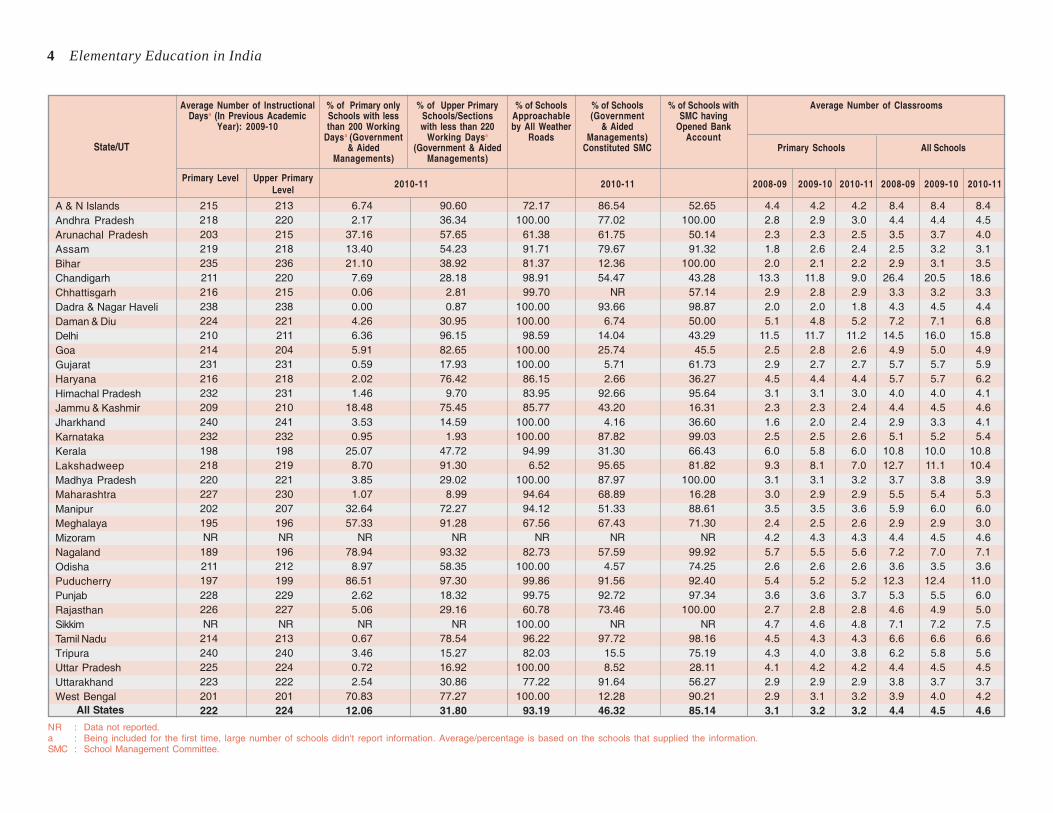
16. Average Number of Instructional Days 4
17. Percentage of Primary Only Schools with Less than 200 Working Days 4
18. Percentage of Upper Primary Schools with Less than 220 Working Days 4
19. Percentage of Schools Approachable by All Weather Roads 4
20. Percenatage of Government Aided Schools having SMC 4
21. Average Number of Classrooms 4
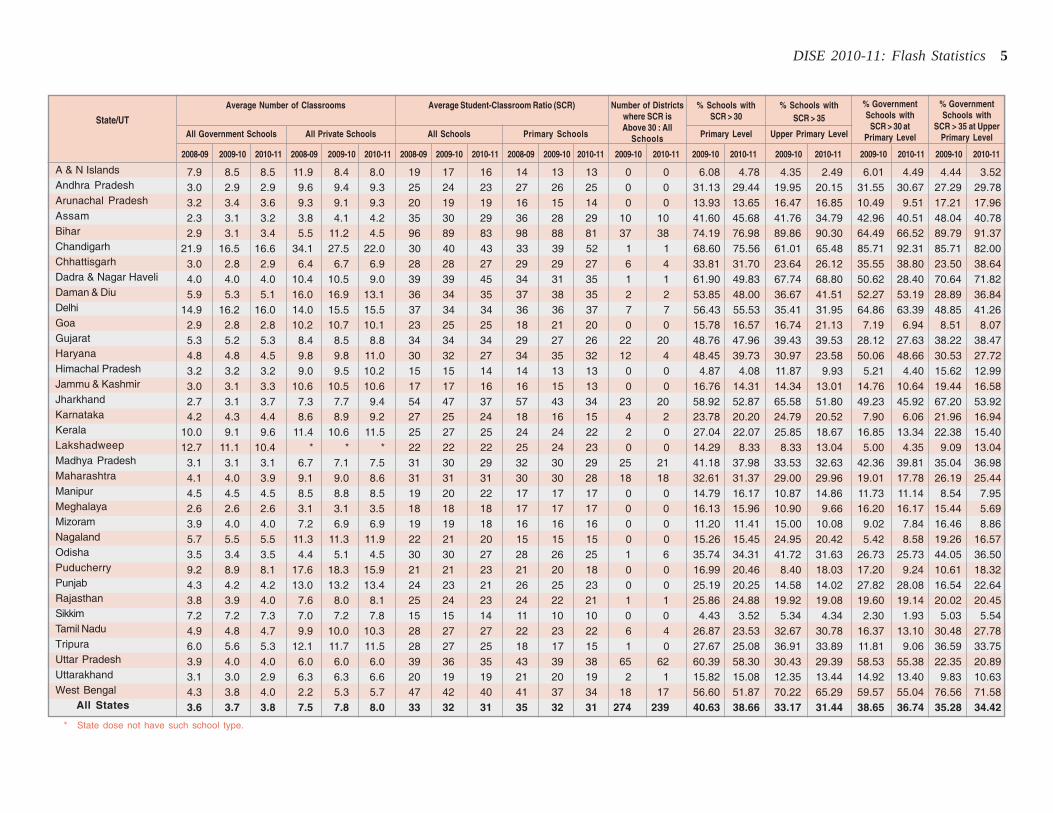
22. Average Student-Classroom Ratio 5
PAGE NO.
23. Number of Districts where Student-Classroom Ratio is above 30 5
24. Percentage of Schools with Student-Classroom Ratio above 30 : Primary Level 5
25. Percentage of Schools with SCR > 35 : Upper Primary Level 5
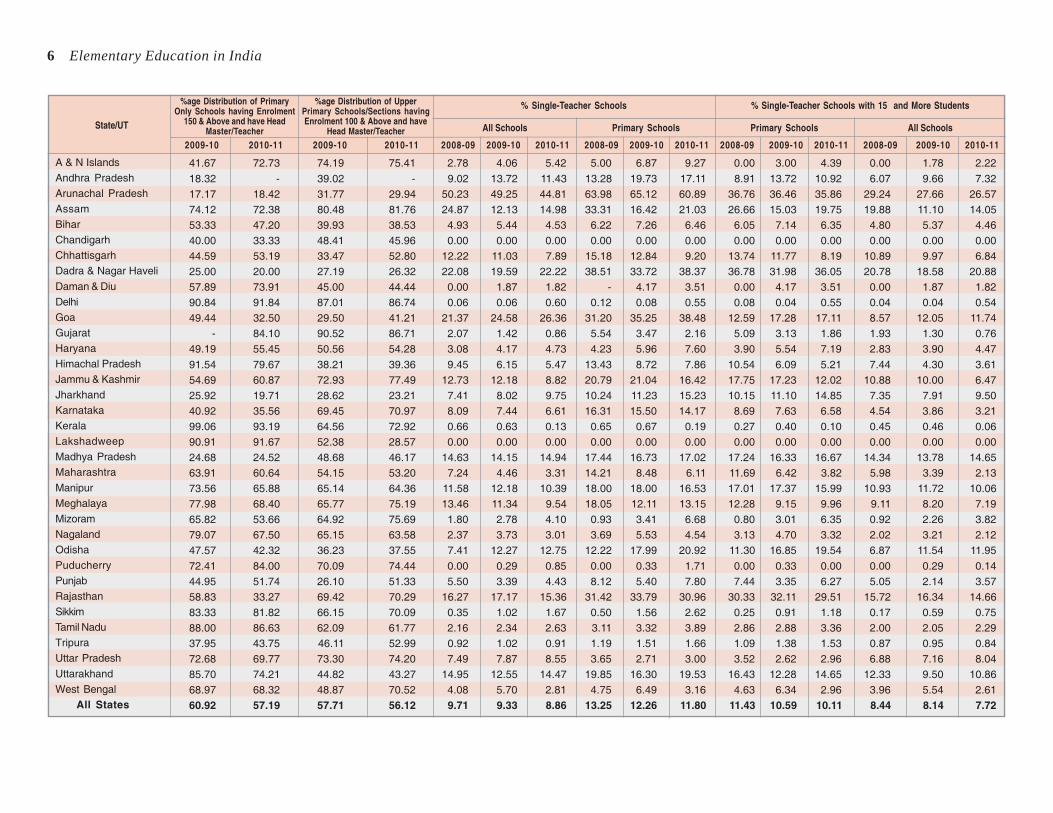
26. Percentage Distribution of Primary Only Schools having Enrolment 150& above and have Head Master/Teacher 6
27. Percentage Distribution of Upper Primary Schools/Sections havingEnrolment 100 & above and have Head Master/Teacher 6
28. Percentage of Single-Teacher Schools 6
29. Percentage of Single-Teacher Schools with 15 and more Students 6
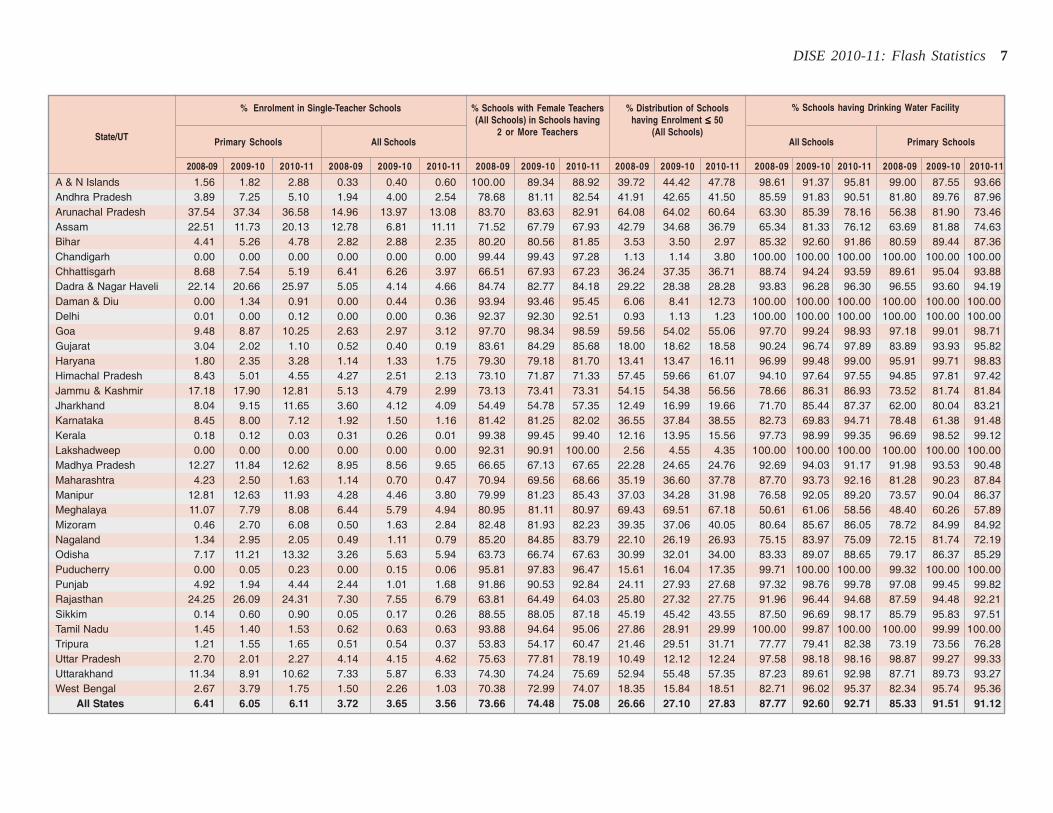
30. Percentage Enrolment in Single-Teacher Schools 7
31. Percentage of Schools with Female Teacher 7
32. Percentage Distribution of Schools having Enrolment ≤ 50 7
Facility Indicators
33. Percentage of Schools having Drinking Water Facility 7
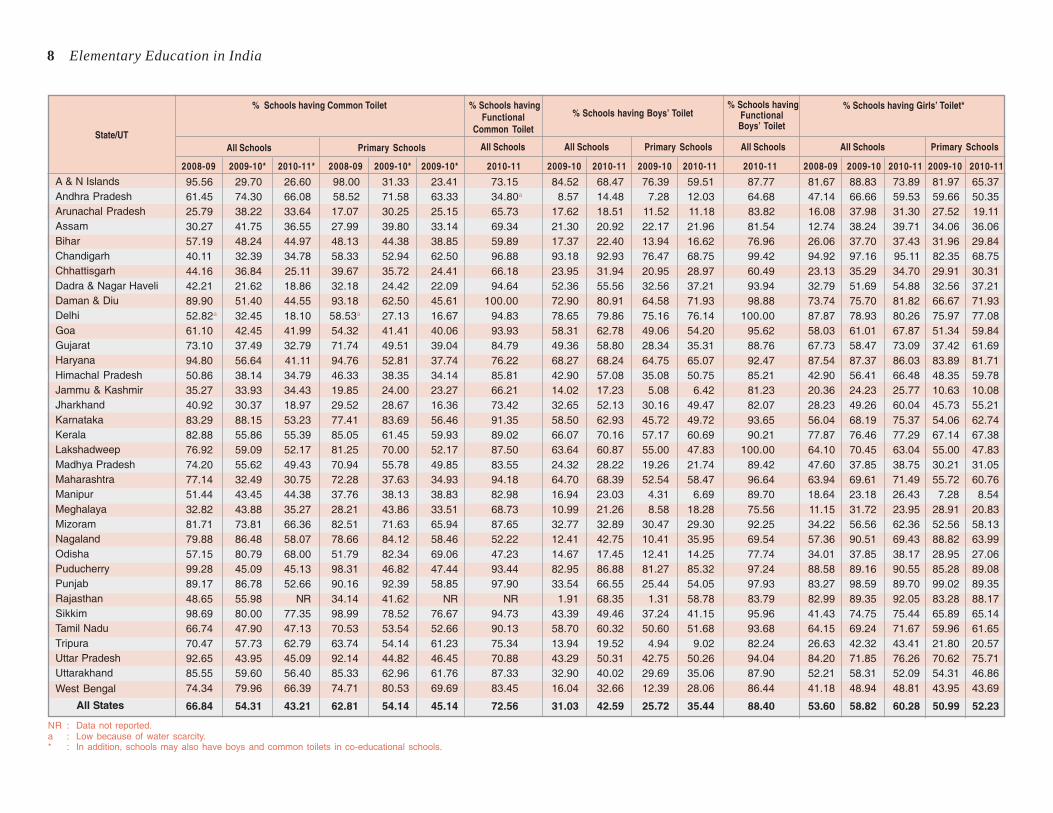
34. Percentage of Schools having Common Toilet 8
35. Percentage of Schools having Functional Common Toilet 8
36. Percentage of Schools having Boys’ Toilet 8
37. Percentage of Schools having Functional Boys’ Toilet 8
38. Percentage of Schools having Girls’ Toilet 8
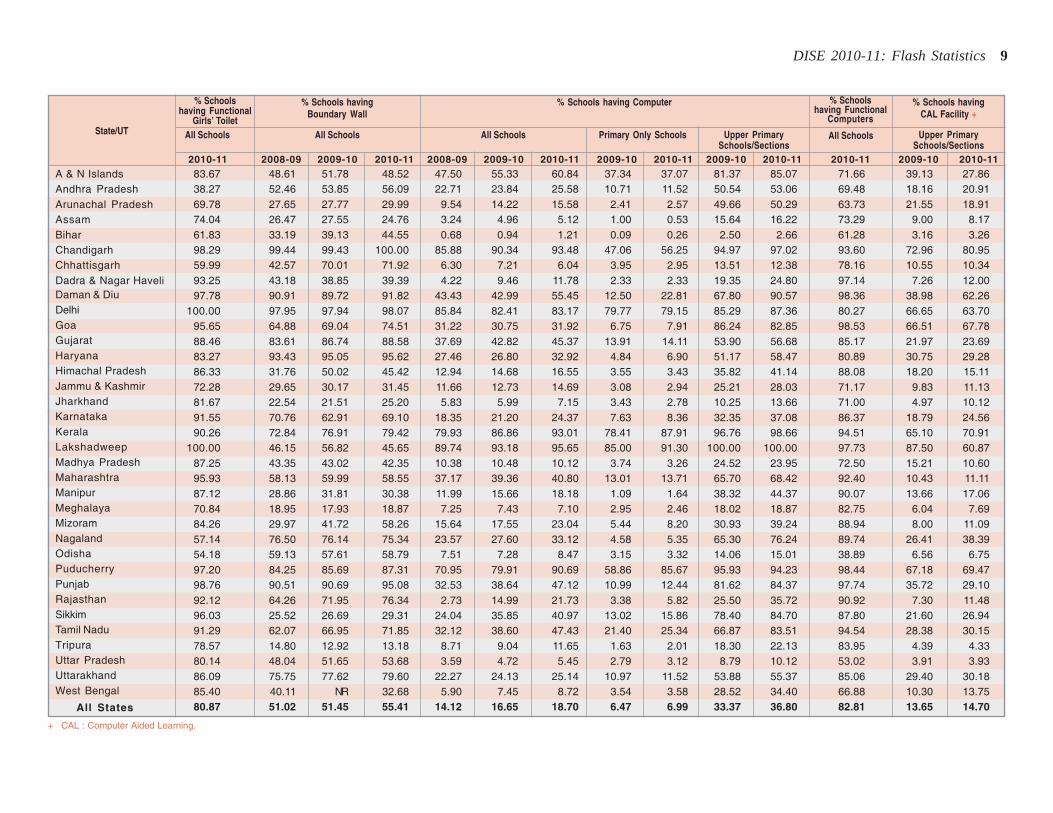
39. Percentage of Schools having Functional Girls’ Toilet 9
40. Percentage of Schools having Boundary Wall 9
41. Percentage of Schools having Computer 9
42. Percentage of Schools having Functional Computer 9
43. Percentage of Schools having CAL Facility 9
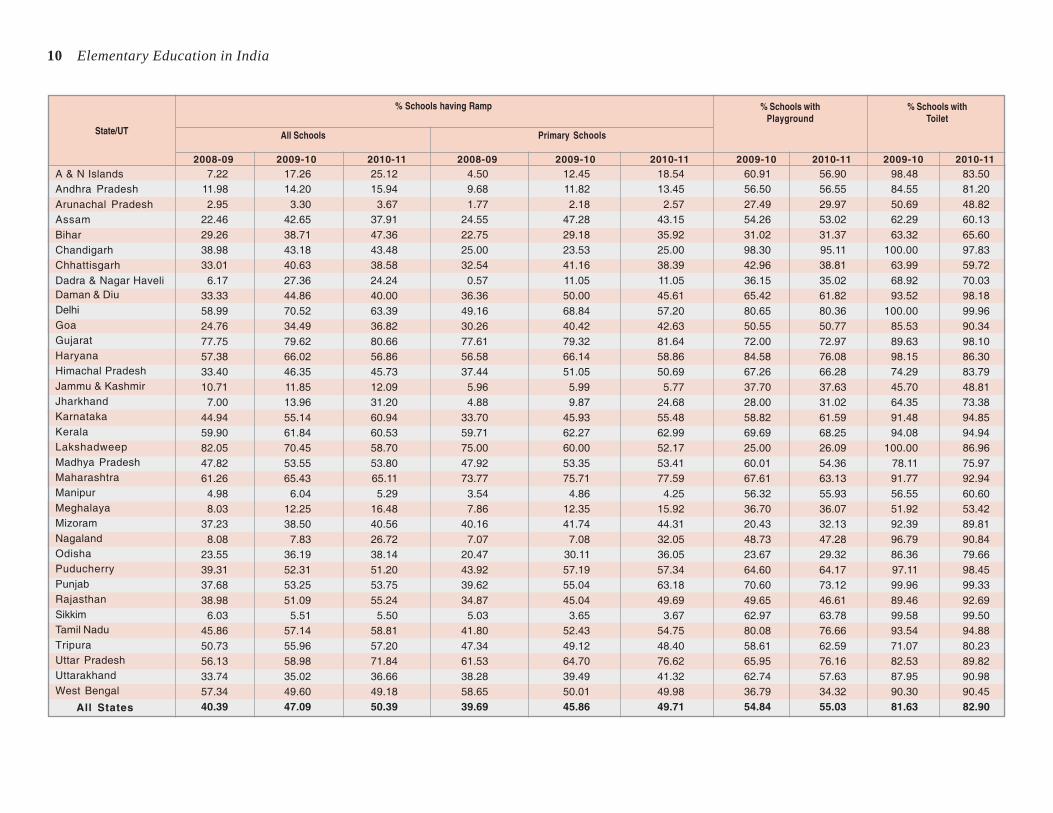
44. Percentage of Schools having Ramp 10
45. Percentage of Schools having Palyground 10
46. Percentage of Schools having Toilet 10
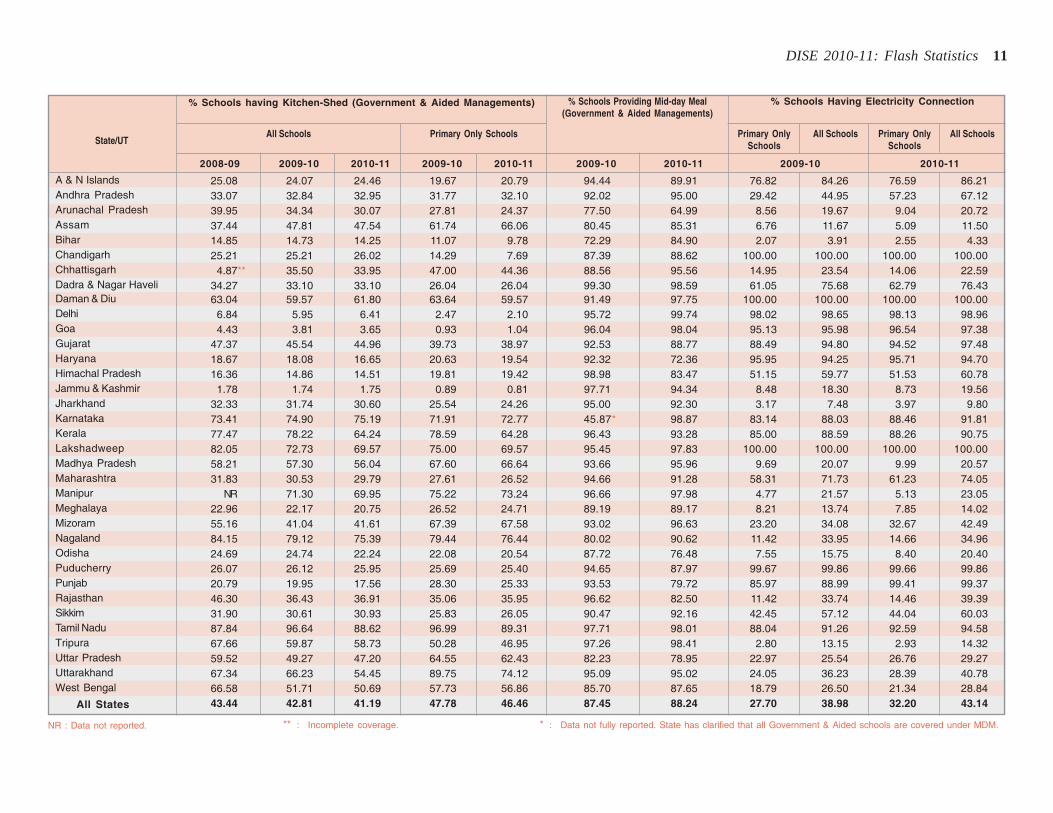
47. Percentage of Schools having Kitchen-Shed 11
PAGE NO.
48. Percentage of Schools Providing Mid-day Meal 11
49. Percentage of Schools Having Electricity Connection 11
Teachers-Related Indicators
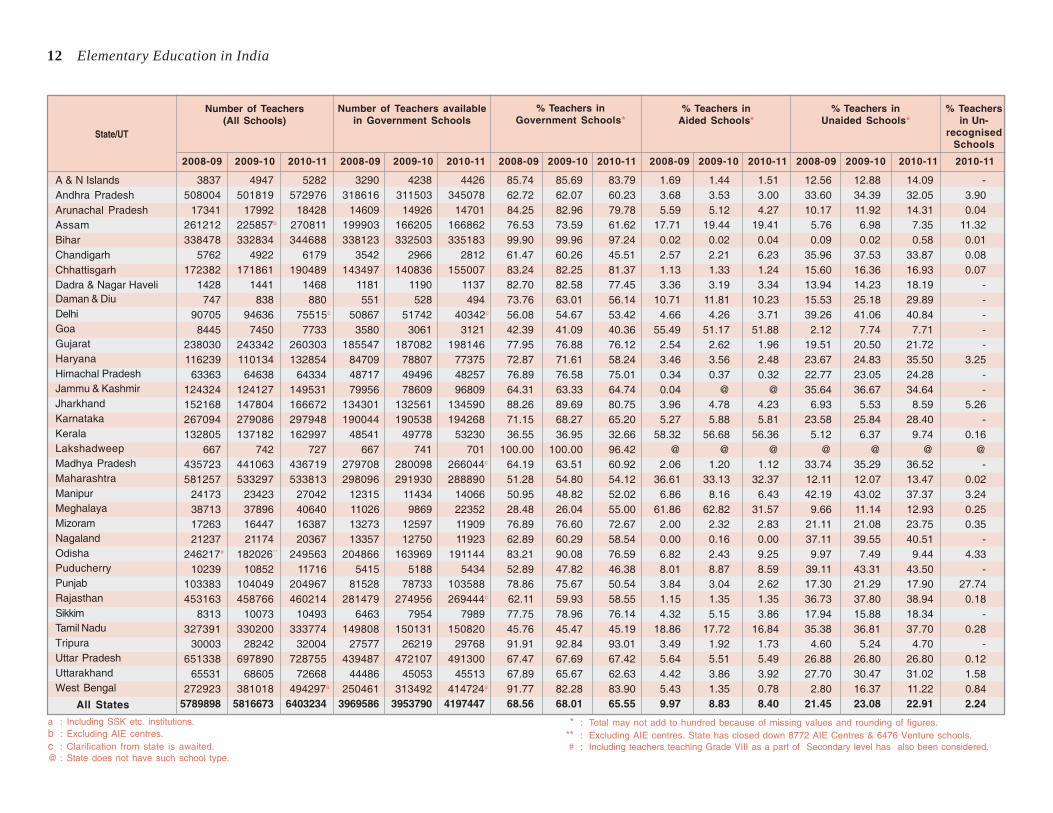
50. Number of Teachers 12
51. Number of Teachers Available in Government Schools 12
52. Percentage of Teachers in Government Schools 12
53. Percentage of Teachers in Aided Schools 12
54. Percentage of Teachers in Unaided Schools 12
55. Percentage of Teachers in Un-recognised Schools 12
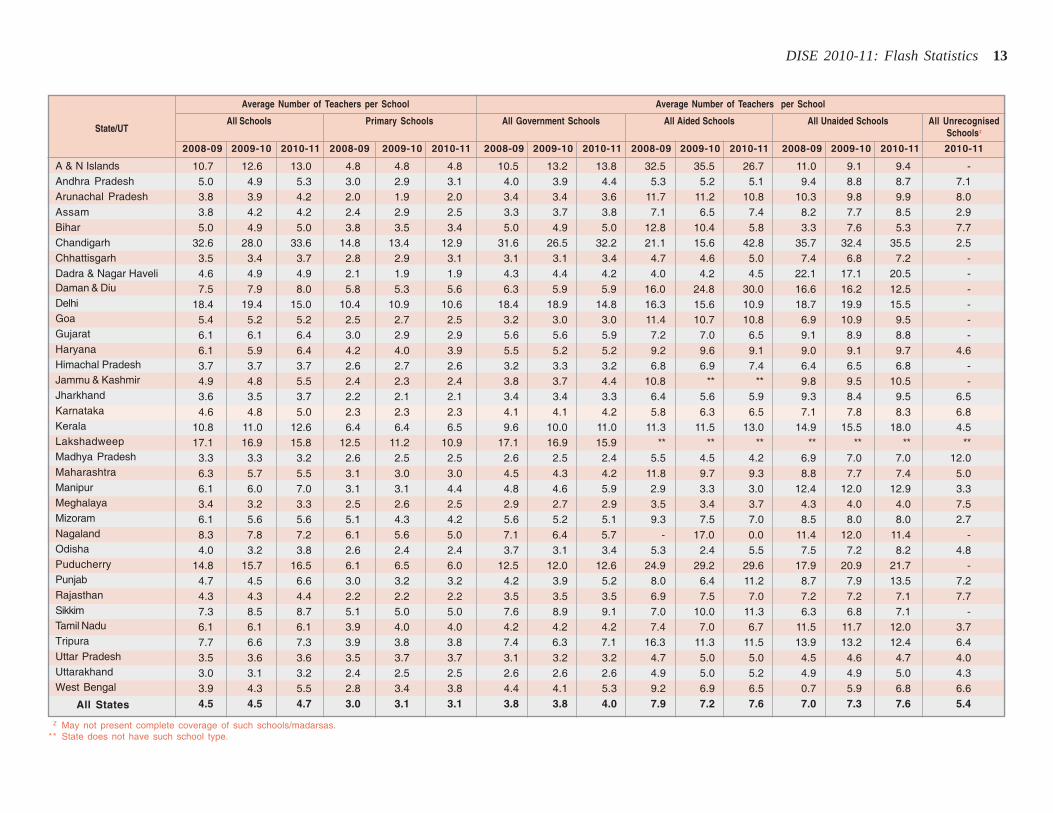
56. Average Number of Teachers per School 13
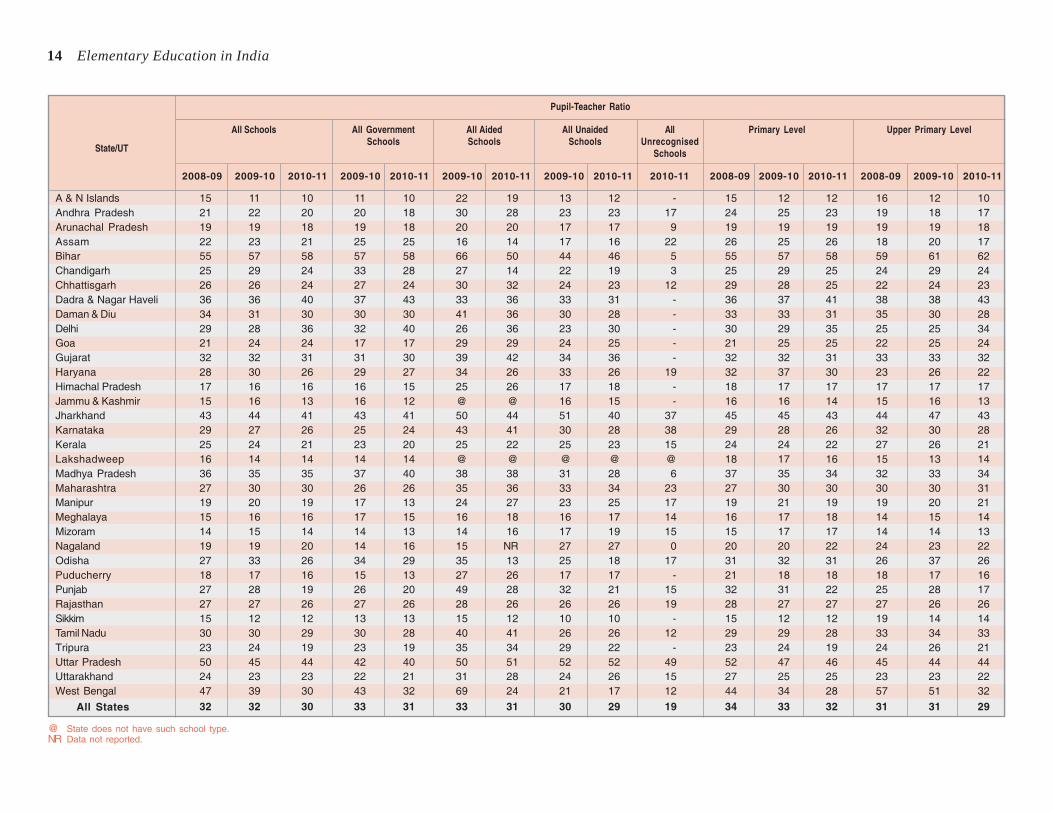
57. Pupil-Teacher Ratio (PTR) 14
58. Number of Districts where PTR is above 30 15
59. Percentage of Schools with PTR > 30 : Primary Level 15
60. Percentage of Schools with PTR > 35 : Upper Primary Level 15
61. Percentage Distribution of Female Teachers 15
62. Percentage Distribution of SC Teachers to Total Teachers 15
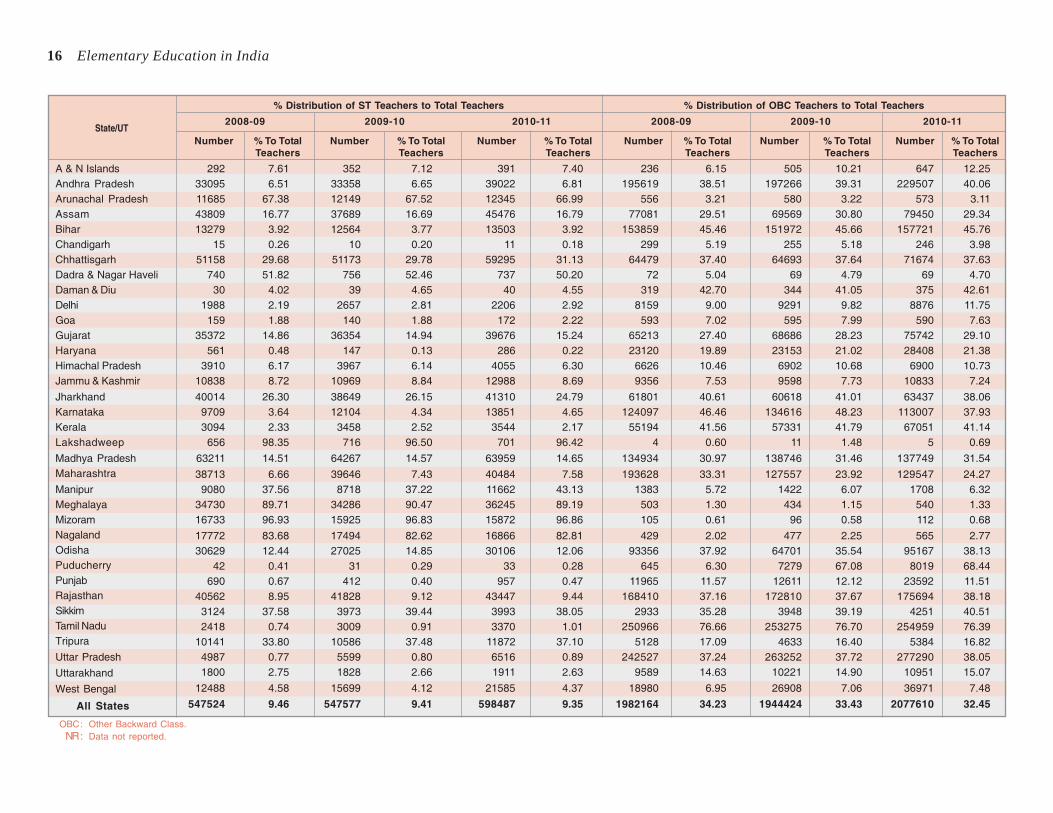
63. Percentage Distribution of ST Teachers to Total Teachers 16
64. Percentage Distribution of OBC Teachers to Total Teachers 16
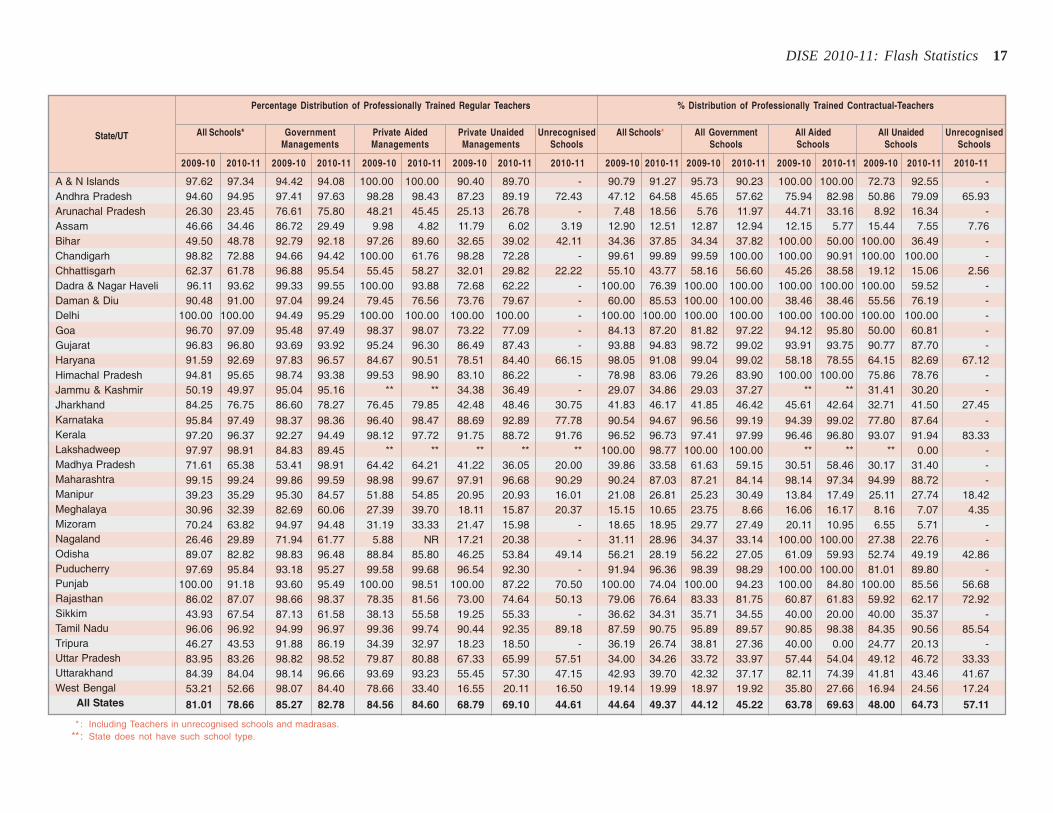
65. Percentage Distribution of Professionally Trained Regular Teachers 17
66. Percentage Distribution of Professionally Trained Contractual-Teachers 17
67. Percentage Distribution of Teachers Received In-Service Training 18
68. Percentage of Teachers Aged 55 Year & Above 18
69. Percentage Teachers Involved in Non-Teaching Assignments to Total Teachers 19
70. Percentage Distribution of Contractual-Teachers to Total Teachers 19
Enrolment-Based Indicators
71. Enrolment 20-21
72. Percentage of CWSN Enrolment to Total Enrolment in Elementary Classes 22
73. Percentage of Girls' Enrolment 22
PAGE NO.
74. Gender Parity Index 23
75. Percentage of Enrolment in Primary Schools with PTR >30 23
76. Percentage of Enrolment in Upper Primary Schools with PTR >35 23
77. Percentage Under-age Children 23
78. Percentage Over-age Children 24
79. Percentage Share of Enrolment in Pre-primary Classes to Total Enrolment inPrimary Classes 24
80. Percentage of SC Population & Enrolment 24
81. Figures 1 to 28 25-31
82. Percentage of ST Population & Enrolment 32
83. Percentage of OBC Enrolment 33
84. Percentage of Muslim Population & Enrolment 34
85. Ratio of Grade V to Grade I Enrolment 35
86. Transition Rate from Primary to Upper Primary Level 35
87. Average Repetition Rate 36
88. Average Drop-out Rate at Primary Level 36
89. Retention Rate at Primary Level 36
90. Gross Completion Rate at Primary Level 37
91. Gross Enrolment Ratio: Primary Level 37
92. Net Enrolment Ratio: Primary Level 37
93. Enrolment Ratio at Upper Primary Level 38
Educational Development Index
94. Variables used in Computing Educational Development Index 41
95. Assumptions used in Computing EDI 42
96. Educational Development Index : Primary Level 43-44
97. Educational Development Index : Upper Primary Level 45-46
98. Composite Educational Development Index 47
Disclaimer
Raw data presented in the document or used for calculating indicators are essentially basedon data provided by the States and UTs through annual data collection (as on 30th September2010) under SSA (DISE). NUEPA is committed to provide professional and software supportto all States and UTs as well as for dissemination and analysis of data as it is provided by theindividual States and UTs.
In no way, NUEPA is involved in data collection as such and therefore the accuracy andtruthfulness of the data rest with the States/UTs. The State Project Directors have certifiedthat data is free from errors and inconsistencies and hence may be merged into the nationaldatabase maintained at NUEPA, New Delhi.
DISE 2010-11: Flash Statistics 1
State/UT
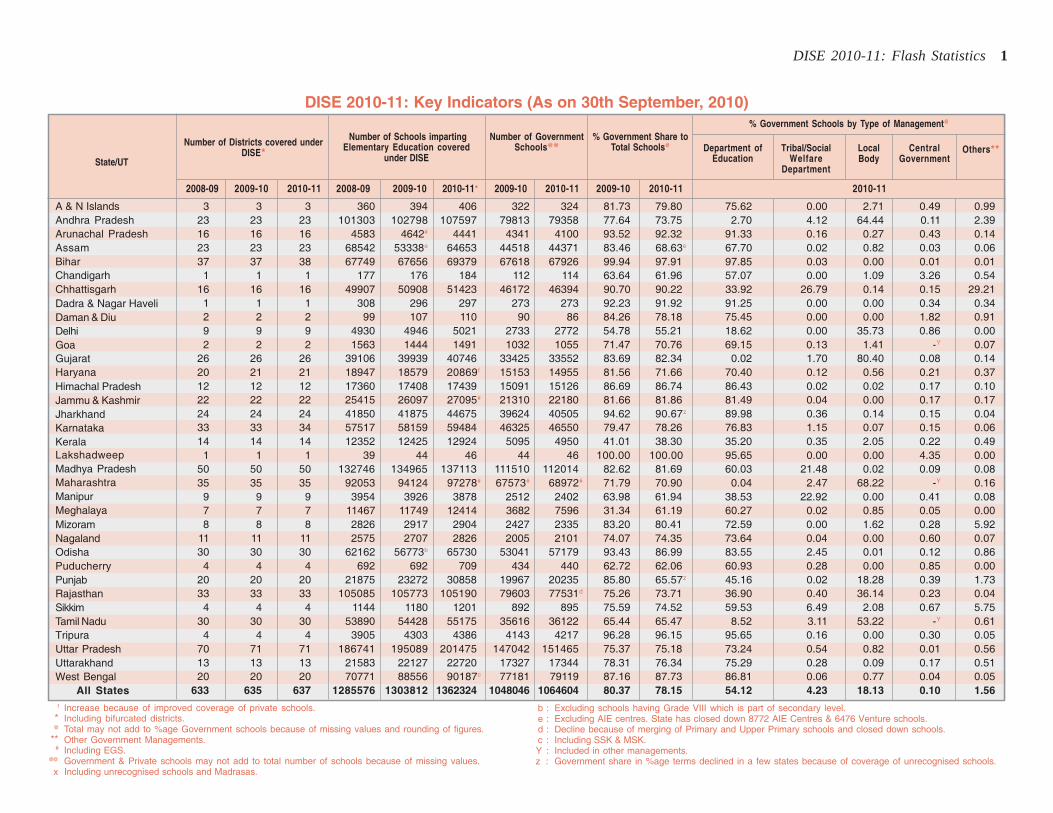
DISE 2010-11: Key Indicators (As on 30th September, 2010)
f Increase because of improved coverage of private schools.* Including bifurcated districts.@ Total may not add to %age Government schools because of missing values and rounding of figures.
** Other Government Managements.# Including EGS.
@@ Government & Private schools may not add to total number of schools because of missing values.x Including unrecognised schools and Madrasas.
A & N IslandsAndhra PradeshArunachal PradeshAssamBiharChandigarhChhattisgarhDadra & Nagar HaveliDaman & DiuDelhiGoaGujaratHaryanaHimachal PradeshJammu & KashmirJharkhandKarnatakaKeralaLakshadweepMadhya PradeshMaharashtraManipurMeghalayaMizoramNagalandOdishaPuducherryPunjabRajasthanSikkimTamil NaduTripuraUttar PradeshUttarakhandWest Bengal
All States
Number of Districts covered underDISE*
Number of GovernmentSchools@@
% Government Share toTotal Schools@
% Government Schools by Type of Management@
Others**Department ofEducation
Tribal/SocialWelfare
Department
LocalBody
2008-09 2009-10 2010-11 2008-09 2009-10 2010-11* 2009-10 2010-11 2009-10 2010-11 2010-11
3 3 3 360 394 406 322 324 81.73 79.80 75.62 0.00 2.71 0.49 0.9923 23 23 101303 102798 107597 79813 79358 77.64 73.75 2.70 4.12 64.44 0.11 2.3916 16 16 4583 4642# 4441 4341 4100 93.52 92.32 91.33 0.16 0.27 0.43 0.1423 23 23 68542 53338e 64653 44518 44371 83.46 68.63e 67.70 0.02 0.82 0.03 0.0637 37 38 67749 67656 69379 67618 67926 99.94 97.91 97.85 0.03 0.00 0.01 0.011 1 1 177 176 184 112 114 63.64 61.96 57.07 0.00 1.09 3.26 0.54
16 16 16 49907 50908 51423 46172 46394 90.70 90.22 33.92 26.79 0.14 0.15 29.211 1 1 308 296 297 273 273 92.23 91.92 91.25 0.00 0.00 0.34 0.342 2 2 99 107 110 90 86 84.26 78.18 75.45 0.00 0.00 1.82 0.919 9 9 4930 4946 5021 2733 2772 54.78 55.21 18.62 0.00 35.73 0.86 0.002 2 2 1563 1444 1491 1032 1055 71.47 70.76 69.15 0.13 1.41 -Y 0.07
26 26 26 39106 39939 40746 33425 33552 83.69 82.34 0.02 1.70 80.40 0.08 0.1420 21 21 18947 18579 20869f 15153 14955 81.56 71.66 70.40 0.12 0.56 0.21 0.3712 12 12 17360 17408 17439 15091 15126 86.69 86.74 86.43 0.02 0.02 0.17 0.1022 22 22 25415 26097 27095# 21310 22180 81.66 81.86 81.49 0.04 0.00 0.17 0.1724 24 24 41850 41875 44675 39624 40505 94.62 90.67z 89.98 0.36 0.14 0.15 0.0433 33 34 57517 58159 59484 46325 46550 79.47 78.26 76.83 1.15 0.07 0.15 0.0614 14 14 12352 12425 12924 5095 4950 41.01 38.30 35.20 0.35 2.05 0.22 0.491 1 1 39 44 46 44 46 100.00 100.00 95.65 0.00 0.00 4.35 0.00
50 50 50 132746 134965 137113 111510 112014 82.62 81.69 60.03 21.48 0.02 0.09 0.0835 35 35 92053 94124 97278# 67573# 68972# 71.79 70.90 0.04 2.47 68.22 -Y 0.169 9 9 3954 3926 3878 2512 2402 63.98 61.94 38.53 22.92 0.00 0.41 0.087 7 7 11467 11749 12414 3682 7596 31.34 61.19 60.27 0.02 0.85 0.05 0.008 8 8 2826 2917 2904 2427 2335 83.20 80.41 72.59 0.00 1.62 0.28 5.92
11 11 11 2575 2707 2826 2005 2101 74.07 74.35 73.64 0.04 0.00 0.60 0.0730 30 30 62162 56773b 65730 53041 57179 93.43 86.99 83.55 2.45 0.01 0.12 0.864 4 4 692 692 709 434 440 62.72 62.06 60.93 0.28 0.00 0.85 0.00
20 20 20 21875 23272 30858 19967 20235 85.80 65.57z 45.16 0.02 18.28 0.39 1.7333 33 33 105085 105773 105190 79603 77531d 75.26 73.71 36.90 0.40 36.14 0.23 0.044 4 4 1144 1180 1201 892 895 75.59 74.52 59.53 6.49 2.08 0.67 5.75
30 30 30 53890 54428 55175 35616 36122 65.44 65.47 8.52 3.11 53.22 -Y 0.614 4 4 3905 4303 4386 4143 4217 96.28 96.15 95.65 0.16 0.00 0.30 0.05
70 71 71 186741 195089 201475 147042 151465 75.37 75.18 73.24 0.54 0.82 0.01 0.5613 13 13 21583 22127 22720 17327 17344 78.31 76.34 75.29 0.28 0.09 0.17 0.5120 20 20 70771 88556 90187c 77181 79119 87.16 87.73 86.81 0.06 0.77 0.04 0.05
633 635 637 1285576 1303812 1362324 1048046 1064604 80.37 78.15 54.12 4.23 18.13 0.10 1.56
b : Excluding schools having Grade VIII which is part of secondary level.e : Excluding AIE centres. State has closed down 8772 AIE Centres & 6476 Venture schools.d : Decline because of merging of Primary and Upper Primary schools and closed down schools.c : Including SSK & MSK.Y : Included in other managements.z : Government share in %age terms declined in a few states because of coverage of unrecognised schools.
Number of Schools impartingElementary Education covered
under DISECentral
Government
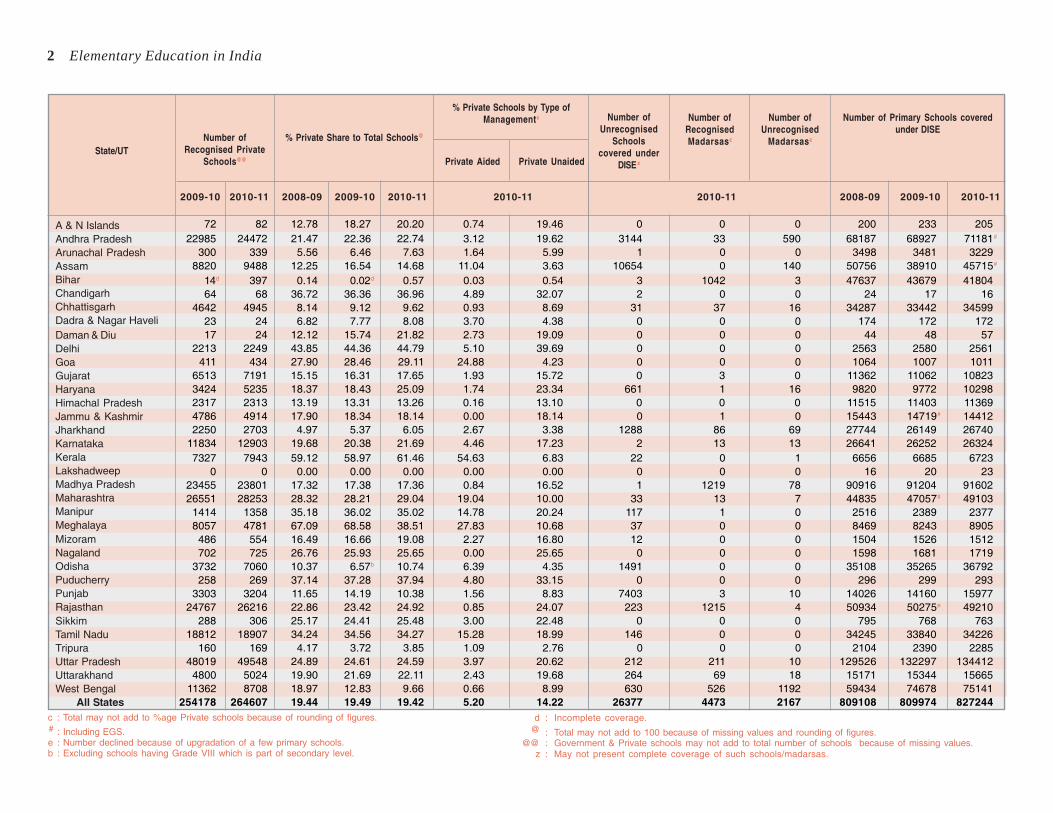
2 Elementary Education in India
State/UT
A & N IslandsAndhra PradeshArunachal PradeshAssamBiharChandigarhChhattisgarhDadra & Nagar HaveliDaman & DiuDelhiGoaGujaratHaryanaHimachal PradeshJammu & KashmirJharkhandKarnatakaKeralaLakshadweepMadhya PradeshMaharashtraManipurMeghalayaMizoramNagalandOdishaPuducherryPunjabRajasthanSikkimTamil NaduTripuraUttar PradeshUttarakhandWest Bengal
All Statesc : Total may not add to %age Private schools because of rounding of figures.# : Including EGS.e : Number declined because of upgradation of a few primary schools.b : Excluding schools having Grade VIII which is part of secondary level.
2009-10 2010-11 2008-09 2009-10 2010-11 2010-11 2010-11 2008-09 2009-10 2010-11
72 82 12.78 18.27 20.20 0.74 19.46 0 0 0 200 233 20522985 24472 21.47 22.36 22.74 3.12 19.62 3144 33 590 68187 68927 71181#
300 339 5.56 6.46 7.63 1.64 5.99 1 0 0 3498 3481 32298820 9488 12.25 16.54 14.68 11.04 3.63 10654 0 140 50756 38910 45715#
14d 397 0.14 0.02d 0.57 0.03 0.54 3 1042 3 47637 43679 4180464 68 36.72 36.36 36.96 4.89 32.07 2 0 0 24 17 16
4642 4945 8.14 9.12 9.62 0.93 8.69 31 37 16 34287 33442 3459923 24 6.82 7.77 8.08 3.70 4.38 0 0 0 174 172 17217 24 12.12 15.74 21.82 2.73 19.09 0 0 0 44 48 57
2213 2249 43.85 44.36 44.79 5.10 39.69 0 0 0 2563 2580 2561411 434 27.90 28.46 29.11 24.88 4.23 0 0 0 1064 1007 1011
6513 7191 15.15 16.31 17.65 1.93 15.72 0 3 0 11362 11062 108233424 5235 18.37 18.43 25.09 1.74 23.34 661 1 16 9820 9772 102982317 2313 13.19 13.31 13.26 0.16 13.10 0 0 0 11515 11403 113694786 4914 17.90 18.34 18.14 0.00 18.14 0 1 0 15443 14719# 144122250 2703 4.97 5.37 6.05 2.67 3.38 1288 86 69 27744 26149 26740
11834 12903 19.68 20.38 21.69 4.46 17.23 2 13 13 26641 26252 263247327 7943 59.12 58.97 61.46 54.63 6.83 22 0 1 6656 6685 6723
0 0 0.00 0.00 0.00 0.00 0.00 0 0 0 16 20 2323455 23801 17.32 17.38 17.36 0.84 16.52 1 1219 78 90916 91204 9160226551 28253 28.32 28.21 29.04 19.04 10.00 33 13 7 44835 47057# 49103
1414 1358 35.18 36.02 35.02 14.78 20.24 117 1 0 2516 2389 23778057 4781 67.09 68.58 38.51 27.83 10.68 37 0 0 8469 8243 8905486 554 16.49 16.66 19.08 2.27 16.80 12 0 0 1504 1526 1512702 725 26.76 25.93 25.65 0.00 25.65 0 0 0 1598 1681 1719
3732 7060 10.37 6.57b 10.74 6.39 4.35 1491 0 0 35108 35265 36792258 269 37.14 37.28 37.94 4.80 33.15 0 0 0 296 299 293
3303 3204 11.65 14.19 10.38 1.56 8.83 7403 3 10 14026 14160 1597724767 26216 22.86 23.42 24.92 0.85 24.07 223 1215 4 50934 50275e 49210
288 306 25.17 24.41 25.48 3.00 22.48 0 0 0 795 768 76318812 18907 34.24 34.56 34.27 15.28 18.99 146 0 0 34245 33840 34226
160 169 4.17 3.72 3.85 1.09 2.76 0 0 0 2104 2390 228548019 49548 24.89 24.61 24.59 3.97 20.62 212 211 10 129526 132297 134412
4800 5024 19.90 21.69 22.11 2.43 19.68 264 69 18 15171 15344 1566511362 8708 18.97 12.83 9.66 0.66 8.99 630 526 1192 59434 74678 75141
254178 264607 19.44 19.49 19.42 5.20 14.22 26377 4473 2167 809108 809974 827244
Number ofRecognised Private
Schools@@
% Private Share to Total Schools@
% Private Schools by Type ofManagementc
Private UnaidedPrivate Aided
Number ofRecognisedMadarsasz
Number ofUnrecognised
Madarsasz
Number of Primary Schools coveredunder DISE
Number ofUnrecognised
Schoolscovered under
DISE z
d : Incomplete coverage.@ : Total may not add to 100 because of missing values and rounding of figures.
@@ : Government & Private schools may not add to total number of schools because of missing values.z : May not present complete coverage of such schools/madarsas.
DISE 2010-11: Flash Statistics 3
State/UT
Density of Schools per 10 Sq. Km.
2010-11 2008-09 2009-10 2010-11 2008-09 2009-10 2010-11 2008-09 2009-10 2010-11 2008-09 2009-10 2010-11 2008-09 2009-10 2010-11A & N IslandsAndhra PradeshArunachal PradeshAssamBiharChandigarhChhattisgarhDadra & Nagar HaveliDaman & DiuDelhiGoaGujaratHaryanaHimachal PradeshJammu & KashmirJharkhandKarnatakaKeralaLakshadweepMadhya PradeshMaharashtraManipurMeghalayaMizoramNagalandOdishaPuducherryPunjabRajasthanSikkimTamil NaduTripuraUttar PradeshUttarakhandWest Bengal
All States
Number of Government SchoolsOpened during the period
2002-03 to 2010-11
PrimarySchools/Sections
Upper PrimarySchools/Sections
Primary Schools/Sections perthousand Child Population
(6 to 11 Years)
Upper PrimarySchools/Sections per
thousand Child Population(11 to 14 Years) Primary Schools/Sections Upper Primary
Schools/Sections
Ratio of Primary to UpperPrimary Schools/Sections
15 6 8 9 7 6 6 8 0.41 0.46 0.33 0.19 0.20 0.24 2.12 2.35 1.355787 3358 12 12 13 7 7 8 3.07 3.13 3.23 1.20 1.23 1.32 2.55 2.54 2.442239 141 41 43 44 14 15 16 0.54 0.54 0.52 0.13 0.14 0.14 4.16 3.93 3.595028 23 17 13 16 9 7 10 6.77 5.25 6.15 2.27 1.84 2.41 2.99 2.85 2.55
17816 493 6 6 6 3 3 4 7.15 7.16 7.34 2.13 2.54 2.93 3.35 2.81 2.516 6 2 2 2 2 3 3 11.94 11.94 12.50 10.63 11.04 11.67 1.12 1.08 1.07
5717 7512 14 15 15 10 11 11 2.71 2.78 2.79 1.15 1.29 1.24 2.35 2.16 2.2488 9 12 12 12 8 8 8 5.97 5.99 6.01 2.46 2.53 2.55 2.42 2.37 2.367 1 3 4 4 5 5 5 4.67 5.33 6.15 4.51 4.84 4.34 1.04 1.10 1.42
106 87 3 3 3 2 2 3 28.70 28.81 29.28 15.96 15.95 16.59 1.80 1.81 1.775 0 8 7 8 5 4 5 3.66 3.17 3.42 1.34 1.18 1.29 2.73 2.69 2.65
2633 973 7 7 8 8 9 9 1.97 2.01 2.05 1.42 1.47 1.53 1.39 1.37 1.35408 257 6 6 6 6 6 7 3.14 3.07 3.49 2.06 1.99 2.38 1.52 1.54 1.47306 1341 23 23 23 16 17 17 2.34 2.34 2.34 1.05 1.08 1.09 2.23 2.17 2.15
8990 688 23 23 24 15 17 20 1.12 1.15 1.18 0.45 0.51 0.57 2.50 2.25 2.0618433 1188 12 12 13 7 7 8 5.10 5.10 5.39 1.77 1.97 2.25 2.88 2.59 2.39
4352 885 11 11 12 10 10 10 2.96 2.99 3.05 1.61 1.66 1.73 1.84 1.80 1.7614 19 4 4 4 4 4 4 2.61 2.61 2.65 1.46 1.48 1.59 1.78 1.77 1.6710 4 5 5 5 5 6 5 9.69 10.94 11.25 7.19 7.50 7.19 1.35 1.46 1.57
5773 8700 13 13 14 9 9 10 3.36 3.43 3.47 1.36 1.42 1.48 2.48 2.41 2.357276 921 8 8 8 8 8 8 2.47 2.52 2.57 1.53 1.53 1.57 1.61 1.65 1.64
58 5 17 17 19 9 10 10 1.69 1.64 1.65 0.64 0.69 0.67 2.62 2.38 2.461614 1372 39 39 43 18 22 22 4.15 3.93 4.12 1.33 1.56 1.56 3.13 2.52 2.64225 211 21 22 23 21 22 23 0.90 0.91 0.91 0.63 0.66 0.66 1.43 1.38 1.38165 64 11 12 13 7 7 8 1.30 1.37 1.42 0.59 0.62 0.67 2.20 2.21 2.12
9078 413 14 14 15 11 9 13 3.27 3.32 3.48 1.74 1.38 1.86 1.88 2.40 1.8714 0 5 6 6 6 6 6 12.13 12.44 12.42 8.05 7.99 8.46 1.51 1.56 1.47
499 954 7 7 11 5 6 11 3.18 3.37 4.84 1.56 1.81 2.95 2.04 1.86 1.6411955 1736 13 13 14 12 12 12 2.89 2.90 2.89 1.58 1.62 1.64 1.82 1.79 1.77
87 4 20 22 24 9 11 12 1.60 1.65 1.68 0.49 0.58 0.62 3.27 2.85 2.721974 1224 9 9 9 6 7 7 3.75 3.69 3.72 1.51 1.58 1.61 2.48 2.33 2.311184 70 12 13 15 8 9 9 3.65 4.03 4.11 1.72 1.82 2.00 2.13 2.21 2.05
19179 28034 6 6 6 4 5 5 5.78 5.92 6.02 2.40 2.63 2.81 2.41 2.25 2.141659 1385 16 17 17 11 12 12 3.01 3.08 3.16 1.20 1.27 1.32 2.52 2.43 2.407558 3291 8 10 10 2 3 3 6.93 8.64 8.69 1.26 1.56 1.69 5.48 5.53 5.13
140258 65375 9 10 10 7 7 8 3.30 3.35 3.45 1.45 1.50 1.63 2.27 2.23 2.12
4 Elementary Education in India
State/UT
A & N IslandsAndhra PradeshArunachal PradeshAssamBiharChandigarhChhattisgarhDadra & Nagar HaveliDaman & DiuDelhiGoaGujaratHaryanaHimachal PradeshJammu & KashmirJharkhandKarnatakaKeralaLakshadweepMadhya PradeshMaharashtraManipurMeghalayaMizoramNagalandOdishaPuducherryPunjabRajasthanSikkimTamil NaduTripuraUttar PradeshUttarakhandWest Bengal
All States
215 213 6.74 90.60 72.17 86.54 52.65 4.4 4.2 4.2 8.4 8.4 8.4218 220 2.17 36.34 100.00 77.02 100.00 2.8 2.9 3.0 4.4 4.4 4.5203 215 37.16 57.65 61.38 61.75 50.14 2.3 2.3 2.5 3.5 3.7 4.0219 218 13.40 54.23 91.71 79.67 91.32 1.8 2.6 2.4 2.5 3.2 3.1235 236 21.10 38.92 81.37 12.36 100.00 2.0 2.1 2.2 2.9 3.1 3.5211 220 7.69 28.18 98.91 54.47 43.28 13.3 11.8 9.0 26.4 20.5 18.6216 215 0.06 2.81 99.70 NR 57.14 2.9 2.8 2.9 3.3 3.2 3.3238 238 0.00 0.87 100.00 93.66 98.87 2.0 2.0 1.8 4.3 4.5 4.4224 221 4.26 30.95 100.00 6.74 50.00 5.1 4.8 5.2 7.2 7.1 6.8210 211 6.36 96.15 98.59 14.04 43.29 11.5 11.7 11.2 14.5 16.0 15.8214 204 5.91 82.65 100.00 25.74 45.5 2.5 2.8 2.6 4.9 5.0 4.9231 231 0.59 17.93 100.00 5.71 61.73 2.9 2.7 2.7 5.7 5.7 5.9216 218 2.02 76.42 86.15 2.66 36.27 4.5 4.4 4.4 5.7 5.7 6.2232 231 1.46 9.70 83.95 92.66 95.64 3.1 3.1 3.0 4.0 4.0 4.1209 210 18.48 75.45 85.77 43.20 16.31 2.3 2.3 2.4 4.4 4.5 4.6240 241 3.53 14.59 100.00 4.16 36.60 1.6 2.0 2.4 2.9 3.3 4.1232 232 0.95 1.93 100.00 87.82 99.03 2.5 2.5 2.6 5.1 5.2 5.4198 198 25.07 47.72 94.99 31.30 66.43 6.0 5.8 6.0 10.8 10.0 10.8218 219 8.70 91.30 6.52 95.65 81.82 9.3 8.1 7.0 12.7 11.1 10.4220 221 3.85 29.02 100.00 87.97 100.00 3.1 3.1 3.2 3.7 3.8 3.9227 230 1.07 8.99 94.64 68.89 16.28 3.0 2.9 2.9 5.5 5.4 5.3202 207 32.64 72.27 94.12 51.33 88.61 3.5 3.5 3.6 5.9 6.0 6.0195 196 57.33 91.28 67.56 67.43 71.30 2.4 2.5 2.6 2.9 2.9 3.0NR NR NR NR NR NR NR 4.2 4.3 4.3 4.4 4.5 4.6
189 196 78.94 93.32 82.73 57.59 99.92 5.7 5.5 5.6 7.2 7.0 7.1211 212 8.97 58.35 100.00 4.57 74.25 2.6 2.6 2.6 3.6 3.5 3.6197 199 86.51 97.30 99.86 91.56 92.40 5.4 5.2 5.2 12.3 12.4 11.0228 229 2.62 18.32 99.75 92.72 97.34 3.6 3.6 3.7 5.3 5.5 6.0226 227 5.06 29.16 60.78 73.46 100.00 2.7 2.8 2.8 4.6 4.9 5.0NR NR NR NR 100.00 NR NR 4.7 4.6 4.8 7.1 7.2 7.5
214 213 0.67 78.54 96.22 97.72 98.16 4.5 4.3 4.3 6.6 6.6 6.6240 240 3.46 15.27 82.03 15.5 75.19 4.3 4.0 3.8 6.2 5.8 5.6225 224 0.72 16.92 100.00 8.52 28.11 4.1 4.2 4.2 4.4 4.5 4.5223 222 2.54 30.86 77.22 91.64 56.27 2.9 2.9 2.9 3.8 3.7 3.7201 201 70.83 77.27 100.00 12.28 90.21 2.9 3.1 3.2 3.9 4.0 4.2222 224 12.06 31.80 93.19 46.32 85.14 3.1 3.2 3.2 4.4 4.5 4.6
Primary Level
Average Number of InstructionalDaysa (In Previous Academic
Year): 2009-10
Average Number of Classrooms
Primary Schools All Schools
Upper PrimaryLevel
% of Primary onlySchools with lessthan 200 Working
Daysa (Government& Aided
Managements)
% of Upper PrimarySchools/Sectionswith less than 220
Working Daysa
(Government & AidedManagements)
2010-11
% of SchoolsApproachableby All Weather
Roads
% of Schools(Government
& AidedManagements)
Constituted SMC
% of Schools withSMC having
Opened BankAccount
2010-11 2008-09 2009-10 2010-11 2008-09 2009-10 2010-11
NR : Data not reported.a : Being included for the first time, large number of schools didn't report information. Average/percentage is based on the schools that supplied the information.SMC : School Management Committee.
DISE 2010-11: Flash Statistics 5
State/UT
A & N IslandsAndhra PradeshArunachal PradeshAssamBiharChandigarhChhattisgarhDadra & Nagar HaveliDaman & DiuDelhiGoaGujaratHaryanaHimachal PradeshJammu & KashmirJharkhandKarnatakaKeralaLakshadweepMadhya PradeshMaharashtraManipurMeghalayaMizoramNagalandOdishaPuducherryPunjabRajasthanSikkimTamil NaduTripuraUttar PradeshUttarakhandWest Bengal
All States
2008-09 2009-10 2010-11 2008-09 2009-10 2010-11 2008-09 2009-10 2010-11 2008-09 2009-10 2010-11 2009-10 2010-11 2009-10 2010-11 2009-10 2010-11 2009-10 2010-11 2009-10 2010-11
7.9 8.5 8.5 11.9 8.4 8.0 19 17 16 14 13 13 0 0 6.08 4.78 4.35 2.49 6.01 4.49 4.44 3.523.0 2.9 2.9 9.6 9.4 9.3 25 24 23 27 26 25 0 0 31.13 29.44 19.95 20.15 31.55 30.67 27.29 29.783.2 3.4 3.6 9.3 9.1 9.3 20 19 19 16 15 14 0 0 13.93 13.65 16.47 16.85 10.49 9.51 17.21 17.962.3 3.1 3.2 3.8 4.1 4.2 35 30 29 36 28 29 10 10 41.60 45.68 41.76 34.79 42.96 40.51 48.04 40.782.9 3.1 3.4 5.5 11.2 4.5 96 89 83 98 88 81 37 38 74.19 76.98 89.86 90.30 64.49 66.52 89.79 91.37
21.9 16.5 16.6 34.1 27.5 22.0 30 40 43 33 39 52 1 1 68.60 75.56 61.01 65.48 85.71 92.31 85.71 82.003.0 2.8 2.9 6.4 6.7 6.9 28 28 27 29 29 27 6 4 33.81 31.70 23.64 26.12 35.55 38.80 23.50 38.644.0 4.0 4.0 10.4 10.5 9.0 39 39 45 34 31 35 1 1 61.90 49.83 67.74 68.80 50.62 28.40 70.64 71.825.9 5.3 5.1 16.0 16.9 13.1 36 34 35 37 38 35 2 2 53.85 48.00 36.67 41.51 52.27 53.19 28.89 36.84
14.9 16.2 16.0 14.0 15.5 15.5 37 34 34 36 36 37 7 7 56.43 55.53 35.41 31.95 64.86 63.39 48.85 41.262.9 2.8 2.8 10.2 10.7 10.1 23 25 25 18 21 20 0 0 15.78 16.57 16.74 21.13 7.19 6.94 8.51 8.075.3 5.2 5.3 8.4 8.5 8.8 34 34 34 29 27 26 22 20 48.76 47.96 39.43 39.53 28.12 27.63 38.22 38.474.8 4.8 4.5 9.8 9.8 11.0 30 32 27 34 35 32 12 4 48.45 39.73 30.97 23.58 50.06 48.66 30.53 27.723.2 3.2 3.2 9.0 9.5 10.2 15 15 14 14 13 13 0 0 4.87 4.08 11.87 9.93 5.21 4.40 15.62 12.993.0 3.1 3.3 10.6 10.5 10.6 17 17 16 16 15 13 0 0 16.76 14.31 14.34 13.01 14.76 10.64 19.44 16.582.7 3.1 3.7 7.3 7.7 9.4 54 47 37 57 43 34 23 20 58.92 52.87 65.58 51.80 49.23 45.92 67.20 53.924.2 4.3 4.4 8.6 8.9 9.2 27 25 24 18 16 15 4 2 23.78 20.20 24.79 20.52 7.90 6.06 21.96 16.94
10.0 9.1 9.6 11.4 10.6 11.5 25 27 25 24 24 22 2 0 27.04 22.07 25.85 18.67 16.85 13.34 22.38 15.4012.7 11.1 10.4 * * * 22 22 22 25 24 23 0 0 14.29 8.33 8.33 13.04 5.00 4.35 9.09 13.043.1 3.1 3.1 6.7 7.1 7.5 31 30 29 32 30 29 25 21 41.18 37.98 33.53 32.63 42.36 39.81 35.04 36.984.1 4.0 3.9 9.1 9.0 8.6 31 31 31 30 30 28 18 18 32.61 31.37 29.00 29.96 19.01 17.78 26.19 25.444.5 4.5 4.5 8.5 8.8 8.5 19 20 22 17 17 17 0 0 14.79 16.17 10.87 14.86 11.73 11.14 8.54 7.952.6 2.6 2.6 3.1 3.1 3.5 18 18 18 17 17 17 0 0 16.13 15.96 10.90 9.66 16.20 16.17 15.44 5.693.9 4.0 4.0 7.2 6.9 6.9 19 19 18 16 16 16 0 0 11.20 11.41 15.00 10.08 9.02 7.84 16.46 8.865.7 5.5 5.5 11.3 11.3 11.9 22 21 20 15 15 15 0 0 15.26 15.45 24.95 20.42 5.42 8.58 19.26 16.573.5 3.4 3.5 4.4 5.1 4.5 30 30 27 28 26 25 1 6 35.74 34.31 41.72 31.63 26.73 25.73 44.05 36.509.2 8.9 8.1 17.6 18.3 15.9 21 21 23 21 20 18 0 0 16.99 20.46 8.40 18.03 17.20 9.24 10.61 18.324.3 4.2 4.2 13.0 13.2 13.4 24 23 21 26 25 23 0 0 25.19 20.25 14.58 14.02 27.82 28.08 16.54 22.643.8 3.9 4.0 7.6 8.0 8.1 25 24 23 24 22 21 1 1 25.86 24.88 19.92 19.08 19.60 19.14 20.02 20.457.2 7.2 7.3 7.0 7.2 7.8 15 15 14 11 10 10 0 0 4.43 3.52 5.34 4.34 2.30 1.93 5.03 5.544.9 4.8 4.7 9.9 10.0 10.3 28 27 27 22 23 22 6 4 26.87 23.53 32.67 30.78 16.37 13.10 30.48 27.786.0 5.6 5.3 12.1 11.7 11.5 28 27 25 18 17 15 1 0 27.67 25.08 36.91 33.89 11.81 9.06 36.59 33.753.9 4.0 4.0 6.0 6.0 6.0 39 36 35 43 39 38 65 62 60.39 58.30 30.43 29.39 58.53 55.38 22.35 20.893.1 3.0 2.9 6.3 6.3 6.6 20 19 19 21 20 19 2 1 15.82 15.08 12.35 13.44 14.92 13.40 9.83 10.634.3 3.8 4.0 2.2 5.3 5.7 47 42 40 41 37 34 18 17 56.60 51.87 70.22 65.29 59.57 55.04 76.56 71.583.6 3.7 3.8 7.5 7.8 8.0 33 32 31 35 32 31 274 239 40.63 38.66 33.17 31.44 38.65 36.74 35.28 34.42
Number of Districtswhere SCR isAbove 30 : All
Schools
Average Number of Classrooms
* State dose not have such school type.
All Government Schools All Private Schools
Average Student-Classroom Ratio (SCR)
All Schools Primary Schools
% Schools withSCR > 30
% Schools withSCR > 35
Primary Level Upper Primary Level
% GovernmentSchools with
SCR > 30 atPrimary Level
% GovernmentSchools with
SCR > 35 at UpperPrimary Level
6 Elementary Education in India
State/UT
A & N Islands
Andhra Pradesh
Arunachal Pradesh
Assam
Bihar
Chandigarh
Chhattisgarh
Dadra & Nagar Haveli
Daman & Diu
Delhi
Goa
Gujarat
Haryana
Himachal Pradesh
Jammu & Kashmir
Jharkhand
Karnataka
Kerala
Lakshadweep
Madhya Pradesh
Maharashtra
Manipur
Meghalaya
Mizoram
Nagaland
Odisha
Puducherry
Punjab
Rajasthan
Sikkim
Tamil Nadu
Tripura
Uttar Pradesh
Uttarakhand
West Bengal
All States
41.67 72.73 74.19 75.41 2.78 4.06 5.42 5.00 6.87 9.27 0.00 3.00 4.39 0.00 1.78 2.22
18.32 - 39.02 - 9.02 13.72 11.43 13.28 19.73 17.11 8.91 13.72 10.92 6.07 9.66 7.32
17.17 18.42 31.77 29.94 50.23 49.25 44.81 63.98 65.12 60.89 36.76 36.46 35.86 29.24 27.66 26.57
74.12 72.38 80.48 81.76 24.87 12.13 14.98 33.31 16.42 21.03 26.66 15.03 19.75 19.88 11.10 14.05
53.33 47.20 39.93 38.53 4.93 5.44 4.53 6.22 7.26 6.46 6.05 7.14 6.35 4.80 5.37 4.46
40.00 33.33 48.41 45.96 0.00 0.00 0.00 0.00 0.00 0.00 0.00 0.00 0.00 0.00 0.00 0.00
44.59 53.19 33.47 52.80 12.22 11.03 7.89 15.18 12.84 9.20 13.74 11.77 8.19 10.89 9.97 6.84
25.00 20.00 27.19 26.32 22.08 19.59 22.22 38.51 33.72 38.37 36.78 31.98 36.05 20.78 18.58 20.88
57.89 73.91 45.00 44.44 0.00 1.87 1.82 - 4.17 3.51 0.00 4.17 3.51 0.00 1.87 1.82
90.84 91.84 87.01 86.74 0.06 0.06 0.60 0.12 0.08 0.55 0.08 0.04 0.55 0.04 0.04 0.54
49.44 32.50 29.50 41.21 21.37 24.58 26.36 31.20 35.25 38.48 12.59 17.28 17.11 8.57 12.05 11.74
- 84.10 90.52 86.71 2.07 1.42 0.86 5.54 3.47 2.16 5.09 3.13 1.86 1.93 1.30 0.76
49.19 55.45 50.56 54.28 3.08 4.17 4.73 4.23 5.96 7.60 3.90 5.54 7.19 2.83 3.90 4.47
91.54 79.67 38.21 39.36 9.45 6.15 5.47 13.43 8.72 7.86 10.54 6.09 5.21 7.44 4.30 3.61
54.69 60.87 72.93 77.49 12.73 12.18 8.82 20.79 21.04 16.42 17.75 17.23 12.02 10.88 10.00 6.47
25.92 19.71 28.62 23.21 7.41 8.02 9.75 10.24 11.23 15.23 10.15 11.10 14.85 7.35 7.91 9.50
40.92 35.56 69.45 70.97 8.09 7.44 6.61 16.31 15.50 14.17 8.69 7.63 6.58 4.54 3.86 3.21
99.06 93.19 64.56 72.92 0.66 0.63 0.13 0.65 0.67 0.19 0.27 0.40 0.10 0.45 0.46 0.06
90.91 91.67 52.38 28.57 0.00 0.00 0.00 0.00 0.00 0.00 0.00 0.00 0.00 0.00 0.00 0.00
24.68 24.52 48.68 46.17 14.63 14.15 14.94 17.44 16.73 17.02 17.24 16.33 16.67 14.34 13.78 14.65
63.91 60.64 54.15 53.20 7.24 4.46 3.31 14.21 8.48 6.11 11.69 6.42 3.82 5.98 3.39 2.13
73.56 65.88 65.14 64.36 11.58 12.18 10.39 18.00 18.00 16.53 17.01 17.37 15.99 10.93 11.72 10.06
77.98 68.40 65.77 75.19 13.46 11.34 9.54 18.05 12.11 13.15 12.28 9.15 9.96 9.11 8.20 7.19
65.82 53.66 64.92 75.69 1.80 2.78 4.10 0.93 3.41 6.68 0.80 3.01 6.35 0.92 2.26 3.82
79.07 67.50 65.15 63.58 2.37 3.73 3.01 3.69 5.53 4.54 3.13 4.70 3.32 2.02 3.21 2.12
47.57 42.32 36.23 37.55 7.41 12.27 12.75 12.22 17.99 20.92 11.30 16.85 19.54 6.87 11.54 11.95
72.41 84.00 70.09 74.44 0.00 0.29 0.85 0.00 0.33 1.71 0.00 0.33 0.00 0.00 0.29 0.14
44.95 51.74 26.10 51.33 5.50 3.39 4.43 8.12 5.40 7.80 7.44 3.35 6.27 5.05 2.14 3.57
58.83 33.27 69.42 70.29 16.27 17.17 15.36 31.42 33.79 30.96 30.33 32.11 29.51 15.72 16.34 14.66
83.33 81.82 66.15 70.09 0.35 1.02 1.67 0.50 1.56 2.62 0.25 0.91 1.18 0.17 0.59 0.75
88.00 86.63 62.09 61.77 2.16 2.34 2.63 3.11 3.32 3.89 2.86 2.88 3.36 2.00 2.05 2.29
37.95 43.75 46.11 52.99 0.92 1.02 0.91 1.19 1.51 1.66 1.09 1.38 1.53 0.87 0.95 0.84
72.68 69.77 73.30 74.20 7.49 7.87 8.55 3.65 2.71 3.00 3.52 2.62 2.96 6.88 7.16 8.04
85.70 74.21 44.82 43.27 14.95 12.55 14.47 19.85 16.30 19.53 16.43 12.28 14.65 12.33 9.50 10.86
68.97 68.32 48.87 70.52 4.08 5.70 2.81 4.75 6.49 3.16 4.63 6.34 2.96 3.96 5.54 2.61
60.92 57.19 57.71 56.12 9.71 9.33 8.86 13.25 12.26 11.80 11.43 10.59 10.11 8.44 8.14 7.72
2009-10 2010-11 2009-10 2010-11 2008-09 2009-10 2010-11 2008-09 2009-10 2010-11 2008-09 2009-10 2010-11 2008-09 2009-10 2010-11
%age Distribution of PrimaryOnly Schools having Enrolment
150 & Above and have HeadMaster/Teacher
%age Distribution of UpperPrimary Schools/Sections havingEnrolment 100 & Above and have
Head Master/Teacher
% Single-Teacher Schools
All Schools Primary Schools Primary Schools
% Single-Teacher Schools with 15 and More Students
All Schools
DISE 2010-11: Flash Statistics 7
State/UT
A & N IslandsAndhra PradeshArunachal PradeshAssamBiharChandigarhChhattisgarhDadra & Nagar HaveliDaman & DiuDelhiGoaGujaratHaryanaHimachal PradeshJammu & KashmirJharkhandKarnatakaKeralaLakshadweepMadhya PradeshMaharashtraManipurMeghalayaMizoramNagalandOdishaPuducherryPunjabRajasthanSikkimTamil NaduTripuraUttar PradeshUttarakhandWest Bengal
All States
2008-09 2009-10 2010-11 2008-09 2009-10 2010-11 2008-09 2009-10 2010-11 2008-09 2009-10 2010-11 2008-09 2009-10 2010-11 2008-09 2009-10 2010-11
1.56 1.82 2.88 0.33 0.40 0.60 100.00 89.34 88.92 39.72 44.42 47.78 98.61 91.37 95.81 99.00 87.55 93.663.89 7.25 5.10 1.94 4.00 2.54 78.68 81.11 82.54 41.91 42.65 41.50 85.59 91.83 90.51 81.80 89.76 87.96
37.54 37.34 36.58 14.96 13.97 13.08 83.70 83.63 82.91 64.08 64.02 60.64 63.30 85.39 78.16 56.38 81.90 73.4622.51 11.73 20.13 12.78 6.81 11.11 71.52 67.79 67.93 42.79 34.68 36.79 65.34 81.33 76.12 63.69 81.88 74.634.41 5.26 4.78 2.82 2.88 2.35 80.20 80.56 81.85 3.53 3.50 2.97 85.32 92.60 91.86 80.59 89.44 87.360.00 0.00 0.00 0.00 0.00 0.00 99.44 99.43 97.28 1.13 1.14 3.80 100.00 100.00 100.00 100.00 100.00 100.008.68 7.54 5.19 6.41 6.26 3.97 66.51 67.93 67.23 36.24 37.35 36.71 88.74 94.24 93.59 89.61 95.04 93.88
22.14 20.66 25.97 5.05 4.14 4.66 84.74 82.77 84.18 29.22 28.38 28.28 93.83 96.28 96.30 96.55 93.60 94.190.00 1.34 0.91 0.00 0.44 0.36 93.94 93.46 95.45 6.06 8.41 12.73 100.00 100.00 100.00 100.00 100.00 100.000.01 0.00 0.12 0.00 0.00 0.36 92.37 92.30 92.51 0.93 1.13 1.23 100.00 100.00 100.00 100.00 100.00 100.009.48 8.87 10.25 2.63 2.97 3.12 97.70 98.34 98.59 59.56 54.02 55.06 97.70 99.24 98.93 97.18 99.01 98.713.04 2.02 1.10 0.52 0.40 0.19 83.61 84.29 85.68 18.00 18.62 18.58 90.24 96.74 97.89 83.89 93.93 95.821.80 2.35 3.28 1.14 1.33 1.75 79.30 79.18 81.70 13.41 13.47 16.11 96.99 99.48 99.00 95.91 99.71 98.838.43 5.01 4.55 4.27 2.51 2.13 73.10 71.87 71.33 57.45 59.66 61.07 94.10 97.64 97.55 94.85 97.81 97.42
17.18 17.90 12.81 5.13 4.79 2.99 73.13 73.41 73.31 54.15 54.38 56.56 78.66 86.31 86.93 73.52 81.74 81.848.04 9.15 11.65 3.60 4.12 4.09 54.49 54.78 57.35 12.49 16.99 19.66 71.70 85.44 87.37 62.00 80.04 83.218.45 8.00 7.12 1.92 1.50 1.16 81.42 81.25 82.02 36.55 37.84 38.55 82.73 69.83 94.71 78.48 61.38 91.480.18 0.12 0.03 0.31 0.26 0.01 99.38 99.45 99.40 12.16 13.95 15.56 97.73 98.99 99.35 96.69 98.52 99.120.00 0.00 0.00 0.00 0.00 0.00 92.31 90.91 100.00 2.56 4.55 4.35 100.00 100.00 100.00 100.00 100.00 100.00
12.27 11.84 12.62 8.95 8.56 9.65 66.65 67.13 67.65 22.28 24.65 24.76 92.69 94.03 91.17 91.98 93.53 90.484.23 2.50 1.63 1.14 0.70 0.47 70.94 69.56 68.66 35.19 36.60 37.78 87.70 93.73 92.16 81.28 90.23 87.84
12.81 12.63 11.93 4.28 4.46 3.80 79.99 81.23 85.43 37.03 34.28 31.98 76.58 92.05 89.20 73.57 90.04 86.3711.07 7.79 8.08 6.44 5.79 4.94 80.95 81.11 80.97 69.43 69.51 67.18 50.61 61.06 58.56 48.40 60.26 57.890.46 2.70 6.08 0.50 1.63 2.84 82.48 81.93 82.23 39.35 37.06 40.05 80.64 85.67 86.05 78.72 84.99 84.921.34 2.95 2.05 0.49 1.11 0.79 85.20 84.85 83.79 22.10 26.19 26.93 75.15 83.97 75.09 72.15 81.74 72.197.17 11.21 13.32 3.26 5.63 5.94 63.73 66.74 67.63 30.99 32.01 34.00 83.33 89.07 88.65 79.17 86.37 85.290.00 0.05 0.23 0.00 0.15 0.06 95.81 97.83 96.47 15.61 16.04 17.35 99.71 100.00 100.00 99.32 100.00 100.004.92 1.94 4.44 2.44 1.01 1.68 91.86 90.53 92.84 24.11 27.93 27.68 97.32 98.76 99.78 97.08 99.45 99.82
24.25 26.09 24.31 7.30 7.55 6.79 63.81 64.49 64.03 25.80 27.32 27.75 91.96 96.44 94.68 87.59 94.48 92.210.14 0.60 0.90 0.05 0.17 0.26 88.55 88.05 87.18 45.19 45.42 43.55 87.50 96.69 98.17 85.79 95.83 97.511.45 1.40 1.53 0.62 0.63 0.63 93.88 94.64 95.06 27.86 28.91 29.99 100.00 99.87 100.00 100.00 99.99 100.001.21 1.55 1.65 0.51 0.54 0.37 53.83 54.17 60.47 21.46 29.51 31.71 77.77 79.41 82.38 73.19 73.56 76.282.70 2.01 2.27 4.14 4.15 4.62 75.63 77.81 78.19 10.49 12.12 12.24 97.58 98.18 98.16 98.87 99.27 99.33
11.34 8.91 10.62 7.33 5.87 6.33 74.30 74.24 75.69 52.94 55.48 57.35 87.23 89.61 92.98 87.71 89.73 93.272.67 3.79 1.75 1.50 2.26 1.03 70.38 72.99 74.07 18.35 15.84 18.51 82.71 96.02 95.37 82.34 95.74 95.366.41 6.05 6.11 3.72 3.65 3.56 73.66 74.48 75.08 26.66 27.10 27.83 87.77 92.60 92.71 85.33 91.51 91.12
Primary Schools
% Schools having Drinking Water Facility% Enrolment in Single-Teacher Schools
All Schools
% Schools with Female Teachers(All Schools) in Schools having
2 or More Teachers
% Distribution of Schoolshaving Enrolment ≤≤≤≤≤ 50
(All Schools)All Schools Primary Schools
8 Elementary Education in India
State/UT
% Schools having Common Toilet % Schools havingFunctional
Common Toilet
% Schools having Boys’ Toilet
A & N IslandsAndhra PradeshArunachal PradeshAssamBiharChandigarhChhattisgarhDadra & Nagar HaveliDaman & DiuDelhiGoaGujaratHaryanaHimachal PradeshJammu & KashmirJharkhandKarnatakaKeralaLakshadweepMadhya PradeshMaharashtraManipurMeghalayaMizoramNagalandOdishaPuducherryPunjabRajasthanSikkimTamil NaduTripuraUttar PradeshUttarakhand
West Bengal
All States
2008-09 2009-10* 2010-11* 2008-09 2009-10* 2009-10* 2010-11 2009-10 2010-11 2009-10 2010-11 2010-11 2008-09 2009-10 2010-11 2009-10 2010-11
95.56 29.70 26.60 98.00 31.33 23.41 73.15 84.52 68.47 76.39 59.51 87.77 81.67 88.83 73.89 81.97 65.3761.45 74.30 66.08 58.52 71.58 63.33 34.80a 8.57 14.48 7.28 12.03 64.68 47.14 66.66 59.53 59.66 50.3525.79 38.22 33.64 17.07 30.25 25.15 65.73 17.62 18.51 11.52 11.18 83.82 16.08 37.98 31.30 27.52 19.1130.27 41.75 36.55 27.99 39.80 33.14 69.34 21.30 20.92 22.17 21.96 81.54 12.74 38.24 39.71 34.06 36.0657.19 48.24 44.97 48.13 44.38 38.85 59.89 17.37 22.40 13.94 16.62 76.96 26.06 37.70 37.43 31.96 29.8440.11 32.39 34.78 58.33 52.94 62.50 96.88 93.18 92.93 76.47 68.75 99.42 94.92 97.16 95.11 82.35 68.7544.16 36.84 25.11 39.67 35.72 24.41 66.18 23.95 31.94 20.95 28.97 60.49 23.13 35.29 34.70 29.91 30.3142.21 21.62 18.86 32.18 24.42 22.09 94.64 52.36 55.56 32.56 37.21 93.94 32.79 51.69 54.88 32.56 37.2189.90 51.40 44.55 93.18 62.50 45.61 100.00 72.90 80.91 64.58 71.93 98.88 73.74 75.70 81.82 66.67 71.9352.82a 32.45 18.10 58.53a 27.13 16.67 94.83 78.65 79.86 75.16 76.14 100.00 87.87 78.93 80.26 75.97 77.0861.10 42.45 41.99 54.32 41.41 40.06 93.93 58.31 62.78 49.06 54.20 95.62 58.03 61.01 67.87 51.34 59.8473.10 37.49 32.79 71.74 49.51 39.04 84.79 49.36 58.80 28.34 35.31 88.76 67.73 58.47 73.09 37.42 61.6994.80 56.64 41.11 94.76 52.81 37.74 76.22 68.27 68.24 64.75 65.07 92.47 87.54 87.37 86.03 83.89 81.7150.86 38.14 34.79 46.33 38.35 34.14 85.81 42.90 57.08 35.08 50.75 85.21 42.90 56.41 66.48 48.35 59.7835.27 33.93 34.43 19.85 24.00 23.27 66.21 14.02 17.23 5.08 6.42 81.23 20.36 24.23 25.77 10.63 10.0840.92 30.37 18.97 29.52 28.67 16.36 73.42 32.65 52.13 30.16 49.47 82.07 28.23 49.26 60.04 45.73 55.2183.29 88.15 53.23 77.41 83.69 56.46 91.35 58.50 62.93 45.72 49.72 93.65 56.04 68.19 75.37 54.06 62.7482.88 55.86 55.39 85.05 61.45 59.93 89.02 66.07 70.16 57.17 60.69 90.21 77.87 76.46 77.29 67.14 67.3876.92 59.09 52.17 81.25 70.00 52.17 87.50 63.64 60.87 55.00 47.83 100.00 64.10 70.45 63.04 55.00 47.8374.20 55.62 49.43 70.94 55.78 49.85 83.55 24.32 28.22 19.26 21.74 89.42 47.60 37.85 38.75 30.21 31.0577.14 32.49 30.75 72.28 37.63 34.93 94.18 64.70 68.39 52.54 58.47 96.64 63.94 69.61 71.49 55.72 60.7651.44 43.45 44.38 37.76 38.13 38.83 82.98 16.94 23.03 4.31 6.69 89.70 18.64 23.18 26.43 7.28 8.5432.82 43.88 35.27 28.21 43.86 33.51 68.73 10.99 21.26 8.58 18.28 75.56 11.15 31.72 23.95 28.91 20.8381.71 73.81 66.36 82.51 71.63 65.94 87.65 32.77 32.89 30.47 29.30 92.25 34.22 56.56 62.36 52.56 58.1379.88 86.48 58.07 78.66 84.12 58.46 52.22 12.41 42.75 10.41 35.95 69.54 57.36 90.51 69.43 88.82 63.9957.15 80.79 68.00 51.79 82.34 69.06 47.23 14.67 17.45 12.41 14.25 77.74 34.01 37.85 38.17 28.95 27.0699.28 45.09 45.13 98.31 46.82 47.44 93.44 82.95 86.88 81.27 85.32 97.24 88.58 89.16 90.55 85.28 89.0889.17 86.78 52.66 90.16 92.39 58.85 97.90 33.54 66.55 25.44 54.05 97.93 83.27 98.59 89.70 99.02 89.3548.65 55.98 NR 34.14 41.62 NR NR 1.91 68.35 1.31 58.78 83.79 82.99 89.35 92.05 83.28 88.1798.69 80.00 77.35 98.99 78.52 76.67 94.73 43.39 49.46 37.24 41.15 95.96 41.43 74.75 75.44 65.89 65.1466.74 47.90 47.13 70.53 53.54 52.66 90.13 58.70 60.32 50.60 51.68 93.68 64.15 69.24 71.67 59.96 61.6570.47 57.73 62.79 63.74 54.14 61.23 75.34 13.94 19.52 4.94 9.02 82.24 26.63 42.32 43.41 21.80 20.5792.65 43.95 45.09 92.14 44.82 46.45 70.88 43.29 50.31 42.75 50.26 94.04 84.20 71.85 76.26 70.62 75.7185.55 59.60 56.40 85.33 62.96 61.76 87.33 32.90 40.02 29.69 35.06 87.90 52.21 58.31 52.09 54.31 46.8674.34 79.96 66.39 74.71 80.53 69.69 83.45 16.04 32.66 12.39 28.06 86.44 41.18 48.94 48.81 43.95 43.69
66.84 54.31 43.21 62.81 54.14 45.14 72.56 31.03 42.59 25.72 35.44 88.40 53.60 58.82 60.28 50.99 52.23
All Schools Primary Schools All Schools
NR : Data not reported.a : Low because of water scarcity.* : In addition, schools may also have boys and common toilets in co-educational schools.
Primary Schools All Schools All Schools Primary Schools
% Schools havingFunctionalBoys’ Toilet
All Schools
% Schools having Girls’ Toilet*
DISE 2010-11: Flash Statistics 9
State/UT
A & N IslandsAndhra PradeshArunachal PradeshAssamBiharChandigarhChhattisgarhDadra & Nagar HaveliDaman & DiuDelhiGoaGujaratHaryanaHimachal PradeshJammu & KashmirJharkhandKarnatakaKeralaLakshadweepMadhya PradeshMaharashtraManipurMeghalayaMizoramNagalandOdishaPuducherryPunjabRajasthanSikkimTamil NaduTripuraUttar PradeshUttarakhandWest Bengal
All States
2010-11 2008-09 2009-10 2010-11 2008-09 2009-10 2010-11 2009-10 2010-11 2009-10 2010-11 2010-11 2009-10 2010-1183.67 48.61 51.78 48.52 47.50 55.33 60.84 37.34 37.07 81.37 85.07 71.66 39.13 27.8638.27 52.46 53.85 56.09 22.71 23.84 25.58 10.71 11.52 50.54 53.06 69.48 18.16 20.9169.78 27.65 27.77 29.99 9.54 14.22 15.58 2.41 2.57 49.66 50.29 63.73 21.55 18.9174.04 26.47 27.55 24.76 3.24 4.96 5.12 1.00 0.53 15.64 16.22 73.29 9.00 8.1761.83 33.19 39.13 44.55 0.68 0.94 1.21 0.09 0.26 2.50 2.66 61.28 3.16 3.2698.29 99.44 99.43 100.00 85.88 90.34 93.48 47.06 56.25 94.97 97.02 93.60 72.96 80.9559.99 42.57 70.01 71.92 6.30 7.21 6.04 3.95 2.95 13.51 12.38 78.16 10.55 10.3493.25 43.18 38.85 39.39 4.22 9.46 11.78 2.33 2.33 19.35 24.80 97.14 7.26 12.0097.78 90.91 89.72 91.82 43.43 42.99 55.45 12.50 22.81 67.80 90.57 98.36 38.98 62.26
100.00 97.95 97.94 98.07 85.84 82.41 83.17 79.77 79.15 85.29 87.36 80.27 66.65 63.7095.65 64.88 69.04 74.51 31.22 30.75 31.92 6.75 7.91 86.24 82.85 98.53 66.51 67.7888.46 83.61 86.74 88.58 37.69 42.82 45.37 13.91 14.11 53.90 56.68 85.17 21.97 23.6983.27 93.43 95.05 95.62 27.46 26.80 32.92 4.84 6.90 51.17 58.47 80.89 30.75 29.2886.33 31.76 50.02 45.42 12.94 14.68 16.55 3.55 3.43 35.82 41.14 88.08 18.20 15.1172.28 29.65 30.17 31.45 11.66 12.73 14.69 3.08 2.94 25.21 28.03 71.17 9.83 11.1381.67 22.54 21.51 25.20 5.83 5.99 7.15 3.43 2.78 10.25 13.66 71.00 4.97 10.1291.55 70.76 62.91 69.10 18.35 21.20 24.37 7.63 8.36 32.35 37.08 86.37 18.79 24.5690.26 72.84 76.91 79.42 79.93 86.86 93.01 78.41 87.91 96.76 98.66 94.51 65.10 70.91
100.00 46.15 56.82 45.65 89.74 93.18 95.65 85.00 91.30 100.00 100.00 97.73 87.50 60.8787.25 43.35 43.02 42.35 10.38 10.48 10.12 3.74 3.26 24.52 23.95 72.50 15.21 10.6095.93 58.13 59.99 58.55 37.17 39.36 40.80 13.01 13.71 65.70 68.42 92.40 10.43 11.1187.12 28.86 31.81 30.38 11.99 15.66 18.18 1.09 1.64 38.32 44.37 90.07 13.66 17.0670.84 18.95 17.93 18.87 7.25 7.43 7.10 2.95 2.46 18.02 18.87 82.75 6.04 7.6984.26 29.97 41.72 58.26 15.64 17.55 23.04 5.44 8.20 30.93 39.24 88.94 8.00 11.0957.14 76.50 76.14 75.34 23.57 27.60 33.12 4.58 5.35 65.30 76.24 89.74 26.41 38.3954.18 59.13 57.61 58.79 7.51 7.28 8.47 3.15 3.32 14.06 15.01 38.89 6.56 6.7597.20 84.25 85.69 87.31 70.95 79.91 90.69 58.86 85.67 95.93 94.23 98.44 67.18 69.4798.76 90.51 90.69 95.08 32.53 38.64 47.12 10.99 12.44 81.62 84.37 97.74 35.72 29.1092.12 64.26 71.95 76.34 2.73 14.99 21.73 3.38 5.82 25.50 35.72 90.92 7.30 11.4896.03 25.52 26.69 29.31 24.04 35.85 40.97 13.02 15.86 78.40 84.70 87.80 21.60 26.9491.29 62.07 66.95 71.85 32.12 38.60 47.43 21.40 25.34 66.87 83.51 94.54 28.38 30.1578.57 14.80 12.92 13.18 8.71 9.04 11.65 1.63 2.01 18.30 22.13 83.95 4.39 4.3380.14 48.04 51.65 53.68 3.59 4.72 5.45 2.79 3.12 8.79 10.12 53.02 3.91 3.9386.09 75.75 77.62 79.60 22.27 24.13 25.14 10.97 11.52 53.88 55.37 85.06 29.40 30.1885.40 40.11 NR 32.68 5.90 7.45 8.72 3.54 3.58 28.52 34.40 66.88 10.30 13.7580.87 51.02 51.45 55.41 14.12 16.65 18.70 6.47 6.99 33.37 36.80 82.81 13.65 14.70
% Schoolshaving Functional
Girls’ ToiletAll Schools
% Schools havingBoundary Wall
All Schools
% Schools having Computer
Primary Only Schools Upper PrimarySchools/Sections
% Schoolshaving Functional
Computers
All Schools
% Schools havingCAL Facility +
Upper PrimarySchools/Sections
+ CAL : Computer Aided Learning.
All Schools
10 Elementary Education in India
State/UT
A & N IslandsAndhra PradeshArunachal PradeshAssamBiharChandigarhChhattisgarhDadra & Nagar HaveliDaman & DiuDelhiGoaGujaratHaryanaHimachal PradeshJammu & KashmirJharkhandKarnatakaKeralaLakshadweepMadhya PradeshMaharashtraManipurMeghalayaMizoramNagalandOdishaPuducherryPunjabRajasthanSikkimTamil NaduTripuraUttar PradeshUttarakhandWest Bengal
All States
2008-09 2009-10 2010-11 2008-09 2009-10 2010-11 2009-10 2010-11 2009-10 2010-117.22 17.26 25.12 4.50 12.45 18.54 60.91 56.90 98.48 83.50
11.98 14.20 15.94 9.68 11.82 13.45 56.50 56.55 84.55 81.202.95 3.30 3.67 1.77 2.18 2.57 27.49 29.97 50.69 48.82
22.46 42.65 37.91 24.55 47.28 43.15 54.26 53.02 62.29 60.1329.26 38.71 47.36 22.75 29.18 35.92 31.02 31.37 63.32 65.6038.98 43.18 43.48 25.00 23.53 25.00 98.30 95.11 100.00 97.8333.01 40.63 38.58 32.54 41.16 38.39 42.96 38.81 63.99 59.72
6.17 27.36 24.24 0.57 11.05 11.05 36.15 35.02 68.92 70.0333.33 44.86 40.00 36.36 50.00 45.61 65.42 61.82 93.52 98.1858.99 70.52 63.39 49.16 68.84 57.20 80.65 80.36 100.00 99.9624.76 34.49 36.82 30.26 40.42 42.63 50.55 50.77 85.53 90.3477.75 79.62 80.66 77.61 79.32 81.64 72.00 72.97 89.63 98.1057.38 66.02 56.86 56.58 66.14 58.86 84.58 76.08 98.15 86.3033.40 46.35 45.73 37.44 51.05 50.69 67.26 66.28 74.29 83.7910.71 11.85 12.09 5.96 5.99 5.77 37.70 37.63 45.70 48.81
7.00 13.96 31.20 4.88 9.87 24.68 28.00 31.02 64.35 73.3844.94 55.14 60.94 33.70 45.93 55.48 58.82 61.59 91.48 94.8559.90 61.84 60.53 59.71 62.27 62.99 69.69 68.25 94.08 94.9482.05 70.45 58.70 75.00 60.00 52.17 25.00 26.09 100.00 86.9647.82 53.55 53.80 47.92 53.35 53.41 60.01 54.36 78.11 75.9761.26 65.43 65.11 73.77 75.71 77.59 67.61 63.13 91.77 92.94
4.98 6.04 5.29 3.54 4.86 4.25 56.32 55.93 56.55 60.608.03 12.25 16.48 7.86 12.35 15.92 36.70 36.07 51.92 53.42
37.23 38.50 40.56 40.16 41.74 44.31 20.43 32.13 92.39 89.818.08 7.83 26.72 7.07 7.08 32.05 48.73 47.28 96.79 90.84
23.55 36.19 38.14 20.47 30.11 36.05 23.67 29.32 86.36 79.6639.31 52.31 51.20 43.92 57.19 57.34 64.60 64.17 97.11 98.4537.68 53.25 53.75 39.62 55.04 63.18 70.60 73.12 99.96 99.3338.98 51.09 55.24 34.87 45.04 49.69 49.65 46.61 89.46 92.69
6.03 5.51 5.50 5.03 3.65 3.67 62.97 63.78 99.58 99.5045.86 57.14 58.81 41.80 52.43 54.75 80.08 76.66 93.54 94.8850.73 55.96 57.20 47.34 49.12 48.40 58.61 62.59 71.07 80.2356.13 58.98 71.84 61.53 64.70 76.62 65.95 76.16 82.53 89.8233.74 35.02 36.66 38.28 39.49 41.32 62.74 57.63 87.95 90.9857.34 49.60 49.18 58.65 50.01 49.98 36.79 34.32 90.30 90.4540.39 47.09 50.39 39.69 45.86 49.71 54.84 55.03 81.63 82.90
All Schools Primary Schools
% Schools having Ramp % Schools withPlayground
% Schools withToilet
DISE 2010-11: Flash Statistics 11
25.08 24.07 24.46 19.67 20.79 94.44 89.91 76.82 84.26 76.59 86.2133.07 32.84 32.95 31.77 32.10 92.02 95.00 29.42 44.95 57.23 67.1239.95 34.34 30.07 27.81 24.37 77.50 64.99 8.56 19.67 9.04 20.7237.44 47.81 47.54 61.74 66.06 80.45 85.31 6.76 11.67 5.09 11.5014.85 14.73 14.25 11.07 9.78 72.29 84.90 2.07 3.91 2.55 4.3325.21 25.21 26.02 14.29 7.69 87.39 88.62 100.00 100.00 100.00 100.00
4.87** 35.50 33.95 47.00 44.36 88.56 95.56 14.95 23.54 14.06 22.5934.27 33.10 33.10 26.04 26.04 99.30 98.59 61.05 75.68 62.79 76.4363.04 59.57 61.80 63.64 59.57 91.49 97.75 100.00 100.00 100.00 100.00
6.84 5.95 6.41 2.47 2.10 95.72 99.74 98.02 98.65 98.13 98.964.43 3.81 3.65 0.93 1.04 96.04 98.04 95.13 95.98 96.54 97.38
47.37 45.54 44.96 39.73 38.97 92.53 88.77 88.49 94.80 94.52 97.4818.67 18.08 16.65 20.63 19.54 92.32 72.36 95.95 94.25 95.71 94.7016.36 14.86 14.51 19.81 19.42 98.98 83.47 51.15 59.77 51.53 60.78
1.78 1.74 1.75 0.89 0.81 97.71 94.34 8.48 18.30 8.73 19.5632.33 31.74 30.60 25.54 24.26 95.00 92.30 3.17 7.48 3.97 9.8073.41 74.90 75.19 71.91 72.77 45.87* 98.87 83.14 88.03 88.46 91.8177.47 78.22 64.24 78.59 64.28 96.43 93.28 85.00 88.59 88.26 90.7582.05 72.73 69.57 75.00 69.57 95.45 97.83 100.00 100.00 100.00 100.0058.21 57.30 56.04 67.60 66.64 93.66 95.96 9.69 20.07 9.99 20.5731.83 30.53 29.79 27.61 26.52 94.66 91.28 58.31 71.73 61.23 74.05
NR 71.30 69.95 75.22 73.24 96.66 97.98 4.77 21.57 5.13 23.0522.96 22.17 20.75 26.52 24.71 89.19 89.17 8.21 13.74 7.85 14.0255.16 41.04 41.61 67.39 67.58 93.02 96.63 23.20 34.08 32.67 42.4984.15 79.12 75.39 79.44 76.44 80.02 90.62 11.42 33.95 14.66 34.9624.69 24.74 22.24 22.08 20.54 87.72 76.48 7.55 15.75 8.40 20.4026.07 26.12 25.95 25.69 25.40 94.65 87.97 99.67 99.86 99.66 99.8620.79 19.95 17.56 28.30 25.33 93.53 79.72 85.97 88.99 99.41 99.3746.30 36.43 36.91 35.06 35.95 96.62 82.50 11.42 33.74 14.46 39.3931.90 30.61 30.93 25.83 26.05 90.47 92.16 42.45 57.12 44.04 60.0387.84 96.64 88.62 96.99 89.31 97.71 98.01 88.04 91.26 92.59 94.5867.66 59.87 58.73 50.28 46.95 97.26 98.41 2.80 13.15 2.93 14.3259.52 49.27 47.20 64.55 62.43 82.23 78.95 22.97 25.54 26.76 29.2767.34 66.23 54.45 89.75 74.12 95.09 95.02 24.05 36.23 28.39 40.7866.58 51.71 50.69 57.73 56.86 85.70 87.65 18.79 26.50 21.34 28.8443.44 42.81 41.19 47.78 46.46 87.45 88.24 27.70 38.98 32.20 43.14
State/UT
A & N IslandsAndhra PradeshArunachal PradeshAssamBiharChandigarhChhattisgarhDadra & Nagar HaveliDaman & DiuDelhiGoaGujaratHaryanaHimachal PradeshJammu & KashmirJharkhandKarnatakaKeralaLakshadweepMadhya PradeshMaharashtraManipurMeghalayaMizoramNagalandOdishaPuducherryPunjabRajasthanSikkimTamil NaduTripuraUttar PradeshUttarakhandWest Bengal
All States
% Schools Having Electricity Connection
2008-09 2009-10 2010-11 2009-10 2010-11 2009-10 2010-11 2009-10 2010-11
% Schools having Kitchen-Shed (Government & Aided Managements)
All Schools Primary Only Schools
% Schools Providing Mid-day Meal(Government & Aided Managements)
Primary OnlySchools
All Schools Primary OnlySchools
All Schools
NR : Data not reported. ** : Incomplete coverage. * : Data not fully reported. State has clarified that all Government & Aided schools are covered under MDM.
12 Elementary Education in India
State/UT
A & N IslandsAndhra PradeshArunachal PradeshAssamBiharChandigarhChhattisgarhDadra & Nagar HaveliDaman & DiuDelhiGoaGujaratHaryanaHimachal PradeshJammu & KashmirJharkhandKarnatakaKeralaLakshadweepMadhya PradeshMaharashtraManipurMeghalayaMizoramNagalandOdishaPuducherryPunjabRajasthanSikkimTamil NaduTripuraUttar PradeshUttarakhandWest Bengal
All States
3837 4947 5282 3290 4238 4426 85.74 85.69 83.79 1.69 1.44 1.51 12.56 12.88 14.09 -508004 501819 572976 318616 311503 345078 62.72 62.07 60.23 3.68 3.53 3.00 33.60 34.39 32.05 3.90
17341 17992 18428 14609 14926 14701 84.25 82.96 79.78 5.59 5.12 4.27 10.17 11.92 14.31 0.04261212 225857b 270811 199903 166205 166862 76.53 73.59 61.62 17.71 19.44 19.41 5.76 6.98 7.35 11.32338478 332834 344688 338123 332503 335183 99.90 99.96 97.24 0.02 0.02 0.04 0.09 0.02 0.58 0.01
5762 4922 6179 3542 2966 2812 61.47 60.26 45.51 2.57 2.21 6.23 35.96 37.53 33.87 0.08172382 171861 190489 143497 140836 155007 83.24 82.25 81.37 1.13 1.33 1.24 15.60 16.36 16.93 0.07
1428 1441 1468 1181 1190 1137 82.70 82.58 77.45 3.36 3.19 3.34 13.94 14.23 18.19 -747 838 880 551 528 494 73.76 63.01 56.14 10.71 11.81 10.23 15.53 25.18 29.89 -
90705 94636 75515c 50867 51742 40342c 56.08 54.67 53.42 4.66 4.26 3.71 39.26 41.06 40.84 -8445 7450 7733 3580 3061 3121 42.39 41.09 40.36 55.49 51.17 51.88 2.12 7.74 7.71 -
238030 243342 260303 185547 187082 198146 77.95 76.88 76.12 2.54 2.62 1.96 19.51 20.50 21.72 -116239 110134 132854 84709 78807 77375 72.87 71.61 58.24 3.46 3.56 2.48 23.67 24.83 35.50 3.25
63363 64638 64334 48717 49496 48257 76.89 76.58 75.01 0.34 0.37 0.32 22.77 23.05 24.28 -124324 124127 149531 79956 78609 96809 64.31 63.33 64.74 0.04 @ @ 35.64 36.67 34.64 -152168 147804 166672 134301 132561 134590 88.26 89.69 80.75 3.96 4.78 4.23 6.93 5.53 8.59 5.26267094 279086 297948 190044 190538 194268 71.15 68.27 65.20 5.27 5.88 5.81 23.58 25.84 28.40 -132805 137182 162997 48541 49778 53230 36.55 36.95 32.66 58.32 56.68 56.36 5.12 6.37 9.74 0.16
667 742 727 667 741 701 100.00 100.00 96.42 @ @ @ @ @ @ @435723 441063 436719 279708 280098 266044c 64.19 63.51 60.92 2.06 1.20 1.12 33.74 35.29 36.52 -581257 533297 533813 298096 291930 288890 51.28 54.80 54.12 36.61 33.13 32.37 12.11 12.07 13.47 0.02
24173 23423 27042 12315 11434 14066 50.95 48.82 52.02 6.86 8.16 6.43 42.19 43.02 37.37 3.2438713 37896 40640 11026 9869 22352 28.48 26.04 55.00 61.86 62.82 31.57 9.66 11.14 12.93 0.2517263 16447 16387 13273 12597 11909 76.89 76.60 72.67 2.00 2.32 2.83 21.11 21.08 23.75 0.3521237 21174 20367 13357 12750 11923 62.89 60.29 58.54 0.00 0.16 0.00 37.11 39.55 40.51 -
246217# 182026** 249563 204866 163969 191144 83.21 90.08 76.59 6.82 2.43 9.25 9.97 7.49 9.44 4.3310239 10852 11716 5415 5188 5434 52.89 47.82 46.38 8.01 8.87 8.59 39.11 43.31 43.50 -
103383 104049 204967 81528 78733 103588 78.86 75.67 50.54 3.84 3.04 2.62 17.30 21.29 17.90 27.74453163 458766 460214 281479 274956 269444c 62.11 59.93 58.55 1.15 1.35 1.35 36.73 37.80 38.94 0.18
8313 10073 10493 6463 7954 7989 77.75 78.96 76.14 4.32 5.15 3.86 17.94 15.88 18.34 -327391 330200 333774 149808 150131 150820 45.76 45.47 45.19 18.86 17.72 16.84 35.38 36.81 37.70 0.28
30003 28242 32004 27577 26219 29768 91.91 92.84 93.01 3.49 1.92 1.73 4.60 5.24 4.70 -651338 697890 728755 439487 472107 491300 67.47 67.69 67.42 5.64 5.51 5.49 26.88 26.80 26.80 0.12
65531 68605 72668 44486 45053 45513 67.89 65.67 62.63 4.42 3.86 3.92 27.70 30.47 31.02 1.58272923 381018 494297a 250461 313492 414724a 91.77 82.28 83.90 5.43 1.35 0.78 2.80 16.37 11.22 0.84
5789898 5816673 6403234 3969586 3953790 4197447 68.56 68.01 65.55 9.97 8.83 8.40 21.45 23.08 22.91 2.24
% Teachers inUnaided Schools*
% Teachers inGovernment Schools*
% Teachers inAided Schools*
2008-09 2009-10 2010-11 2008-09 2009-10 2010-11 2008-09 2009-10 2010-11 2008-09 2009-10 2010-11 2008-09 2009-10 2010-11 2010-11
Number of Teachers(All Schools)
Number of Teachers availablein Government Schools
a : Including SSK etc. institutions.b : Excluding AIE centres.c : Clarification from state is awaited.@ : State does not have such school type.
% Teachersin Un-
recognisedSchools
* : Total may not add to hundred because of missing values and rounding of figures.** : Excluding AIE centres. State has closed down 8772 AIE Centres & 6476 Venture schools.# : Including teachers teaching Grade VIII as a part of Secondary level has also been considered.
DISE 2010-11: Flash Statistics 13
State/UT
2008-09 2009-10 2010-11 2008-09 2009-10 2010-11 2008-09 2009-10 2010-11 2008-09 2009-10 2010-11 2008-09 2009-10 2010-11 2010-11
A & N IslandsAndhra PradeshArunachal Pradesh
AssamBiharChandigarhChhattisgarh
Dadra & Nagar HaveliDaman & DiuDelhiGoaGujarat
HaryanaHimachal PradeshJammu & KashmirJharkhand
KarnatakaKeralaLakshadweepMadhya Pradesh
MaharashtraManipurMeghalayaMizoram
NagalandOdishaPuducherryPunjab
RajasthanSikkimTamil NaduTripura
Uttar PradeshUttarakhandWest Bengal
All States
10.7 12.6 13.0 4.8 4.8 4.8 10.5 13.2 13.8 32.5 35.5 26.7 11.0 9.1 9.4 -5.0 4.9 5.3 3.0 2.9 3.1 4.0 3.9 4.4 5.3 5.2 5.1 9.4 8.8 8.7 7.13.8 3.9 4.2 2.0 1.9 2.0 3.4 3.4 3.6 11.7 11.2 10.8 10.3 9.8 9.9 8.03.8 4.2 4.2 2.4 2.9 2.5 3.3 3.7 3.8 7.1 6.5 7.4 8.2 7.7 8.5 2.9
5.0 4.9 5.0 3.8 3.5 3.4 5.0 4.9 5.0 12.8 10.4 5.8 3.3 7.6 5.3 7.732.6 28.0 33.6 14.8 13.4 12.9 31.6 26.5 32.2 21.1 15.6 42.8 35.7 32.4 35.5 2.53.5 3.4 3.7 2.8 2.9 3.1 3.1 3.1 3.4 4.7 4.6 5.0 7.4 6.8 7.2 -4.6 4.9 4.9 2.1 1.9 1.9 4.3 4.4 4.2 4.0 4.2 4.5 22.1 17.1 20.5 -
7.5 7.9 8.0 5.8 5.3 5.6 6.3 5.9 5.9 16.0 24.8 30.0 16.6 16.2 12.5 -18.4 19.4 15.0 10.4 10.9 10.6 18.4 18.9 14.8 16.3 15.6 10.9 18.7 19.9 15.5 -5.4 5.2 5.2 2.5 2.7 2.5 3.2 3.0 3.0 11.4 10.7 10.8 6.9 10.9 9.5 -6.1 6.1 6.4 3.0 2.9 2.9 5.6 5.6 5.9 7.2 7.0 6.5 9.1 8.9 8.8 -
6.1 5.9 6.4 4.2 4.0 3.9 5.5 5.2 5.2 9.2 9.6 9.1 9.0 9.1 9.7 4.63.7 3.7 3.7 2.6 2.7 2.6 3.2 3.3 3.2 6.8 6.9 7.4 6.4 6.5 6.8 -4.9 4.8 5.5 2.4 2.3 2.4 3.8 3.7 4.4 10.8 ** ** 9.8 9.5 10.5 -3.6 3.5 3.7 2.2 2.1 2.1 3.4 3.4 3.3 6.4 5.6 5.9 9.3 8.4 9.5 6.5
4.6 4.8 5.0 2.3 2.3 2.3 4.1 4.1 4.2 5.8 6.3 6.5 7.1 7.8 8.3 6.810.8 11.0 12.6 6.4 6.4 6.5 9.6 10.0 11.0 11.3 11.5 13.0 14.9 15.5 18.0 4.517.1 16.9 15.8 12.5 11.2 10.9 17.1 16.9 15.9 ** ** ** ** ** ** **3.3 3.3 3.2 2.6 2.5 2.5 2.6 2.5 2.4 5.5 4.5 4.2 6.9 7.0 7.0 12.0
6.3 5.7 5.5 3.1 3.0 3.0 4.5 4.3 4.2 11.8 9.7 9.3 8.8 7.7 7.4 5.06.1 6.0 7.0 3.1 3.1 4.4 4.8 4.6 5.9 2.9 3.3 3.0 12.4 12.0 12.9 3.33.4 3.2 3.3 2.5 2.6 2.5 2.9 2.7 2.9 3.5 3.4 3.7 4.3 4.0 4.0 7.56.1 5.6 5.6 5.1 4.3 4.2 5.6 5.2 5.1 9.3 7.5 7.0 8.5 8.0 8.0 2.7
8.3 7.8 7.2 6.1 5.6 5.0 7.1 6.4 5.7 - 17.0 0.0 11.4 12.0 11.4 -4.0 3.2 3.8 2.6 2.4 2.4 3.7 3.1 3.4 5.3 2.4 5.5 7.5 7.2 8.2 4.8
14.8 15.7 16.5 6.1 6.5 6.0 12.5 12.0 12.6 24.9 29.2 29.6 17.9 20.9 21.7 -4.7 4.5 6.6 3.0 3.2 3.2 4.2 3.9 5.2 8.0 6.4 11.2 8.7 7.9 13.5 7.2
4.3 4.3 4.4 2.2 2.2 2.2 3.5 3.5 3.5 6.9 7.5 7.0 7.2 7.2 7.1 7.77.3 8.5 8.7 5.1 5.0 5.0 7.6 8.9 9.1 7.0 10.0 11.3 6.3 6.8 7.1 -6.1 6.1 6.1 3.9 4.0 4.0 4.2 4.2 4.2 7.4 7.0 6.7 11.5 11.7 12.0 3.77.7 6.6 7.3 3.9 3.8 3.8 7.4 6.3 7.1 16.3 11.3 11.5 13.9 13.2 12.4 6.4
3.5 3.6 3.6 3.5 3.7 3.7 3.1 3.2 3.2 4.7 5.0 5.0 4.5 4.6 4.7 4.03.0 3.1 3.2 2.4 2.5 2.5 2.6 2.6 2.6 4.9 5.0 5.2 4.9 4.9 5.0 4.33.9 4.3 5.5 2.8 3.4 3.8 4.4 4.1 5.3 9.2 6.9 6.5 0.7 5.9 6.8 6.64.5 4.5 4.7 3.0 3.1 3.1 3.8 3.8 4.0 7.9 7.2 7.6 7.0 7.3 7.6 5.4
All Schools All Unaided Schools
Average Number of Teachers per School
z May not present complete coverage of such schools/madarsas.** State does not have such school type.
Primary Schools All Government Schools All Aided Schools All UnrecognisedSchoolsz
Average Number of Teachers per School
14 Elementary Education in India
State/UT
2008-09 2009-10 2010-11 2009-10 2010-11 2009-10 2010-11 2009-10 2010-11 2010-11 2008-09 2009-10 2010-11 2008-09 2009-10 2010-11
A & N IslandsAndhra PradeshArunachal PradeshAssamBiharChandigarhChhattisgarhDadra & Nagar HaveliDaman & DiuDelhiGoaGujaratHaryanaHimachal PradeshJammu & KashmirJharkhandKarnatakaKeralaLakshadweepMadhya PradeshMaharashtraManipurMeghalayaMizoramNagalandOdishaPuducherryPunjabRajasthanSikkimTamil NaduTripuraUttar PradeshUttarakhandWest Bengal
All States
@ State does not have such school type.NR Data not reported.
15 11 10 11 10 22 19 13 12 - 15 12 12 16 12 1021 22 20 20 18 30 28 23 23 17 24 25 23 19 18 1719 19 18 19 18 20 20 17 17 9 19 19 19 19 19 1822 23 21 25 25 16 14 17 16 22 26 25 26 18 20 1755 57 58 57 58 66 50 44 46 5 55 57 58 59 61 6225 29 24 33 28 27 14 22 19 3 25 29 25 24 29 2426 26 24 27 24 30 32 24 23 12 29 28 25 22 24 2336 36 40 37 43 33 36 33 31 - 36 37 41 38 38 4334 31 30 30 30 41 36 30 28 - 33 33 31 35 30 2829 28 36 32 40 26 36 23 30 - 30 29 35 25 25 3421 24 24 17 17 29 29 24 25 - 21 25 25 22 25 2432 32 31 31 30 39 42 34 36 - 32 32 31 33 33 3228 30 26 29 27 34 26 33 26 19 32 37 30 23 26 2217 16 16 16 15 25 26 17 18 - 18 17 17 17 17 1715 16 13 16 12 @ @ 16 15 - 16 16 14 15 16 1343 44 41 43 41 50 44 51 40 37 45 45 43 44 47 4329 27 26 25 24 43 41 30 28 38 29 28 26 32 30 2825 24 21 23 20 25 22 25 23 15 24 24 22 27 26 2116 14 14 14 14 @ @ @ @ @ 18 17 16 15 13 1436 35 35 37 40 38 38 31 28 6 37 35 34 32 33 3427 30 30 26 26 35 36 33 34 23 27 30 30 30 30 3119 20 19 17 13 24 27 23 25 17 19 21 19 19 20 2115 16 16 17 15 16 18 16 17 14 16 17 18 14 15 1414 15 14 14 13 14 16 17 19 15 15 17 17 14 14 1319 19 20 14 16 15 NR 27 27 0 20 20 22 24 23 2227 33 26 34 29 35 13 25 18 17 31 32 31 26 37 2618 17 16 15 13 27 26 17 17 - 21 18 18 18 17 1627 28 19 26 20 49 28 32 21 15 32 31 22 25 28 1727 27 26 27 26 28 26 26 26 19 28 27 27 27 26 2615 12 12 13 13 15 12 10 10 - 15 12 12 19 14 1430 30 29 30 28 40 41 26 26 12 29 29 28 33 34 3323 24 19 23 19 35 34 29 22 - 23 24 19 24 26 2150 45 44 42 40 50 51 52 52 49 52 47 46 45 44 4424 23 23 22 21 31 28 24 26 15 27 25 25 23 23 2247 39 30 43 32 69 24 21 17 12 44 34 28 57 51 32
32 32 30 33 31 33 31 30 29 19 34 33 32 31 31 29
All Schools All GovernmentSchools
Pupil-Teacher Ratio
All AidedSchools
All UnaidedSchools
AllUnrecognised
Schools
Primary Level Upper Primary Level

DISE 2010-11: Flash Statistics 15
State/UT
A & N IslandsAndhra PradeshArunachal PradeshAssamBiharChandigarhChhattisgarhDadra & Nagar HaveliDaman & DiuDelhiGoaGujaratHaryanaHimachal PradeshJammu & KashmirJharkhandKarnatakaKeralaLakshadweepMadhya PradeshMaharashtraManipurMeghalayaMizoramNagalandOdishaPuducherryPunjabRajasthanSikkimTamil NaduTripuraUttar PradeshUttarakhandWest Bengal
All States
0 0 1.06 0.37 0.00 0.00 0.55 0.56 0.00 0.00 59.19 58.15 58.70 11 0.29 24 0.49 29 0.55
0 0 23.08 17.33 10.46 6.32 20.66 14.06 8.80 2.55 45.43 45.70 46.89 65340 12.86 66529 13.26 82393 14.38
0 0 17.57 18.32 13.19 13.29 17.46 18.47 12.74 13.22 37.24 37.78 37.58 237 1.37 288 1.60 296 1.61
3 2 38.99 40.89 15.15 11.28 41.67 45.51 23.03 18.88 30.55 30.89 30.68 14789 5.66 12662 5.61 15133 5.59
37 38 87.67 88.44 86.93 88.37 85.85 85.90 86.84 89.11 37.11 37.55 38.53 50532 14.93 50141 15.06 51918 15.06
0 0 44.19 25.00 24.53 13.69 100.00 84.62 35.16 22.00 80.88 83.28 82.57 471 8.17 406 8.25 389 6.30
1 0 35.79 29.08 20.96 18.13 37.60 34.04 19.95 22.53 34.83 35.84 37.27 23161 13.44 22476 13.08 24679 12.96
1 1 64.29 65.42 58.06 67.20 58.64 58.02 57.80 70.00 56.95 56.90 58.64 71 4.97 75 5.20 80 5.45
2 1 49.23 42.67 30.51 24.53 50.00 48.94 22.22 15.79 65.21 67.54 70.91 49 6.56 61 7.28 65 7.39
3 8 50.92 68.56 13.49 39.23 76.82 86.30 14.06 54.20 71.81 72.18 73.48 8759 9.66 9191 9.71 7471 9.89
0 0 12.37 13.89 21.79 20.71 2.47 2.69 6.38 4.97 76.90 77.97 77.41 107 1.27 94 1.26 95 1.23
19 12 44.98 39.99 32.25 26.28 25.93 23.44 29.75 21.54 53.90 54.55 54.43 24785 10.41 24850 10.21 26294 10.10
6 1 58.67 49.46 20.67 14.74 65.21 62.82 13.81 8.46 47.39 46.61 49.42 12217 10.51 11953 10.85 14087 10.60
0 0 6.99 6.45 6.96 6.84 5.86 4.90 4.79 4.28 42.71 42.98 43.55 9227 14.56 9731 15.05 9754 15.16
0 0 12.73 8.61 7.88 4.89 14.29 9.02 7.94 4.63 43.24 44.21 43.49 6054 4.87 6085 4.90 7195 4.81
24 24 69.81 66.80 67.28 61.86 64.40 61.46 68.94 64.97 28.07 27.71 29.22 12690 8.34 12459 8.43 13016 7.81
11 3 26.05 22.76 26.01 21.84 9.34 8.04 18.21 13.98 54.64 55.14 56.37 34971 13.09 36249 12.99 39007 13.09
1 0 16.22 13.31 16.34 8.00 10.17 8.30 14.50 6.67 73.72 73.90 74.05 5352 4.03 5919 4.31 6779 4.16
0 0 5.71 2.78 0.00 0.00 5.00 4.35 0.00 0.00 38.89 38.06 41.38 1 0.15 3 0.40 5 0.69
36 38 55.69 53.38 38.83 42.73 60.42 58.89 43.03 51.91 38.82 39.23 40.43 57473 13.19 57893 13.13 56879 13.02
16 17 30.71 29.90 25.26 26.33 20.03 18.78 17.68 17.61 43.41 43.58 44.43 66306 11.41 66372 12.45 65871 12.34
0 0 25.95 22.06 17.18 15.92 28.53 19.54 13.88 9.24 43.14 44.29 44.36 891 3.69 869 3.71 931 3.44
0 0 11.50 14.36 5.86 4.53 11.67 13.71 6.32 1.71 51.82 52.34 52.50 643 1.66 561 1.48 559 1.38
0 0 15.89 18.85 4.40 3.67 17.82 21.18 3.81 1.30 43.05 42.54 42.22 177 1.03 161 0.98 127 0.78
0 0 17.64 21.06 18.23 16.98 11.37 15.94 6.56 4.84 43.80 44.72 44.24 692 3.26 727 3.43 624 3.06
22 3 46.46 46.00 47.61 34.62 39.21 39.87 49.97 41.11 34.05 38.29 36.35 29470 11.97 26280 14.44 30077 12.05
0 0 7.35 6.22 4.83 2.16 5.20 5.22 5.59 2.09 64.78 69.54 67.49 1186 11.58 1335 12.30 1384 11.81
9 0 40.60 27.36 22.81 6.22 39.46 41.16 12.05 3.89 64.49 64.98 70.69 18976 18.36 20202 19.42 33558 16.37
6 5 40.33 38.67 25.53 24.05 43.85 43.17 26.44 24.75 30.02 30.14 30.15 65951 14.55 65572 14.29 65318 14.19
0 0 2.81 1.93 3.64 1.83 1.34 1.16 2.35 0.65 45.50 48.66 48.86 314 3.78 372 3.69 402 3.83
16 9 36.89 29.85 40.35 35.22 27.45 20.43 37.97 29.50 74.99 76.65 77.43 44432 13.57 45198 13.69 47048 14.10
0 0 25.07 15.02 26.87 13.76 16.32 10.01 25.82 12.72 25.14 25.19 26.37 4085 13.62 3921 13.88 4674 14.60
69 68 67.60 65.97 50.29 50.07 65.16 62.96 46.43 46.55 37.48 39.11 39.56 92497 14.20 101973 14.61 109278 15.00
3 2 24.76 25.06 16.45 15.88 23.72 22.81 10.46 7.96 46.43 47.15 47.66 7421 11.32 7639 11.13 8277 11.39
19 11 54.26 41.51 63.22 36.66 58.88 44.54 68.53 39.38 33.55 43.07 41.21 53466 19.59 69026 18.12 93117 18.84
304 243 45.76 42.44 34.34 31.32 45.88 42.81 35.43 33.20 43.46 44.83 45.51 712804 12.31 737297 12.68 816809 12.76
Number of Districtswhere PTR is Above
30 : All Schools
2009-10 2010-11 2009-10 2010-11 2009-10 2010-11 2009-10 2010-11 2009-10 2010-11 2008-09 2009-10 2010-11
% Schools withPTR > 30
Primary Level
% Schools withPTR > 35 Upper
Primary Level
% Distribution of FemaleTeachers (All Schools)
% Distribution of SC Teachers to Total Teachers
Number % To Total Number % To Total Number % To TotalTeachers Teachers Teachers
2008-09 2009-10 2010-11
% GovernmentSchools with
PTR > 35 at UpperPrimary Level
% GovernmentSchools withPTR > 30 at
Primary Level
16 Elementary Education in India
State/UT
A & N IslandsAndhra PradeshArunachal PradeshAssamBiharChandigarhChhattisgarhDadra & Nagar HaveliDaman & DiuDelhiGoaGujaratHaryanaHimachal PradeshJammu & Kashmir
JharkhandKarnatakaKeralaLakshadweep
Madhya PradeshMaharashtra
ManipurMeghalayaMizoramNagalandOdishaPuducherryPunjabRajasthanSikkimTamil NaduTripura
Uttar Pradesh
Uttarakhand
West Bengal
All States
% Distribution of ST Teachers to Total Teachers
2008-09 2009-10 2010-11 2008-09 2009-10 2010-11
Number % To Total Number % To Total Number % To Total Number % To Total Number % To Total Number % To TotalTeachers Teachers Teachers Teachers Teachers Teachers
292 7.61 352 7.12 391 7.40 236 6.15 505 10.21 647 12.2533095 6.51 33358 6.65 39022 6.81 195619 38.51 197266 39.31 229507 40.0611685 67.38 12149 67.52 12345 66.99 556 3.21 580 3.22 573 3.1143809 16.77 37689 16.69 45476 16.79 77081 29.51 69569 30.80 79450 29.3413279 3.92 12564 3.77 13503 3.92 153859 45.46 151972 45.66 157721 45.76
15 0.26 10 0.20 11 0.18 299 5.19 255 5.18 246 3.9851158 29.68 51173 29.78 59295 31.13 64479 37.40 64693 37.64 71674 37.63
740 51.82 756 52.46 737 50.20 72 5.04 69 4.79 69 4.7030 4.02 39 4.65 40 4.55 319 42.70 344 41.05 375 42.61
1988 2.19 2657 2.81 2206 2.92 8159 9.00 9291 9.82 8876 11.75159 1.88 140 1.88 172 2.22 593 7.02 595 7.99 590 7.63
35372 14.86 36354 14.94 39676 15.24 65213 27.40 68686 28.23 75742 29.10561 0.48 147 0.13 286 0.22 23120 19.89 23153 21.02 28408 21.38
3910 6.17 3967 6.14 4055 6.30 6626 10.46 6902 10.68 6900 10.7310838 8.72 10969 8.84 12988 8.69 9356 7.53 9598 7.73 10833 7.24
40014 26.30 38649 26.15 41310 24.79 61801 40.61 60618 41.01 63437 38.069709 3.64 12104 4.34 13851 4.65 124097 46.46 134616 48.23 113007 37.933094 2.33 3458 2.52 3544 2.17 55194 41.56 57331 41.79 67051 41.14
656 98.35 716 96.50 701 96.42 4 0.60 11 1.48 5 0.69
63211 14.51 64267 14.57 63959 14.65 134934 30.97 138746 31.46 137749 31.54
38713 6.66 39646 7.43 40484 7.58 193628 33.31 127557 23.92 129547 24.279080 37.56 8718 37.22 11662 43.13 1383 5.72 1422 6.07 1708 6.32
34730 89.71 34286 90.47 36245 89.19 503 1.30 434 1.15 540 1.3316733 96.93 15925 96.83 15872 96.86 105 0.61 96 0.58 112 0.68
17772 83.68 17494 82.62 16866 82.81 429 2.02 477 2.25 565 2.7730629 12.44 27025 14.85 30106 12.06 93356 37.92 64701 35.54 95167 38.13
42 0.41 31 0.29 33 0.28 645 6.30 7279 67.08 8019 68.44690 0.67 412 0.40 957 0.47 11965 11.57 12611 12.12 23592 11.51
40562 8.95 41828 9.12 43447 9.44 168410 37.16 172810 37.67 175694 38.183124 37.58 3973 39.44 3993 38.05 2933 35.28 3948 39.19 4251 40.512418 0.74 3009 0.91 3370 1.01 250966 76.66 253275 76.70 254959 76.39
10141 33.80 10586 37.48 11872 37.10 5128 17.09 4633 16.40 5384 16.824987 0.77 5599 0.80 6516 0.89 242527 37.24 263252 37.72 277290 38.051800 2.75 1828 2.66 1911 2.63 9589 14.63 10221 14.90 10951 15.07
12488 4.58 15699 4.12 21585 4.37 18980 6.95 26908 7.06 36971 7.48
547524 9.46 547577 9.41 598487 9.35 1982164 34.23 1944424 33.43 2077610 32.45
% Distribution of OBC Teachers to Total Teachers
OBC: Other Backward Class.NR: Data not reported.
DISE 2010-11: Flash Statistics 17
State/UT
A & N IslandsAndhra PradeshArunachal PradeshAssamBiharChandigarhChhattisgarhDadra & Nagar HaveliDaman & DiuDelhiGoaGujaratHaryanaHimachal PradeshJammu & KashmirJharkhandKarnatakaKeralaLakshadweepMadhya PradeshMaharashtraManipurMeghalayaMizoramNagalandOdishaPuducherryPunjabRajasthanSikkimTamil NaduTripuraUttar PradeshUttarakhandWest Bengal
All States
97.62 97.34 94.42 94.08 100.00 100.00 90.40 89.70 - 90.79 91.27 95.73 90.23 100.00 100.00 72.73 92.55 -94.60 94.95 97.41 97.63 98.28 98.43 87.23 89.19 72.43 47.12 64.58 45.65 57.62 75.94 82.98 50.86 79.09 65.9326.30 23.45 76.61 75.80 48.21 45.45 25.13 26.78 - 7.48 18.56 5.76 11.97 44.71 33.16 8.92 16.34 -46.66 34.46 86.72 29.49 9.98 4.82 11.79 6.02 3.19 12.90 12.51 12.87 12.94 12.15 5.77 15.44 7.55 7.7649.50 48.78 92.79 92.18 97.26 89.60 32.65 39.02 42.11 34.36 37.85 34.34 37.82 100.00 50.00 100.00 36.49 -98.82 72.88 94.66 94.42 100.00 61.76 98.28 72.28 - 99.61 99.89 99.59 100.00 100.00 90.91 100.00 100.00 -62.37 61.78 96.88 95.54 55.45 58.27 32.01 29.82 22.22 55.10 43.77 58.16 56.60 45.26 38.58 19.12 15.06 2.5696.11 93.62 99.33 99.55 100.00 93.88 72.68 62.22 - 100.00 76.39 100.00 100.00 100.00 100.00 100.00 59.52 -90.48 91.00 97.04 99.24 79.45 76.56 73.76 79.67 - 60.00 85.53 100.00 100.00 38.46 38.46 55.56 76.19 -
100.00 100.00 94.49 95.29 100.00 100.00 100.00 100.00 - 100.00 100.00 100.00 100.00 100.00 100.00 100.00 100.00 -96.70 97.09 95.48 97.49 98.37 98.07 73.22 77.09 - 84.13 87.20 81.82 97.22 94.12 95.80 50.00 60.81 -96.83 96.80 93.69 93.92 95.24 96.30 86.49 87.43 - 93.88 94.83 98.72 99.02 93.91 93.75 90.77 87.70 -91.59 92.69 97.83 96.57 84.67 90.51 78.51 84.40 66.15 98.05 91.08 99.04 99.02 58.18 78.55 64.15 82.69 67.1294.81 95.65 98.74 93.38 99.53 98.90 83.10 86.22 - 78.98 83.06 79.26 83.90 100.00 100.00 75.86 78.76 -50.19 49.97 95.04 95.16 ** ** 34.38 36.49 - 29.07 34.86 29.03 37.27 ** ** 31.41 30.20 -84.25 76.75 86.60 78.27 76.45 79.85 42.48 48.46 30.75 41.83 46.17 41.85 46.42 45.61 42.64 32.71 41.50 27.45
95.84 97.49 98.37 98.36 96.40 98.47 88.69 92.89 77.78 90.54 94.67 96.56 99.19 94.39 99.02 77.80 87.64 -97.20 96.37 92.27 94.49 98.12 97.72 91.75 88.72 91.76 96.52 96.73 97.41 97.99 96.46 96.80 93.07 91.94 83.3397.97 98.91 84.83 89.45 ** ** ** ** ** 100.00 98.77 100.00 100.00 ** ** ** 0.00 -71.61 65.38 53.41 98.91 64.42 64.21 41.22 36.05 20.00 39.86 33.58 61.63 59.15 30.51 58.46 30.17 31.40 -99.15 99.24 99.86 99.59 98.98 99.67 97.91 96.68 90.29 90.24 87.03 87.21 84.14 98.14 97.34 94.99 88.72 -39.23 35.29 95.30 84.57 51.88 54.85 20.95 20.93 16.01 21.08 26.81 25.23 30.49 13.84 17.49 25.11 27.74 18.4230.96 32.39 82.69 60.06 27.39 39.70 18.11 15.87 20.37 15.15 10.65 23.75 8.66 16.06 16.17 8.16 7.07 4.3570.24 63.82 94.97 94.48 31.19 33.33 21.47 15.98 - 18.65 18.95 29.77 27.49 20.11 10.95 6.55 5.71 -26.46 29.89 71.94 61.77 5.88 NR 17.21 20.38 - 31.11 28.96 34.37 33.14 100.00 100.00 27.38 22.76 -89.07 82.82 98.83 96.48 88.84 85.80 46.25 53.84 49.14 56.21 28.19 56.22 27.05 61.09 59.93 52.74 49.19 42.8697.69 95.84 93.18 95.27 99.58 99.68 96.54 92.30 - 91.94 96.36 98.39 98.29 100.00 100.00 81.01 89.80 -
100.00 91.18 93.60 95.49 100.00 98.51 100.00 87.22 70.50 100.00 74.04 100.00 94.23 100.00 84.80 100.00 85.56 56.6886.02 87.07 98.66 98.37 78.35 81.56 73.00 74.64 50.13 79.06 76.64 83.33 81.75 60.87 61.83 59.92 62.17 72.9243.93 67.54 87.13 61.58 38.13 55.58 19.25 55.33 - 36.62 34.31 35.71 34.55 40.00 20.00 40.00 35.37 -96.06 96.92 94.99 96.97 99.36 99.74 90.44 92.35 89.18 87.59 90.75 95.89 89.57 90.85 98.38 84.35 90.56 85.5446.27 43.53 91.88 86.19 34.39 32.97 18.23 18.50 - 36.19 26.74 38.81 27.36 40.00 0.00 24.77 20.13 -83.95 83.26 98.82 98.52 79.87 80.88 67.33 65.99 57.51 34.00 34.26 33.72 33.97 57.44 54.04 49.12 46.72 33.3384.39 84.04 98.14 96.66 93.69 93.23 55.45 57.30 47.15 42.93 39.70 42.32 37.17 82.11 74.39 41.81 43.46 41.6753.21 52.66 98.07 84.40 78.66 33.40 16.55 20.11 16.50 19.14 19.99 18.97 19.92 35.80 27.66 16.94 24.56 17.24
81.01 78.66 85.27 82.78 84.56 84.60 68.79 69.10 44.61 44.64 49.37 44.12 45.22 63.78 69.63 48.00 64.73 57.11
% Distribution of Professionally Trained Contractual-TeachersPercentage Distribution of Professionally Trained Regular Teachers
2009-10 2010-11 2009-10 2010-11 2009-10 2010-11 2009-10 2010-11 2010-11 2009-10 2010-11 2009-10 2010-11 2009-10 2010-11 2009-10 2010-11 2010-11
All Schools* GovernmentManagements
Private AidedManagements
Private UnaidedManagements
UnrecognisedSchools
All Schools* All GovernmentSchools
All AidedSchools
All UnaidedSchools
UnrecognisedSchools
* : Including Teachers in unrecognised schools and madrasas.**: State does not have such school type.
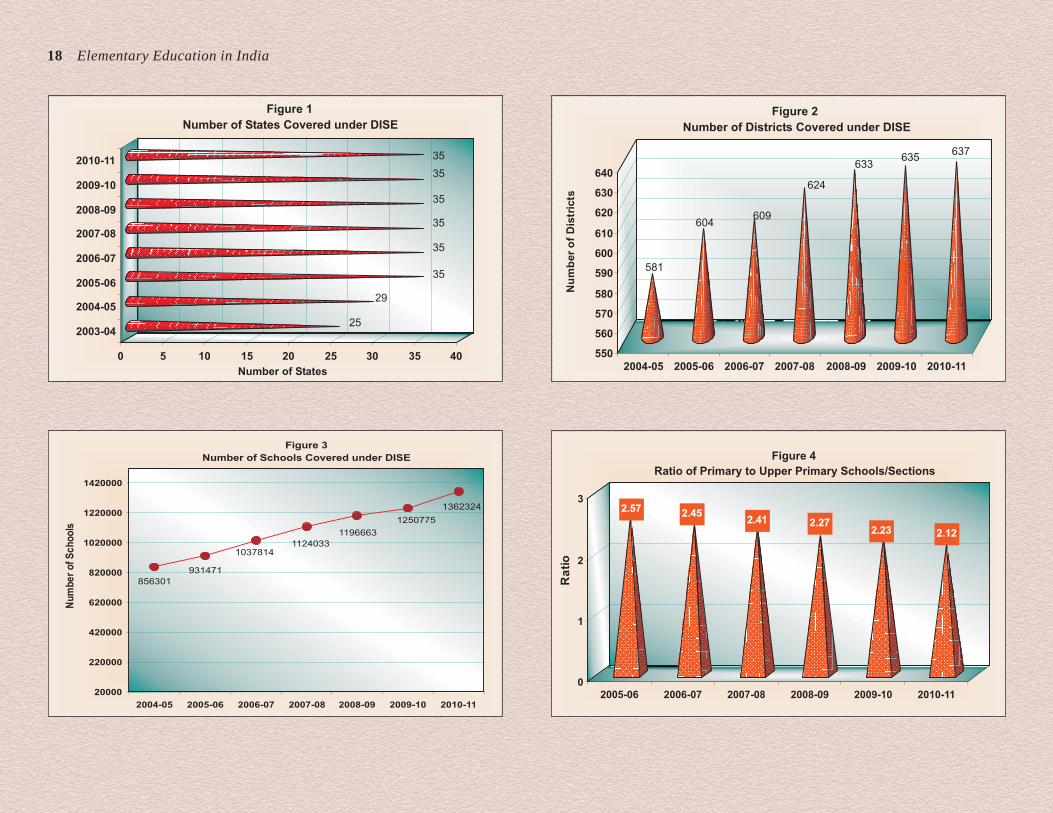
18 Elementary Education in India
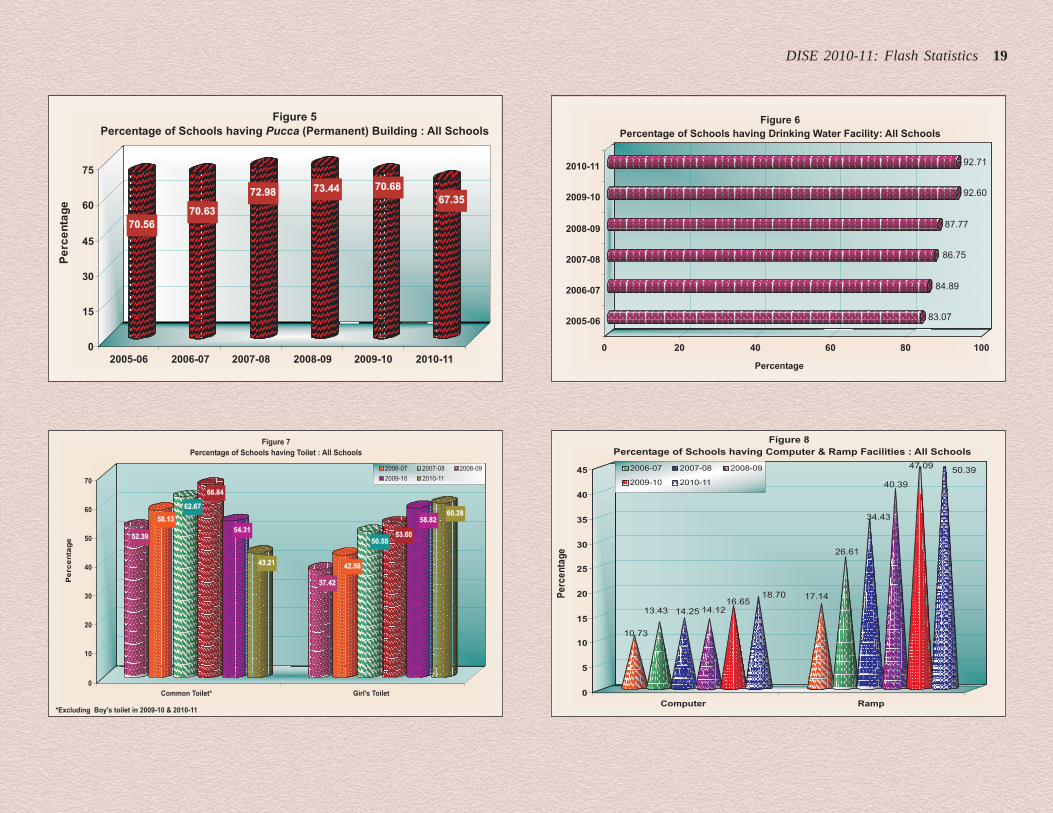
DISE 2010-11: Flash Statistics 19
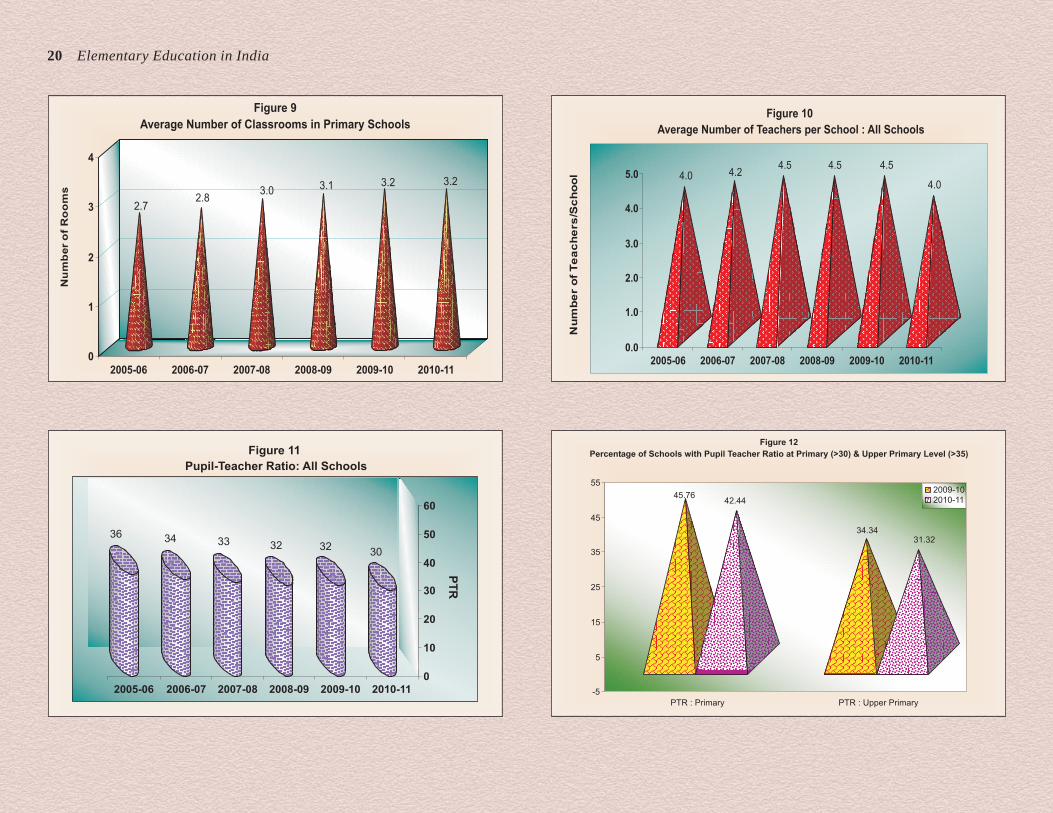
20 Elementary Education in India
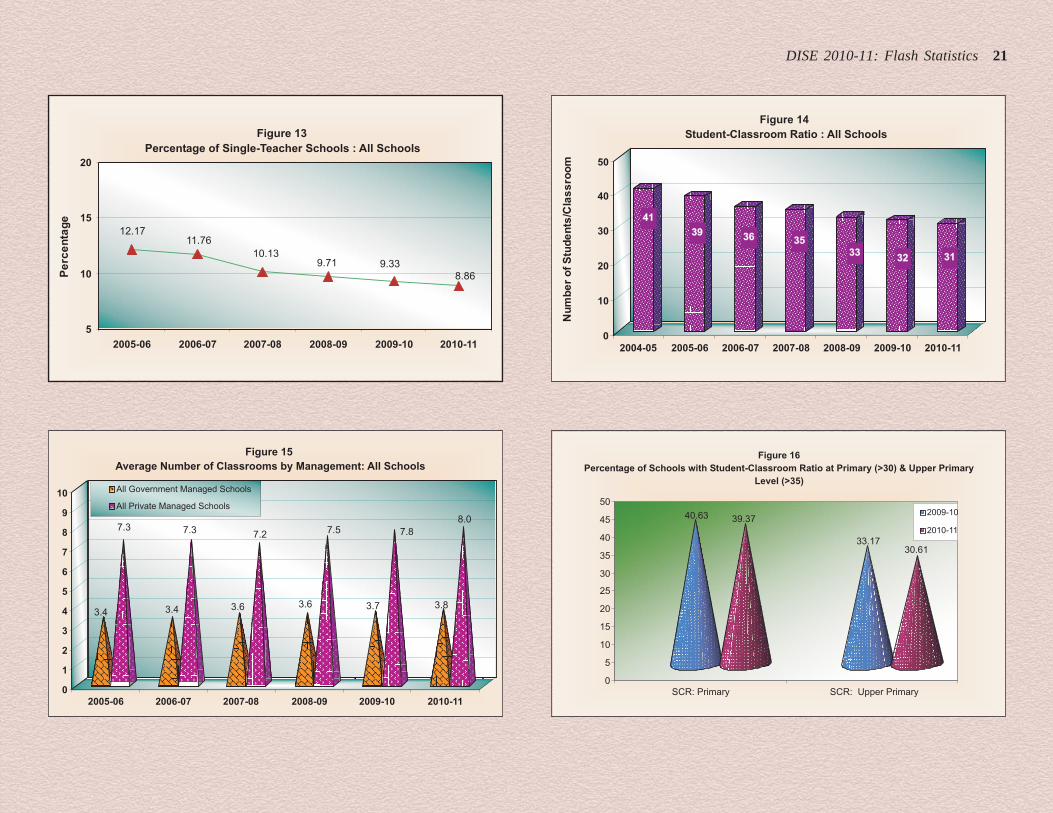
DISE 2010-11: Flash Statistics 21
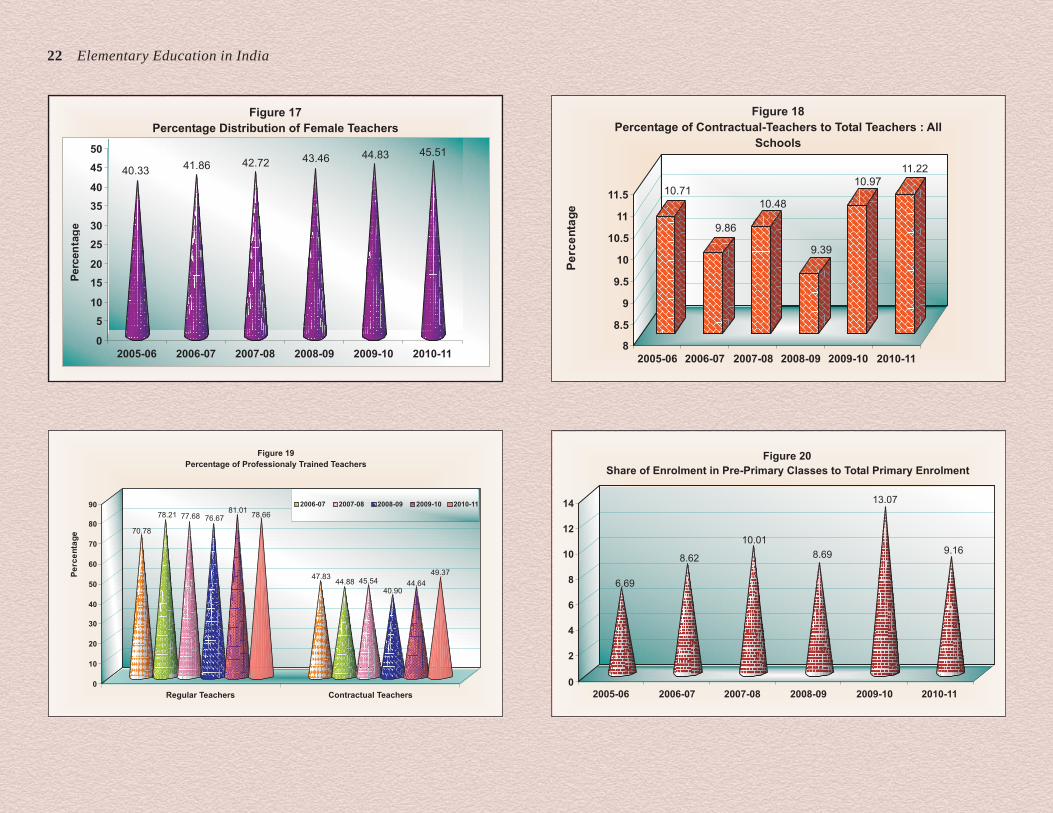
22 Elementary Education in India
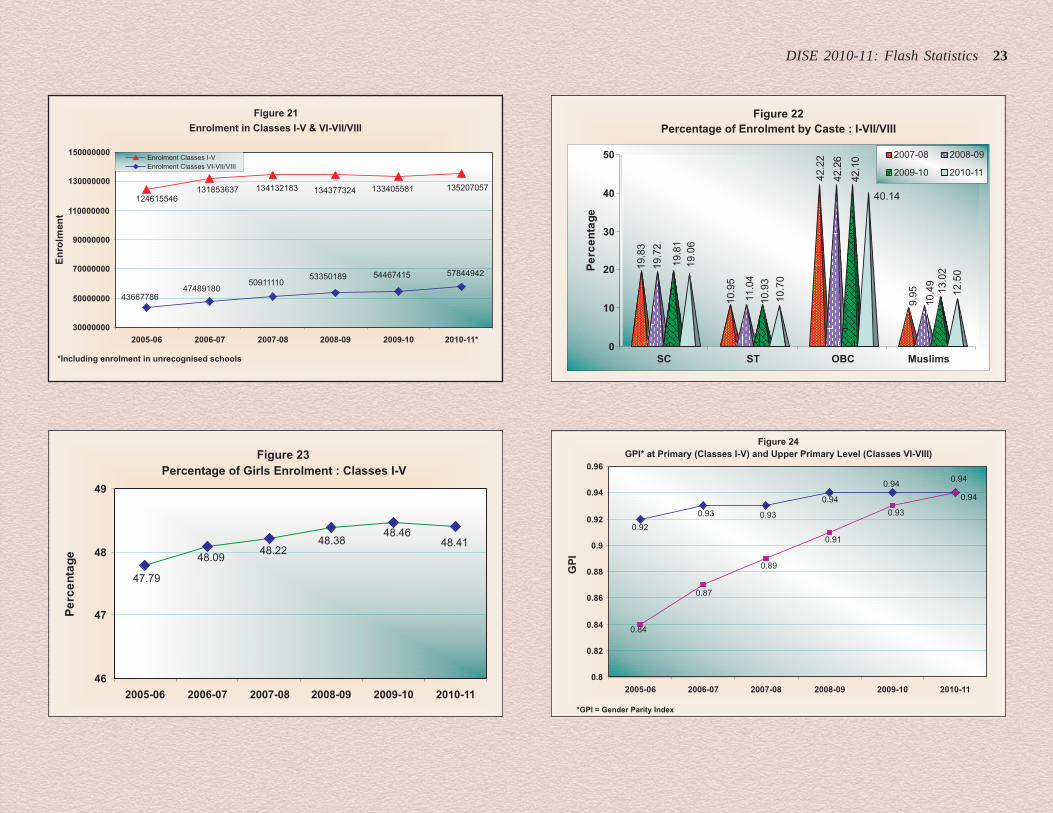
DISE 2010-11: Flash Statistics 23
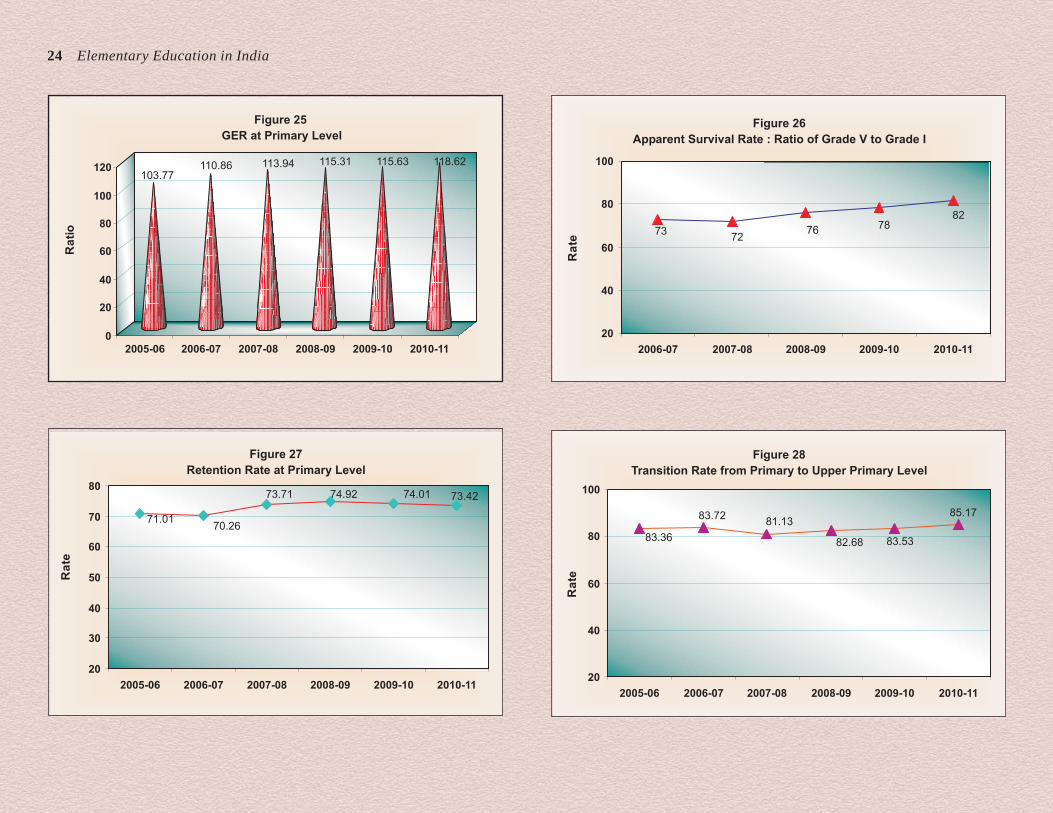
24 Elementary Education in India
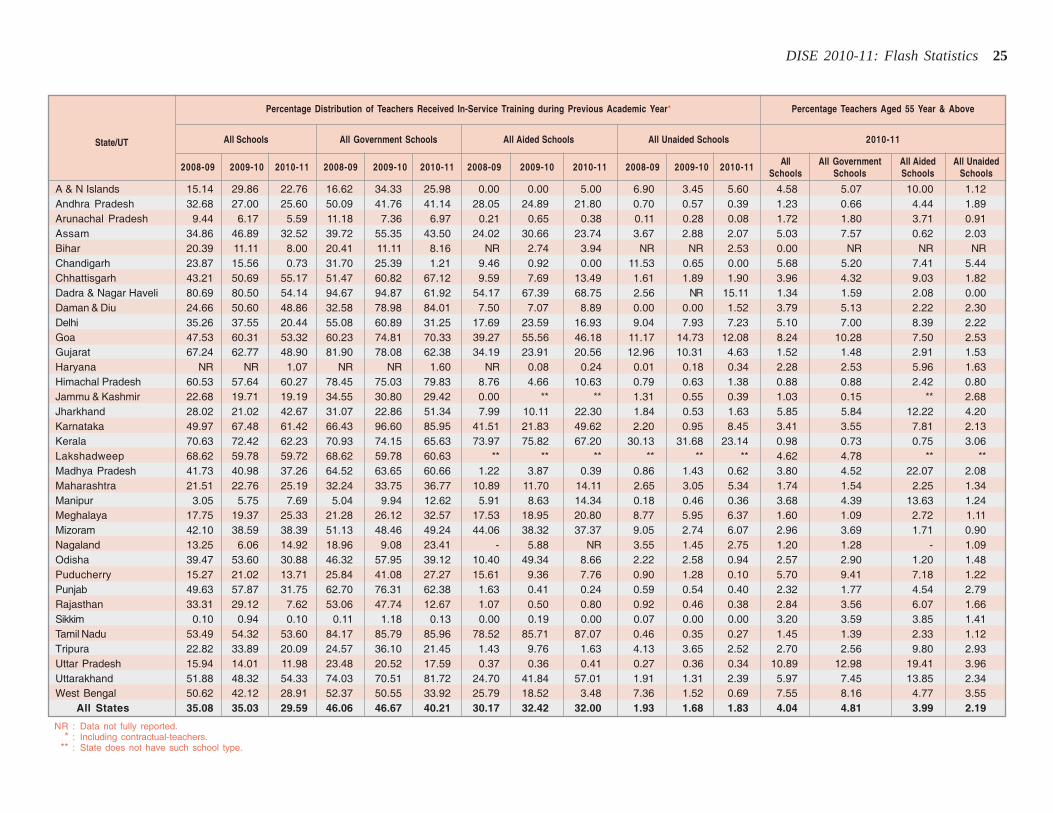
DISE 2010-11: Flash Statistics 25
State/UT
A & N IslandsAndhra PradeshArunachal PradeshAssamBiharChandigarhChhattisgarhDadra & Nagar HaveliDaman & DiuDelhiGoaGujaratHaryanaHimachal PradeshJammu & KashmirJharkhandKarnatakaKeralaLakshadweepMadhya PradeshMaharashtraManipurMeghalayaMizoramNagalandOdishaPuducherryPunjabRajasthanSikkimTamil NaduTripuraUttar PradeshUttarakhandWest Bengal
All States
15.14 29.86 22.76 16.62 34.33 25.98 0.00 0.00 5.00 6.90 3.45 5.60 4.58 5.07 10.00 1.1232.68 27.00 25.60 50.09 41.76 41.14 28.05 24.89 21.80 0.70 0.57 0.39 1.23 0.66 4.44 1.89
9.44 6.17 5.59 11.18 7.36 6.97 0.21 0.65 0.38 0.11 0.28 0.08 1.72 1.80 3.71 0.9134.86 46.89 32.52 39.72 55.35 43.50 24.02 30.66 23.74 3.67 2.88 2.07 5.03 7.57 0.62 2.0320.39 11.11 8.00 20.41 11.11 8.16 NR 2.74 3.94 NR NR 2.53 0.00 NR NR NR23.87 15.56 0.73 31.70 25.39 1.21 9.46 0.92 0.00 11.53 0.65 0.00 5.68 5.20 7.41 5.4443.21 50.69 55.17 51.47 60.82 67.12 9.59 7.69 13.49 1.61 1.89 1.90 3.96 4.32 9.03 1.8280.69 80.50 54.14 94.67 94.87 61.92 54.17 67.39 68.75 2.56 NR 15.11 1.34 1.59 2.08 0.0024.66 50.60 48.86 32.58 78.98 84.01 7.50 7.07 8.89 0.00 0.00 1.52 3.79 5.13 2.22 2.3035.26 37.55 20.44 55.08 60.89 31.25 17.69 23.59 16.93 9.04 7.93 7.23 5.10 7.00 8.39 2.2247.53 60.31 53.32 60.23 74.81 70.33 39.27 55.56 46.18 11.17 14.73 12.08 8.24 10.28 7.50 2.5367.24 62.77 48.90 81.90 78.08 62.38 34.19 23.91 20.56 12.96 10.31 4.63 1.52 1.48 2.91 1.53
NR NR 1.07 NR NR 1.60 NR 0.08 0.24 0.01 0.18 0.34 2.28 2.53 5.96 1.6360.53 57.64 60.27 78.45 75.03 79.83 8.76 4.66 10.63 0.79 0.63 1.38 0.88 0.88 2.42 0.8022.68 19.71 19.19 34.55 30.80 29.42 0.00 ** ** 1.31 0.55 0.39 1.03 0.15 ** 2.6828.02 21.02 42.67 31.07 22.86 51.34 7.99 10.11 22.30 1.84 0.53 1.63 5.85 5.84 12.22 4.2049.97 67.48 61.42 66.43 96.60 85.95 41.51 21.83 49.62 2.20 0.95 8.45 3.41 3.55 7.81 2.1370.63 72.42 62.23 70.93 74.15 65.63 73.97 75.82 67.20 30.13 31.68 23.14 0.98 0.73 0.75 3.0668.62 59.78 59.72 68.62 59.78 60.63 ** ** ** ** ** ** 4.62 4.78 ** **41.73 40.98 37.26 64.52 63.65 60.66 1.22 3.87 0.39 0.86 1.43 0.62 3.80 4.52 22.07 2.0821.51 22.76 25.19 32.24 33.75 36.77 10.89 11.70 14.11 2.65 3.05 5.34 1.74 1.54 2.25 1.34
3.05 5.75 7.69 5.04 9.94 12.62 5.91 8.63 14.34 0.18 0.46 0.36 3.68 4.39 13.63 1.2417.75 19.37 25.33 21.28 26.12 32.57 17.53 18.95 20.80 8.77 5.95 6.37 1.60 1.09 2.72 1.1142.10 38.59 38.39 51.13 48.46 49.24 44.06 38.32 37.37 9.05 2.74 6.07 2.96 3.69 1.71 0.9013.25 6.06 14.92 18.96 9.08 23.41 - 5.88 NR 3.55 1.45 2.75 1.20 1.28 - 1.0939.47 53.60 30.88 46.32 57.95 39.12 10.40 49.34 8.66 2.22 2.58 0.94 2.57 2.90 1.20 1.4815.27 21.02 13.71 25.84 41.08 27.27 15.61 9.36 7.76 0.90 1.28 0.10 5.70 9.41 7.18 1.2249.63 57.87 31.75 62.70 76.31 62.38 1.63 0.41 0.24 0.59 0.54 0.40 2.32 1.77 4.54 2.7933.31 29.12 7.62 53.06 47.74 12.67 1.07 0.50 0.80 0.92 0.46 0.38 2.84 3.56 6.07 1.66
0.10 0.94 0.10 0.11 1.18 0.13 0.00 0.19 0.00 0.07 0.00 0.00 3.20 3.59 3.85 1.4153.49 54.32 53.60 84.17 85.79 85.96 78.52 85.71 87.07 0.46 0.35 0.27 1.45 1.39 2.33 1.1222.82 33.89 20.09 24.57 36.10 21.45 1.43 9.76 1.63 4.13 3.65 2.52 2.70 2.56 9.80 2.9315.94 14.01 11.98 23.48 20.52 17.59 0.37 0.36 0.41 0.27 0.36 0.34 10.89 12.98 19.41 3.9651.88 48.32 54.33 74.03 70.51 81.72 24.70 41.84 57.01 1.91 1.31 2.39 5.97 7.45 13.85 2.3450.62 42.12 28.91 52.37 50.55 33.92 25.79 18.52 3.48 7.36 1.52 0.69 7.55 8.16 4.77 3.5535.08 35.03 29.59 46.06 46.67 40.21 30.17 32.42 32.00 1.93 1.68 1.83 4.04 4.81 3.99 2.19
Percentage Distribution of Teachers Received In-Service Training during Previous Academic Year*
2008-09 2009-10 2010-11 2008-09 2009-10 2010-11 2008-09 2009-10 2010-11 2008-09 2009-10 2010-11 All All Government All Aided All UnaidedSchools Schools Schools Schools
All Schools
NR : Data not fully reported.* : Including contractual-teachers.
** : State does not have such school type.
All Government Schools All Aided Schools All Unaided Schools 2010-11
Percentage Teachers Aged 55 Year & Above
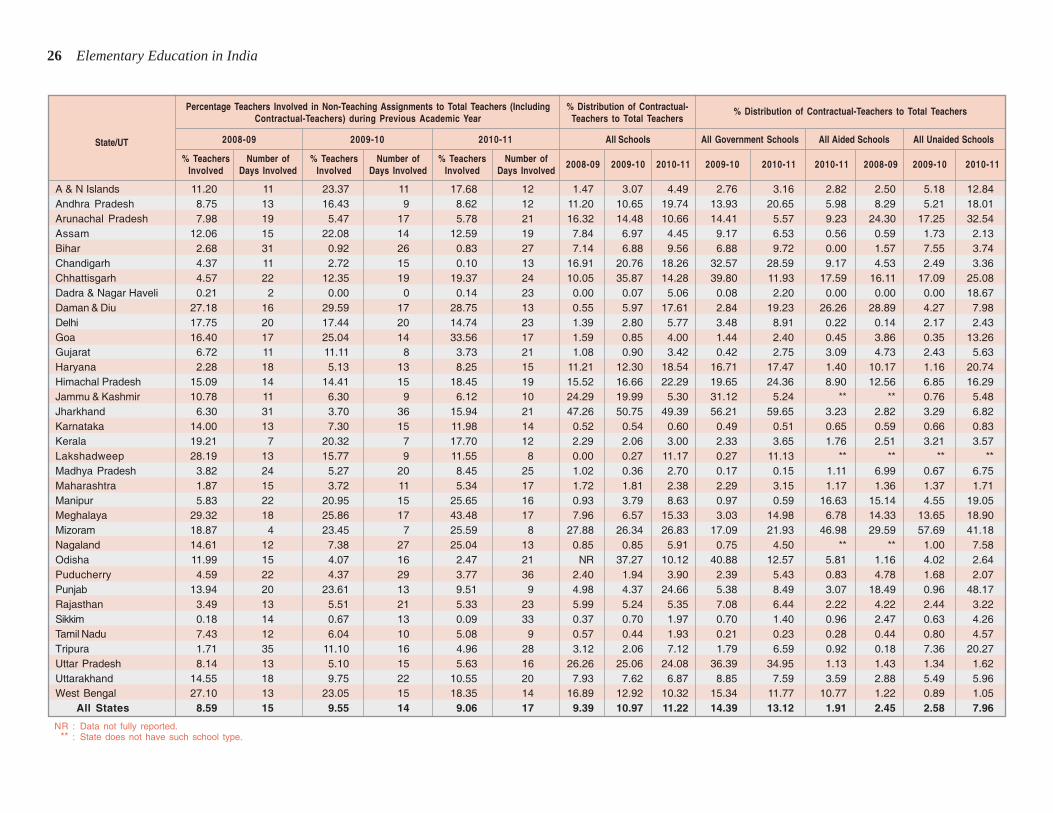
26 Elementary Education in India
State/UT
A & N IslandsAndhra PradeshArunachal PradeshAssamBiharChandigarhChhattisgarhDadra & Nagar HaveliDaman & DiuDelhiGoaGujaratHaryanaHimachal PradeshJammu & KashmirJharkhandKarnatakaKeralaLakshadweepMadhya PradeshMaharashtraManipurMeghalayaMizoramNagalandOdishaPuducherryPunjabRajasthanSikkimTamil NaduTripuraUttar PradeshUttarakhandWest Bengal
All States
11.20 11 23.37 11 17.68 12 1.47 3.07 4.49 2.76 3.16 2.82 2.50 5.18 12.848.75 13 16.43 9 8.62 12 11.20 10.65 19.74 13.93 20.65 5.98 8.29 5.21 18.017.98 19 5.47 17 5.78 21 16.32 14.48 10.66 14.41 5.57 9.23 24.30 17.25 32.54
12.06 15 22.08 14 12.59 19 7.84 6.97 4.45 9.17 6.53 0.56 0.59 1.73 2.132.68 31 0.92 26 0.83 27 7.14 6.88 9.56 6.88 9.72 0.00 1.57 7.55 3.744.37 11 2.72 15 0.10 13 16.91 20.76 18.26 32.57 28.59 9.17 4.53 2.49 3.364.57 22 12.35 19 19.37 24 10.05 35.87 14.28 39.80 11.93 17.59 16.11 17.09 25.080.21 2 0.00 0 0.14 23 0.00 0.07 5.06 0.08 2.20 0.00 0.00 0.00 18.67
27.18 16 29.59 17 28.75 13 0.55 5.97 17.61 2.84 19.23 26.26 28.89 4.27 7.9817.75 20 17.44 20 14.74 23 1.39 2.80 5.77 3.48 8.91 0.22 0.14 2.17 2.4316.40 17 25.04 14 33.56 17 1.59 0.85 4.00 1.44 2.40 0.45 3.86 0.35 13.26
6.72 11 11.11 8 3.73 21 1.08 0.90 3.42 0.42 2.75 3.09 4.73 2.43 5.632.28 18 5.13 13 8.25 15 11.21 12.30 18.54 16.71 17.47 1.40 10.17 1.16 20.74
15.09 14 14.41 15 18.45 19 15.52 16.66 22.29 19.65 24.36 8.90 12.56 6.85 16.2910.78 11 6.30 9 6.12 10 24.29 19.99 5.30 31.12 5.24 ** ** 0.76 5.48
6.30 31 3.70 36 15.94 21 47.26 50.75 49.39 56.21 59.65 3.23 2.82 3.29 6.8214.00 13 7.30 15 11.98 14 0.52 0.54 0.60 0.49 0.51 0.65 0.59 0.66 0.8319.21 7 20.32 7 17.70 12 2.29 2.06 3.00 2.33 3.65 1.76 2.51 3.21 3.5728.19 13 15.77 9 11.55 8 0.00 0.27 11.17 0.27 11.13 ** ** ** **
3.82 24 5.27 20 8.45 25 1.02 0.36 2.70 0.17 0.15 1.11 6.99 0.67 6.751.87 15 3.72 11 5.34 17 1.72 1.81 2.38 2.29 3.15 1.17 1.36 1.37 1.715.83 22 20.95 15 25.65 16 0.93 3.79 8.63 0.97 0.59 16.63 15.14 4.55 19.05
29.32 18 25.86 17 43.48 17 7.96 6.57 15.33 3.03 14.98 6.78 14.33 13.65 18.9018.87 4 23.45 7 25.59 8 27.88 26.34 26.83 17.09 21.93 46.98 29.59 57.69 41.1814.61 12 7.38 27 25.04 13 0.85 0.85 5.91 0.75 4.50 ** ** 1.00 7.5811.99 15 4.07 16 2.47 21 NR 37.27 10.12 40.88 12.57 5.81 1.16 4.02 2.644.59 22 4.37 29 3.77 36 2.40 1.94 3.90 2.39 5.43 0.83 4.78 1.68 2.07
13.94 20 23.61 13 9.51 9 4.98 4.37 24.66 5.38 8.49 3.07 18.49 0.96 48.173.49 13 5.51 21 5.33 23 5.99 5.24 5.35 7.08 6.44 2.22 4.22 2.44 3.220.18 14 0.67 13 0.09 33 0.37 0.70 1.97 0.70 1.40 0.96 2.47 0.63 4.267.43 12 6.04 10 5.08 9 0.57 0.44 1.93 0.21 0.23 0.28 0.44 0.80 4.571.71 35 11.10 16 4.96 28 3.12 2.06 7.12 1.79 6.59 0.92 0.18 7.36 20.278.14 13 5.10 15 5.63 16 26.26 25.06 24.08 36.39 34.95 1.13 1.43 1.34 1.62
14.55 18 9.75 22 10.55 20 7.93 7.62 6.87 8.85 7.59 3.59 2.88 5.49 5.9627.10 13 23.05 15 18.35 14 16.89 12.92 10.32 15.34 11.77 10.77 1.22 0.89 1.05
8.59 15 9.55 14 9.06 17 9.39 10.97 11.22 14.39 13.12 1.91 2.45 2.58 7.96
Percentage Teachers Involved in Non-Teaching Assignments to Total Teachers (IncludingContractual-Teachers) during Previous Academic Year
% Teachers Number of % Teachers Number of % Teachers Number of 2008-09 2009-10 2010-11 2009-10 2010-11 2010-11 2008-09 2009-10 2010-11Involved Days Involved Involved Days Involved Involved Days Involved
2008-09
NR : Data not fully reported.** : State does not have such school type.
2009-10 2010-11 All Schools
% Distribution of Contractual-Teachers to Total Teachers
All Government Schools
% Distribution of Contractual-Teachers to Total Teachers
All Aided Schools All Unaided Schools
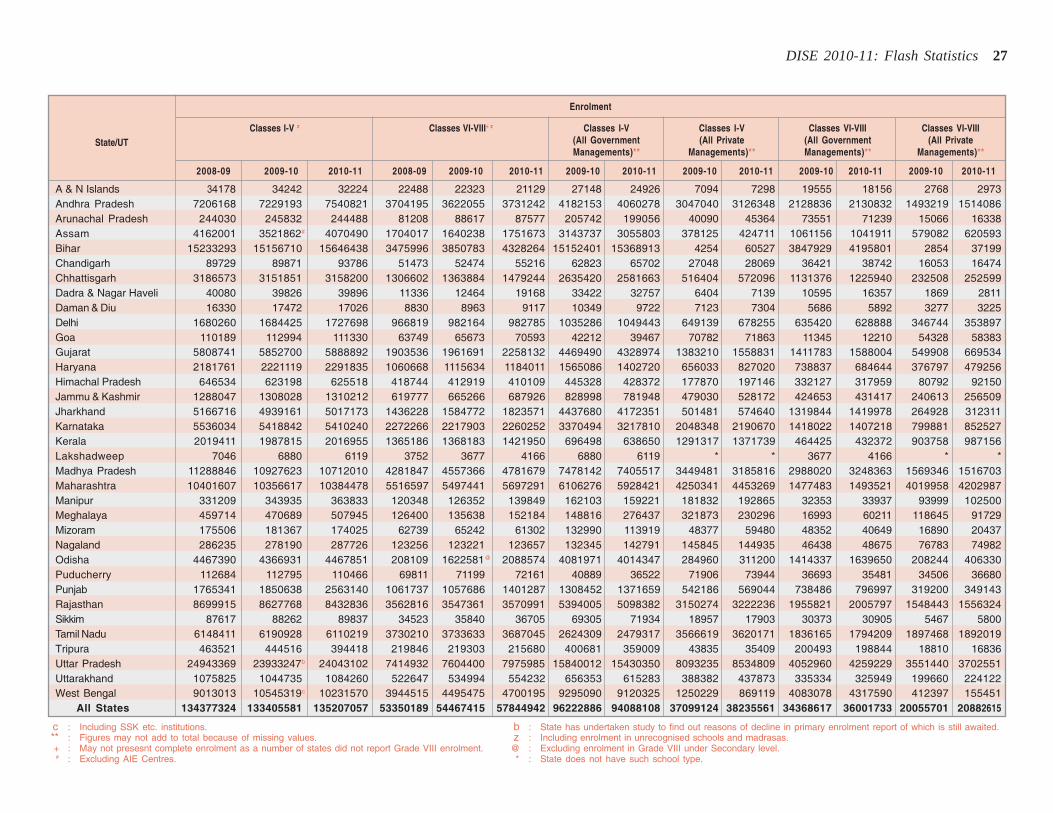
DISE 2010-11: Flash Statistics 27
c : Including SSK etc. institutions.** : Figures may not add to total because of missing values.+ : May not presesnt complete enrolment as a number of states did not report Grade VIII enrolment.# : Excluding AIE Centres.
State/UT
A & N IslandsAndhra PradeshArunachal PradeshAssamBiharChandigarhChhattisgarhDadra & Nagar HaveliDaman & DiuDelhiGoaGujaratHaryanaHimachal PradeshJammu & KashmirJharkhandKarnatakaKeralaLakshadweepMadhya PradeshMaharashtraManipurMeghalayaMizoramNagalandOdishaPuducherryPunjabRajasthanSikkimTamil NaduTripuraUttar PradeshUttarakhandWest Bengal
All States
34178 34242 32224 22488 22323 21129 27148 24926 7094 7298 19555 18156 2768 29737206168 7229193 7540821 3704195 3622055 3731242 4182153 4060278 3047040 3126348 2128836 2130832 1493219 1514086
244030 245832 244488 81208 88617 87577 205742 199056 40090 45364 73551 71239 15066 163384162001 3521862# 4070490 1704017 1640238 1751673 3143737 3055803 378125 424711 1061156 1041911 579082 620593
15233293 15156710 15646438 3475996 3850783 4328264 15152401 15368913 4254 60527 3847929 4195801 2854 3719989729 89871 93786 51473 52474 55216 62823 65702 27048 28069 36421 38742 16053 16474
3186573 3151851 3158200 1306602 1363884 1479244 2635420 2581663 516404 572096 1131376 1225940 232508 25259940080 39826 39896 11336 12464 19168 33422 32757 6404 7139 10595 16357 1869 281116330 17472 17026 8830 8963 9117 10349 9722 7123 7304 5686 5892 3277 3225
1680260 1684425 1727698 966819 982164 982785 1035286 1049443 649139 678255 635420 628888 346744 353897110189 112994 111330 63749 65673 70593 42212 39467 70782 71863 11345 12210 54328 58383
5808741 5852700 5888892 1903536 1961691 2258132 4469490 4328974 1383210 1558831 1411783 1588004 549908 6695342181761 2221119 2291835 1060668 1115634 1184011 1565086 1402720 656033 827020 738837 684644 376797 479256
646534 623198 625518 418744 412919 410109 445328 428372 177870 197146 332127 317959 80792 921501288047 1308028 1310212 619777 665266 687926 828998 781948 479030 528172 424653 431417 240613 2565095166716 4939161 5017173 1436228 1584772 1823571 4437680 4172351 501481 574640 1319844 1419978 264928 3123115536034 5418842 5410240 2272266 2217903 2260252 3370494 3217810 2048348 2190670 1418022 1407218 799881 8525272019411 1987815 2016955 1365186 1368183 1421950 696498 638650 1291317 1371739 464425 432372 903758 987156
7046 6880 6119 3752 3677 4166 6880 6119 * * 3677 4166 * *11288846 10927623 10712010 4281847 4557366 4781679 7478142 7405517 3449481 3185816 2988020 3248363 1569346 151670310401607 10356617 10384478 5516597 5497441 5697291 6106276 5928421 4250341 4453269 1477483 1493521 4019958 4202987
331209 343935 363833 120348 126352 139849 162103 159221 181832 192865 32353 33937 93999 102500459714 470689 507945 126400 135638 152184 148816 276437 321873 230296 16993 60211 118645 91729175506 181367 174025 62739 65242 61302 132990 113919 48377 59480 48352 40649 16890 20437286235 278190 287726 123256 123221 123657 132345 142791 145845 144935 46438 48675 76783 74982
4467390 4366931 4467851 208109 1622581@ 2088574 4081971 4014347 284960 311200 1414337 1639650 208244 406330112684 112795 110466 69811 71199 72161 40889 36522 71906 73944 36693 35481 34506 36680
1765341 1850638 2563140 1061737 1057686 1401287 1308452 1371659 542186 569044 738486 796997 319200 3491438699915 8627768 8432836 3562816 3547361 3570991 5394005 5098382 3150274 3222236 1955821 2005797 1548443 1556324
87617 88262 89837 34523 35840 36705 69305 71934 18957 17903 30373 30905 5467 58006148411 6190928 6110219 3730210 3733633 3687045 2624309 2479317 3566619 3620171 1836165 1794209 1897468 1892019463521 444516 394418 219846 219303 215680 400681 359009 43835 35409 200493 198844 18810 16836
24943369 23933247b 24043102 7414932 7604400 7975985 15840012 15430350 8093235 8534809 4052960 4259229 3551440 37025511075825 1044735 1084260 522647 534994 554232 656353 615283 388382 437873 335334 325949 199660 2241229013013 10545319c 10231570 3944515 4495475 4700195 9295090 9120325 1250229 869119 4083078 4317590 412397 155451
134377324 133405581 135207057 53350189 54467415 57844942 96222886 94088108 37099124 38235561 34368617 36001733 20055701 20882615
Enrolment
2008-09 2009-10 2010-11 2008-09 2009-10 2010-11 2009-10 2010-11 2009-10 2010-11 2009-10 2010-11 2009-10 2010-11
Classes I-V z Classes VI-VIII+ z Classes I-V(All GovernmentManagements)**
Classes I-V(All Private
Managements)**
Classes VI-VIII(All GovernmentManagements)**
Classes VI-VIII(All Private
Managements)**
b : State has undertaken study to find out reasons of decline in primary enrolment report of which is still awaited.z : Including enrolment in unrecognised schools and madrasas.
@ : Excluding enrolment in Grade VIII under Secondary level.* : State does not have such school type.
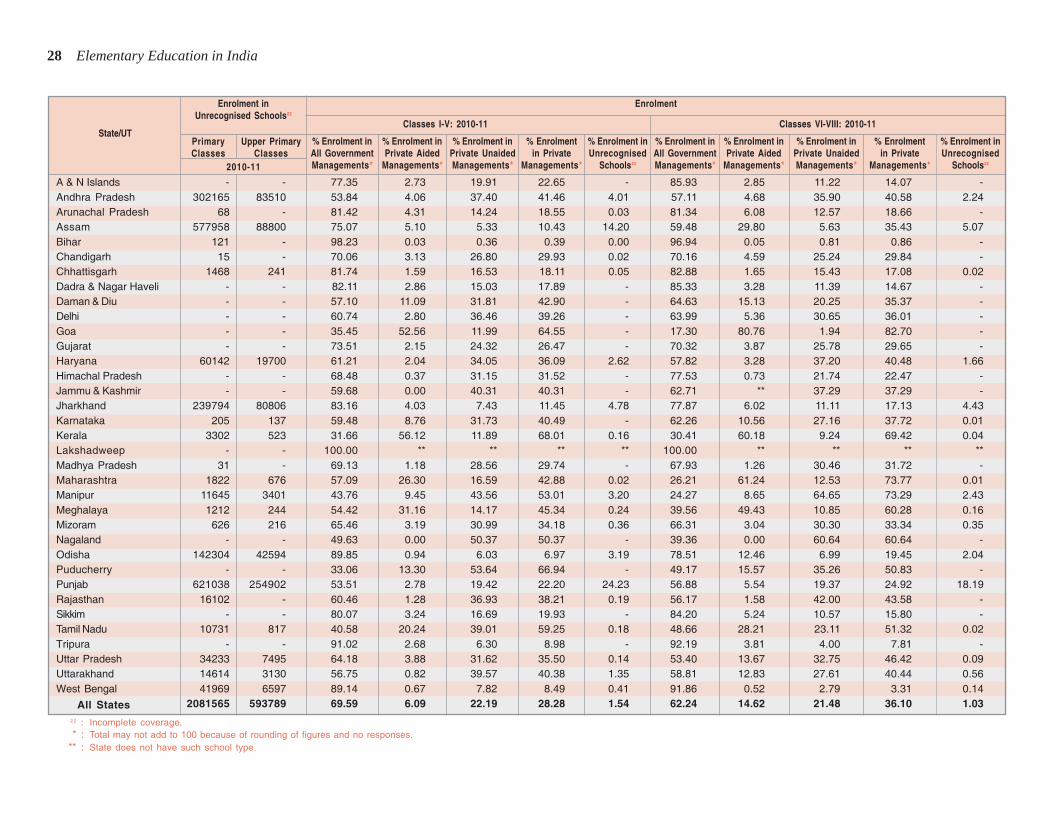
28 Elementary Education in India
State/UT
A & N IslandsAndhra PradeshArunachal PradeshAssamBiharChandigarhChhattisgarhDadra & Nagar HaveliDaman & DiuDelhiGoaGujaratHaryanaHimachal PradeshJammu & KashmirJharkhandKarnatakaKeralaLakshadweepMadhya PradeshMaharashtraManipurMeghalayaMizoramNagalandOdishaPuducherryPunjabRajasthanSikkimTamil NaduTripuraUttar PradeshUttarakhandWest Bengal
All States
- - 77.35 2.73 19.91 22.65 - 85.93 2.85 11.22 14.07 -302165 83510 53.84 4.06 37.40 41.46 4.01 57.11 4.68 35.90 40.58 2.24
68 - 81.42 4.31 14.24 18.55 0.03 81.34 6.08 12.57 18.66 -577958 88800 75.07 5.10 5.33 10.43 14.20 59.48 29.80 5.63 35.43 5.07
121 - 98.23 0.03 0.36 0.39 0.00 96.94 0.05 0.81 0.86 -15 - 70.06 3.13 26.80 29.93 0.02 70.16 4.59 25.24 29.84 -
1468 241 81.74 1.59 16.53 18.11 0.05 82.88 1.65 15.43 17.08 0.02- - 82.11 2.86 15.03 17.89 - 85.33 3.28 11.39 14.67 -- - 57.10 11.09 31.81 42.90 - 64.63 15.13 20.25 35.37 -- - 60.74 2.80 36.46 39.26 - 63.99 5.36 30.65 36.01 -- - 35.45 52.56 11.99 64.55 - 17.30 80.76 1.94 82.70 -- - 73.51 2.15 24.32 26.47 - 70.32 3.87 25.78 29.65 -
60142 19700 61.21 2.04 34.05 36.09 2.62 57.82 3.28 37.20 40.48 1.66- - 68.48 0.37 31.15 31.52 - 77.53 0.73 21.74 22.47 -- - 59.68 0.00 40.31 40.31 - 62.71 ** 37.29 37.29 -
239794 80806 83.16 4.03 7.43 11.45 4.78 77.87 6.02 11.11 17.13 4.43205 137 59.48 8.76 31.73 40.49 - 62.26 10.56 27.16 37.72 0.01
3302 523 31.66 56.12 11.89 68.01 0.16 30.41 60.18 9.24 69.42 0.04- - 100.00 ** ** ** ** 100.00 ** ** ** **
31 - 69.13 1.18 28.56 29.74 - 67.93 1.26 30.46 31.72 -1822 676 57.09 26.30 16.59 42.88 0.02 26.21 61.24 12.53 73.77 0.01
11645 3401 43.76 9.45 43.56 53.01 3.20 24.27 8.65 64.65 73.29 2.431212 244 54.42 31.16 14.17 45.34 0.24 39.56 49.43 10.85 60.28 0.16626 216 65.46 3.19 30.99 34.18 0.36 66.31 3.04 30.30 33.34 0.35
- - 49.63 0.00 50.37 50.37 - 39.36 0.00 60.64 60.64 -142304 42594 89.85 0.94 6.03 6.97 3.19 78.51 12.46 6.99 19.45 2.04
- - 33.06 13.30 53.64 66.94 - 49.17 15.57 35.26 50.83 -621038 254902 53.51 2.78 19.42 22.20 24.23 56.88 5.54 19.37 24.92 18.19
16102 - 60.46 1.28 36.93 38.21 0.19 56.17 1.58 42.00 43.58 -- - 80.07 3.24 16.69 19.93 - 84.20 5.24 10.57 15.80 -
10731 817 40.58 20.24 39.01 59.25 0.18 48.66 28.21 23.11 51.32 0.02- - 91.02 2.68 6.30 8.98 - 92.19 3.81 4.00 7.81 -
34233 7495 64.18 3.88 31.62 35.50 0.14 53.40 13.67 32.75 46.42 0.0914614 3130 56.75 0.82 39.57 40.38 1.35 58.81 12.83 27.61 40.44 0.5641969 6597 89.14 0.67 7.82 8.49 0.41 91.86 0.52 2.79 3.31 0.14
2081565 593789 69.59 6.09 22.19 28.28 1.54 62.24 14.62 21.48 36.10 1.03zz : Incomplete coverage.* : Total may not add to 100 because of rounding of figures and no responses.
** : State does not have such school type.
Enrolment inUnrecognised Schoolszz
2010-11
PrimaryClasses
Upper PrimaryClasses
% Enrolment inAll GovernmentManagements*
% Enrolment inPrivate UnaidedManagements*
% Enrolmentin Private
Managements*
% Enrolment inUnrecognised
Schoolszz
% Enrolment inAll GovernmentManagements*
% Enrolment inPrivate Aided
Managements*
% Enrolment inPrivate UnaidedManagements*
% Enrolmentin Private
Managements*
% Enrolment inPrivate Aided
Managements*
% Enrolment inUnrecognised
Schoolszz
Enrolment
Classes I-V: 2010-11 Classes VI-VIII: 2010-11
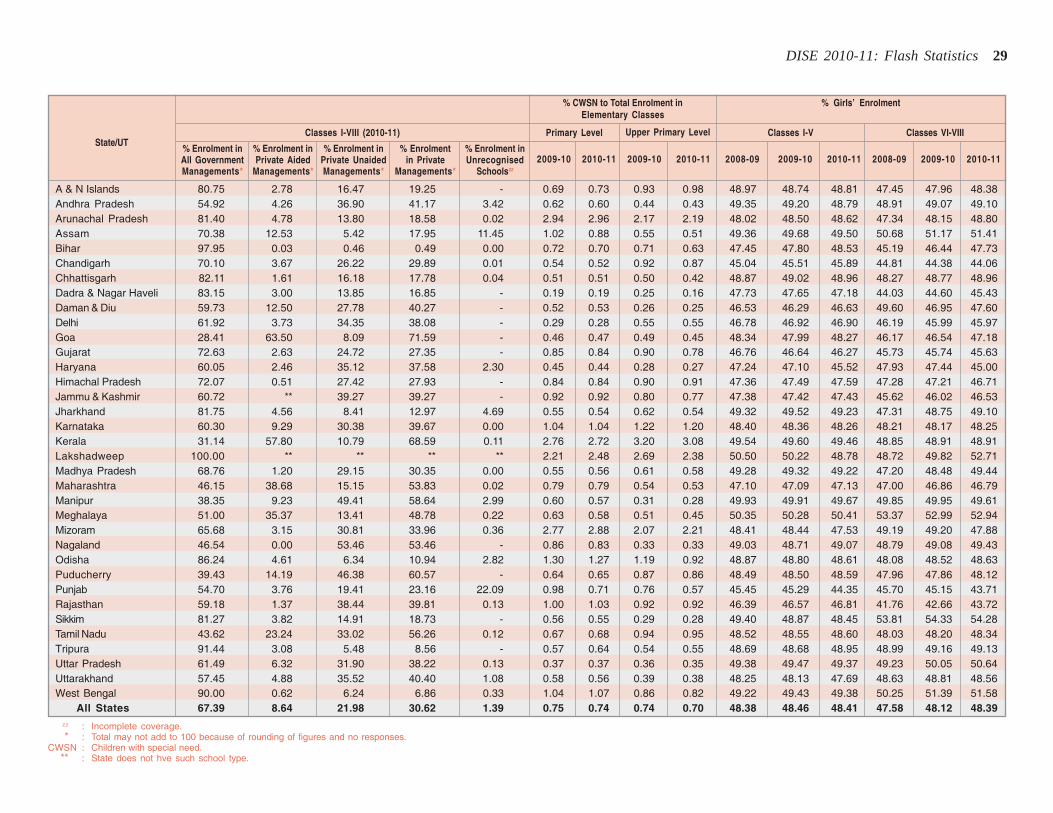
DISE 2010-11: Flash Statistics 29
State/UT
A & N IslandsAndhra PradeshArunachal PradeshAssamBiharChandigarhChhattisgarhDadra & Nagar HaveliDaman & DiuDelhiGoaGujaratHaryanaHimachal PradeshJammu & KashmirJharkhandKarnatakaKeralaLakshadweepMadhya PradeshMaharashtraManipurMeghalayaMizoramNagalandOdishaPuducherryPunjabRajasthanSikkimTamil NaduTripuraUttar PradeshUttarakhandWest Bengal
All States
80.75 2.78 16.47 19.25 - 0.69 0.73 0.93 0.98 48.97 48.74 48.81 47.45 47.96 48.3854.92 4.26 36.90 41.17 3.42 0.62 0.60 0.44 0.43 49.35 49.20 48.79 48.91 49.07 49.1081.40 4.78 13.80 18.58 0.02 2.94 2.96 2.17 2.19 48.02 48.50 48.62 47.34 48.15 48.8070.38 12.53 5.42 17.95 11.45 1.02 0.88 0.55 0.51 49.36 49.68 49.50 50.68 51.17 51.4197.95 0.03 0.46 0.49 0.00 0.72 0.70 0.71 0.63 47.45 47.80 48.53 45.19 46.44 47.7370.10 3.67 26.22 29.89 0.01 0.54 0.52 0.92 0.87 45.04 45.51 45.89 44.81 44.38 44.0682.11 1.61 16.18 17.78 0.04 0.51 0.51 0.50 0.42 48.87 49.02 48.96 48.27 48.77 48.9683.15 3.00 13.85 16.85 - 0.19 0.19 0.25 0.16 47.73 47.65 47.18 44.03 44.60 45.4359.73 12.50 27.78 40.27 - 0.52 0.53 0.26 0.25 46.53 46.29 46.63 49.60 46.95 47.6061.92 3.73 34.35 38.08 - 0.29 0.28 0.55 0.55 46.78 46.92 46.90 46.19 45.99 45.9728.41 63.50 8.09 71.59 - 0.46 0.47 0.49 0.45 48.34 47.99 48.27 46.17 46.54 47.1872.63 2.63 24.72 27.35 - 0.85 0.84 0.90 0.78 46.76 46.64 46.27 45.73 45.74 45.6360.05 2.46 35.12 37.58 2.30 0.45 0.44 0.28 0.27 47.24 47.10 45.52 47.93 47.44 45.0072.07 0.51 27.42 27.93 - 0.84 0.84 0.90 0.91 47.36 47.49 47.59 47.28 47.21 46.7160.72 ** 39.27 39.27 - 0.92 0.92 0.80 0.77 47.38 47.42 47.43 45.62 46.02 46.5381.75 4.56 8.41 12.97 4.69 0.55 0.54 0.62 0.54 49.32 49.52 49.23 47.31 48.75 49.1060.30 9.29 30.38 39.67 0.00 1.04 1.04 1.22 1.20 48.40 48.36 48.26 48.21 48.17 48.2531.14 57.80 10.79 68.59 0.11 2.76 2.72 3.20 3.08 49.54 49.60 49.46 48.85 48.91 48.91
100.00 ** ** ** ** 2.21 2.48 2.69 2.38 50.50 50.22 48.78 48.72 49.82 52.7168.76 1.20 29.15 30.35 0.00 0.55 0.56 0.61 0.58 49.28 49.32 49.22 47.20 48.48 49.4446.15 38.68 15.15 53.83 0.02 0.79 0.79 0.54 0.53 47.10 47.09 47.13 47.00 46.86 46.7938.35 9.23 49.41 58.64 2.99 0.60 0.57 0.31 0.28 49.93 49.91 49.67 49.85 49.95 49.6151.00 35.37 13.41 48.78 0.22 0.63 0.58 0.51 0.45 50.35 50.28 50.41 53.37 52.99 52.9465.68 3.15 30.81 33.96 0.36 2.77 2.88 2.07 2.21 48.41 48.44 47.53 49.19 49.20 47.8846.54 0.00 53.46 53.46 - 0.86 0.83 0.33 0.33 49.03 48.71 49.07 48.79 49.08 49.4386.24 4.61 6.34 10.94 2.82 1.30 1.27 1.19 0.92 48.87 48.80 48.61 48.08 48.52 48.6339.43 14.19 46.38 60.57 - 0.64 0.65 0.87 0.86 48.49 48.50 48.59 47.96 47.86 48.1254.70 3.76 19.41 23.16 22.09 0.98 0.71 0.76 0.57 45.45 45.29 44.35 45.70 45.15 43.7159.18 1.37 38.44 39.81 0.13 1.00 1.03 0.92 0.92 46.39 46.57 46.81 41.76 42.66 43.7281.27 3.82 14.91 18.73 - 0.56 0.55 0.29 0.28 49.40 48.87 48.45 53.81 54.33 54.2843.62 23.24 33.02 56.26 0.12 0.67 0.68 0.94 0.95 48.52 48.55 48.60 48.03 48.20 48.3491.44 3.08 5.48 8.56 - 0.57 0.64 0.54 0.55 48.69 48.68 48.95 48.99 49.16 49.1361.49 6.32 31.90 38.22 0.13 0.37 0.37 0.36 0.35 49.38 49.47 49.37 49.23 50.05 50.6457.45 4.88 35.52 40.40 1.08 0.58 0.56 0.39 0.38 48.25 48.13 47.69 48.63 48.81 48.5690.00 0.62 6.24 6.86 0.33 1.04 1.07 0.86 0.82 49.22 49.43 49.38 50.25 51.39 51.5867.39 8.64 21.98 30.62 1.39 0.75 0.74 0.74 0.70 48.38 48.46 48.41 47.58 48.12 48.39
Classes I-VIII (2010-11)
zz : Incomplete coverage.* : Total may not add to 100 because of rounding of figures and no responses.
CWSN : Children with special need.** : State does not hve such school type.
Primary Level
% Girls’ Enrolment
Classes I-V
% CWSN to Total Enrolment inElementary Classes
Classes VI-VIII
% Enrolment inAll GovernmentManagements*
% Enrolment inPrivate Aided
Managements*
% Enrolment inPrivate UnaidedManagements*
% Enrolmentin Private
Managements*
% Enrolment inUnrecognised
Schoolszz
2009-10 2010-11 2009-10 2010-11 2008-09 2009-10 2010-11 2008-09 2009-10 2010-11
Upper Primary Level
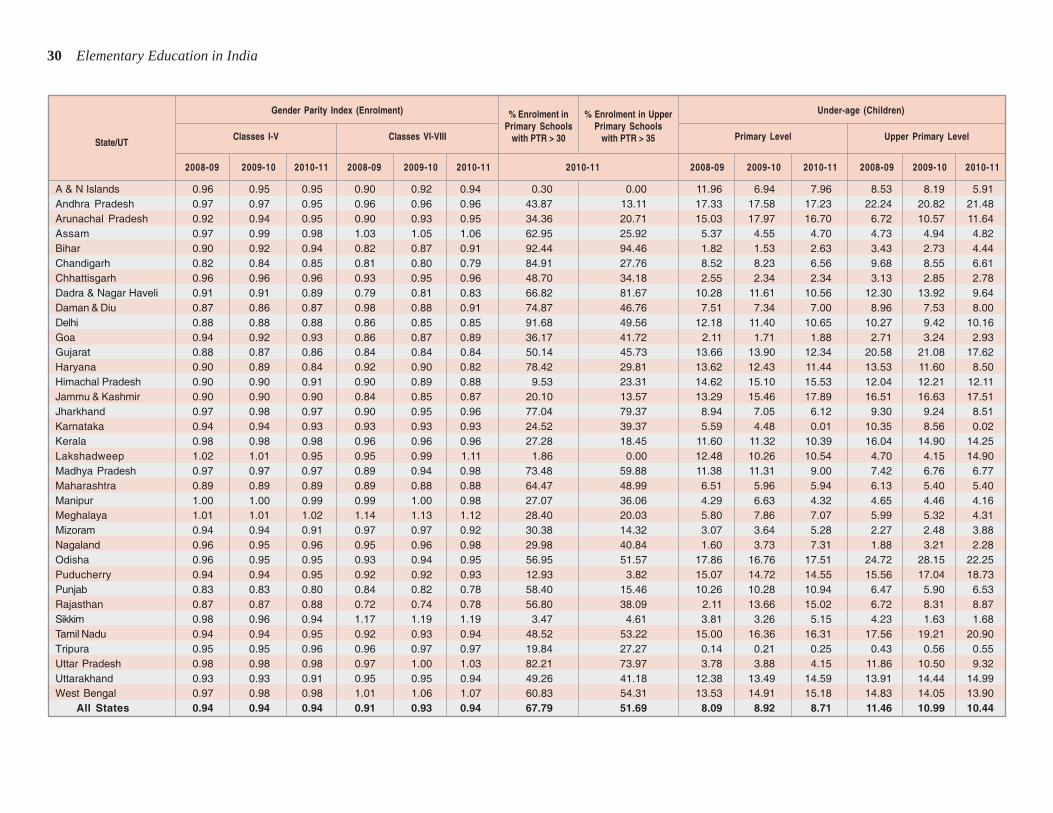
30 Elementary Education in India
State/UT
A & N IslandsAndhra PradeshArunachal PradeshAssamBiharChandigarhChhattisgarhDadra & Nagar HaveliDaman & DiuDelhiGoaGujaratHaryanaHimachal PradeshJammu & KashmirJharkhandKarnatakaKeralaLakshadweepMadhya PradeshMaharashtraManipurMeghalayaMizoramNagalandOdishaPuducherryPunjabRajasthanSikkimTamil NaduTripuraUttar PradeshUttarakhandWest Bengal
All States
0.96 0.95 0.95 0.90 0.92 0.94 0.30 0.00 11.96 6.94 7.96 8.53 8.19 5.910.97 0.97 0.95 0.96 0.96 0.96 43.87 13.11 17.33 17.58 17.23 22.24 20.82 21.480.92 0.94 0.95 0.90 0.93 0.95 34.36 20.71 15.03 17.97 16.70 6.72 10.57 11.640.97 0.99 0.98 1.03 1.05 1.06 62.95 25.92 5.37 4.55 4.70 4.73 4.94 4.820.90 0.92 0.94 0.82 0.87 0.91 92.44 94.46 1.82 1.53 2.63 3.43 2.73 4.440.82 0.84 0.85 0.81 0.80 0.79 84.91 27.76 8.52 8.23 6.56 9.68 8.55 6.610.96 0.96 0.96 0.93 0.95 0.96 48.70 34.18 2.55 2.34 2.34 3.13 2.85 2.780.91 0.91 0.89 0.79 0.81 0.83 66.82 81.67 10.28 11.61 10.56 12.30 13.92 9.640.87 0.86 0.87 0.98 0.88 0.91 74.87 46.76 7.51 7.34 7.00 8.96 7.53 8.000.88 0.88 0.88 0.86 0.85 0.85 91.68 49.56 12.18 11.40 10.65 10.27 9.42 10.160.94 0.92 0.93 0.86 0.87 0.89 36.17 41.72 2.11 1.71 1.88 2.71 3.24 2.930.88 0.87 0.86 0.84 0.84 0.84 50.14 45.73 13.66 13.90 12.34 20.58 21.08 17.620.90 0.89 0.84 0.92 0.90 0.82 78.42 29.81 13.62 12.43 11.44 13.53 11.60 8.500.90 0.90 0.91 0.90 0.89 0.88 9.53 23.31 14.62 15.10 15.53 12.04 12.21 12.110.90 0.90 0.90 0.84 0.85 0.87 20.10 13.57 13.29 15.46 17.89 16.51 16.63 17.510.97 0.98 0.97 0.90 0.95 0.96 77.04 79.37 8.94 7.05 6.12 9.30 9.24 8.510.94 0.94 0.93 0.93 0.93 0.93 24.52 39.37 5.59 4.48 0.01 10.35 8.56 0.020.98 0.98 0.98 0.96 0.96 0.96 27.28 18.45 11.60 11.32 10.39 16.04 14.90 14.251.02 1.01 0.95 0.95 0.99 1.11 1.86 0.00 12.48 10.26 10.54 4.70 4.15 14.900.97 0.97 0.97 0.89 0.94 0.98 73.48 59.88 11.38 11.31 9.00 7.42 6.76 6.770.89 0.89 0.89 0.89 0.88 0.88 64.47 48.99 6.51 5.96 5.94 6.13 5.40 5.401.00 1.00 0.99 0.99 1.00 0.98 27.07 36.06 4.29 6.63 4.32 4.65 4.46 4.161.01 1.01 1.02 1.14 1.13 1.12 28.40 20.03 5.80 7.86 7.07 5.99 5.32 4.310.94 0.94 0.91 0.97 0.97 0.92 30.38 14.32 3.07 3.64 5.28 2.27 2.48 3.880.96 0.95 0.96 0.95 0.96 0.98 29.98 40.84 1.60 3.73 7.31 1.88 3.21 2.280.96 0.95 0.95 0.93 0.94 0.95 56.95 51.57 17.86 16.76 17.51 24.72 28.15 22.250.94 0.94 0.95 0.92 0.92 0.93 12.93 3.82 15.07 14.72 14.55 15.56 17.04 18.730.83 0.83 0.80 0.84 0.82 0.78 58.40 15.46 10.26 10.28 10.94 6.47 5.90 6.530.87 0.87 0.88 0.72 0.74 0.78 56.80 38.09 2.11 13.66 15.02 6.72 8.31 8.870.98 0.96 0.94 1.17 1.19 1.19 3.47 4.61 3.81 3.26 5.15 4.23 1.63 1.680.94 0.94 0.95 0.92 0.93 0.94 48.52 53.22 15.00 16.36 16.31 17.56 19.21 20.900.95 0.95 0.96 0.96 0.97 0.97 19.84 27.27 0.14 0.21 0.25 0.43 0.56 0.550.98 0.98 0.98 0.97 1.00 1.03 82.21 73.97 3.78 3.88 4.15 11.86 10.50 9.320.93 0.93 0.91 0.95 0.95 0.94 49.26 41.18 12.38 13.49 14.59 13.91 14.44 14.990.97 0.98 0.98 1.01 1.06 1.07 60.83 54.31 13.53 14.91 15.18 14.83 14.05 13.900.94 0.94 0.94 0.91 0.93 0.94 67.79 51.69 8.09 8.92 8.71 11.46 10.99 10.44
Classes I-V
Under-age (Children)
Primary Level
% Enrolment inPrimary Schools
with PTR > 30 Upper Primary Level
2008-09 2009-10 2010-11 2008-09 2009-10 2010-11 2010-11 2008-09 2009-10 2010-11 2008-09 2009-10 2010-11
Gender Parity Index (Enrolment)
Classes VI-VIII
% Enrolment in UpperPrimary Schools
with PTR > 35
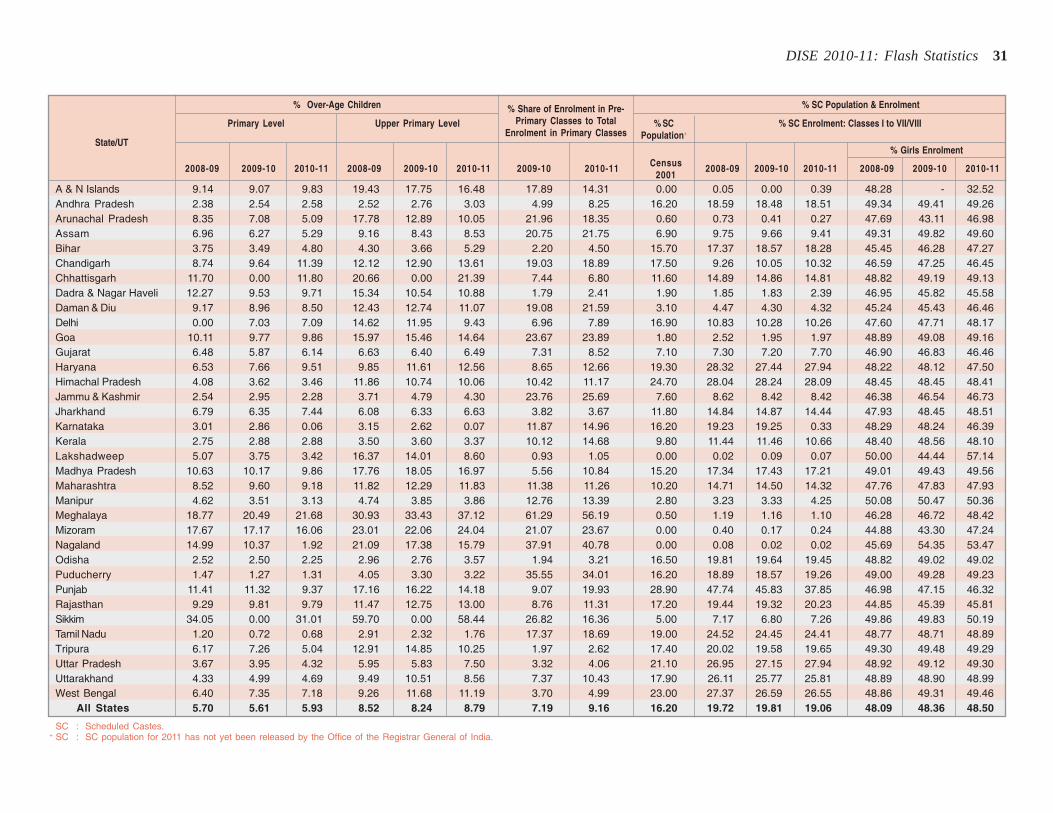
DISE 2010-11: Flash Statistics 31
State/UT
A & N IslandsAndhra PradeshArunachal PradeshAssamBiharChandigarhChhattisgarhDadra & Nagar HaveliDaman & DiuDelhiGoaGujaratHaryanaHimachal PradeshJammu & KashmirJharkhandKarnatakaKeralaLakshadweepMadhya PradeshMaharashtraManipurMeghalayaMizoramNagalandOdishaPuducherryPunjabRajasthanSikkimTamil NaduTripuraUttar PradeshUttarakhandWest Bengal
All States
9.14 9.07 9.83 19.43 17.75 16.48 17.89 14.31 0.00 0.05 0.00 0.39 48.28 - 32.522.38 2.54 2.58 2.52 2.76 3.03 4.99 8.25 16.20 18.59 18.48 18.51 49.34 49.41 49.268.35 7.08 5.09 17.78 12.89 10.05 21.96 18.35 0.60 0.73 0.41 0.27 47.69 43.11 46.986.96 6.27 5.29 9.16 8.43 8.53 20.75 21.75 6.90 9.75 9.66 9.41 49.31 49.82 49.603.75 3.49 4.80 4.30 3.66 5.29 2.20 4.50 15.70 17.37 18.57 18.28 45.45 46.28 47.278.74 9.64 11.39 12.12 12.90 13.61 19.03 18.89 17.50 9.26 10.05 10.32 46.59 47.25 46.45
11.70 0.00 11.80 20.66 0.00 21.39 7.44 6.80 11.60 14.89 14.86 14.81 48.82 49.19 49.1312.27 9.53 9.71 15.34 10.54 10.88 1.79 2.41 1.90 1.85 1.83 2.39 46.95 45.82 45.58
9.17 8.96 8.50 12.43 12.74 11.07 19.08 21.59 3.10 4.47 4.30 4.32 45.24 45.43 46.460.00 7.03 7.09 14.62 11.95 9.43 6.96 7.89 16.90 10.83 10.28 10.26 47.60 47.71 48.17
10.11 9.77 9.86 15.97 15.46 14.64 23.67 23.89 1.80 2.52 1.95 1.97 48.89 49.08 49.166.48 5.87 6.14 6.63 6.40 6.49 7.31 8.52 7.10 7.30 7.20 7.70 46.90 46.83 46.466.53 7.66 9.51 9.85 11.61 12.56 8.65 12.66 19.30 28.32 27.44 27.94 48.22 48.12 47.504.08 3.62 3.46 11.86 10.74 10.06 10.42 11.17 24.70 28.04 28.24 28.09 48.45 48.45 48.412.54 2.95 2.28 3.71 4.79 4.30 23.76 25.69 7.60 8.62 8.42 8.42 46.38 46.54 46.736.79 6.35 7.44 6.08 6.33 6.63 3.82 3.67 11.80 14.84 14.87 14.44 47.93 48.45 48.513.01 2.86 0.06 3.15 2.62 0.07 11.87 14.96 16.20 19.23 19.25 0.33 48.29 48.24 46.392.75 2.88 2.88 3.50 3.60 3.37 10.12 14.68 9.80 11.44 11.46 10.66 48.40 48.56 48.105.07 3.75 3.42 16.37 14.01 8.60 0.93 1.05 0.00 0.02 0.09 0.07 50.00 44.44 57.14
10.63 10.17 9.86 17.76 18.05 16.97 5.56 10.84 15.20 17.34 17.43 17.21 49.01 49.43 49.568.52 9.60 9.18 11.82 12.29 11.83 11.38 11.26 10.20 14.71 14.50 14.32 47.76 47.83 47.934.62 3.51 3.13 4.74 3.85 3.86 12.76 13.39 2.80 3.23 3.33 4.25 50.08 50.47 50.36
18.77 20.49 21.68 30.93 33.43 37.12 61.29 56.19 0.50 1.19 1.16 1.10 46.28 46.72 48.4217.67 17.17 16.06 23.01 22.06 24.04 21.07 23.67 0.00 0.40 0.17 0.24 44.88 43.30 47.2414.99 10.37 1.92 21.09 17.38 15.79 37.91 40.78 0.00 0.08 0.02 0.02 45.69 54.35 53.47
2.52 2.50 2.25 2.96 2.76 3.57 1.94 3.21 16.50 19.81 19.64 19.45 48.82 49.02 49.021.47 1.27 1.31 4.05 3.30 3.22 35.55 34.01 16.20 18.89 18.57 19.26 49.00 49.28 49.23
11.41 11.32 9.37 17.16 16.22 14.18 9.07 19.93 28.90 47.74 45.83 37.85 46.98 47.15 46.329.29 9.81 9.79 11.47 12.75 13.00 8.76 11.31 17.20 19.44 19.32 20.23 44.85 45.39 45.81
34.05 0.00 31.01 59.70 0.00 58.44 26.82 16.36 5.00 7.17 6.80 7.26 49.86 49.83 50.191.20 0.72 0.68 2.91 2.32 1.76 17.37 18.69 19.00 24.52 24.45 24.41 48.77 48.71 48.896.17 7.26 5.04 12.91 14.85 10.25 1.97 2.62 17.40 20.02 19.58 19.65 49.30 49.48 49.293.67 3.95 4.32 5.95 5.83 7.50 3.32 4.06 21.10 26.95 27.15 27.94 48.92 49.12 49.304.33 4.99 4.69 9.49 10.51 8.56 7.37 10.43 17.90 26.11 25.77 25.81 48.89 48.90 48.996.40 7.35 7.18 9.26 11.68 11.19 3.70 4.99 23.00 27.37 26.59 26.55 48.86 49.31 49.465.70 5.61 5.93 8.52 8.24 8.79 7.19 9.16 16.20 19.72 19.81 19.06 48.09 48.36 48.50
Primary Level
% SC Population & Enrolment
% SC Enrolment: Classes I to VII/VIII
2008-09 2009-10 2010-11 2008-09 2009-10 2010-11 2009-10 2010-11 Census 2008-09 2009-10 2010-11 2008-09 2009-10 2010-112001
% Over-Age Children
Upper Primary Level% Share of Enrolment in Pre-
Primary Classes to TotalEnrolment in Primary Classes
% SCPopulation+
% Girls Enrolment
SC : Scheduled Castes.+ SC : SC population for 2011 has not yet been released by the Office of the Registrar General of India.
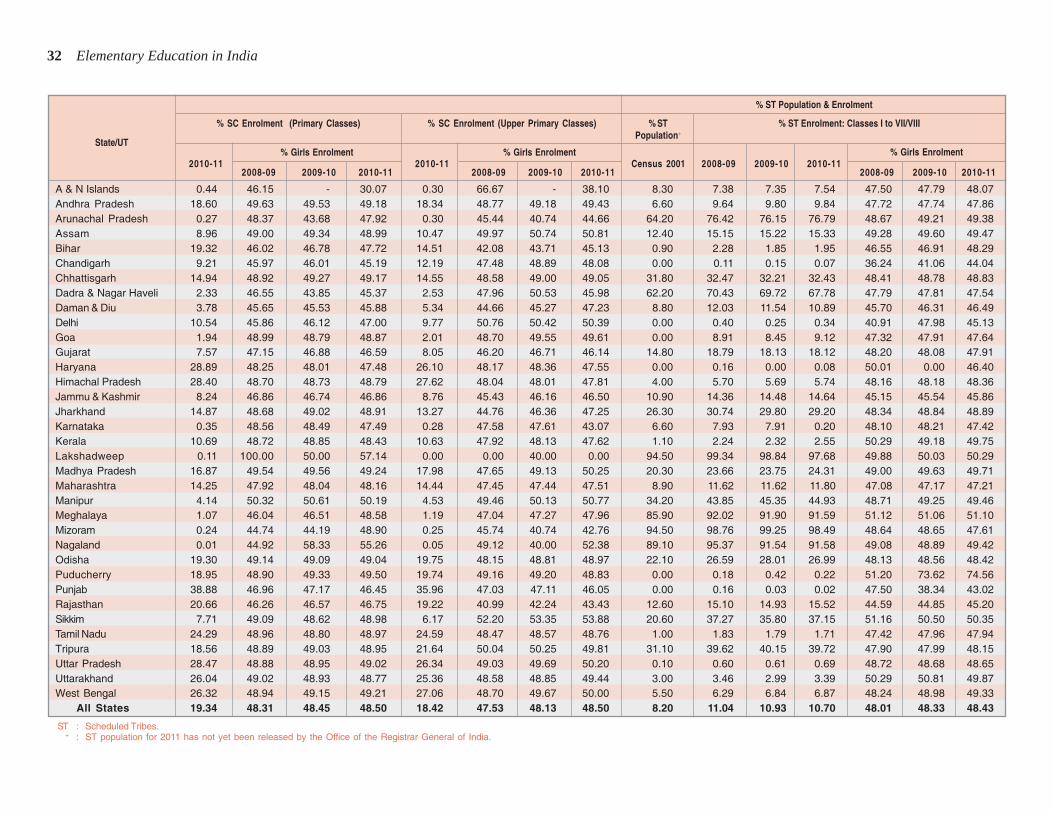
32 Elementary Education in India
State/UT
A & N IslandsAndhra PradeshArunachal PradeshAssamBiharChandigarhChhattisgarhDadra & Nagar HaveliDaman & DiuDelhiGoaGujaratHaryanaHimachal PradeshJammu & KashmirJharkhandKarnatakaKeralaLakshadweepMadhya PradeshMaharashtraManipurMeghalayaMizoramNagalandOdishaPuducherryPunjabRajasthanSikkimTamil NaduTripuraUttar PradeshUttarakhandWest Bengal
All States
0.44 46.15 - 30.07 0.30 66.67 - 38.10 8.30 7.38 7.35 7.54 47.50 47.79 48.0718.60 49.63 49.53 49.18 18.34 48.77 49.18 49.43 6.60 9.64 9.80 9.84 47.72 47.74 47.86
0.27 48.37 43.68 47.92 0.30 45.44 40.74 44.66 64.20 76.42 76.15 76.79 48.67 49.21 49.388.96 49.00 49.34 48.99 10.47 49.97 50.74 50.81 12.40 15.15 15.22 15.33 49.28 49.60 49.47
19.32 46.02 46.78 47.72 14.51 42.08 43.71 45.13 0.90 2.28 1.85 1.95 46.55 46.91 48.299.21 45.97 46.01 45.19 12.19 47.48 48.89 48.08 0.00 0.11 0.15 0.07 36.24 41.06 44.04
14.94 48.92 49.27 49.17 14.55 48.58 49.00 49.05 31.80 32.47 32.21 32.43 48.41 48.78 48.832.33 46.55 43.85 45.37 2.53 47.96 50.53 45.98 62.20 70.43 69.72 67.78 47.79 47.81 47.543.78 45.65 45.53 45.88 5.34 44.66 45.27 47.23 8.80 12.03 11.54 10.89 45.70 46.31 46.49
10.54 45.86 46.12 47.00 9.77 50.76 50.42 50.39 0.00 0.40 0.25 0.34 40.91 47.98 45.131.94 48.99 48.79 48.87 2.01 48.70 49.55 49.61 0.00 8.91 8.45 9.12 47.32 47.91 47.647.57 47.15 46.88 46.59 8.05 46.20 46.71 46.14 14.80 18.79 18.13 18.12 48.20 48.08 47.91
28.89 48.25 48.01 47.48 26.10 48.17 48.36 47.55 0.00 0.16 0.00 0.08 50.01 0.00 46.4028.40 48.70 48.73 48.79 27.62 48.04 48.01 47.81 4.00 5.70 5.69 5.74 48.16 48.18 48.36
8.24 46.86 46.74 46.86 8.76 45.43 46.16 46.50 10.90 14.36 14.48 14.64 45.15 45.54 45.8614.87 48.68 49.02 48.91 13.27 44.76 46.36 47.25 26.30 30.74 29.80 29.20 48.34 48.84 48.89
0.35 48.56 48.49 47.49 0.28 47.58 47.61 43.07 6.60 7.93 7.91 0.20 48.10 48.21 47.4210.69 48.72 48.85 48.43 10.63 47.92 48.13 47.62 1.10 2.24 2.32 2.55 50.29 49.18 49.75
0.11 100.00 50.00 57.14 0.00 0.00 40.00 0.00 94.50 99.34 98.84 97.68 49.88 50.03 50.2916.87 49.54 49.56 49.24 17.98 47.65 49.13 50.25 20.30 23.66 23.75 24.31 49.00 49.63 49.7114.25 47.92 48.04 48.16 14.44 47.45 47.44 47.51 8.90 11.62 11.62 11.80 47.08 47.17 47.21
4.14 50.32 50.61 50.19 4.53 49.46 50.13 50.77 34.20 43.85 45.35 44.93 48.71 49.25 49.461.07 46.04 46.51 48.58 1.19 47.04 47.27 47.96 85.90 92.02 91.90 91.59 51.12 51.06 51.100.24 44.74 44.19 48.90 0.25 45.74 40.74 42.76 94.50 98.76 99.25 98.49 48.64 48.65 47.610.01 44.92 58.33 55.26 0.05 49.12 40.00 52.38 89.10 95.37 91.54 91.58 49.08 48.89 49.42
19.30 49.14 49.09 49.04 19.75 48.15 48.81 48.97 22.10 26.59 28.01 26.99 48.13 48.56 48.4218.95 48.90 49.33 49.50 19.74 49.16 49.20 48.83 0.00 0.18 0.42 0.22 51.20 73.62 74.5638.88 46.96 47.17 46.45 35.96 47.03 47.11 46.05 0.00 0.16 0.03 0.02 47.50 38.34 43.0220.66 46.26 46.57 46.75 19.22 40.99 42.24 43.43 12.60 15.10 14.93 15.52 44.59 44.85 45.20
7.71 49.09 48.62 48.98 6.17 52.20 53.35 53.88 20.60 37.27 35.80 37.15 51.16 50.50 50.3524.29 48.96 48.80 48.97 24.59 48.47 48.57 48.76 1.00 1.83 1.79 1.71 47.42 47.96 47.9418.56 48.89 49.03 48.95 21.64 50.04 50.25 49.81 31.10 39.62 40.15 39.72 47.90 47.99 48.1528.47 48.88 48.95 49.02 26.34 49.03 49.69 50.20 0.10 0.60 0.61 0.69 48.72 48.68 48.6526.04 49.02 48.93 48.77 25.36 48.58 48.85 49.44 3.00 3.46 2.99 3.39 50.29 50.81 49.8726.32 48.94 49.15 49.21 27.06 48.70 49.67 50.00 5.50 6.29 6.84 6.87 48.24 48.98 49.3319.34 48.31 48.45 48.50 18.42 47.53 48.13 48.50 8.20 11.04 10.93 10.70 48.01 48.33 48.43
% SC Enrolment (Primary Classes)
% ST Population & Enrolment
% ST Enrolment: Classes I to VII/VIII
2010-112008-09 2009-10 2010-11
2010-112008-09 2009-10 2010-11
Census 2001 2008-09 2009-10 2010-112008-09 2009-10 2010-11
% SC Enrolment (Upper Primary Classes) % STPopulation+
% Girls Enrolment
ST : Scheduled Tribes.+ : ST population for 2011 has not yet been released by the Office of the Registrar General of India.
% Girls Enrolment % Girls Enrolment
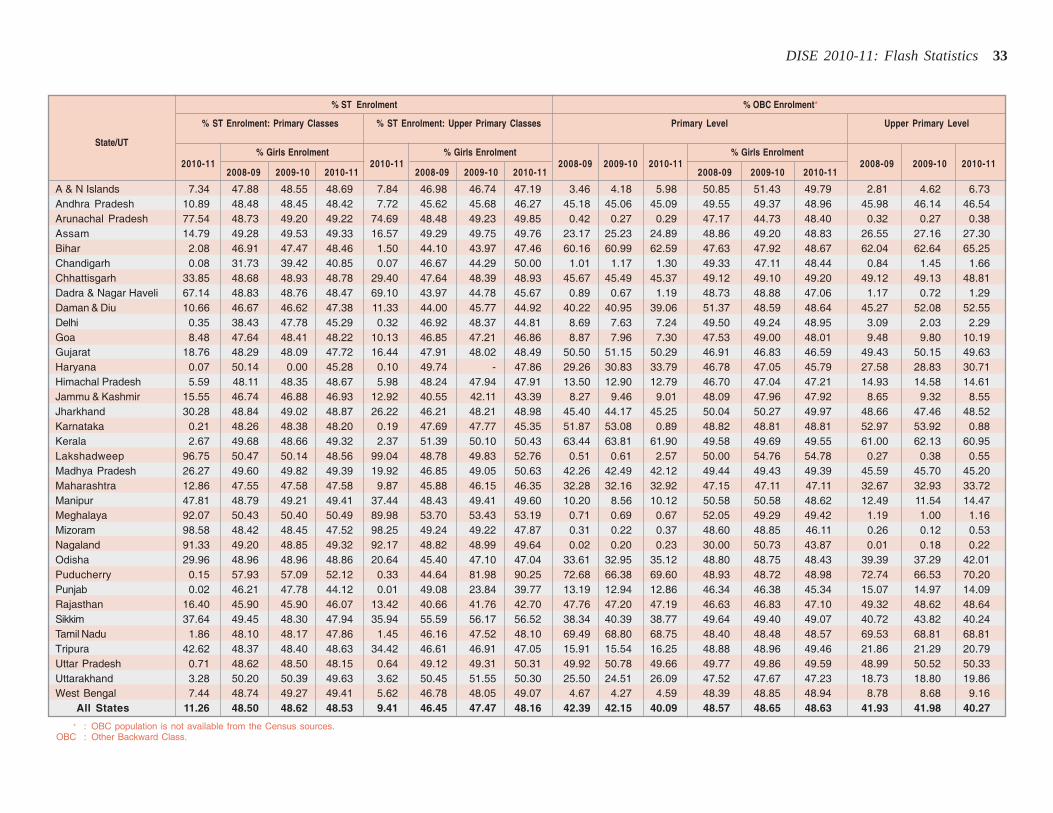
DISE 2010-11: Flash Statistics 33
State/UT
A & N IslandsAndhra PradeshArunachal PradeshAssamBiharChandigarhChhattisgarhDadra & Nagar HaveliDaman & DiuDelhiGoaGujaratHaryanaHimachal PradeshJammu & KashmirJharkhandKarnatakaKeralaLakshadweepMadhya PradeshMaharashtraManipurMeghalayaMizoramNagalandOdishaPuducherryPunjabRajasthanSikkimTamil NaduTripuraUttar PradeshUttarakhandWest Bengal
All States
7.34 47.88 48.55 48.69 7.84 46.98 46.74 47.19 3.46 4.18 5.98 50.85 51.43 49.79 2.81 4.62 6.7310.89 48.48 48.45 48.42 7.72 45.62 45.68 46.27 45.18 45.06 45.09 49.55 49.37 48.96 45.98 46.14 46.5477.54 48.73 49.20 49.22 74.69 48.48 49.23 49.85 0.42 0.27 0.29 47.17 44.73 48.40 0.32 0.27 0.3814.79 49.28 49.53 49.33 16.57 49.29 49.75 49.76 23.17 25.23 24.89 48.86 49.20 48.83 26.55 27.16 27.302.08 46.91 47.47 48.46 1.50 44.10 43.97 47.46 60.16 60.99 62.59 47.63 47.92 48.67 62.04 62.64 65.250.08 31.73 39.42 40.85 0.07 46.67 44.29 50.00 1.01 1.17 1.30 49.33 47.11 48.44 0.84 1.45 1.66
33.85 48.68 48.93 48.78 29.40 47.64 48.39 48.93 45.67 45.49 45.37 49.12 49.10 49.20 49.12 49.13 48.8167.14 48.83 48.76 48.47 69.10 43.97 44.78 45.67 0.89 0.67 1.19 48.73 48.88 47.06 1.17 0.72 1.2910.66 46.67 46.62 47.38 11.33 44.00 45.77 44.92 40.22 40.95 39.06 51.37 48.59 48.64 45.27 52.08 52.550.35 38.43 47.78 45.29 0.32 46.92 48.37 44.81 8.69 7.63 7.24 49.50 49.24 48.95 3.09 2.03 2.298.48 47.64 48.41 48.22 10.13 46.85 47.21 46.86 8.87 7.96 7.30 47.53 49.00 48.01 9.48 9.80 10.19
18.76 48.29 48.09 47.72 16.44 47.91 48.02 48.49 50.50 51.15 50.29 46.91 46.83 46.59 49.43 50.15 49.630.07 50.14 0.00 45.28 0.10 49.74 - 47.86 29.26 30.83 33.79 46.78 47.05 45.79 27.58 28.83 30.715.59 48.11 48.35 48.67 5.98 48.24 47.94 47.91 13.50 12.90 12.79 46.70 47.04 47.21 14.93 14.58 14.61
15.55 46.74 46.88 46.93 12.92 40.55 42.11 43.39 8.27 9.46 9.01 48.09 47.96 47.92 8.65 9.32 8.5530.28 48.84 49.02 48.87 26.22 46.21 48.21 48.98 45.40 44.17 45.25 50.04 50.27 49.97 48.66 47.46 48.520.21 48.26 48.38 48.20 0.19 47.69 47.77 45.35 51.87 53.08 0.89 48.82 48.81 48.81 52.97 53.92 0.882.67 49.68 48.66 49.32 2.37 51.39 50.10 50.43 63.44 63.81 61.90 49.58 49.69 49.55 61.00 62.13 60.95
96.75 50.47 50.14 48.56 99.04 48.78 49.83 52.76 0.51 0.61 2.57 50.00 54.76 54.78 0.27 0.38 0.5526.27 49.60 49.82 49.39 19.92 46.85 49.05 50.63 42.26 42.49 42.12 49.44 49.43 49.39 45.59 45.70 45.2012.86 47.55 47.58 47.58 9.87 45.88 46.15 46.35 32.28 32.16 32.92 47.15 47.11 47.11 32.67 32.93 33.7247.81 48.79 49.21 49.41 37.44 48.43 49.41 49.60 10.20 8.56 10.12 50.58 50.58 48.62 12.49 11.54 14.4792.07 50.43 50.40 50.49 89.98 53.70 53.43 53.19 0.71 0.69 0.67 52.05 49.29 49.42 1.19 1.00 1.1698.58 48.42 48.45 47.52 98.25 49.24 49.22 47.87 0.31 0.22 0.37 48.60 48.85 46.11 0.26 0.12 0.5391.33 49.20 48.85 49.32 92.17 48.82 48.99 49.64 0.02 0.20 0.23 30.00 50.73 43.87 0.01 0.18 0.2229.96 48.96 48.96 48.86 20.64 45.40 47.10 47.04 33.61 32.95 35.12 48.80 48.75 48.43 39.39 37.29 42.010.15 57.93 57.09 52.12 0.33 44.64 81.98 90.25 72.68 66.38 69.60 48.93 48.72 48.98 72.74 66.53 70.200.02 46.21 47.78 44.12 0.01 49.08 23.84 39.77 13.19 12.94 12.86 46.34 46.38 45.34 15.07 14.97 14.09
16.40 45.90 45.90 46.07 13.42 40.66 41.76 42.70 47.76 47.20 47.19 46.63 46.83 47.10 49.32 48.62 48.6437.64 49.45 48.30 47.94 35.94 55.59 56.17 56.52 38.34 40.39 38.77 49.64 49.40 49.07 40.72 43.82 40.241.86 48.10 48.17 47.86 1.45 46.16 47.52 48.10 69.49 68.80 68.75 48.40 48.48 48.57 69.53 68.81 68.81
42.62 48.37 48.40 48.63 34.42 46.61 46.91 47.05 15.91 15.54 16.25 48.88 48.96 49.46 21.86 21.29 20.790.71 48.62 48.50 48.15 0.64 49.12 49.31 50.31 49.92 50.78 49.66 49.77 49.86 49.59 48.99 50.52 50.333.28 50.20 50.39 49.63 3.62 50.45 51.55 50.30 25.50 24.51 26.09 47.52 47.67 47.23 18.73 18.80 19.867.44 48.74 49.27 49.41 5.62 46.78 48.05 49.07 4.67 4.27 4.59 48.39 48.85 48.94 8.78 8.68 9.16
11.26 48.50 48.62 48.53 9.41 46.45 47.47 48.16 42.39 42.15 40.09 48.57 48.65 48.63 41.93 41.98 40.27
% ST Enrolment: Primary Classes
% OBC Enrolment*
Primary Level
2010-112008-09 2009-10 2010-11
2010-112008-09 2009-10 2010-11
2008-09 2009-10 2010-112008-09 2009-10 2010-11
2008-09 2009-10 2010-11
% ST Enrolment: Upper Primary Classes
+ : OBC population is not available from the Census sources.OBC : Other Backward Class.
% Girls Enrolment % Girls Enrolment
% ST Enrolment
Upper Primary Level
% Girls Enrolment
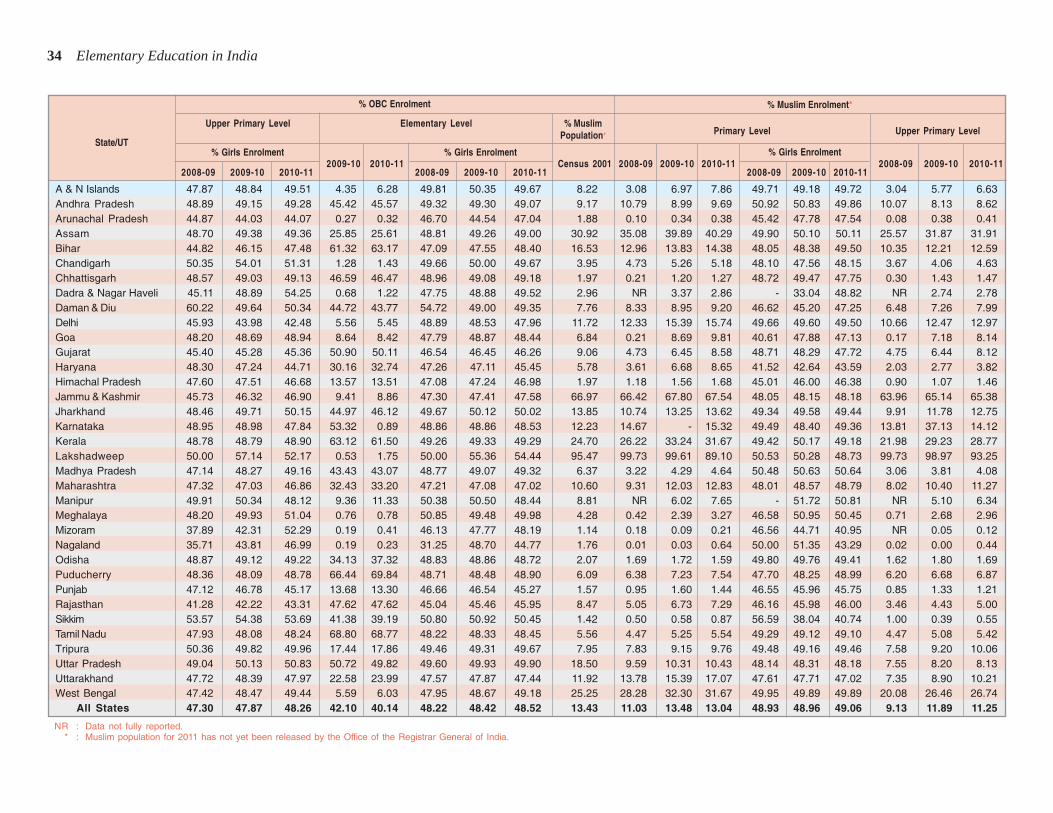
34 Elementary Education in India
State/UT
A & N IslandsAndhra PradeshArunachal PradeshAssamBiharChandigarhChhattisgarhDadra & Nagar HaveliDaman & DiuDelhiGoaGujaratHaryanaHimachal PradeshJammu & KashmirJharkhandKarnatakaKeralaLakshadweepMadhya PradeshMaharashtraManipurMeghalayaMizoramNagalandOdishaPuducherryPunjabRajasthanSikkimTamil NaduTripuraUttar PradeshUttarakhandWest Bengal
All States
47.87 48.84 49.51 4.35 6.28 49.81 50.35 49.67 8.22 3.08 6.97 7.86 49.71 49.18 49.72 3.04 5.77 6.6348.89 49.15 49.28 45.42 45.57 49.32 49.30 49.07 9.17 10.79 8.99 9.69 50.92 50.83 49.86 10.07 8.13 8.6244.87 44.03 44.07 0.27 0.32 46.70 44.54 47.04 1.88 0.10 0.34 0.38 45.42 47.78 47.54 0.08 0.38 0.4148.70 49.38 49.36 25.85 25.61 48.81 49.26 49.00 30.92 35.08 39.89 40.29 49.90 50.10 50.11 25.57 31.87 31.9144.82 46.15 47.48 61.32 63.17 47.09 47.55 48.40 16.53 12.96 13.83 14.38 48.05 48.38 49.50 10.35 12.21 12.5950.35 54.01 51.31 1.28 1.43 49.66 50.00 49.67 3.95 4.73 5.26 5.18 48.10 47.56 48.15 3.67 4.06 4.6348.57 49.03 49.13 46.59 46.47 48.96 49.08 49.18 1.97 0.21 1.20 1.27 48.72 49.47 47.75 0.30 1.43 1.4745.11 48.89 54.25 0.68 1.22 47.75 48.88 49.52 2.96 NR 3.37 2.86 - 33.04 48.82 NR 2.74 2.7860.22 49.64 50.34 44.72 43.77 54.72 49.00 49.35 7.76 8.33 8.95 9.20 46.62 45.20 47.25 6.48 7.26 7.9945.93 43.98 42.48 5.56 5.45 48.89 48.53 47.96 11.72 12.33 15.39 15.74 49.66 49.60 49.50 10.66 12.47 12.9748.20 48.69 48.94 8.64 8.42 47.79 48.87 48.44 6.84 0.21 8.69 9.81 40.61 47.88 47.13 0.17 7.18 8.1445.40 45.28 45.36 50.90 50.11 46.54 46.45 46.26 9.06 4.73 6.45 8.58 48.71 48.29 47.72 4.75 6.44 8.1248.30 47.24 44.71 30.16 32.74 47.26 47.11 45.45 5.78 3.61 6.68 8.65 41.52 42.64 43.59 2.03 2.77 3.8247.60 47.51 46.68 13.57 13.51 47.08 47.24 46.98 1.97 1.18 1.56 1.68 45.01 46.00 46.38 0.90 1.07 1.4645.73 46.32 46.90 9.41 8.86 47.30 47.41 47.58 66.97 66.42 67.80 67.54 48.05 48.15 48.18 63.96 65.14 65.3848.46 49.71 50.15 44.97 46.12 49.67 50.12 50.02 13.85 10.74 13.25 13.62 49.34 49.58 49.44 9.91 11.78 12.7548.95 48.98 47.84 53.32 0.89 48.86 48.86 48.53 12.23 14.67 - 15.32 49.49 48.40 49.36 13.81 37.13 14.1248.78 48.79 48.90 63.12 61.50 49.26 49.33 49.29 24.70 26.22 33.24 31.67 49.42 50.17 49.18 21.98 29.23 28.7750.00 57.14 52.17 0.53 1.75 50.00 55.36 54.44 95.47 99.73 99.61 89.10 50.53 50.28 48.73 99.73 98.97 93.2547.14 48.27 49.16 43.43 43.07 48.77 49.07 49.32 6.37 3.22 4.29 4.64 50.48 50.63 50.64 3.06 3.81 4.0847.32 47.03 46.86 32.43 33.20 47.21 47.08 47.02 10.60 9.31 12.03 12.83 48.01 48.57 48.79 8.02 10.40 11.2749.91 50.34 48.12 9.36 11.33 50.38 50.50 48.44 8.81 NR 6.02 7.65 - 51.72 50.81 NR 5.10 6.3448.20 49.93 51.04 0.76 0.78 50.85 49.48 49.98 4.28 0.42 2.39 3.27 46.58 50.95 50.45 0.71 2.68 2.9637.89 42.31 52.29 0.19 0.41 46.13 47.77 48.19 1.14 0.18 0.09 0.21 46.56 44.71 40.95 NR 0.05 0.1235.71 43.81 46.99 0.19 0.23 31.25 48.70 44.77 1.76 0.01 0.03 0.64 50.00 51.35 43.29 0.02 0.00 0.4448.87 49.12 49.22 34.13 37.32 48.83 48.86 48.72 2.07 1.69 1.72 1.59 49.80 49.76 49.41 1.62 1.80 1.6948.36 48.09 48.78 66.44 69.84 48.71 48.48 48.90 6.09 6.38 7.23 7.54 47.70 48.25 48.99 6.20 6.68 6.8747.12 46.78 45.17 13.68 13.30 46.66 46.54 45.27 1.57 0.95 1.60 1.44 46.55 45.96 45.75 0.85 1.33 1.2141.28 42.22 43.31 47.62 47.62 45.04 45.46 45.95 8.47 5.05 6.73 7.29 46.16 45.98 46.00 3.46 4.43 5.0053.57 54.38 53.69 41.38 39.19 50.80 50.92 50.45 1.42 0.50 0.58 0.87 56.59 38.04 40.74 1.00 0.39 0.5547.93 48.08 48.24 68.80 68.77 48.22 48.33 48.45 5.56 4.47 5.25 5.54 49.29 49.12 49.10 4.47 5.08 5.4250.36 49.82 49.96 17.44 17.86 49.46 49.31 49.67 7.95 7.83 9.15 9.76 49.48 49.16 49.46 7.58 9.20 10.0649.04 50.13 50.83 50.72 49.82 49.60 49.93 49.90 18.50 9.59 10.31 10.43 48.14 48.31 48.18 7.55 8.20 8.1347.72 48.39 47.97 22.58 23.99 47.57 47.87 47.44 11.92 13.78 15.39 17.07 47.61 47.71 47.02 7.35 8.90 10.2147.42 48.47 49.44 5.59 6.03 47.95 48.67 49.18 25.25 28.28 32.30 31.67 49.95 49.89 49.89 20.08 26.46 26.7447.30 47.87 48.26 42.10 40.14 48.22 48.42 48.52 13.43 11.03 13.48 13.04 48.93 48.96 49.06 9.13 11.89 11.25
% Muslim Enrolment*
Primary Level
2008-09 2009-10 2010-112009-10 2010-11
2008-09 2009-10 2010-11Census 2001 2008-09 2009-10 2010-11
2008-09 2009-10 2010-112008-09 2009-10 2010-11
Elementary Level % MuslimPopulation+
% Girls Enrolment
NR : Data not fully reported.* : Muslim population for 2011 has not yet been released by the Office of the Registrar General of India.
% Girls Enrolment % Girls Enrolment
Upper Primary Level
% OBC Enrolment
Upper Primary Level
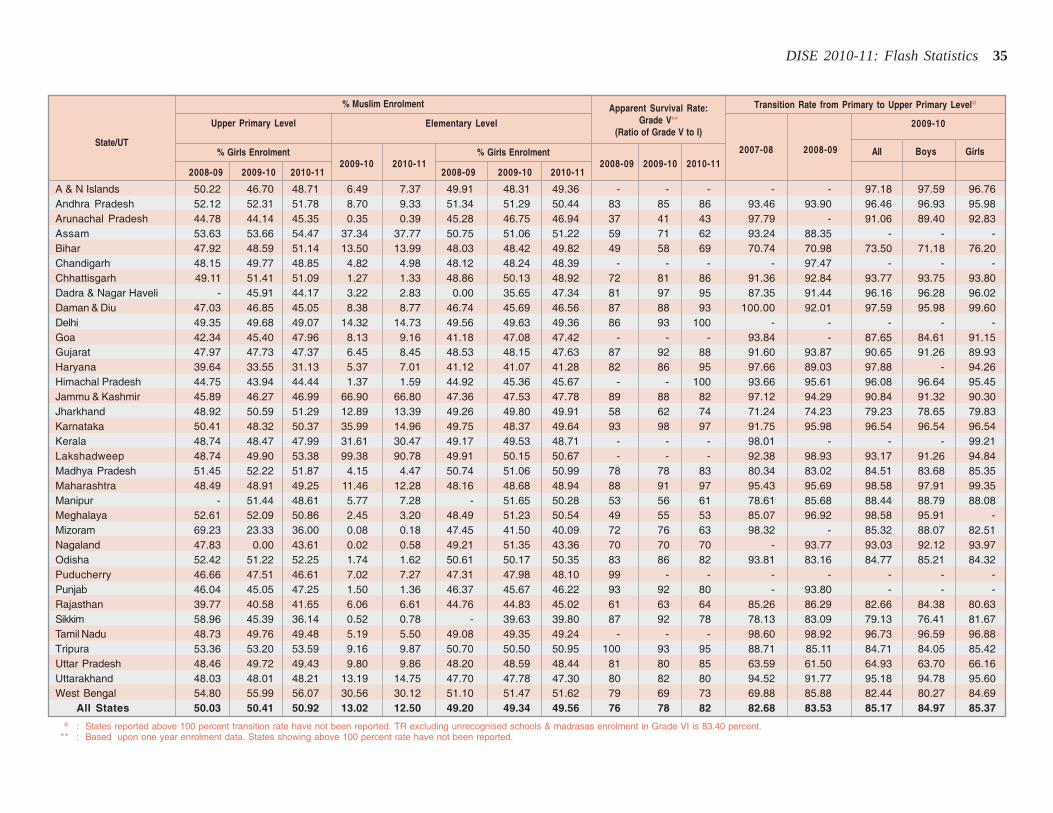
DISE 2010-11: Flash Statistics 35
State/UT
A & N IslandsAndhra PradeshArunachal PradeshAssamBiharChandigarhChhattisgarhDadra & Nagar HaveliDaman & DiuDelhiGoaGujaratHaryanaHimachal PradeshJammu & KashmirJharkhandKarnatakaKeralaLakshadweepMadhya PradeshMaharashtraManipurMeghalayaMizoramNagalandOdishaPuducherryPunjabRajasthanSikkimTamil NaduTripuraUttar PradeshUttarakhandWest Bengal
All States
50.22 46.70 48.71 6.49 7.37 49.91 48.31 49.36 - - - - - 97.18 97.59 96.7652.12 52.31 51.78 8.70 9.33 51.34 51.29 50.44 83 85 86 93.46 93.90 96.46 96.93 95.9844.78 44.14 45.35 0.35 0.39 45.28 46.75 46.94 37 41 43 97.79 - 91.06 89.40 92.8353.63 53.66 54.47 37.34 37.77 50.75 51.06 51.22 59 71 62 93.24 88.35 - - -47.92 48.59 51.14 13.50 13.99 48.03 48.42 49.82 49 58 69 70.74 70.98 73.50 71.18 76.2048.15 49.77 48.85 4.82 4.98 48.12 48.24 48.39 - - - - 97.47 - - -49.11 51.41 51.09 1.27 1.33 48.86 50.13 48.92 72 81 86 91.36 92.84 93.77 93.75 93.80
- 45.91 44.17 3.22 2.83 0.00 35.65 47.34 81 97 95 87.35 91.44 96.16 96.28 96.0247.03 46.85 45.05 8.38 8.77 46.74 45.69 46.56 87 88 93 100.00 92.01 97.59 95.98 99.6049.35 49.68 49.07 14.32 14.73 49.56 49.63 49.36 86 93 100 - - - - -42.34 45.40 47.96 8.13 9.16 41.18 47.08 47.42 - - - 93.84 - 87.65 84.61 91.1547.97 47.73 47.37 6.45 8.45 48.53 48.15 47.63 87 92 88 91.60 93.87 90.65 91.26 89.9339.64 33.55 31.13 5.37 7.01 41.12 41.07 41.28 82 86 95 97.66 89.03 97.88 - 94.2644.75 43.94 44.44 1.37 1.59 44.92 45.36 45.67 - - 100 93.66 95.61 96.08 96.64 95.4545.89 46.27 46.99 66.90 66.80 47.36 47.53 47.78 89 88 82 97.12 94.29 90.84 91.32 90.3048.92 50.59 51.29 12.89 13.39 49.26 49.80 49.91 58 62 74 71.24 74.23 79.23 78.65 79.8350.41 48.32 50.37 35.99 14.96 49.75 48.37 49.64 93 98 97 91.75 95.98 96.54 96.54 96.5448.74 48.47 47.99 31.61 30.47 49.17 49.53 48.71 - - - 98.01 - - - 99.2148.74 49.90 53.38 99.38 90.78 49.91 50.15 50.67 - - - 92.38 98.93 93.17 91.26 94.8451.45 52.22 51.87 4.15 4.47 50.74 51.06 50.99 78 78 83 80.34 83.02 84.51 83.68 85.3548.49 48.91 49.25 11.46 12.28 48.16 48.68 48.94 88 91 97 95.43 95.69 98.58 97.91 99.35
- 51.44 48.61 5.77 7.28 - 51.65 50.28 53 56 61 78.61 85.68 88.44 88.79 88.0852.61 52.09 50.86 2.45 3.20 48.49 51.23 50.54 49 55 53 85.07 96.92 98.58 95.91 -69.23 23.33 36.00 0.08 0.18 47.45 41.50 40.09 72 76 63 98.32 - 85.32 88.07 82.5147.83 0.00 43.61 0.02 0.58 49.21 51.35 43.36 70 70 70 - 93.77 93.03 92.12 93.9752.42 51.22 52.25 1.74 1.62 50.61 50.17 50.35 83 86 82 93.81 83.16 84.77 85.21 84.3246.66 47.51 46.61 7.02 7.27 47.31 47.98 48.10 99 - - - - - - -46.04 45.05 47.25 1.50 1.36 46.37 45.67 46.22 93 92 80 - 93.80 - - -39.77 40.58 41.65 6.06 6.61 44.76 44.83 45.02 61 63 64 85.26 86.29 82.66 84.38 80.6358.96 45.39 36.14 0.52 0.78 - 39.63 39.80 87 92 78 78.13 83.09 79.13 76.41 81.6748.73 49.76 49.48 5.19 5.50 49.08 49.35 49.24 - - - 98.60 98.92 96.73 96.59 96.8853.36 53.20 53.59 9.16 9.87 50.70 50.50 50.95 100 93 95 88.71 85.11 84.71 84.05 85.4248.46 49.72 49.43 9.80 9.86 48.20 48.59 48.44 81 80 85 63.59 61.50 64.93 63.70 66.1648.03 48.01 48.21 13.19 14.75 47.70 47.78 47.30 80 82 80 94.52 91.77 95.18 94.78 95.6054.80 55.99 56.07 30.56 30.12 51.10 51.47 51.62 79 69 73 69.88 85.88 82.44 80.27 84.6950.03 50.41 50.92 13.02 12.50 49.20 49.34 49.56 76 78 82 82.68 83.53 85.17 84.97 85.37
Transition Rate from Primary to Upper Primary Level@
2008-09 2009-10 2010-112009-10 2010-11
2008-09 2009-10 2010-112008-09 2009-10 2010-11
2007-08 2008-09 All Boys Girls
Elementary Level
Apparent Survival Rate:Grade V**
(Ratio of Grade V to I)
@ : States reported above 100 percent transition rate have not been reported. TR excluding unrecognised schools & madrasas enrolment in Grade VI is 83.40 percent.** : Based upon one year enrolment data. States showing above 100 percent rate have not been reported.
% Girls Enrolment % Girls Enrolment
2009-10
% Muslim Enrolment
Upper Primary Level
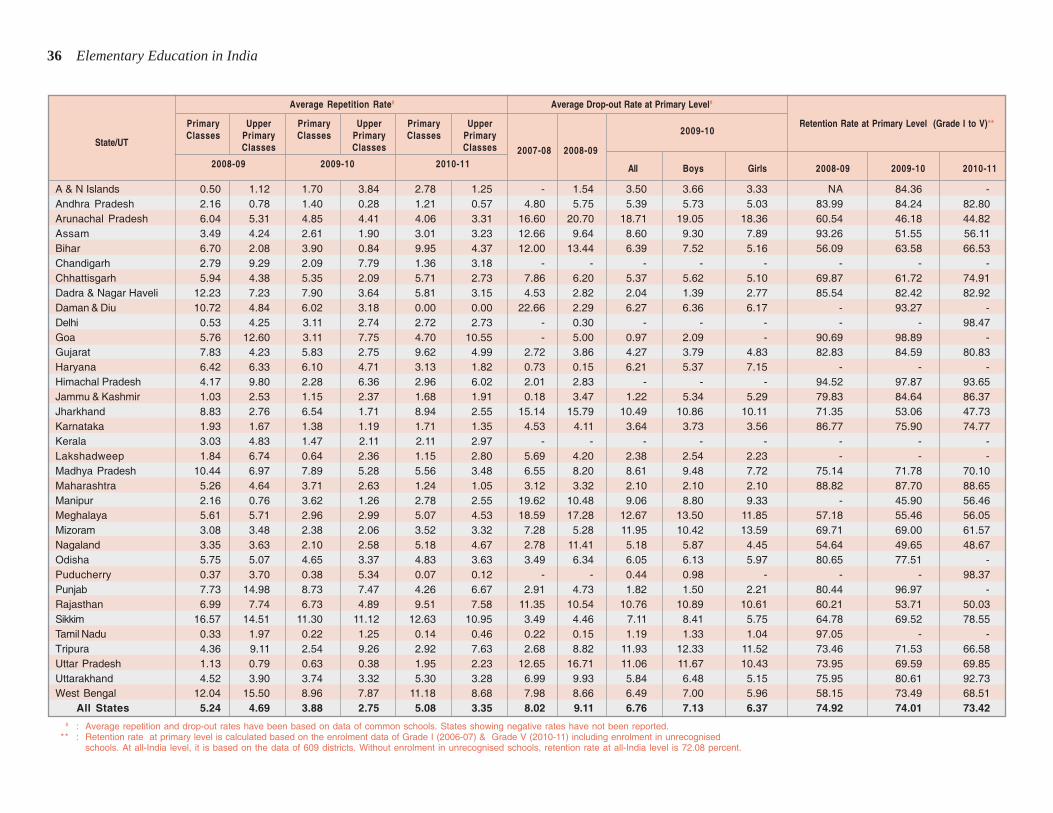
36 Elementary Education in India
State/UT
A & N IslandsAndhra PradeshArunachal PradeshAssamBiharChandigarhChhattisgarhDadra & Nagar HaveliDaman & DiuDelhiGoaGujaratHaryanaHimachal PradeshJammu & KashmirJharkhandKarnatakaKeralaLakshadweepMadhya PradeshMaharashtraManipurMeghalayaMizoramNagalandOdishaPuducherryPunjabRajasthanSikkimTamil NaduTripuraUttar PradeshUttarakhandWest Bengal
All States
0.50 1.12 1.70 3.84 2.78 1.25 - 1.54 3.50 3.66 3.33 NA 84.36 -2.16 0.78 1.40 0.28 1.21 0.57 4.80 5.75 5.39 5.73 5.03 83.99 84.24 82.806.04 5.31 4.85 4.41 4.06 3.31 16.60 20.70 18.71 19.05 18.36 60.54 46.18 44.823.49 4.24 2.61 1.90 3.01 3.23 12.66 9.64 8.60 9.30 7.89 93.26 51.55 56.116.70 2.08 3.90 0.84 9.95 4.37 12.00 13.44 6.39 7.52 5.16 56.09 63.58 66.532.79 9.29 2.09 7.79 1.36 3.18 - - - - - - - -5.94 4.38 5.35 2.09 5.71 2.73 7.86 6.20 5.37 5.62 5.10 69.87 61.72 74.91
12.23 7.23 7.90 3.64 5.81 3.15 4.53 2.82 2.04 1.39 2.77 85.54 82.42 82.9210.72 4.84 6.02 3.18 0.00 0.00 22.66 2.29 6.27 6.36 6.17 - 93.27 -
0.53 4.25 3.11 2.74 2.72 2.73 - 0.30 - - - - - 98.475.76 12.60 3.11 7.75 4.70 10.55 - 5.00 0.97 2.09 - 90.69 98.89 -7.83 4.23 5.83 2.75 9.62 4.99 2.72 3.86 4.27 3.79 4.83 82.83 84.59 80.836.42 6.33 6.10 4.71 3.13 1.82 0.73 0.15 6.21 5.37 7.15 - - -4.17 9.80 2.28 6.36 2.96 6.02 2.01 2.83 - - - 94.52 97.87 93.651.03 2.53 1.15 2.37 1.68 1.91 0.18 3.47 1.22 5.34 5.29 79.83 84.64 86.378.83 2.76 6.54 1.71 8.94 2.55 15.14 15.79 10.49 10.86 10.11 71.35 53.06 47.731.93 1.67 1.38 1.19 1.71 1.35 4.53 4.11 3.64 3.73 3.56 86.77 75.90 74.773.03 4.83 1.47 2.11 2.11 2.97 - - - - - - - -1.84 6.74 0.64 2.36 1.15 2.80 5.69 4.20 2.38 2.54 2.23 - - -
10.44 6.97 7.89 5.28 5.56 3.48 6.55 8.20 8.61 9.48 7.72 75.14 71.78 70.105.26 4.64 3.71 2.63 1.24 1.05 3.12 3.32 2.10 2.10 2.10 88.82 87.70 88.652.16 0.76 3.62 1.26 2.78 2.55 19.62 10.48 9.06 8.80 9.33 - 45.90 56.465.61 5.71 2.96 2.99 5.07 4.53 18.59 17.28 12.67 13.50 11.85 57.18 55.46 56.053.08 3.48 2.38 2.06 3.52 3.32 7.28 5.28 11.95 10.42 13.59 69.71 69.00 61.573.35 3.63 2.10 2.58 5.18 4.67 2.78 11.41 5.18 5.87 4.45 54.64 49.65 48.675.75 5.07 4.65 3.37 4.83 3.63 3.49 6.34 6.05 6.13 5.97 80.65 77.51 -0.37 3.70 0.38 5.34 0.07 0.12 - - 0.44 0.98 - - - 98.377.73 14.98 8.73 7.47 4.26 6.67 2.91 4.73 1.82 1.50 2.21 80.44 96.97 -6.99 7.74 6.73 4.89 9.51 7.58 11.35 10.54 10.76 10.89 10.61 60.21 53.71 50.03
16.57 14.51 11.30 11.12 12.63 10.95 3.49 4.46 7.11 8.41 5.75 64.78 69.52 78.550.33 1.97 0.22 1.25 0.14 0.46 0.22 0.15 1.19 1.33 1.04 97.05 - -4.36 9.11 2.54 9.26 2.92 7.63 2.68 8.82 11.93 12.33 11.52 73.46 71.53 66.581.13 0.79 0.63 0.38 1.95 2.23 12.65 16.71 11.06 11.67 10.43 73.95 69.59 69.854.52 3.90 3.74 3.32 5.30 3.28 6.99 9.93 5.84 6.48 5.15 75.95 80.61 92.73
12.04 15.50 8.96 7.87 11.18 8.68 7.98 8.66 6.49 7.00 5.96 58.15 73.49 68.515.24 4.69 3.88 2.75 5.08 3.35 8.02 9.11 6.76 7.13 6.37 74.92 74.01 73.42
2008-09 2009-10 2010-11
Average Repetition Rate#
# : Average repetition and drop-out rates have been based on data of common schools. States showing negative rates have not been reported.** : Retention rate at primary level is calculated based on the enrolment data of Grade I (2006-07) & Grade V (2010-11) including enrolment in unrecognised
schools. At all-India level, it is based on the data of 609 districts. Without enrolment in unrecognised schools, retention rate at all-India level is 72.08 percent.
PrimaryClasses
Retention Rate at Primary Level (Grade I to V)**UpperPrimaryClasses
PrimaryClasses
UpperPrimaryClasses
PrimaryClasses
UpperPrimaryClasses
Average Drop-out Rate at Primary Level#
2007-08 2008-09
2009-10
All Boys Girls 2008-09 2009-10 2010-11
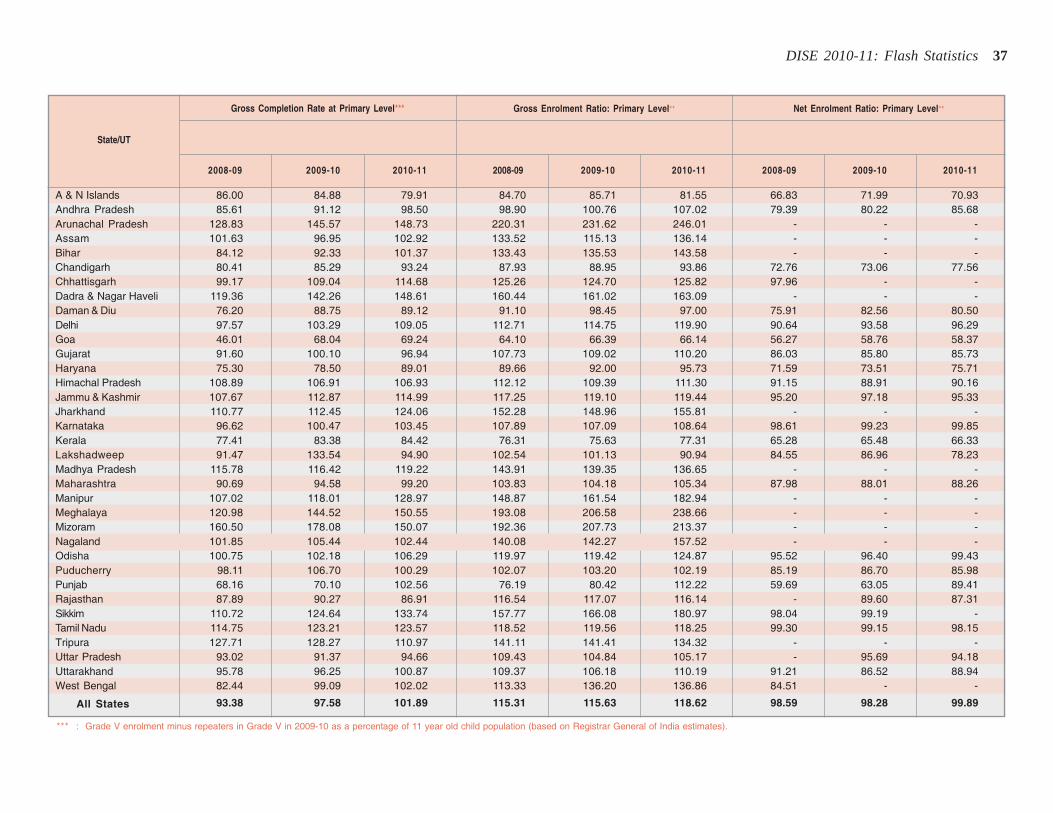
DISE 2010-11: Flash Statistics 37
State/UT
Net Enrolment Ratio: Primary Level++
2008-09 2009-10 2010-11 2008-09 2009-10 2010-11 2008-09 2009-10 2010-11
Gross Completion Rate at Primary Level*** Gross Enrolment Ratio: Primary Level++
A & N IslandsAndhra PradeshArunachal PradeshAssamBiharChandigarhChhattisgarhDadra & Nagar HaveliDaman & DiuDelhiGoaGujaratHaryanaHimachal PradeshJammu & KashmirJharkhandKarnatakaKeralaLakshadweepMadhya PradeshMaharashtraManipurMeghalayaMizoramNagalandOdishaPuducherryPunjabRajasthanSikkimTamil NaduTripuraUttar PradeshUttarakhandWest Bengal
All States
86.00 84.88 79.91 84.70 85.71 81.55 66.83 71.99 70.9385.61 91.12 98.50 98.90 100.76 107.02 79.39 80.22 85.68
128.83 145.57 148.73 220.31 231.62 246.01 - - -101.63 96.95 102.92 133.52 115.13 136.14 - - -
84.12 92.33 101.37 133.43 135.53 143.58 - - -80.41 85.29 93.24 87.93 88.95 93.86 72.76 73.06 77.5699.17 109.04 114.68 125.26 124.70 125.82 97.96 - -
119.36 142.26 148.61 160.44 161.02 163.09 - - -76.20 88.75 89.12 91.10 98.45 97.00 75.91 82.56 80.5097.57 103.29 109.05 112.71 114.75 119.90 90.64 93.58 96.2946.01 68.04 69.24 64.10 66.39 66.14 56.27 58.76 58.3791.60 100.10 96.94 107.73 109.02 110.20 86.03 85.80 85.7375.30 78.50 89.01 89.66 92.00 95.73 71.59 73.51 75.71
108.89 106.91 106.93 112.12 109.39 111.30 91.15 88.91 90.16107.67 112.87 114.99 117.25 119.10 119.44 95.20 97.18 95.33110.77 112.45 124.06 152.28 148.96 155.81 - - -96.62 100.47 103.45 107.89 107.09 108.64 98.61 99.23 99.8577.41 83.38 84.42 76.31 75.63 77.31 65.28 65.48 66.3391.47 133.54 94.90 102.54 101.13 90.94 84.55 86.96 78.23
115.78 116.42 119.22 143.91 139.35 136.65 - - -90.69 94.58 99.20 103.83 104.18 105.34 87.98 88.01 88.26
107.02 118.01 128.97 148.87 161.54 182.94 - - -120.98 144.52 150.55 193.08 206.58 238.66 - - -160.50 178.08 150.07 192.36 207.73 213.37 - - -101.85 105.44 102.44 140.08 142.27 157.52 - - -100.75 102.18 106.29 119.97 119.42 124.87 95.52 96.40 99.43
98.11 106.70 100.29 102.07 103.20 102.19 85.19 86.70 85.9868.16 70.10 102.56 76.19 80.42 112.22 59.69 63.05 89.4187.89 90.27 86.91 116.54 117.07 116.14 - 89.60 87.31
110.72 124.64 133.74 157.77 166.08 180.97 98.04 99.19 -114.75 123.21 123.57 118.52 119.56 118.25 99.30 99.15 98.15127.71 128.27 110.97 141.11 141.41 134.32 - - -
93.02 91.37 94.66 109.43 104.84 105.17 - 95.69 94.1895.78 96.25 100.87 109.37 106.18 110.19 91.21 86.52 88.9482.44 99.09 102.02 113.33 136.20 136.86 84.51 - -
93.38 97.58 101.89 115.31 115.63 118.62 98.59 98.28 99.89
*** : Grade V enrolment minus repeaters in Grade V in 2009-10 as a percentage of 11 year old child population (based on Registrar General of India estimates).
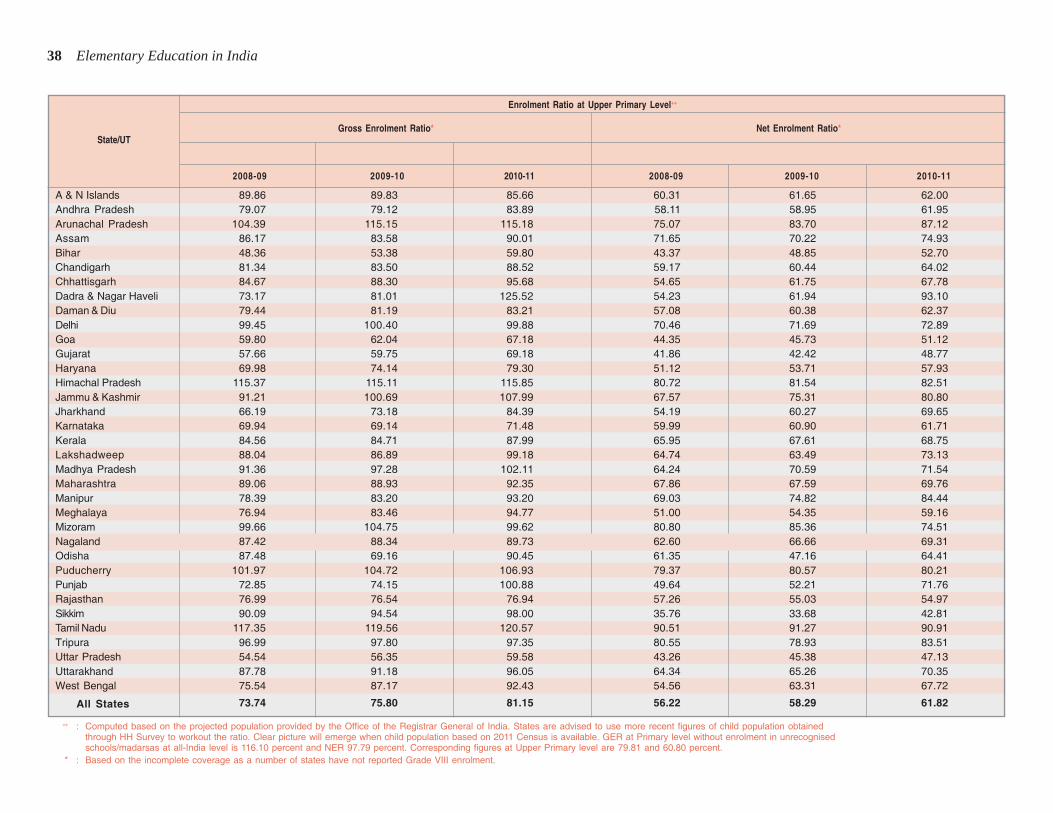
38 Elementary Education in India
State/UT
2008-09 2009-10 2010-11 2008-09 2009-10 2010-11
Enrolment Ratio at Upper Primary Level++
A & N IslandsAndhra PradeshArunachal PradeshAssamBiharChandigarhChhattisgarhDadra & Nagar HaveliDaman & DiuDelhiGoaGujaratHaryanaHimachal PradeshJammu & KashmirJharkhandKarnatakaKeralaLakshadweepMadhya PradeshMaharashtraManipurMeghalayaMizoramNagalandOdishaPuducherryPunjabRajasthanSikkimTamil NaduTripuraUttar PradeshUttarakhandWest Bengal
All States
89.86 89.83 85.66 60.31 61.65 62.0079.07 79.12 83.89 58.11 58.95 61.95
104.39 115.15 115.18 75.07 83.70 87.1286.17 83.58 90.01 71.65 70.22 74.9348.36 53.38 59.80 43.37 48.85 52.7081.34 83.50 88.52 59.17 60.44 64.0284.67 88.30 95.68 54.65 61.75 67.7873.17 81.01 125.52 54.23 61.94 93.1079.44 81.19 83.21 57.08 60.38 62.3799.45 100.40 99.88 70.46 71.69 72.8959.80 62.04 67.18 44.35 45.73 51.1257.66 59.75 69.18 41.86 42.42 48.7769.98 74.14 79.30 51.12 53.71 57.93
115.37 115.11 115.85 80.72 81.54 82.5191.21 100.69 107.99 67.57 75.31 80.8066.19 73.18 84.39 54.19 60.27 69.6569.94 69.14 71.48 59.99 60.90 61.7184.56 84.71 87.99 65.95 67.61 68.7588.04 86.89 99.18 64.74 63.49 73.1391.36 97.28 102.11 64.24 70.59 71.5489.06 88.93 92.35 67.86 67.59 69.7678.39 83.20 93.20 69.03 74.82 84.4476.94 83.46 94.77 51.00 54.35 59.1699.66 104.75 99.62 80.80 85.36 74.5187.42 88.34 89.73 62.60 66.66 69.3187.48 69.16 90.45 61.35 47.16 64.41
101.97 104.72 106.93 79.37 80.57 80.2172.85 74.15 100.88 49.64 52.21 71.7676.99 76.54 76.94 57.26 55.03 54.9790.09 94.54 98.00 35.76 33.68 42.81
117.35 119.56 120.57 90.51 91.27 90.9196.99 97.80 97.35 80.55 78.93 83.5154.54 56.35 59.58 43.26 45.38 47.1387.78 91.18 96.05 64.34 65.26 70.3575.54 87.17 92.43 54.56 63.31 67.72
73.74 75.80 81.15 56.22 58.29 61.82
++ : Computed based on the projected population provided by the Office of the Registrar General of India. States are advised to use more recent figures of child population obtainedthrough HH Survey to workout the ratio. Clear picture will emerge when child population based on 2011 Census is available. GER at Primary level without enrolment in unrecognisedschools/madarsas at all-India level is 116.10 percent and NER 97.79 percent. Corresponding figures at Upper Primary level are 79.81 and 60.80 percent.
* : Based on the incomplete coverage as a number of states have not reported Grade VIII enrolment.
Gross Enrolment Ratio* Net Enrolment Ratio*
EDUCATIONALEDUCATIONALEDUCATIONALEDUCATIONALEDUCATIONAL
DEVELOPMENTDEVELOPMENTDEVELOPMENTDEVELOPMENTDEVELOPMENT
INDEXINDEXINDEXINDEXINDEX
(EDI)(EDI)(EDI)(EDI)(EDI)
2010-112010-112010-112010-112010-11
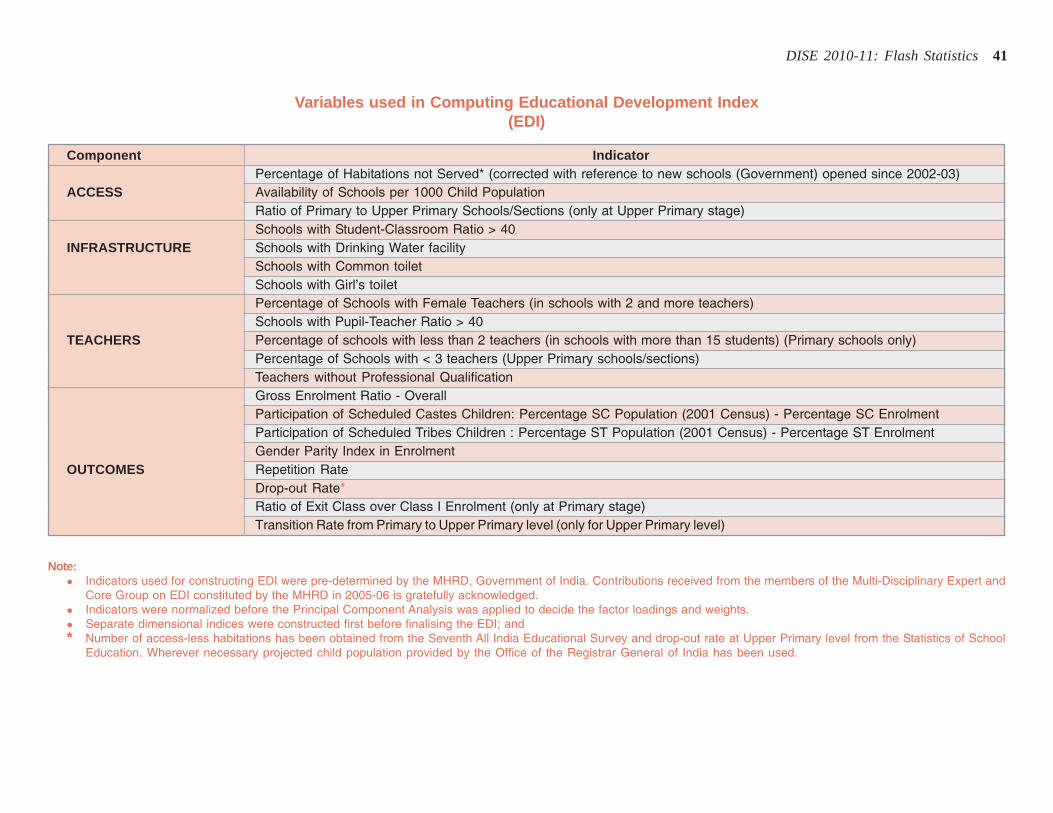
DISE 2010-11: Flash Statistics 41
Variables used in Computing Educational Development Index(EDI)
Component IndicatorPercentage of Habitations not Served* (corrected with reference to new schools (Government) opened since 2002-03)
ACCESS Availability of Schools per 1000 Child PopulationRatio of Primary to Upper Primary Schools/Sections (only at Upper Primary stage)Schools with Student-Classroom Ratio > 40
INFRASTRUCTURE Schools with Drinking Water facilitySchools with Common toiletSchools with Girl’s toiletPercentage of Schools with Female Teachers (in schools with 2 and more teachers)Schools with Pupil-Teacher Ratio > 40
TEACHERS Percentage of schools with less than 2 teachers (in schools with more than 15 students) (Primary schools only)Percentage of Schools with < 3 teachers (Upper Primary schools/sections)Teachers without Professional QualificationGross Enrolment Ratio - OverallParticipation of Scheduled Castes Children: Percentage SC Population (2001 Census) - Percentage SC EnrolmentParticipation of Scheduled Tribes Children : Percentage ST Population (2001 Census) - Percentage ST EnrolmentGender Parity Index in Enrolment
OUTCOMES Repetition RateDrop-out Rate*Ratio of Exit Class over Class I Enrolment (only at Primary stage)Transition Rate from Primary to Upper Primary level (only for Upper Primary level)
Note:� Indicators used for constructing EDI were pre-determined by the MHRD, Government of India. Contributions received from the members of the Multi-Disciplinary Expert and
Core Group on EDI constituted by the MHRD in 2005-06 is gratefully acknowledged.� Indicators were normalized before the Principal Component Analysis was applied to decide the factor loadings and weights.� Separate dimensional indices were constructed first before finalising the EDI; and* Number of access-less habitations has been obtained from the Seventh All India Educational Survey and drop-out rate at Upper Primary level from the Statistics of School
Education. Wherever necessary projected child population provided by the Office of the Registrar General of India has been used.
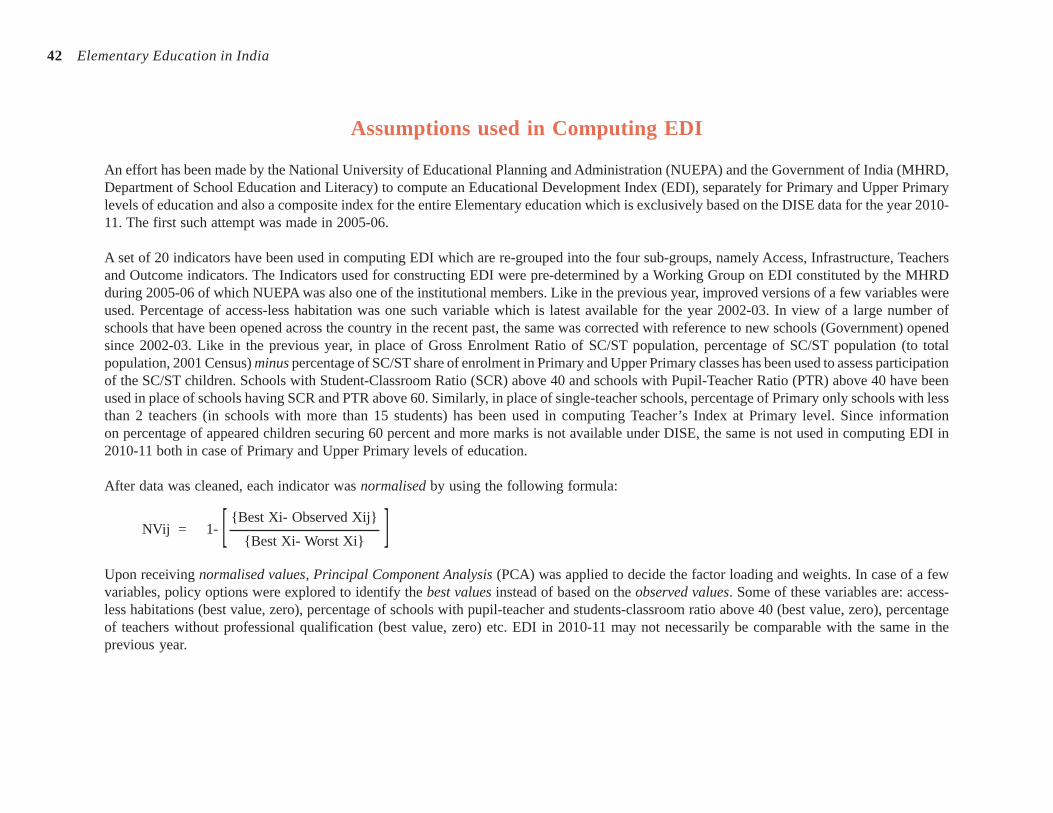
42 Elementary Education in India
Assumptions used in Computing EDI
An effort has been made by the National University of Educational Planning and Administration (NUEPA) and the Government of India (MHRD,Department of School Education and Literacy) to compute an Educational Development Index (EDI), separately for Primary and Upper Primarylevels of education and also a composite index for the entire Elementary education which is exclusively based on the DISE data for the year 2010-11. The first such attempt was made in 2005-06.
A set of 20 indicators have been used in computing EDI which are re-grouped into the four sub-groups, namely Access, Infrastructure, Teachersand Outcome indicators. The Indicators used for constructing EDI were pre-determined by a Working Group on EDI constituted by the MHRDduring 2005-06 of which NUEPA was also one of the institutional members. Like in the previous year, improved versions of a few variables wereused. Percentage of access-less habitation was one such variable which is latest available for the year 2002-03. In view of a large number ofschools that have been opened across the country in the recent past, the same was corrected with reference to new schools (Government) openedsince 2002-03. Like in the previous year, in place of Gross Enrolment Ratio of SC/ST population, percentage of SC/ST population (to totalpopulation, 2001 Census) minus percentage of SC/ST share of enrolment in Primary and Upper Primary classes has been used to assess participationof the SC/ST children. Schools with Student-Classroom Ratio (SCR) above 40 and schools with Pupil-Teacher Ratio (PTR) above 40 have beenused in place of schools having SCR and PTR above 60. Similarly, in place of single-teacher schools, percentage of Primary only schools with lessthan 2 teachers (in schools with more than 15 students) has been used in computing Teacher’s Index at Primary level. Since informationon percentage of appeared children securing 60 percent and more marks is not available under DISE, the same is not used in computing EDI in2010-11 both in case of Primary and Upper Primary levels of education.
After data was cleaned, each indicator was normalised by using the following formula:
{Best Xi- Observed Xij}NVij = 1-
{Best Xi- Worst Xi}
Upon receiving normalised values, Principal Component Analysis (PCA) was applied to decide the factor loading and weights. In case of a fewvariables, policy options were explored to identify the best values instead of based on the observed values. Some of these variables are: access-less habitations (best value, zero), percentage of schools with pupil-teacher and students-classroom ratio above 40 (best value, zero), percentageof teachers without professional qualification (best value, zero) etc. EDI in 2010-11 may not necessarily be comparable with the same in theprevious year.
[ ]
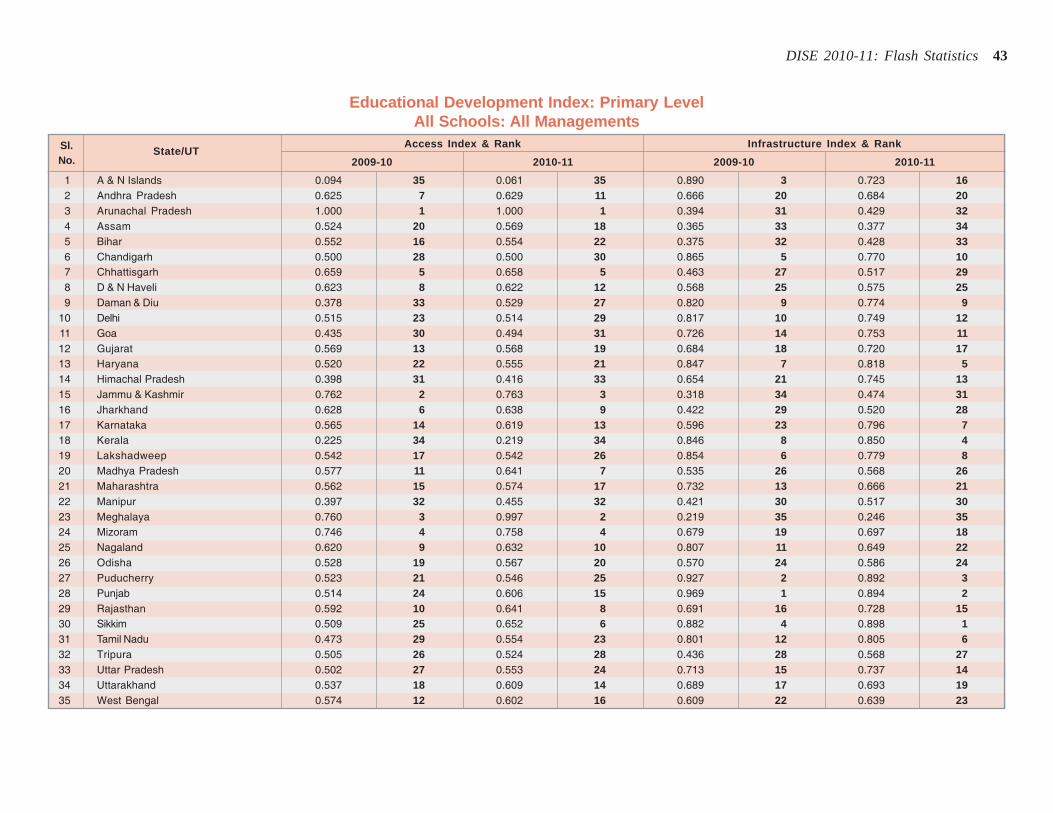
DISE 2010-11: Flash Statistics 43
Educational Development Index: Primary LevelAll Schools: All Managements
Sl. State/UTAccess Index & Rank Infrastructure Index & Rank
No. 2009-10 2010-11 2009-10 2010-11
1 A & N Islands 0.094 35 0.061 35 0.890 3 0.723 162 Andhra Pradesh 0.625 7 0.629 11 0.666 20 0.684 203 Arunachal Pradesh 1.000 1 1.000 1 0.394 31 0.429 324 Assam 0.524 20 0.569 18 0.365 33 0.377 345 Bihar 0.552 16 0.554 22 0.375 32 0.428 336 Chandigarh 0.500 28 0.500 30 0.865 5 0.770 107 Chhattisgarh 0.659 5 0.658 5 0.463 27 0.517 298 D & N Haveli 0.623 8 0.622 12 0.568 25 0.575 259 Daman & Diu 0.378 33 0.529 27 0.820 9 0.774 9
10 Delhi 0.515 23 0.514 29 0.817 10 0.749 1211 Goa 0.435 30 0.494 31 0.726 14 0.753 1112 Gujarat 0.569 13 0.568 19 0.684 18 0.720 1713 Haryana 0.520 22 0.555 21 0.847 7 0.818 514 Himachal Pradesh 0.398 31 0.416 33 0.654 21 0.745 1315 Jammu & Kashmir 0.762 2 0.763 3 0.318 34 0.474 3116 Jharkhand 0.628 6 0.638 9 0.422 29 0.520 2817 Karnataka 0.565 14 0.619 13 0.596 23 0.796 718 Kerala 0.225 34 0.219 34 0.846 8 0.850 419 Lakshadweep 0.542 17 0.542 26 0.854 6 0.779 820 Madhya Pradesh 0.577 11 0.641 7 0.535 26 0.568 2621 Maharashtra 0.562 15 0.574 17 0.732 13 0.666 2122 Manipur 0.397 32 0.455 32 0.421 30 0.517 3023 Meghalaya 0.760 3 0.997 2 0.219 35 0.246 3524 Mizoram 0.746 4 0.758 4 0.679 19 0.697 1825 Nagaland 0.620 9 0.632 10 0.807 11 0.649 2226 Odisha 0.528 19 0.567 20 0.570 24 0.586 2427 Puducherry 0.523 21 0.546 25 0.927 2 0.892 328 Punjab 0.514 24 0.606 15 0.969 1 0.894 229 Rajasthan 0.592 10 0.641 8 0.691 16 0.728 1530 Sikkim 0.509 25 0.652 6 0.882 4 0.898 131 Tamil Nadu 0.473 29 0.554 23 0.801 12 0.805 632 Tripura 0.505 26 0.524 28 0.436 28 0.568 2733 Uttar Pradesh 0.502 27 0.553 24 0.713 15 0.737 1434 Uttarakhand 0.537 18 0.609 14 0.689 17 0.693 1935 West Bengal 0.574 12 0.602 16 0.609 22 0.639 23
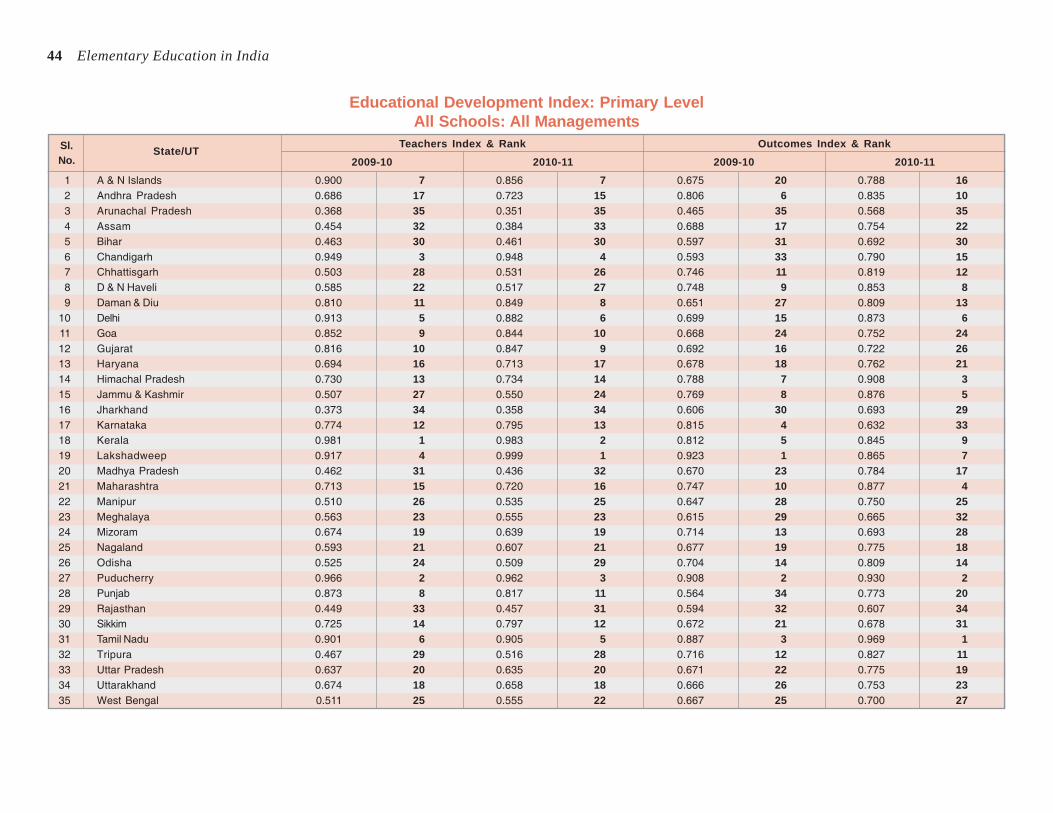
44 Elementary Education in India
Educational Development Index: Primary LevelAll Schools: All Managements
Sl. State/UTTeachers Index & Rank Outcomes Index & Rank
No. 2009-10 2010-11 2009-10 2010-11
1 A & N Islands 0.900 7 0.856 7 0.675 20 0.788 162 Andhra Pradesh 0.686 17 0.723 15 0.806 6 0.835 103 Arunachal Pradesh 0.368 35 0.351 35 0.465 35 0.568 354 Assam 0.454 32 0.384 33 0.688 17 0.754 225 Bihar 0.463 30 0.461 30 0.597 31 0.692 306 Chandigarh 0.949 3 0.948 4 0.593 33 0.790 157 Chhattisgarh 0.503 28 0.531 26 0.746 11 0.819 128 D & N Haveli 0.585 22 0.517 27 0.748 9 0.853 89 Daman & Diu 0.810 11 0.849 8 0.651 27 0.809 13
10 Delhi 0.913 5 0.882 6 0.699 15 0.873 611 Goa 0.852 9 0.844 10 0.668 24 0.752 2412 Gujarat 0.816 10 0.847 9 0.692 16 0.722 2613 Haryana 0.694 16 0.713 17 0.678 18 0.762 2114 Himachal Pradesh 0.730 13 0.734 14 0.788 7 0.908 315 Jammu & Kashmir 0.507 27 0.550 24 0.769 8 0.876 516 Jharkhand 0.373 34 0.358 34 0.606 30 0.693 2917 Karnataka 0.774 12 0.795 13 0.815 4 0.632 3318 Kerala 0.981 1 0.983 2 0.812 5 0.845 919 Lakshadweep 0.917 4 0.999 1 0.923 1 0.865 720 Madhya Pradesh 0.462 31 0.436 32 0.670 23 0.784 1721 Maharashtra 0.713 15 0.720 16 0.747 10 0.877 422 Manipur 0.510 26 0.535 25 0.647 28 0.750 2523 Meghalaya 0.563 23 0.555 23 0.615 29 0.665 3224 Mizoram 0.674 19 0.639 19 0.714 13 0.693 2825 Nagaland 0.593 21 0.607 21 0.677 19 0.775 1826 Odisha 0.525 24 0.509 29 0.704 14 0.809 1427 Puducherry 0.966 2 0.962 3 0.908 2 0.930 228 Punjab 0.873 8 0.817 11 0.564 34 0.773 2029 Rajasthan 0.449 33 0.457 31 0.594 32 0.607 3430 Sikkim 0.725 14 0.797 12 0.672 21 0.678 3131 Tamil Nadu 0.901 6 0.905 5 0.887 3 0.969 132 Tripura 0.467 29 0.516 28 0.716 12 0.827 1133 Uttar Pradesh 0.637 20 0.635 20 0.671 22 0.775 1934 Uttarakhand 0.674 18 0.658 18 0.666 26 0.753 2335 West Bengal 0.511 25 0.555 22 0.667 25 0.700 27
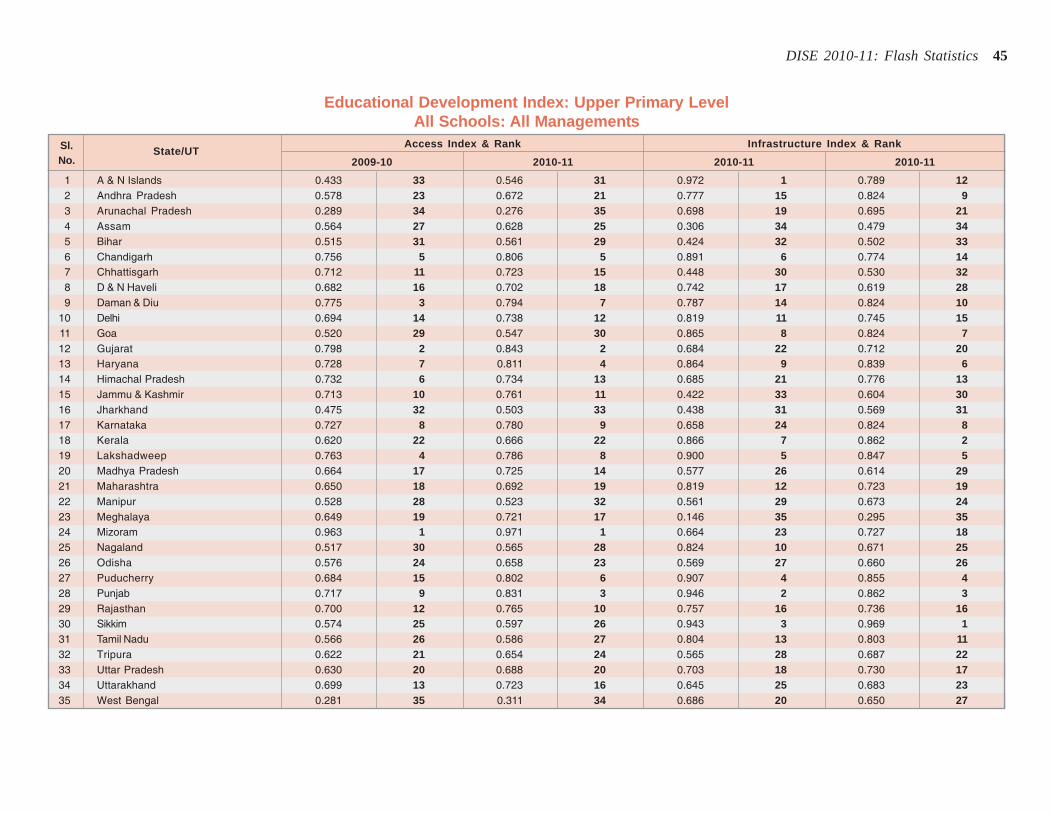
DISE 2010-11: Flash Statistics 45
Educational Development Index: Upper Primary LevelAll Schools: All Managements
Sl. State/UTAccess Index & Rank Infrastructure Index & Rank
No. 2009-10 2010-11 2010-11 2010-11
1 A & N Islands 0.433 33 0.546 31 0.972 1 0.789 122 Andhra Pradesh 0.578 23 0.672 21 0.777 15 0.824 93 Arunachal Pradesh 0.289 34 0.276 35 0.698 19 0.695 214 Assam 0.564 27 0.628 25 0.306 34 0.479 345 Bihar 0.515 31 0.561 29 0.424 32 0.502 336 Chandigarh 0.756 5 0.806 5 0.891 6 0.774 147 Chhattisgarh 0.712 11 0.723 15 0.448 30 0.530 328 D & N Haveli 0.682 16 0.702 18 0.742 17 0.619 289 Daman & Diu 0.775 3 0.794 7 0.787 14 0.824 10
10 Delhi 0.694 14 0.738 12 0.819 11 0.745 1511 Goa 0.520 29 0.547 30 0.865 8 0.824 712 Gujarat 0.798 2 0.843 2 0.684 22 0.712 2013 Haryana 0.728 7 0.811 4 0.864 9 0.839 614 Himachal Pradesh 0.732 6 0.734 13 0.685 21 0.776 1315 Jammu & Kashmir 0.713 10 0.761 11 0.422 33 0.604 3016 Jharkhand 0.475 32 0.503 33 0.438 31 0.569 3117 Karnataka 0.727 8 0.780 9 0.658 24 0.824 818 Kerala 0.620 22 0.666 22 0.866 7 0.862 219 Lakshadweep 0.763 4 0.786 8 0.900 5 0.847 520 Madhya Pradesh 0.664 17 0.725 14 0.577 26 0.614 2921 Maharashtra 0.650 18 0.692 19 0.819 12 0.723 1922 Manipur 0.528 28 0.523 32 0.561 29 0.673 2423 Meghalaya 0.649 19 0.721 17 0.146 35 0.295 3524 Mizoram 0.963 1 0.971 1 0.664 23 0.727 1825 Nagaland 0.517 30 0.565 28 0.824 10 0.671 2526 Odisha 0.576 24 0.658 23 0.569 27 0.660 2627 Puducherry 0.684 15 0.802 6 0.907 4 0.855 428 Punjab 0.717 9 0.831 3 0.946 2 0.862 329 Rajasthan 0.700 12 0.765 10 0.757 16 0.736 1630 Sikkim 0.574 25 0.597 26 0.943 3 0.969 131 Tamil Nadu 0.566 26 0.586 27 0.804 13 0.803 1132 Tripura 0.622 21 0.654 24 0.565 28 0.687 2233 Uttar Pradesh 0.630 20 0.688 20 0.703 18 0.730 1734 Uttarakhand 0.699 13 0.723 16 0.645 25 0.683 2335 West Bengal 0.281 35 0.311 34 0.686 20 0.650 27
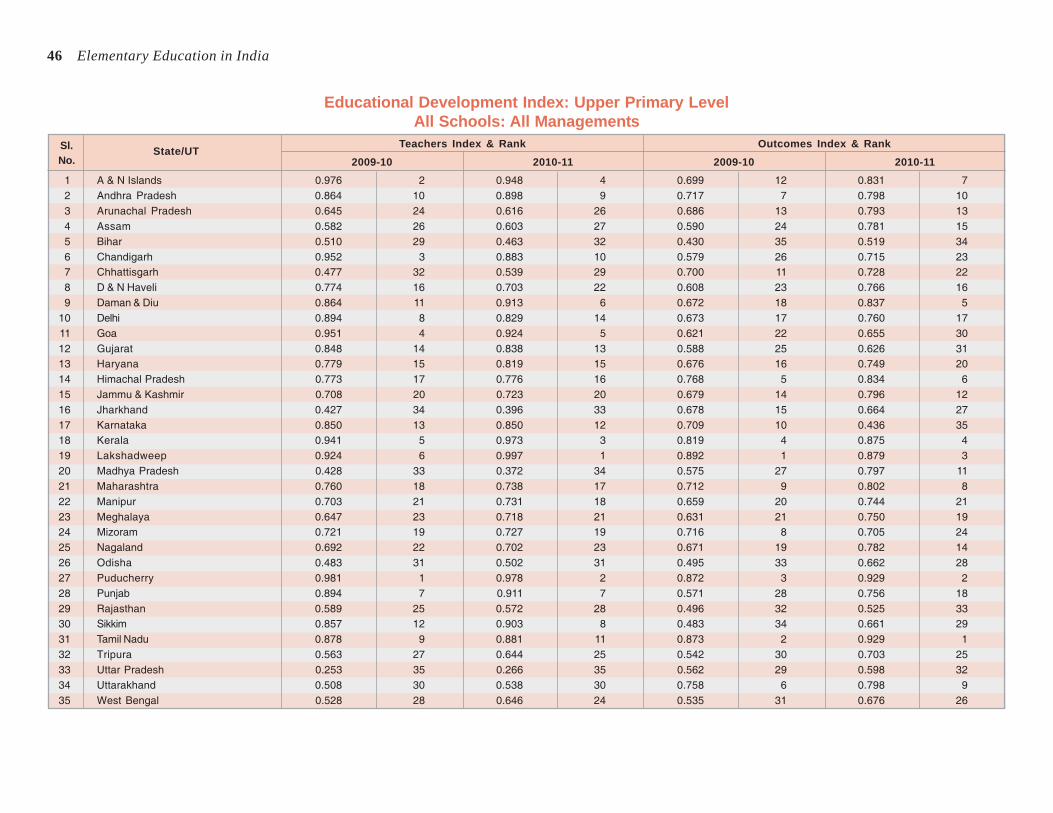
46 Elementary Education in India
Educational Development Index: Upper Primary LevelAll Schools: All Managements
Sl. State/UTTeachers Index & Rank Outcomes Index & Rank
No. 2009-10 2010-11 2009-10 2010-11
1 A & N Islands 0.976 2 0.948 4 0.699 12 0.831 72 Andhra Pradesh 0.864 10 0.898 9 0.717 7 0.798 103 Arunachal Pradesh 0.645 24 0.616 26 0.686 13 0.793 134 Assam 0.582 26 0.603 27 0.590 24 0.781 155 Bihar 0.510 29 0.463 32 0.430 35 0.519 346 Chandigarh 0.952 3 0.883 10 0.579 26 0.715 237 Chhattisgarh 0.477 32 0.539 29 0.700 11 0.728 228 D & N Haveli 0.774 16 0.703 22 0.608 23 0.766 169 Daman & Diu 0.864 11 0.913 6 0.672 18 0.837 5
10 Delhi 0.894 8 0.829 14 0.673 17 0.760 1711 Goa 0.951 4 0.924 5 0.621 22 0.655 3012 Gujarat 0.848 14 0.838 13 0.588 25 0.626 3113 Haryana 0.779 15 0.819 15 0.676 16 0.749 2014 Himachal Pradesh 0.773 17 0.776 16 0.768 5 0.834 615 Jammu & Kashmir 0.708 20 0.723 20 0.679 14 0.796 1216 Jharkhand 0.427 34 0.396 33 0.678 15 0.664 2717 Karnataka 0.850 13 0.850 12 0.709 10 0.436 3518 Kerala 0.941 5 0.973 3 0.819 4 0.875 419 Lakshadweep 0.924 6 0.997 1 0.892 1 0.879 320 Madhya Pradesh 0.428 33 0.372 34 0.575 27 0.797 1121 Maharashtra 0.760 18 0.738 17 0.712 9 0.802 822 Manipur 0.703 21 0.731 18 0.659 20 0.744 2123 Meghalaya 0.647 23 0.718 21 0.631 21 0.750 1924 Mizoram 0.721 19 0.727 19 0.716 8 0.705 2425 Nagaland 0.692 22 0.702 23 0.671 19 0.782 1426 Odisha 0.483 31 0.502 31 0.495 33 0.662 2827 Puducherry 0.981 1 0.978 2 0.872 3 0.929 228 Punjab 0.894 7 0.911 7 0.571 28 0.756 1829 Rajasthan 0.589 25 0.572 28 0.496 32 0.525 3330 Sikkim 0.857 12 0.903 8 0.483 34 0.661 2931 Tamil Nadu 0.878 9 0.881 11 0.873 2 0.929 132 Tripura 0.563 27 0.644 25 0.542 30 0.703 2533 Uttar Pradesh 0.253 35 0.266 35 0.562 29 0.598 3234 Uttarakhand 0.508 30 0.538 30 0.758 6 0.798 935 West Bengal 0.528 28 0.646 24 0.535 31 0.676 26
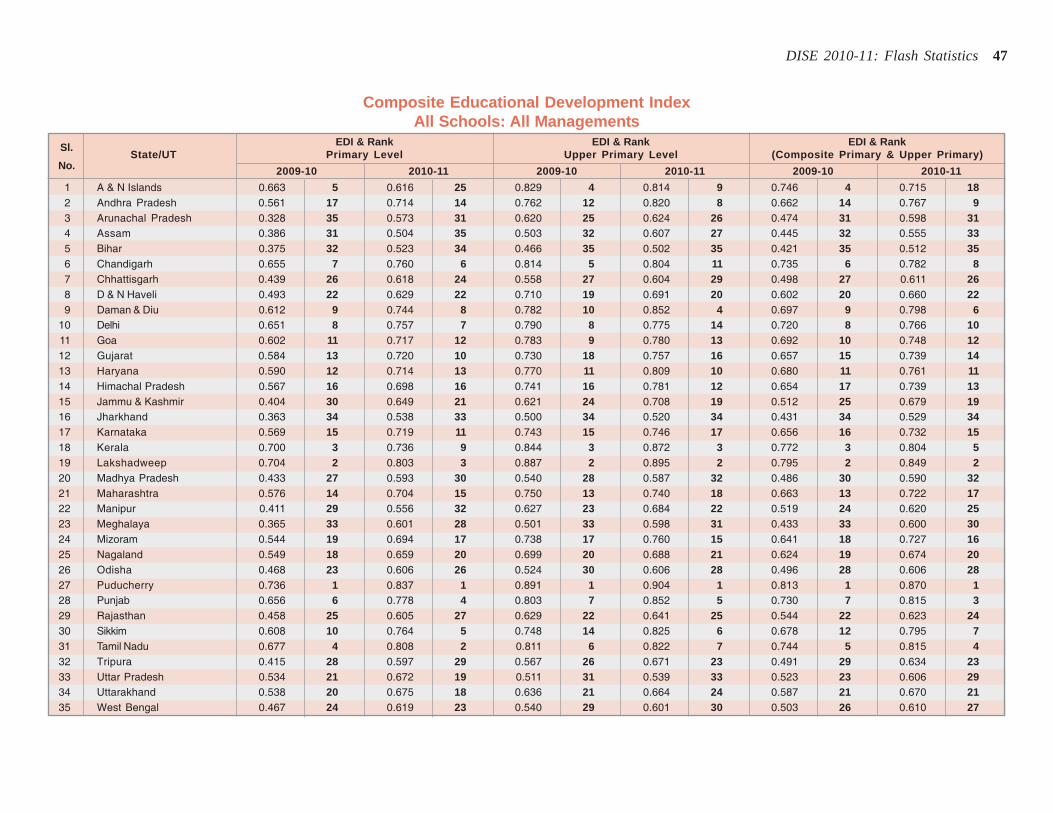
DISE 2010-11: Flash Statistics 47
Composite Educational Development IndexAll Schools: All Managements
Sl. EDI & Rank EDI & Rank EDI & RankState/UT Primary Level Upper Primary Level (Composite Primary & Upper Primary)
No. 2009-10 2010-11 2009-10 2010-11 2009-10 2010-11
1 A & N Islands 0.663 5 0.616 25 0.829 4 0.814 9 0.746 4 0.715 182 Andhra Pradesh 0.561 17 0.714 14 0.762 12 0.820 8 0.662 14 0.767 93 Arunachal Pradesh 0.328 35 0.573 31 0.620 25 0.624 26 0.474 31 0.598 314 Assam 0.386 31 0.504 35 0.503 32 0.607 27 0.445 32 0.555 335 Bihar 0.375 32 0.523 34 0.466 35 0.502 35 0.421 35 0.512 356 Chandigarh 0.655 7 0.760 6 0.814 5 0.804 11 0.735 6 0.782 87 Chhattisgarh 0.439 26 0.618 24 0.558 27 0.604 29 0.498 27 0.611 268 D & N Haveli 0.493 22 0.629 22 0.710 19 0.691 20 0.602 20 0.660 229 Daman & Diu 0.612 9 0.744 8 0.782 10 0.852 4 0.697 9 0.798 6
10 Delhi 0.651 8 0.757 7 0.790 8 0.775 14 0.720 8 0.766 1011 Goa 0.602 11 0.717 12 0.783 9 0.780 13 0.692 10 0.748 1212 Gujarat 0.584 13 0.720 10 0.730 18 0.757 16 0.657 15 0.739 1413 Haryana 0.590 12 0.714 13 0.770 11 0.809 10 0.680 11 0.761 1114 Himachal Pradesh 0.567 16 0.698 16 0.741 16 0.781 12 0.654 17 0.739 1315 Jammu & Kashmir 0.404 30 0.649 21 0.621 24 0.708 19 0.512 25 0.679 1916 Jharkhand 0.363 34 0.538 33 0.500 34 0.520 34 0.431 34 0.529 3417 Karnataka 0.569 15 0.719 11 0.743 15 0.746 17 0.656 16 0.732 1518 Kerala 0.700 3 0.736 9 0.844 3 0.872 3 0.772 3 0.804 519 Lakshadweep 0.704 2 0.803 3 0.887 2 0.895 2 0.795 2 0.849 220 Madhya Pradesh 0.433 27 0.593 30 0.540 28 0.587 32 0.486 30 0.590 3221 Maharashtra 0.576 14 0.704 15 0.750 13 0.740 18 0.663 13 0.722 1722 Manipur 0.411 29 0.556 32 0.627 23 0.684 22 0.519 24 0.620 2523 Meghalaya 0.365 33 0.601 28 0.501 33 0.598 31 0.433 33 0.600 3024 Mizoram 0.544 19 0.694 17 0.738 17 0.760 15 0.641 18 0.727 1625 Nagaland 0.549 18 0.659 20 0.699 20 0.688 21 0.624 19 0.674 2026 Odisha 0.468 23 0.606 26 0.524 30 0.606 28 0.496 28 0.606 2827 Puducherry 0.736 1 0.837 1 0.891 1 0.904 1 0.813 1 0.870 128 Punjab 0.656 6 0.778 4 0.803 7 0.852 5 0.730 7 0.815 329 Rajasthan 0.458 25 0.605 27 0.629 22 0.641 25 0.544 22 0.623 2430 Sikkim 0.608 10 0.764 5 0.748 14 0.825 6 0.678 12 0.795 731 Tamil Nadu 0.677 4 0.808 2 0.811 6 0.822 7 0.744 5 0.815 432 Tripura 0.415 28 0.597 29 0.567 26 0.671 23 0.491 29 0.634 2333 Uttar Pradesh 0.534 21 0.672 19 0.511 31 0.539 33 0.523 23 0.606 2934 Uttarakhand 0.538 20 0.675 18 0.636 21 0.664 24 0.587 21 0.670 2135 West Bengal 0.467 24 0.619 23 0.540 29 0.601 30 0.503 26 0.610 27