31
Flat-earth economics Far-reaching consequences of flat payoff functions David Pannell University of Western Australia
| Date post: | 14-Dec-2015 |
| Category: |
Documents |
| Upload: | madilyn-shrieves |
| View: | 217 times |
| Download: | 3 times |

Flat-earth economics
Far-reaching consequences of flat payoff functions
David PannellUniversity of Western Australia

Starting point
1983

Payoffs
profit expected value of profit expected utility any other objective function that
has an internal optimal solution

Example: whole farm plan
-10000
0
10000
20000
30000
40000
50000
60000
0% 20% 40% 60% 80% 100%
Percentage of farm land in crop
Wh
ole
-far
m a
nn
ual
pro
fit
(A$)
90% of maximum
51% 92%

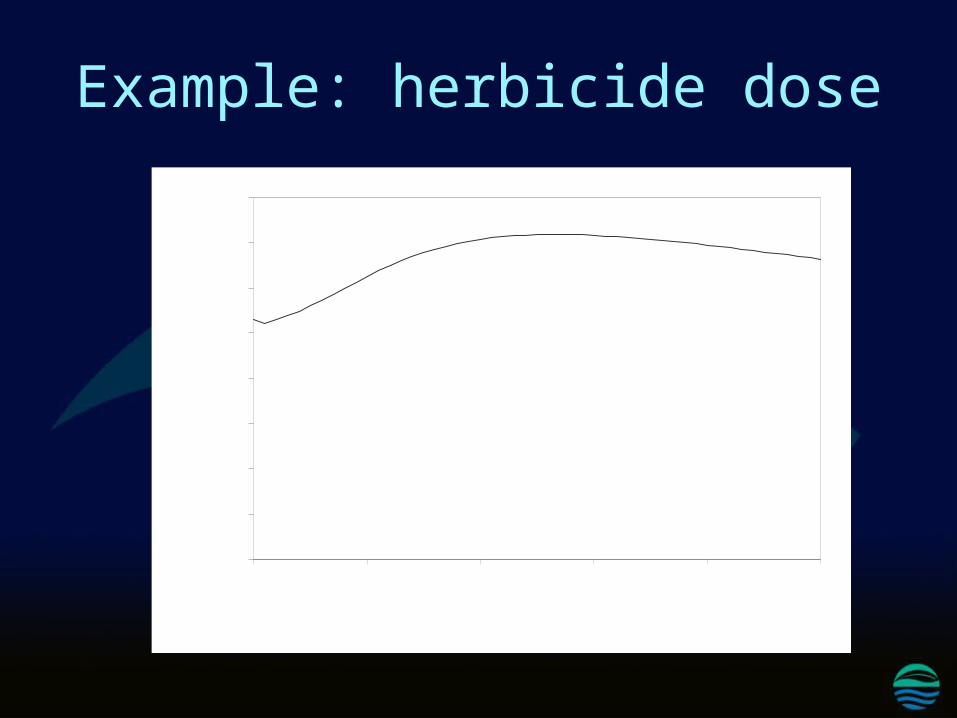
Example: herbicide dose
0
20
40
60
80
100
120
140
160
0 0.1 0.2 0.3 0.4 0.5
Herbicide dose (kg/ha)
Pro
fit
(A$
/ha
)
95% of maximum
0.440.15
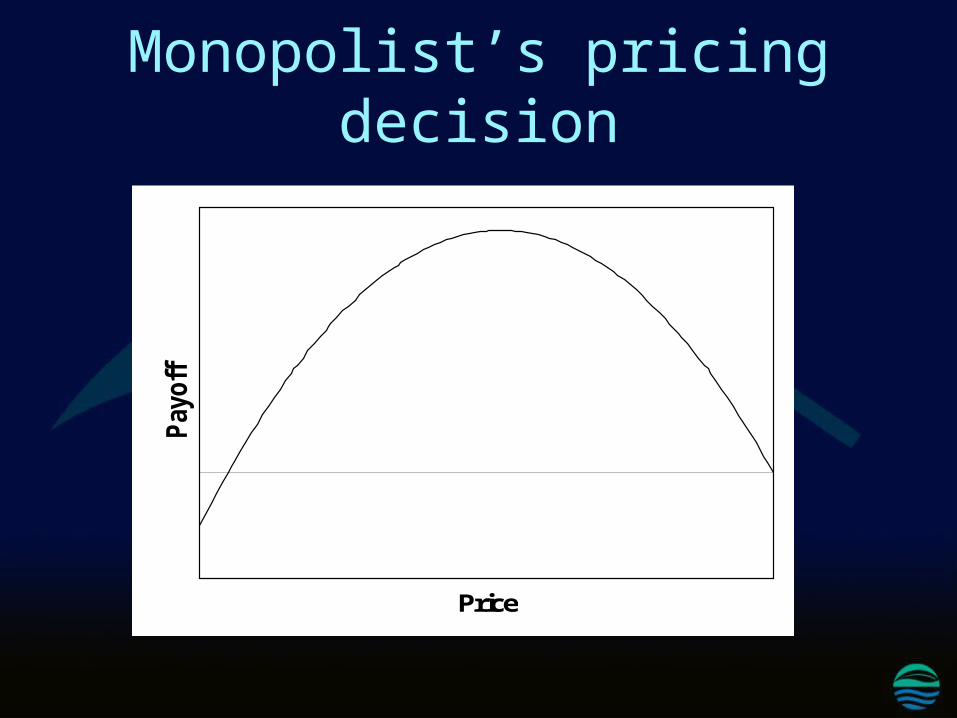
Monopolist’s pricing decision
Price
Pay
off
.

Jardine (1975):
“On presenting information to agronomists about flat profit curves for fertlizers, I observed such reactions as complete disbelief, blank incomprehension, incipient terror, and others less readily categorized.”
Flat payoff functions are:
A consistent empirical finding (almost universal)
Very important Rarely acknowledged
Debated in 1975, but apparently not since

What is behind it?
0
20
40
60
80
100
120
140
160
180
0 0.1 0.2 0.3 0.4 0.5
Herbicide dose (kg/ha)
Be
ne
fit
or
co
st
(A$
/ha
) Benefit
Cost

What is behind it?
Diversified portfolios e.g. because of
risk aversion variable resource quality resource constraints complementarity between enterprises
Implications
Implication 1:Margin for error
Decisions without careful analysis Can consider extra factors
Risk Personal preference
DSSs focus on plateau, not optimum

Implication 2: The value of monitoring
Sustainability indicators/EMS The value of information
decision theory framework What difference to the decision?
• information decision What difference then to payoff?
decision payoff Weighted by probabilities
Value often low

Implication 2: The value of monitoring
If payoff function is flat: Info may change decision But not change payoff by much
0.0
0.2
0.4
0.6
0.8
1.0
1.2
1.4
1.6
0 40 80 120 160 200 240 280
Area of trees (ha)
NP
V (
m$
)

Implication 2: The value of monitoring
If payoff function steep Optimal solution obvious More info doesn’t change it
0.8
0.9
1.0
1.1
1.2
0 40 80 120 160 200 240 280
Area of trees (ha)
NP
V (
m$
)
Either way, low info value
Implication 3: Precision farming
Jock Anderson (1975): "In pursuing optimal levels of
decision variables, precision is pretence and great accuracy is absurdity."
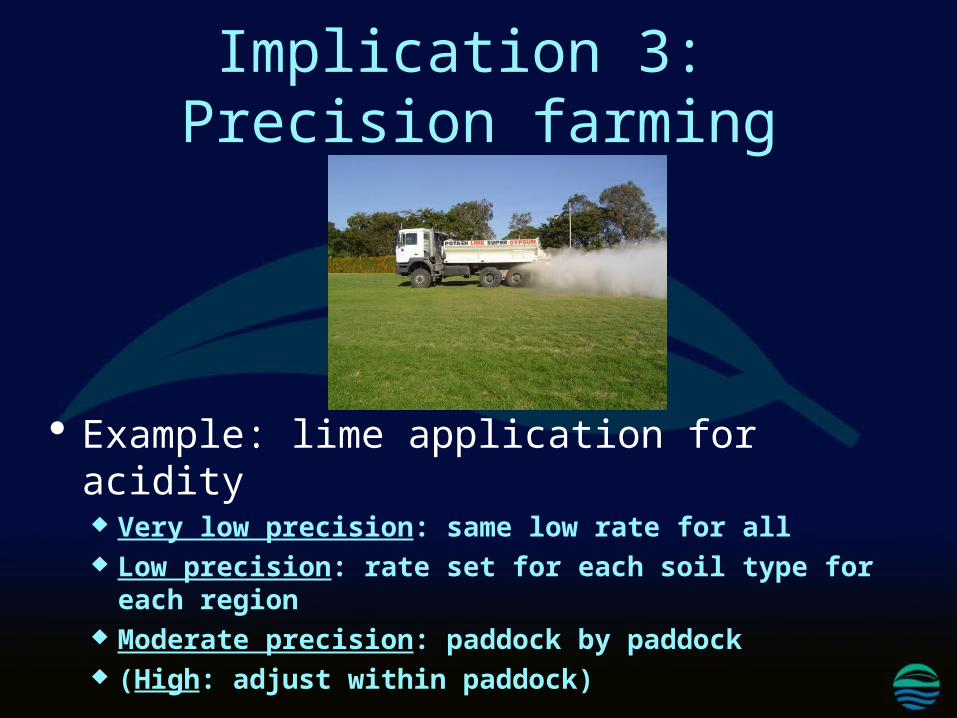
Implication 3: Precision farming
Example: lime application for acidity Very low precision: same low rate for all Low precision: rate set for each soil type for each
region Moderate precision: paddock by paddock (High: adjust within paddock)
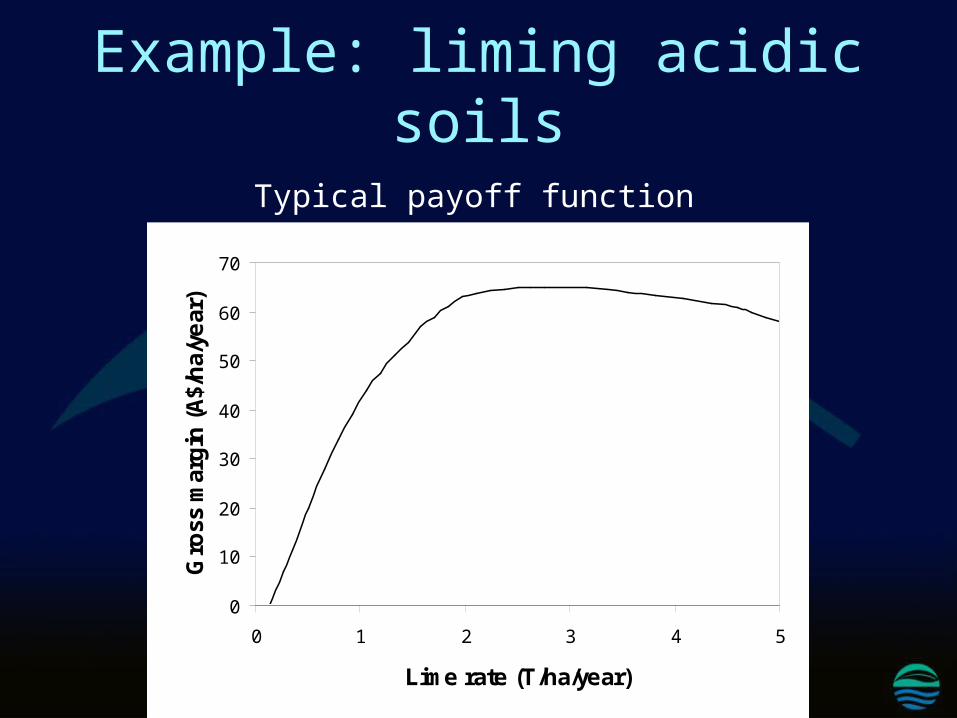
Example: liming acidic soils
0
10
20
30
40
50
60
70
0 1 2 3 4 5
Lime rate (T/ha/year)
Gro
ss m
arg
in (
A$/
ha/
year
)Typical payoff function

Implication 3: Precision farming
Rainfall zone Change fromvery low tolow
Change fromlow tomoderate
Low 148
42
High 721
30
Value of information $/ha from greater precision of info
Change frommoderate tohigh
0
0

Implication 4:Value of research
Consider two types of research increases the yield of a crop by 20%
(increases yield directly) provides info that yield will be 20% higher than
previously believed (increases yield indirectly through adjustments to input levels)
Which is more valuable?

Implication 4:Value of research
Input level
Pa
yo
ff (
e.g
. ex
pe
cte
d p
rofi
t)
Perceived payoff without research
Perceived payoff with research
I1 I2
P1,1
P1,2
P2,2
Value of improving technology = P2,2 - P1,1Value of improving information = P2,2 - P1,2

Implication 5:Risk

Implication 5:Risk
Accounting for risk aversion makes a small difference to payoffs (CE or U)
Example: herbicides againFarmer’s relativerisk aversion
Cost of using risk-neutral model
(%)0.0 0.00.8 0.0381.6 0.182.4 0.463.2 0.95
Example: herbicide dose
0
20
40
60
80
100
120
140
160
0 0.1 0.2 0.3 0.4 0.5
Herbicide dose (kg/ha)
Pro
fit
(A$
/ha
)
95% of maximum
R=0R=3.2
A non-implication:Externalities
“Surely, if you consider externalities, the point breaks down!” payoff function stops being flat input level starts to really matter

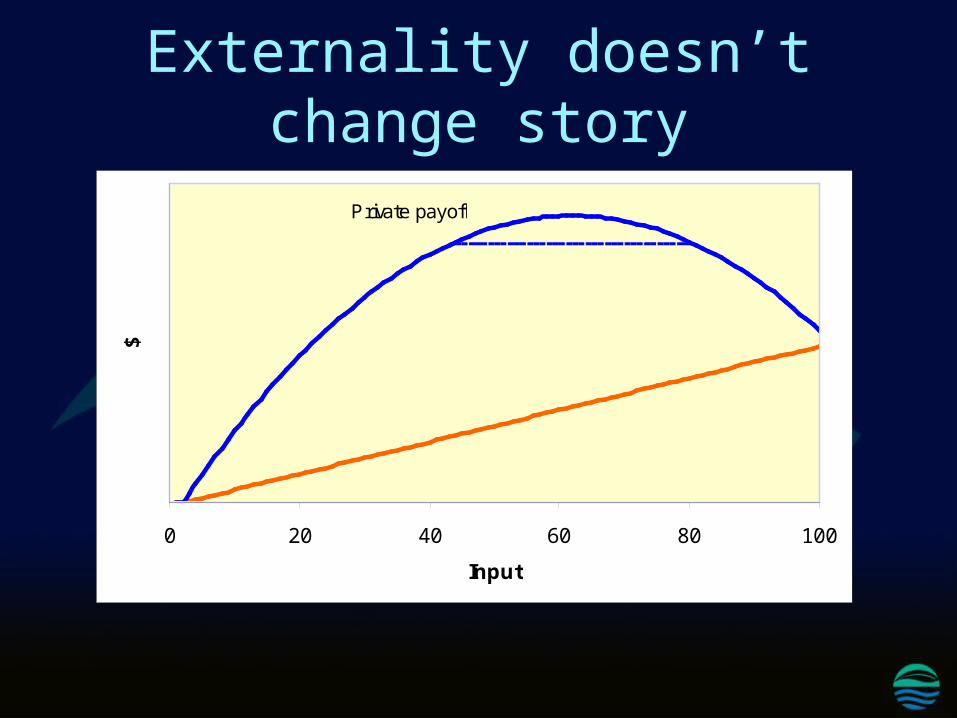
Externality doesn’t change story
0 20 40 60 80 100
Input
$
Private payoff
90% range
Externality doesn’t change story
0 20 40 60 80 100
Input
$
Private payoff
Externality

Externality doesn’t change story
0 20 40 60 80 100
Input
$
Private payoff
Payoff - externality
Externality

Conclusion
Flatness far more important than optimum
Should emphasise flatness and its implications to our students to our clients to ourselves
Conclusion
Implications include Margin for error/Flexibility Low value of monitoring Diminishing marginal value of precision Research: value of new technology greater than
value of new information Risk aversion not very important in normative
studies

www.davidpannell.net
Pannell, D.J. (2006). Flat-earth economics: The far-reaching consequences of flat payoff functions in economic decision making, Review of Agricultural Economics 28(4): 553-566.


