Industrial Electrical Engineering and Automation CODEN:LUTEDX/(TEIE-5353)/1-65(2015) Flexible Product Testing Using an Articulated Robot System Equipped with a Real-Time Force and Torque Sensor Ulf Tronde Division of Industrial Electrical Engineering and Automation Faculty of Engineering, Lund University
Transcript
Ind
ust
rial E
lectr
ical En
gin
eerin
g a
nd
A
uto
matio
n
CODEN:LUTEDX/(TEIE-5353)/1-65(2015)
Flexible Product Testing Using an
Articulated Robot System Equipped with
a Real-Time Force and Torque Sensor
Ulf Tronde
Division of Industrial Electrical Engineering and Automation Faculty of Engineering, Lund University
1
Flexible product testing using an articulated robot system equipped with
a real-time force and torque sensor
Master Thesis by Ulf Tronde
Division of Industrial Electrical Engineering and
Automation (IEA)
Supervisor IEA: Gunnar Lindstedt Supervisor CRS Robotics: Göran Lasson
Examinator IEA: Ulf Jeppsson
Faculty of Engineering Lund University
May 2015
2
Abstract Car manufacturers have traditionally tested new products using intricate, but not very flexible, mechanical devices. The test methods have been designed to check that e.g. the user interfaces and controls work properly in various kinds of climates and environments and have a life expectancy that is adequate. It has however been difficult to test that the controls have the desired feeling. As of today the only way of testing the feeling of a control is to let a test panel, consisting of a couple of persons, operate it and report the feeling. This will result in a very subjective statement that will highly depend on the test persons. The term feeling is difficult to define, but two natural properties of feeling are the force and torque required to operate the control. The objective of this master thesis was to develop and evaluate a flexible, objective and standardized method to measure force and torque during product testing, using an articulated robot system equipped with a force and torque sensor. A couple of ordinary electrical push buttons and rotary switches were selected to represent the various types of controls. A test method comprising the robot system, software with graphical user interface and various control systems were developed. Several tests were performed on the selected test objects. The results demonstrated that it was possible to measure the force and the torque required to operate the push buttons and rotary switches and that they displayed unique profiles. It was also possible to measure the required energy to operate the controls. The results were repeatable over time and showed little variance. From the performed tests and result analysis, it was concluded that it is possible to measure the test objects as desired with a flexible, objective and standardized method using the articulated robot system equipped with a force and torque sensor. Test objects can be measured and compared to standard objects, which have a desired feeling and the test method has the potential to replace current subjective product tests and improve the development and testing of user interfaces in cars.
3
Preface
Perspectives over Time The Master Thesis work was performed late 1996 to early 1997, which was 18 years ago. At that time the IT sector had just started for real and since that time there has been a tremendous development and also the introduction of completely new platforms. The car industry has of course also had a large development, but compared to the IT sector it has been modest. In the car industry there is still a demand for user tests like the one developed in this work. The interior of the car contains a majority of the user interfaces that existed 18 years ago. The introduction of touch screens is the major exception and will probably revolutionize the industry in the next years to come. Nonetheless, the problem definition and approach in this thesis is still very much valid. The computer platforms and software used in this work have certainly evolved, but all of them are still available in new versions and are widely used. The same is true for the robot system. Below is a list of the different components and the status of today.
• The small laboratory and industrial robots from CRS Robotics are available in newer versions from Thermo Fisher Scientific. The specifications for their robot F5 are very similar to that of the A465, with improved repeatability and strength. The software controlling the robot is more user friendly;
• The force and torque sensors are still available from the same manufacturer;
• Personal computers (PC) using Microsoft Windows are still in use, just much more powerful;
• Excel and the included VBA macros are still widely spread and used and DDE is also still used within Microsoft Windows and Microsoft applications. The VBA code would have to be adjusted for new syntax codes and communication protocols.
In summary, it is my belief that this Master Thesis work still is of interest today with rather much the same problem definition and approach as well as result. Another aspect of course is the reflection that it would just have been so much easier to finalize and present the report 18 years ago… Ulf Tronde, 21 May 2015
4
Acknowledgments I would like to thank my supervisors at the Division of Industrial Electrical Engineering and Automation (IEA): Gunnar Lindstedt and Gustaf Olsson; my supervisor at CRS Robotics: Göran Lasson; and my examinator at IEA: Ulf Jeppsson. Also thanks to Ulf Edvardsson, Volvo Product & Process Engineering Division, for supplying test specimens and helping to define the background of the work. My greatest gratitude though, goes to my wife Ann who has been supporting and encouraged me to finally complete this master thesis report!
5
Abbreviations and Terms Accuracy (Pose Accuracy) Deviation between the commanded
pose and the attained pose when approaching the commanded pose from the same direction.
A/D converter Analog to Digital conversion Articulated Means ‘equipped with joints’ ASCII American Standard Code for
Information Interchange. The code is used in computer communication and represents text. It encodes 128 specific characters.
bps Bits per second CPU Central Processing Unit DDE Dynamic Data Exchange. Protocol
used for communication and data sharing between applications in Windows.
DOF Degrees of Freedom FLASH EPROM Non-volatile memory. Contains
firmware and settings that remains also after power is removed.
LCD Liquid Crystal Display Opto-isolated connector A connector with a built-in light
emitter and receiver, which makes it galvanically isolated.
PC Personal Computer PID Proportional Integral Derivative.
An algorithm that uses three terms consisting of the proportional, the integral and the derivative values to control a process.
6
PLC Programmable Logic Controller. A computer or application specifically designed for controlling automation.
RAM Random Access Memory. A
volatile memory where data can be read and written with high speed. The data is lost when power is removed.
Repeatability (Pose repeatability) Closeness of agreement between
the positions and orientations of the attained poses after n repeated visits to the same commanded pose in the same direction.
RISC Reduced Instruction Set
Computing. A microprocessor architecture where the number of instructions are reduced to improve processing speed.
RS232 A serial communication standard VB Visual Basic. A programming
language from Microsoft. Programs designed in VB can be used as stand alone applications.
VBA Visual Basic for Applications.
Similar to VB and is built into most Microsoft Office applications. It can normally only be used within a host application.
7
Table of Contents
Abstract 2 Preface 3 Acknowledgments 4 Abbreviations and Terms 5 Table of Contents 7 1. Introduction 9 1.1. Research and Development at Volvo 9 1.2. Problem Definition and Objectives 10 1.3. Flexible Systems for Product Testing 10 1.4. Overview of the Thesis 11
1.1. Research and Development at Volvo Volvo, the largest car manufacturer in Sweden, has a research department entirely designated for testing the electrical systems and user interfaces incorporated in the company’s car fleet. The user interface comprises all of the controls available to the driver and the passengers to operate the car. Some examples are the steering wheel, the pedals, the gear lever and the abundance of electrical switches, adjustment levers and knobs. In an ordinary car today, there are about 50 to 80 of these different controls. Also included in the term user interface is the presentation system informing the driver about the status of the car and the environment. This research department closely cooperates with the departments responsible for design and development of the equipment mentioned above. In the process of developing new controls, there has to be an interaction between the two departments to ensure that the products meet the required quality standards. For instance that they work properly in various kinds of climates and environments during their entire life-span and have a life-expectancy that is adequate, but also that the controls have the desired feeling. The former properties are currently tested in the laboratories by intricate, but not very flexible, mechanical devices and in climate-chambers and this is fairly simple and straightforward. The testing of the latter property, the feeling, presents a far more difficult problem. As of today the only way of testing the feeling of a control is to let a test panel, consisting of a couple of persons, operate it and report the feeling. This, of course, will result in a very subjective statement that will highly depend on the test person. Even the term feeling is very hard to pinpoint. It could for example be the force required to activate a switch, how the surface texture on the switch is experienced or if it conveys a sense of good quality to the user. A rough definition of the term feeling could be the summarized impression the consumer experience when using the product. Traditionally when a new product is developed, a couple of prototypes are manufactured by a sub-contractor and then tested manually by Volvo to determine if it has the desired feeling. If not, it will be sent back to the manufacturer and readjusted. This process can sometimes be repeated several times and costs a lot of time, money and efforts. When the product eventually is accepted it will be mounted in a car together with several other controls and then yet another problem occurs. Since each of the controls has been tested individually with subjective methods, the different controls in a car might not have the same feeling. This imposes a great problem because a car manufacturer wants the cars to constitute a specific concept. Everything in the car should follow this concept. If a car is intended to give the driver the impression of high quality, then all the controls should also have a sensation of high quality to them. If it was at all possible to isolate a few parameters that strongly influence the feeling of a control and if it furthermore existed a way of measuring
10
these parameters, the matter of ordering products from sub-contractors and ensuring a uniform feeling would be much easier. In the same way as Volvo today can specify the design, function and quality of a product that is ordered from a sub-contractor, Volvo would also be able to specify the desired feeling of the product. Once a product is ordered, it would be the responsibility of the sub-contractors that the product fulfills the specification of those parameters. Furthermore, it would be desirable if the test method were adaptable to different types of controls. The mechanical devices that are used today for expected lifetime and function testing are constructed for a single purpose only and for a specific control. When a new control type is to be subjected to testing, a completely new mechanical test device has to be constructed. This is very expensive and time consuming.
1.2. Problem Definition and Objectives In the previous Section it was concluded that it would be desirable if some important parameters could be extracted from the term feeling and if there was an adaptable method to measure these parameters. In the case of a push button switch for example, two obvious parameters are the force and the depression distance required for operating it and in the case of a rotary switch, two other natural parameters are the torque and the rotation angle. When studying other types of controls, it seems as if these particular parameter-pairs form the basis. In consideration of the desire to work out a flexible test method for measuring force, torque and adherent positions and angles, it appears to be a natural step to use a small industrial robot system that has the ability to do these types of measurements. The main objective of this master thesis is to develop and evaluate a suitable and standardized method to measure force and torque during product testing, using an articulated robot system equipped with a force and torque sensor.
1.3. Flexible Systems for Product Testing The articulated robot system from CRS Robotics Corporation is designed for a diversified field of applications. Since it is easily reprogrammed and reconfigured, it provides a very flexible method to automate industrial tasks, such as in this case product testing. Currently, the customary method to test products is to use equipment developed for one particular type of test and often these tests have to be performed manually. By instead using a robot system, a much more adaptable method can be derived and by eliminating the need for manual manipulation, the tests should be more accurate and repetitive. When the robot system is equipped with a force and torque sensor, it has the ability to not only perform traditional product testing, like function and life
11
time testing, but also to measure force and torque in real-time during these tasks.
1.4. Overview of the Thesis Chapter 1 provides the background for the study and in Chapter 2 the problem of finding reasonable measurement methods for different types of controls is discussed together with a description of the desired measurement procedure. An outline of the robot system, both hardware and software, is found in Chapter 3. In Chapter 4 the force and torque sensor is described and Chapter 5 treats the supervisory computer system. The entire integration of the equipment and the test procedure is covered in Chapter 6 and in Chapter 7 the results are presented and analyzed and the chapter also contains the conclusions. In Chapter 8 the study is discussed providing topics for future works and specific challenges encountered. The programming code is attached in Appendices A and B, and formulas and conversions are found in Appendix C.
12
2. Problem Approach In Section 1.2 it was pointed out that the two basic operations when interacting with the car controls are pushing (or pulling) and rotation. Examples of the former are activation of an electrical pushbutton, changing the gear, and maneuvering the windshield wiper stick. Examples of the latter are turning of knobs and turning the steering wheel. In order to limit the extent of the thesis, a couple of ordinary electrical push buttons and rotary switches were selected to represent the various types of controls. In Section 2.1 the measurement situation will be described and in Section 2.2 some ideas of the desired measurement procedure are developed.
2.1. Measurement Situation Volvo provided a set of different buttons, switches and levers. In order to narrow the scope of the work, 4 push buttons and 3 rotary switches were selected for further tests. A reasonable test cycle for the push buttons would be to push down on the button and at the same time measure the required force. By recording the distance travelled and the equivalent required force at that particular distance, the test result would consist of an array with distance-force pairs. The ideal velocity when pushing down on the button would probably be rather high to match real-life operation, but this will unfortunately demand a very fast sampling rate. If the required force is a function of the velocity, the result will of course be influenced. Nevertheless, since the purpose of the test is to establish some kind of measure of feeling that is comparable with other tests, it was assumed that as long as all the tests were made using the same motion velocity, the requirement for high velocity could be disregarded. A conceivable test cycle for the rotary switches would in this case be to turn the rotary switch and at the same time measure the angle and the equivalent torque. Here the test result would be an array of angle-torque pairs. The same reasoning, concerning the motion velocity, that was conducted for the push buttons is assumed to be valid also for rotary switches.
13
2.2. Desired Measurement Procedure The desired system should be able to perform safe and reproducible tests with minimal interference from the operator. By selecting a specific type of test and placing the test object in a predetermined position and then activating the system, it should, by itself, perform one or more test cycles and then process the result and finally present it to the operator. A brief summary of the desired elements included in the measurement procedure is as follows: (• : performed by the operator) (- : performed by the system)
• Place test object in a predetermined position • Select type of measurement (push button or rotary switch) • (Option: Select number of cycles, motion velocity, etc.) • Start the test
- Execute the test cycle(s) and sample distance-force or angle-torque
- Perform necessary signal processing and conversions - Save the result in a computer file - Process the data (compute averages and statistics, etc.) - Present the result
• Select desired presentation form (data, diagram, etc.) • Save, print or compare test objects • Chose to continue testing or to shut down
14
3. The Robot System The robot system was provided by CRS Robotics Nordic AB, Lund, Sweden. Head office: CRS Robotics Corporation, Burlington, Ontario, Canada. (Current name: Thermo Fisher Scientific, Waltham, Massachusetts, USA). The system (Figure 3.a) is composed of several essential parts. The robot arm is described in Section 3.1. The robot controller unit and the operating system that resides inside it and regulates the robot arm are covered in Section 3.2. The user available software is treated in Section 3.3 and finally the host computer that can be utilized as an extended terminal to manage the software and supervise the system is described in Section 3.4.
Figure 3.a. The robot system A465 from CRS Robotics Corporation.
3.1. The Robot Arm The articulated robot arm A465 [1], seen to the right in Figure 3.a, has six rotating joints, which entails to six degrees of freedom (DOF) (Figure 3.b). The word articulated means ‘provided with joints’ [2]. The actual definition of DOF reads as follows; ‘DOF is one of the variables (maximum number of six) required to define the motion of a body in space’ [3]. The elementary motions that the body can have in relation to a coordinate system are translation along the coordinate axis and rotation around the axis. In the case of a Cartesian coordinate system, defining the three-dimensional space, there are three orthogonal axes and thus a maximum of six degrees of freedom. Since the arm has six DOF, it means that the end of the arm, where the tool is mounted, is able to reach any point in the three dimensional space and in any direction, as long as the point is inside the working area (Figure 3.c) of the robot. The number of joints, however, should not be confused with the degrees of freedom. The degrees of freedom also depend on the types of joints and how they are connected. A robot arm may even have more than six joints, but still have a maximum of six degrees of freedom or less. The robot arm described in this text may, for example, be fitted on a track. It would then still have six degrees of freedom, but a larger working area. Adding an extra joint also enables the arm to reach certain positions in
15
several different ways. At the free end of the last link of the arm, there is a tool flange where an end-effector [2] can be attached. This end-effector can for example be a servo or a pneumatic gripper and in combination with these a force and torque transducer can be installed (which will be treated later on in Section 4.1).
Figure 3.b. The locations of the six rotating joints in the robot arm.
Figure 3.c. The working area is the space that is within reach for the tool tip.
This particular robot arm is capable of manipulating a nominal payload of 2 kg and a maximum payload of 3 kg. It has a repeatability of ± 0.05 mm. This means that it is able to return to a specific point with an absolute error less than 0.05 mm, even after several cycles. Repeatability should not be mixed-up with accuracy [3]. Accuracy is the deviation between the desired computed position and the actual attained position. There is no accuracy stated for this robot, but generally it can be assumed that the repeatability is better than the accuracy. Furthermore, the arm has the ability to move at a maximum velocity of 4.5 m/s [1]. When performing linear or path motions, the maximum velocity is reduced to 1 m/s. The arm joints are driven by DC servo motors via harmonic drives, which provides gear reduction for higher torque. The position of each joint is determined with optical encoders.
16
3.2. The Robot Controller
Figure 3.d. The C500 robot controller from CRS Robotics Corporation.
The C500 robot controller unit (Figure 3.d) is the electronic heart of the robot system [4]. Based on a 32-bit RISC [5] processor, it performs the necessary calculations to control the motions of the robot arm. It is able to simultaneously support up to eight robot axis and a gripper with an update rate of 14 kHz (corresponding to an update time of 70 µs) per axis. It uses a PID [6] regulator control algorithm and has either a trapezoidal or parabolic velocity profile. In a trapezoidal profile, the motion accelerates linearly up to a maximum speed and then decelerates linearly until it stops. A parabolic profile has a parabolic accelerate phase and a parabolic decelerate phase. It has the ability to compute several different types of paths, like joint interpolated (point-to-point), straight line, continuous path and relative or blended motion. The operating system and control parameters are stored in a non-volatile FLASH EPROM [7] memory. The robot controller can communicate with other peripherals via two serial RS232 ports [8] with a standard speed of 38400 bps. It is possible to expand the controller with additional parallel RISC-based processors to provide high-speed communication. This option was used in the tests in this thesis to connect the robot controller to the real-time force and torque sensor equipment, see Section 4. In a similar way, a vision system can optionally be connected. Furthermore, for the use of sensors and additional actuators, the controller has 16 opto-isolated inputs and 12 opto-isolated outputs, 4 contact relays output and one PLC [9] interface. There are four ways of managing the robot controller. It may receive commands from the teach pendant, the front panel on the controller, the terminal emulator on the host computer or from a program executed within the controller. At any given time, the controller can be controlled from only one source. The most basic method is to use the teach pendant (Figure 3.e). This is a hand-held robot control terminal that provides a means to move the robot, edit and run robot programs. It has a four-line LCD display for presenting and editing programs, locations, variables and for checking the status of the robot. It is also equipped with an alphanumerical keyboard, an emergency stop switch and a live-man switch (if released, the live-man switch will stop the robot motion). The main use of the teach pendant however, is to move
17
the robot manually in order to teach the robot locations which will then be referred to in robot programs. These locations can be stored together with programs and variables in the controller’s battery backed RAM memory [10] with room for 256 kB.
Figure 3.e. The teach pendant.
The front panel can be utilized to start or stop program execution, homing and for emergency stopping. The other two methods to manage the robot controller; the use of a terminal emulator on a host computer or a robot program that is executed within in the controller, will be described in the following sections.
3.3. System Software The programs that can be executed in the robot controller are written in RAPL-2, which is an abbreviation for Robot Application Programming Language [11]. The language is line-structured and similar to simple programming languages like BASIC [12] and Pascal [13]. It allows, among other things, for robot control, computations, storage of variables and locations, logical operations, supervision of inputs and outputs, and handling of subroutines. There are two methods to implement a program in the controller. By using the teach pendant, one programming-line at the time can be entered or edited. When implementing larger and more complex programs however, it is better to edit the program in Windows on a host computer and then download the complete program to the controller. The procedures for writing and downloading programs are described in the next Section. Another method for designing programs are the use of Process Control Programming (PCP) [4] [14], which utilizes high level programming (e.g. C/C++ [15]) and allows for a more efficient application of the controller system.
18
3.4. Host Computer
Figure 3.f. The host computer consists of an ordinary IBM-compatible PC, in this case with a Pentium processor and the operative system Windows 95.
The host computer (Figure 3.f) consists of an ordinary IBM-compatible PC. The computer used in these tests has a Pentium [16] processor and is using the operative system Windows 95 [17]. Installed on the computer is the robot communication software Robcomm for Windows (RCWIN) [18]. This software enables the communication between the PC and the C500 robot controller, using a 38400-bps serial connection. The most basic mode of communication is the use of a terminal emulator utility that allows for direct, low level communication with the control system. The software also has the ability to manage the storage, retrieval and downloading of programs, locations and variables. Furthermore it can control the execution of programs in the controller and it also logs events and errors and performs diagnostic tests of the user memory. A text editor is used to write and edit the programs, which later are downloaded to the controller. There is a text editor included in RCWIN, but any other text editor is sufficient. As mentioned before, the programs are written in RAPL-2 and will initially have the filename extension “.txt”. The programs are then tokenized, i.e. the text code is converted to RAPL-2 mnemonic codes. After it has been tokenized, the filename will have the extension “.rob”. The program is thereafter downloaded individually or together with other programs, variable files (“’.var”) or locations files (“.loc”) to the controller. Once the program is downloaded in the controller, it can be started from either the teach pendant, the front panel, from RCWIN or from another program on the host computer via the DDE [19] interface. DDE stands for Dynamic Data Exchange and is an interface enabling communication and data exchange between RCWIN (and hence the
19
controller) and other programs like for example process controlling and database software. In these tests, the DDE interface is used to connect RCWIN to Microsoft Excel and Visual Basic for the purpose of launching the test programs, and processing and storing the measured data provided by the controller and the force and torque sensing equipment, see Chapter 5 for a more detailed description of this issue.
20
4. The Real-Time Force and Torque Sensor System The force and torque sensor system [20] [21] is manufactured by ATI Industrial Automation, North Carolina, USA. The system operates in two different modes; force sampling mode and force control mode. In force sampling mode, the force sensor provides information to the robot controller, but plays no part in controlling the action of the robot. This is the operating mode that was used in this thesis. In force control mode, the sensor provides information to the control loop regulating the robot arm. This allows for adaptive control of the forces the arm is exerting on surrounding objects. The system consists of the transducer, see Section 4.1, which is mounted on the robot arm and does the actual force and torque sampling, and the F/T controller, see Section 4.2, that process the sampled signals and communicates with the robot controller.
4.1. The Transducer
Figure 4.a. The Force Torques Transducer at the end of the robot arm.
Figure 4.b. A closer look at the Gamma 15/50 transducer.
21
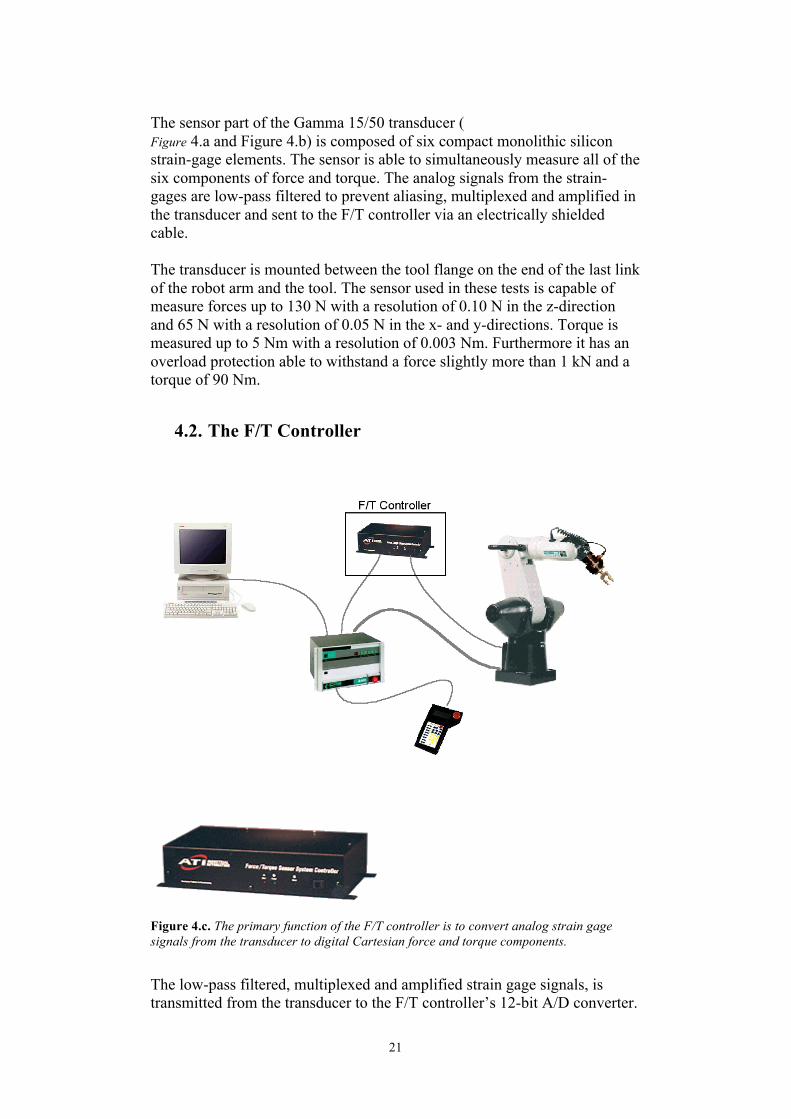
The sensor part of the Gamma 15/50 transducer ( Figure 4.a and Figure 4.b) is composed of six compact monolithic silicon strain-gage elements. The sensor is able to simultaneously measure all of the six components of force and torque. The analog signals from the strain-gages are low-pass filtered to prevent aliasing, multiplexed and amplified in the transducer and sent to the F/T controller via an electrically shielded cable. The transducer is mounted between the tool flange on the end of the last link of the robot arm and the tool. The sensor used in these tests is capable of measure forces up to 130 N with a resolution of 0.10 N in the z-direction and 65 N with a resolution of 0.05 N in the x- and y-directions. Torque is measured up to 5 Nm with a resolution of 0.003 Nm. Furthermore it has an overload protection able to withstand a force slightly more than 1 kN and a torque of 90 Nm.
4.2. The F/T Controller
Figure 4.c. The primary function of the F/T controller is to convert analog strain gage signals from the transducer to digital Cartesian force and torque components.
The low-pass filtered, multiplexed and amplified strain gage signals, is transmitted from the transducer to the F/T controller’s 12-bit A/D converter.
22
The now digitized signal is then sent forward to the CPU, which further processes the data and then transfers the data via a 38400 bps RS-232C interface to the robot controller. Since the A/D converter has 12 bits, the final resolution of the measured force and torque components will be 1 / 4096 (212=4096). When the sensor system measures all six components of force and torque, which is the case in these tests, the sampling rate in the F/T controller is 750 Hz. However, this rate can be increased up to approximately 3000 Hz depending on the number of components that is measured and the data-type used. The factor determining the actual update rate in the robot controller however, is the serial communication speed rather than the sampling rate. In these tests the data is transmitted in ASCII [22] code with a rate of 38400 bps and this results in an update rate of 87 Hz in the robot controller. By using binary code instead, it is possible to increase this to more than 500 Hz. The data from the sensor system is made available to the robot controller as part of an array of RAPL interface variables. This means that the data is accessible in the same way as any other variables that are handled by the robot controller. The reserved template name is ”FORCE” and is indexed from 0 to 61. Some of the elements in the array are read-only variables and these consist of the six Cartesian components of force and torque that the transducer is subjected to. Among these variables are also the resultant force and torque as well as the maximum sensed forces, moments and resultants that has been recorded since the activation of the sensor system. All of these mentioned data are well suited for the task of this work. The other elements of the array are read or write variables. The majority of these variables are used in conjunction with force control mode, which is not used in this work.
23
5. Supervisory Computer System The supervisory computer system is essentially a program, written in Visual Basic for Applications (VBA) [23], which is executed on a PC. The system supervises the entire test sequence. It manage the user interface, commands the robot system to initiate tests, then collects and stores the sampled data and finally performs analysis on the data and presents the result to the user. The computer is briefly described in Section 5.1 and the software that was used to develop the computer program is presented in Section 5.2.
5.1. Hardware The hardware is in this case the same PC that is utilized as host computer by the robot system, see Chapter 3.4, which means that the supervisory program and the robot communication program Robcomm run on the same computer. This is convenient since it simplifies the necessary interaction between the two programs by enabling them to communicate through the Dynamic Data Exchange (DDE) interface.
5.2. Software Platform The program was written in Visual Basic for Applications (VBA) version 5.0, which is included in Microsoft Excel version 95, Swedish edition. VBA is basically an object-oriented language that is found in a couple of Microsoft utility products like Excel as well as in the stand-alone software development tool Visual Basic (VB). The difference is that programs developed in VB are detached and can be used without any other programs while programs developed in VBA included in Excel is closely connected to this program and has to be run together with it, which is the case in this work. Excel and VBA was chosen because it is reliable, well known, and easy to maintain and migrate. It is possible for anyone with some programming knowledge to edit and make changes in the program to adapt it to a specific measurement situation. Another feature of Excel and VB/VBA is the use of DDE for communication with other applications, as mentioned in Section 3.4.
24
6. Test Implementation This chapter provides an overview of the complete testing system.
6.1. Test Objects The selected push buttons (Figure 6.a) were mounted, facing upwards, on an aluminum panel that was fixed on top of a table. They are referred to as button numbers 1 to 5, starting with the one to the left. Button #1 had an integrated rheostat wheel. Trying to measure this turning movement seemed a difficult task for this initial system, so button #1 was therefore excluded from the tests. Button #2 was of the “seesaw” type and was turned on by pushing down on one end and turned off by pushing down on the other end. Buttons #3 to #5 were activated by pushing down once and deactivated by pushing down a second time. Only the “activation” phase was tested. The buttons typically had a travel distance of 5-7 mm.
Figure 6.a. The push buttons used for the tests. Labelled #1 to #5 from left to right.
The rotary switches used in the test (Figure 6.b) were integrated on a climate control panel that was fixed on top of a table. The panel was mounted with an inclination of about 30° relative to the table. The rotary switches were labelled #1 to #3, starting with the one to the left. Switches #1 and #3 had a full travel of 180° (from position “9 o’clock” to “3 o’clock” and “6 o’clock” to “12 o’clock”). The switch in the middle, number 2, had no travel limitations and could thus be rotated continuously to the left or right. All three switches had notches that could be felt when turning them.
25
Figure 6.b. The rotary switches used for the tests. Labelled #1 to #3 from left to right.
6.2. Hardware The robot arm was mounted on a table together with the switches (Figure 6.c). At the free end of the last link of the arm, a force and torque transducer was fitted to the tool flange. Then in turn, either a pin tool (Figure 6.d), or a fork-shaped tool (Figure 6.e), was attached to the transducer. The pin tool was used to press the push button switches and the fork-shaped tool was used to turn the rotary switches. Some trials were initially made using a servo gripper (Figure 6.f), but it appeared to be somewhat heavy and cumbersome. The pin tool and the fork-shaped tool however, were light and easily reached the switches. The obvious advantage of using a servo gripper, however, would be avoiding the necessity to change tools and also be able to test round buttons.
Figure 6.c. The robot arm mounted on a table together with the switches.
26
Figure 6.d. The pin tool used to press the push button switches.
Figure 6.e. The fork-shaped tool used to turn rotary switches.
Figure 6.f. The servo gripper.
27
6.3. Software The software was created in VBA as described in Chapter 5.2. It was developed in an object oriented fashion to be easier to adapt to different measurement situations and future upgrades. The graphical user interface is presented in Figures 6.g to 6.k. The Swedish language was used in the user interface for labels and button names.
Figure 6.g. The layout of the Main Menu, with the button names in Swedish. The user can select “Information”, “Settings”, “Measurement”, “Show Data”, “Show Diagram”, New Test Object”, “Open”, “Save”, “Print” or “Quit”.
Figure 6.h. When selecting “Mätning” (“Measurement”) in the main menu, the following menu is presented. Here the user can chose the number of measurements and enter the name of the test person.
28
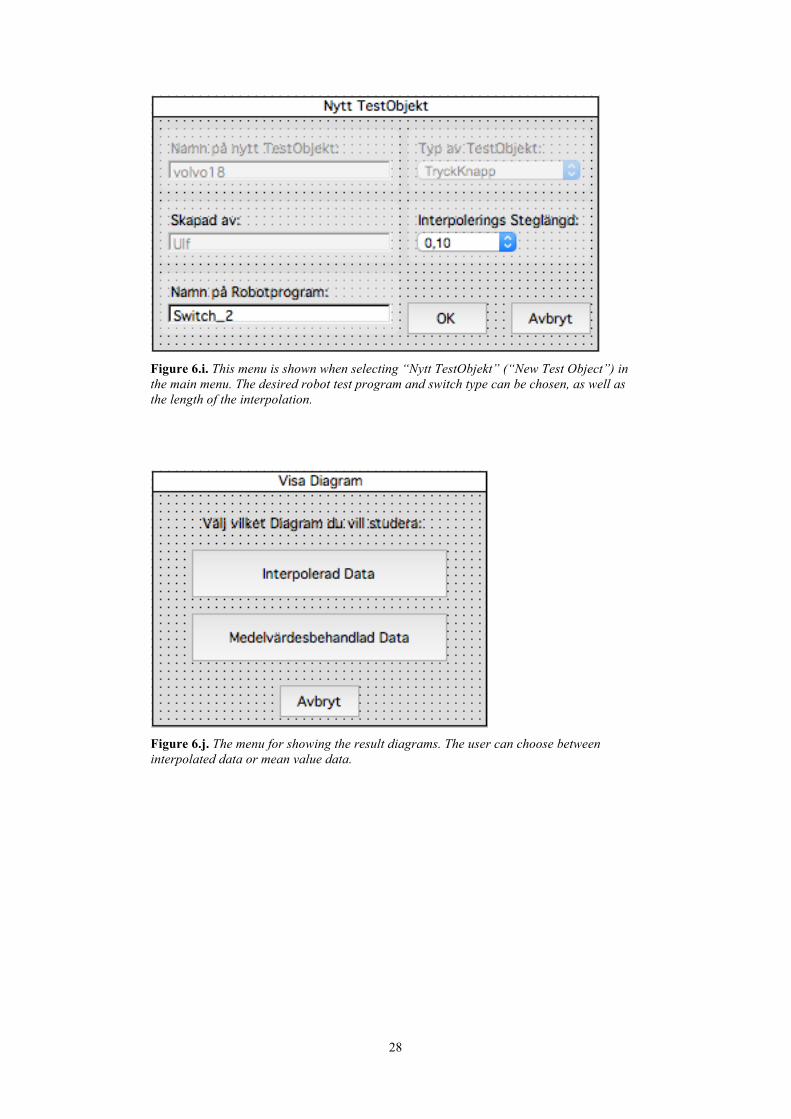
Figure 6.i. This menu is shown when selecting “Nytt TestObjekt” (“New Test Object”) in the main menu. The desired robot test program and switch type can be chosen, as well as the length of the interpolation.
Figure 6.j. The menu for showing the result diagrams. The user can choose between interpolated data or mean value data.
29
Figure 6.k. The menu for showing the result data. The user can select original data, interpolated data or mean value data.
The VBA software consists of a main module and several sub modules, see Appendix A. The modules control the graphical user interface and handle the communication with the robot code. It collects the data from the robot and force/torque-system and finally processes that data and presents the data to the user. It also handles errors that can result from e.g. communication errors and numerical inconsistencies. In essential, it follows the desired measurement procedure in Chapter 2.2. When a test is executed, the VBA software transfers the necessary in-data to the robot system and executes the robot program that in turn controls the robot. The robot arms moves to a predetermined location close to the selected test object. These locations have to be taught (with the function “Teach”) by the operator before the tests, see Chapter 3.2. In case of a push button, it starts to push on the button and at the same time samples the force. When the force reaches a predetermined maximum value (when the button is fully pressed down), it terminates the test and transfers the data back to the VBA software. It the test object is a rotary switch, the robot arm starts to turn the switch and at the same time samples the torque. When the turning angle reaches a predetermined maximum value, it terminates the test and transfers the data back to the VBA software. The movement of the buttons or switches during the sampling of position and force or torque data could not be done in predefined steps. Instead the movement was continuous during the sampling. This results in that the x-location and angle were not measured at exactly predetermined uniform increments. The x-location and angle is therefore interpolated into predetermined steps.
30
When sampling the results from consecutive tests, the mean values together with the maximum and minimum values are stored. The robot program (Appendix B) also consists of several sub modules, for initialization, testing and recovery. The VBA modules activate these programs. The predetermined positions for measuring different tests objects are stored in the robot system by ‘teaching’ the system, see Chapter 3.2.
31
7. Test Results, Analysis and Conclusions The test results are presented in graphical form below starting with the push buttons and then the rotary switches.
7.1. Test Results - Push Buttons In the following diagrams, the distance (mm) and the correlating measured force (N) are depicted on the x- and the y-axes. The Swedish terms “Väg-Kraft Diagram”, Väg” and “Kraft” can be translated to “Distance-Force Diagram”, “Distance” and “Force”.
Figure 7.a. Push Button #2. 1 measurement. Energy= 7.98 mJ.
Figure 7.b. Push Button #2. Max/Mean/Min values of 5 measurements.
32
Figure 7.c. Push Button #3. 1 measurement, first test. Energy= 15.5 mJ.
Figure 7.d. Push Button #3. Max/Mean/Min values of 200 measurements, first test.
33
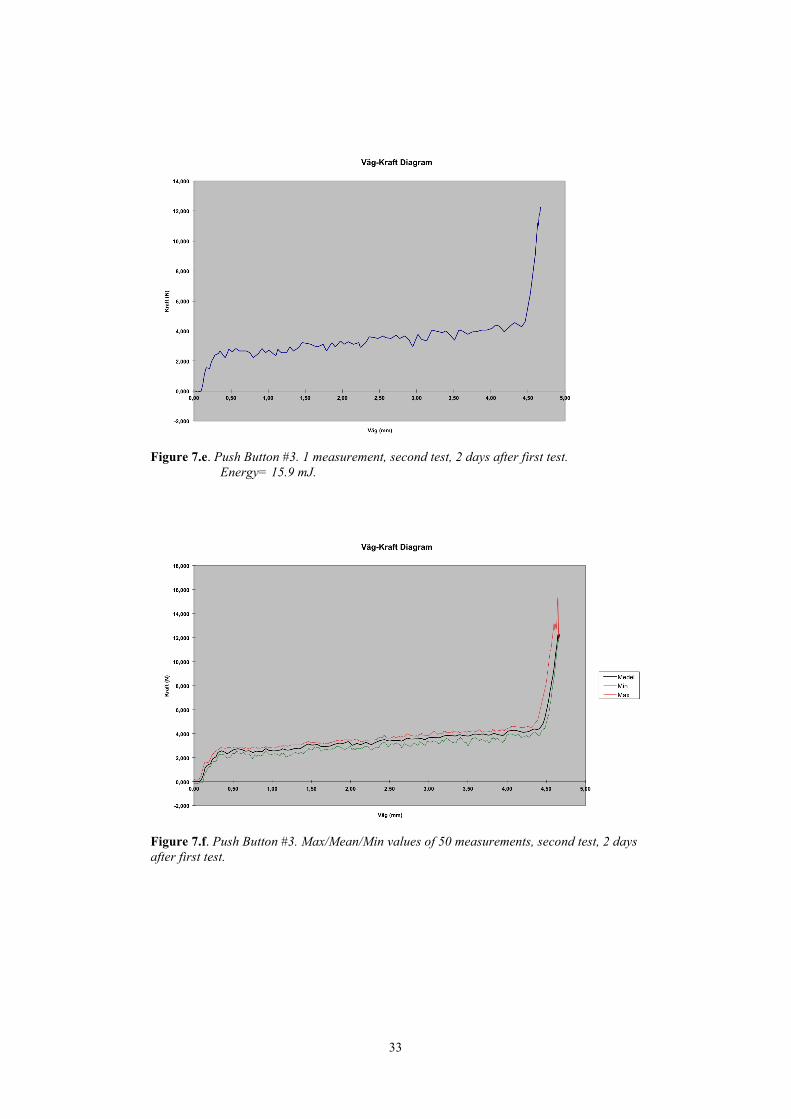
Figure 7.e. Push Button #3. 1 measurement, second test, 2 days after first test. Energy= 15.9 mJ.
Figure 7.f. Push Button #3. Max/Mean/Min values of 50 measurements, second test, 2 days after first test.
Figure 7.h. Push Button #4. Max/Mean/Min values of 50 measurements.
35
Figure 7.i. Push Button #5. 1 measurement. Energy= 7.10 mJ.
Figure 7.j. Push Button #5. Max/Mean/Min values of 5 measurements.
36
7.2. Analysis - Push Buttons The figures above show that each push button has a rather distinct profile. In some cases the required force rises to a near constant value until the button is fully pressed down (Figure 7.c). For other buttons, a higher initial force is required (Figure 7.a). Analysis of data from one measurement (Figure 7.c) to another one 2 days later (Figure 7.e), using the Pearson Product-Moment Correlation [24] (in Excel, Appendix C), gives a correlation coefficient of 0.98. Same analysis, but using mean values (Figure 7.d and Figure 7.f), gives a correlation coefficient of 0.99. This suggests that the tests are repeatable over time. Another interesting property is the energy content of the button. How much energy is used to press down the button? Since the travel (mm) and force (N) are measured, the area under the graph (converted to standard scientific units) should represent that energy. Using the trapezoidal numerical method [25] (Appendix C), the energy content for pressing the buttons were calculated and presented in the figures above. A comparison of the energy levels between several tests on the same button also shows that the tests are repeatable and that this property can be used to define the button profile. The maximum and minimum values presented in the figures above indicate that there is not much variation in the measured results from consecutive tests.
37
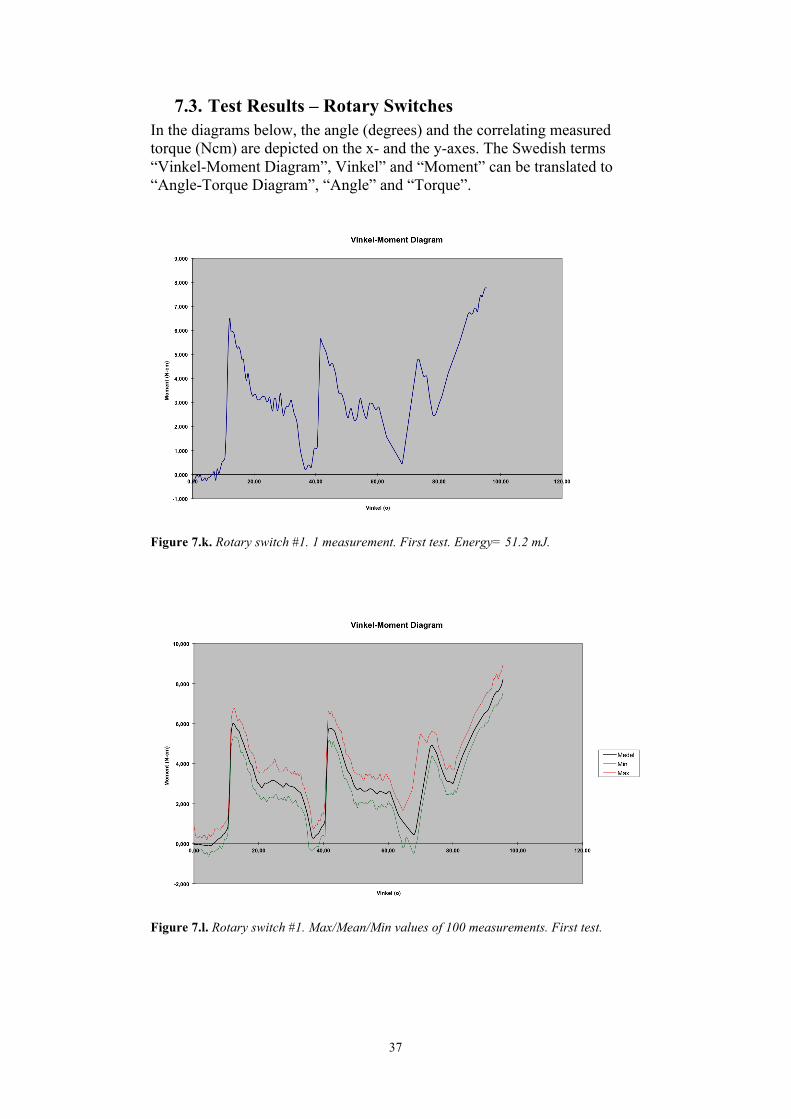
7.3. Test Results – Rotary Switches In the diagrams below, the angle (degrees) and the correlating measured torque (Ncm) are depicted on the x- and the y-axes. The Swedish terms “Vinkel-Moment Diagram”, Vinkel” and “Moment” can be translated to “Angle-Torque Diagram”, “Angle” and “Torque”.
Figure 7.k. Rotary switch #1. 1 measurement. First test. Energy= 51.2 mJ.
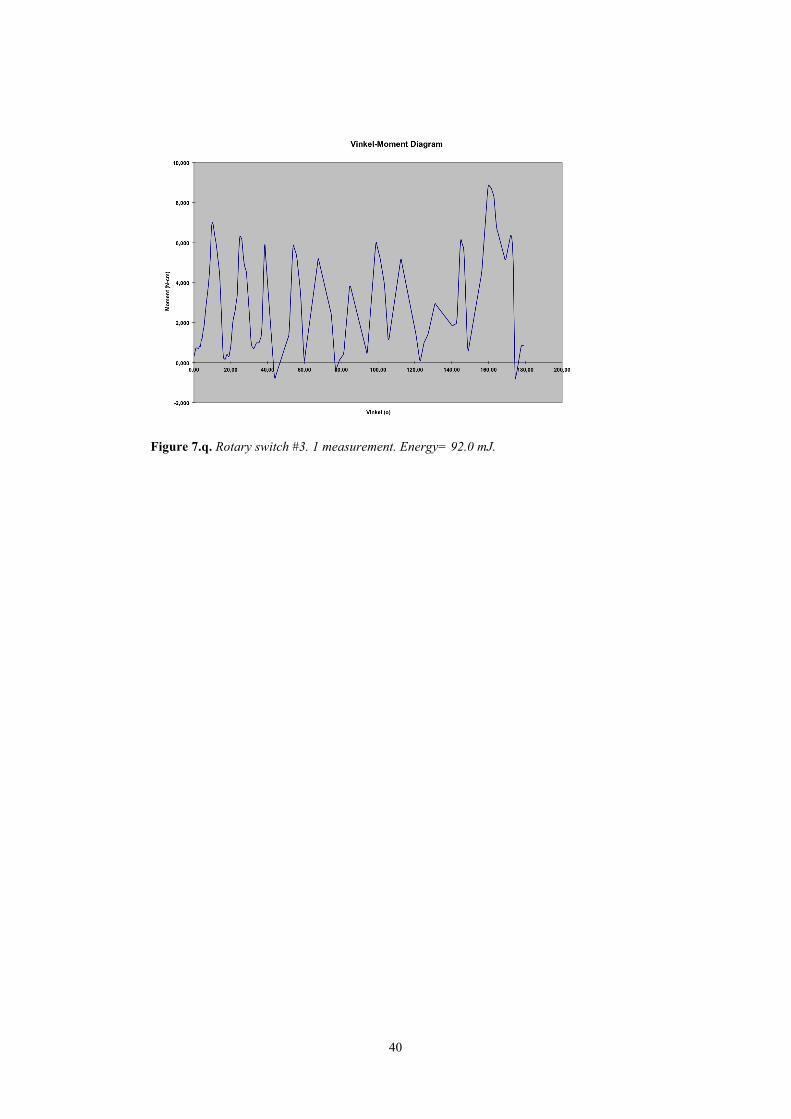
Figure 7.l. Rotary switch #1. Max/Mean/Min values of 100 measurements. First test.
38
Figure 7.m. Rotary switch #1. 1 measurement. Second test, 3 weeks after first test. Energy= 47.6 mJ.
Figure 7.n. Rotary switch #1. Max/Mean/Min values of 100 measurements. Second test, 3 weeks after first test.
39
Figure 7.o. Rotary switch #2. 1 measurement. Energy= 37.8 mJ.
Figure 7.p. Rotary switch #2. Max/Mean/Min values of 5 measurements.
40
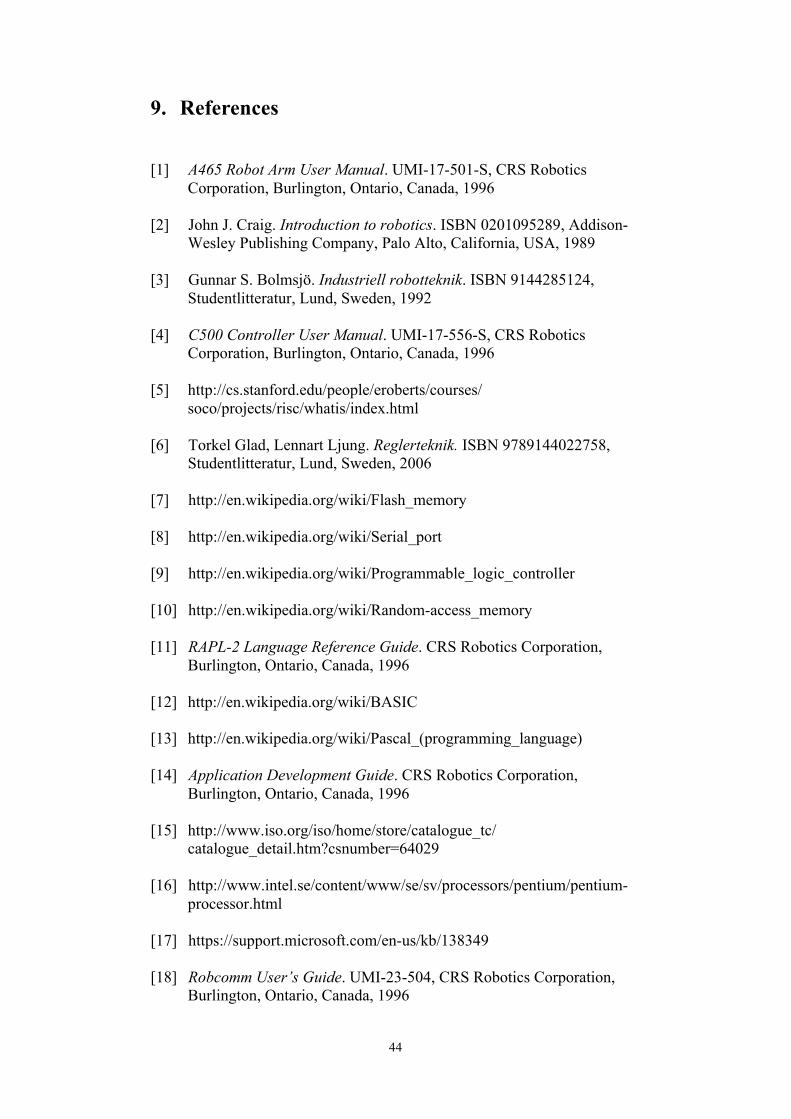
Figure 7.q. Rotary switch #3. 1 measurement. Energy= 92.0 mJ.
41
7.4. Analysis – Rotary Switches Just as for the push buttons, the figures above show that the rotary switches also have rather distinct profiles. It can be clearly seen that the graphs correspond to the notches that can be felt when turning the rotary switches. Analysis of data from one measurement (Figure 7.k) to another one 3 weeks later (Figure 7.m), using the Pearson Product-Moment Correlation [24] (in Excel, Appendix C), gives a correlation coefficient of 0.94. Same analysis, but using mean values (Figure 7.l and Figure 7.n), gives a correlation coefficient of 0.98. These tests also seem to be repeatable over time. The energy required to turn the rotary switch should also be possible to calculate. With the angle (in radians) and torque (Ncm) measured, the area under the graph (converted to standard scientific units) should represent the energy. Using the trapezoidal numerical method [25] (Appendix C), the energy content for the rotary switches were calculated and presented in the figures above. Also here, a comparison of the energy levels between several tests on the same switch shows that the tests are repeatable and that this property can be used to define the switch profile. The maximum and minimum values presented in the figures above indicate that there is not much variation in the measured results from consecutive tests.
7.5. Conclusions From the performed tests and result analysis, it can be concluded that:
• It is possible to measure the test objects as desired with a standardized method using the articulated robot system equipped with a force and torque sensor;
• The test objects have unique force or torque profiles; • The tests are repeatable; • Test objects can be measured and compared to standard objects,
which have a desired feeling, using the demonstrated profiles, correlations and inherent energy;
• The standardized and flexible test method has the potential to replace current subjective product tests and improve the development and testing of user interfaces in cars.
42
8. Discussion
8.1. Future Perspectives The next step would be to have test persons define desirable profiles for different types of buttons and switches to set model profiles. These could then be used for comparison with future test objects. The entire system can be developed towards more standardized test procedures and ease of use, e.g.:
• Enhancing the graphical user interface; • Developing the software for more types of test objects and options; • Incorporating automatic correlation with model profiles; • Standardized fixtures for holding the test objects and applying the
test probes at predefined locations; • Adding entities to better be able to correlate to model objects, like
maximum and minimum allowed forces, maximum slope etc.; • Faster tests by using high speed parallel ports for communication
and by using high level programming (PCP) in the robot programs; • The standard deviation of the result could be calculated during the
sampling. When testing rotary switches with distinctive notches, it might be better to use a servo gripper, since it stays in contact with the switch at all times. The fork shaped tool looses contact every time the switch snaps after the notch. An alternative could be to use a tool that precisely fits the rotary switch handle. There are five standard transducers available from ATI with measurement ranges from 12 N to 5000 N suitable for different measurement situations. In this thesis work a more sensitive transducer would have been preferable for better resolution, but the Gamma 15/50 transducer was the one at hand.
8.2. Specific Challenges It has been a very challenging but interesting work. One of the first challenges was to find out the different force and torque variables that were measured by the transducer and the associated coordinate system. One subject that accounted for many hours of trial and error was the communication protocol (DDE) between the VBA software and the robot controller. Since the sampling is performed in real-time during the robot motion, the synchronization of all involved processes was crucial. In order to stay synchronized, a solution was to check if the robot system was busy or ready for new inputs and accordingly send ready signals to the processes. The movement of the buttons or switches during the associated sampling of position and force or torque data could not be done in predefined steps. Instead the movement was continuous during the sampling. This movement
43
is probably closer to reality when activating the buttons, but the drawback was that the x-location and angle were not measured in exactly predetermined uniform increments. The solution was to interpolate the result and thus get uniform x-location and angle steps.
44
9. References [1] A465 Robot Arm User Manual. UMI-17-501-S, CRS Robotics
Corporation, Burlington, Ontario, Canada, 1996 [2] John J. Craig. Introduction to robotics. ISBN 0201095289, Addison-
Wesley Publishing Company, Palo Alto, California, USA, 1989 [3] Gunnar S. Bolmsjö. Industriell robotteknik. ISBN 9144285124,
us/library/office/ee814737(v=office.14).aspx [24] http://www.excelfunctions.net/Excel-Correl-Function.html [25] Torgil Ekman, Numeriska Metoder på Dator och Dosa. ISBN 9144262418, Studentlitteratur, Lund, Sweden, 1987 All websites were reachable at 10:30 CET 2015-05-20
46
Appendix A Visual Basic Applications (VBA) Code VBA version 5.0, included in Microsoft Excel version 95, Swedish edition. Allmän Initierad Som Bool Sub Auto_öppna() ' Definierar sökvägar RobcommSökväg = "C:\crs\rcwin" ChDir RobcommSökväg Shell RobcommSökväg + "\robot.exe", 6 AppActivate "Microsoft Excel" End Sub Sub Auto_stäng() Initierad = Falskt End Sub Sub Init() ' Initierar robotsystemet Vid Fel GåTill 10 DDEKommando "ROBCOMM"; "RUN"; "Init" Initierad = Sant Avsluta Sub 10: MedRuta "Ett fel har uppstått!! Prova igen." VisaHuvudMeny Slut Sub Sub Mätning(AntalMätningar) ' Körs när knappen “Mätning” aktiveras. Förbereder ' kalkylblad och kör sedan robotens testsekvens ' (Namn=RobotProgNamn) på testobjekt nr “Objekt” ' Detta utförs AntalMätningar ggr. ' Hämtar sedan Kraft eller Vridmoment arrayvariabel Vid Fel GåTill 50 RobotProgNamn = Kalkylbladlista("Interpolerad Data").Celler(11, 6).Val Object = Kalkylbladlista("Interpolerad Data").Celler(12, 6).Val Typ = Kalkylbladlista("Data").Celler(4, 2).Val Kalkylbladlista("Data").Celler(8, 2).Val = Now
47
Kalkylbladlista("Interpolerad Data").Celler(8, 2).Val = Kalkylbladlista("Data").Celler(8, 2).Val Kalkylbladlista("Accumulerad Data").Celler(8, 2).Val = Kalkylbladlista("Data").Celler(8, 2).Val Kalkylbladlista("MedelVärde Data").Celler(8, 2).Val = Kalkylbladlista("Data").Celler(8, 2).Val If Kalkylbladlista("Accumulerad Data").Celler(10, 2).Val = 0 Then Kalkylbladlista("Accumulerad Data").Celler(7, 2).Val = Kalkylbladlista("Data").Celler(8, 2).Val Kalkylbladlista("MedelVärde Data").Celler(7, 2).Val = Kalkylbladlista("Data").Celler(8, 2).Val End If Om Initierad = Falskt Så Init Vänta (5) Utför Medan RobotBusy = 1 Loop Slut Om DDESättVariabel(“ROBCOMM”, “Object”, Object) For i = 1 To AntalMätningar Program.Skärmuppdatering = False DDEKommando "ROBCOMM", "RUN", RobotProgNamn Wait (30) Do While RobotBusy = 1 Loop Select Case Typ Case "TryckKnapp" HämtaDataXKraft Case "Vred" HämtaDataFiMoment End Select Program.Skärmuppdatering = True Next Avsluta Sub 50: MedRuta "Ett fel har uppstått!! Prova igen." VisaHuvudMeny End Sub Function RobotBusy() On Error GoTo 80 RobotBusyDDE = HämtaDDETal("ROBCOMM", "VARIABLE", "BUSY") RobotBusy = KonvDDEVariableTillHeltal(RobotBusyDDE(1, 1)) Exit Function 80: MsgBox "Ett fel har uppstått!! Prova igen." VisaHuvudMeny End Function
48
Sub HämtaDataXKraft() ' Hämtar variabel-arrayerna för kraft och position 'Vid Fel GåTill 90 LOCAT = HämtaDDETal("ROBCOMM", "LOCARRAY", "LOCAT") KRAFT = HämtaDDETal("ROBCOMM", "VARARRAY", "KRAFT") LOCATSTART = KonvDDELocArrayTillDbl(LOCAT(1, 1), 2) KRAFTSTART = KonvDDEVarArrayTillDbl(KRAFT(1, 1)) Kalkylbladlista("Data").Område(Area(11, 2, 500, 3)).RaderaInnehåll N = 1 Do While KonvDDEVarArrayTillDbl(KRAFT(N, 1)) < 9990 Kalkylbladlista("Data").Celler(N + 10, 2).Val = (1) * (KonvDDELocArrayTillDbl(LOCAT(N, 1), 2) - LOCATSTART) Kalkylbladlista("Data").Celler(N + 10, 3).Val = (-0.27811) * (KonvDDEVarArrayTillDbl(KRAFT(N, 1)) - KRAFTSTART) N = N + 1 Loop Sampla N - 1 Avsluta Sub 90: MedRuta "Ett fel har uppstått!! Prova igen." VisaHuvudMeny End Sub Sub HämtaDataFiMoment() ' Hämtar variabel-arrayerna för vridmoment och position On Error GoTo 110 LOCAT = HämtaDDETal("ROBCOMM", "LOCARRAY", "LOCAT") KRAFT = HämtaDDETal("ROBCOMM", "VARARRAY", "KRAFT") VinkelStart = 57.29578 * (KonvDDELocArrayTillDbl(LOCAT(1, 1), 6)) KRAFTSTART = KonvDDEVarArrayTillDbl(KRAFT(1, 1)) Kalkylbladlista("Data").Område(Area(11, 2, 500, 3)).RaderaInnehåll N = 1 Do While KonvDDEVarArrayTillDbl(KRAFT(N, 1)) < 9990 Vinkel = 57.29578 * (KonvDDELocArrayTillDbl(LOCAT(N, 1), 6)) If Vinkel - VinkelStart < -0.2 Then Vinkel = Vinkel + 360 ElseIf Vinkel - VinkelStart > 360 Then Vinkel = Vinkel - 359.9 End If Kalkylbladlista("Data").Celler(N + 10, 2).Val = Vinkel - VinkelStart ' - 359,9
49
Kalkylbladlista("Data").Celler(N + 10, 3).Val = (-0.706408) * (KonvDDEVarArrayTillDbl(KRAFT(N, 1)) - KRAFTSTART) N = N + 1 Loop Sampla N - 1 Exit Sub 110: MsgBox "Ett fel har uppstått!! Prova igen. (110)" VisaHuvudMeny End Sub Function KonvDDEVarArrayTillDbl(DDETal) ' Konverterar variabel från sträng till dubbelvariable On Error GoTo 120 A = InStr(1, DDETal, ",", 0) u_b = Len(DDETal) DDETalxx = Right(DDETal, (u_b - A)) C = InStr(1, DDETalxx, ".", 0) Mid(DDETalxx, C, 1) = "," KonvDDEVarArrayTillDbl = CDbl(DDETalxx) Exit Function 120: MsgBox "Ett fel har uppstått!! Prova igen. (120)" VisaHuvudMeny End Function Function KonvDDELocArrayTillDbl(DDETal, AntalKomma) ' Konverterar variabel från sträng till dubbelvariable On Error GoTo 121 aa = 1 For i = 1 To AntalKomma A = InStr(aa, DDETal, ",", 0) aa = A + 1 Next u_b = InStr(aa, DDETal, ",", 0) DDETalxx = Mid(DDETal, aa, (u_b - aa)) C = InStr(1, DDETalxx, ".", 0) Mid(DDETalxx, C, 1) = "," KonvDDELocArrayTillDbl = CDbl(DDETalxx) Exit Function 121: MsgBox "Ett fel har uppstått!! Prova igen.(121)" VisaHuvudMeny End Function Function KonvDDEVariableTillHeltal(DDETal) ' Konverterar variabel från sträng till heltal
50
On Error GoTo 130 A = InStr(1, DDETal, ",", 0) u_b = Len(DDETal) DDETalxx = Right(DDETal, (u_b - A)) C = InStr(1, DDETalxx, ".", 0) Mid(DDETalxx, C, 1) = "," KonvDDEVariableTillHeltal = CInt(DDETalxx) Exit Function 130: MsgBox "Ett fel har uppstått!! Prova igen." VisaHuvudMeny End Function Function HämtaDDETal(Application, Topic, Item) ' Funktionen öppnar en DDE-förbindelse med ' programmet:Application, hämtar ' en variabel:Item och stänger därefter DDE- ' förbindelsen. '"Application" , Tex: "ROBCOMM" '"Topic" , Tex: "VARIABLE" '"Item" , Tex: "BUSY" On Error GoTo 140 DDEKanal = DDEInitiera(Application, Topic) HämtaDDETal = DDEBegär(DDEKanal, Item) DDEAvsluta (DDEKanal) DDEKommando Application, "REREAD", "ALL" Exit Function 140: MsgBox "Ett fel har uppstått!! Prova igen." VisaHuvudMeny End Function Sub DDEKommando(Application, Topic, Item) ' Subrutinen öppnar en DDE-förbindelse med ' programmet:Application, utför ' ett kommando:Topic (eventuellt på programnamnet:Item) ' och stänger därefter DDE-förbindelsen. '"Application" , Tex: "ROBCOMM" '"Topic" , Tex: "RUN" '"Item" , Tex: "Main" On Error GoTo 150 DDEKanal = DDEInitiera(Application, Topic) DDEUtför DDEKanal, Item DDEAvsluta (DDEKanal) Exit Sub 150: MsgBox "Ett fel har uppstått!! Prova igen." VisaHuvudMeny End Sub
51
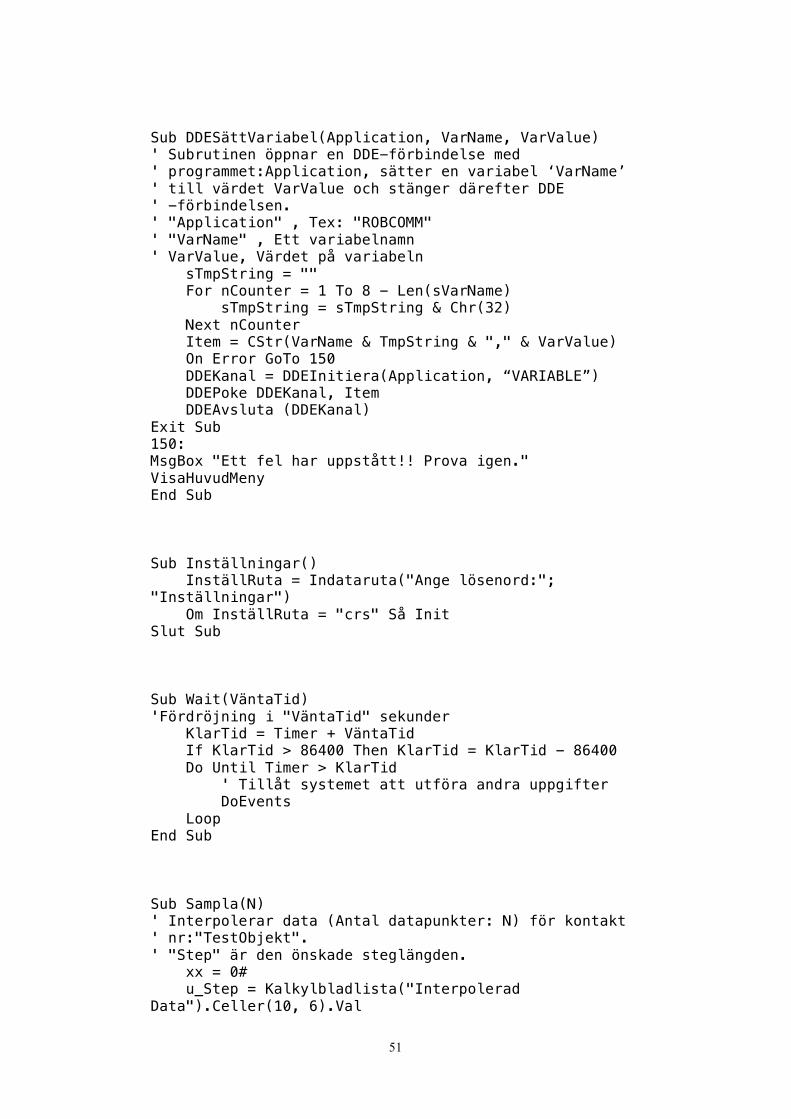
Sub DDESättVariabel(Application, VarName, VarValue) ' Subrutinen öppnar en DDE-förbindelse med ' programmet:Application, sätter en variabel ‘VarName’ ' till värdet VarValue och stänger därefter DDE ' -förbindelsen. ' "Application" , Tex: "ROBCOMM" ' "VarName" , Ett variabelnamn ' VarValue, Värdet på variabeln sTmpString = "" For nCounter = 1 To 8 - Len(sVarName) sTmpString = sTmpString & Chr(32) Next nCounter Item = CStr(VarName & TmpString & "," & VarValue) On Error GoTo 150 DDEKanal = DDEInitiera(Application, “VARIABLE”) DDEPoke DDEKanal, Item DDEAvsluta (DDEKanal) Exit Sub 150: MsgBox "Ett fel har uppstått!! Prova igen." VisaHuvudMeny End Sub Sub Inställningar() InställRuta = Indataruta("Ange lösenord:"; "Inställningar") Om InställRuta = "crs" Så Init Slut Sub Sub Wait(VäntaTid) 'Fördröjning i "VäntaTid" sekunder KlarTid = Timer + VäntaTid If KlarTid > 86400 Then KlarTid = KlarTid - 86400 Do Until Timer > KlarTid ' Tillåt systemet att utföra andra uppgifter DoEvents Loop End Sub Sub Sampla(N) ' Interpolerar data (Antal datapunkter: N) för kontakt ' nr:"TestObjekt". ' "Step" är den önskade steglängden. xx = 0# u_Step = Kalkylbladlista("Interpolerad Data").Celler(10, 6).Val
52
StepInv = 1 / u_Step AntalUtfMät = Kalkylbladlista("Accumulerad Data").Celler(10, 2).Val + 1 Kalkylbladlista("Accumulerad Data").Celler(10, 2).Val = AntalUtfMät Kalkylbladlista("MedelVärde Data").Celler(10, 2).Val = AntalUtfMät Kalkylbladlista("HuvudMeny").Celler(1, 1).Val = AntalUtfMät For i = 1 To (N - 1) x1 = Kalkylbladlista("Data").Celler(i + 10, 2).Val x2 = Kalkylbladlista("Data").Celler(i + 11, 2).Val y1 = Kalkylbladlista("Data").Celler(i + 10, 3).Val y2 = Kalkylbladlista("Data").Celler(i + 11, 3).Val If x1 <> x2 Then k = (y2 - y1) / (x2 - x1) Do While xx < x2 yy = k * (xx - x1) + y1 Kalkylbladlista("Interpolerad Data").Celler((xx * StepInv) + 11, 2).Val = xx Kalkylbladlista("Interpolerad Data").Celler((xx * StepInv) + 11, 3).Val = yy AntalMät = Kalkylbladlista("Accumulerad Data").Celler((xx * StepInv) + 13, 4).Val + 1 Kalkylbladlista("Accumulerad Data").Celler((xx * StepInv) + 13, 4).Val = AntalMät gyy = Kalkylbladlista("Accumulerad Data").Celler((xx * StepInv) + 13, 3).Val Kalkylbladlista("Accumulerad Data").Celler((xx * StepInv) + 13, 2).Val = xx Kalkylbladlista("Accumulerad Data").Celler((xx * StepInv) + 13, 3).Val = yy + gyy Kalkylbladlista("MedelVärde Data").Celler((xx * StepInv) + 14, 2).Val = xx Kalkylbladlista("MedelVärde Data").Celler((xx * StepInv) + 14, 3).Val = (yy + gyy) / AntalMät If AntalMät = 1 Then Kalkylbladlista("MedelVärde Data").Celler((xx * StepInv) + 14, Kol + 4).Val = yy Kalkylbladlista("MedelVärde Data").Celler((xx * StepInv) + 14, Kol + 5).Val = yy End If If yy < Kalkylbladlista("MedelVärde Data").Celler((xx * StepInv) + 14, 4).Val Then Kalkylbladlista("MedelVärde Data").Celler((xx * StepInv) + 14, Kol + 4).Val = yy If yy > Kalkylbladlista("MedelVärde Data").Celler((xx * StepInv) + 14, 5).Val Then Kalkylbladlista("MedelVärde Data").Celler((xx * StepInv) + 14, Kol + 5).Val = yy
53
xx = xx + u_Step Loop End If Next End Sub Function Area(Rad÷V, Kol÷V, RadUH, KolUH) Area = Chr(Kol÷V + 64) + CStr(Rad÷V) + ":" + Chr(KolUH + 64) + CStr(RadUH) End Function Sub InitTyp(Typ) ' Förbereder kalkylbladslistor och diagram Select Case Typ Case "TryckKnapp" 'Step = With AktivArbetsbok With Kalkylbladlista("Data") .Celler(10, 2).Val = "Väg (mm)" .Celler(10, 3).Val = "Kraft (N)" .Kolumner("B").Kolumnbredd = 8.43 .Kolumner("C").Kolumnbredd = 8.43 End With With Kalkylbladlista("Interpolerad Data") .Celler(10, 2).Val = "Väg (mm)" .Celler(10, 3).Val = "Kraft (N)" .Kolumner("B").Kolumnbredd = 8.43 .Kolumner("C").Kolumnbredd = 8.43 End With With Kalkylbladlista("Accumulerad Data") .Celler(12, 2).Val = "Väg (mm)" .Celler(12, 3).Val = "Kraft (N)" .Kolumner("B").Kolumnbredd = 8.43 .Kolumner("C").Kolumnbredd = 8.43 End With With Kalkylbladlista("MedelVärde Data") .Celler(12, 2).Val = "Väg (mm)" .Celler(12, 3).Val = "Kraft (N)" .Kolumner("B").Kolumnbredd = 8.43 End With With Diagramlista("Diagram Data") .Diagramrubrik.Titel = "Väg-Kraft Diagram" .Axlar(xlKategori).Axelrubrik.Titel = "Väg (mm)" .Axlar(xlVärde).Axelrubrik.Titel = "Kraft (N)" End With With Diagramlista("Diagram MedelVärde Data")
54
.Diagramrubrik.Titel = "Väg-Kraft Diagram" .Axlar(xlKategori).Axelrubrik.Titel = "Väg (mm)" .Axlar(xlVärde).Axelrubrik.Titel = "Kraft (N)" End With End With Case "Vred" With AktivArbetsbok With Kalkylbladlista("Data") .Celler(10, 2).Val = "Vinkel(o)" .Celler(10, 3).Val = "Moment (N-cm)" .Kolumner("B").Kolumnbredd = 8.43 .Kolumner("C").Kolumnbredd = 14 End With With Kalkylbladlista("Interpolerad Data") .Celler(10, 2).Val = "Vinkel(o)" .Celler(10, 3).Val = "Moment (N-cm)" .Kolumner("B").Kolumnbredd = 8.43 .Kolumner("C").Kolumnbredd = 14 End With With Kalkylbladlista("Accumulerad Data") .Celler(12, 2).Val = "Vinkel(o)" .Celler(12, 3).Val = "Moment (N-cm)" .Kolumner("B").Kolumnbredd = 8.43 .Kolumner("C").Kolumnbredd = 14 End With With Kalkylbladlista("MedelVärde Data") .Celler(12, 2).Val = "Vinkel(o)" .Celler(12, 3).Val = "Moment (N-cm)" .Kolumner("B").Kolumnbredd = 8.43 End With With Diagramlista("Diagram Data") .Diagramrubrik.Titel = "Vinkel-Moment Diagram" .Axlar(xlKategori).Axelrubrik.Titel = "Vinkel (o)" .Axlar(xlVärde).Axelrubrik.Titel = "Moment (N-cm)" End With With Diagramlista("Diagram MedelVärde Data") .Diagramrubrik.Titel = "Vinkel-Moment Diagram" .Axlar(xlKategori).Axelrubrik.Titel = "Vinkel (o)" .Axlar(xlVärde).Axelrubrik.Titel = "Moment (N-cm)" End With End With End Select End Sub
Kalkylbladlista("Interpolerad Data").Celler(10, 6).Val = Kalkylbladlista("Info").Celler(Dialogbladlista("Dialog3").NedrullbaraListrutor("32").Val + 5, 5).Val Kalkylbladlista("Interpolerad Data").Celler(11, 6).Val = Dialogbladlista("Dialog3").Redigeringsrutor("37").u_Text Kalkylbladlista("Accumulerad Data").Celler(3, 2).Val = Kalkylbladlista("Data").Celler(3, 2).Val Kalkylbladlista("Accumulerad Data").Celler(4, 2).Val = Kalkylbladlista("Data").Celler(4, 2).Val Kalkylbladlista("Accumulerad Data").Celler(5, 2).Val = Kalkylbladlista("Data").Celler(5, 2).Val Kalkylbladlista("Accumulerad Data").Celler(6, 2).Val = Kalkylbladlista("Data").Celler(6, 2).Val Kalkylbladlista("Accumulerad Data").Celler(10, 2).Val = 0 Kalkylbladlista("MedelVärde Data").Celler(3, 2).Val = Kalkylbladlista("Data").Celler(3, 2).Val Kalkylbladlista("MedelVärde Data").Celler(4, 2).Val = Kalkylbladlista("Data").Celler(4, 2).Val Kalkylbladlista("MedelVärde Data").Celler(5, 2).Val = Kalkylbladlista("Data").Celler(5, 2).Val Kalkylbladlista("MedelVärde Data").Celler(6, 2).Val = Kalkylbladlista("Data").Celler(6, 2).Val Kalkylbladlista("MedelVärde Data").Celler(10, 2).Val = 0 End Sub Sub NyttTestObjektAvbryt_Knapp() Dialogbladlista("Dialog3").Dölj AktivArbetsbok.Bladlista("HuvudMeny").Aktivera End Sub Sub Öppna_Knapp() filAttÖppna = Program.HämtaÖppnaFilnamn("Excel (*.xls),*.xls") If filAttÖppna <> False Then Arbetsböcker.Öppna filnamn:=filAttÖppna End If End Sub Sub Spara_Knapp() GammalSökväg = "C:\crs\userprog\prog_1\excel" GammaltFilNamn = Kalkylbladlista("Data").Celler(3, 2).Val
57
AktivArbetsbok.SparaKopiaSom GammalSökväg + "\" + GammaltFilNamn + ".XLS" End Sub Sub SkrivUt_Knapp() ' Ej aktiverad. Printfunktion finns inkorporerad i ' Excel End Sub Sub Avsluta_Knapp() End End Sub Sub Mätning_Knapp() Dialogbladlista("Dialog4").Visa End Sub Sub MätningOK_Knapp() Kalkylbladlista("Data").Celler(7, 2).Val = Dialogbladlista("Dialog4").Redigeringsrutor("8").u_Text Kalkylbladlista("Interpolerad Data").Celler(7, 2).Val = Kalkylbladlista("Data").Celler(7, 2).Val Dialogbladlista("Dialog4").Dölj Mätning CInt(Dialogbladlista("Dialog4").Redigeringsrutor("10").u_Text) End Sub Sub MätningAvbryt_Knapp() Dialogbladlista("Dialog4").Dölj End Sub Sub VisaData_Knapp() Dialogbladlista("Dialog1").Visa End Sub Sub VisaDiagram_Knapp() Dialogbladlista("Dialog2").Visa End Sub
58
Sub OriginalData_Knapp() Dialogbladlista("Dialog1").Dölj AktivArbetsbok.Kalkylbladlista("Data").Aktivera End Sub Sub InterpoleradData_Knapp() Dialogbladlista("Dialog1").Dölj AktivArbetsbok.Kalkylbladlista("Interpolerad Data").Aktivera End Sub Sub MedelvärdesbehandladData_Knapp() Dialogbladlista("Dialog1").Dölj AktivArbetsbok.Kalkylbladlista("MedelVärde Data").Aktivera End Sub Sub VisaDataAvbryt_Knapp() Dialogbladlista("Dialog1").Dölj AktivArbetsbok.Bladlista("HuvudMeny").Aktivera End Sub Sub Information_Knapp() ' Ej aktiverad End Sub Sub Inställningar_Knapp() ' Ej aktiverad End Sub Sub VisaDiagramData() Dialogbladlista("Dialog2").Dölj AktivArbetsbok.Bladlista("Diagram Data").Aktivera End Sub Sub VisaDiagramMVData() Dialogbladlista("Dialog2").Dölj
59
AktivArbetsbok.Bladlista("Diagram MedelVärde Data").Aktivera End Sub Sub VisaDiagramAvbryt_Knapp() Dialogbladlista("Dialog2").Dölj AktivArbetsbok.Bladlista("HuvudMeny").Aktivera End Sub Sub VisaHuvudMeny() AktivArbetsbok.Bladlista("HuvudMeny").Aktivera End Sub ///
60
Appendix B Robot Files Robot Code (RAPL-2 Code), executed in Robcomm 4.30. INIT.TXT ; Program Name: Init ; ; Initializes the robot system and sets the speed ; ! BUSY = 1 ; POSE FUN PASSWORD 255 @CLINSPD 40.0 PASSWORD 0 SPEED 30 READY FINISH GOSUB FON GOSUB ERASER ; ! BUSY = 0 ; STOP $ FON.TXT ; Program Name: FON ; ; Initializes the Force and Torque sensor ; SENSOR FORCE INZ ; initialize the sensor memory SENSOR FORCE ON ; turn on the sensor sampling RETURN $ ERASER.TXT ; Program Name: ERASER ; ; Erases all values in the array DVAR and the array ; DLOCN ; ! N = 1 DO
61
DVAR KRAFT[N] DLOCN LOCAT[N] ++ N UNTIL N > MAXNUMB ! MAXNUMB = 1 RETURN $ MAX.TXT ; Program Name: MAX ; ; Collects the maximum forces that was measured ; ! MAXX=FORCE[42] ! MAXT=FORCE[45] STOP $ RECOVER.TXT ; Program Name: Recover ; ; Resets the system ; PASSWORD 255 @CLINSPD 40.0 PASSWORD 0 $ PushButton.TXT ; Program Name: PushButton ; ; This program does the actual measurement of ; a push button, designated ‘Object’ ; The operator have to define a start position ; ‘PBStart(Object)’ and an end position ; ‘PBEnd(Object)’ for each test object. ; ! BUSY = 1 POSE FUN GOSUB FON SENSOR FORCE FRAME RAW ; ! MAXFOZ = 3.596 * MAXFN1 ; Converts from N to Oz ! MAXCONOZ = 3.596 *MAXCONN ; Converts from N to Oz SPEED 50 MOVE PBStart[Object] ; Move to start position FINISH SENSOR FORCE CALIBRATE X
62
! STARTF = FORCE[0] SPEED 10 MOVE PBEnd[Object] ; Start pushing on the switch ; ***************************************************** ; SAFETY!!!! Interrupts if anything in the path ; (if force more than max allowed force) !!! ! C = 0 DO IF ABS(FORCE[0] - STARTF) > MAXCONOZ THEN 100 ++ C UNTIL C > 100 FINISH ; ***************************************************** ; ! COUNT = 1 PASSWORD 255 @CLINSPD MAXLNSPD SENSOR FORCE CALIBRATE X ! STARTF = FORCE[0] SPEED SPEED1 Z DEPTH1,S 10 ACTUAL LOCAT[COUNT] ! KRAFT[COUNT] = FORCE[0] - STARTF IF ABS(FORCE[0] - STARTF) > MAXFOZ THEN 20 ++ COUNT GOTO 10 20 HALT ; ! KRAFT[COUNT + 1] = 9999 ! BUSY = 0 @CLINSPD 40.0 PASSWORD 0 SPEED 30 MOVE PBEnd[Object] FINISH SPEED 50 MOVE PBStart[Object] FINISH ; GOTO 200 100 HALT SPEED 50 MOVE PBStart [Object] FINISH 200 ! BUSY = 0 IF COUNT > MAXNUMB THEN 999 STOP ; 999 ! MAXNUMB = COUNT STOP $
63
RotarySwitch.TXT ; Program Name: RotarySwitch ; ; This program does the actual measurement of ; a rotary switch, designated ‘Object’ ; The operator have to define start positions ; ‘RWStart1(Object)’, ‘RWStart2(Object)’ and an end ; position ‘RSEnd(Object)’ for each test object. ; ! BUSY = 1 POSE FUN GOSUB FON SENSOR FORCE FRAME RAW ; ! MAXFOZ = 3.596 * MAXFN3 ; Converts from N to Oz ! MAXCONOZ = 3.596 * MAXCONN ; Converts from N to Oz ! VINKE12R = VINKE12 / 57.29578 ; Conv degrees to rad SPEED 50 MOVE RWStart1[Object] ; Move to start position MOVE RWStart2[Object] FINISH SENSOR FORCE CALIBRATE X ! STARTF = FORCE[0] SPEED 10 MOVE RSEnd[Object] ; Start turning the switch ; ***************************************************** ; SAFETY!!!! Interrupts if anything in the path ; (if force more than max allowed force) !!! ! C = 0 DO IF ABS(FORCE[0] - STARTF) > MAXCONOZ THEN 100 ++ C UNTIL C > 50 FINISH ; ***************************************************** ; ! COUNT = 1 SPEED 50 ROLL VINKE11 FINISH ! STARTF = FORCE[3] ACTUAL STARTL ! A = TCOMP(STARTL) ! VINKSLUT = TCOMP(STARTL) + VINKE12R IF VINKSLUT < (-3.141592) THEN 300 IF VINKSLUT > 3.141592 THEN 350 5 SPEED SPEED3 ROLL VINKE12 DO ACTUAL LOCAT[COUNT] ! HAR = TCOMP(LOCAT[COUNT]) ! KRAFT[COUNT] = FORCE[3] - STARTF IF ABS(FORCE[3] - STARTF) > MAXFOZ THEN 20 ++ COUNT
64
UNTIL ABS(HAR - VINKSLUT) < 0.02 ! KRAFT[COUNT] = 9999 ! BUSY = 0 SPEED 50 ROLL -(VINKE11 + VINKE12 + VINKE13) ROLL VINKE13 MOVE RWStart1[Object] FINISH IF COUNT > MAXNUMB THEN 999 STOP ; 20 HALT ! KRAFT[COUNT + 1] = 9999 ! BUSY = 0 SPEED 50 MOVE RSEnd[Object] FINISH ROLL -VINKE13 ROLL VINKE13 MOVE RWStart1[Object] FINISH IF COUNT > MAXNUMB THEN 999 STOP ; 100 HALT SPEED 50 MOVE RWStart1[Object] FINISH STOP ; 300 ! VINKSLUT = VINKSLUT + 6.28318 GOTO 5 350 ! VINKSLUT = VINKSLUT - 6.28318 GOTO 5 ; 999 ! MAXNUMB = COUNT STOP $
65
Appendix C Formulas and Conversions Formulas The Pearson Product-Moment Correlation Coefficient [24] for two sets of values, calculated using the formula “Correlation” in Excel: 𝑟 = ∑ ! ! ! ! ! !
∑ ! ! ! ! ∑ ! ! ! !
The Trapezoidal numerical method [25] for calculating the area under the graph:
𝑓 𝑥 𝑑𝑥!
! ≈
12 (𝑥!!! – 𝑥!
!
!!!
)(𝑓 𝑥!!! + 𝑓(𝑥!))
Conversions The Force and Torque sensors are calibrated in Ounce (Oz), OzInch and radians (rad). In the robot code these units are converted to N, Ncm and degrees as follows: 1 N ≈ 3.596 Oz (1 Oz ≈ 28.35 g ≈ 0.2781 N) 1 Ncm ≈ 1.4156 OzInch (1 OzInch ≈ 0.7064 Ncm) 1 rad = 360/2π ≈ 57.296 degrees