Page 1
Isolated Power Systems Connect 2016
UAE - Pacific Partnership Fund: Fiji LaKaRo Solar
PV/Diesel Hybrid Project Case Study
Masdar - Special Projects Department
Author: John Caruso
December 1st, 2016
Page 2
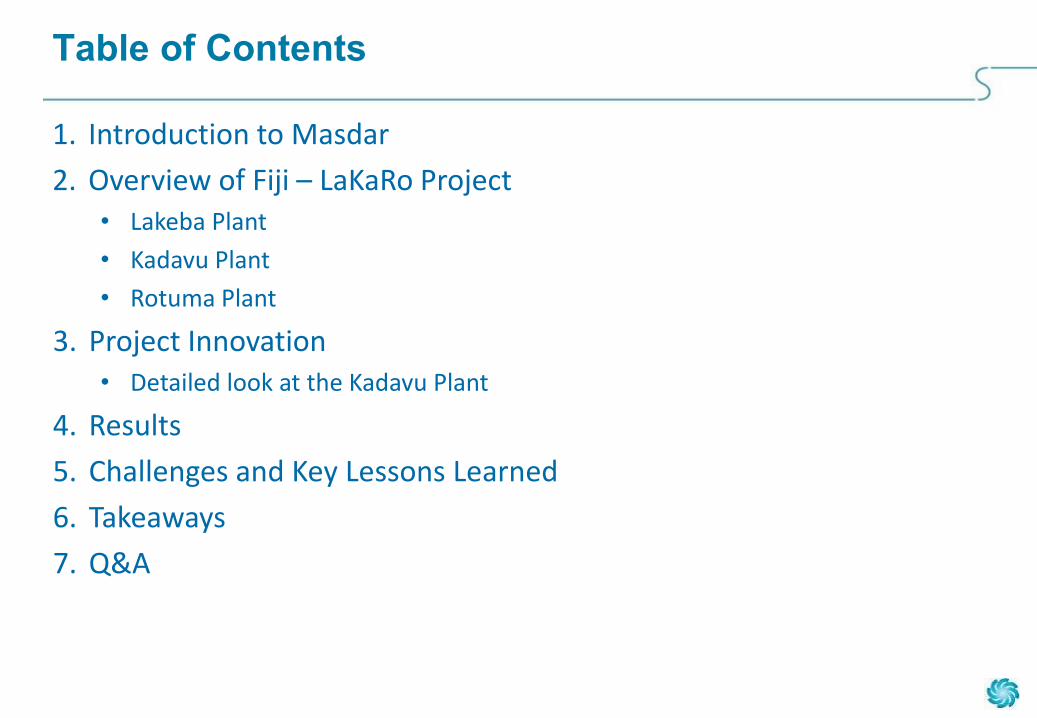
Table of Contents
1. Introduction to Masdar
2. Overview of Fiji – LaKaRo Project • Lakeba Plant
• Kadavu Plant
• Rotuma Plant
3. Project Innovation • Detailed look at the Kadavu Plant
4. Results
5. Challenges and Key Lessons Learned
6. Takeaways
7. Q&A
Page 3
Masdar - Who We Are
Masdar is Abu Dhabi’s renewable
energy company. We work to advance
the development, commercialisation
and deployment of clean energy
technologies and solutions.
We serve as a link between today’s
fossil fuel economy and the energy
economy of the future.
We are a commercially-driven
company wholly-owned by the
Mubadala Development Company.
“We must not rely on oil alone as the main
source of our national income.”
“We have to diversify the sources of our
revenue and construct economic projects
that will ensure a free, stable and dignified
life for the people.”
Sheikh Zayed bin Sultan Al Nahyan
Founding Father of the UAE
Page 4
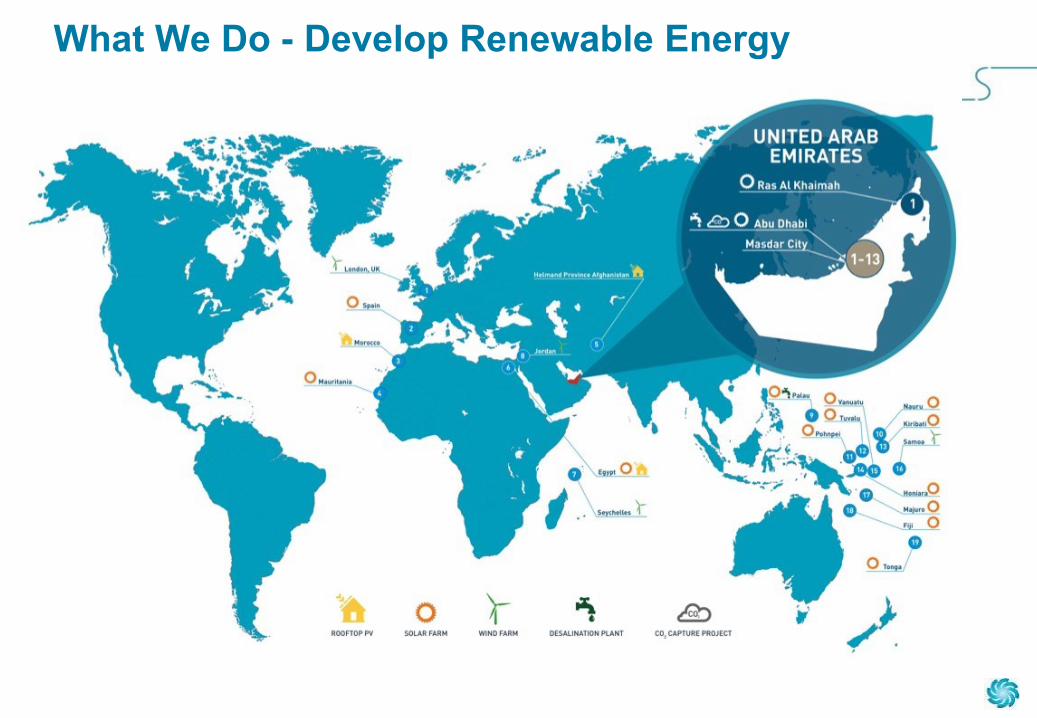
What We Do - Develop Renewable Energy
Page 5
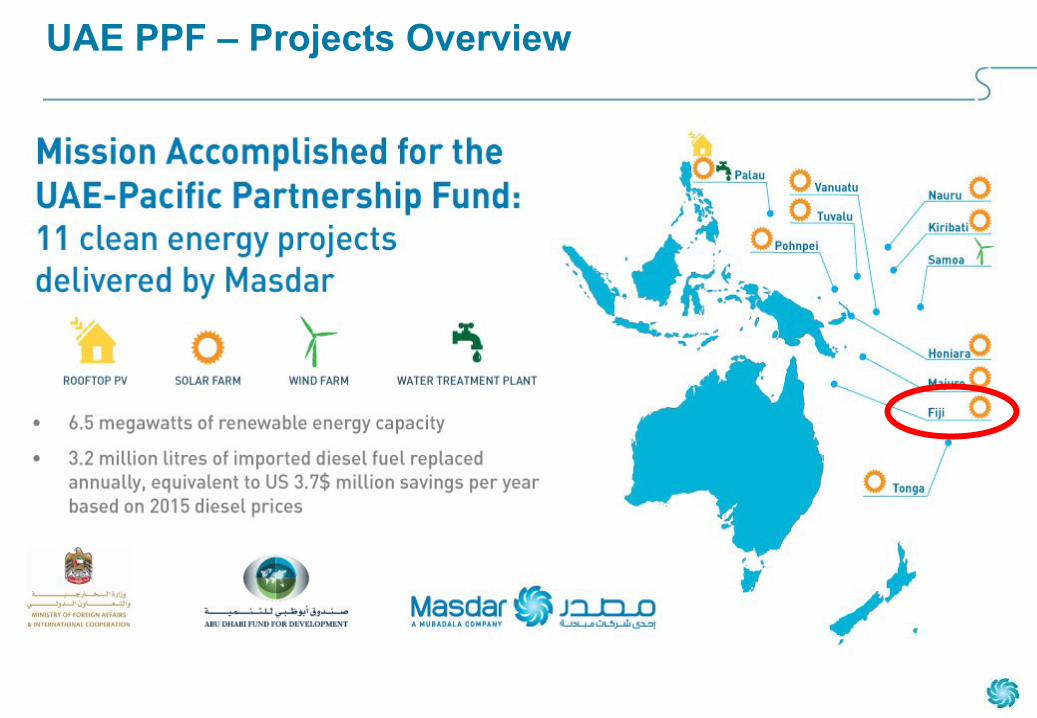
UAE PPF – Projects Overview
Page 6
Fiji Project - LaKaRo
Lakeba Kadavu Rotuma Project PV Capacity (kW) 150 225 150
Diesel Capacity (kW) 138 184 138
Module Type 494 x JA-310 Poly 726 x JA-310 Poly 494 x JA-310 Poly
Inverter 7 x Sunny Tripower 20000TL 10 x Sunny Tripower 20000TL 7 x Sunny Tripower 20000TL
Racking Schletter- Groundmount Schletter- Groundmount Schletter- Groundmount
FSC SMA Fuel Save Controller 2.0 SMA Fuel Save Controller 2.0 SMA Fuel Save Controller 2.0
Diesel Type 3 x Hatz Low Load Diesel Twin pack 4 x Hatz Low Load Diesel Twin pack 3 x Hatz Low Load Diesel Twin pack
Diesel Controller 6 x Woodward easYgen-3200 8 x Woodward easYgen-3200 6 x Woodward easYgen-3200
LaKaRo Project:
• 3 individual plants in Fiji located in the outer islands of Lakeba, Kadavu, Rotuma
• 525 kW of Solar PV
• 460 kW of Low load diesel generator (LLDG)
Page 7
Types of PV-Diesel-Hybrid
System CAPEX
Fuel S
avin
gs
0%
100%
A
B
C
D
E
LaKaRo Systems
Existing Diesel replaced
by Hatz Low Load Diesel
Generators
Page 8
Kadavu Specifications
Kadavu
Project PV Capacity (kW) 225
Diesel Capacity (kW) 184
Module Type 726 x JA-310 Poly
Inverter 10 x Sunny Tripower 20000TL
Racking Schletter- Groundmount
FSC SMA Fuel Save Controller 2.0
Diesel Type 4 x Hatz Low Load Diesel Twin pack (8 x 23
kW LLDGs)
Diesel Controller 8 x Woodward easYgen-3200
Page 9
Kadavu Project (Ariel View)
Page 10
Kadavu Fuel Saver
Page 11
Kadavu Low Load Diesel Generator
Hatz Low Load Diesel Generators
• “Flat” efficiency curves. Engine can run at
lower capacity with more efficiency then
typical diesel engines
• Use of smaller sized engines coupled in one
twin pack. Reduced engine capacity allows
for load to be managed in smaller intervals.
• 23 kW engines >> theoretical minimum
running load of 6 kW
Page 12
Kadavu Power Station
8 x Woodward easYgen-3200
controllers
Hatz Diesel Twin Packs
Fuel Save Controller
Page 13
Kadavu Load Profile
0
50
100
150
200
250
1 2 3 4 5 6 7 8 9 10 11 12 13 14 15 16 17 18 19 20 21 22 23 24
kW
Hour
Kadavu Load Profile
Base Diesel Generation Demand
Page 14
Kadavu Load Profile
0
50
100
150
200
250
1 2 3 4 5 6 7 8 9 10 11 12 13 14 15 16 17 18 19 20 21 22 23 24
kW
Hour
Kadavu Load Profile with Theoretical Solar PV Generation
Base Diesel Generation Utilised Solar PV Supply Solar Curtailment Demand
Page 15
Results 1) Kadavu Load + Generation Profiles
0
20
40
60
80
100
120
140
Kadavu Load + Generation Profile - August 5th 2016 High Solar Availability
Generator Solar PV Load
PV online
Gen = Load - PV
Generator operating to
maintain spinning reserve (24
to 30 kW)
Matching load
and PV profiles
Instantaneous load
Page 16
48.549
49.550
50.551
51.5
5:2
2:4
1 a
.m.
5:4
1:1
0 a
.m.
5:5
9:3
9 a
.m.
6:1
8:0
8 a
.m.
6:3
6:3
7 a
.m.
6:5
5:0
6 a
.m.
7:1
3:3
5 a
.m.
7:3
2:0
3 a
.m.
7:5
0:3
3 a
.m.
8:0
9:0
2 a
.m.
8:2
7:3
0 a
.m.
8:4
5:5
9 a
.m.
9:0
4:2
8 a
.m.
9:2
2:5
7 a
.m.
9:4
1:2
6 a
.m.
9:5
9:5
5 a
.m.
10
:18
:24
a.m
.1
0:3
6:5
3 a
.m.
10
:55
:22
a.m
.1
1:1
3:5
1 a
.m.
11
:32
:20
a.m
.1
1:5
0:4
9 a
.m.
12
:09
:18
p.m
.1
2:2
7:4
7 p
.m.
12
:46
:16
p.m
.1
:04
:45
p.m
.1
:23
:13
p.m
.1
:41
:42
p.m
.2
:00
:11
p.m
.2
:18
:40
p.m
.2
:37
:10
p.m
.2
:55
:38
p.m
.3
:14
:07
p.m
.3
:32
:36
p.m
.3
:51
:05
p.m
.4
:09
:34
p.m
.4
:28
:03
p.m
.4
:46
:32
p.m
.5
:05
:01
p.m
.5
:23
:30
p.m
.5
:41
:59
p.m
.6
:00
:28
p.m
.6
:18
:56
p.m
.6
:37
:25
p.m
.6
:55
:54
p.m
.7
:14
:23
p.m
.7
:32
:52
p.m
.7
:51
:21
p.m
.8
:09
:50
p.m
.8
:28
:19
p.m
.8
:46
:48
p.m
.9
:05
:17
p.m
.9
:23
:46
p.m
.9
:42
:15
p.m
.1
0:0
0:4
4 p
.m.
10
:19
:13
p.m
.1
0:3
7:4
1 p
.m.
10
:56
:11
p.m
.1
1:1
4:3
9 p
.m.
11
:33
:08
p.m
.1
1:5
1:3
8 p
.m.
Kadavu Frequency- August 5th 2016
410412414416418420
5:2
2:4
1 a
.m.
5:4
1:1
0 a
.m.
5:5
9:3
9 a
.m.
6:1
8:0
8 a
.m.
6:3
6:3
7 a
.m.
6:5
5:0
6 a
.m.
7:1
3:3
5 a
.m.
7:3
2:0
3 a
.m.
7:5
0:3
3 a
.m.
8:0
9:0
2 a
.m.
8:2
7:3
0 a
.m.
8:4
5:5
9 a
.m.
9:0
4:2
8 a
.m.
9:2
2:5
7 a
.m.
9:4
1:2
6 a
.m.
9:5
9:5
5 a
.m.
10:18:24…
10:36:53…
10:55:22…
11:13:51…
11:32:20…
11:50:49…
12:09:18…
12:27:47…
12:46:16…
1:0
4:4
5 p
.m.
1:2
3:1
3 p
.m.
1:4
1:4
2 p
.m.
2:0
0:1
1 p
.m.
2:1
8:4
0 p
.m.
2:3
7:1
0 p
.m.
2:5
5:3
8 p
.m.
3:1
4:0
7 p
.m.
3:3
2:3
6 p
.m.
3:5
1:0
5 p
.m.
4:0
9:3
4 p
.m.
4:2
8:0
3 p
.m.
4:4
6:3
2 p
.m.
5:0
5:0
1 p
.m.
5:2
3:3
0 p
.m.
5:4
1:5
9 p
.m.
6:0
0:2
8 p
.m.
6:1
8:5
6 p
.m.
6:3
7:2
5 p
.m.
6:5
5:5
4 p
.m.
7:1
4:2
3 p
.m.
7:3
2:5
2 p
.m.
7:5
1:2
1 p
.m.
8:0
9:5
0 p
.m.
8:2
8:1
9 p
.m.
8:4
6:4
8 p
.m.
9:0
5:1
7 p
.m.
9:2
3:4
6 p
.m.
9:4
2:1
5 p
.m.
10:00:44…
10:19:13…
10:37:41…
10:56:11…
11:14:39…
11:33:08…
11:51:38…
Kadavu Voltage- August 5th 2016
Results 2) Kadavu Frequency and Voltage
Page 17
-20
0
20
40
60
80
100
120
140
6:1
46
:31
6:4
77
:04
7:2
17
:37
7:5
48
:10
8:2
78
:44
9:0
09
:17
9:3
49
:50
10
:07
10
:24
10
:40
10
:57
11
:14
11
:30
11
:47
12
:04
12
:20
12
:37
12
:54
13
:10
13
:27
13
:43
14
:00
14
:17
14
:33
14
:50
15
:07
15
:23
15
:40
15
:57
16
:13
16
:30
16
:47
17
:03
17
:20
17
:37
17
:53
18
:10
18
:27
18
:43
19
:00
19
:17
19
:33
19
:50
20
:06
20
:23
20
:40
20
:56
21
:13
21
:30
21
:46
22
:03
22
:20
22
:36
22
:53
23
:10
23
:26
23
:43
Kadavu Load Profile - August 6th 2016 Volatile Solar Availability
Generator Solar PV Average Load
Results 3) Kadavu Load + Volatile Gen. Profiles
Page 18
45
46
47
48
49
50
51
52
-20
0
20
40
60
80
100
120
140
6:1
46
:31
6:4
77
:04
7:2
17
:37
7:5
48
:10
8:2
78
:44
9:0
09
:17
9:3
49
:50
10
:07
10
:24
10
:40
10
:57
11
:14
11
:30
11
:47
12
:04
12
:20
12
:37
12
:54
13
:10
13
:27
13
:43
14
:00
14
:17
14
:33
14
:50
15
:07
15
:23
15
:40
15
:57
16
:13
16
:30
16
:47
17
:03
17
:20
17
:37
17
:53
18
:10
18
:27
18
:43
19
:00
19
:17
19
:33
19
:50
20
:06
20
:23
20
:40
20
:56
21
:13
21
:30
21
:46
22
:03
22
:20
22
:36
22
:53
23
:10
23
:26
23
:43
Kadavu Load Profile - August 6th 2016 Volatile Solar Availability
Generator Solar PV Average Load Frequency
Frequency fluctuations <1%
Results 3) Kadavu Load + Volatile Gen. Profiles
Page 19
390
395
400
405
410
415
420
-20
0
20
40
60
80
100
120
140
6:1
46
:31
6:4
77
:04
7:2
17
:37
7:5
48
:10
8:2
78
:44
9:0
09
:17
9:3
49
:50
10
:07
10
:24
10
:40
10
:57
11
:14
11
:30
11
:47
12
:04
12
:20
12
:37
12
:54
13
:10
13
:27
13
:43
14
:00
14
:17
14
:33
14
:50
15
:07
15
:23
15
:40
15
:57
16
:13
16
:30
16
:47
17
:03
17
:20
17
:37
17
:53
18
:10
18
:27
18
:43
19
:00
19
:17
19
:33
19
:50
20
:06
20
:23
20
:40
20
:56
21
:13
21
:30
21
:46
22
:03
22
:20
22
:36
22
:53
23
:10
23
:26
23
:43
Kadavu Load Profile - August 6th 2016 Volatile Solar Availability
Generator Solar PV Load Voltage
Voltage fluctuations <1%
Results 3) Kadavu Load + Volatile Gen. Profiles
Page 20
LeKaRo Summary of Results
Summary of Results
• Successful replacement of existing diesel generators with innovative low load diesel generators
and Solar PV plant with fuel save controller
• Highest solar PV penetration in one day of 76.29% and an average penetration of 57.31% over a
one year period
• Highest percentage of diesel energy displaced in one day of 57.46% and an average percentage
of diesel energy displaced of 31.94%
Lekeba power station
Page 21
LaKaRo Energy Needs
Pre-Project Post-Project
Outer Island Diesel Price Today (Q4-2015)
0.70 USD/ltr 0.70 USD/ltr
Est. Outer Island Diesel Price (2015-2035)
0.95 USD/ltr 0.95 USD/ltr
Energy Demand (2015) 980 MWhr 980 MWhr
Energy Demand (2015-2035) 24,500 MWhr 24,500 MWhr
Ave Diesel usage per year (2015)
302,000 ltr 205,500 ltr
Diesel usage (2015-2035) 6,040,000 ltr 4,110,800 ltr
Diesel Expenditure (2015-2035)
5,750,000 USD 3,905,000 USD
CO2 Equivalent (2015-2035) 16,200 Tonnes CO2 11,000 Tonnes CO2
OVER 1.8 MILLION USD
OF DIRECT DIESEL FUEL
SAVINGS OVER THE NEXT
20 YEARS
OVER 5,000 TONNES OF
CO2 AVOIDED
LeKaRo Key Achievements
Page 22
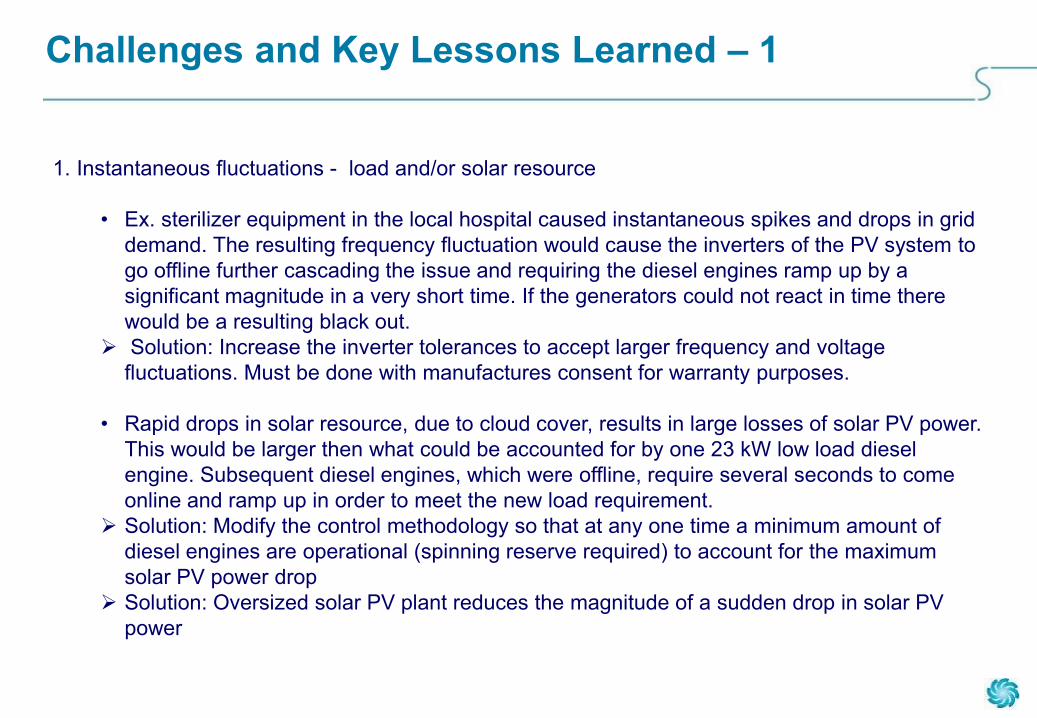
Challenges and Key Lessons Learned – 1
1. Instantaneous fluctuations - load and/or solar resource
• Ex. sterilizer equipment in the local hospital caused instantaneous spikes and drops in grid
demand. The resulting frequency fluctuation would cause the inverters of the PV system to
go offline further cascading the issue and requiring the diesel engines ramp up by a
significant magnitude in a very short time. If the generators could not react in time there
would be a resulting black out.
Solution: Increase the inverter tolerances to accept larger frequency and voltage
fluctuations. Must be done with manufactures consent for warranty purposes.
• Rapid drops in solar resource, due to cloud cover, results in large losses of solar PV power.
This would be larger then what could be accounted for by one 23 kW low load diesel
engine. Subsequent diesel engines, which were offline, require several seconds to come
online and ramp up in order to meet the new load requirement.
Solution: Modify the control methodology so that at any one time a minimum amount of
diesel engines are operational (spinning reserve required) to account for the maximum
solar PV power drop
Solution: Oversized solar PV plant reduces the magnitude of a sudden drop in solar PV
power
Page 23
2. System control logic to main balanced running hours between engines
• This is done equalize long term running hours. If there are maintenance issue with one of
the engines it will naturally have the lowest running hours, the system would constantly try
to use this engine if it is not taken offline by the operators. Example – engine with
faulty/dirty filter, maintenance issue would be worsened by control logic.
Improved control logic used to fixed this issue
Periodic manual intervention and regular maintenance is important
3. Irradiation data not being incorporated into fuel saver
• Caused an extra degree of reserve capacity from the LLDG. The SMA Fuel Saver controller
requires input from an irradiance sensor on site in order to calculate the available solar
resource, cannot be calculated indirectly by the inverters.
4. Grid imbalance on micro grids
• Voltages across different lines can vary drastically. Three phase inverters have a set
tolerance bandwidth and cannot operate outside of a maximum threshold.
Possible solutions include single phase inverters or battery solutions.
5. Use of small capacity generators requires modified protection philosophy
• Typical breakers didn’t incorporate a function to change set points (inrush current).
Suitably configured breakers must be chosen in the design of the low load diesel generator
protection system.
Challenges and Key Lessons Learned – 2
Page 24
System CAPEX
Fuel S
avin
gs
0%
100%
A
B
C
D
E
PV Penetration 55-60%
Displaced Diesel Energy
(Fuel Saving) 30-35%
LeKaRo Conclusion
LaKaRo Systems
Page 25
Battery integration with the fuel saver provides additional versatility, but is it technical and economically
feasible? Some possible options which could be explored.
i) Battery system with non-grid forming inverters
• Power smoothing, eliminates instantaneous fluctuations generation profiles and minimal peak
shaving
• 2-4 hours of battery capacity with appropriate C-rate
• Requires diesels to form the grid, diesel always run at minimal load
ii) Battery system with grid forming inverters
• Diesel generators placed offline during daytime hours, reduces diesel running hours ; lower
maintenance costs
• Requires larger battery system ~4-12 hours of battery capacity
iii) Battery system with grid forming inverters- no diesel generators
• Eliminates the need for diesel generators. Micro-grid is entirely powered by Solar PV
• Requires large enough battery system to account for multiple days of low/zero solar irradiance
to prevent blackouts; ~48-62 hours of battery capacity
Future case study…
LeKaRo Takeaways
Page 26
Thank You - Q&A
Thank You
Page 27
APPENDIX 1
Case Study Appendix
Page 28
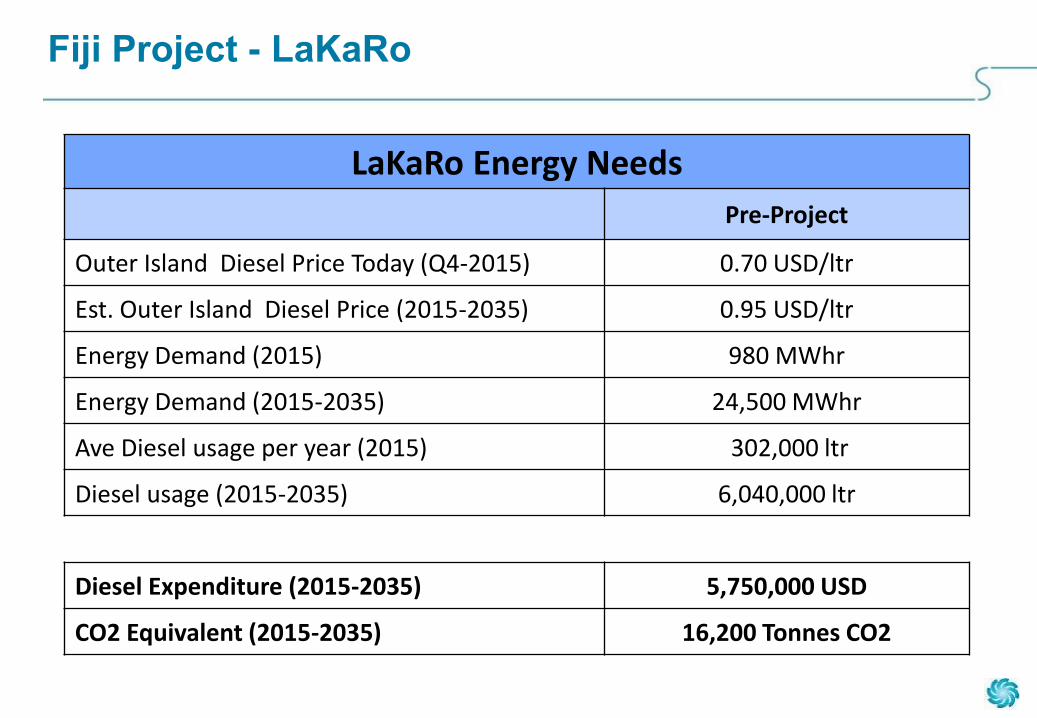
Fiji Project - LaKaRo
LaKaRo Energy Needs
Pre-Project
Outer Island Diesel Price Today (Q4-2015) 0.70 USD/ltr
Est. Outer Island Diesel Price (2015-2035) 0.95 USD/ltr
Energy Demand (2015) 980 MWhr
Energy Demand (2015-2035) 24,500 MWhr
Ave Diesel usage per year (2015) 302,000 ltr
Diesel usage (2015-2035) 6,040,000 ltr
Diesel Expenditure (2015-2035) 5,750,000 USD
CO2 Equivalent (2015-2035) 16,200 Tonnes CO2