28
Flood and Coastal Erosion Risk Management appraisal guidance Guidance on applying the scoring and weighting methodology March 2010
Flood and Coastal Erosion Risk Management appraisal guidance
Guidance on applying the scoring and weighting methodology
March 2010
We are the Environment Agency. It's our job to look after your environment and make it a better place - for you, and for future generations. Your environment is the air you breathe, the water you drink and the ground you walk on. Working with business, Government and society as a whole, we are making your environment cleaner and healthier. The Environment Agency. Out there, making your environment a better place.
Published by: Environment Agency Rio House Waterside Drive, Aztec West Almondsbury, Bristol BS32 4UD Tel: 0870 8506506 Email: [email protected] www.environment-agency.gov.uk © Environment Agency; March 2010 All rights reserved. This document may be reproduced with prior permission of the Environment Agency.
TABLE OF CONTENTS
Page Preface 1 1. The Approach 1 2. Step 1: Scoring of Impacts 2 3. Step 2: Weighting of Impacts 5 4. Step 3: Calculating Implied Money Values for the Intangible Impacts 11 5. Verifying the Implied Values 17 6. Identifying the Preferred Option 19
Environment Agency Scoring and Weighing Supporting Document i

Environment Agency Scoring and Weighing Supporting Document ii
PREFACE This is a supporting document to the Environment Agency’s Flood and Coastal Erosion Risk Management Appraisal Guidance (FCERM-AG).
1. THE APPROACH The scoring and weighting methodology can be used to estimate monetary values for those impacts that are difficult to measure in monetary values. It has been developed for use in flood and coastal erosion risk appraisal work through five pilot trials. It is based on three main steps: Step 1: scoring of impacts; Step 2: weighting of impacts; Step 3: calculating implied money values for the intangible impacts; and Step 4: verifying the implied values. The methodology forms part of the current approach to project appraisal, relying on options that have been identified elsewhere (see Chapter 6 of the main guidance) and impacts (benefits and damages) that have been described using an Appraisal Summary Table (AST) (see Chapter 7 of the main guidance). The approach requires scores to be assigned to each option and weights to be assigned to each category. Once all the scores and weights have been assigned, implied values can be calculated as a method for estimating the value of the intangible benefits1 relative to the tangible benefits2. Scoring and weighting can, therefore, provide a less costly alternative to stated preference and other techniques as a method for directly eliciting money values for those impacts that are otherwise difficult to estimate in money terms. It is therefore most useful when the intangible impacts are likely to be significant and could have a significant effect on the choice of preferred option. Implied values could also be used alongside benefits transfer values as a method of validation/verification that the estimated benefits are reasonable. Overall, the use of implied values could help to keep the costs of appraisal down while allowing all of the benefits to be valued. The outputs from Step 3 have been designed to fit in with the current method for identifying the preferred option since they enable the net present value (NPV), benefit-cost ratio (BCR) and incremental benefit-cost ratio (IBCR) to be calculated.
1 Where intangible benefits are defined as those that are difficult to value in monetary terms,
such as environmental and social benefits. 2 Where tangible benefits are defined as those that can be readily valued in monetary terms,
such as property damages avoided.
Environment Agency Scoring and Weighing Supporting Document 1

2. STEP 1: SCORING OF IMPACTS Scoring of impacts begins once the AST has been fully completed (see Chapter 7 of the main guidance). Scores are used to distinguish between the impacts caused by the options for each category in the AST. The approach to use is as follows: first identify which is the worst option. This is the usually the option with the
greatest negative impacts (damages). You should give the worst option a score of 0 (the worst option could also be the option with the lowest benefits if all options would provide benefits for a particular impact type). For any one impact type, it is likely that impacts will be presented in comparable ways (e.g. money terms, quantified measures or qualitative descriptions). If there is a mixture of quantitative and qualitative information, you will need to consider both when deciding which option is worst;
next identify which is the best option. This is the option with the least negative
impacts (damages) or greatest benefits. The best option is assigned a score of 100. It is important to note that two (or more) options can be considered equal best (or worst) and all assigned a score of 100 (or 0). Even if there is only a small difference between the impacts under the worst and best options (i.e. the impacts are very similar but you can distinguish between them), you should still give them scores of 0 and 100. It will be useful to record that you believe this is a small difference, though, as it is the difference between the worst and best options that is the basis on which you will assign weights; and
all the remaining options are assigned a score between 0 and 100 depending
on how close they are to the worst/best options. Quantitative information can be used as the basis for scores where available and appropriate (i.e. where the quantitative information captures the total impact/benefit). You should record any assumptions made when assigning scores to maintain transparency. You can assess the impact of uncertainties during sensitivity analysis.
You can easily calculate the scores for those impacts that have been estimated in money terms. These can be calculated automatically as the range (from worst to best option) is known as are the intermediate impacts of those options between the worst and best. You will need to consider the time over which the impacts are predicted to occur. This may involve dividing into epochs or time periods to reflect differences between short, medium and long-term effects.
Environment Agency Scoring and Weighing Supporting Document 2

Environment Agency Scoring and Weighing Supporting Document 3
Example
Category Do-nothing Do-minimum (maintain pumping)
Increased pumping
Road raising
Recreation
Increase in flood level affects some 1.5km of footpaths
Gradual increase in flooding over time affects 1.5km footpaths by year 30
Footpaths protected for 100 years
1.5km of footpaths affected over time (as do-minimum) with road as alternative
Score
0 (worst option – affects all footpaths and for longest period of time)
70 (due to protection of footpaths for 30 years)
100 (best option – protects footpath for whole time period of appraisal)
80 (due to protection of footpaths for 30 years and potential to use road as alternative, but this is less beneficial than footpaths)
Category Do-nothing Do-minimum (maintain embankments)
Raise embankments
Realign embankments
Heritage Write-off of 3 Grade 2* listed buildings
Protection of 3 Grade 2* listed buildings
Protection of 3 Grade 2* listed buildings
Write-off of 1 Grade 2* listed building
Score 0 (worst option) 100 (best option) 100 (best option)
66 (based on 2/3 Grade 2* listed buildings being protected)
All of the scores you have assigned should be recorded in a Scoring Summary Table, an example of which is provided as Table 2.1, overleaf3. This table requires you to include justifications for the scores assigned, again to provide an audit trail and transparency to the appraisal. Such descriptions are also useful further information becomes available, e.g. on a particular impact type as it is easier to revise the scores rather than having to begin the scoring process agaThe descriptions also provide you with an opportunity to check your scores when you reach the end, e.g. to ensure that the same thinking has been applied throughout. This is particularly important if the scoring has been undertaken overa period of time, and/or where different people have been involved when scoring the variou
if
in.
s impacts.
3 Table 2.1 shows some impact types. These are intended as examples. The AST for a
specific project should be tailored to ensure that all the impacts are included.
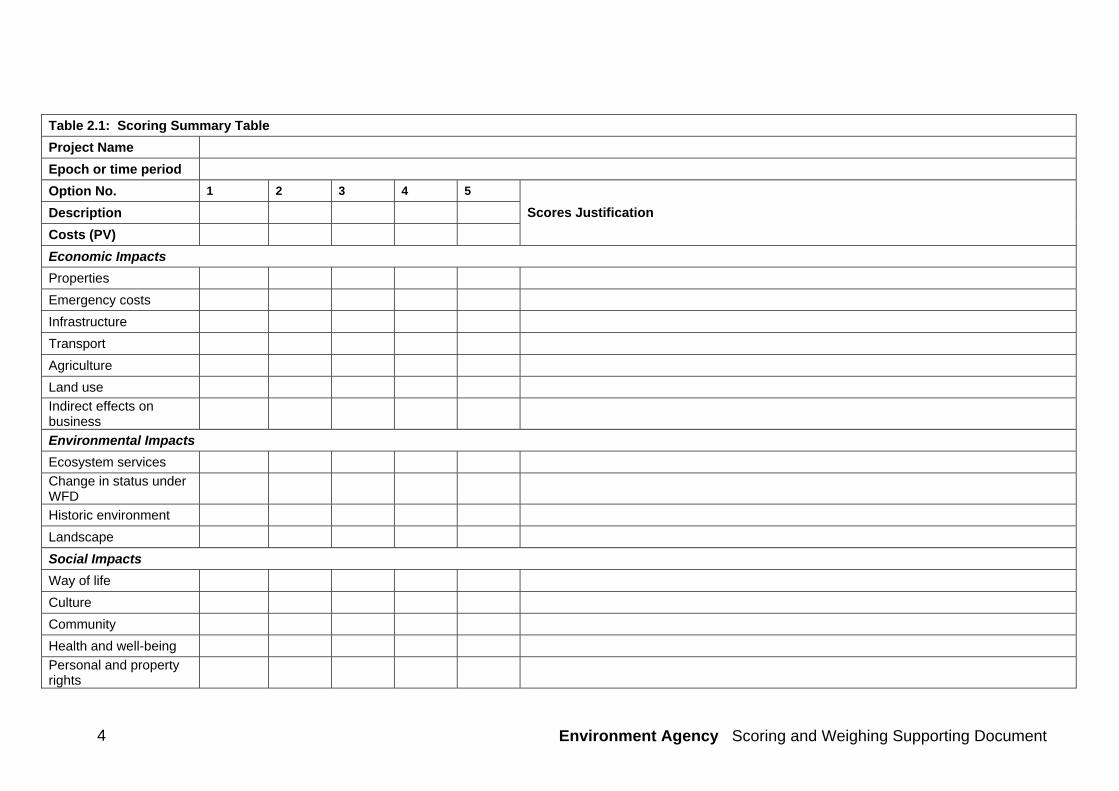
Table 2.1: Scoring Summary Table
Project Name
Epoch or time period
Option No. 1 2 3 4 5
Description
Costs (PV)
Scores Justification
Economic Impacts
Properties
Emergency costs
Infrastructure
Transport
Agriculture
Land use
Indirect effects on business
Environmental Impacts
Ecosystem services
Change in status under WFD
Historic environment
Landscape
Social Impacts
Way of life
Culture
Community
Health and well-being
Personal and property rights
Environment Agency Scoring and Weighing Supporting Document 4
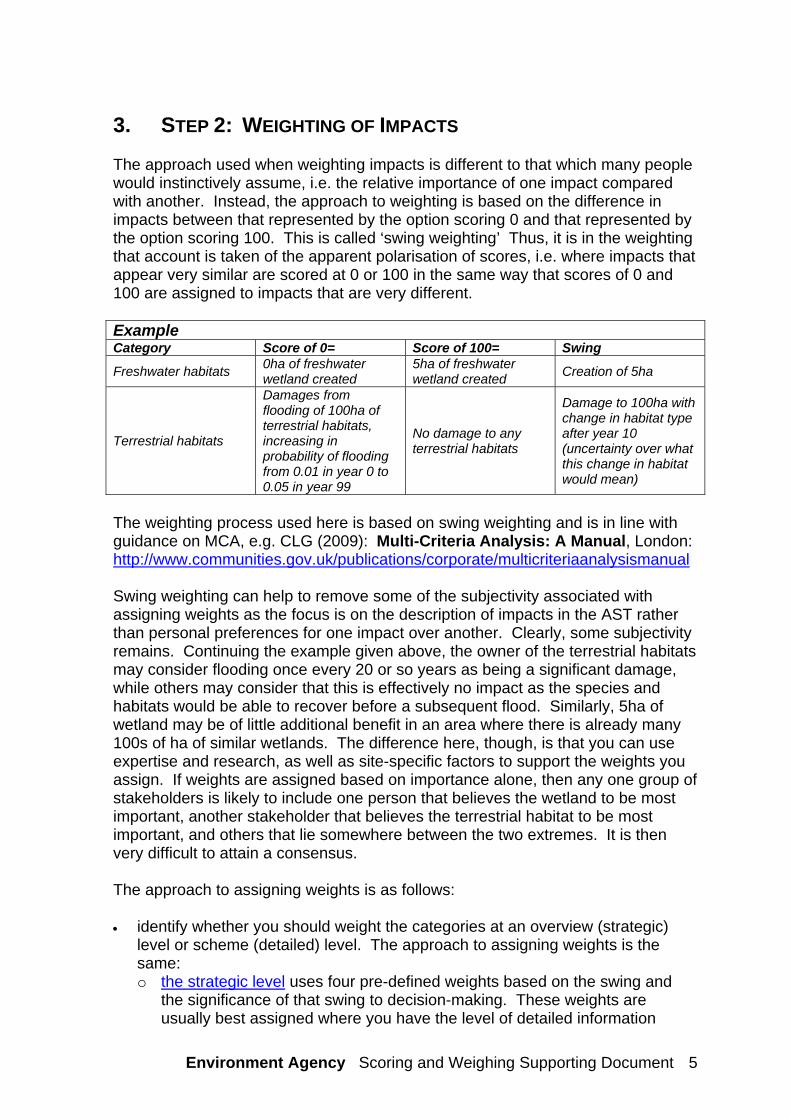
3. STEP 2: WEIGHTING OF IMPACTS The approach used when weighting impacts is different to that which many people would instinctively assume, i.e. the relative importance of one impact compared with another. Instead, the approach to weighting is based on the difference in impacts between that represented by the option scoring 0 and that represented by the option scoring 100. This is called ‘swing weighting’ Thus, it is in the weighting that account is taken of the apparent polarisation of scores, i.e. where impacts that appear very similar are scored at 0 or 100 in the same way that scores of 0 and 100 are assigned to impacts that are very different. Example Category Score of 0= Score of 100= Swing
Freshwater habitats 0ha of freshwater wetland created
5ha of freshwater wetland created
Creation of 5ha
Terrestrial habitats
Damages from flooding of 100ha of terrestrial habitats, increasing in probability of flooding from 0.01 in year 0 to 0.05 in year 99
No damage to any terrestrial habitats
Damage to 100ha with change in habitat type after year 10 (uncertainty over what this change in habitat would mean)
The weighting process used here is based on swing weighting and is in line with guidance on MCA, e.g. CLG (2009): Multi-Criteria Analysis: A Manual, London: http://www.communities.gov.uk/publications/corporate/multicriteriaanalysismanual
Swing weighting can help to remove some of the subjectivity associated with assigning weights as the focus is on the description of impacts in the AST rather than personal preferences for one impact over another. Clearly, some subjectivity remains. Continuing the example given above, the owner of the terrestrial habitats may consider flooding once every 20 or so years as being a significant damage, while others may consider that this is effectively no impact as the species and habitats would be able to recover before a subsequent flood. Similarly, 5ha of wetland may be of little additional benefit in an area where there is already many 100s of ha of similar wetlands. The difference here, though, is that you can use expertise and research, as well as site-specific factors to support the weights you assign. If weights are assigned based on importance alone, then any one group of stakeholders is likely to include one person that believes the wetland to be most important, another stakeholder that believes the terrestrial habitat to be most important, and others that lie somewhere between the two extremes. It is then very difficult to attain a consensus. The approach to assigning weights is as follows:
identify whether you should weight the categories at an overview (strategic)
level or scheme (detailed) level. The approach to assigning weights is the same: o the strategic level uses four pre-defined weights based on the swing and
the significance of that swing to decision-making. These weights are usually best assigned where you have the level of detailed information
Environment Agency Scoring and Weighing Supporting Document 5

Environment Agency Scoring and Weighing Supporting Document 6
typically available at the strategic level. They can also be useful as a first attempt at assigning detailed weights, where you would then focus on those categories with the highest weights as these are more likely to affect the choice of preferred option;
o the detailed level allows you to assign any weight from 0 to 100 based on the description of the impacts and the swing between the best and worst option. It is usual to apply weights that vary in 5s or 10s (i.e. 5, 10 , 15, 20, etc.) rather than 1s (i.e. 5, 6, 7, 8) to reflect some of the uncertainties;
You should complete the weighting summary table when assigning weights (Table 3.1). This includes space for recording why you have assigned ranks and weights, maintaining transparency and making future changes easier to incorporate. The reasoning is also likely to be important when assessing what is driving the choice of preferred option in the sensitivity analysis and when discussing the preferred option with stakeholders. You will need to weight both the monetised and non-monetised impacts in the weighting process. This can help make the weighting process easier as (i) more weights can be calculated automatically and (ii) there are more reference points against which the non-monetised impacts can be compared. It also allows you to update/amend the weights at a later date should money values become available (for example, using the Environmental Valuation Handbook4) without having to start all over again. The inclusion of additional monetised values later on will provide a useful check of the weights you have assigned. You will need to assign weights for all the epochs or time periods you have considered. Strategic level weights A simplified approach to weighting is proposed for high level assessments (e.g. strategies) where the amount of information available is generally a summary of the impacts without detailed specific data. For example, the number of electricity sub-stations at risk is likely to be known, but the impacts of loss of any one (or all) of the sub-stations is more difficult to assess without detailed information on the area supplied by each sub-station, the amount of spare capacity, and the potential to re-route electricity supplies through other, unaffected electricity sub-stations(redundancy). At the strategy level, it is proposed that a simpler weighting system is used based on the following definitions:
impact likely to be extreme or critical: weight assigned is 100; impact likely to be important: weight assigned is 60; impact likely to be moderate: weight assigned is 20; and impact is considered non-significant: weight assigned is 5. The above weighting approach has been used as part of the appraisal for the Thames Estuary 2100 strategy (including impacts on the city of London).
4 eftec (2007): Flood and Coastal Erosion Risk Management: Economic Valuation of
Environmental Effects, prepared for the Environment Agency.

Table 3.1: Weighting Summary Table
Project Name
Epoch or time period
Difference between 0 and 100 if was valued in money terms
Impact type Score of 0 = Score of 100 = Swing
£10s
-£1
00s
£1,0
00s-
£10,
000s
£100
,000
s
£m
illio
ns Rank Weight
Monetised Value
Implied Value
Economic Impacts
Properties
Key infrastructure
Land use
Transport
Indirect impacts on business
Environmental Impacts
Ecosystem service s
Change in status under WFD
Historic environment
Landscape
Social Impacts
Way of life
Culture
Commun ity
Health and well-being
Personal and property rights
Environment Agency Scoring and Weighing Supporting Document 7
The use of pre-defined weights means that approximate weights can be assigned based on the level of information collected for the appraisal. It avoids the need to spend a lot of time and resources on collecting information that may later be found to be immaterial in terms of the decision being made (e.g. those impacts that are found to be non-significant). More information can be collected on the extreme/critical and important impacts at a later date if the differences between options are small or being driven by uncertainties. Use of the four pre-defined weights means that the information you are collecting can be tailored to the most significant impacts such that the appraisal becomes much more proportionate in terms of resources required. Detailed level weights You may choose to apply the detailed weights where you need to refine the weights assigned to the extreme, critical and important impacts identified using the simpler approach (above) or where you have a small number of categories with detailed information available on each. The approach to use here is to:
identify which of the impact types has the biggest swing from 0 to 100:
o use all the information recorded in the ASTs and what you know about the project area to help you identify where the difference in impacts would be greatest if the worst option were implemented compared with the best option;
o use the difference in impacts on the monetised impacts to help you by
comparing the swing in impacts in money values against the swings described qualitatively and/or quantitatively. It is always useful to compare impact types against those where the difference has been measured in money terms (e.g. property damages). Consider whether the impacts are likely to be the same as, greater than, or less than the property damages. The money values are used as they help ensure that you are consistent when considering what is a small or moderate difference, but also because that will help you later on when assigning weights. Some projects may have property damages of £10millions or even £100millions, so you may want to change the column headings if that is more useful to you. You can then tick which difference is appropriate for each impact type.
o use the extra columns in the weighting summary table (Table 3.1) to help
you:
consider what the difference between the best and worst options might be if it were measured in money terms. Some people find this reasonably easy to do, others find it more difficult. The categories given in Table 3.1 reflect negligible difference (£10s-£100s), small differences (£1000s-£10,000s), moderate differences (£100,000s) and large differences (£millions).
Environment Agency Scoring and Weighing Supporting Document 8

Example Difference between 0 and 100 if was valued in money terms
Category
£10s
-£1
00s
£1,0
00s-
£10,
000s
£100
,000
s
£m
illio
ns Assumptions
Freshwater habitats (1) Y 5ha created but there are already many 100s has
Terrestrial habitats (1) Y
Flooding is infrequent and stakeholders do not expect significant impacts as the habitats can recover between floods
Freshwater habitats (2) Y 5ha created in area with no/few wetlands adding to the local biodiversity
Terrestrial habitats (2) Y
Flooding would result in a change in habitat quality to intertidal mudflats with significant biodiversity (and BAP) benefits
The weighting summary table also includes ‘rank’. Where you have ticked the difference in money values, you can use this to help rank the impacts from which has the biggest difference (rank = 1) through to which has the smallest difference. You can also do this without having ticked the difference in money terms, if you found that the money boxes were not helpful.
Example
Category Rank Assumptions
Freshwater habitats (1) 1= 5ha created but there are already many 100s has
Terrestrial habitats (1) 1= Flooding is infrequent and stakeholders do not expect significant impacts as the habitats can recover between floods
Freshwater habitats (2) 2 5ha created in area with no/few wetlands adding to the local biodiversity
Terrestrial habitats (2) 1
Flooding would result in a change in habitat quality with conversion of terrestrial habitats to intertidal mudflats. These would offer significantly greater overall habitat value and provide BAP habitats
You will have engaged with stakeholders when identifying and describing the impacts under each option, so you should have a clear understanding of the likelihood of significant damages (or not). You may also want to involve stakeholders in the scoring and weighting process. Engagement of stakeholders may help you discover information that shows that the terrestrial habitat is the only place that a particular species of snail is found; if the habitat is flooded there may be a risk that the snail would become extinct. That may affect how you rank (and subsequently weight) the terrestrial habitat. If you know the reasoning behind your ranking before the new information became available, you can easily change the
Environment Agency Scoring and Weighing Supporting Document 9

ranking. The potential differences in swing and rank and, subsequently, weight emphasises how important it is to record your reasoning.
once you have identified the swing and ranked the categories, you need to
begin to assign weights:
o the impact type ranked 1 (with the biggest swing) is assigned a weight of 100;
o all other impact types are assigned a weight relative to this depending on
the relative swing. it is important to note that you should only assign a weight of 0 to an impact if there is no difference between the options;
o weights of the monetised impacts can be easily calculated where there is
more than one impact type that has been measured in money terms. For example, if the swing on one impact type is £100 million and on a second is £10 million, the weight of the first is 100 and the weight of the second is 10.
.
o the weights for the non-monetised impact types can be determined by comparing their swing with that of the monetised impacts. To minimise the number of comparisons between impacts that have to be made during weighting, it is recommended that you weight the impacts against at least one monetised impact type5 and the impact type ranked one higher than the impact you are considering
Example
Category Rank Weight Assumptions
Property damages 1 100 Swing = £500,000
Freshwater habitats (1) 2= 10
5ha created but there are already many 100s has. Swing considered to be 10% that of property damages, based on description and discussion with stakeholders
Terrestrial habitats (1) 2= 10
Flooding is infrequent and stakeholders do not expect significant impacts as the habitats can recover between floods. Swing considered to be 10% that of property damages, based on description and discussion with stakeholders
Property damages 2 50 Swing = £500,000
Freshwater habitats (2) 3 40 5ha created in area with no/few wetlands adding to the local biodiversity. Considered slightly smaller swing that property damages
Terrestrial habitats (2) 1 100
Flooding would result in a change in habitat quality to intertidal mudflats with significant biodiversity (and BAP) benefits. Swing considered to be twice that of the swing on property damages
5 In most cases, property damages are ranked 1 and it is measured in money terms. In
some rural projects, other (non-monetised) impacts may be ranked one where the difference in impacts between the worst and best options is considered to be greater than the difference in property damages.
Environment Agency Scoring and Weighing Supporting Document 10
4. STEP 3: CALCULATING IMPLIED MONEY VALUES FOR THE
INTANGIBLE IMPACTS The final step in the methodology is to calculate implied values for the intangible impacts. This can be done because: (i) the scores and weights of all impacts have been assigned relative to each
other; and (ii) the scores and weights of the monetised impacts have been included as
reference points against which the swing of the non-monetised impacts is compared.
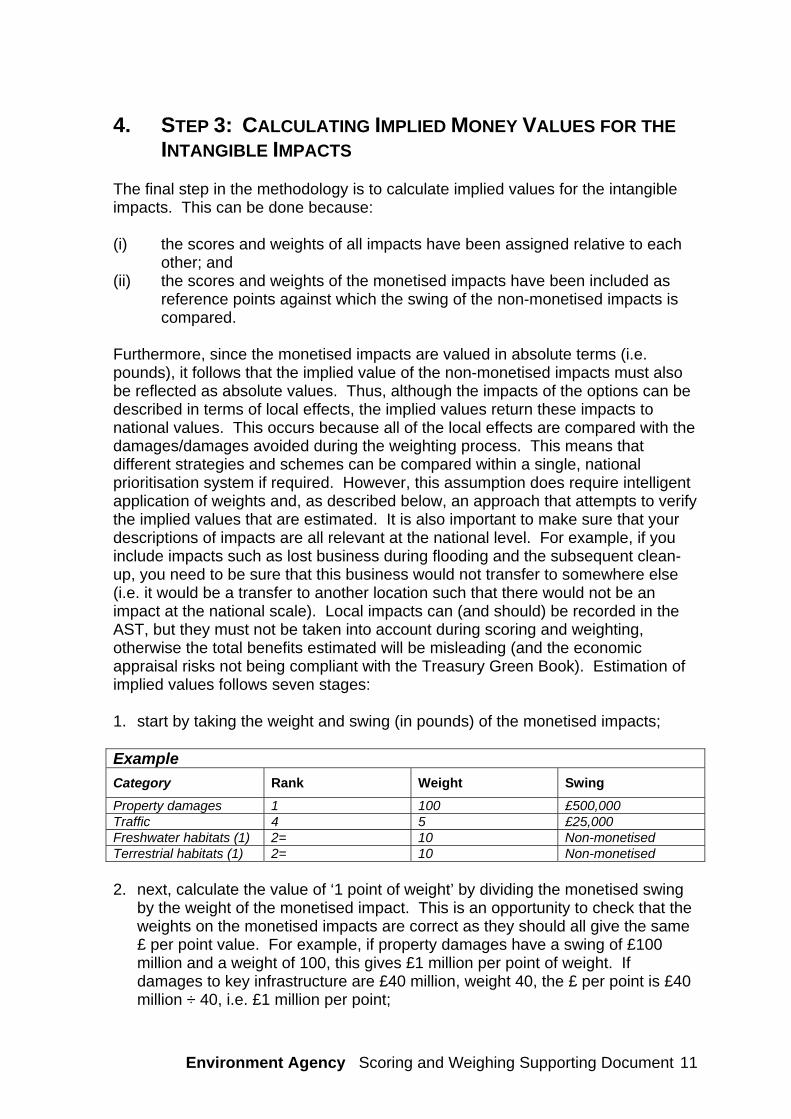
Furthermore, since the monetised impacts are valued in absolute terms (i.e. pounds), it follows that the implied value of the non-monetised impacts must also be reflected as absolute values. Thus, although the impacts of the options can be described in terms of local effects, the implied values return these impacts to national values. This occurs because all of the local effects are compared with the damages/damages avoided during the weighting process. This means that different strategies and schemes can be compared within a single, national prioritisation system if required. However, this assumption does require intelligent application of weights and, as described below, an approach that attempts to verify the implied values that are estimated. It is also important to make sure that your descriptions of impacts are all relevant at the national level. For example, if you include impacts such as lost business during flooding and the subsequent clean-up, you need to be sure that this business would not transfer to somewhere else (i.e. it would be a transfer to another location such that there would not be an impact at the national scale). Local impacts can (and should) be recorded in the AST, but they must not be taken into account during scoring and weighting, otherwise the total benefits estimated will be misleading (and the economic appraisal risks not being compliant with the Treasury Green Book). Estimation of implied values follows seven stages: 1. start by taking the weight and swing (in pounds) of the monetised impacts; Example
Category Rank Weight Swing
Property damages 1 100 £500,000 Traffic 4 5 £25,000 Freshwater habitats (1) 2= 10 Non-monetised Terrestrial habitats (1) 2= 10 Non-monetised 2. next, calculate the value of ‘1 point of weight’ by dividing the monetised swing
by the weight of the monetised impact. This is an opportunity to check that the weights on the monetised impacts are correct as they should all give the same £ per point value. For example, if property damages have a swing of £100 million and a weight of 100, this gives £1 million per point of weight. If damages to key infrastructure are £40 million, weight 40, the £ per point is £40 million ÷ 40, i.e. £1 million per point;
Environment Agency Scoring and Weighing Supporting Document 11
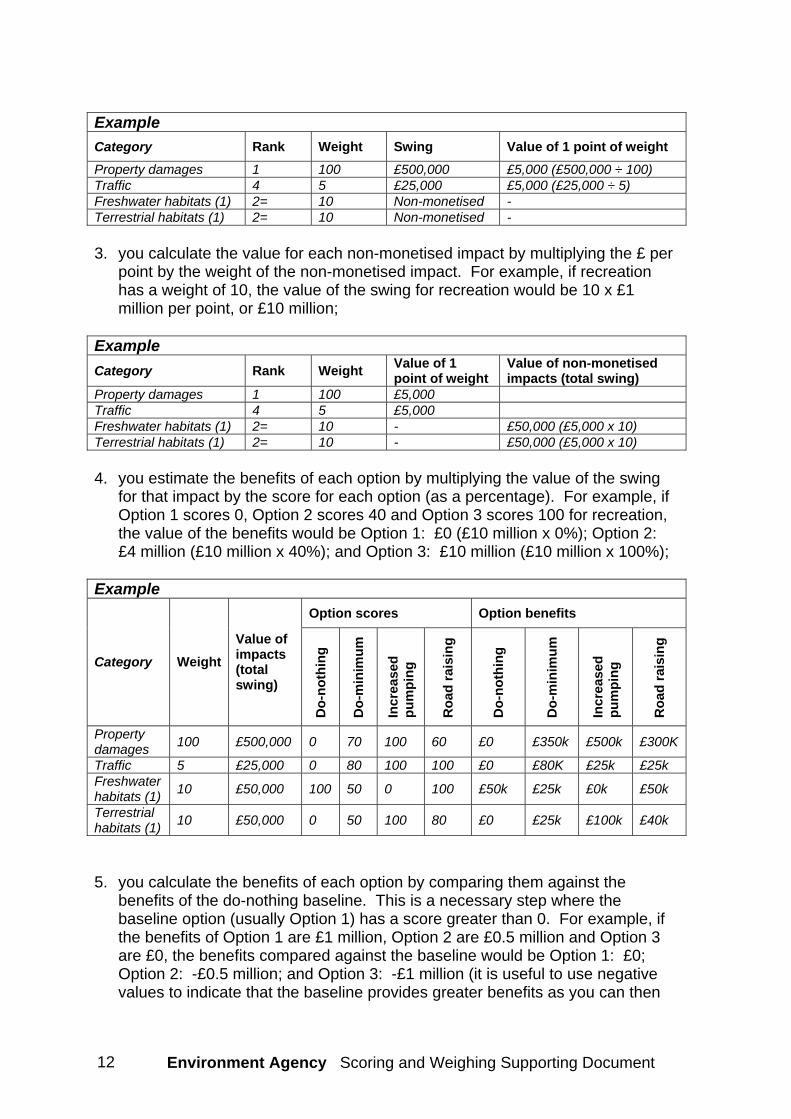
Example
Category Rank Weight Swing Value of 1 point of weight
Property damages 1 100 £500,000 £5,000 (£500,000 ÷ 100) Traffic 4 5 £25,000 £5,000 (£25,000 ÷ 5) Freshwater habitats (1) 2= 10 Non-monetised - Terrestrial habitats (1) 2= 10 Non-monetised - 3. you calculate the value for each non-monetised impact by multiplying the £ per
point by the weight of the non-monetised impact. For example, if recreation has a weight of 10, the value of the swing for recreation would be 10 x £1 million per point, or £10 million;
Example
Category Rank Weight Value of 1 point of weight
Value of non-monetised impacts (total swing)
Property damages 1 100 £5,000 Traffic 4 5 £5,000 Freshwater habitats (1) 2= 10 - £50,000 (£5,000 x 10) Terrestrial habitats (1) 2= 10 - £50,000 (£5,000 x 10) 4. you estimate the benefits of each option by multiplying the value of the swing
for that impact by the score for each option (as a percentage). For example, if Option 1 scores 0, Option 2 scores 40 and Option 3 scores 100 for recreation, the value of the benefits would be Option 1: £0 (£10 million x 0%); Option 2: £4 million (£10 million x 40%); and Option 3: £10 million (£10 million x 100%);
Example
Option scores Option benefits
Category Weight
Value of impacts (total swing)
Do
-no
thin
g
Do
-min
imu
m
Incr
ease
d
pu
mp
ing
Ro
ad r
aisi
ng
Do
-no
thin
g
Do
-min
imu
m
Incr
ease
d
pu
mp
ing
Ro
ad r
aisi
ng
Property damages
100 £500,000 0 70 100 60 £0 £350k £500k £300K
Traffic 5 £25,000 0 80 100 100 £0 £80K £25k £25k Freshwater habitats (1)
10 £50,000 100 50 0 100 £50k £25k £0k £50k
Terrestrial habitats (1)
10 £50,000 0 50 100 80 £0 £25k £100k £40k
5. you calculate the benefits of each option by comparing them against the
benefits of the do-nothing baseline. This is a necessary step where the baseline option (usually Option 1) has a score greater than 0. For example, if the benefits of Option 1 are £1 million, Option 2 are £0.5 million and Option 3 are £0, the benefits compared against the baseline would be Option 1: £0; Option 2: -£0.5 million; and Option 3: -£1 million (it is useful to use negative values to indicate that the baseline provides greater benefits as you can then
Environment Agency Scoring and Weighing Supporting Document 12
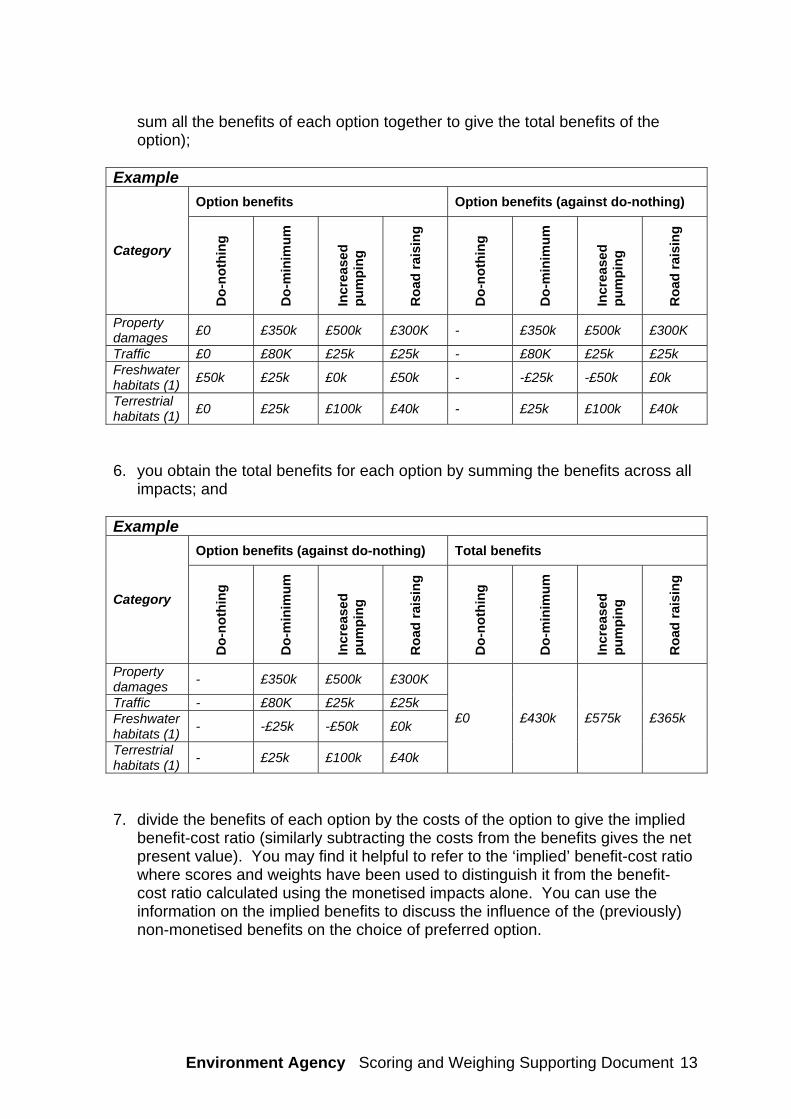
sum all the benefits of each option together to give the total benefits of the option);
Example
Option benefits Option benefits (against do-nothing)
Category
Do
-no
thin
g
Do
-min
imu
m
Incr
ease
d
pu
mp
ing
Ro
ad r
aisi
ng
Do
-no
thin
g
Do
-min
imu
m
Incr
ease
d
pu
mp
ing
Ro
ad r
aisi
ng
Property damages
£0 £350k £500k £300K - £350k £500k £300K
Traffic £0 £80K £25k £25k - £80K £25k £25k Freshwater habitats (1)
£50k £25k £0k £50k - -£25k -£50k £0k
Terrestrial habitats (1)
£0 £25k £100k £40k - £25k £100k £40k
6. you obtain the total benefits for each option by summing the benefits across all
impacts; and Example
Option benefits (against do-nothing) Total benefits
Category
Do
-no
thin
g
Do
-min
imu
m
Incr
ease
d
pu
mp
ing
Ro
ad r
aisi
ng
Do
-no
thin
g
Do
-min
imu
m
Incr
ease
d
pu
mp
ing
Ro
ad r
aisi
ng
Property damages
- £350k £500k £300K
Traffic - £80K £25k £25k Freshwater habitats (1)
- -£25k -£50k £0k
Terrestrial habitats (1)
- £25k £100k £40k
£0 £430k £575k £365k
7. divide the benefits of each option by the costs of the option to give the implied
benefit-cost ratio (similarly subtracting the costs from the benefits gives the net present value). You may find it helpful to refer to the ‘implied’ benefit-cost ratio where scores and weights have been used to distinguish it from the benefit-cost ratio calculated using the monetised impacts alone. You can use the information on the implied benefits to discuss the influence of the (previously) non-monetised benefits on the choice of preferred option.
Environment Agency Scoring and Weighing Supporting Document 13
Environment Agency Scoring and Weighing Supporting Document 14
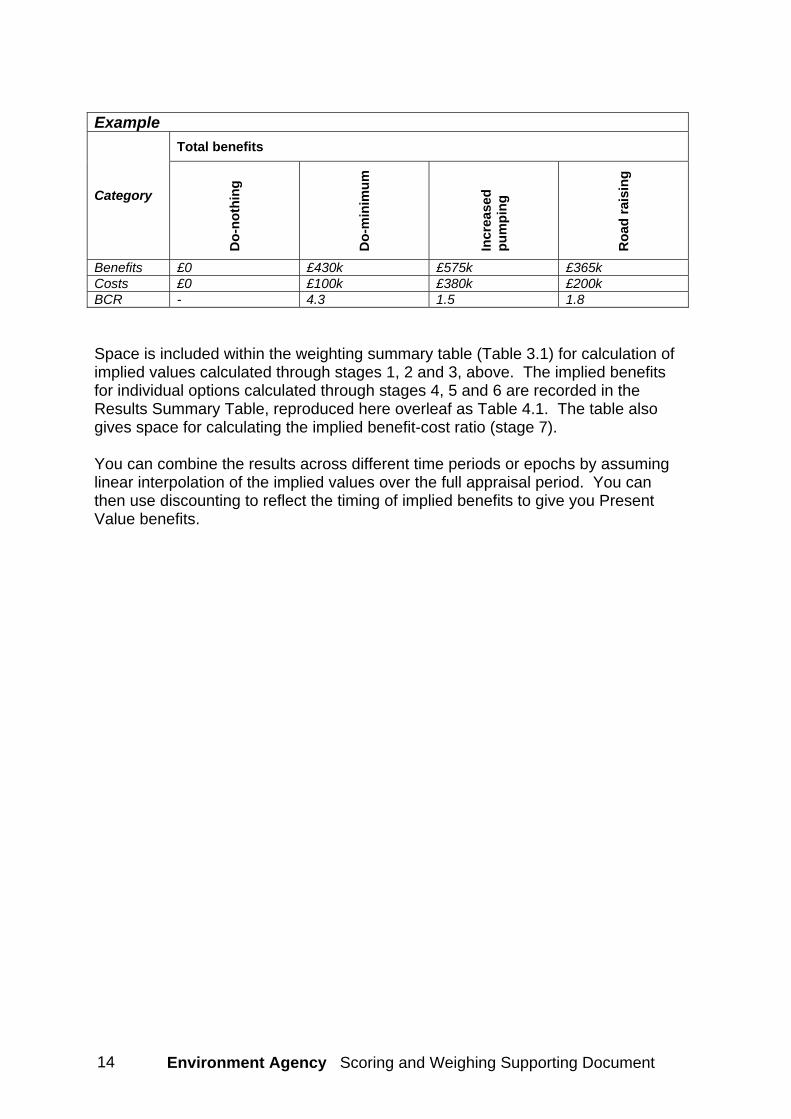
Example
Total benefits
Category
Do
-no
thin
g
Do
-min
imu
m
Incr
ease
d
pu
mp
ing
Ro
ad r
aisi
ng
Benefits £0 £430k £575k £365k Costs £0 £100k £380k £200k BCR - 4.3 1.5 1.8 Space is included within the weighting summary table (Table 3.1) for calculation of implied values calculated through stages 1, 2 and 3, above. The implied benefits for individual options calculated through stages 4, 5 and 6 are recorded in the Results Summary Table, reproduced here overleaf as Table 4.1. The table also gives space for calculating the implied benefit-cost ratio (stage 7). You can combine the results across different time periods or epochs by assuming linear interpolation of the implied values over the full appraisal period. You can then use discounting to reflect the timing of implied benefits to give you Present Value benefits.

Table 4.1: Results Summary Table
Project Name
Epoch or time period
Scores as Assigned (from Scoring AST) Implied Value for Option Implied Values Against Option 1 as Baseline
Option No. 1 2 3 4 5 6 1 2 3 4 5 6 1 2 3 4 5 6
Costs (PV)
Economic Impacts
Propert ies
Key infrastructure
Land use
Transp ort
Indirect impacts on business
Environmental Impacts
Habitats and species
Water (quality and quantity)
Natural process es
Landscape and townscape
Historical environment
Social Impacts
Recreation
Risk to life and health
Commun ity
Environment Agency Scoring and Weighing Supporting Document
15
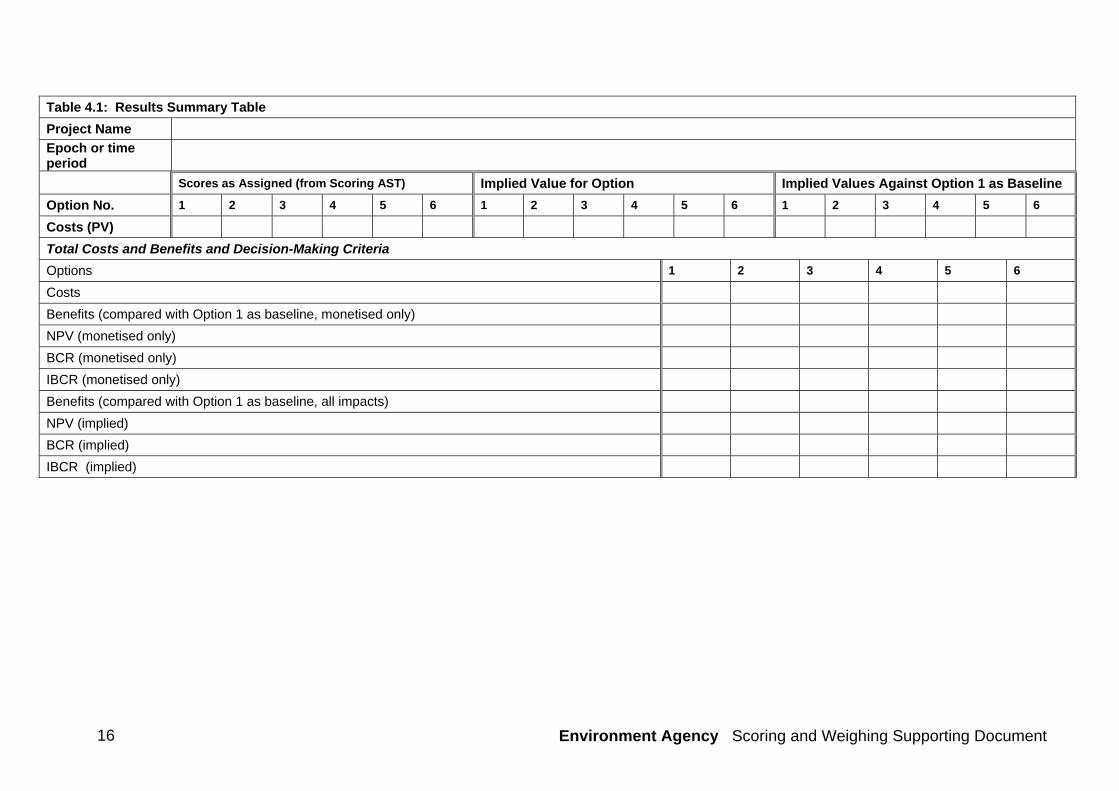
Environment Agency Scoring and Weighing Supporting Document 16
Table 4.1: Results Summary Table
Project Name
Epoch or time period
Scores as Assigned (from Scoring AST) Implied Value for Option Implied Values Against Option 1 as Baseline
Option No. 1 2 3 4 5 6 1 2 3 4 5 6 1 2 3 4 5 6
Costs (PV)
Total Costs and Benefits and Decision-Making Criteria
Options 1 2 3 4 5 6
Costs
Benefits (compared with Option 1 as baseline, monetised only)
NPV (monetised only)
BCR (monetised only)
IBCR (monetised only)
Benefits (compared with Option 1 as baseline, all impacts)
NPV (implied)
BCR (implied)
IBCR (implied)
5. STEP 4: VERIFYING THE IMPLIED VALUES It is important that the implied values calculated using the approach set out above are verified. This involves consideration of the implied values to determine that they are reasonable. The decision as to what is reasonable (or not) is aided through the use of indicative values that are estimated and compared against the implied values. This approach is used to determine whether the weights need to be modified, taking into account the reasoning behind the weight as well as the comparison with any indicative values. It is essential that the weights are verified in this way since the implied values are used to inform the implied benefit-cost ratio and, hence, have a direct influence on choice of preferred option.
Table 5.1 summarises the key indicative values that have been used to help verify the implied values. The sources for the indicative values are included in the table and have been drawn from academic literature as well as real costs experienced during flood events. It is not intended that the indicative values are used to place an economic value on the impacts. Many of the values in Table 5.1 are derived from very different contexts (e.g. studies in the USA), hence, the use of the values as a direct input to the economic appraisal may not be considered robust. In many cases, the values also relate to impacts for which data are likely to be very difficult to estimate (e.g. disruption on a railway line is given in terms of £ per minute delay). Instead, it is intended that they are used to provide a guide as to whether the implied values estimated are likely to be a significant over- (or under-) estimate of the ‘real’ damages. The use of some of the comparator values requires some additional calculations to be made: key infrastructure:
o the use of average speeds is based on the methodology for travel disruption. Here it assumes that road closures or diversions due to flooding could reduce the speed at which emergency vehicles are able to travel. This can result in a longer journey time to hospital. If average speed is reduced to 10 mph and the distance to the hospital is one mile, the damages would be £15,000. To use the comparator value you can divide the implied value by the damages caused by the expected reduction in speed along a diversion route. This will give number of emergency patients affected. You can then see if this seems reasonable given the population in the project area and typical number of emergency cases per day; and
o cost of electricity outage: here the comparator value is given as £ damages per hour without electricity. You can divide the implied value by the comparator values to identify how much time properties would be without electricity. This will allow you to identify if the weight is appropriate.
transport: like electricity outage, you can use the comparator value to estimate
the length disruption is represented by the implied value (for example, divide the implied value by £115,000 per day for rail disruption).
Environment Agency Scoring and Weighing Supporting Document 17
natural processes: you can divide the implied value by the comparator value to see if this exceeds the actual length of defences;
historical environment: you can divide the implied value by the willingness to
pay values to see how many people would have to visit the site (and pay). This may need to be estimated as visits per year where you have annualised implied values or total visits over a number of years where you have implied values that aggregate benefits over longer time periods.
recreation: as with historical environment, you can divide the implied value by
the willingness to pay value to estimate how many people would have to use the site.
risk to life and health: you can divide the implied value by the comparator
values to see how many people would have to be affected to justify the weight given.
Judgements need to be made as to whether the results given by using the comparator values suggest that the implied values are reasonable or not. In some cases, you may wish to adjust the weights. Where there is a reasonable, justifiable explanation why the implied values vary from the comparator values, this is used to make a case for retaining the implied value. Using the comparator values to verify the implied values you have calculated will help justify the scores and weights you have assigned and will help you explain to others (including stakeholders) why the choice of preferred option is robust. Example
Category
Value of non-monetised impacts (total swing)
Comparator value
Comments
Freshwater habitats (1) £50,000
Coastal grazing marsh: £800 to £1,200 per ha Management costs for reestablishment of reedbeds: £310 per ha/yr (England)
Implied value over 5 ha is £10,000 per ha. Comparator value is for re-creation but exclude any ongoing management costs. If these are equal to the management costs of reedbeds (£310/ha/year for England), the total costs over 100 years would be £9,000 per ha, plus cost of re-creation suggests implied value is appropriate
Terrestrial habitats (1) £50,000
Management costs for reedbeds of £35/ha/yr
100 ha affected but impact would be small (£50,000 ÷ 100 = £500 per ha, or £17 per ha per year over 100 years). This could still be too high if damage is negligible, although is half the management costs so may be appropriate
Environment Agency Scoring and Weighing Supporting Document 18
Environment Agency Scoring and Weighing Supporting Document
19
6. IDENTIFYING THE PREFERRED OPTION The calculation of implied values for each option means that the net present
value, benefit-cost ratios and incremental benefit-cost ratios can be calculated (as used in Chapter 8 of the main guidance to help you identify the preferred option). It is recommended that any values estimates based on the implied values include the word ‘implied’ within the description, e.g. implied benefit-cost ratio; an alternative suggestion is that the BCR including all the impacts be called the ‘comprehensive’ benefit-cost ratio. This should help avoid any confusion over whether the implied value of the intangible impacts has been included or not.
Sensitivity analysis can also be used to identify which impacts are driving
the decision and, thus, where it may be beneficial to place greater focus when assessing the realism of the implied values. You can also test how much the weights would have to change to make a different option preferred.

Table 5.1: Comparator Values for Comparison with Implied Values
Impact Type Comparator Value Source/Basis
Economic Impacts
Properties Likely to be valued
Average Speed Cost to Health (per mile)
10 mph £15,000
20 mph £7,500
30 mph £5,000
40 mph £3,750
50 mph £3,000
60 mph £2,500
Based on value of a life of £1 million and an increased risk of death from a heart attack for each 5 minutes extra travelling time to a hospital. Average of 64 emergency cases per day per NHS Trust (2009/10).
Cancelled operations: £64,000 per day per operating theatre (US hospital emergency closed for 2 months after flooding, operations expected to be longer, assumed 3 months: £5.8 million per operating theatre)
Based on costs of undertaking operation privately (£8,000 per operation) and average of 8 operations per day (from House of Commons Committee of Public Accounts (2003): The PFI Contract for the Redevelopment of West Middlesex Hospital).
£275 per pupil per day missed of school (2 month closure £11,000 per pupil assuming 20 days per month)
Based on lost benefits from unauthorised absences (National Audit Office (2005): Improving School Attendance in England).
Cost of electricity outage: $3 per hour residential (£2.25) $1,200 per hour for small-medium commercial/industrial (£900) $82,000 per hour for large commercial/ industrial (£61,500)
Lawton L et al (2003): A Framework and Review of Customer Outage Costs: Integration and Analysis of Electricity Utility Outage Cost Surveys, Berkeley National Laboratory, November 2003. Figures for a one hour summer afternoon outage.
Key infrastructure
£13.6 million – costs of flooding of WTW to Severn Trent (lost water to 130,000 households for 2 weeks, estimated £1 million per day)
Note on Severn Trent profits (2008), newspaper reports on Mythe WTW Tewksbury.
Good drainage Bad drainage Very bad drainage
£600 to £1,400 per ha
£300 to £400 per ha
£200 per ha
Based on typical financial gross margins from grassland from Multi-Coloured Manual.
Good drainage Bad drainage Very bad drainage
£550 per ha £440 per ha £270 per ha
Based on typical financial gross margins from arable (wheat) from Multi-Coloured Manual.
Land use
Increase in value due to development potential: £1.9 million (residential) and £240,000 (commercial/industrial)
Based on land values used to estimate costs of adaptation options in North Norfolk.
Environment Agency Scoring and Weighing Supporting Document 20

Table 5.1: Comparator Values for Comparison with Implied Values
Impact Type Comparator Value Source/Basis
Indirect damages based on direct damages: Transport infrastructure: 30% to 50% of direct losses
Based on paper for Yangtze River, but which includes estimates of indirect damages from worldwide studies (including UK, US and Australia).
Railway disruption costs: £80 per minute, i.e. £115,000 per day (assumed per km)
From Multi-Coloured Manual.
Road disruption: £77,000 per day (assumed per km) Based on 10,000 vehicles affected with 10km diversion reducing speeds from 35 kph (urban) to 10 kph (urban at capacity); following approach in Multi-Coloured Handbook.
Transport
Closure of Central Line: £40 million over 11 weeks: £3.6 million per week or £520,000 per day
Estimates provided on costs for London Underground (includes £20 million passenger refunds).
Indirect impacts on businesses
Indirect damages based on direct damages: - farming: 28% of direct losses - industrial and commercial: 30% of direct losses
Based on paper for Yangtze River, but which includes estimates of indirect damages from worldwide studies (including UK, US and Australia).
Environmental Impacts
Habitat Type Cost
Coastal grazing marsh £800 to £1,200 per ha
Coastal lagoons £4,200 to £57,000 per ha
Reed beds £2,800 to £7,300 per ha
From Multi-Coloured Manual.
Reedbed management £60/ha/yr annual cost (England) £35/ha/yr annual cost (Wales)
Reedbed restoration £820 capital costs/ha plus £60/ha/yr annual cost (England) £35/ha/yr annual cost (Wales)
Reedbed reestablishment £1,400 capital costs/ha plus £380/ha/yr annual cost (England) £310/ha/yr annual cost Wales
Saline lagoon management £140/ha/yr annual cost (England) £34/ha/yr annual cost (Wales)
Saline lagoon restoration £1,100 capital costs/ha plus £140/ha/yr annual cost (England) £34/ha/yr annual cost (Wales)
Habitats and species
Saline lagoon creation £26,000 capital costs/ha plus £140/ha/yr annual cost (England)
From Entec (2008): Update of benchmark cost database with pCEA results, Collaborative Research Programme on River Basin Management Planning Economics, Project 2c update, May 2008. (based on costs for the UK Biodiversity Action Plan)
Environment Agency Scoring and Weighing Supporting Document
21
Table 5.1: Comparator Values for Comparison with Implied Values
Impact Type Comparator Value Source/Basis
£34/ha/yr annual cost Wales
Chalk river habitat restoration £15,000 per km (physical work over 25 years)
Saltmarsh £1,100 to £90,000 per ha From Spurgeon J (1998): The Socio-Economic Costs and Benefits of Coastal Habitat Rehabilitation and Creation, Marine Pollution Bulletin, Vol 37, No8-12, pp373-382.
Wetland £1,000 per ha per year for singe function wetland
Based on Woodward & Wui (2001): (2001): The economic value of wetland services: a meta-analysis, Ecological Economics, 37, pp257-270.
Water (quality and quantity)
Willingness to pay of households (hh) to improve river water quality from very bad (RE1) to okay (RE3): £12.30 per hh per year (uprated to £15.00 per hh, 2008 prices)
Georgiou et al (2000) - value used in Benefits Assessment Guidance (reflects willingness to pay for biodiversity improvements, assumed okay here as check on water quality implications for biodiversity).
Embankment with saltmarsh £4,600,000 per km (0m to 80m) £3,500,000 per km (0m to 6m)
Embankment £2,000,000 per km
Seawalls £6,000,000 per km
Groynes £2,500,000 per km
Natural processes
Revetments £9,000,000 per km
Estimated saving in terms of defence costs in different exposure situations (saltmarsh fronting defences and change from high to medium wave conditions) based on work by Dixon in the 1990s.
Valuing renovation of historical buildings in Grainger Town, Newcastle: £10.10 to £13.80 per hh per year
Garrod et al (1996) in eftec (2005): Valuation of the Historic Environment, report for English Heritage.
Historical Environment Valuing restoration of historic centre of Split, Croatia: $44 (domestic and foreign tourists per visit, $168 residents, tax)
Pagiola (2001) in eftec (2005): Valuation of the Historic Environment, report for English Heritage.
Social Impacts
Change Value (Loss)
Deterioration in beach, promenade
£2.34 to £3.74 per visit
Cliff erosion, very reduced access
£1.89 to £4.84 per visit
Breach, reduced access £2.82 to £3.72 per visit
Change Value (Gain)
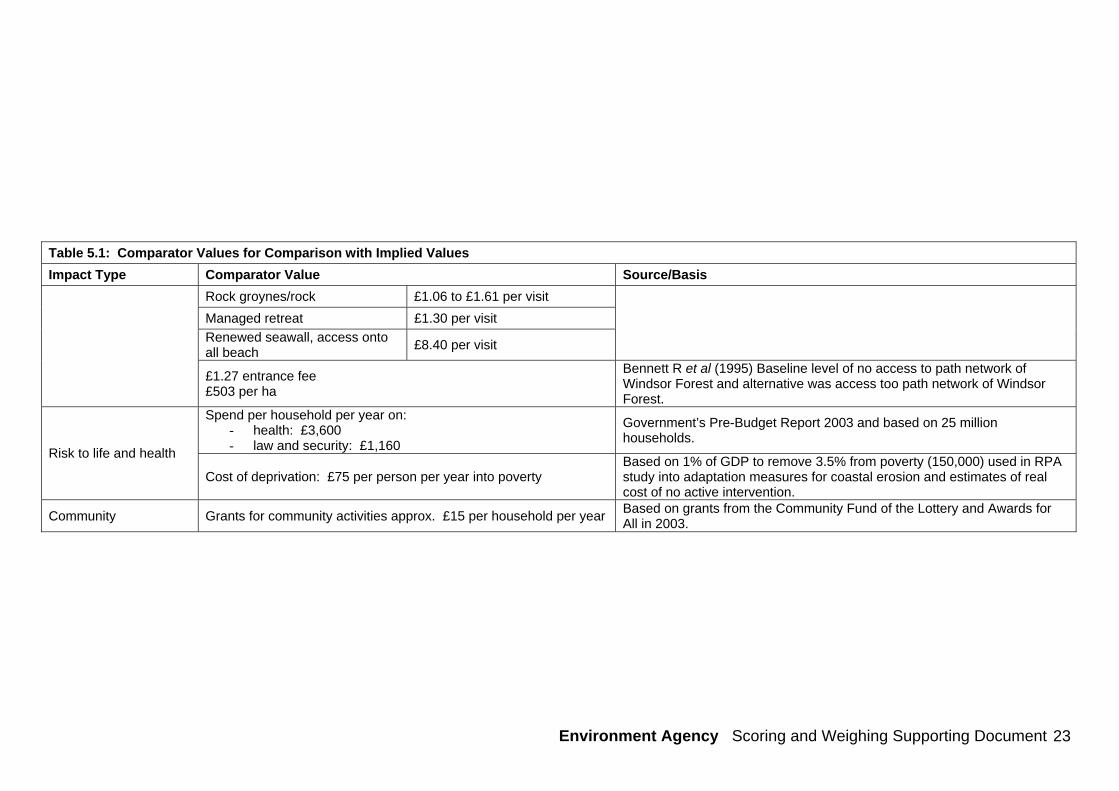
Recreation
Nourishment of beach £1.08 to £1.49 per visit
From Multi-Coloured Manual ( values given in £2001).
Environment Agency Scoring and Weighing Supporting Document 22
Environment Agency Scoring and Weighing Supporting Document
23
Table 5.1: Comparator Values for Comparison with Implied Values
Impact Type Comparator Value Source/Basis
Rock groynes/rock £1.06 to £1.61 per visit
Managed retreat £1.30 per visit
Renewed seawall, access onto all beach
£8.40 per visit
£1.27 entrance fee £503 per ha
Bennett R et al (1995) Baseline level of no access to path network of Windsor Forest and alternative was access too path network of Windsor Forest.
Spend per household per year on: - health: £3,600 - law and security: £1,160
Government’s Pre-Budget Report 2003 and based on 25 million households.
Risk to life and health
Cost of deprivation: £75 per person per year into poverty Based on 1% of GDP to remove 3.5% from poverty (150,000) used in RPA study into adaptation measures for coastal erosion and estimates of real cost of no active intervention.
Community Grants for community activities approx. £15 per household per year Based on grants from the Community Fund of the Lottery and Awards for All in 2003.

Would you like to find out more about us, or about your environment? Then call us on 08708 506 506* (Mon-Fri 8-6) email [email protected] or visit our website www.environment-agency.gov.uk incident hotline 0800 80 70 60 (24hrs) floodline 0845 988 1188 * Approximate calls costs: 8p plus 6p per minute (standard landline). Please note charges will vary across telephone providers Environment first: This publication is printed on paper made from 100 per cent previously used waste. By-products from making the pulp and paper are used for composting and fertiliser, for making cement and for generating energy.
Environment Agency Scoring and Weighing Supporting Document 24


