104
Flood Information Tool User Manual Revision 7 Developed for: NATIONAL INSTITUTE OF BUILDING SCIENCES 1090 Vermont Avenue, N.W., Suite 700 Washington, D.C. 20005-4905 1 April 2003

Flood Information Tool User Manual
Revision 7
Developed for:
NATIONAL INSTITUTE OF BUILDING SCIENCES 1090 Vermont Avenue, N.W., Suite 700 Washington, D.C. 20005-4905
1 April 2003

Copyright Notice Funding from the Federal Emergency Management Agency (FEMA) under agreements with the National Institute of Building Sciences (NIBS) supported the work that provided the basis for this publication. The substance and findings of that work are dedicated to the public. NIBS is solely responsible for the accuracy of the statements and interpretations contained in this publication. Such interpretations do not necessarily reflect the views of the Federal Government. The National Institute of Building Sciences is a non-governmental, non-profit organization authorized by Congress to encourage a more rational building regulatory environment, to accelerate the introduction of existing and new technology into the building process and to disseminate technical information. Copies of this report are available through the Federal Emergency Management Agency. For information contact FEMA at www.fema.gov/hazus or:
FEMA Distribution Center P.O. Box 2012 Jessup, Maryland 20794-2012 Tel.: 1-800-480-2520 Fax: 301-362-5335
HAZUS® is a trademark of the Federal Emergency Management Agency This manual is copyrighted © 1995-2002 by the Federal Emergency Management Agency. All Rights Reserved. The FIT operates as an extension to ESRI’s Geographic Information Systems (GIS) software package ArcGIS. The FIT user is subject to ESRI’s ArcGIS’ license and copyright agreements.

Flood Information Tool User Manual Revision Record Sheet
Date Revision Description of Major Revisions
Author(s) Reviewer(s) Software Version
25 Feb 2002
1.0 Riverine Beta Linda Wrigley Eric Tate
Ed Mifflin
Neil Blais Paul Flores
1.0 Beta
5 June 2002
2.0 Riverine Complete Linda Wrigley Eric Tate
Ed Mifflin
Neil Blais Paul Flores
1.0 Riverine
13 June 2002
3.0 Coastal Revisions Linda Wrigley Eric Tate
Chris Jones Fatih Dogan
Neil Blais Paul Flores
2.0 Beta
8 July 2002
4.0 Riverine & Coastal minor edits & screen
shot updates
Linda Wrigley Eric Tate
Fatih Dogan
Neil Blais Paul Flores
2.1.0 Beta
23 July 2002
5.0 Riverine & Coastal minor edits & screen
shot updates
Linda Wrigley Eric Tate
Fatih Dogan
Neil Blais Paul Flores
2.1.0
16 October 2002
6.0 Minor edits to Appendix B &
Appendix C
Linda Wrigley Eric Tate
Neil Blais 2.2.0
1 April 2003
7.0 Minor edits and screen updates
Linda Wrigley Eric Tate
Fatih Dogan
Neil Blais 3.0.0

Table of Contents
Table of Contents
1 INTRODUCTION ..................................................................................................................... 1-1
1.1 OVERVIEW OF REQUIREMENTS ............................................................................................. 1-2 1.1.1 System Requirements ................................................................................................... 1-2 1.1.2 Data Requirements ...................................................................................................... 1-3
1.2 KEY FUNCTIONALITY ........................................................................................................... 1-5 1.3 OVERVIEW OF THE FIT RIVERINE METHODOLOGY............................................................... 1-6 1.4 OVERVIEW OF THE FIT COASTAL METHODOLOGY............................................................... 1-8
2 USING FIT................................................................................................................................. 2-1
2.1 GETTING STARTED ............................................................................................................... 2-1 2.2 MENU OPTIONS .................................................................................................................... 2-3
2.2.1 HAZUS-FIT Menu ....................................................................................................... 2-3 2.2.2 Riverine Menu.............................................................................................................. 2-4 2.2.3 Coastal Menu............................................................................................................... 2-5
2.3 PROJECT SETUP AND VALIDATION........................................................................................ 2-6 2.3.1 General Tab ................................................................................................................. 2-8 2.3.2 Ground Surface Tab .................................................................................................. 2-11 2.3.3 Flood Surface Tab ..................................................................................................... 2-13 2.3.4 Floodplain Boundary Tab (Riverine Only)................................................................ 2-16 2.3.5 Analysis Boundary Tab (Coastal Only)..................................................................... 2-17 2.3.6 Completion of the Project Setup and Validation Process - Riverine and Coastal .... 2-18
2.4 RIVERINE ANALYSIS ........................................................................................................... 2-20 2.4.1 Depth Grid Wizard .................................................................................................... 2-20 2.4.2 Backwater Analysis Menu ......................................................................................... 2-31 2.4.3 Interpolate New Depth Grid ...................................................................................... 2-36
2.5 COASTAL ANALYSIS ........................................................................................................... 2-38 2.5.1 Build 100-Yr Elevation Grid...................................................................................... 2-39 2.5.2 Shoreline Wizard ....................................................................................................... 2-42 2.5.3 Edit Transects (Optional) .......................................................................................... 2-57 2.5.4 Frontal Dune Analysis (Optional) ............................................................................. 2-60 2.5.5 Calculate Hazard Grids............................................................................................. 2-64
2.6 MERGE FIT PROJECTS ........................................................................................................ 2-66
APPENDIX A – INPUT DATA AND CONVERSION METHODS............................................ A-1
A.1 ESRI GIS DATA FORMATS.................................................................................................. A-1 A.1.1 ArcInfo Grid.................................................................................................................A-1 A.1.2 Polyline Flood Elevations ...........................................................................................A-1 A.1.3 Polygon Floodplain Boundaries..................................................................................A-1 A.1.4 Polygon Flood Elevations ...........................................................................................A-1 A.1.5 Mass Points..................................................................................................................A-2 A.1.6 Polyline Contours ........................................................................................................A-2 A.1.7 TIN ...............................................................................................................................A-5 A.1.8 ArcInfo Region.............................................................................................................A-6 A.1.9 Generate File ...............................................................................................................A-6
Flood Information Tool User Manual iv Revision 7

Table of Contents
A.2 NON-ESRI GIS DATA ......................................................................................................... A-7 A.2.1 USGS DEM..................................................................................................................A-7 A.2.2 USGS SDTS DEM........................................................................................................A-8 A.2.3 USGS DLG...................................................................................................................A-8 A.2.4 USGS SDTS DLG ........................................................................................................A-9 A.2.5 MapINFO MIF.............................................................................................................A-9 A.2.6 Microstation DGN .......................................................................................................A-9 A.2.7 AutoCAD DWG..........................................................................................................A-10 A.2.8 ASCII Grid .................................................................................................................A-10 A.2.9 DXF............................................................................................................................A-11 A.2.10 Binary ........................................................................................................................A-11 A.2.11 DTED DEM ...............................................................................................................A-11 A.2.12 dBASE Table..............................................................................................................A-12 A.2.13 Digital Hydraulic Model Cross-Sections (Georeferenced) .......................................A-12 A.2.14 Digitized Streamline and Point Elevations................................................................A-12 A.2.15 Digitized Stream Baseline .........................................................................................A-12
A.3 NON-GIS DATA................................................................................................................. A-13 A.3.1 Hardcopy FIRM Polygons.........................................................................................A-13 A.3.2 Hardcopy BFE Lines .................................................................................................A-13 A.3.3 Hardcopy Hydraulic Model Cross-Sections..............................................................A-13 A.3.4 Digital Hydraulic Model Cross-Sections (Non-georeferenced)................................A-13
APPENDIX B – FIT FILE STRUCTURE ..................................................................................... B-1
APPENDIX C – TROUBLESHOOTING GUIDE ........................................................................ C-1
INDEX
Flood Information Tool User Manual v Revision 7

Table of Contents
List of Figures FIGURE 1-1: FIT SCHEMATIC .............................................................................................................. 1-1 FIGURE 2-1: ARCMAP’S EXTENSIONS DIALOG .................................................................................... 2-1 FIGURE 2-2: FLOOD INFORMATION TOOL TOOLBAR ............................................................................ 2-2 FIGURE 2-3: PROJECT SETUP AND VALIDATION – GENERAL TAB DIALOG FOR RIVERINE HAZARD..... 2-8 FIGURE 2-4: PROJECT SETUP AND VALIDATION – GENERAL TAB DIALOG FOR COASTAL HAZARD ..... 2-9 FIGURE 2-5: PROJECT SETUP AND VALIDATION – GROUND SURFACE TAB DIALOG .......................... 2-11 FIGURE 2-6: PROJECT SETUP AND VALIDATION – GROUND SURFACE TAB DIALOG WITH VERTICAL
DATUM AS OTHER ...................................................................................................................... 2-12 FIGURE 2-7: PROJECT SETUP AND VALIDATION – FLOOD SURFACE TAB DIALOG ............................. 2-13 FIGURE 2-8: PROJECT SETUP AND VALIDATION – FLOOD SURFACE TAB DIALOG FOR COASTAL –
“GREAT LAKES” STUDY AREA AND “OTHER” GREAT LAKE NAME ........................................... 2-14 FIGURE 2-9: PROJECT SETUP AND VALIDATION - FLOODPLAIN BOUNDARY TAB .............................. 2-16 FIGURE 2-10: PROJECT SETUP AND VALIDATION - ANALYSIS BOUNDARY TAB ................................ 2-17 FIGURE 2-11: DATA CONFLICT ERROR MESSAGE.............................................................................. 2-18 FIGURE 2-12: VERTICAL UNITS MISSING ERROR MESSAGE............................................................... 2-18 FIGURE 2-13: STREAM LIMITS DIALOG.............................................................................................. 2-21 FIGURE 2-14: UNACCEPTABLE STREAM LIMITS................................................................................. 2-22 FIGURE 2-15: INCORRECT STREAM LIMITS ........................................................................................ 2-23 FIGURE 2-16: INCORRECT STREAM LIMITS ERROR MESSAGE............................................................ 2-23 FIGURE 2-17: STREAM LIMITS DRAWN CORRECTLY.......................................................................... 2-24 FIGURE 2-18: FLOW CENTERLINE BUFFER DIALOG ........................................................................... 2-25 FIGURE 2-19: FLOOD ELEVATION AND DISCHARGE FIELDS DIALOG ................................................. 2-26 FIGURE 2-20: SET THRESHOLD? DIALOG .......................................................................................... 2-28 FIGURE 2-21: SET THRESHOLD DIALOG ............................................................................................ 2-29 FIGURE 2-22: BACKWATER POLYGONS DIALOG – INITIAL ................................................................ 2-31 FIGURE 2-23: BACKWATER POLYGON DIALOG - CLEAR OR ACCEPT................................................. 2-32 FIGURE 2-24: BACKWATER POLYGONS DIALOG - WITH BACKWATER FLOOD ELEVATION INFORMATION
................................................................................................................................................... 2-33 FIGURE 2-25: BACKWATER POLYGONS DIALOG - FINISH .................................................................. 2-34 FIGURE 2-26: STUDY AREA AFTER BACKWATER ANALYSIS .............................................................. 2-35 FIGURE 2-27: INTERPOLATE A NEW DEPTH GRID DIALOG ................................................................ 2-36 FIGURE 2-28: FLOOD ELEVATION AND ZONE FIELDS DIALOG ........................................................... 2-40 FIGURE 2-29: AO/VO ZONE DEPTH FIELD........................................................................................ 2-41 FIGURE 2-30: BUILD 100-YR ELEVATION GRID MESSAGE BOX ........................................................ 2-41 FIGURE 2-31: SHORELINE DEFINITION............................................................................................... 2-42 FIGURE 2-32: ERROR MESSAGE - SHORELINE OCCURS TOO FAR SEAWARD...................................... 2-43 FIGURE 2-33: SHORELINE - TOO FAR OFFSHORE ............................................................................... 2-44 FIGURE 2-34: SOME TRANSECTS CAN NEVER REACH LAND ............................................................. 2-44 FIGURE 2-35: USER DRAWN SHORELINE – VERY CLOSE TO THE STUDY AREA BOUNDARY.............. 2-45 FIGURE 2-36: ERROR MESSAGE - SHORELINE VERY CLOSE TO THE STUDY AREA BOUNDARY ......... 2-45 FIGURE 2-37: SHORELINE TOO CLOSE TO THE STUDY AREA BOUNDARY.......................................... 2-46 FIGURE 2-38: ERROR MESSAGE – SHORELINE TOO FAR ON LAND.................................................... 2-46 FIGURE 2-39: SHORELINE OCCURS TOO FAR LANDWARD ................................................................. 2-47 FIGURE 2-40: SHORELINE CORRECTLY DRAWN................................................................................. 2-48 FIGURE 2-41: SHORELINE INCORRECTLY DRAWN.............................................................................. 2-48 FIGURE 2-42: SHORELINE SEGMENTS DIALOG................................................................................... 2-49
Flood Information Tool User Manual vi Revision 7

Table of Contents
FIGURE 2-43: SHORELINE SEGMENTS DIALOG WITH MULTIPLE SHORELINE SEGMENTS DISPLAYED. 2-50 FIGURE 2-44: SHORELINE SEGMENTS DIALOG WITH WAVE DIRECTION REVERSED .......................... 2-51 FIGURE 2-45: SHORELINE SEGMENT CHARACTERISTICS DIALOG – TYPE TAB .................................. 2-52 FIGURE 2-46: SHORELINE TYPE......................................................................................................... 2-53 FIGURE 2-47: SHORELINE SEGMENT CHARACTERISTICS DIALOG - STILLWATER ELEVATIONS TAB .. 2-54 FIGURE 2-48: TRANSECT EDITOR DIALOG......................................................................................... 2-57 FIGURE 2-49: TRANSECT EDITOR FOR NON-ERODIBLE SHORELINE SEGMENT................................... 2-58 FIGURE 2-50: DATA FRAME FOR EROSION ANALYSIS........................................................................ 2-61 FIGURE 2-51: FLOOD-INDUCED EROSION .......................................................................................... 2-61 FIGURE 2-52: GUIDANCE FOR USER SELECTION OF DUNE PEAK........................................................ 2-62 FIGURE 2-53: FRONTAL DUNE ANALYSIS WITH APPLY ENABLED ..................................................... 2-63 FIGURE 2-54: ANALYSIS RETURN PERIODS DIALOG .......................................................................... 2-64 FIGURE 2-55: ANALYSIS OF RETURN PERIODS COMPLETE................................................................. 2-65 FIGURE 2-56: MERGE FIT PROJECTS DIALOG ................................................................................... 2-66
List of Tables TABLE 1-1: RIVERINE INPUT DATA REQUIREMENTS............................................................................. 1-3 TABLE 1-2: COASTAL INPUT DATA REQUIREMENTS............................................................................. 1-4 TABLE 2-1: HAZUS-FIT MENU OPTIONS............................................................................................ 2-3 TABLE 2-2: RIVERINE MENU OPTIONS ................................................................................................. 2-4 TABLE 2-3: COASTAL MENU OPTIONS.................................................................................................. 2-5 TABLE 2-4: DEFAULT REFERENCE ELEVATIONS FOR THE GREAT LAKES............................................ 2-15 TABLE 2-5: FEMA FLOOD HAZARD ZONE NAMES AND DESCRIPTIONS RECOGNIZED BY THE FIT..... 2-39
Flood Information Tool User Manual vii Revision 7

Chapter 1 Introduction
1 Introduction The Federal Emergency Management Agency (FEMA), under a cooperative agreement with the National Institute of Building Sciences (NIBS), has developed a standardized, nationally-applicable natural hazards loss estimation methodology. This methodology is implemented through PC-based geographic information system (GIS) software called HAZUS®MH. HAZUS®MH applies a multi-hazard methodology, with models for estimating potential losses from earthquake, flood (riverine and coastal), and wind (hurricanes) hazards.
The flood loss estimation methodology consists of two basic analytical processes: flood hazard analysis and flood loss estimation analysis. Flood hazards in the FIT are divided into riverine and coastal. In the riverine hazard module, characteristics such as frequency, discharge, and terrain elevation are used to model the spatial variation in flood elevation and flood depth. In the coastal hazard module, characteristics such as frequency, stillwater elevations, wave conditions, and terrain information are used to model the spatial variation in flood-induced erosion, flood elevation, and flood depth.
The Flood Information Tool (FIT) is an ArcGIS extension designed to process user-supplied flood hazard data into the format required by the HAZUS®MH Flood Model. The FIT, when given user-supplied inputs (e.g., ground elevations, flood elevations, and floodplain boundary information), computes the extent, depth and elevation of flooding for riverine and coastal hazards.
An overall schematic of the FIT is provided in Figure 1-1 showing some of the types of data input that users may have and the FIT output (depth of flooding).
Coastal BFE Polygons
Flood Elevations
Digitized Stream Cross Sections Attributed with Flood Elevation
Digitized BFEs from FIRM
Ground Elevations
DEM
Contours
TIN
FIRM or DFIRM data
Registration,Projection,Translation
Depth &Elevationof Flooding
FIT
Floodplain Boundary
Figure 1-1: FIT Schematic
Flood Information Tool User Manual 1-1 Revision 7

Chapter 1 Introduction
See Appendix A for information regarding conversion methods for the various types of input data.
The FIT stores data in a format and file structure (Appendix B) readily accessible by the HAZUS®MH Flood Model. Use of the FIT ensures the projection and map units of the data meet the HAZUS®MH Flood Model requirements and allows the user to import the data without additional manipulation.
1.1 Overview of Requirements
The FIT is an ArcGIS extension that provides users with a system of analysis utilities and tutorials used to process user-supplied flood hazard data into the format required by the HAZUS®MH Flood Model. The FIT is designed for users with GIS experience. Specifically, familiarity with ArcGIS is advantageous. Users should also have an understanding of riverine and/or coastal flooding mechanisms in order to properly create and interpret FIT output data.
1.1.1 System Requirements
The FIT requires users to have ArcGIS 8.3 or higher, with the ArcGIS Spatial Analyst extension installed on their stand-alone PC. The FIT functions as an extension in this environment. The hardware requirements for the FIT are those of ArcGIS 8.3:
Processor: 450 MHz required, 650 MHz or greater recommended •
•
•
RAM: 128 MB required, 256 MB or greater recommended
Operating System: Windows 2000, Windows NT 4.0, Windows XP
Flood Information Tool User Manual 1-2 Revision 7

Chapter 1 Introduction
1.1.2 Data Requirements
Use of the FIT requires the users to provide input spatial data. This includes terrain elevation information in the form of an ArcInfo grid, and flood elevation and floodplain boundary information as ESRI feature classes. The feature classes can exist as a shapefile, ArcInfo coverage, or as part of a geodatabase. All user supplied data must share a common map projection, datums, and units. More detailed descriptions of the input data requirements are provided in Table 1-1 and Table 1-2.
Table 1-1: Riverine Input Data Requirements
Required Input Purpose Spatial Data Format
Rules
Digital elevation model (DEM)
Describe terrain elevations and establish the cell size of all output grids
ArcInfo grid Should represent bald-earth conditions (i.e., no buildings, trees, etc.)
Flood elevation lines
Contain populated fields for flood elevations and discharges (optional) for one or more return periods.
ArcGIS polyline feature class
• Cannot intersect each other
• Should intersect the center of the floodplain
• No attribute fields named "Along", "Power", or "Skew"
Floodplain boundary
Define the centerline of flow and act as a guide for determining the floodplain width
ArcGIS polyline feature class
Represented by a single, continuous polygon feature
Flood Information Tool User Manual 1-3 Revision 7

Chapter 1 Introduction
Table 1-2:
Coastal Input Data Requirements
Required Input Purpose Spatial Data Format
Rules
Digital elevation model (DEM)
Describe terrain elevations and establish the cell size of all output grids
ArcInfo grid Should represent bald-earth conditions (i.e., no buildings, trees, etc.)
Flood hazard polygons
Contain populated fields for the flood elevations and FEMA flood hazard zones of the 100-yr flood
ArcGIS polyline feature class
If AO (sheet flow) zones exist, the depth should be stored in its own field
Analysis boundary
Define the boundary of analysis for all output data
ArcGIS polyline feature class
Represented by a single polygon feature that is completely contained with the DEM domain
Local flood insurance study
Provide stillwater elevations and wave setup at the shoreline
-- At a minimum, the 100-yr stillwater elevation wave setup component should be available
Flood Information Tool User Manual 1-4 Revision 7

Chapter 1 Introduction
1.2 Key Functionality
The FIT allows users to input locally available terrain information and flood information (elevation and boundaries) to develop grids of flood depth and flood elevation. This is accomplished through a series of user interface dialogs that guide the user through the process while gaining critical user input. Key features of the FIT are:
• Multi-hazard analysis: able to process flood hazard data for both riverine and coastal settings.
• Accepts user-supplied data: flexible enough to accept a variety of user-supplied terrain and flood hazard data.
• Flood surface interpolation: algorithms provide a means to interpolate flood elevations between cross-sections (riverine) and across base flood elevation polygons (coastal).
• Flood depth analysis: calculates flood depth grid(s) throughout the area of analysis.
• Flood frequency analysis: once the initial flood depth analyses are performed, depth grids for user-specified return periods can be interpolated.
• Flood-induced erosion analysis (coastal hazard only): algorithms model potential failure of the frontal dune in order to calculate a grid of flood-induced erosion depth. The FIT procedure is similar to the procedure used in FEMA coastal flood studies.
• Guidance via help functions to help users transform their flood hazard data into the formats required by the FIT.
It should be noted what functionality the FIT does not provide, namely hydrologic and hydraulic calculations. These computations must be completed elsewhere, and the results provided to the FIT as input data (see Section 1.1.2).
Flood Information Tool User Manual 1-5 Revision 7

Chapter 1 Introduction
1.3 Overview of the FIT Riverine Methodology
The riverine portion of the FIT was developed to allow users of HAZUS®MH to incorporate results of their own, stream-specific, hydraulic models. The primary FIT output is a flood depth grid or a set of such grids formatted for use in HAZUS®MH. The spatial data required to run the riverine portion of the FIT are a digital elevation model (DEM), a set of polylines (cross sections) attributed with flood elevations, and a polygon that defines a representative floodplain boundary. The DEM is an ArcInfo grid; the polyline and polygon files are shapefiles.
Input Floodplain Boundary
The user is required to identify up- and downstream limits of study and the shapefile field(s) that contains the elevation data in the polyline shapefile. If the floodplains are represented by more than one polygon, the user is required to identify the polygon associated with the study area. The floodplain boundary polygon need not be associated with any particular flood. It is used by the FIT only to define a “smooth” line representing the general flow path of floodwater. Only one polygon can be associated with a study reach. Floodplains that are disconnected (by a road crossing, for example) must be somehow connected (merged) or studied as two reaches.
Centerline of Flow
Once the stream limits have been chosen, the program will define a polyline from the upstream limit to the downstream limit. That polyline is, in a sense, the centerline of the floodplain. It is the aforementioned smooth line representing the general flow path of floodwater. Note that the program uses centerline to identify cross sections within the reach. Specifically, only cross section lines that cross the centerline are considered in subsequent analyses. It is important to ensure that all cross sections within a reach cross the centerline. Note that lines that cross the floodplain polygon necessarily cross the centerline.
Bounding Polygon
An initial buffer is computed around the centerline and the user is prompted to increase and/or decrease the buffer until satisfied that the conveyance area of the floodplain of interest is contained within the buffer. The chosen buffer defines the extent to which flood depths will be calculated and, therefore, is referred to as the bounding polygon. The extent of the floodplain boundary shapefile may help in guiding the decision on how large to make the bounding polygon.
The lengths of the cross section lines and the limits do not restrict the size of bounding polygon. If necessary, the program will extend cross-section lines to the bounding polygon. If necessary, the cross-section lines are extended in a manner that preserves a sense of alignment perpendicular to flood flow. The limits are extended in a straight line following the alignment at the ends of each respective limit. Users should try to avoid drawing stream limits that cross each other, intersect cross sections, or otherwise cut off portions of the bounding polygon pertinent to describing the floodplain.
Flood Information Tool User Manual 1-6 Revision 7

Chapter 1 Introduction
Non-Conveyance Areas
Certain low-lying areas adjacent to the floodplain, such as tributary streams, that do not convey but, rather, retain floodwater (pond) at the flood elevation in the conveyance part of the floodplain, need not be included within the bounding polygon. The FIT provides an analysis option for including such areas inside and outside of the bounding polygon. The ideal bounding polygon contains all portions of (different frequency) floodplains being analyzed and, also, minimizes the areas subject to ponding.
Interpolation of Additional Hazard Grids
If the cross sections are attributed with multiple flood elevations, the FIT uses the information supplied for the initial analyses to develop subsequent flood depth grids. That is, subsequent flood depth grids can be developed without re-entering reach limits and choosing bounding polygons. If cross sections are attributed with at least three flood elevations and corresponding discharge values, the FIT offers an option to interpolate other flood depth grids.
Modeling Tips
The study reach is defined by the choice of up- and downstream limits. In some situations, subdividing a reach into shorter reaches can improve the efficiency (run time) of the FIT. Subdividing a reach into reaches covered by bounding polygons of different sizes will yield results quicker than using the largest bounding polygon for the entire reach. In general, reaches should be chosen to include relatively homogeneous floodplain widths. Reaches should overlap enough to ensure that there are no gaps in coverage of the floodplain.
Highly meandering floodplain configurations may warrant special attention. If the flow centerline (not the stream) has a horseshoe-shaped meander, increasing the buffer will, at some distance, create a discontinuity in the bounding polygon. An “island” will form within the bounding polygon somewhere within the meander (inside the horseshoe). The interpolation algorithm in the FIT does not operate properly in such situations. Increasing the bounding polygon beyond that limiting size will result in error messages. If the bounding polygon must be increased beyond that limit, the meander should be analyzed piece-wise, thereby removing the “horseshoe” shape within any reach.
In order to analyze a stream network piece-wise, each partial analysis should begin by specifying a new working directory in the Project Setup and Validation dialog. After each individual analysis is complete, the results can be combined using the Merge FIT Projects menu item.
Flood Information Tool User Manual 1-7 Revision 7

Chapter 1 Introduction
1.4 Overview of the FIT Coastal Methodology
The coastal portion of the FIT was developed to allow users of HAZUS®MH to incorporate data from coastal flood hazard maps produced by FEMA or produced by other sources. The result of using the FIT is a flood depth grid or a set of such grids formatted for use in HAZUS®MH. The data required to run the coastal portion of the FIT are a digital elevation model (DEM), a set of polygons (areas subject to flooding) attributed with base flood elevations (BFE) and FEMA flood hazard zones (e.g., zone VE, zone AE, etc.) and a polygon representing the analysis boundary. The DEM is a grid; the polygon files are Shapefiles. The flood elevation polygons used by the coastal FIT must be associated with the base flood (100-year flood). They are used by the FIT to generate a 100-year flood elevation grid, and form the basis for all other return period flood surfaces calculated by the FIT.
Shoreline Characterization
The user is required to identify all coastal flood sources that will be considered by HAZUS®MH, and to draw a shoreline associated with each flood source. The shoreline drawn by the user should be a general depiction of the shoreline, and should not be a detailed rendering. In tidal areas, the shoreline drawn should represent the approximate mean sea level shoreline; in the Great Lakes the shoreline should be drawn at approximately the International Great Lakes Datum (IGLD) chart datum. If the user has a local map layers depicting the water line, this can be used as a guide when drawing the generalized shoreline.
The user must then divide each shoreline into segments of common physical characteristics and wave exposure. The shoreline types available for user selection include: rocky bluff; sandy bluff, little beach; sandy beach, small dune; sandy beach, large dune; open wetland; erosion protection structure. If the user selects an erosion protection structure (e.g., seawall or revetment) for a shoreline segment, the user must assign a level of protection afforded by the structure (i.e., a flood return period, below which the structure will not fail, and below which the structure will protect the uplands from flooding and erosion).
The user must provide the 100-year stillwater elevation at each shoreline segment, along with any contribution from wave setup (the stillwater elevation and wave setup information are published by FEMA in the Flood Insurance Study report -- FIS-- for each coastal community). The FIT relies upon the 100-year stillwater elevation (without setup) to calculate 10-year, 50-year and 500-year stillwater elevations. The user can edit or replace these elevations with values taken directly from the FIS, if available; otherwise, the FIT will use the calculated values, which are based on nationwide default data. Ultimately, the FIT can use the stillwater elevation values -- calculated or input by the user -- to calculate 10-year, 50-year, 500-year and interpolated flood elevation grids.
The FIT relies upon the user segmentation to differentiate between those segments that will be subject to flood-induced erosion and those that won’t. The FIT will generate shore-perpendicular transects from each shoreline segment. The transects are located at a pre-determined spacing and extend inland from the shoreline. The user is free to add and delete new transects if so desired.
Flood Information Tool User Manual 1-8 Revision 7

Chapter 1 Introduction
Frontal Dune Erosion
The FIT will create a profile (of ground elevation versus distance inland from the shoreline) for each transect crossing an erodable shoreline segment, and with sufficient wave action to cause erosion of dunes and bluffs or failure of erosion protection devices during the base flood. The user may select the peak and toe of the dune/bluff, or accept the FIT selections. The FIT will then calculate an eroded ground profile along each transect, and interpolate an eroded ground elevation grid.
Output Hazard Grids
The FIT will calculate the flood depth grid (i.e., the difference between the flood elevation grid and the eroded ground elevation grid) for the 100-year flood and for other return periods selected by the user. This information will be passed to HAZUS®MH, along with other data (shoreline characteristics, transect data, stillwater elevations, flood hazard zone information, etc.).
The flood depth grids created by the FIT will be used by HAZUS®MH with a suite of flood depth-damage functions to calculate flood damage. The vertical erosion grid calculated by the FIT (i.e., the vertical difference between the original ground elevation grid and the eroded ground elevation grid) will also be passed to HAZUS®MH, for use with an erosion depth-damage function to calculate erosion damage.
Modeling Tips
The study areas are subject to flooding from more than one coastal flood source. For example, a barrier island may be exposed to flooding from the open ocean and a bay. In such cases, FIT coastal analyses should be completed separately for each flood source. In order to analyze an area with multiple flood sources, each partial analysis should begin by specifying a new working directory in the Project Setup and Validation dialog and delineating and characterizing a new shoreline with the Shoreline Wizard. After each individual analysis is complete, the results can be combined using the Merge FIT Projects menu item.
Flood Information Tool User Manual 1-9 Revision 7

Chapter 2 Using FIT
2 Using FIT
2.1 Getting Started
Start the ArcMap application. ⇒
⇒
⇒
To access the FIT and the Spatial Analyst extensions:
Select Extensions... from the ArcMap’s Tool menu.
Click on the check boxes for Spatial Analyst and the Flood Information Tool as shown in Figure 2-1.
Figure 2-1: ArcMap’s Extensions Dialog
Flood Information Tool User Manual 2-1 Revision 7

Chapter 2 Using FIT
The Flood Information Tool that contains the menu items HAZUS_FIT, Riverine and Coastal is added to ArcMap’s menu. All of FIT’s functionality is accessed through the Flood Information Tool toolbar.
Figure 2-2: Flood Information Tool Toolbar
If the FIT toolbar is not displayed, select Toolbars from the View menu. ⇒
⇒
⇒
⇒
Click on Flood Information Tool.
Repeat to display the Spatial Analyst toolbar but select Spatial Analyst instead of Flood Information Tool.
Adjust the placement of the toolbars by dragging and dropping them to a convenient place on the screen. The Flood Information Tool may be placed on the menu bar if desired.
Flood Information Tool User Manual 2-2 Revision 7

Chapter 2 Using FIT
2.2 Menu Options
2.2.1 HAZUS-FIT Menu
Table 2-1: HAZUS-FIT Menu Options
HAZUS-FIT Menu Options Purpose Availability
Project Setup and Validation Allows the user to select the map layers to be used for flood hazard analysis, identify characteristics of them and view their projection. The FIT verifies that the input map layers share common vertical units, vertical datums, and map projections. See Section 2.3.
Available at all times.
Merge FIT Projects Allows users to merge output depth and elevation grids as well as output shapefiles from separate FIT analyses. See Section 2.6.
Available at all times.
FIT Help Gives the user access to the online help for the FIT.
Available at all times.
About FIT Provides access to the version number of FIT and copyright information.
Available at all times.
Flood Information Tool User Manual 2-3 Revision 7

Chapter 2 Using FIT
2.2.2 Riverine Menu
If the riverine hazard has been selected and validated on the Project Setup and Validation dialog, the Riverine menu options are enabled. (Shown in Figure 2-3.) The following is a brief description of each Riverine menu option and when it is available on the Riverine menu.
Table 2-2: Riverine Menu Options
Riverine Menu Options Purpose Availability
Depth Grid Wizard Allows the user to establish the analysis bounding polygon and produce flood elevation and depth grids. See Section 2.4.1.
Available after a project has been selected, defined as a Riverine hazard and validated using the Project Setup and Validation option on the HAZUS-FIT menu.
Backwater Analysis Performs map operations to identify and establish flood elevations for areas of potential backwater. See Section 2.4.2.
Available after the initial depth grids have been produced using the Depth Grid Wizard option on the Riverine menu.
Interpolate New Depth Grid Allows the user to specify additional return periods to be interpolated and a new depth grid created for each. The user can select flood return periods between 2 years and 1000 years. See Section 2.4.3
Available when at least 3 return periods with elevation and discharge values are added on the Depth Grid Wizard’s Flood Elevation and Discharge Fields dialog.
Flood Information Tool User Manual 2-4 Revision 7

Chapter 2 Using FIT
2.2.3 Coastal Menu
The Coastal menu options on the Flood Information Tool toolbar are available when a coastal hazard project has been selected and validated on the Project Setup and Validation dialog shown in Figure 2-4. The following identifies the Coastal menu options and when each is enabled on the Coastal menu.
Table 2-3: Coastal Menu Options
Coastal Menu Options Purpose Availability
Build 100-Yr Elevation Grid
Calculates and builds a 100-yr. elevation grid. See Section 2.5.1.
Available after a project has been selected, defined as Coastal and validated using the Project Setup and Validation option on the HAZUS-FIT menu.
Shoreline Wizard Selection of the Shoreline Wizard launches a series of dialogs designed to help the user identify and characterize the shoreline of interest. See Section 2.5.2.
Available when a 100-yr. elevation grid has been created using the Build 100-Yr Elevation Grid option on the Coastal menu.
Edit Transects Selection of Edit Transects allows the user to create new transects, select and delete new transects or apply the transects proposed by the FIT along their shoreline. See Section 2.5.3. (Optional.)
Available after the Shoreline Wizard has been completed using the Shoreline Wizard option on the Coastal menu.
Frontal Dune Analysis The Frontal Dune Analysis option allows the user to select the dune toe and peak for each erodable transect. See Section 2.5.4. (Optional)
Available after the Shoreline Wizard has been completed using the Shoreline Wizard option on the Coastal menu.
Calculate Hazard Grid The Calculate Hazard Grid option allows the user to specify additional return periods to be interpolated and new depth grid created for each. The user can select flood return periods between 10-year and 500-year. See Section 2.5.5.
Available after the Shoreline Wizard has been completed using the Shoreline Wizard option on the Coastal menu.
Flood Information Tool User Manual 2-5 Revision 7
Chapter 2 Using FIT
2.3 Project Setup and Validation
The Project Setup and Validation dialog allows the user to identify the input map layers to be used in the flood hazard analysis. Users can also review the projection of their map layers and ensure that they share a projection, units, and datum as required for the analysis.
The Project Setup and Validation dialog itself will not allow the modification or the manipulation of the data. To manipulate existing data units, projection or datum, you will need to use the functionality in ArcCatalog and/or ArcToolbox.
Click on ArcMap’s File / New menu option to start a new ESRI ArcMap document (.mxd). ⇒
⇒
⇒
Add the required input data layers to the map by clicking File/Add Data menu option and browsing to the location of the files. (See Section 1.1.2.)
To open the Project Setup and Validation dialog:
Select Project Setup and Validation from the HAZUS_FIT menu on the Flood Information Tool toolbar.
The Project Setup and Validation dialog appears over the active map window. By default, the General Tab with Riverine Hazard radio button selected is displayed. With Riverine selected as the hazard on the General Tab, the Project Setup and Validation Dialog consists of four tabs: General, Ground Surface, Flood Surface and Floodplain Boundary as shown in Figure 2-3. If Coastal (Coastal radio button) is selected as the hazard on the General Tab, the Project Setup and Validation Dialog consists of four tabs: General, Ground Surface, Flood Surface, and Analysis Boundary as shown in Figure 2-4.
If an area is subject to both riverine and coastal flooding, separate analyses must be conducted with the Riverine and Coastal FIT; the results are combined later in the HAZUS®MH flood model itself.
Project Setup and Validation –Riverine:
General Tab: Allows the user to select the hazard and define the working directory. See Figure 2-3.
•
•
•
•
Ground Surface Tab: Allows the user to specify the map layer for their digital terrain information, select the source, elevation units, vertical datum, and enter other descriptive parameters. The projection, horizontal units and cell size are also displayed See Figure 2-5 and Figure 2-6.
Flood Surface Tab: Displays the flood elevation map layer information for the user to check and select the map layer, source, elevation units, vertical datum, and other descriptive parameters. See Figure 2-7.
Floodplain Boundary Tab: Displays the floodplain boundary map layer information for the user to select the map layer and source, and other descriptive parameters. See Figure 2-9.
Flood Information Tool User Manual 2-6 Revision 7

Chapter 2 Using FIT
Project Setup and Validation – Coastal:
General Tab: Allows the user to select a hazard. It also allows the user to define the study area geographic location (i.e, Great Lakes, Atlantic Coast, etc.), and working directory. See Figure 2-4.
•
•
•
•
Ground Surface Tab: Allows the user to specify the map layer for their digital terrain information, select the source, elevation units, vertical datum, and enter other descriptive parameters. The projection, horizontal units and cell size are also displayed See Figure 2-5 and Figure 2-6.
Flood Surface Tab: Displays the flood elevation map layer information for the user to check and select the map layer, source, elevation units and vertical datum. See Figure 2-7 through Figure 2-8.
Analysis Boundary: Displays the analysis boundary map layer information for the user to select the map layer and source, and other descriptive parameters. See Figure 2-10.
Flood Information Tool User Manual 2-7 Revision 7

Chapter 2 Using FIT
2.3.1 General Tab
The General Tab allows the user to select a hazard, and define the project name and working directory.
If not already displayed, click on the General Tab. ⇒
The General Tab is displayed as shown in Figure 2-3.
Figure 2-3: Project Setup and Validation – General Tab Dialog for Riverine Hazard
Labels of required fields are displayed in Red.
Select the desired hazard by clicking on the appropriate radio button in the Select Hazard group box.
⇒
Flood Information Tool User Manual 2-8 Revision 7

Chapter 2 Using FIT
Riverine Hazard Complete the project information as follows:
Click on the Open Directory icon for Working directory to browse to the working directory. Single click on the appropriate directory to highlight and click Select. Do not double click. (Required) A new folder can be created by clicking the New Folder button within the Select Working Directory dialog.
⇒
⇒
⇒
⇒
Type in the Basin name. (Optional)
Type in the Reach name. (Optional)
Enter your name and the analysis date. (Optional)
Coastal Hazard
If Coastal is selected, the Study area location list box is enabled as shown in Figure 2-4.
Figure 2-4: Project Setup and Validation – General Tab Dialog for Coastal Hazard
Select the study area from the Study area location list box. (Required) ⇒
Flood Information Tool User Manual 2-9 Revision 7

Chapter 2 Using FIT
If Great Lakes is selected from the Study area location dropdown list, the Great Lake Name dropdown list box is enabled as a required field.
If needed, select the Great Lake name from the Great Lake Name dropdown list box. ⇒
⇒
⇒
⇒
⇒
The user must select one of six choices: Lake Erie, Lake Huron, Lake Michigan, Lake Ontario, Lake Superior, or Other. A choice of "Other" indicates the study shoreline does not lie on one of the main lakes, and when the ordinary low water level at the study shoreline is substantially different (i.e., more than 5 feet) than the ordinary low water level on the nearest main lake. This situation may arise along hydraulic connections between the main lakes, or Lake St. Clair. If "Other" is selected, the Reference Elevation field on the flood Surface Tab is enabled and a value must be entered (Figure 2-8).
Complete the project information as follows:
Click on the Open Directory icon for Working directory to browse to the working directory. Single click on the appropriate directory to highlight and click Select. Do not double click. (Required) A new folder can be created by clicking the New Folder button within the Select Working Directory dialog.
Type in the Study area. (Optional)
Type in the Beach name. (Optional)
Enter your name and the analysis date. (Optional)
Flood Information Tool User Manual 2-10 Revision 7

Chapter 2 Using FIT
2.3.2 Ground Surface Tab
The Ground Surface Tab allows the user to specify the map layer for their digital terrain information, and select the source, elevation units and vertical datum. The projection, horizontal units and the cell size of the grid are also displayed. The Ground Surface Tab is the same for a riverine hazard and a coastal hazard.
Click on the Ground Surface Tab. ⇒
The Ground Surface Tab is displayed as shown in Figure 2-5.
Figure 2-5: Project Setup and Validation – Ground Surface Tab Dialog
Labels of required fields are displayed in Red.
Select the appropriate map layer from the Map layer dropdown list which displays all raster layers in the active data frame.
⇒
⇒
⇒
Select the elevation units from the Elevation units dropdown list. (Required)
Select the vertical datum from the Vertical datum dropdown list. (Required)
Flood Information Tool User Manual 2-11 Revision 7

Chapter 2 Using FIT
If Other is selected for Vertical datum, the Other datum name is enabled as shown in Figure 2-6.
Figure 2-6: Project Setup and Validation – Ground Surface Tab Dialog with Vertical Datum as Other
Enter the Other datum name as required. (Required if Vertical datum is Other) ⇒
The Elevation units, Vertical datum and Other datum name must be the same on the Ground Surface Tab and the Flood Surface Tab.
Select the source from the Source dropdown list. (Optional) ⇒
⇒
⇒
Enter the description in the Description text box. (Optional)
Enter the layer date in the Date text box. (Optional)
The remaining boxes display the following map layer information from the raster projection file: cell size and map projection.
Coastal users should keep in mind that every shore-normal transect, that would be automatically drawn in later stages on the user drawn shoreline, needs at least 500 ft. of length landward of the shoreline. If there are narrow islands in the area of interest, the DEM should NOT be clipped to islands and extend towards sea with elevation values other than “No data”.
Flood Information Tool User Manual 2-12 Revision 7
Chapter 2 Using FIT
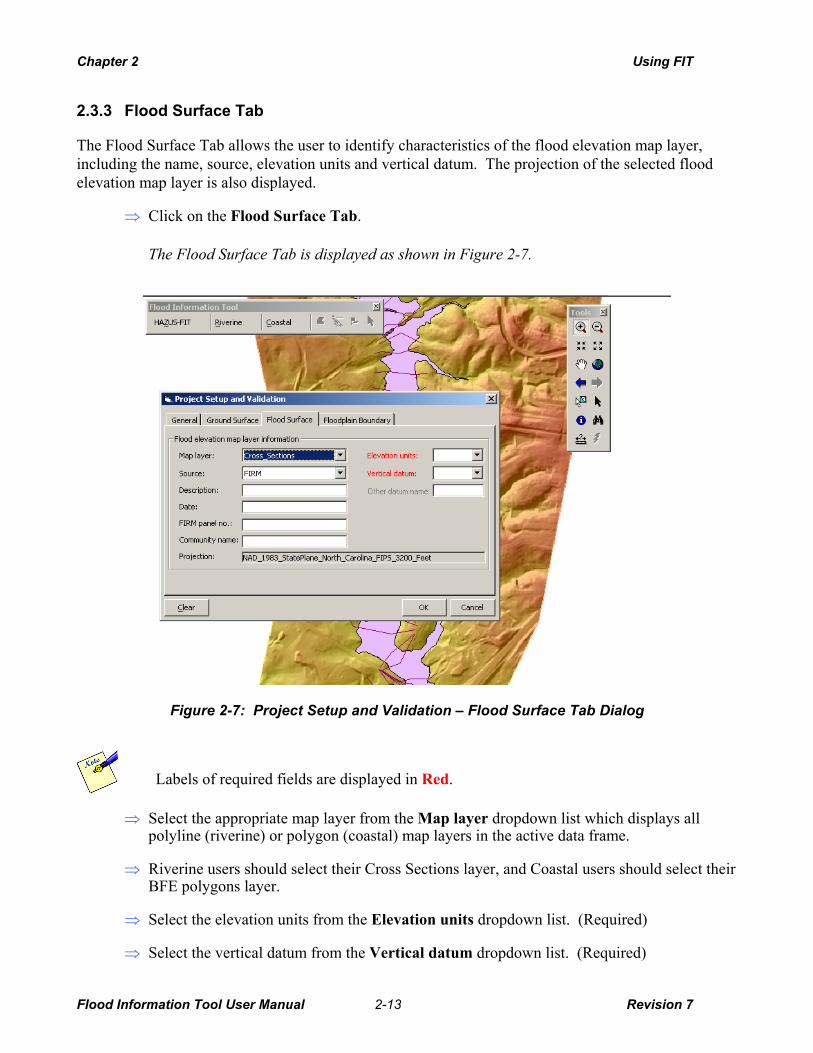
2.3.3 Flood Surface Tab
The Flood Surface Tab allows the user to identify characteristics of the flood elevation map layer, including the name, source, elevation units and vertical datum. The projection of the selected flood elevation map layer is also displayed.
Click on the Flood Surface Tab. ⇒
The Flood Surface Tab is displayed as shown in Figure 2-7.
Figure 2-7: Project Setup and Validation – Flood Surface Tab Dialog
Labels of required fields are displayed in Red.
Select the appropriate map layer from the Map layer dropdown list which displays all polyline (riverine) or polygon (coastal) map layers in the active data frame.
⇒
⇒
⇒
⇒
Riverine users should select their Cross Sections layer, and Coastal users should select their BFE polygons layer.
Select the elevation units from the Elevation units dropdown list. (Required)
Select the vertical datum from the Vertical datum dropdown list. (Required)
Flood Information Tool User Manual 2-13 Revision 7

Chapter 2 Using FIT
If Other is selected for Vertical datum, the Other datum name is enabled.
Enter the Other datum name as required. (Required if Vertical datum is Other) ⇒
The Elevation units, Vertical datum and Other datum name must be the same on the Ground Surface Tab and the Flood Surface Tab.
When setting up a Coastal hazard and Great lakes is selected as the Study area location and “Other” is selected from the dropdown list box on the General Tab, the Reference elev: field appears and becomes a required field as shown in Figure 2-8.
Figure 2-8: Project Setup and Validation – Flood Surface Tab Dialog for Coastal – “Great Lakes” Study Area and “Other” Great Lake Name
Flood Information Tool User Manual 2-14 Revision 7

Chapter 2 Using FIT
Select the source from the Source dropdown list. (Optional) ⇒
⇒
⇒
⇒
⇒
⇒
Enter the description in the Description text box. (Optional)
Enter the shapefile creation date in the Date text box. (Optional)
Enter the FIRM Panel no in the FIRM Panel no. text box. (Optional)
Enter the community name in the Community name text box. (Optional)
Enter the reference elevation in the Reference elev: text box. (Enabled and required for Great Lakes study area and “Other” great lake). Note that reference elevation should be entered in feet and be between 0 and 601 feet. The reference elevation input by the user should be the ordinary low water elevation (similar to IGLD Chart Datum) relative to NGVD29. The chart datums in Table 2-4 may be of assistance if a specific chart datum for the study shoreline cannot be found.
Table 2-4: Default Reference Elevations for the Great Lakes
Lake Elevation
Eric 570 ft.
Huron 578 ft.
Michigan 578 ft.
Ontario 244 ft.
St. Clair 573 ft.
Superior 601 ft.
The FIT user reference elevations along with the 100-yr. Stillwater elevation to calculate the 10 yr, 50-yr, and 500-yr Stillwater and flood elevations
The remaining box displays the Projection map layer information .
Coastal users should note that each valid BFE polygon they provide, should have a BFE greater than the reference elevation.
Flood Information Tool User Manual 2-15 Revision 7

Chapter 2 Using FIT
2.3.4 Floodplain Boundary Tab (Riverine Only)
The Floodplain Boundary Tab allows the user to identify the characteristics of their flood elevation information. The projection of the selected flood boundary map layer is also displayed. To access the Floodplain Boundary Tab:
Click on the Floodplain Boundary Tab. ⇒
The Floodplain Boundary Tab as shown in Figure 2-9 is displayed. This dialog is applicable for the Riverine Hazard only.
Figure 2-9: Project Setup and Validation - Floodplain Boundary Tab
Select the appropriate map layer from the combo box labeled Map layer. This combo box displays all polygon layers in the active data frame.
⇒
⇒
⇒
⇒
⇒
⇒
Select the source from the Source combo box dropdown list. (Optional)
Enter the description in the Description text box. (Optional)
Enter the date in the Date text box. (Optional)
The text box labeled FIRM panel no. allows the community to input their FIRM panel number. (Optional)
As needed, enter the community name from the FIRM panel in the text box labeled Community name. (Optional)
Flood Information Tool User Manual 2-16 Revision 7

Chapter 2 Using FIT
2.3.5 Analysis Boundary Tab (Coastal Only)
The Analysis Boundary polygon is used to specify where the hazard should be calculated by FIT. It should be a single feature in a polygon shapefile which consists of one single ring (doughnut shaped polygon, or polygons with multiple disjointed pieces are not allowed). In general the Analysis Boundary polygon should not be too narrow and should allow 1500 ft. long transects to be built inside it. Also it should not be much greater than the area that the user plans to draw the shoreline.
The Analysis Boundary Tab allows the user to set the analysis boundary map layer and provide descriptive information about it. To access the Analysis Boundary Tab:
Click on the Analysis Boundary Tab. ⇒
The Analysis Boundary Tab as shown in Figure 2-10 is displayed. This dialog is applicable for the Coastal Hazard only.
Figure 2-10: Project Setup and Validation - Analysis Boundary Tab
Select the appropriate map layer from a combo box labeled Map layer. This combo box displays all polygon layers in the active data frame.
⇒
⇒
⇒
⇒
Select the source from the Source combo box dropdown list. (Optional)
Enter the description in the Description text box. (Optional)
Enter the date in the Date text box. (Optional)
Flood Information Tool User Manual 2-17 Revision 7

Chapter 2 Using FIT
2.3.6 Completion of the Project Setup and Validation Process - Riverine and Coastal
Click Cancel to close the Project Setup and Validation dialog and discard any changes made or click Clear to remove all user input from all of the Project Setup and Validation tabs. When Clear is used the Project Setup and Validation dialog remains open.
⇒
⇒ Click OK to save edits and close the Project Setup and Validation dialog.
The critical map layer information is checked by the FIT to determine if there are any data conflicts with different map units or if any required data missing.
If conflicts or missing data are found, an error message is displayed to notify the user of the problem and which fields or key parameters need to be reviewed.
Figure 2-11: Data Conflict Error Message
Figure 2-12: Vertical Units Missing Error Message
Flood Information Tool User Manual 2-18 Revision 7

Chapter 2 Using FIT
Once the project has been set up and validated, additional user input is required for the analysis. The information needed for a riverine hazard is different from the information required for a coastal hazard.
It is recommended that the user save the file before proceeding to the next menu option.
⇒
•
•
Click the Save toolbar icon or select Save from the ArcMap File menu.
Riverine Hazard: Proceed to Section 2.4.
Coastal Hazard: Proceed to Section 2.5.
Flood Information Tool User Manual 2-19 Revision 7

Chapter 2 Using FIT
2.4 Riverine Analysis
It is recommended that the user review the Riverine FIT methodology discussion in Section 1.3 above. This review will help the user anticipate the actions requested by the FIT and the resulting action taken by the FIT.
If the riverine hazard was selected on the General Tab on the Project Setup and Validation dialog, the Riverine menu options are available. See Section 2.2.2 for a brief description of each Riverine menu option and when it is available.
The FIT’s title bar offers updates to the user on which process is currently being handled during periods of data review, analyses, etc.
2.4.1 Depth Grid Wizard
The Depth Grid Wizard provides the interface necessary for the user to manipulate their data and produce the initial depth grids by identifying the upstream and down stream limits of the study area, defining the flow centerline buffer and mapping the elevation field and discharge field with the appropriate return period.
The floodplain boundary layer (polygon), the cross-section/elevation layer (attributed polylines), and the DEM (grid) identified in the Project Setup and Validation dialog must be in the active dataframe.
Click on Riverine on the Flood Information Tool and select Depth Grid Wizard.... ⇒
The Stream Limits dialog is displayed as shown in Figure 2-13.
Flood Information Tool User Manual 2-20 Revision 7

Chapter 2 Using FIT
Figure 2-13: Stream Limits Dialog
The Stream Limits dialog is used to identify the upstream and downstream limits of the study area.
⇒
⇒
⇒
•
•
Select the Upstream limit radio button for the Upstream limit.
The Draw Polyline tool in the Draw limits group box is enabled.
Click on the Draw button.
The cursor changes from an arrow to a crosshair when held over the active map, indicating that the draw polyline tool is active. This tool is used to cut the floodplain polygon into a subset used for subsequent analyses.
To draw the stream limits on the active map, single click to add a vertex and finish by double clicking on the map.
When drawing the stream limits, there are several issues to keep in mind:
Each stream limit line should cross the floodplain boundary, intersecting its perimeter exactly twice.
No stream limit line should intersect a flood elevation line.
Flood Information Tool User Manual 2-21 Revision 7

Chapter 2 Using FIT
The shape of the limit should mimic that of the adjacent flood elevation line to be included in the analysis. For example, the orientation of the upstream limit line should parallel that of the flood elevation line just downstream.
•
•
•
The end points of the stream limits should extend at least two cell sizes beyond the floodplain boundary.
Avoid drawing Stream Limits that look like the ones shown in Figure 2-14.
These Stream Limits are incorrect since they have segments at the end(s) that are perpendicular or that reverse direction.
Figure 2-14: Unacceptable Stream Limits
The FIT checks to ensure that lines drawn by the user cross the floodplain polygon exactly twice before saving the polyline. This prevents the user from stopping the line within the floodplain and from crossing the polygon in several places.
Flood Information Tool User Manual 2-22 Revision 7

Chapter 2 Using FIT
The upstream limit is OK in this example since the upstream limit extended to the outer edge of the flow centerline buffer does not intersect the flood elevation line just downstream. However, if the flow centerline buffer had been larger, the upstream limit may have intersected the flood elevation line and caused an error.
The error, similar to the one shown in Figure 2-16, occurred since the downstream limit, extended to the edge of the flow centerline buffer, has intersected the flood elevation line just upstream.
Figure 2-17 shows stream limits drawn correctly to avoid an error regardless of the size of the flow centerline buffer.
Figure 2-15: Incorrect Stream Limits
Figure 2-16: Incorrect Stream Limits Error Message
Flood Information Tool User Manual 2-23 Revision 7

Chapter 2 Using FIT
The orientation of the upstream limit line parallels that of the flood elevation line just downstream, which eliminates the possibility of the two intersecting regardless of the size of the flow centerline buffer.
The orientation of the downstream limit line parallels that of the flood elevation line just upstream, which eliminates the possibility of the two intersecting regardless of the size of the flow centerline buffer.
Figure 2-17: Stream Limits Drawn Correctly
Repeat this process for Downstream limits. ⇒
⇒ Click Next.
The FIT uses the Upstream limit and the Downstream limit to cut the polygon into two polylines representing the left and right sides of the floodplain boundary. The midpoint between the two sides of the floodplain boundary trace out the centerline of general flow. The centerline of the floodplain boundary and a buffer of the centerline are displayed on the DEM (grid). Also, the flood elevation lines that intersect the centerline are highlighted, indicating which lines will be used in the depth grid computations. The Flow Centerline Buffer dialog is displayed on top of the active window as shown in Figure 2-18.
The processing time required to determine the flow centerline can markedly increase for input floodplain polygons with very narrow sections between the upstream and downstream limits. This is because the midpoint of the floodplain boundary cannot be calculated if the floodplain width is less than twice the DEM cell size. As a remedy, the FIT buffers the floodplain boundary polygon, a process that can consume several minutes depending on the size of the polygon and number of vertices.
Flood Information Tool User Manual 2-24 Revision 7

Chapter 2 Using FIT
Figure 2-18: Flow Centerline Buffer Dialog
The centerline buffer is used to define the universe in which flood hazard computations will take place. The buffer controls are used to adjust the estimated floodplain width of the lowest frequency flood to be analyzed. Ideally, the centerline buffer should include all areas through which floodwaters are conveyed. Within the conveyance boundary, the FIT will calculate flood elevations by interpolating between adjacent sets of cross-sections. In non-conveyance areas (backwater), flood elevations should be based on the elevation at which water backs up from the channel rather than through interpolation between cross-sections. As such, non-conveyance areas should not be included in the flow centerline buffer. Instead non-conveyance areas (ponding) can be added later in the FIT through backwater analysis.
Click the Increase buffer button to increase the buffer by one step. Continue as needed. ⇒
⇒
⇒
⇒
⇒
Click the Decrease buffer button to decrease the buffer by one step. Continue as needed.
Use the Reset button to return to the buffer size that existed upon entering this dialog.
If you need to return to the Stream Limits dialog, click the Back button.
Click Next.
If necessary, the upstream and downstream limit lines are extended to the edges of the centerline buffer. The limits are extended with the orientation at their endpoints. An error message is posted if the extended limits intersect a flood elevation line. If this occurs, the
Flood Information Tool User Manual 2-25 Revision 7

Chapter 2 Using FIT
limit geometry and/or buffer size will need to be altered.
The Flood Elevation and Discharge Fields dialog is displayed on top of the active map as shown in the Figure 2-19. The FIT cannot predict which attribute fields of the user supplied flood elevation polyline shapefile are used to store the flood elevation and discharge data. This dialog allows you to point the FIT to the attribute fields holding the flood elevation and discharge information for your flood return periods.
In most cases, specifying an incorrect field will not cause the analysis to stop, but will definitely produce inaccurate results.
Figure 2-19: Flood Elevation and Discharge Fields Dialog
Type the return period to be mapped in the Return period (2-1000 yrs) text box. This is the return period that you would like to map to the elevation field from your attribute database.
⇒
⇒
⇒
Select the flood elevation field from the Elevation field list box to link the return period to a particular elevation field. This list box contains the numeric fields from the attribute table of the flood elevation lines shapefile.
Select the discharge field from the Discharge field list box to link the return period to a particular discharge field. This list box also contains the numeric fields from the attribute table of the flood elevation lines shapefile. Associating a discharge field with the return period and flood elevation field is optional.
When a return period has been entered and a flood elevation field have been selected, the Add button is enabled.
Flood Information Tool User Manual 2-26 Revision 7
Chapter 2 Using FIT
Click Add to link the return period with the selected Elevation field and Discharge field. ⇒
⇒
The Return period, Elevation field name, and Discharge field name, if selected are added to the Output field mapping text box in the lower portion of the dialog. The selected elevation field and discharge field are removed from the Elevation field and Discharge field list boxes in the Input field mapping parameters group box.
Repeat as needed to analyze additional return periods.
At least 3 return periods with elevation AND discharge values are required for the interpolation of additional depth grids and to enable the Riverine menu item, Interpolate New Depth Grid.
To remove a return period and its associated elevation and discharge fields from the display text box, select a line and click Remove.
⇒
⇒
⇒
The selected record is deleted from the defined return period list box in the lower portion of the dialog and the elevation and discharge fields used for the deleted record are once again available in the Elevation field and the Discharge field list boxes.
To return to the Flow Centerline Buffer dialog, click Back.
When at least one field-mapping record is added to the lower text display box, the Calculate button is enabled.
Click Calculate.
Calculation of the flood elevation and depth grids for all return periods entered now begins.
The duration of analysis depends primarily upon the size of the final buffer, the cell size of the DEM, and the computer hardware configuration. As with other dialogs in the FIT, computation progress is displayed in the title bar in the upper left-hand corner of the screen. Upon completion of the computations, the Flood Elevation and Discharge Fields dialog is closed. The Backwater Analysis option on the Riverine menu is enabled.
Flood Information Tool User Manual 2-27 Revision 7

Chapter 2 Using FIT
At this point, up to 2 additional layers are added to the map.
1 Depth X This map layer shows the depth grid for return period X, where X represents the lowest frequency flood analyzed. If multiple return periods were analyzed, the associated depth grids are saved to the working directory but only the grid for return period X is added to the map.
2 Boundary X This map layer shows the floodplain boundary for return period X, where X represents the lowest frequency flood analyzed. If multiple return periods were analyzed, the associated floodplain boundaries are saved to the working directory, but only the boundary for return period X is added to the map.
The term “backlines” in the FIT refers to locations along the final buffer at which the depth of flooding exceeds zero. If the analysis determines that there are more than 10 backlines, the Set Threshold? dialog, shown in Figure 2-20, is displayed.
Figure 2-20: Set Threshold? Dialog
At this point, you may want to consider the following options:
Increase the centerline buffer.
Click No on the Set Threshold? dialog. ⇒
⇒
If backlines occur where flow is conveyed, then the final buffer was too narrow.
Increase the centerline buffer by rerunning the Depth Wizard as described in this section and increase the centerline buffer.
•
•
When the Depth Wizard is repeated for an area, the data is overwritten.
Increasing the centerline buffer can actually increase the number of backlines. This can occur when a long backline is broken up into several backlines.
Flood Information Tool User Manual 2-28 Revision 7

Chapter 2 Using FIT
Increase the depth threshold.
Click Yes on the Set Threshold? dialog. ⇒
The Set Threshold dialog, shown in Figure 2-21, is displayed for a new threshold value to be entered.
Figure 2-21: Set Threshold Dialog
Click OK. ⇒
The backlines are recalculated.
Setting a new value for the threshold does not change the flood elevation, flood depth grid or the floodplain boundary.
Flood Information Tool User Manual 2-29 Revision 7

Chapter 2 Using FIT
Leave as is and continue.
If the backlines occur where flow is not conveyed, then they indicate potential backwater (non-conveyance) areas of flooding.
Click No and continue to Backwater Analysis Menu, Section 2.4.2. ⇒
It is recommended that the user save the file before proceeding to the next menu option.
⇒ Click the Save toolbar icon or select Save from the ArcMap File menu.
Flood Information Tool User Manual 2-30 Revision 7

Chapter 2 Using FIT
2.4.2 Backwater Analysis Menu
The Backwater Analysis option on the Riverine menu allows the user to perform map operations to identify and establish flood elevations for non-conveyance areas (ponds) of flooding. Lines along the edge of the bounding polygon where the flood depths are greater than zero have been identified by the FIT and are shown on the display in magenta as a shapefile called “Backlines”. (See magnified item on Figure 2-22.)
Click Riverine on the Flood Information Tool toolbar and select Backwater Analysis from the Riverine menu.
⇒
The Backwater Analysis dialog, shown in Figure 2-22, is displayed.
Figure 2-22: Backwater Polygons Dialog – Initial
Click on the Draw Polygon button to activate the backwater polygon drawing tool. ⇒
Flood Information Tool User Manual 2-31 Revision 7
Chapter 2 Using FIT
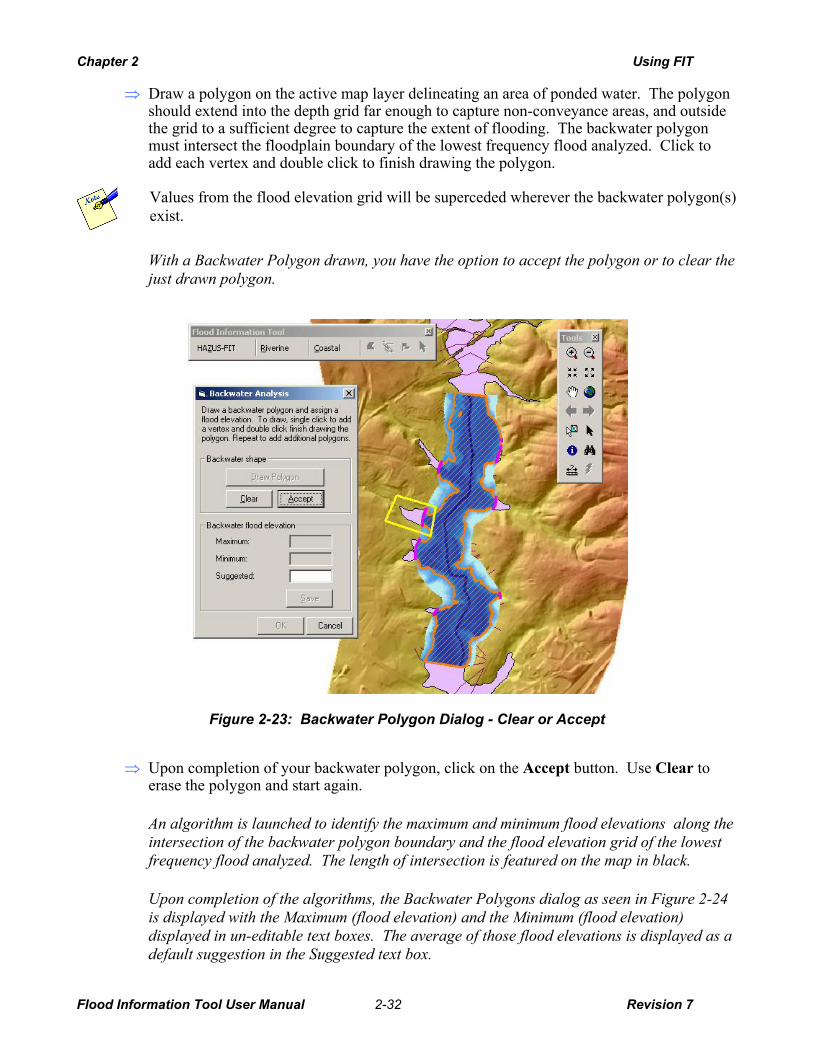
Draw a polygon on the active map layer delineating an area of ponded water. The polygon should extend into the depth grid far enough to capture non-conveyance areas, and outside the grid to a sufficient degree to capture the extent of flooding. The backwater polygon must intersect the floodplain boundary of the lowest frequency flood analyzed. Click to add each vertex and double click to finish drawing the polygon.
⇒
Values from the flood elevation grid will be superceded wherever the backwater polygon(s) exist.
With a Backwater Polygon drawn, you have the option to accept the polygon or to clear the just drawn polygon.
Figure 2-23: Backwater Polygon Dialog - Clear or Accept
Upon completion of your backwater polygon, click on the Accept button. Use Clear to erase the polygon and start again.
⇒
An algorithm is launched to identify the maximum and minimum flood elevations along the intersection of the backwater polygon boundary and the flood elevation grid of the lowest frequency flood analyzed. The length of intersection is featured on the map in black.
Upon completion of the algorithms, the Backwater Polygons dialog as seen in Figure 2-24 is displayed with the Maximum (flood elevation) and the Minimum (flood elevation) displayed in un-editable text boxes. The average of those flood elevations is displayed as a default suggestion in the Suggested text box.
Flood Information Tool User Manual 2-32 Revision 7

Chapter 2 Using FIT
Use the suggested elevation or enter a value. ⇒
⇒ Click the Save button to commit the backwater shape and elevation to disk.
Figure 2-24: Backwater Polygons Dialog - With Backwater Flood Elevation Information
Once the input values have been saved, they cannot be removed by clicking Cancel.
The polygon coverage representing the flood extent is created. The Backwater Polygons dialog is redisplayed as shown in Figure 2-25. (Note: The backwater polygon which is normally displayed in light blue is shown as red due to print considerations.)
To create another backwater polygon on the map layer repeat the above steps. ⇒
Flood Information Tool User Manual 2-33 Revision 7

Chapter 2 Using FIT
Figure 2-25: Backwater Polygons Dialog - Finish
Select OK to close the Backwater Polygon dialog. ⇒
Upon completion of the calculations, the flood depth grid has been expanded to include the defined backwater polygons and is displayed as shown in Figure 2-26.
Flood Information Tool User Manual 2-34 Revision 7

Chapter 2 Using FIT
Figure 2-26: Study Area after Backwater Analysis
It is recommended that the user save the file before proceeding to the next menu option.
⇒ Click the Save toolbar icon or select Save from the ArcMap File menu.
Flood Information Tool User Manual 2-35 Revision 7
Chapter 2 Using FIT
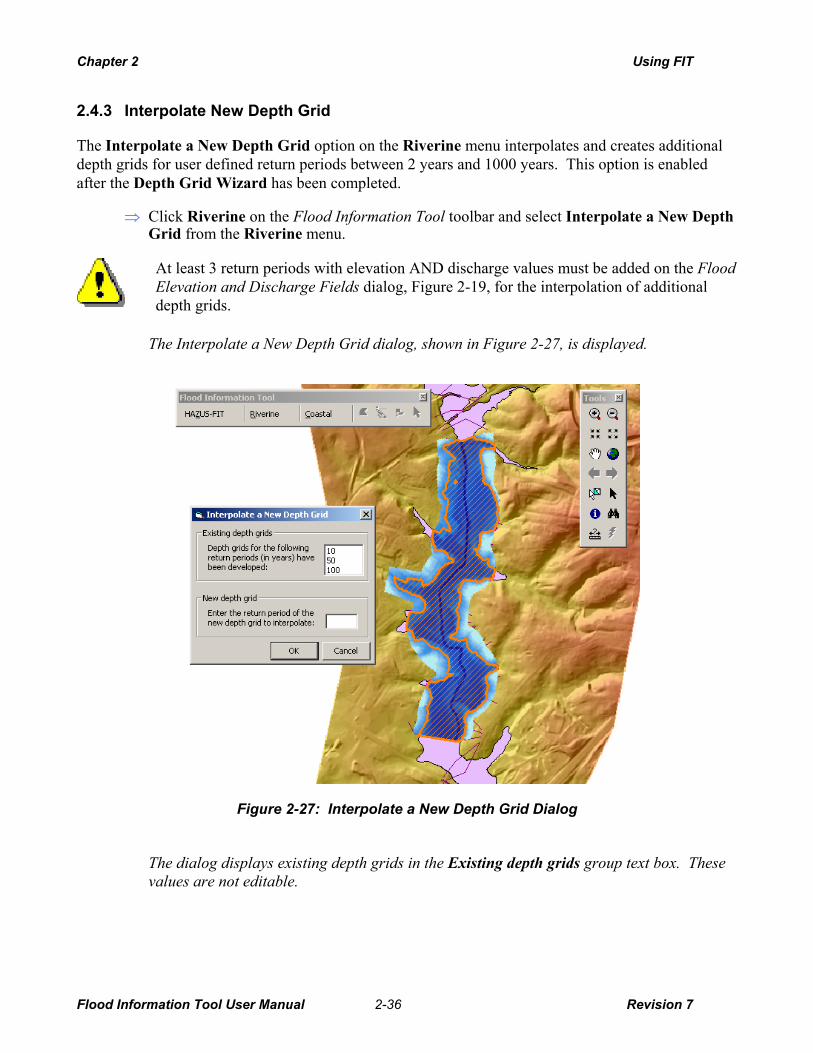
2.4.3 Interpolate New Depth Grid
The Interpolate a New Depth Grid option on the Riverine menu interpolates and creates additional depth grids for user defined return periods between 2 years and 1000 years. This option is enabled after the Depth Grid Wizard has been completed.
Click Riverine on the Flood Information Tool toolbar and select Interpolate a New Depth Grid from the Riverine menu.
⇒
At least 3 return periods with elevation AND discharge values must be added on the Flood Elevation and Discharge Fields dialog, Figure 2-19, for the interpolation of additional depth grids.
The Interpolate a New Depth Grid dialog, shown in Figure 2-27, is displayed.
Figure 2-27: Interpolate a New Depth Grid Dialog
The dialog displays existing depth grids in the Existing depth grids group text box. These values are not editable.
Flood Information Tool User Manual 2-36 Revision 7
Chapter 2 Using FIT
Enter a new return period for the new depth grid in the New depth grid group text box. ⇒
⇒
⇒
Click OK.
Repeat these steps for each return period for which to interpolate flood hazard grids.
It is recommended that the user save the file before proceeding to the next menu option.
⇒ Click the Save toolbar icon or select Save from the ArcMap File menu.
Flood Information Tool User Manual 2-37 Revision 7

Chapter 2 Using FIT
2.5 Coastal Analysis
The Coastal menu options on the Flood Information Tool toolbar are available when a coastal hazard project has been selected and validated on the Project Setup and Validation dialog shown in Figure 2-4. See Section 2.2.3 for a brief description of each Coastal menu option and when it is available.
It is recommended that the user review the Coastal FIT Methodology discussion in Section 1.4. This review will help the user anticipate the actions requested by the FIT and the resulting actions taken by the FIT.
In coastal analyses, unlike riverine, flooding can occur in areas where pre-flood ground elevations lie above the flood surface. Erosion of the frontal dune caused by the flood can lower ground elevations below the flood surface. The flood-induced erosion analysis accounts for erosion caused by the flood. Functionality to analyze long-term shoreline erosion is not included in the FIT, but is included in HAZUS®MH.
The FIT’s title bar offers updates to the user on which process is currently being handled during periods of data review, analyses, etc.
Flood Information Tool User Manual 2-38 Revision 7
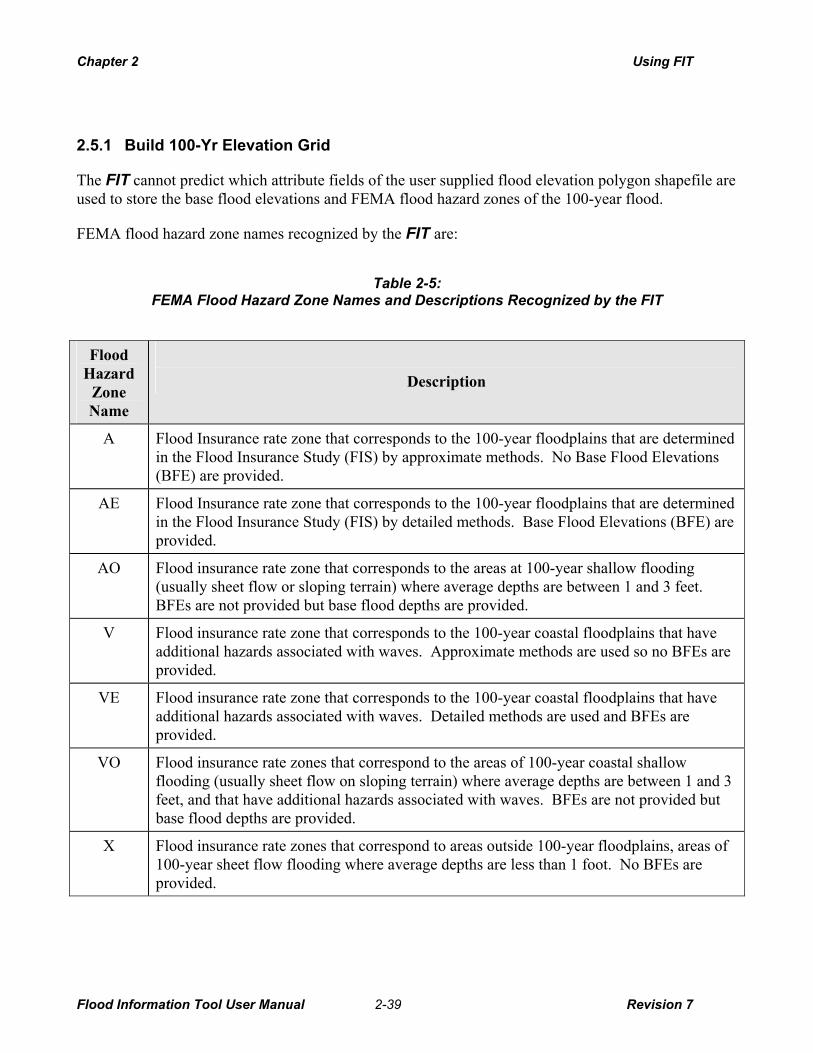
Chapter 2 Using FIT
2.5.1 Build 100-Yr Elevation Grid
The FIT cannot predict which attribute fields of the user supplied flood elevation polygon shapefile are used to store the base flood elevations and FEMA flood hazard zones of the 100-year flood.
FEMA flood hazard zone names recognized by the FIT are:
Table 2-5: FEMA Flood Hazard Zone Names and Descriptions Recognized by the FIT
Flood Hazard
Zone Name
Description
A Flood Insurance rate zone that corresponds to the 100-year floodplains that are determined in the Flood Insurance Study (FIS) by approximate methods. No Base Flood Elevations (BFE) are provided.
AE Flood Insurance rate zone that corresponds to the 100-year floodplains that are determined in the Flood Insurance Study (FIS) by detailed methods. Base Flood Elevations (BFE) are provided.
AO Flood insurance rate zone that corresponds to the areas at 100-year shallow flooding (usually sheet flow or sloping terrain) where average depths are between 1 and 3 feet. BFEs are not provided but base flood depths are provided.
V Flood insurance rate zone that corresponds to the 100-year coastal floodplains that have additional hazards associated with waves. Approximate methods are used so no BFEs are provided.
VE Flood insurance rate zone that corresponds to the 100-year coastal floodplains that have additional hazards associated with waves. Detailed methods are used and BFEs are provided.
VO Flood insurance rate zones that correspond to the areas of 100-year coastal shallow flooding (usually sheet flow on sloping terrain) where average depths are between 1 and 3 feet, and that have additional hazards associated with waves. BFEs are not provided but base flood depths are provided.
X Flood insurance rate zones that correspond to areas outside 100-year floodplains, areas of 100-year sheet flow flooding where average depths are less than 1 foot. No BFEs are provided.
Flood Information Tool User Manual 2-39 Revision 7

Chapter 2 Using FIT
Users must attribute numbered A zones (e.g., A1 through A30, A99, etc.) as AE zones for the FIT to recognize and use them. Similarly, there is a requirement to attribute numbered V zones (e.g., V1 through V30, V99, etc.) as VE zones. B and C zones should be attributed as Zone X
The Build 100-Yr Elevation Grid menu option on the Coastal menu asks the user to define the attribute fields for flood elevation and hazard zone of the 100 year flood and creates the 100-year elevation grid based on the selected fields.
In some cases specifying incorrect fields will not cause the analysis to stop but will definitely produce inaccurate results.
Click on Coastal on the Flood Information Tool toolbar and select the Build 100-Yr Elevation Grid... menu option.
⇒
The Flood Elevation and Zone Fields dialog is displayed as shown in Figure 2-28.
Figure 2-28: Flood Elevation and Zone Fields Dialog
Select the attribute field which has the flood elevation data from the Elevation field list box. (Required)
⇒
⇒ Select the attribute field which has the flood zone data from the Flood zone field list box. (Required)
Flood Information Tool User Manual 2-40 Revision 7

Chapter 2 Using FIT
If the data contains AO/VO zones, you should select the attribute field which has the depth data from the Sheet flow (AO/VO zone) depth field list box. (Optional)
⇒
The FIT reviews the information in the selected fields. The FIT notifies the user if problematic data is found as shown in Figure 2-29 when a field has been selected in the Sheet flow (AO/VO zone) depth grid field group box and the data does not contain any AO or VO zones.
Figure 2-29: AO/VO Zone Depth Field
Click OK to dismiss the error message. ⇒
⇒
⇒
Review the data and correct the problem.
Click OK.
An analysis is performed based upon the selected flood elevation and zone information and a 100 year elevation grid is created. A message box is displayed to notify the user that the grid calculations are complete.
Figure 2-30: Build 100-Yr Elevation Grid Message Box
Click OK. ⇒
The Shoreline Wizard... option is enabled on the Coastal menu.
It is recommended that the user save the ArcMap document before proceeding to the next menu option.
⇒ Click the Save toolbar icon or select Save from the ArcMap File menu.
Flood Information Tool User Manual 2-41 Revision 7

Chapter 2 Using FIT
2.5.2 Shoreline Wizard
The Shoreline Wizard option on the Coastal menu launches a series of dialogs designed to help the user identify and characterize the shoreline of interest, the specific shoreline reach of interest, and input shoreline descriptive information.
Some areas are subject to flooding from more than one coastal flood source. For example, a barrier island may be exposed to flooding from the open ocean and a bay. In such cases, the FIT Coastal Hazard Process must be completed for each flood source and its associated shoreline.
Select the Shoreline Wizard on the Coastal menu. ⇒
The Shoreline Wizard displays the Shoreline Definition dialog designed to allow the user to define the shoreline and the limits of the analysis. See Figure 2-31.
Figure 2-31: Shoreline Definition
Flood Information Tool User Manual 2-42 Revision 7

Chapter 2 Using FIT
The user should draw the shoreline as a polyline following the general shoreline shape, entirely within the limits of the study area polygon. Also there is a minimum length requirement of 100 feet. On average, the polyline should be drawn at approximately Mean Sea Level in tidal areas and near the IGLD chart datum along the Great Lakes. It is not necessary to follow small-scale changes in shoreline orientation -- in fact, doing so can cause problems during the subsequent transect creation and grid interpolations.
If the shoreline is drawn too far landward, the frontal dune analysis routine may not work; if the shoreline is drawn too far seaward, some or all of the transects that FIT constructs on this shoreline will be completely submerged in to the water and an error message will result in the further stages of the Shoreline Wizard (specifically at the end of the Shoreline Segment Characteristics dialog, when Finish is clicked). Another check that will be performed at this mentioned further stage is making sure each transect has at least 500 ft. of length on the land (above reference elevation). It is a good idea for the user to keep these in mind when drawing the shoreline so that these checks will not fail.
Both the shape of the study area and the relative location of the drawn shoreline can cause these checks to fail. Possible error messages are shown below.
Error message #1:
Figure 2-32: Error Message - Shoreline Occurs Too Far Seaward
The error message shown in Figure 2-32 has multiple ways of being generated.
The user drawn shoreline is too far offshore as shown in Figure 2-33. •
•
•
Some of the transects can never reach land because of the way they are oriented. See Figure 2-34.
The user drawn shoreline is very close to the boundary of the study area as shown in Figure 2-35.
Flood Information Tool User Manual 2-43 Revision 7

Chapter 2 Using FIT
Figure 2-33: Shoreline - Too Far Offshore
Figure 2-34: Some Transects Can Never Reach Land
Flood Information Tool User Manual 2-44 Revision 7

Chapter 2 Using FIT
Figure 2-35: User Drawn Shoreline – Very Close to the Study Area Boundary
Error message #2:
Figure 2-36: Error Message - Shoreline Very Close to the Study Area Boundary
When the perpendicular distance from the shoreline to the study area boundary is insufficient as shown in Figure 2-37, the error message shown in Figure 2-36 will be displayed. FIT needs at least 500 ft. long transects to perform analysis.
Flood Information Tool User Manual 2-45 Revision 7

Chapter 2 Using FIT
Figure 2-37: Shoreline Too Close to the Study Area Boundary
Error message #3:
Figure 2-38: Error Message – Shoreline Too Far On Land
The error message shown in Figure 2-38 will appear when the user drawn shoreline is drawn too far landward. See Figure 2-39.
Flood Information Tool User Manual 2-46 Revision 7

Chapter 2 Using FIT
Figure 2-39: Shoreline Occurs Too Far Landward
An example of a correctly drawn shoreline is shown in Figure 2-40. See Figure 2-41 for an example of an shoreline incorrectly drawn because the user attempted to include every small-scale change in the shoreline. The shoreline shown in Figure 2-41 presents problems because the analysis transects constructed perpendicular to it will vary greatly in orientation, and will likely not be perpendicular to the general shoreline and any dune features. Frontal dune analysis and eroded ground interpolations will be compromised by the resulting transect orientations. It is for this reason why the FIT requires users to draw the shoreline instead of accepting input of the locally-available shoreline/water line map layer.
Flood Information Tool User Manual 2-47 Revision 7

Chapter 2 Using FIT
Figure 2-40: Shoreline Correctly Drawn
Figure 2-41: Shoreline Incorrectly Drawn
Flood Information Tool User Manual 2-48 Revision 7

Chapter 2 Using FIT
Click Draw. ⇒
⇒
⇒
⇒
The cursor changes from an arrow to a crosshair when held over the active map, indicating that the Draw Polyline tool is active.
To draw the desired shoreline polyline, single click to add a vertex and double click to finish drawing.
To delete the shoreline polyline, click Clear.
The Next button is activated once the shoreline has been defined.
Click Next >.
The FIT uses this map layer as the starting point for transects.
The Shoreline Segments dialog is displayed as shown in Figure 2-42.
The Shoreline Segments dialog allows the user to split the shoreline into segments of shared physical characteristics, wave conditions or stillwater elevations. The user can then enter descriptive information regarding each segment.
Figure 2-42: Shoreline Segments Dialog
Flood Information Tool User Manual 2-49 Revision 7

Chapter 2 Using FIT
Click Draw shoreline breakline to visually create polyline segments on the map to represent the various shore segments.
⇒
⇒ Draw the polyline segments that demark changes in the shoreline. Single click to add a vertex and double click to finish drawing.
Shoreline segments should be divided according to one or more of the following criteria: shared physical characteristics, same stillwater elevations or wave conditions. FIT accepted shoreline types are rocky bluff; sand/sediment bluff, little beach; sandy beach, small dunes; sandy beach, large dunes; open wetlands; erosion protection structure. See Figure 2-46.
In some cases, Stillwater elevations and shoreline types may be uniform along a study shoreline, but segments should still be created. One such instance will occur along bluff of steeply sloped shorelines where wave runup elevations control base flood conditions, and where BFEs shown on the FIRM step up or down several feet in the longshore direction (despite similar Stillwater elevations and shoreline types). The user should draw breaklines corresponding to divisions between different BFE zones along the shoreline.
The segments created should not be shorter than 100 ft. The FIT will display an error message in those cases.
Figure 2-43: Shoreline Segments Dialog with Multiple Shoreline Segments Displayed
Flood Information Tool User Manual 2-50 Revision 7

Chapter 2 Using FIT
Click on Clear all breaklines to delete all of the user defined shoreline segments. ⇒
⇒
The endlines of the shoreline are displayed with arrows indicating the direction from flood source to land.
As needed, click on Switch direction to reverse the direction of the arrowheads.
The map redisplays the shoreline with the arrowheads on the start and end shoreline points in the reverse direction as shown in Figure 2-44.
Figure 2-44: Shoreline Segments Dialog with Wave Direction Reversed
If you need to return to the Shoreline Definition dialog, click < Back. All changes will be preserved unless any of the previous dialogs are changed.
⇒
⇒ Click Next >.
The Shoreline Segments dialog closes and the Shoreline Segment Characteristics dialog is displayed. See Figure 2-45.
The Shoreline Segment Characteristics dialog requires the user to define the type of shoreline along each segment and identify flood parameters. In the upper portion of the Shoreline Segment Characteristics dialog is a box labeled Current segment: which shows the user the current shoreline segment upon which they are working.
Flood Information Tool User Manual 2-51 Revision 7

Chapter 2 Using FIT
The Shoreline Segment Characteristics dialog consists of two tabs:
Shoreline Type: Allows the user to select a shoreline segment, identify the shoreline type and indicate if damaging waves (i.e., those capable of eroding dunes and bluffs, or damaging shore protection structures) occur at the shoreline during 100-year flood conditions.
•
• Stillwater Elevations: Allows the user to input stillwater elevations for a select range of return periods.
Shoreline Type Tab
Figure 2-45: Shoreline Segment Characteristics Dialog – Type Tab
Select the desired shoreline segment by clicking on either the left or the right Current Segment action buttons. The current shoreline segment is displayed in the text box in the middle.
⇒
The selected shoreline segment is highlighted on the map.
Flood Information Tool User Manual 2-52 Revision 7
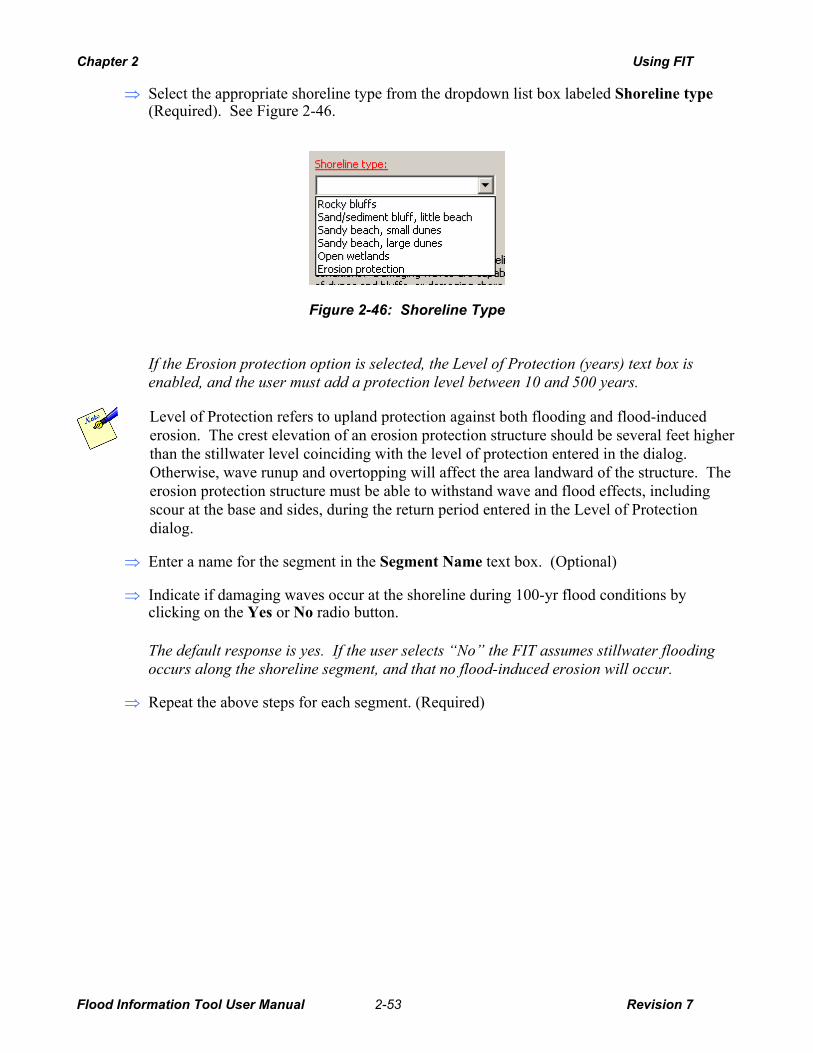
Chapter 2 Using FIT
Select the appropriate shoreline type from the dropdown list box labeled Shoreline type (Required). See Figure 2-46.
⇒
Figure 2-46: Shoreline Type
If the Erosion protection option is selected, the Level of Protection (years) text box is enabled, and the user must add a protection level between 10 and 500 years.
Level of Protection refers to upland protection against both flooding and flood-induced erosion. The crest elevation of an erosion protection structure should be several feet higher than the stillwater level coinciding with the level of protection entered in the dialog. Otherwise, wave runup and overtopping will affect the area landward of the structure. The erosion protection structure must be able to withstand wave and flood effects, including scour at the base and sides, during the return period entered in the Level of Protection dialog.
Enter a name for the segment in the Segment Name text box. (Optional) ⇒
⇒
⇒
Indicate if damaging waves occur at the shoreline during 100-yr flood conditions by clicking on the Yes or No radio button.
The default response is yes. If the user selects “No” the FIT assumes stillwater flooding occurs along the shoreline segment, and that no flood-induced erosion will occur.
Repeat the above steps for each segment. (Required)
Flood Information Tool User Manual 2-53 Revision 7

Chapter 2 Using FIT
Stillwater Elevations Tab
Click on the Stillwater Elevations Tab to input Stillwater elevations for a 100 year return period.
⇒
The Stillwater Elevations Tab dialog is displayed on the Shoreline Segment Characteristics dialog as shown in Figure 2-47.
Figure 2-47: Shoreline Segment Characteristics Dialog - Stillwater Elevations Tab
Enter the 100-year stillwater elevation in effect in the Elevation text box. Numeric values with decimals are accepted
⇒
The user can obtain the 100-year stillwater elevation (and the 10-year, 50-year and 500-year stillwater elevations) from the Flood Insurance Study (FIS) report, which accompanies the Flood Insurance Rate Maps for the community. The elevations are contained in the “Summary of Stillwater Elevations” table in the FIS.
The user should make sure that 100-yr BFEs corresponding to a particular segment are greater than the 100-yr SWEL of that segment, but less than or equal to the 100-yr SWEL + 25 ft.
Enter the name of the source in the Source text box. (Optional) ⇒
Flood Information Tool User Manual 2-54 Revision 7

Chapter 2 Using FIT
Indicate if the 100-yr elevation includes wave setup, by clicking on the Yes or No radio button.
⇒
The 100-year stillwater elevation from FIS should be input into the FIT. If the 100-year stillwater elevation includes wave setup, this value should still be input, the option button Yes selected, and the wave setup (feet) put in the appropriate box. The FIT will remove the wave setup from the 100-year stillwater elevation prior to calculating the 10-year, 50-year, and 500-year elevations. If wave setup is included in the 100-yr. stillwater elevation, but the Yes option button is not selected and the setup value is not input by the user, the effect will be to overestimate the 10-yr, 50-yr, 500-yr and interpolated flood elevations surfaces.
The user can determine whether wave setup is included in the 100-year stillwater elevation by reading the FIS carefully. If the user is uncertain or if the FIS is not clear on this point, the user can plot the stillwater elevations (linear scale) versus return period (log scale). The points should fall on approximately a straight line on the plot. If the 100-year point lies above a line drawn through the other points, the distance from the line to the 100-year point can be approximated as the wave setup.
When the Yes radio button is selected, the Wave Setup (ft) text box is enabled as a required field.
Enter a value for the wave setup between 0 and 3 ft. in the Wave Setup (ft) text box. Numeric values with decimals are accepted.
⇒
⇒
Once the 100-year stillwater elevation and wave setup data have been entered, values are displayed in the text boxes in the Other SWEL group box.
Edit the stillwater elevation information for each return period in the Other stillwater elevations group text boxes as needed. Numeric values with decimals are accepted.
The user can replace the values calculated by the FIT using data from the “Summary of Stillwater Elevations” table in the FIS. If the table in the FIS does not contain an elevation for a particular return period, use the value calculated by the FIT.
Select the vertical datum from the Vertical Datum list box. (Required) ⇒
⇒
⇒
If Other is selected in the Vertical Datum list box, the Other Vertical Datum text box is enabled.
Enter the vertical datum name in the Other Vertical Datum text box as required. This datum should match the one selected in the Project Setup and Validation dialog.
If the stillwater elevation information for all segments is the same or very similar, click Apply to All Segments and edit the stillwater elevation for each segment as needed. Otherwise repeat the above steps for each segment.
When all of the required information for each segment is defined, the Finish button is enabled.
Flood Information Tool User Manual 2-55 Revision 7

Chapter 2 Using FIT
Click Finish. ⇒
The Shoreline Segment Characteristics dialog closes and the Main Window appears. The Edit Transects, Frontal Dune Analysis, and Calculate 100-Yr Depth Grid options on the Coastal menu are enabled.
Upon selection of Finish, an algorithm is launched to create a series of shore-normal transects. The Transects are numbered in ascending fashion starting with 1 at the start of the shoreline through x at the end point of the shoreline. The shore-normal transects are developed as polylines, to the shoreline defined by the user, and will not extend beyond the user’s Analysis Boundary. The polylines will appear on the active map layer for the users visualization and editing. The transects are constructed in the same direction as the shoreline endlines previously displayed with the Shoreline Segments dialog, and should point toward land. If the direction of the transects is incorrect, it is important to re-run the shoreline wizard to correct the error. During the process of creating the shore-normal transects, a series of checks are performed to make sure that the transects are not completely submerged and each has at least 500 ft. of length on the land (above reference elevation). If one of these checks fails the user will be shown the appropriate error message (see Figure 2-32 through Figure 2-39). The user can find out at which transect the process was stopped by opening the attribute table of transects feature class and looking at the column named “Complete”. The transects that passed the checks will have the word “YES” on that column.
It is recommended that the user save the file before proceeding to the next menu option.
⇒ Click the Save toolbar icon or select Save from the ArcMap File menu.
Flood Information Tool User Manual 2-56 Revision 7

Chapter 2 Using FIT
2.5.3 Edit Transects (Optional)
Once the Shoreline Wizard has been completed, the Edit Transects option is available on the Coastal menu. Selection of Edit Transects allows the user to add new transects, or delete any added transects. The location of FIT generated transects cannot be altered.
Transects are used by the Coastal FIT to model flood-induced erosion of the frontal dune (the eroded ground surface affects the flood surface and flood depths). Transects are drawn by the FIT, perpendicular to and extending landward from the shoreline.
The user must have completed the Shoreline Wizard to activate the Edit Transects option on the Coastal menu, but use of the editing functionality is optional. Users may wish to add transects to achieve a tighter transect spacing or to place transects at selected locations.
Select Edit Transects from the Coastal menu located on the Flood Information Tool toolbar.
⇒
The Transect Editor dialog is displayed as shown in Figure 2-48. The map zooms into the selected segment and displays the selected segment in a highlighted mode with the existing transects.
Figure 2-48: Transect Editor Dialog
Flood Information Tool User Manual 2-57 Revision 7

Chapter 2 Using FIT
For non-erodable shore segments (rocky bluffs, high levels of erosion protection, or open wetlands), the Transect Editor dialog displays the shore segment information but the Transect Layout options are disabled as shown in Figure 2-49.
Figure 2-49: Transect Editor for Non-Erodible Shoreline Segment
Select the desired shoreline segment by clicking on the previous or next button labeled Number.
⇒
⇒
⇒
⇒
The information for the selected shore segment is displayed.
To add a new transect, click on the Add a new transect button to activate the Draw line tool.
The FIT transect draw tool is activated.
Draw a line that intersects the current segment at the point where the new transect will be added. Clicking on the map will add a vertex and double clicking will finish drawing.
The added transect is perpendicular to the shoreline and is shown in red. It may extend beyond the Analysis Boundary, but will be clipped once OK is clicked.
To delete a transect, select the transects to be deleted by using the Select an added transect tool. When the Select tool is activated, dragging a box around the transect or clicking on it will select it. Once you have selected a transect, click on the Selected radio button and click Clear to delete it.
Flood Information Tool User Manual 2-58 Revision 7

Chapter 2 Using FIT
Alternately, clicking on the All radio button and clicking the Clear button will delete all of the user defined transects on the current segment.
The user is not allowed to delete transects developed automatically by the FIT. This enables the FIT to maintain the minimum transect spacing. Users are allowed to add transects to enhance the FIT’s accuracy. Users are also able to delete transects they have added before they click OK and make them permanent.
Repeat as needed for the remainder of the shoreline segments. ⇒
⇒
⇒
Click Cancel to discard edits.
Click OK to accept the edits and make them permanent.
After added transects are made permanent, the only way to go back to the original transect layout is to restart the Shoreline Wizard.
The Transect Editor dialog is closed and transects are renumbered based on the newly added transects. The FIT will clip them if necessary to make sure that they do not extend beyond the user’s Analysis Boundary.
It is recommended that the user save the ArcMap document before proceeding to the next menu option.
⇒ Click the Save toolbar icon or select Save from the ArcMap File menu.
Flood Information Tool User Manual 2-59 Revision 7
Chapter 2 Using FIT
2.5.4 Frontal Dune Analysis (Optional)
Once the Shoreline Wizard has been completed, the Frontal Dune Analysis menu item is enabled on the Coastal menu.
The FIT will perform a frontal dune analysis (flood-induced erosion analysis) for transects lying in shoreline segments classified as erodible and with damaging waves present.
The Frontal Dune Analysis option allows the user to change the location of the frontal dune toe and peak for each transect, but does not allow the user to forsake the analysis itself.
Select Frontal Dune Analysis from the Coastal menu to access the Flood-Induced Erosion dialog.
⇒
The Frontal Dune Analysis dialog is displayed, shown in Figure 2-51, and a new data frame within ArcGIS is launched and displayed as shown in Figure 2-50. The data frame has an x- and y-axis with the x-axis representing the distance inland from the actual shoreline. In the cross-sectional profile, the shoreline represents the (0,0) point. Those transects identified on the Shoreline Segment Characteristics dialog (Figure 2-45) as lying in a shoreline segment exposed to damaging waves and with a shoreline type capable of being eroded, can be edited
Flood-induced erosion of the frontal dune is only considered within 500 ft of the shoreline.
Flood Information Tool User Manual 2-60 Revision 7

Chapter 2 Using FIT
Figure 2-50: Data Frame for Erosion Analysis
Figure 2-51: Flood-Induced Erosion
Select the transect to be defined by either clicking on the arrow to the right or the left of the Transect number text box displaying the current transect.
⇒
Flood Information Tool User Manual 2-61 Revision 7

Chapter 2 Using FIT
The FIT will assign the dune toe to the intersection of the transect profile and the 10-year SWEL. The user has the option to use this toe, or select another using the Select button.
In the Dune toe group box, elect to use the 10-yr stillwater elevation by leaving the Use 10-yr SWEL radio button selected or select Draw to draw the toe on the dune profile.
⇒
The toe should lie at the transition between the horizontal beach and the steep slope of the dune/bluff -- at the base of the slope. If the default 10-yr SWEL elevation intersects the transect on the beach or lies too high on the slope, the flood-induced erosion assessment results may be incorrect and the user should select the correct toe location.
The FIT will select and display a peak for the user. The user has the option to use this peak or draw another using the Draw button.
In the Dune Peak group box, select Draw. ⇒
⇒ Using the Draw Tool that is enabled, draw the dune peak on the dune profile by clicking on the appropriate place on the displayed map.
The dune peak should lie at or near the top of the dune, close to the upper limit of the steep slope on the dune's landward side (see Figure 2-52).
Figure 2-52: Guidance for User Selection of Dune Peak
The dune peak is repositioned and the Apply button is enabled on the Frontal Dune Analysis dialog as shown in Figure 2-53.
Flood Information Tool User Manual 2-62 Revision 7

Chapter 2 Using FIT
Figure 2-53: Frontal Dune Analysis with Apply Enabled
Click Apply. ⇒
The peak should lie at the maximum elevation of a single dune profile, or at the top of the slope on the landward side of a profile with multiple peaks. If the profile contains a bluff (nearly horizontal ground surface lying atop a steep slope), select the landward-most point on the bluff).
Repeat for each transect. (Optional) ⇒
⇒
⇒
Click OK.
A polygon coverage representing the flood extent is created.
Click OK.
It is recommended that the user save the ArcMap document before proceeding to the next menu option.
⇒ Click the Save toolbar icon or select Save from the ArcMap File menu.
Flood Information Tool User Manual 2-63 Revision 7

Chapter 2 Using FIT
2.5.5 Calculate Hazard Grids
Once the Shoreline Wizard has been completed, the Calculate Hazard Grids option appears on the Coastal menu. The Calculate Hazard Grids option on the Coastal menu, activates the Analysis Return Periods dialog which allows the user to specify additional return periods to be interpolated and new depth grid created for each. The user can select flood return periods between 10-year and 500-year.
Select Calculate Hazard Grids on the Coastal menu. ⇒
The Analysis Return Periods dialog is displayed as shown in Figure 2-54.
Figure 2-54: Analysis Return Periods Dialog
Enter a return period in the Return period (10-500 years) text box. ⇒
⇒
⇒
Click Add>.
The value entered in the Return Period (yr) text box is transferred to the list box on the right.
Repeat for additional return periods.
Flood Information Tool User Manual 2-64 Revision 7

Chapter 2 Using FIT
To remove a return period from the list box on the right, select the return period in the text box on the right and click Remove.
⇒
⇒
The selected return period is removed from the list box on the right.
Click Calculate to start the analysis.
The Analysis Return Periods dialog is closed. A depth grid for each of the defined return periods is produced. An eroded profile is created at each transect where flood-induced erosion occurs, and the flood depth along each transect is computed. Once the calculations have been completed for each transect, the model will start interpolating eroded ground elevations and flood depths between transects. Once the analysis is complete, a figure similar to Figure 2-55 is displayed.
Figure 2-55: Analysis of Return Periods Complete
It is recommended that the user save the ArcMap document before proceeding to the next menu option.
⇒ Click the Save toolbar icon or select Save from the ArcMap File menu.
Flood Information Tool User Manual 2-65 Revision 7

Chapter 2 Using FIT
2.6 Merge FIT Projects
Users are able to merge the depth and elevation grids (hazard, and flood-induced erosion) as well as output shapefiles of multiple projects into a single project so that they can be sent to the HAZUS®MH Flood Model together instead of separately. This capability is provided in the Merge FIT Projects option on the HAZUS_FIT menu located on the Flood Information Tool toolbar.
Select Merge FIT Projects from the HAZUS_FIT menu. ⇒
The Merge FIT Projects dialog is displayed as shown in Figure 2-56. This dialog allows the user to select the projects to be merged.
Figure 2-56: Merge FIT Projects Dialog
Merging Coastal and Riverine projects is not allowed. The grids and output shapefiles will be sent separately to the HAZUS®MH Flood Model where the individual damage functions will determine the controlling flood source for each occupancy classification. In other words, losses will be estimated for both grids and the flood model will select the highest damage value for each occupancy and census block.
Merging Grids:
To select the FIT’s projects to be merged:
Click on the Open File icon of the Directory in the Select FIT projects to be merged group box; navigate to the location of the project folder to be merged, single click the project folder and click Select. Do not double click.
⇒
⇒
⇒
Click Add.
The name of the selected FIT project folder is displayed in the list box.
Repeat for each FIT project to be merged.
Flood Information Tool User Manual 2-66 Revision 7

Chapter 2 Using FIT
To remove a FIT project from the list box, select the project and click Remove. ⇒
⇒
⇒
The selected FIT project is removed from the list of projects to be merged.
To define the FIT project:
Click on the Open File icon of the Directory in the Output project group box; navigate to the location of the project folder for the output project, select the project folder and click Select. (Required)
Click OK.
All of the FIT projects that were listed in the list box are merged into one and saved under the output project directory.
At least two FIT projects have to be added to the list box and the output project defined for the OK button to become enabled. There is no limit on the number of projects to be merged at one time but it should be noted that increasing the number will increase the processing time.
Flood Information Tool User Manual 2-67 Revision 7

Appendix A Input Data and Conversion Methods
Appendix A – Input Data and Conversion Methods
A.1 ESRI GIS Data Formats
A.1.1 ArcInfo Grid
This is the input data format required by the FIT for both riverine and coastal analysis. No conversion is required.
A.1.2 Polyline Flood Elevations
This is the input data format required by the FIT for riverine flood elevations. No conversion is required if in the polyline feature class format. Examples of flood elevation polylines are DFIRM BFE lines, digitized BFE lines, and digitized hydraulic model cross-sections. Each polyline should be attributed with one or more flood elevation(s) and the polylines should not intersect one another.
A.1.3 Polygon Floodplain Boundaries
This is the input data format required by the FIT for both riverine and coastal analysis. No conversion is required if in the polygon feature class format. Examples of floodplain boundary polygons include the FEMA Q3 and digitized floodplain polygons.
A.1.4 Polygon Flood Elevations
This is the input data format required by the FIT for coastal flood elevations and flood hazard zones. No conversion is required if in the polygon feature class format. Examples of coastal flood elevation polygons include the FEMA DFIRM and digitized flood elevation polygon. Each polygon should be attributed with a flood elevation, FEMA flood hazard zone, and sheet flow (AO/VO zone) depth (if applicable).
Flood Information Tool User Manual A-1 Revision 7

Appendix A Input Data and Conversion Methods
A.1.5 Mass Points
The conversion of Mass Points requires the use of one of Spatial Analyst’s interpolation methods (e.g. Spline, Inverse Distance Weighted) to interpolate points to raster. See Spatial Analyst documentation for further information on different methods of point interpolation.
LIDAR data must be preprocessed to represent bare earth conditions before performing the conversion to the FIT format.
A.1.6 Polyline Contours
The ArcGIS Spatial Analyst extension provides vector-to-raster conversion functionality through the menu item Convert Features to Raster. However, if used on polyline contour data, the resulting raster contains grid cells at the line locations, but not elsewhere. As such, this method is inadequate for developing a terrain elevation surface across the entire floodplain. Such a surface must be developed through interpolation. However, the ArcGIS raster interpolation routines accept only points as input. As a remedy, the FIT includes a standalone utility to convert line contours in a shapefile format, to mass points. The points can then be interpolated to a raster surface as described in Section A.1.2.
Flood Information Tool User Manual A-2 Revision 7

Appendix A Input Data and Conversion Methods
To add the Contour Converter to the ArcToolbox:
⇒
⇒
⇒
Start ArcToolbox.
Expand the My Tools folder.
Select Add Custom EXE Wizard
⇒
⇒
Select the ContourConverter.exe. from the FIT installation directory.
Complete the remaining Add Custom EXE Wizard steps.
To convert Contour data to Mass Points:
⇒
⇒
⇒
Start ArcToolbox.
Expand the My Tools folder.
Select ContourConverter
Flood Information Tool User Manual A-3 Revision 7

Appendix A Input Data and Conversion Methods
Select the Input Shapefile by using the browse button, drag and drop from Windows Explorer, or drag and drop from ArcCatalog.
⇒
⇒
⇒
Select the correct Elevation Field from the contour shapefile attribute table.
Enter the desired Point Interval.
Along each contour line, elevation points will be created using this point spacing. The lower the point interval, the greater the number of resulting points and required processing time. The desired point interval should be determined keeping in mind the trade off between point resolution and processing time. The processing time is dependent upon the following variables:
•
•
•
•
⇒
⇒
Computer hardware configuration
Point interval
Length of contour lines
Number of contour lines
Select the Output directory and define the name of the output file.
Click OK.
Flood Information Tool User Manual A-4 Revision 7
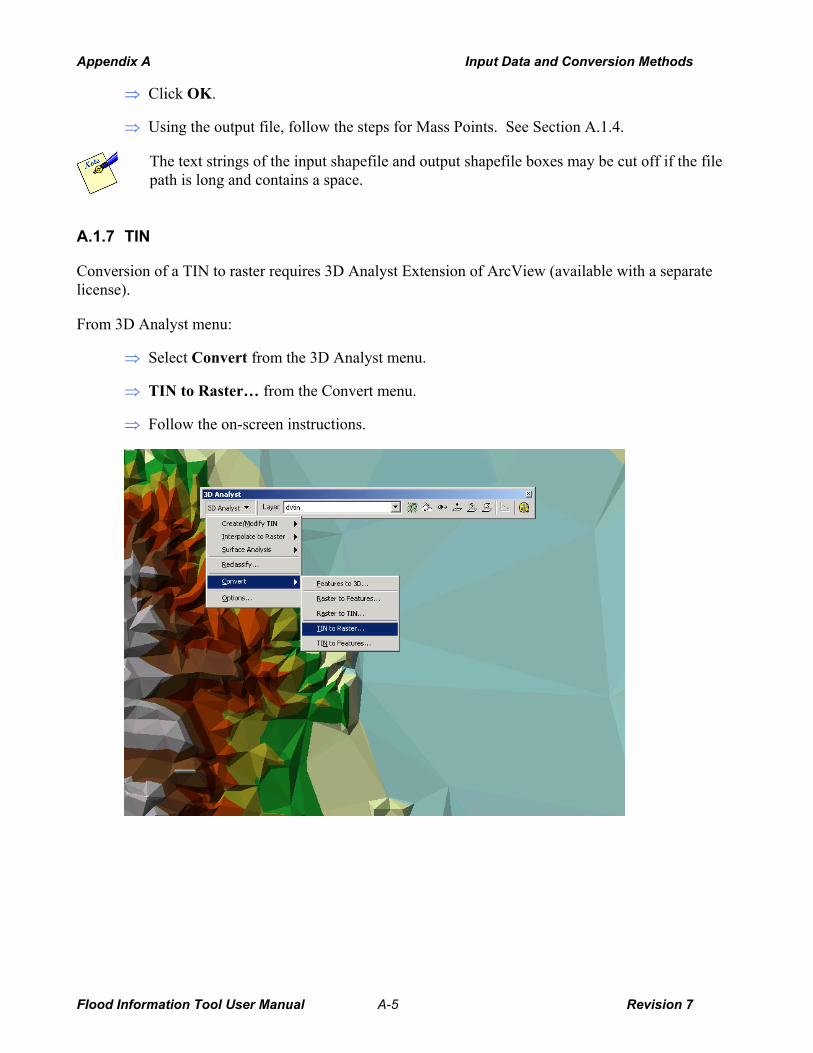
Appendix A Input Data and Conversion Methods
Click OK. ⇒
⇒ Using the output file, follow the steps for Mass Points. See Section A.1.4.
The text strings of the input shapefile and output shapefile boxes may be cut off if the file path is long and contains a space.
A.1.7 TIN
Conversion of a TIN to raster requires 3D Analyst Extension of ArcView (available with a separate license).
From 3D Analyst menu:
Select Convert from the 3D Analyst menu. ⇒
⇒
⇒
TIN to Raster… from the Convert menu.
Follow the on-screen instructions.
Flood Information Tool User Manual A-5 Revision 7

Appendix A Input Data and Conversion Methods
A.1.8 ArcInfo Region
Need to be converted into the ArcGIS polygon feature class format by user. This will require the use of ArcInfo.
A.1.9 Generate File
This item has been deferred from this release of the FIT. Users with ArcInfo can convert Generate Files into shapefiles.
Flood Information Tool User Manual A-6 Revision 7

Appendix A Input Data and Conversion Methods
A.2 Non-ESRI GIS Data
A.2.1 USGS DEM
To convert USGS DEM ground elevation data into ArcInfo Grid format:
⇒
⇒
⇒
⇒
Start ArcToolbox.
Expand the Conversion Tools folder.
Expand the Import to Raster folder.
Select DEM to Grid
There are reports that this will not work unless:
a. ArcMap is running and have a project already loaded (not a new one but one that has been saved before and loaded now)
b. Spatial Analyst is loaded in ArcMap. See Section 2.1.
Flood Information Tool User Manual A-7 Revision 7

Appendix A Input Data and Conversion Methods
A.2.2 USGS SDTS DEM
To convert USGS SDTS DEM ground elevation data into ArcInfo Grid format:
⇒
⇒
⇒
⇒
Start ArcToolbox.
Expand the Conversion Tools folder.
Expand the Import to Raster folder.
Select SDTS Raster to Grid
A.2.3 USGS DLG
The U.S. Geological Survey digital line graph (DLG) data format is used to store digital vector representations of cartographic information, such as topography, hydrography, and transportation features. Conversion of USGS DLG data to an ArcGIS feature class requires an ArcInfo license:
⇒
⇒
⇒
⇒
Start ArcToolbox.
Expand the Conversion Tools folder.
Expand the Import to Coverage folder.
Select DLG to Coverage Wizard
Flood Information Tool User Manual A-8 Revision 7

Appendix A Input Data and Conversion Methods
A.2.4 USGS SDTS DLG
Convert to a data format readable by the ArcView version of ArcGIS vector by using one of the data translators commercially available
⇒
⇒
•
Follow the steps for contours. See Section A.1.6.
Examples of commercially available data translators are:
DLG2SHP at http://www.gistools.com/ (~$100)
FME at http://www.safe.com/fme_desktop.htm (15 days free trial, after that ~$500) •
Also at http://www.fws.gov/data/gisconv/sdtsovr.html detailed steps for conversion in ArcView 3.x can be found.
•
A.2.5 MapINFO MIF
To convert MapInfo MIF vector data into the ArcGIS shapefile format:
⇒
⇒
⇒
⇒
Start ArcToolbox.
Expand the Conversion Tools folder.
Expand the Import to Shapefile folder.
Select MIF to Shapefile.
A.2.6 Microstation DGN
Same as AutoCAD DWG. See Section A.2.7.
Flood Information Tool User Manual A-9 Revision 7

Appendix A Input Data and Conversion Methods
A.2.7 AutoCAD DWG
To convert AutoCAD DWG ground elevation data into ArcGIS feature class format:
⇒
⇒
⇒
⇒
Start ArcToolbox.
Expand the Conversion Tools folder.
Expand the Export from CAD folder.
Select CAD to Geodatabase.
The geodatabase should be created before beginning the conversion process. To create a new geodatabase, select New/Personal Geodatabase from ArcCatalog’s File menu.
A.2.8 ASCII Grid
To convert ASCII Grid ground elevation data into ArcGIS Grid format:
⇒
⇒
⇒
⇒
Start ArcToolbox.
Expand the Conversion Tools folder.
Expand the Import to Raster folder.
Select ASCII to Grid.
Flood Information Tool User Manual A-10 Revision 7

Appendix A Input Data and Conversion Methods
A.2.9 DXF
Use steps described for AutoCAD DWG in Section A.2.7. ⇒
A.2.10 Binary
This item has been deferred from this release of the FIT.
A.2.11 DTED DEM
To convert DTED DEM ground elevation data into ArcGIS Grid format:
⇒
⇒
⇒
⇒
Start ArcToolbox.
Expand the Conversion Tools folder.
Expand the Import to Raster folder.
Select DTED to Grid.
Flood Information Tool User Manual A-11 Revision 7

Appendix A Input Data and Conversion Methods
A.2.12 dBASE Table
Tabular data containing geographic coordinates can be added to ArcMap if the table contains at least two fields: one for the x-coordinate and one for the y-coordinate. To convert a dBASE table into the ArcGIS shapefile format:
⇒
⇒
⇒
⇒
⇒
⇒
⇒
Start ArcMap.
From the Tools menu, select Add XY Data.
Browse to the table.
Specify the x and y fields.
Click the Edit button to specify the spatial reference.
Click OK to close the Add XY Data dialog.
Convert the layer to a shapefile by right-clicking the layer in the ArcMap table of contents, and selecting Data/Export Data.
A.2.13 Digital Hydraulic Model Cross-Sections (Georeferenced)
Need to be converted into a GIS by user
A.2.14 Digitized Streamline and Point Elevations
This item has been deferred from this release of the FIT.
A.2.15 Digitized Stream Baseline
This item has been deferred from this release of the FIT.
Flood Information Tool User Manual A-12 Revision 7

Appendix A Input Data and Conversion Methods
A.3 Non-GIS Data
A.3.1 Hardcopy FIRM Polygons
Need to be digitized by user (e.g.: see http://www.ncgia.ucsb.edu/cctp/ for help).
A.3.2 Hardcopy BFE Lines
Need to be digitized by user (e.g.: see http://www.ncgia.ucsb.edu/cctp/ for help)
A.3.3 Hardcopy Hydraulic Model Cross-Sections
Need to be digitized by user (e.g.: see http://www.ncgia.ucsb.edu/cctp/ for help)
A.3.4 Digital Hydraulic Model Cross-Sections (Non-georeferenced)
This item has been deferred from this release of the FIT.
Flood Information Tool User Manual A-13 Revision 7

Appendix B FIT File Structure
Appendix B – FIT File Structure The location of the output data from the FIT is the working directory specified by the user in the Project Setup and Validation – General Tab dialog. (See Figure 2-3 for Riverine and Figure 2-4 for Coastal.)
It is important not to alter these files in any way, if the FIT is to function properly.
Riverine
Name Type Description
Depth Folder Contains raster datasets for all flood depth grids created. Follows the naming convention “DepthX”, where X = an integer return period between 2 – 1000 years.
Elev Folder Contains raster datasets for all flood elevation grids created. Follows the naming convention “ElevX”, where X = an integer return period between 2 – 1000 years.
Misc Folder Contains a raster datasets of upstream cross-section (when applicable)
FITResults Personal geodatabase All feature classes will be stored under “FITResults” feature dataset in the FITResults.mdb
Backlines Polyline feature class Indicates areas along the floodplain (buffer) boundary where flood depths exceed zero for the lowest frequency flood analyzed.
Backwater Polygon feature class Backwater polygons.
BoundaryX Polygon feature class Floodplain boundary for return period “X”.
Centerline Polyline feature class General centerline of flow.
EucXSecs Polyline feature class The set of flood elevation lines used in the depth grid analysis.
FloodPts Point feature class Flood elevation points used to interpolate the flood elevation grid(s).
Mask Polygon feature class Defines the analysis boundary.
Input INI file Project descriptive and analysis parameters.
Flood Information Tool User Manual B-1 Revision 7

Appendix B FIT File Structure
Coastal
Name Type Description
Depth Folder Contains raster datasets for all flood depth grids created. Follows the naming convention “DepthX”, where X = an integer return period between 10 – 500 years.
Elev Folder Contains raster datasets for all flood elevation grids created. Follows the naming convention “ElevX”, where X = an integer return period between 10 – 500 years. Also stores grids of shoreline segments, a sheet flow and hazard zone.
Misc Folder Contains raster datasets of shoreline segments, BFEs, and sheet flow depths.
Erosion Folder Contains raster datasets for erosion elevation and depth grids. Follows the naming convention “ErElevX” or “ErDepthX”, where X = an integer return period between 10 – 500 years.
Zone Folder Contains raster datasets for flood hazard zone. Follows the naming convention “ZoneX” where X = an integer return period between 10 – 500 years.
FITResults Personal geodatabase All feature classes will be stored under “FITResults” feature dataset in the FITResults.mdb
Shoreline Polyline feature class Generalized shoreline drawn by the user.
Transects Polyline feature class Shore normal transects used for frontal dune analyses.
BoundaryX Polygon feature class Floodplain boundary for return period “X”
Mask Polygon feature class Defines the Analysis Boundary
Erosion Pts Point feature class Eroded ground elevation points used to interpolate the eroded ground deviation grid.
Input INI file Project descriptive and analysis parameters.
Flood Information Tool User Manual B-2 Revision 7

Appendix C Troubleshooting Guide
Appendix C – Troubleshooting Guide 1 Issue:
Cause: There are two potential causes and both are related to bugs in ArcMap:
a. There is a file sharing error. The FIT is attempting to save a grid dataset, but another application (ArcCatalog or Windows Explorer) is claiming ownership or the grid has read-only permission.
b. ArcMap will not allow a grid dataset to be overwritten because ArcMap erroneously believes there is an active map layer referencing the grid.
Solution: •
•
•
•
•
•
•
Note the file path to the grid dataset displayed in the error message.
Save the ArcMap document and close ArcMap.
If a grid dataset with the same name and path already exists, ensure the grid and associated information folder and contents have write permission.
In Windows Explorer, ensure that the folder indicated in the error message is not open.
In ArcCatalog, ensure that the folder indicated in the error message is not open.
Open the Windows Task Manager and click on the Processes tab. Click on the “Image Name” field twice so that the application names are sorted in ascending order. If ArcMap.exe appears in the list, select it and click the “End Process” button.
Open the ArcMap document and re-start the process that generated the error message.
Flood Information Tool User Manual C-1 Revision 7

Appendix C Troubleshooting Guide
2 Issue: The FIT dialogs that allow drawing stay on top even when switching to other Windows applications.
Cause: There is an incompatibility between ArcMap and Visual Basic regarding modeless dialogs.
Solution: None. This is an ArcMap limitation.
3 Issue: After saving a new ArcMap document or using Save As to change the name of an existing document, the new name is not updated in the ArcMap title bar.
Cause: The FIT often uses the ArcMap title bar to post status messages. When not processing, the title bar will show the name of the current ArcMap document. But due to an ArcMap limitation, the title bar is not updated in certain circumstances.
Solution: Click on the ArcMap Save button.
4 Issue: A "Catastrophic Error" has occurred.
Cause: If an "Edit Session" is open when FIT is running, it will cause a conflict.
Solution: Close the "Edit Session" by selecting Stop Editing from the ArcMap Editor toolbar before running FIT.
5 Issue: Some of the layers disappear from view during a FIT analysis.
Cause: ArcMap is interrupted by clicking some button before it finishes refreshing.
Solution: Click the Refresh View button in ArcMap.
6 Issue:
Cause: There is a file sharing error. The FIT is attempting to save a grid dataset, but another application is claiming ownership or the grid has read-only permission.
Solution: •
•
•
Close ArcMap.
In Windows Explorer and ArcCatalog, ensure that no folders are open within the FIT working directory.
Open the Windows Task Manager and click on the Processes tab. Click on the “Image Name” field twice so that the application names are sorted in ascending
Flood Information Tool User Manual C-2 Revision 7

Appendix C Troubleshooting Guide
order. If ArcMap.exe appears in the list, select it and click the “End Process” button.
• Open the ArcMap document and re-start the process that generated the error message.
7 Issue:
This message appears when the shoreline is definitely not seaward of mean sea level.
Cause: Bug with ArcMap’s identify tool.
Solution: Save and close ArcMap. Re-open ArcMap and continue with the Shoreline Wizard.
8 Issue: The flood depth grid exists only along the stream centerline and cross-sections.
Cause: Unknown.
Solution: Re-run the Depth Grid Wizard.
Flood Information Tool User Manual C-3 Revision 7

Index
Index
1
100-year flood, 1-8, 2-57 100-year stillwater elevation, 1-8, 2-59
A
About FIT, 2-3 analysis boundary, 1-8 Analysis Boundary Tab, 2-8, 2-21 Analysis Return Periods, 2-69
B
backlines, 2-33 Backwater Analysis, 2-4, 2-36 basin name, 2-10 beach name, 2-11 boundary, 1-1 Boundary X, 2-33 bounding polygon, 1-6 buffer, 1-6, 1-7, 2-30 Build 100-Yr Elevation Grid, 2-5, 2-45
C
calculate hazard grids, 2-6 Calculate Hazard Grids, 2-69 cell size, 2-14 centerline of flow, 1-6 coastal
Analysis Boundary Tab, 2-8, 2-21 Build 100-Yr Elevation Grid, 2-5, 2-45 Calculate Hazard Grids, 2-6, 2-69 Edit Transects, 2-5, 2-62 Flood Surface Tab, 2-15 Frontal Dune Analysis, 2-5, 2-65 General Tab, 2-5, 2-8, 2-10, 2-43 Ground Surface Tab, 2-12 hazard, 2-24 methodology, 1-8, 2-43 Shoreline Definition, 2-47 Shoreline Segment Characteristics, 2-56 Shoreline Wizard, 2-5, 2-47
community name, 2-20 copyright, 2-3
D
DEM, 1-6, 1-8, 2-29 depth, 1-1 depth, 2-37 depth grid, 2-3, 2-33, 2-70, 2-71 Depth Grid Wizard, 2-4, 2-25
Flood Elevation and Discharge Fields, 2-31 Flow Centerline Buffer, 2-29 Stream Limits, 2-25
Depth X, 2-33 discharge values, 1-7 downstream limit, 1-6, 2-29 dune erosion, 1-9, 2-65 Dune Peak, 2-67 dune toe, 2-5 Dune Toe, 2-67
E
Edit Transects, 2-5, 2-61, 2-62 elevation grid, 2-3, 2-5, 2-45, 2-71 elevation units, 2-12, 2-16 erosion, 2-58, 2-71
F
FEMA, 1-8 FIRM panel number, 2-19 FIS, 1-8, 2-60 FIT
coastal methodology, 1-8, 2-43 copyright, 2-3 key functionality, 1-5 output, 1-1 riverine methodology, 1-6 schematic, 1-1 start, 2-1 version, 2-3
FIT Help, 2-3 flood depth, 1-5, 1-6, 1-8, 1-9, 2-70 flood discharge, 2-31, 2-32 flood elevation, 1-5, 1-7, 2-15, 2-31, 2-32, 2-
37, 2-45 flood extent, 2-38 flood flow, 1-6
Flood Information Tool User Manual Index-1 Revision 7

Index
Flood Information Tool, 1-1, 1-2, 2-2, 2-5, 2-7, 2-25, 2-36, 2-41, 2-43, 2-45, 2-62, 2-71
flood source, 1-8, 1-9 Flood Surface Tab, 2-8, 2-15 flood surfaces, 1-8 flood-induced erosion, 1-8, 2-58, 2-62, 2-67, 2-
70, 2-71 floodplain, 1-1, 1-6, 1-7 floodplain boundary, 1-6, 2-29, 2-33, 2-37 Floodplain Boundary Tab, 2-8, 2-19 Flow Centerline Buffer, 2-29, 2-32 frontal dune, 2-62 Frontal Dune Analysis, 2-5, 2-65 frontal dune erosion, 1-9 frontal dune peak, 2-65 frontal dune toe, 2-65
G
General Tab, 2-5, 2-7, 2-8, 2-9, 2-43 Great Lakes, 1-8, 2-8, 2-11, 2-48 ground elevation, 1-9, 2-70 Ground Surface Tab, 2-7, 2-8, 2-12
H
hazard, 1-1, 1-8, 2-9, 2-71 coastal, 2-5, 2-10, 2-21, 2-24, 2-43, 2-45 riverine, 2-4, 2-7, 2-10, 2-19, 2-24, 2-25
HAZUS Flood Model, 1-1, 1-2, 1-6, 2-71 HAZUS-FIT
About FIT, 2-3 FIT Help, 2-3 Merge FIT Projects, 2-3 Project Setup and Validation, 2-3
I
interpolate, 1-9 Interpolate New Depth Grid, 2-4, 2-41 interpolation, 1-7
M
map layer, 2-12, 2-15, 2-19, 2-21 map units, 1-2, 2-23 maximum flood elevation, 2-37 menu, 2-1, 2-4, 2-25
Coastal, 2-5, 2-43, 2-45, 2-47, 2-62, 2-65, 2-69
HAZUS_FIT, 2-7, 2-71 Riverine, 2-4, 2-25, 2-32, 2-36
Merge FIT Projects, 1-7, 1-9, 2-3, 2-71 methodology, 1-6, 1-8 minimum flood elevation, 2-37 modeling tips, 1-7, 1-9
N
non-conveyance areas, 1-7
O
online help, 2-3 output hazard grids, 1-9
P
peak, 2-5 ponding, 1-7 profile, 1-9 Project Setup and Validation, 1-7, 1-9, 2-3, 2-7
Analysis Boundary Tab, 2-8 Flood Surface Tab, 2-8 Floodplain Boundary Tab, 2-8 General Tab, 2-7, 2-8 Ground Surface Tab, 2-7, 2-8
projection, 1-2, 2-14, 2-18
R
reach, 1-7 reach name, 2-10 required data missing, 2-23 return period, 1-8, 2-25, 2-31, 2-32, 2-57, 2-59 riverine
analysis, 2-4, 2-25 Backwater Analysis, 2-4, 2-36 Depth Grid Wizard, 2-4, 2-25 Flood Surface Tab, 2-15 Floodplain Boundary Tab, 2-8, 2-19 General Tab, 2-7, 2-10 Ground Surface Tab, 2-12 hazard, 2-7, 2-24 Interpolate New Depth Grid, 2-4, 2-41 menu, 2-4, 2-25, 2-32, 2-36, 2-41 methodology, 1-6
S
select hazard, 2-9
Flood Information Tool User Manual Index-2 Revision 7

Index
Set Threshold, 2-33 shapefiles, 1-8 shoreline, 2-47 shoreline characterization, 1-8 Shoreline Definition, 2-47 Shoreline Segment Characteristics, 2-56, 2-65
Shoreline Type Tab, 2-57 Stillwater Elevations Tab, 2-59
Shoreline Segments, 2-54 shoreline type, 1-8, 2-57, 2-58 Shoreline Wizard, 1-9, 2-5, 2-47, 2-62
Shoreline Definition, 2-47 Shoreline Segment Characteristics, 2-56 Shoreline Segments, 2-54
source, 2-14, 2-18, 2-19, 2-21 stillwater elevation, 2-57, 2-67 Stream Limits, 2-26, 2-31 study area, 2-10, 2-11
T
tidal area, 1-8 transect, 1-8, 2-5, 2-54, 2-70 Transect Editor, 2-62
U
upstream limit, 1-6, 2-26
V
vertical datum, 2-13, 2-16
W
wave setup, 1-8, 2-60 working directory, 2-10, 2-11
Flood Information Tool User Manual Index-3 Revision 7


