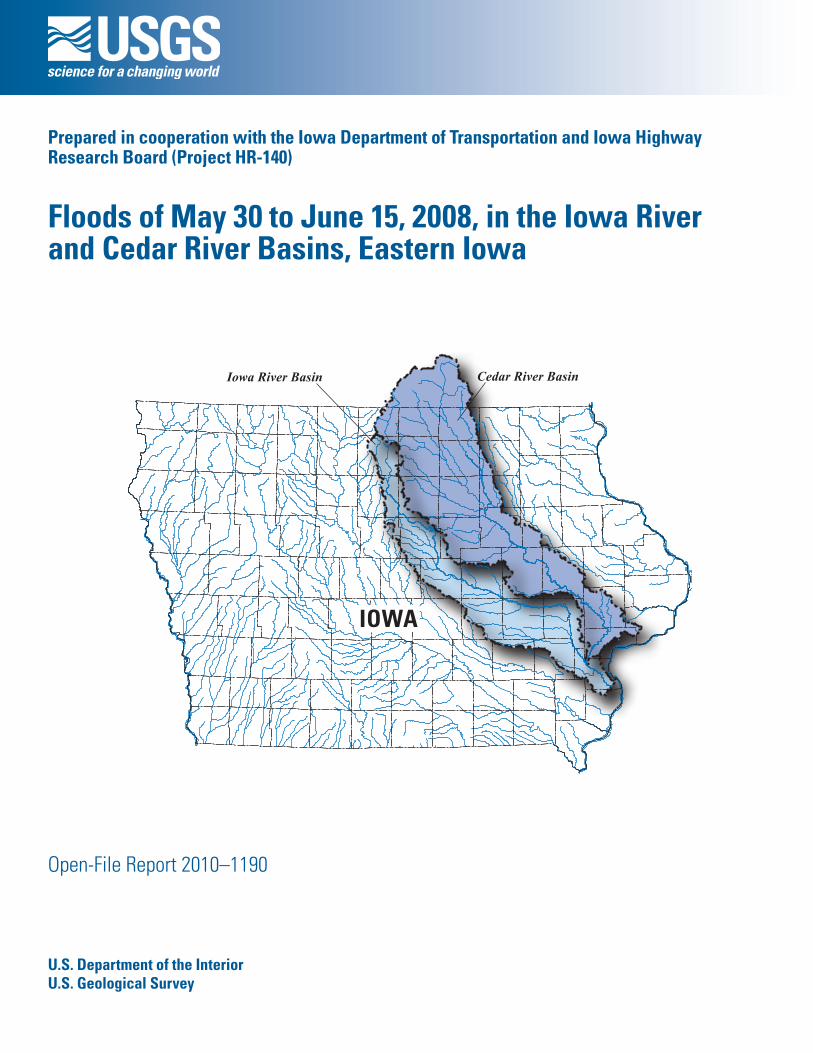
U.S. Department of the Interior U.S. Geological Survey Open-File Report 2010–1190 Prepared in cooperation with the Iowa Department of Transportation and Iowa Highway Research Board (Project HR-140) Floods of May 30 to June 15, 2008, in the Iowa River and Cedar River Basins, Eastern Iowa Iowa River Basin Cedar River Basin IOWA
Transcript
U.S. Department of the InteriorU.S. Geological Survey
Open-File Report 2010–1190
Prepared in cooperation with the Iowa Department of Transportation and Iowa Highway Research Board (Project HR-140)
Floods of May 30 to June 15, 2008, in the Iowa River and Cedar River Basins, Eastern Iowa
Iowa River Basin Cedar River Basin
IOWA
Floods of May 30 to June 15, 2008, in the Iowa River and Cedar River Basins, Eastern Iowa
By S. Mike Linhart and David A. Eash
Prepared in cooperation with the Iowa Department of Transportation and Iowa Highway Research Board (Project HR-140)
Open-File Report 2010–1190
U.S. Department of the InteriorU.S. Geological Survey
U.S. Department of the InteriorKEN SALAZAR, Secretary
U.S. Geological SurveyMarcia McNutt, Director
U.S. Geological Survey, Reston, Virginia: 2010
For more information on the USGS—the Federal source for science about the Earth, its natural and living resources, natural hazards, and the environment, visit http://www.usgs.gov or call 1-888-ASK-USGS
For an overview of USGS information products, including maps, imagery, and publications, visit http://www.usgs.gov/pubprod
To order this and other USGS information products, visit http://store.usgs.gov
Any use of trade, product, or firm names is for descriptive purposes only and does not imply endorsement by the U.S. Government.
Although this report is in the public domain, permission must be secured from the individual copyright owners to reproduce any copyrighted materials contained within this report.
Suggested citation:Linhart, S.M., and Eash, D.A., 2010, Floods of May 30 to June 15, 2008, in the Iowa and Cedar River basins, eastern Iowa: U.S. Geological Survey Open-File Report 2010–1190, 99 p. with Appendixes.
ISBN 978-1-4113-2962-1
iii
Acknowledgments
The authors express their gratitude to the following: Federal Emergency Management Agency (FEMA), U.S. Army Corps of Engineers (USACE), Muscatine County Engineers Office, and the City of Iowa City for providing additional high-water marks for the June 2008 flood along the Iowa and Cedar Rivers; Terry Morse, Iowa Department of Transportation, Dennis Michael with the Louisa County Engineers Office, and the Linn County Engineers Office for providing elevation data for temporary bench marks at bridges; Harry Hillaker, State Climatologist, Iowa Depart-ment of Agriculture and Land Stewardship, for providing an isohyetal map of rainfall for the 16-day period ending 7:00 a.m. on June 13, 2008; Bonnie Shepard, National Flood Insurance Program Bureau and Statistical Agent, Federal Emergency Management Agency, for providing private property damage claims for 26 counties in Iowa and 2 counties in Minnesota; and Dennis Harper, State Hazard Mitigation Officer, Iowa Homeland Security and Emergency Management Division, for providing public assistance project costs for 26 counties in Iowa. The authors also express gratitude to the following U.S. Geological Survey employees: Ed Fischer, George Frye, Mike Holt, Kasey Hutchinson, Jon Nania, Phil Soenksen, Seth Studley, Kevin Townsend, and Clint Van Schepen for collecting field data for the determination of water-surface and bench-mark elevations listed in this report; Rochelle Galer for preparing the maps of the Iowa River and Cedar River Basins; and Kaylene Carney for obtaining newspaper articles for the compilation flood description information.
Purpose and Scope ..............................................................................................................................4Study Area..............................................................................................................................................4
Floods of May 30 to June 15, 2008 ...............................................................................................................9Flood Probability....................................................................................................................................9Storm Description ...............................................................................................................................10Flood Description ................................................................................................................................14
Iowa River Basin ........................................................................................................................17Cedar River Basin ......................................................................................................................24
Flood Runoff .........................................................................................................................................25Chronology of Flood Impacts ............................................................................................................25
Flood Profile ..................................................................................................................................................28Summary........................................................................................................................................................29References Cited..........................................................................................................................................29Figures 12–39 ................................................................................................................................................33Tables 3, 7, and 8 ..........................................................................................................................................63Appendix 1. Flood History of Iowa River and Cedar River Basins .......................................................79
Flood of June 1851 ..............................................................................................................................80Flood of July 1881 ................................................................................................................................80Flood of June 1918 ..............................................................................................................................80Flood of March 1929 ...........................................................................................................................81Flood of March 1933 ...........................................................................................................................81
iv
Flood of June 1947 ..............................................................................................................................81Flood of June 1951 ..............................................................................................................................81Flood of June 1954 ..............................................................................................................................81Flood of March and April 1961 ..........................................................................................................82Flood of July 1969 ................................................................................................................................82Flood of 1993 ........................................................................................................................................82Flood of July 1999 ................................................................................................................................83Flood of June 2002 ..............................................................................................................................83Comparison of the 2008 flood with the 1993 flood and other significant historical floods .....83
Appendix 2. List of bench marks and reference points .........................................................................85
Figures
1. Map showing Iowa River Basin and lines of equal rainfall for 16 days beginning at 7:00 a.m. on May 29 and ending at 7:00 a.m. on June 13, 2008. ........................................2
2. Map showing Cedar River Basin and lines of equal rainfall for 16 days beginning at 7:00 a.m. on May 29 and ending at 7:00 a.m. on June 13, 2008. .....................................................3
3. Map showing Iowa River and Cedar River Basins and landform regions of Iowa ............................................................................................................................................9
4. Graph showing annual peak discharge record for the streamgage 05454500 Iowa River at Iowa City, Iowa………......................................................................................12
5. Graph showing annual peak discharge record and 1-percent flood probability for the streamgage 05464500 Cedar River at Cedar Rapids, Iowa ......................................13
6. Graph showing four-hour cumulative rainfall for May 29 to June 13, 2008, at four rain gages in the Iowa River and Cedar River Basins. .................................................15
7. Graph showing discharge hydrographs for selected streamgages on the Iowa River upstream from the confluence with the Cedar River, May 29 to July 15, 2008. ................................................................................................................................18
8. Graph showing discharge hydrographs for selected streamgages on the Cedar River, May 29 to July 15, 2008.………. ........................................................................20
9. Graph showing discharge hydrographs of the streamgage 05454500 Iowa River at Iowa City, Iowa, October 1, 2007, to September 30, 2008, and October 1, 1992, to September 30, 1993 ................................................................................................................22
10. Graph showing discharge hydrographs of the streamgage 05464500 Cedar River at Cedar Rapids, Iowa, October 1, 2007, to September 30, 2008, and October 1, 1992, to September 30, 1993 ...................................................................................23
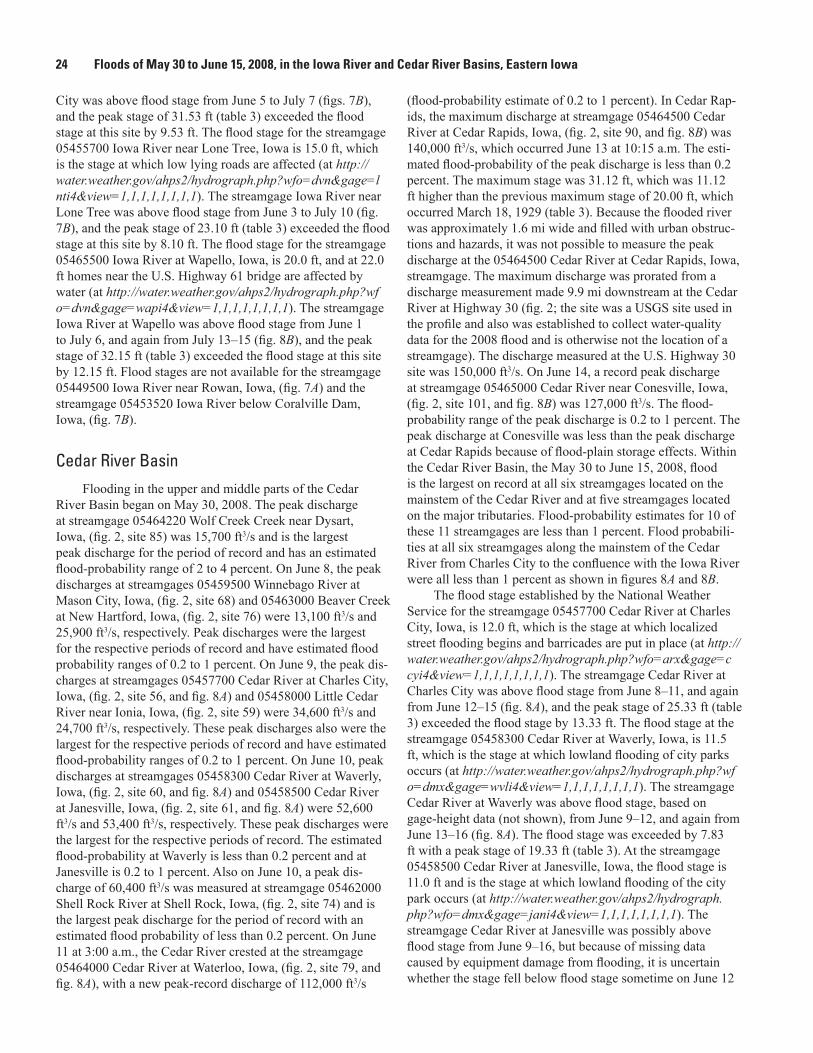
11. Graph showing relation between unit runoff values for the 2008 flood and drainage area for streamgages on the Iowa and Cedar Rivers. ..........................................................26
12. Graph showing profile of the June 2008 flood for the Iowa River, river miles 5.5 to 324.2 .........................................................................................................................34
13. Graph showing profile of the June 2008 flood for the Iowa River, river miles 5.5 to 30 ..............................................................................................................................35
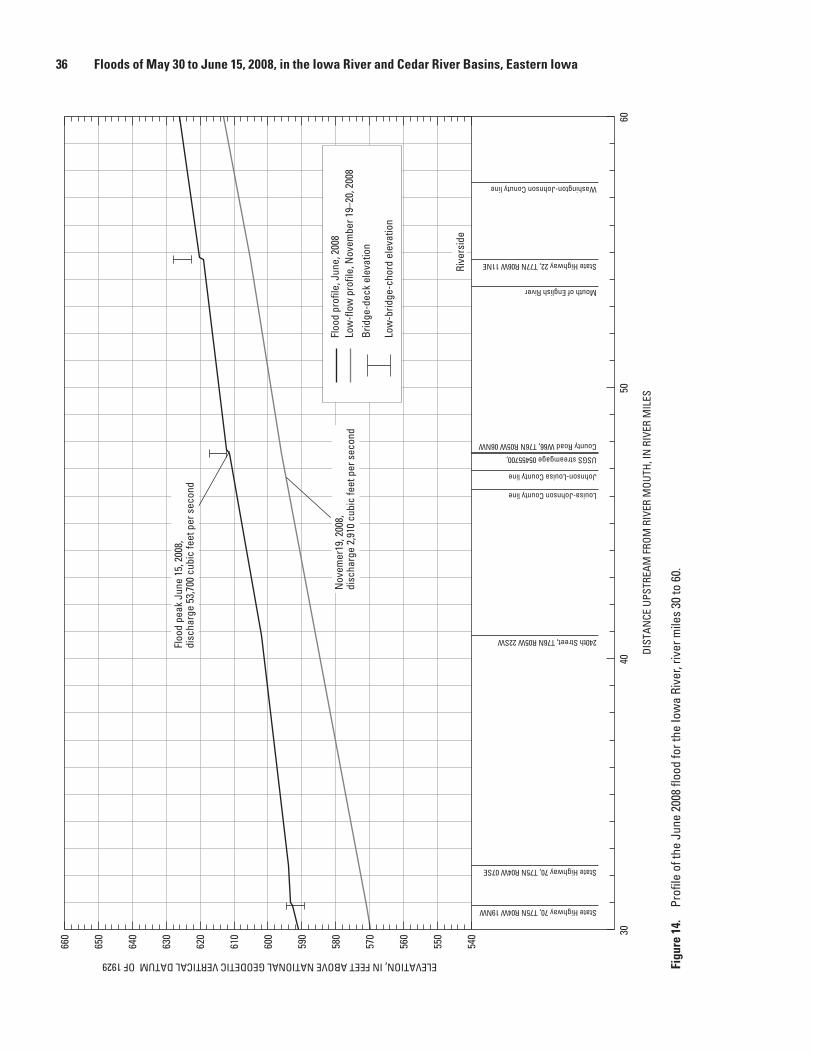
14. Graph showing profile of the June 2008 flood for the Iowa River, river miles 30 to 60 ...............................................................................................................................36
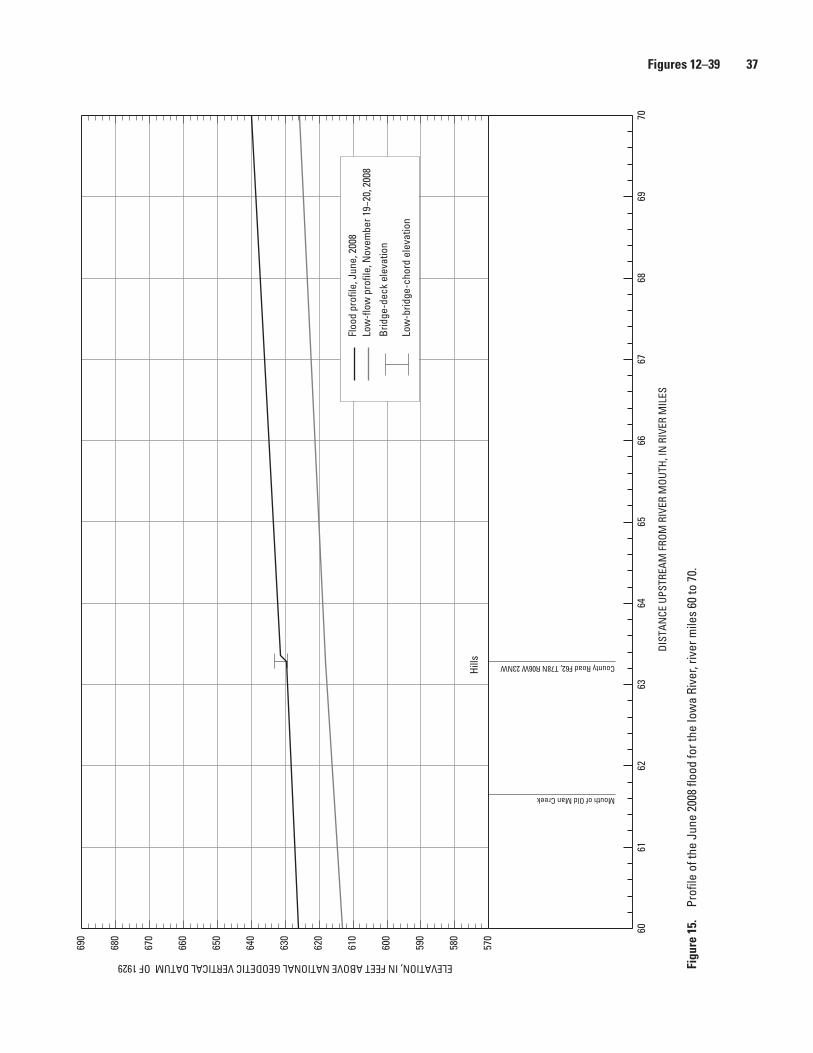
15. Graph showing profile of the June 2008 flood for the Iowa River, river miles 60 to 70 ...............................................................................................................................37
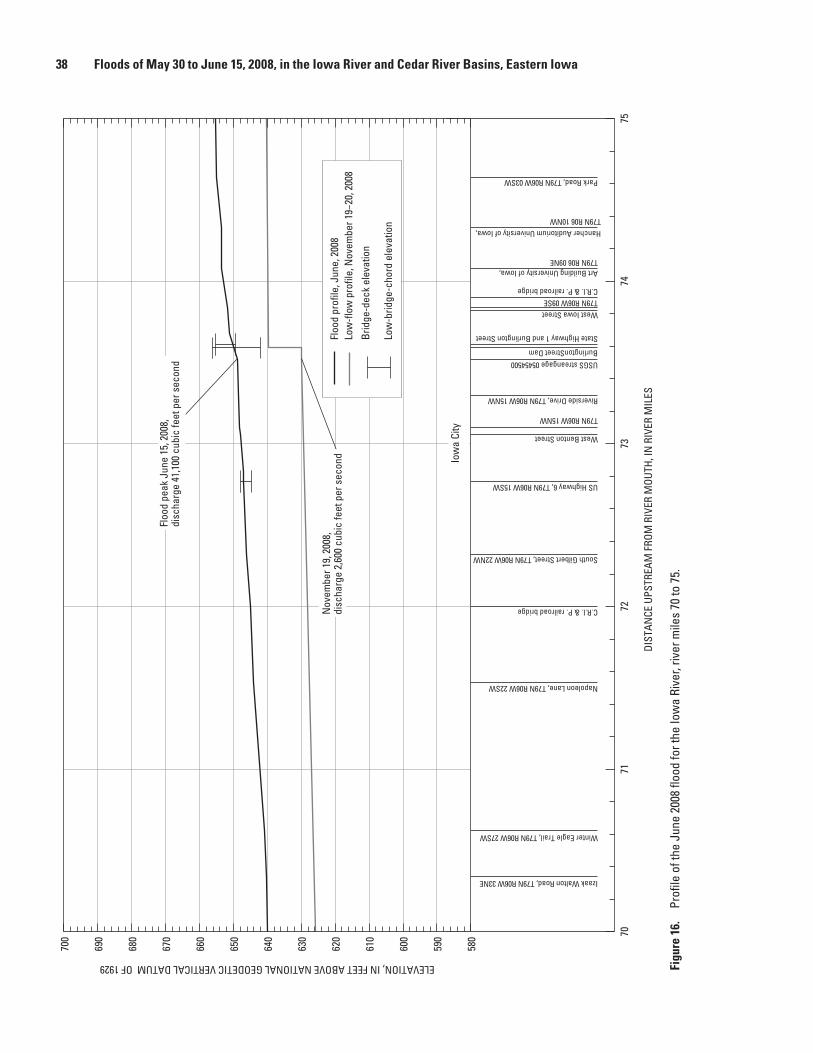
16. Graph showing profile of the June 2008 flood for the Iowa River, river miles 70 to 75 ...............................................................................................................................38
v
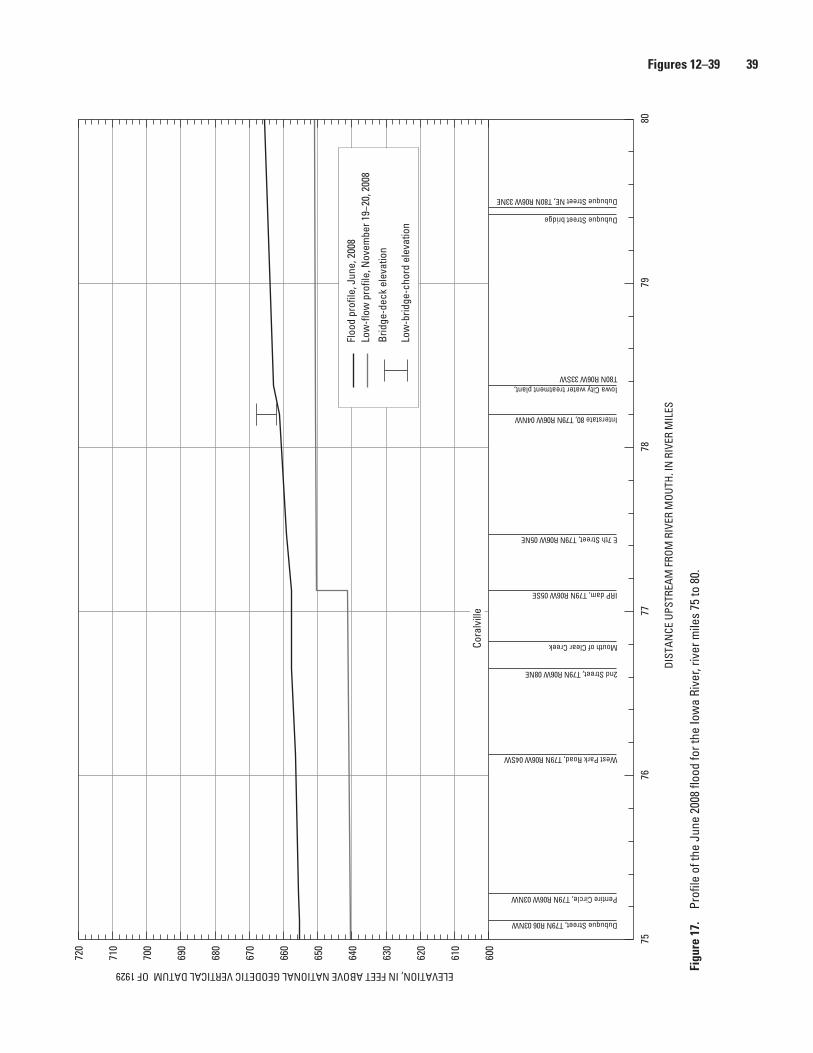
17. Graph showing profile of the June 2008 flood for the Iowa River, river miles 75 to 80 ...............................................................................................................................39
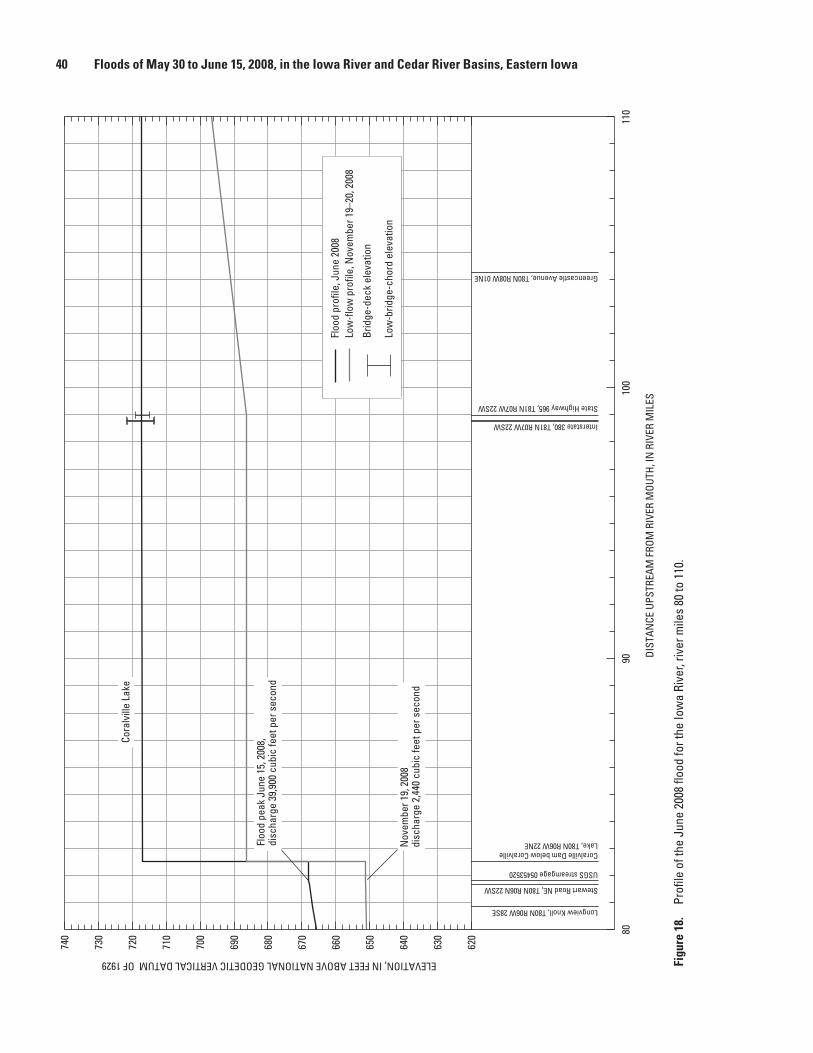
18. Graph showing profile of the June 2008 flood for the Iowa River, river miles 80 to 110 .............................................................................................................................40
19. Graph showing profile of the June 2008 flood for the Iowa River, river miles 110 to 140 ...........................................................................................................................41
20. Graph showing profile of the June 2008 flood for the Iowa River, river miles 140 to 170 ...........................................................................................................................42
21. Graph showing profile of the June 2008 flood for the Iowa River, river miles 170 to 200 ...........................................................................................................................43
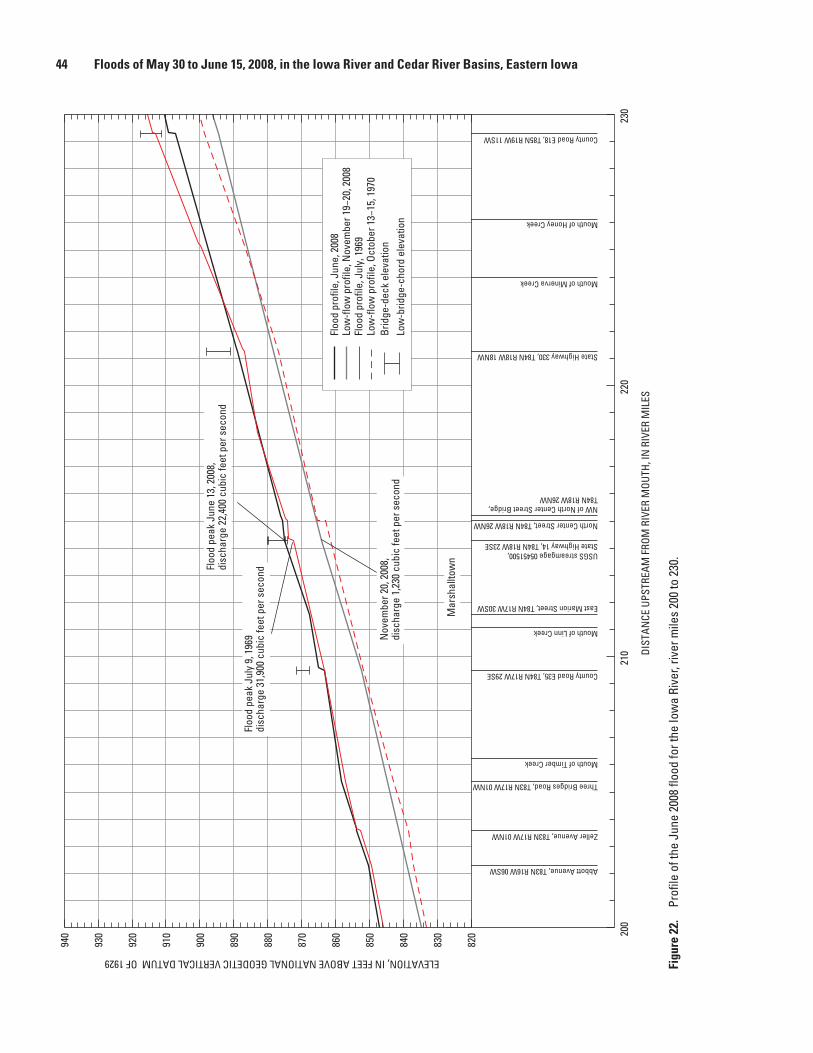
22. Graph showing profile of the June 2008 flood for the Iowa River, river miles 200 to 230 ...........................................................................................................................44
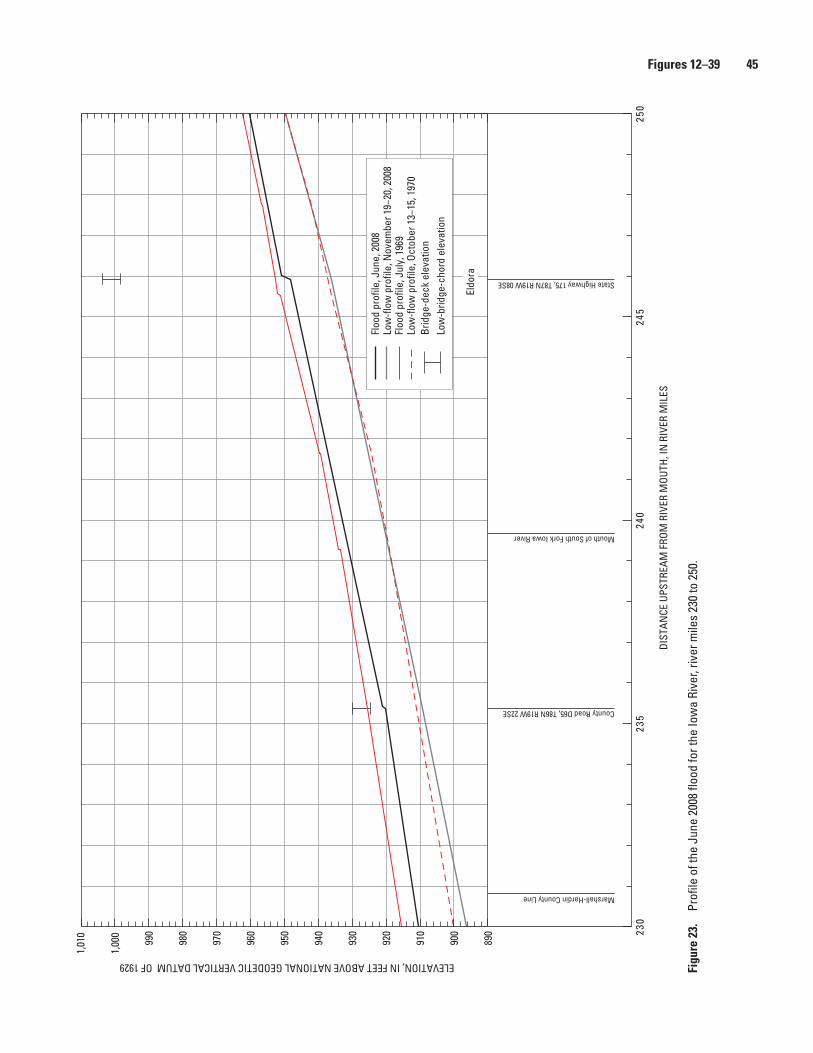
23. Graph showing profile of the June 2008 flood for the Iowa River, river miles 230 to 250 ...........................................................................................................................45
24. Graph showing profile of the June 2008 flood for the Iowa River, river miles 250 to 270 ...........................................................................................................................46
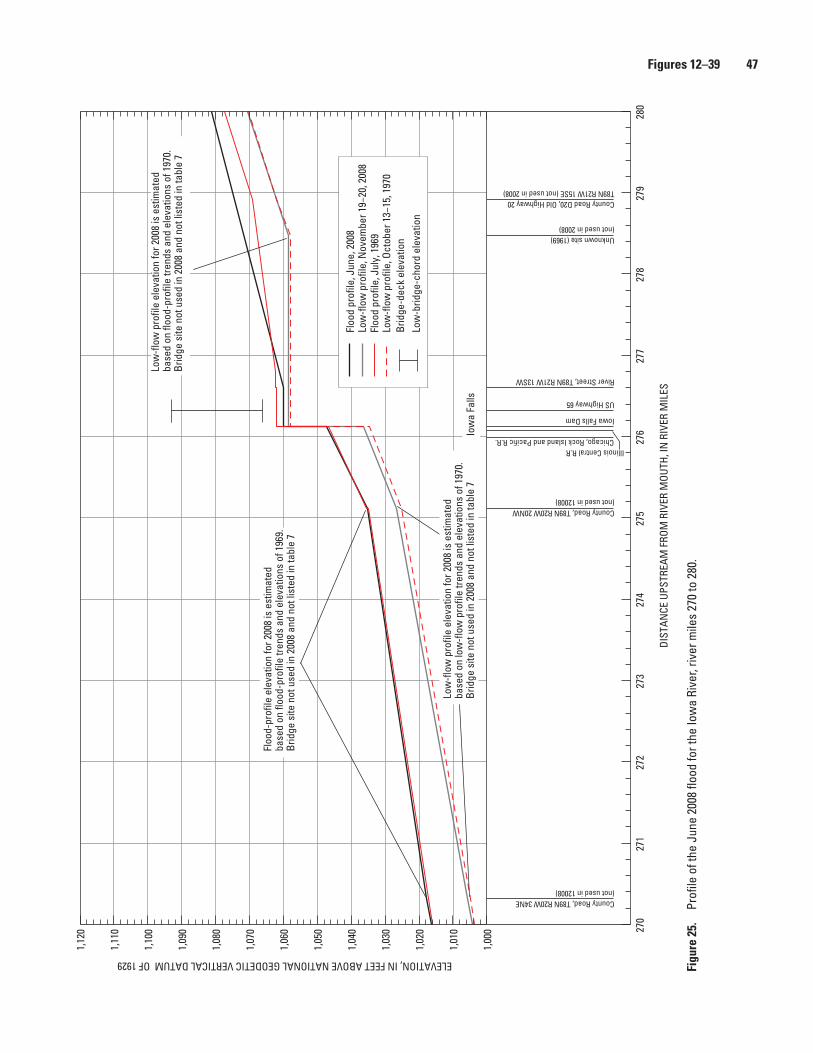
25. Graph showing profile of the June 2008 flood for the Iowa River, river miles 270 to 280 ...........................................................................................................................47
26. Graph showing profile of the June 2008 flood for the Iowa River, river miles 280 to 300 ...........................................................................................................................48
27. Graph showing profile of the June 2008 flood for the Iowa River, river miles 300 to 324.2 .......................................................................................................................49
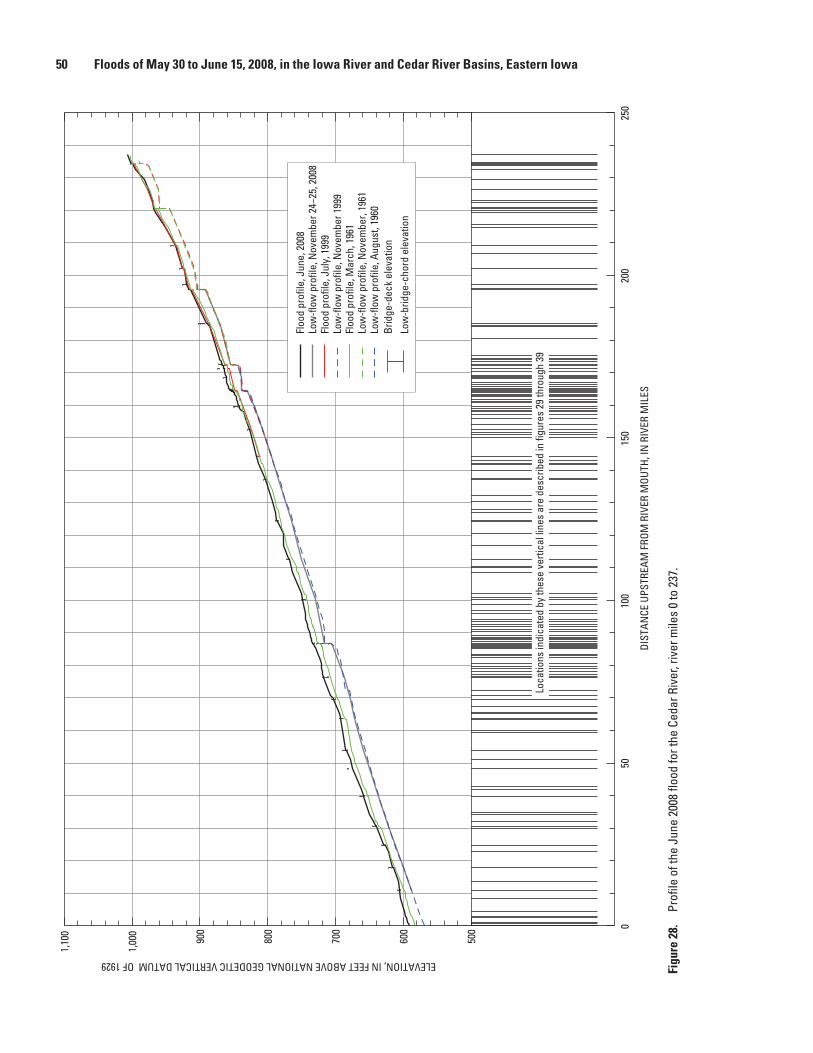
28. Graph showing profile of the June 2008 flood for the Cedar River, river miles 0 to 237 ...............................................................................................................................50
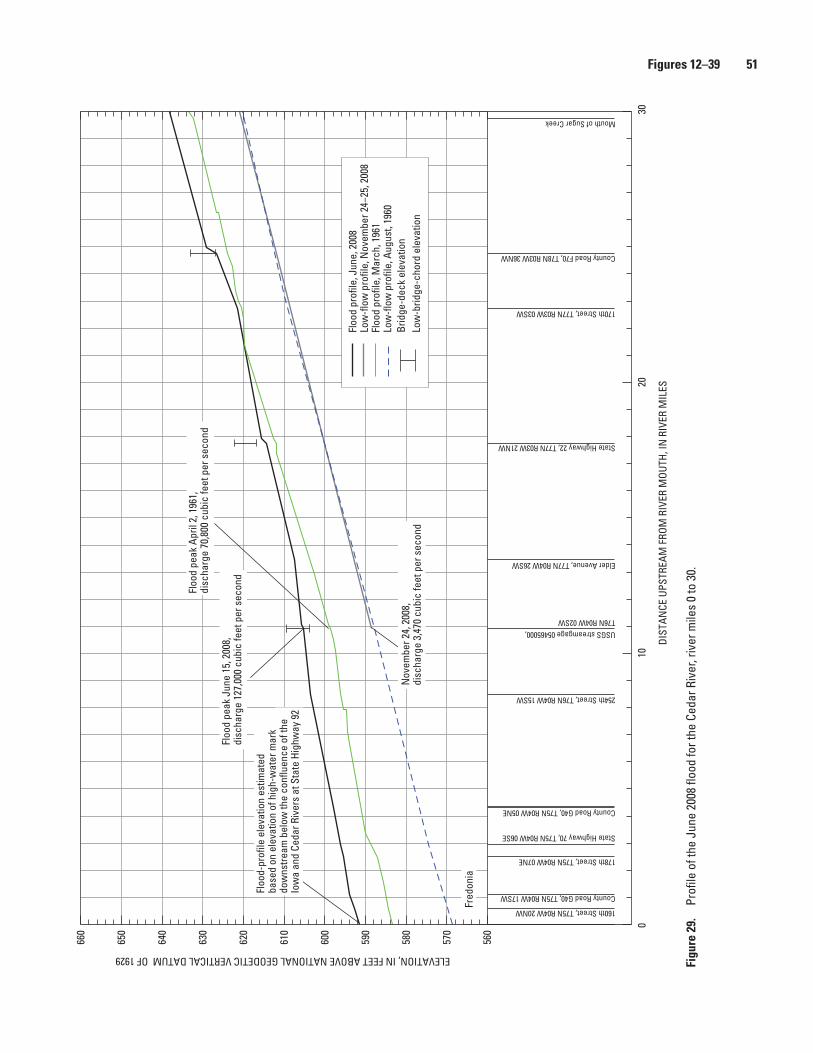
29. Graph showing profile of the June 2008 flood for the Cedar River, river miles 0 to 30 .................................................................................................................................51
30. Graph showing profile of the June 2008 flood for the Cedar River, river miles 30 to 60 ...............................................................................................................................52
31. Graph showing profile of the June 2008 flood for the Cedar River, river miles 60 to 75 ...............................................................................................................................53
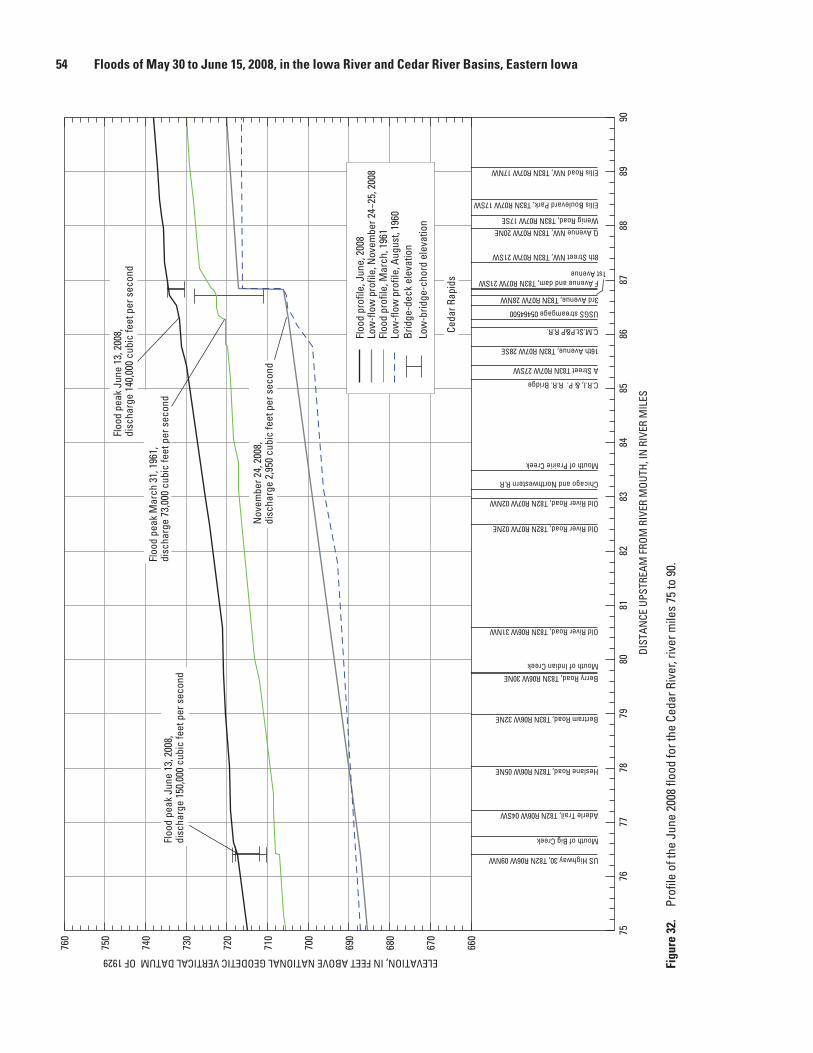
32. Graph showing profile of the June 2008 flood for the Cedar River, river miles 75 to 90 ..............................................................................................................................54
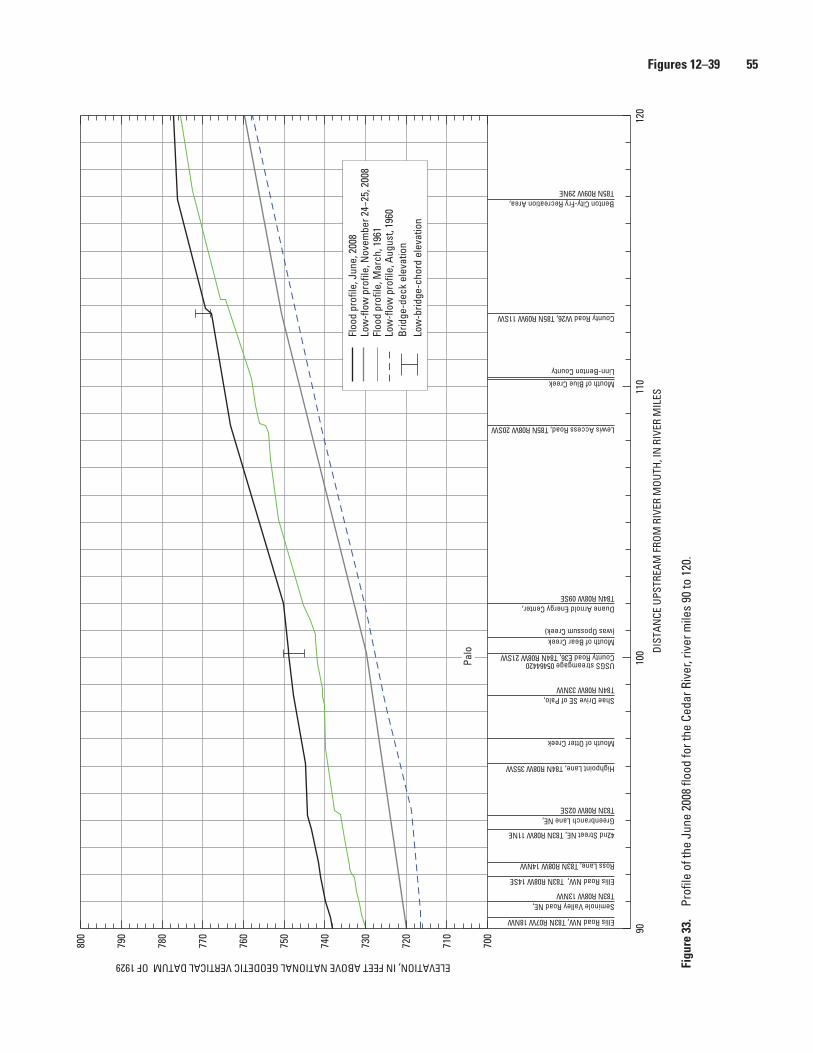
33. Graph showing profile of the June 2008 flood for the Cedar River, river miles 90 to 120 .............................................................................................................................55
34. Graph showing profile of the June 2008 flood for the Cedar River, river miles 120 to 150 ...........................................................................................................................56
35. Graph showing profile of the June 2008 flood for the Cedar River, river miles 150 to 160 ...........................................................................................................................57
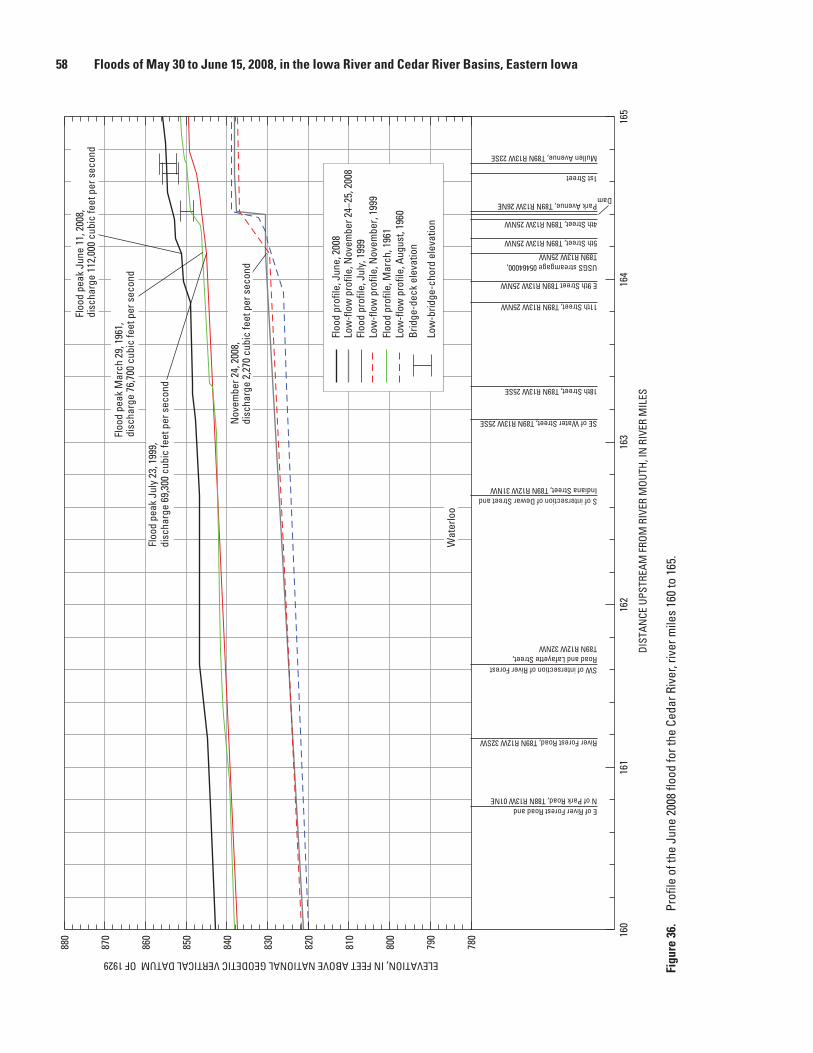
36. Graph showing profile of the June 2008 flood for the Cedar River, river miles 160 to 165 ...........................................................................................................................58
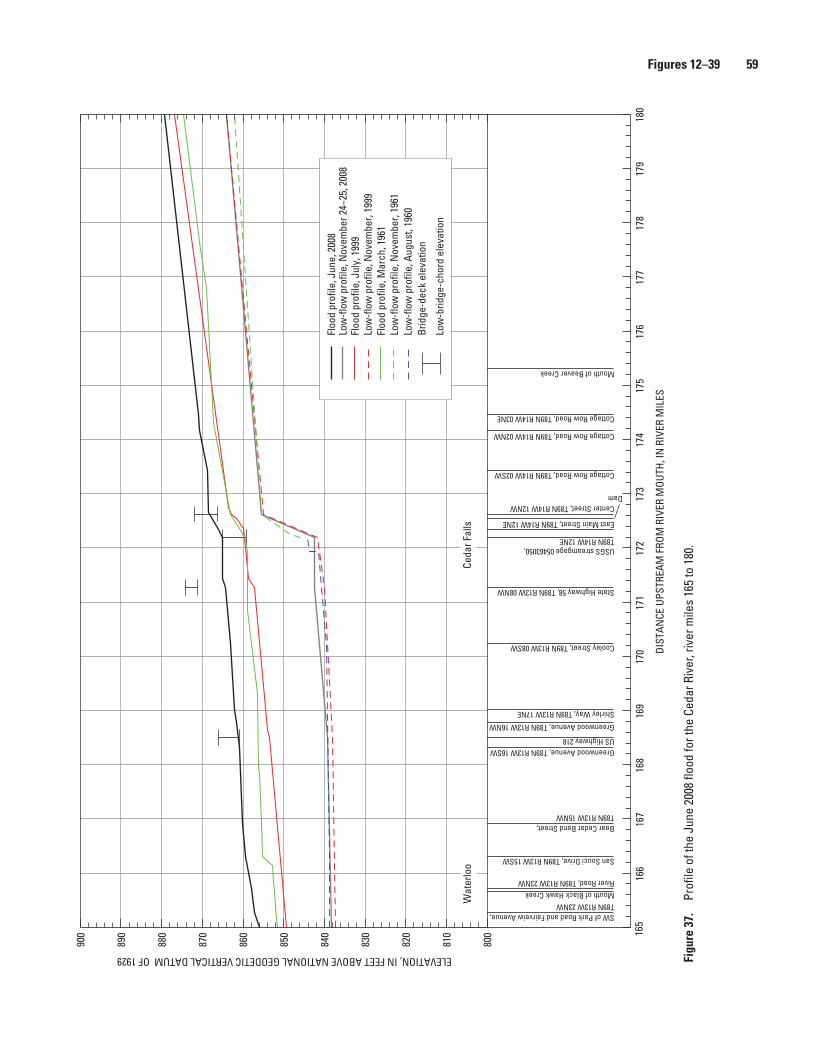
37. Graph showing profile of the June 2008 flood for the Cedar River, river miles 165 to 180 ...........................................................................................................................59
38. Graph showing profile of the June 2008 flood for the Cedar River, river miles 180 to 210 ...........................................................................................................................60
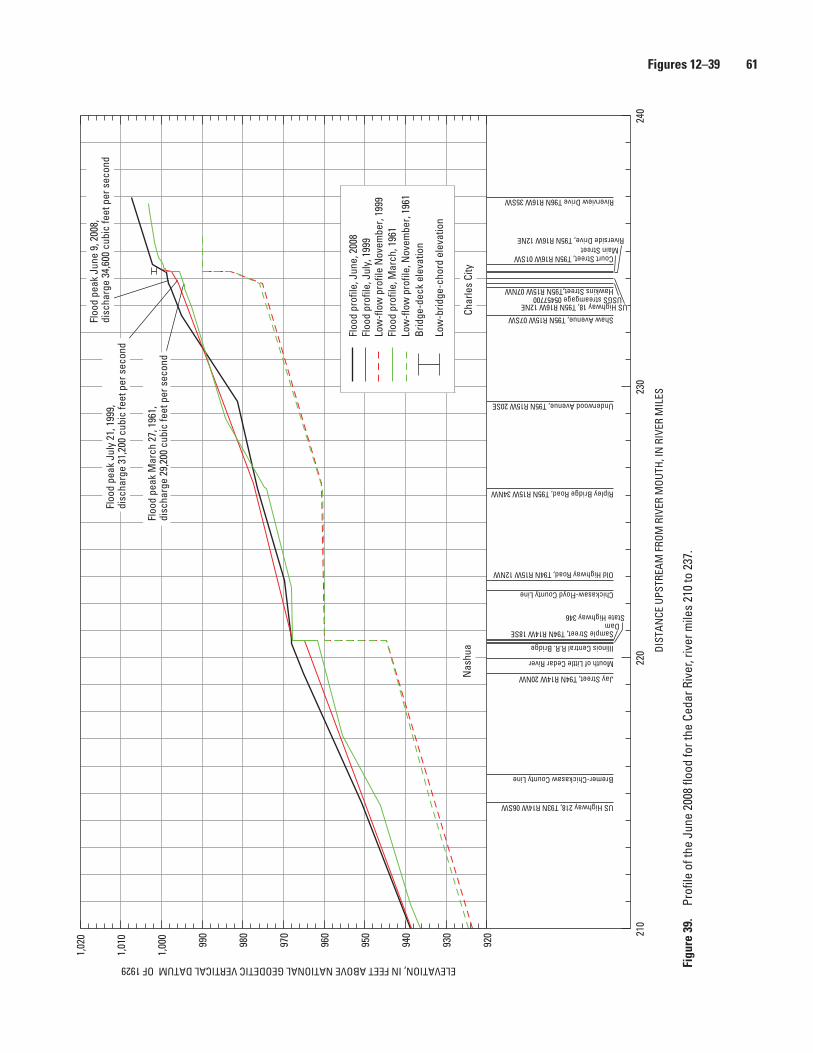
39. Graph showing profile of the June 2008 flood for the Cedar River, river miles 210 to 237 ...........................................................................................................................61
vi
Tables
1. National Flood Insurance Program Bureau and Statistical Agent Iowa and Minnesota loss report for selected counties, June 1–30, 2008, as of June 30, 2009 .............................6
2. Iowa Public Assistance Program project costs for selected counties for disaster number 1763, May–June 2008, as of August 24, 2009. ............................................................8
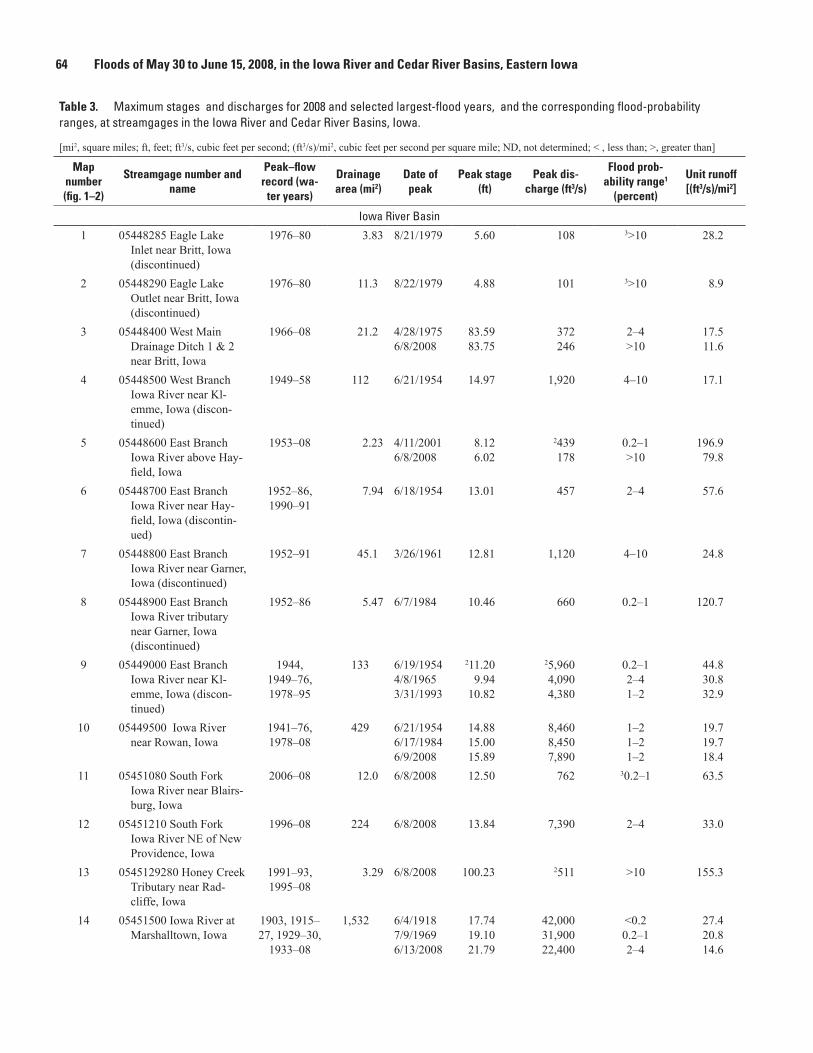
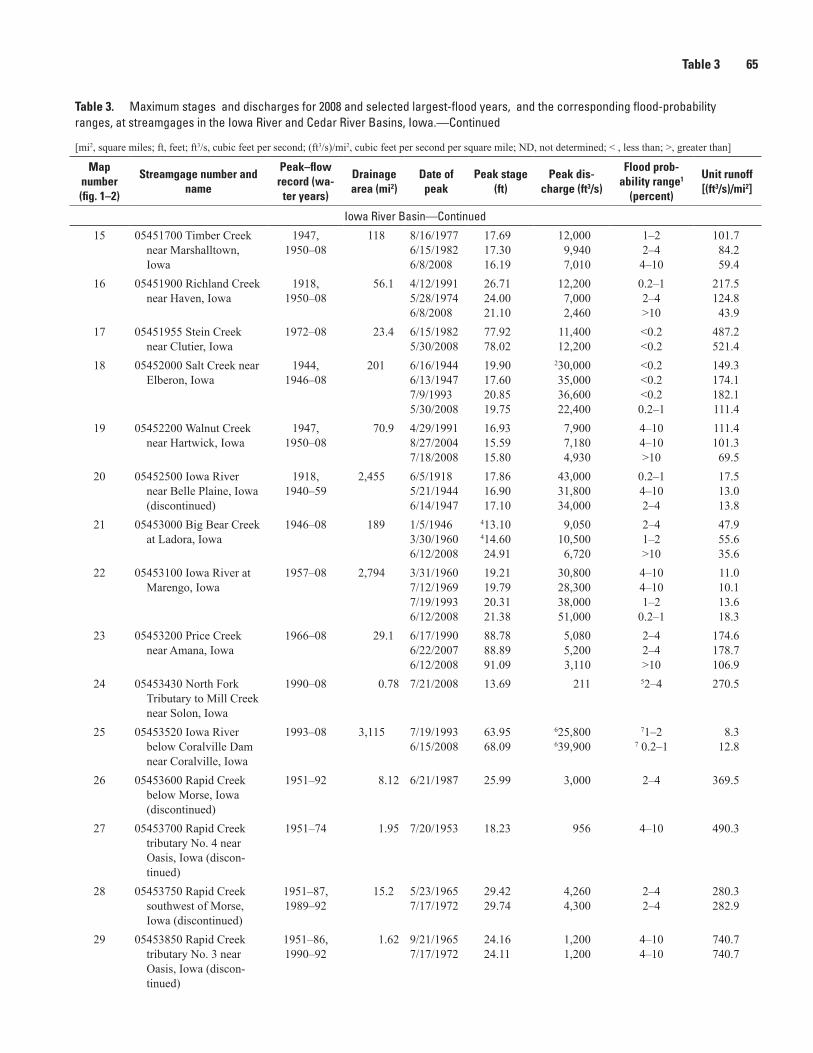
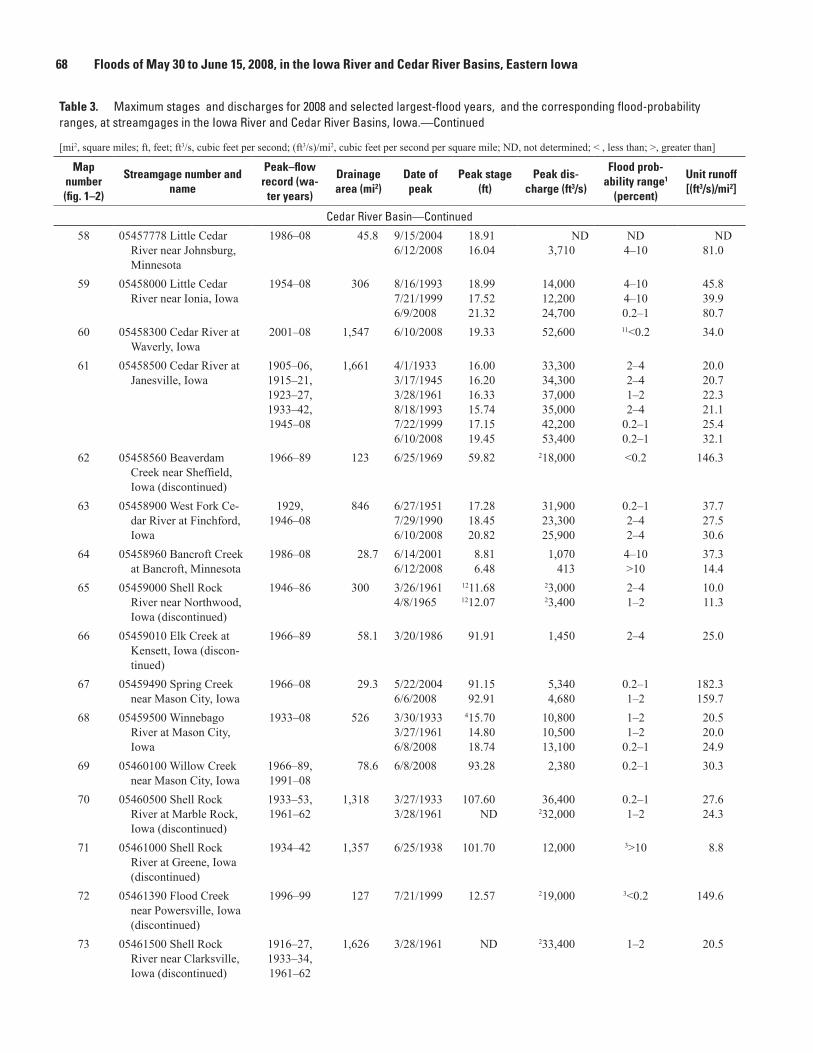
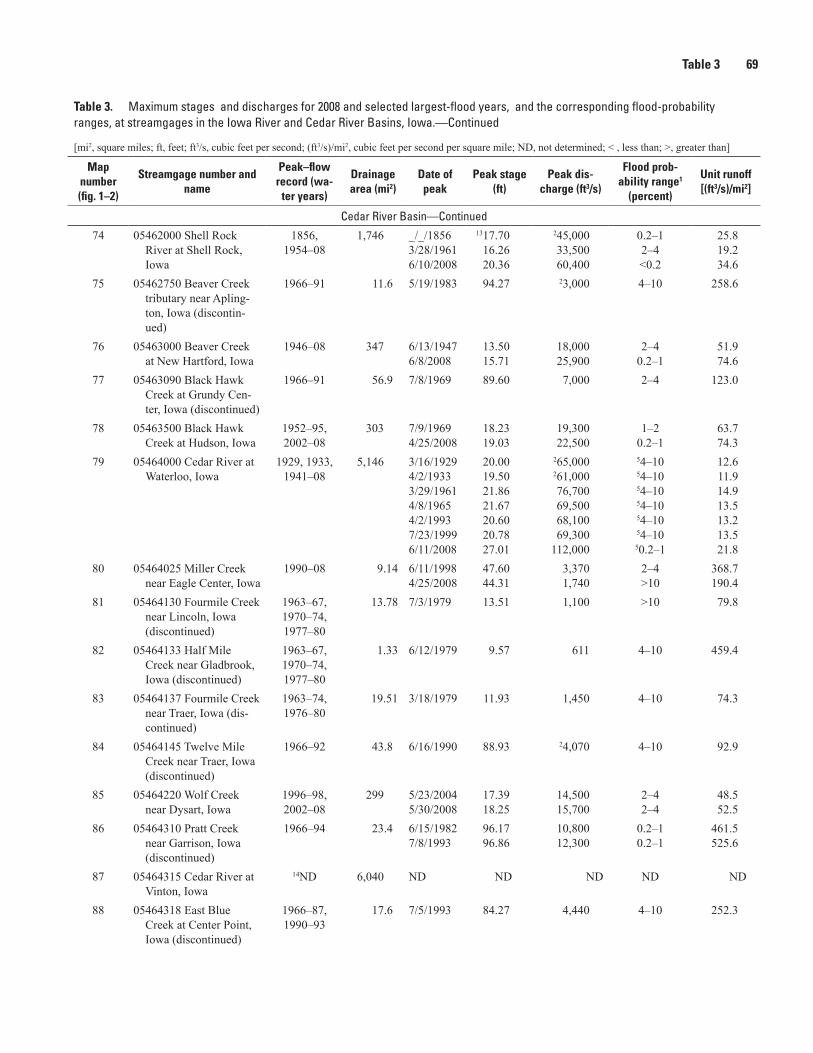
3. Maximum stages and discharges for 2008 and selected largest-flood years, and the corresponding flood-probability ranges, at streamgages in the Iowa River and Cedar River Basins, Iowa ......................................................................................................................64
4. Flood probability and equivalent flood recurrence intervals for selected probabilities .................................................................................................................................10
5. Twenty-four hour rainfall amounts at selected rain gages in eastern Iowa from May 29 to June 13, 2008............. ................................................................................................16
6. Magnitude and probability of theoretical rainfall amounts for selected storm periods in the North-Central, Central, East-Central, Northeast, and Southeast Iowa Climatological Divisions. ............................................................................................................17
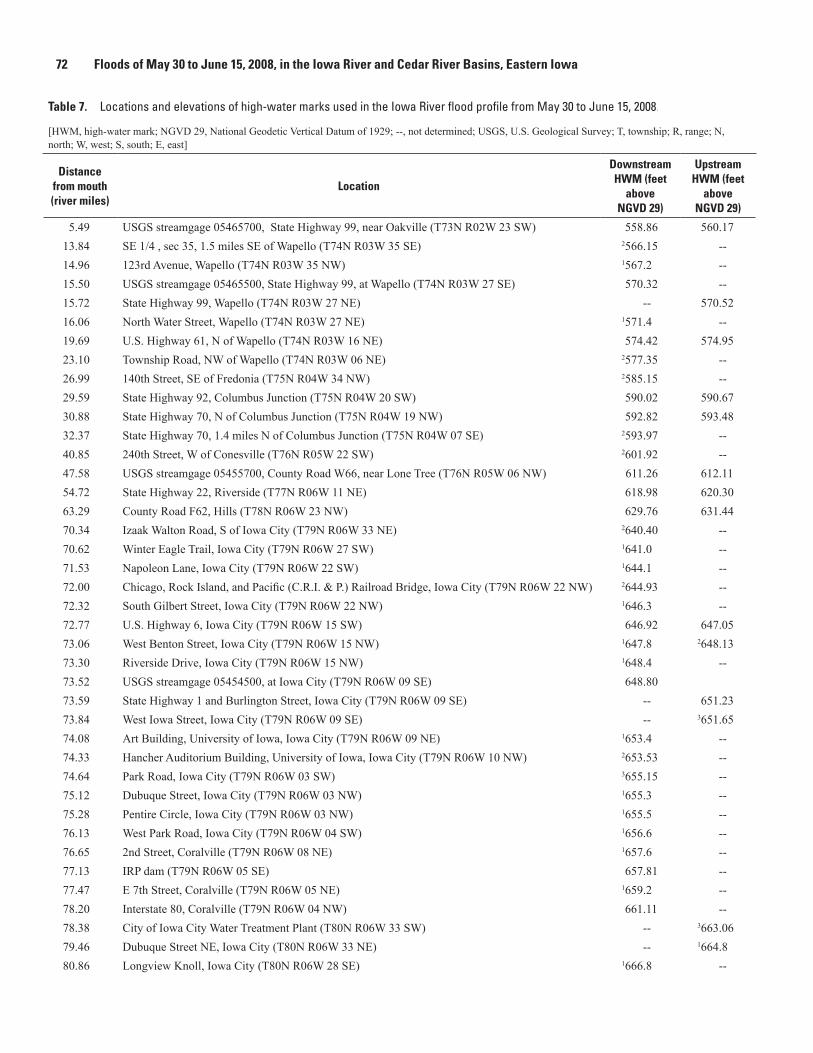
7. Locations and elevations of high-water marks used in the Iowa River flood profile from May 30 to June 15, 2008............. .......................................................................................72
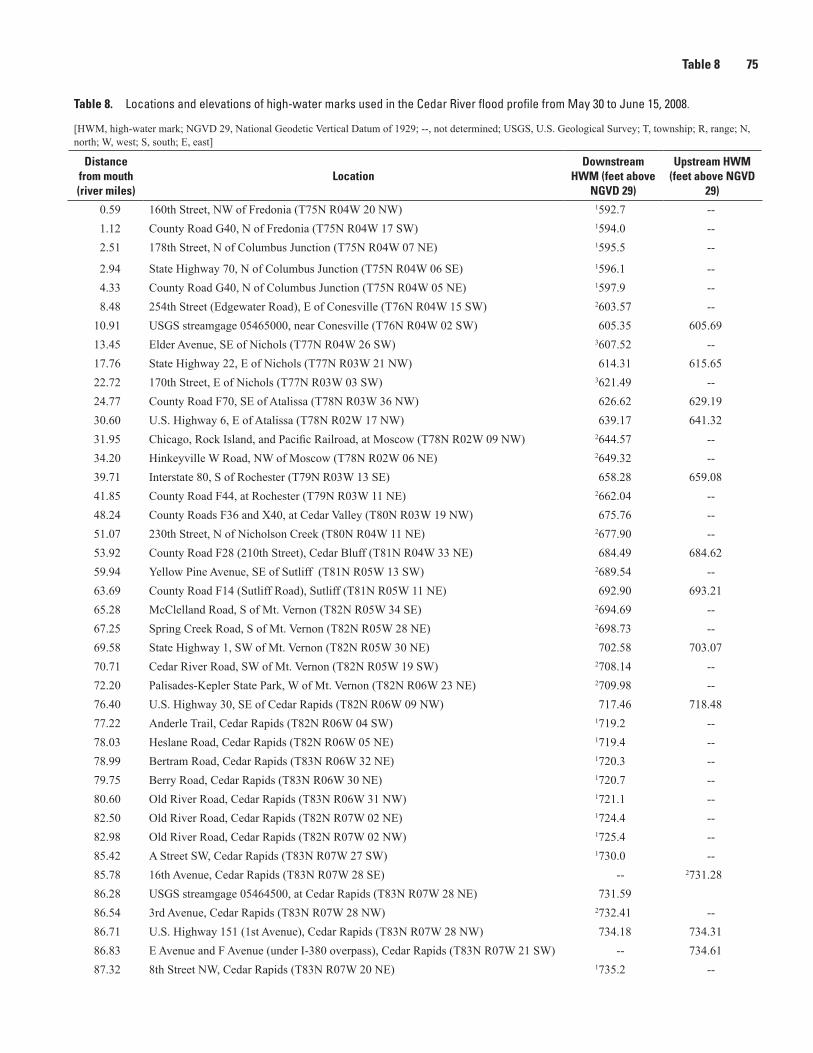
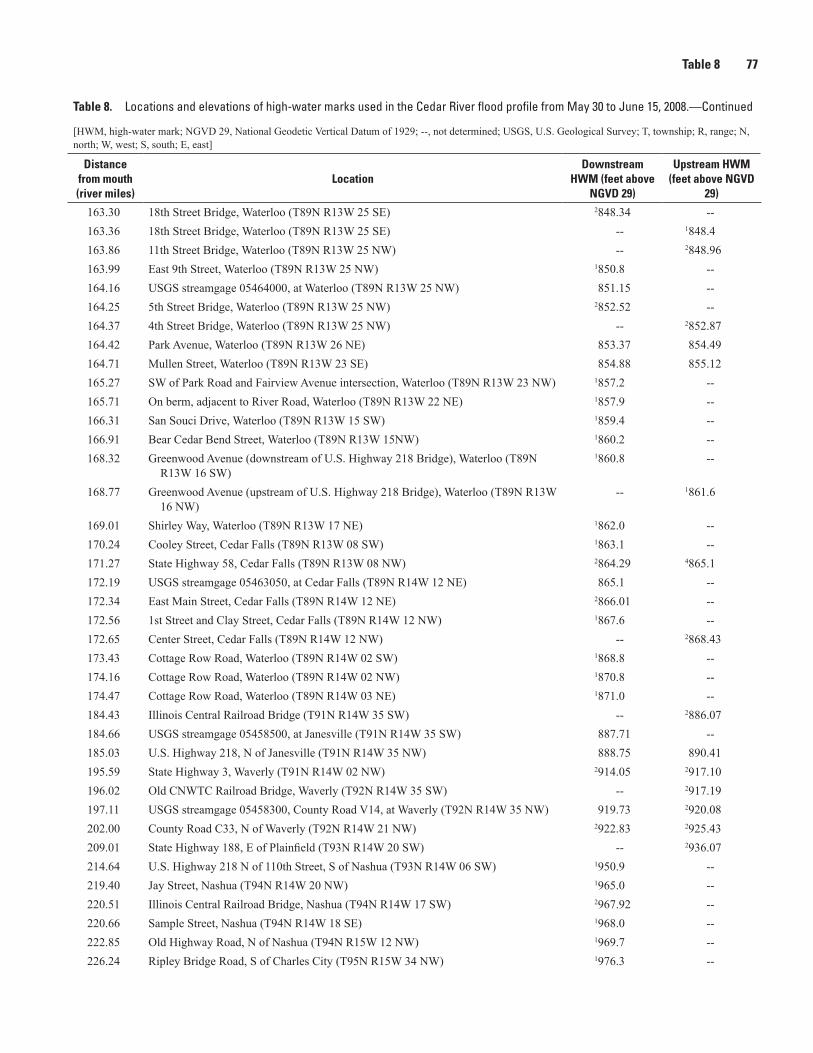
8. Locations and elevations of high-water marks used in the Cedar River flood profile from May 30 to June 15, 2008............. .......................................................................................75
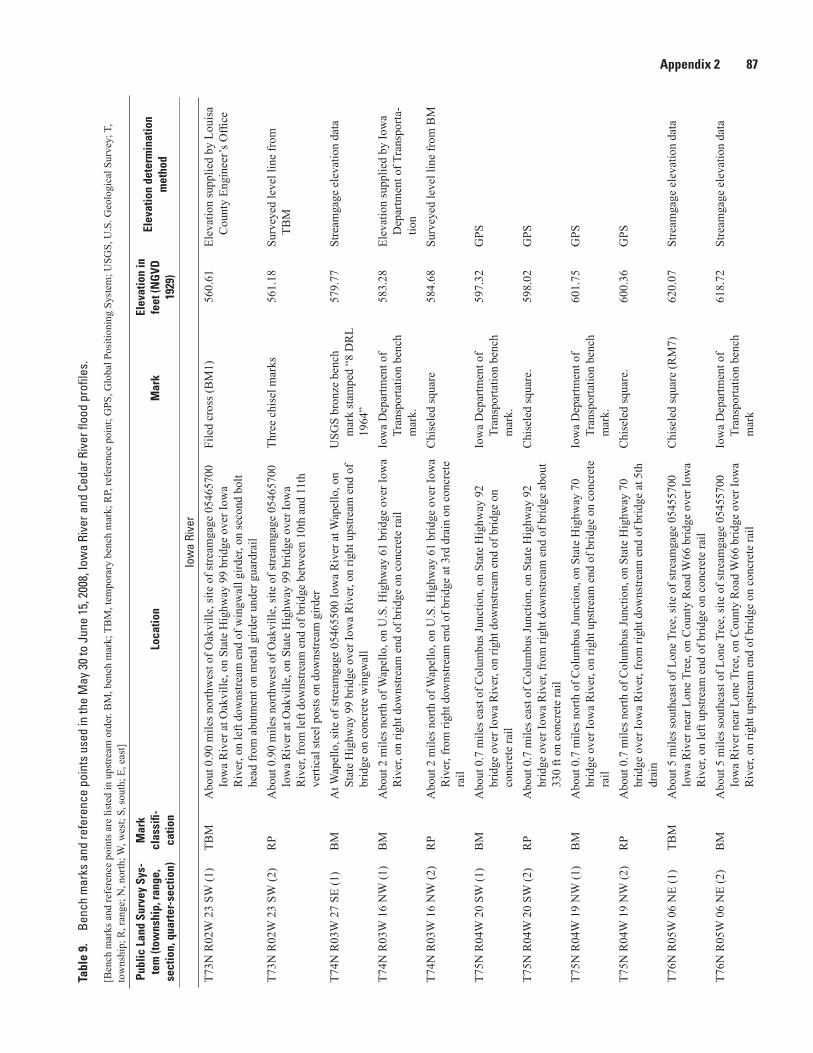
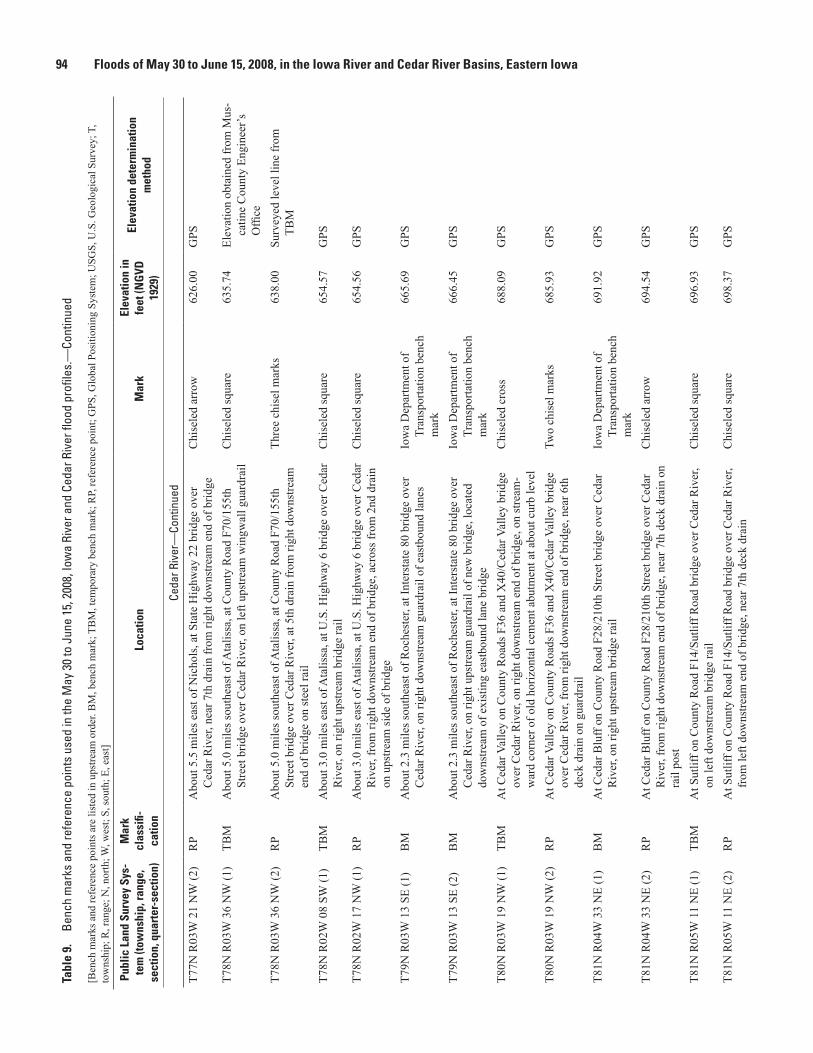
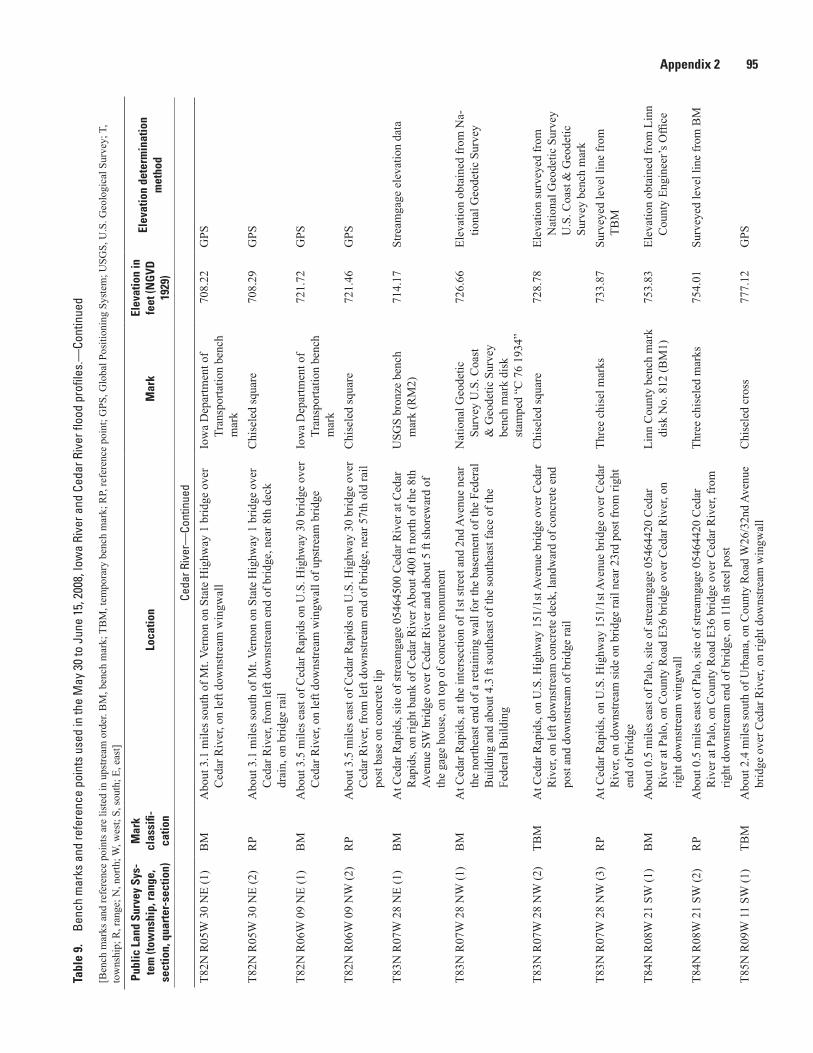
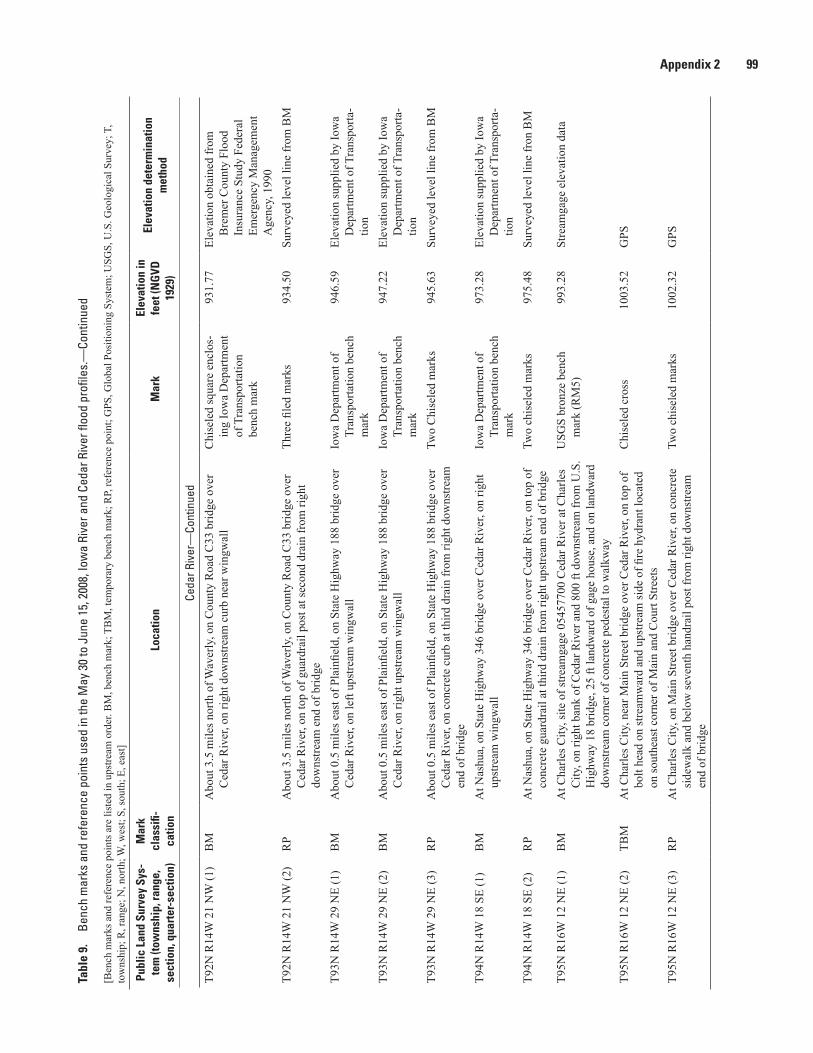
9. Bench marks and reference points used in the May 30 to June 15, 2008, Iowa River and Cedar River flood profiles ..................................................................................................87
Conversion Factors, Abbreviations, and Datums
Inch/Pound to SI
Multiply By To obtain
Length
inch (in.) 2.54 centimeter (cm)foot (ft) 0.3048 meter (m)mile (mi) 1.609 kilometer (km)
Area
square mile (mi2) 2.590 square kilometer (km2)
Flow rate
cubic foot per second (ft3/s) 0.02832 cubic meter per second (m3/s)
Elevation or vertical coordinate information is referenced to the National Geodetic Vertical Datum of 1929 (NGVD 1929).
Elevation refers to distance above or below NGVD 1929.
NGVD 1929 can be converted to the North American Vertical Datum of 1988 by using the National Geodetic Survey conversion utility available at http://www.ngs.noaa.gov/TOOLS/Vertcon/vertcon.html.
Horizontal coordinate information is referenced to the North American Datum of 1983 (NAD 83).
Map projections are Universal Transverse Mercator, Zone 15.
Water year is the 12-month period from October 1 through September 30. The water year is designated by the calendar year in which the water year ends and that includes 9 of the 12 months. Thus, the water year ending September 30, 2008, is called the “2008 water year.”
Abstract As a result of prolonged and intense periods of rainfall in
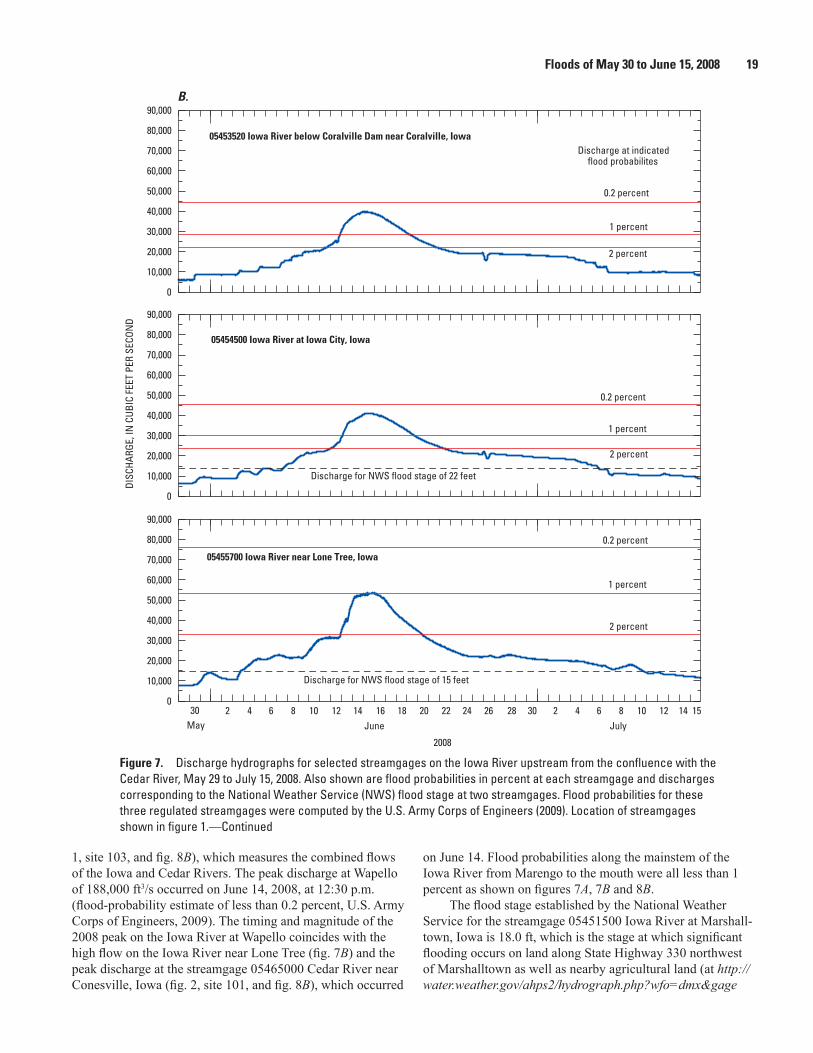
late May and early June, 2008, along with heavier than normal snowpack the previous winter, record flooding occurred in Iowa in the Iowa River and Cedar River Basins. The storms were part of an exceptionally wet period from May 29 through June 12, when an Iowa statewide average of 9.03 inches of rain fell; the normal statewide average for the same period is 2.45 inches. From May 29 to June 13, the 16-day rainfall totals recorded at rain gages in Iowa Falls and Clutier were 14.00 and 13.83 inches, respectively. Within the Iowa River Basin, peak discharges of 51,000 cubic feet per second (flood-proba-bility estimate of 0.2 to 1 percent) at the 05453100 Iowa River at Marengo, Iowa streamflow-gaging station (streamgage) on June 12, and of 39,900 cubic feet per second (flood-probability estimate of 0.2 to 1 percent) at the 05453520 Iowa River below Coralville Dam near Coralville, Iowa streamgage on June 15 are the largest floods on record for those sites. A peak discharge of 41,100 cubic feet per second (flood-probability estimate of 0.2 to 1 percent) on June 15 at the 05454500 Iowa River at Iowa City, Iowa streamgage is the fourth high-est on record, but is the largest flood since regulation by the Coralville Dam began in 1958.
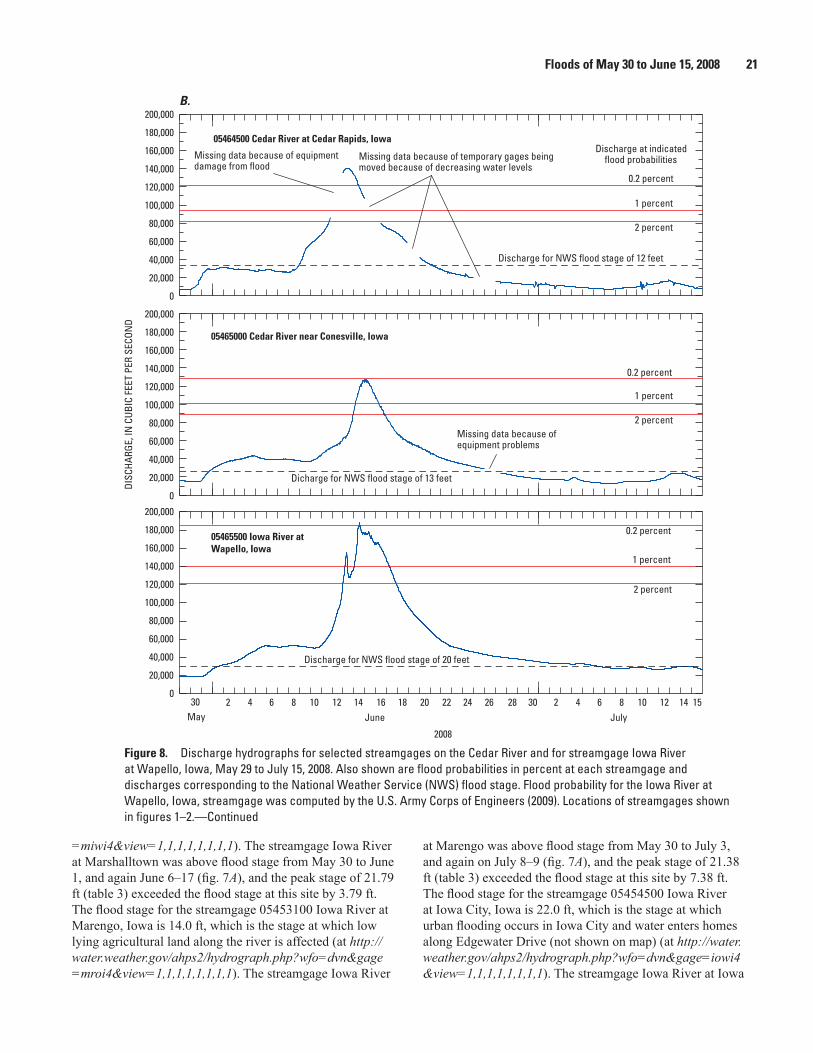
Within the Cedar River Basin, the May 30 to June 15, 2008, flood is the largest on record at all six streamgages in Iowa located on the mainstem of the Cedar River and at five streamgages located on the major tributaries. Flood-probability estimates for 10 of these 11 streamgages are less than 1 per-cent. Peak discharges of 112,000 cubic feet per second (flood-probability estimate of 0.2 to 1 percent) at the 05464000 Cedar River at Waterloo, Iowa streamgage on June 11 and of 140,000 cubic feet per second (flood-probability estimate of less than 0.2 percent) at the 05464500 Cedar River at Cedar Rapids, Iowa streamgage on June 13 are the largest floods on record for those sites. Downstream from the confluence of the Iowa and Cedar Rivers, the peak discharge of 188,000 cubic feet per second (flood-probability estimate of less than 0.2 percent) at the 05465500 Iowa River at Wapello, Iowa streamgage on June 14, 2008, is the largest flood on record in the Iowa River and Cedar River Basins since 1903.
High-water marks were measured at 88 locations along the Iowa River between State Highway 99 near Oakville and U.S. Highway 69 in Belmond, a distance of 319 river miles. High-water marks were measured at 127 locations along the Cedar River between Fredonia near the mouth (confluence with the Iowa River) and Riverview Drive north of Charles City, a distance of 236 river miles. The high-water marks were used to develop flood profiles for the Iowa and Cedar River.
Introduction In 2008, separate flood events occurred in the Midwest in
January, February, March, April, May, June, July, and Septem-ber (Holmes and others, 2010). At various times during 2008, flooding occurred in parts of Arkansas (Funkhouser and Eng, 2009), Illinois, Indiana (Morlock and others, 2008), Iowa, Kansas, Michigan, Minnesota, Missouri, Nebraska, Oklahoma, South Dakota, and Wisconsin (Fitzpatrick and others, 2008). The June floods were the most severe and widespread, causing substantial flooding and damage in all of the aforementioned States with the exception of Arkansas. During 2008, new maximum peak discharges were recorded at more than 147 U.S. Geological Survey (USGS) Midwestern streamgages. Flood-probability estimates of peak discharges at 26 of these sites were less than 0.2 percent, and at 67 of the sites, were between 0.2 and 1 percent (Holmes and others, 2010). In the Midwest, the flooding of June 2008 resulted in the loss of 11 lives and damages in excess of $5 billion (National Weather Service, 2009).
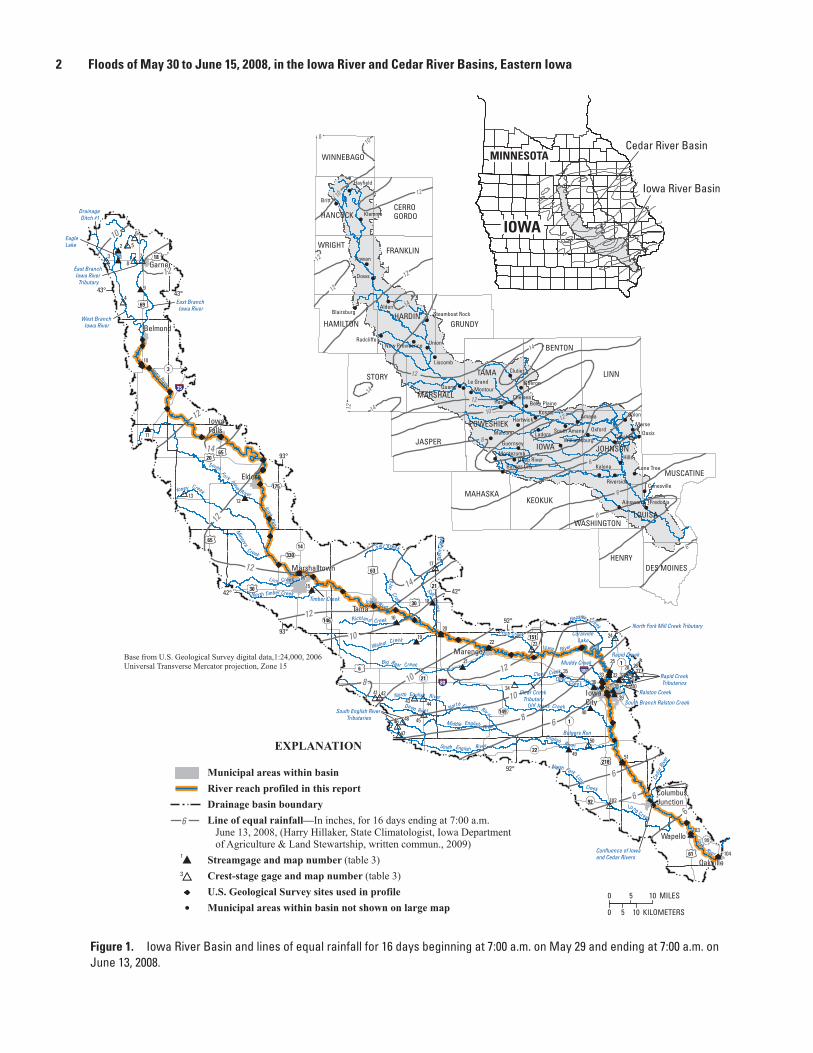
Frequent and heavy rainfall events in late May and early June caused record flooding along the Iowa and Cedar Rivers (figs. 1–2) in eastern Iowa in June 2008. New maximum peak discharge records were established from May 30, 2008, to June 15, 2008, at 22 USGS streamgages in the Iowa River and Cedar River Basins, which includes two streamgages along the mainstem of the Iowa River and six streamgages along the mainstem of the Cedar River. Below the confluence of the Iowa and Cedar Rivers, a new maximum peak discharge was recorded at streamgage 05465500 Iowa River at Wapello, Iowa (fig. 1, site 103). From May 30 to June 15, new peak
Floods of May 30 to June 15, 2008, in the Iowa River and Cedar River Basins, Eastern Iowa
By S. Mike Linhart and David A. Eash
2 Floods of May 30 to June 15, 2008, in the Iowa River and Cedar River Basins, Eastern Iowa
86
6
12
6
14
6
12
8
10
14
12
10
10
10
DeerCree k
Clear Creek
Deep River
Honey Creek
OtterCreek
Iowa
River
English River
Richland Creek
Middle English
Iowa River
North English River
Salt
Creek
South English River
River
Hoosier Creek
Walnut Creek
Salt Creek
North E nglish Riv er
Old Mans Creek
North Fork Long
Creek
Linn Creek
Iowa River
South
Fo rk Iowa
River
Big Bear Creek
Iow a
River
Minerva
Creek
Garner
Belmond
IowaFalls
Eldora
Marshalltown
Tama
Marengo
IowaCity
ColumbusJunction
Oakville
Wapello
3
4
5
6
78
17
2324
2628
2930
31
3441 42
46
47
48
50
102
13
27
43 44
45
1
2
9
10
11
12
1415
16
18
19
1
20
21
22
25
323335
3637 38
39
40
49 51
103
104
69
18
3
35
2065
175
14
30
63
146
21
30
6
8021
149
22
1
218
92
61
380
Bulgers Run
South Branch Ralston Creek
Ralston Creek
Rapid Creek
Lo ng Creek
Clear Creek Tributary
Muddy Creek
East Branch Iowa River
West Branch Iowa River
Eagle Lake
Iowa River
East Branch Iowa River
Tributary
Coralville Lake
North Timber CreekTimber Creek
65
151
1
330
12
Ceda
r Rive
r
12
12
Dows
Oasis
MorseAmana Solon
Haven
Britt
Union
Alden
Rowan
Hills
Kalona
Malcom OxfordLadora
Klemme
Koszta
QuarryElberon
Clutier
ChelseaMontour
Liscomb
Guernsey
Hartwick
Hayfield
FredoniaAinsworth
Montezuma
Radcliffe
Riverside
Lone TreeDeep River
Blairsburg
Conesville
Coralville
Barnes City
South Amana
Williamsburg
Belle Plaine
Steamboat Rock
Le Grand
New Providence
LINNTAMA
IOWAJASPER
BENTON
STORY
HARDIN
WRIGHT
KEOKUK
JOHNSON
HENRY
FRANKLIN
MAHASKA
GRUNDY
HANCOCK
HAMILTON
MARSHALL
WASHINGTON
MUSCATINE
CERRO GORDO
DES MOINES
WINNEBAGO
IOWA
MINNESOTA
Base from U.S. Geological Survey digital data,1:24,000, 2006Universal Transverse Mercator projection, Zone 15
Iowa River Basin
Cedar River Basin
North Fork Mill Creek Tributary Price Creek
South English River Tributaries
Rapid CreekTributaries
Drainage Ditch #1
92°
92°
93°
93°
43° 43°
42° 42°
S tei
n C r
e ek
99
EXPLANATION
Municipal areas within basinRiver reach profiled in this reportDrainage basin boundaryLine of equal rainfall—In inches, for 16 days ending at 7:00 a.m. June 13, 2008, (Harry Hillaker, State Climatologist, Iowa Department of Agriculture & Land Stewartship, written commun., 2009)Streamgage and map number (table 3)Crest-stage gage and map number (table 3)U.S. Geological Survey sites used in profileMunicipal areas within basin not shown on large map
3
Confluence of Iowa and Cedar Rivers
0 5 10 MILES
0 5 10 KILOMETERS
6
8
6
12
10
14
8
12
6
6
1210
14
1214
14
12
10
12
12
12
6 LOUISA
POWESHIEK
Figure 1. Iowa River Basin and lines of equal rainfall for 16 days beginning at 7:00 a.m. on May 29 and ending at 7:00 a.m. on June 13, 2008.
Introduction 3
Figure 2. Cedar River Basin and lines of equal rainfall for 16 days beginning at 7:00 a.m. on May 29 and ending at 7:00 a.m. on June 13, 2008.
F o urmile Creek
Deer Creek
Elk Creek
Spring
Creek
Be ar Creek
Black Hawk Cree k
Rock Creek
M iller
C reek
Wol f Creek
BearCreek
Wol f C reek
Shell
Rock
Rive r
Indian
Cree
k
West F ork Cedar Rive r
Twelvemile
Cre e k
RoseCr e e k
Big
Cree
k
Cedar
River
Ban
cro
ft Cre ek
Prairie Creek
Li ttleCedar
River
CedarRiverFlood
Creek
Pratt Cre
ek
Cedar
Riv e r
Beaver Cree k
Dr yCr
eek
Ott er
Cree
k
Hor
ton
Creek
Shell
RockR ive r
Poyn
erCr
eek
Winnebago
R iver
Littl
e
Cedar River
Willow Creek
Base from U.S. Geological Survey digital data, 1:24,000, 2006Universal Transverse Mercator projection, Zone 15
EXPLANATION
Municipal areas within basinRiver reach profiled in this reportDrainage basin boundaryLine of equal rainfall—In inches, for 16 days ending at 7:00 a.m. June 13, 2008, (Harry Hillaker, State Climatologist, Iowa Department of Agriculture & Land Stewartship, written commun., 2009)Streamgage and map number (table 3)Crest-stage gage and map number (table 3)U.S. Geological Survey sites used in profileMunicipal areas within basin not shown on large map
6
0 5 10 MILES
0 5 10 KILOMETERS
Beaverdam
Creek
6
18
1
218
57
63
3
30
3
22
80
218
30
38
63
20
9
346
13
14
9
130
151
380
188
150
38
20
55
56
59
60
6163
65
68
70
71 72
76
78
79
84
87
89
90
94
100
101
52
73
74
8182 83
85
54
62
66
67
69
88
97
57
75
7780
86
91
92
93
95
96
98
99
53
58
64
Suga
r Cre
ek
Cedar Rapids
Charles City
Mason City
Waterloo
Waverly
Austin
251
30
90
69
35
56
9
218
65
218
3514
3
14
175
Prairie Creek Tributary
Bailey Creek
Gizzard Creek
East BranchBlue Creek
35
13
65
96
21
8
218
151
Lillibridge Creek
Nashua
Gilbertville
Sutiff
Cedar Bluff
Northwood
Mitchell
Bassett
IoniaMarble Rock
PowersvilleGreene
SheffieldClarksville
Shell Rock
JanesvilleFinchford
Aplington
HudsonGrundy Center
Eagle Center
Lincoln
TraerGladbrook Dysart Vinton
AlburnettGarrison
Palo MarionVan Horne
FairfaxBlairstown
WestBranch
Wilton
New Hartford
Carpenter
Kensett
Plainfield
Cedar Falls
Evansdale
La Porte City
Mount AuburnCenter Point
MountVernon
Cedar Valley
Rochester
MoscowAtalissaNichols
Conesville
FredoniaColumbus
Junction
Dumont
AustinBancroft Dexter
Johnsburg
DODGE
FARIBAULT FREEBORN MOWER
STEELE
WINNEBAGO
MITCHELL
WORTH
HANCOCK CERROGORDO CHICKASAW
FLOYD
WRIGHT BREMER
FRANKLINBUTLER
BUCHANANBLACKHAWK
TAMAMARSHALL
CEDAR
JOHNSON
SCOTT
MUSCATINE
LOUISA
GRUNDY
JONESLINN
BENTON
HARDIN
6
10
12
14
12
6
66
12
12 14
1412
12
810
12
12
8108
14
8
6
14
6
14
12
10
12
10
12
10
12
6
12
IOWA
MINNESOTA
Iowa River Basin
Cedar River Basin
Thunder Creek
Hoover Creek
Beaver Creek Tributary
West Branch Wapsinonoc Creek
Half Mile Creek
91°
91°92°
92°
93°
93°
43° 43°
42° 42°
52
53
IOWA
MINNESOTA
Cedar River at Highway 30
4 Floods of May 30 to June 15, 2008, in the Iowa River and Cedar River Basins, Eastern Iowa
discharge records also were established at two streamgages on one major tributary to the Iowa River and at five streamgages on major tributaries to the Cedar River (figs. 1–2). From May 30 to June 15, four streamgages on minor tributaries to Iowa River and two streamgages on minor tributaries to the Cedar River also recorded new peak discharges. New maximum peak discharges also occurred on April 25 at streamgage 05463500 Black Hawk Creek at Hudson, Iowa (fig. 2, site 78), and on July 21 at streamgage 05453430 North Fork Tributary to Mill Creek near Solon, Iowa (fig. 1, site 24), bringing the total number of streamgages in the Iowa River and Cedar River Basins with record floods in 2008 to 24.
During May and June 2008, record high discharges or flood probabilities of 1 percent or smaller (100-year flood-ing or greater) occurred at 62 streamgage locations in Iowa, particularly in eastern Iowa (Buchmiller and Eash, 2010). New maximum peak discharges were recorded at 41 of these 62 streamgages, which include the 22 previously noted streamgages within the Iowa River and Cedar River Basins. High water and flooding in the headwater streams in north-central and eastern Iowa, particularly in June, resulted in flooding of historic proportions in the Iowa and Cedar Riv-ers. Previous flood peak discharges at many locations were exceeded by substantial amounts, in some cases nearly dou-bling the previous record peak discharge at locations where more than 100 years of streamflow record were available.
The floods of 2008 were severe in many communities in eastern Iowa, forcing the evacuation of thousands of Iowans and threatening critical infrastructures such as drinking-water supplies and wastewater facilities. The greatest urban dam-age was caused by the Cedar River flood in Cedar Rapids and the Iowa River flood in Iowa City; flood damage in Iowa City included University of Iowa facilities. Many major roads and highways throughout Iowa were closed during the flooding, causing substantial disruptions in transportation. Erosion and sediment deposition from the flooding damaged agricultural lands. As of June 17, 2008, many people (38,043) had been displaced from their homes across 16 counties in Iowa because of the flooding. In addition, 29 counties had received presi-dential emergency declarations and 83 counties were listed as state disaster areas (Boshart, Cedar Rapids-Iowa City Gazette, June 17, 2008).
On May 27, 2008, a Federal disaster declaration (number 1763) was issued to help Iowans recover from losses caused by severe storms, tornados, and flooding (Federal Emergency Management Agency, 2008a). The Federal disaster declaration which began with Butler County, and eventually increased to 85 counties, provided aid for losses incurred in Iowa between May 25 and August 13, 2008. From May 27, 2008, to October 31, 2008, Federal Emergency Management Agency (FEMA) officials reported that 39,928 individuals had registered for aid and as of May 22, 2009, nearly $1.3 billion of aid had been approved for individuals, families, and businesses, in Iowa, and an additional $583 million had been obligated for improvements to infrastructure (Federal Emergency Manage-ment Agency, 2009). Private property damage claims reported
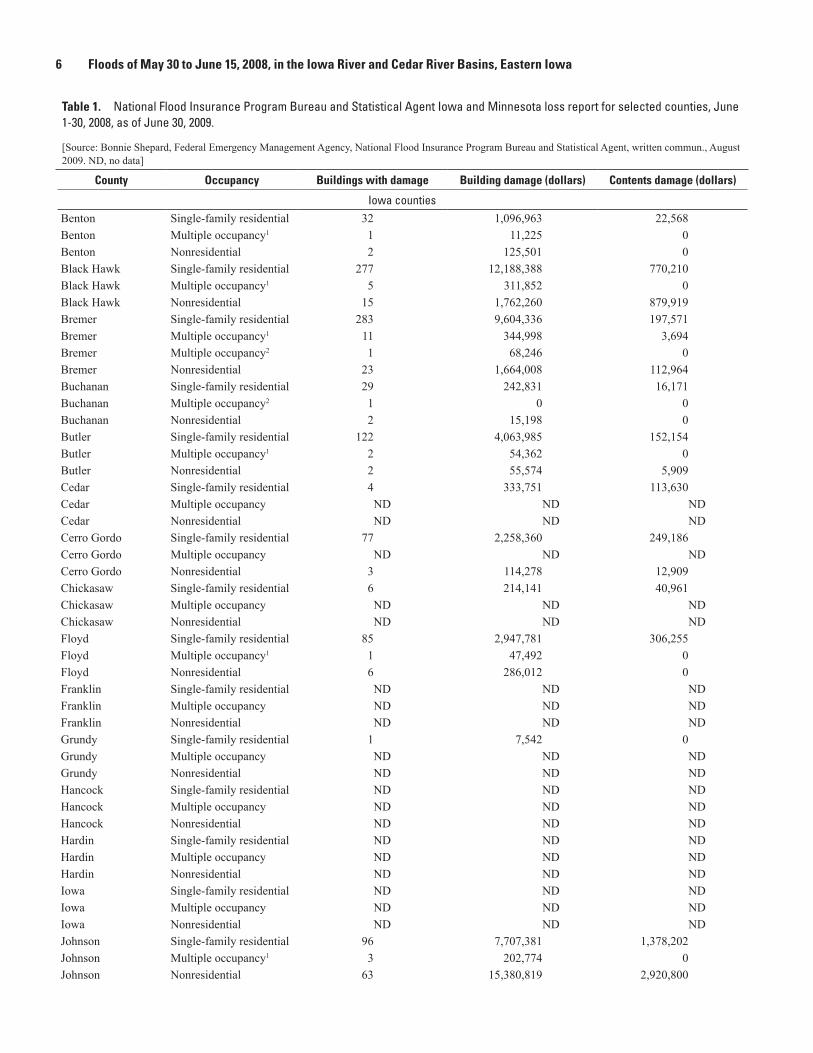
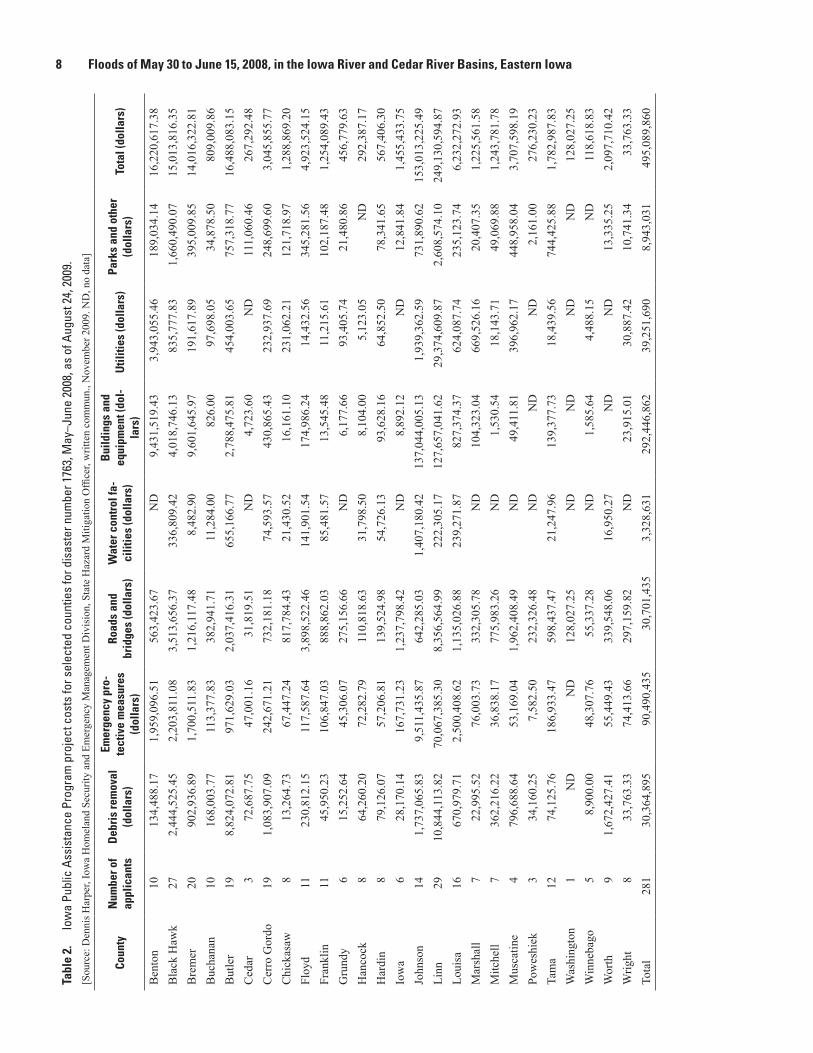
for residential and nonresidential buildings in 26 selected counties in eastern Iowa, and 2 counties in southern Minne-sota, are shown in table 1 (Bonnie Shepard, FEMA, National Flood Insurance Program Bureau and Statistical Agent, written commun., August 2009). Approved public assistance costs (assistance to local governments for the repair of disaster-damaged public facilities) for the same 26 counties in Iowa are shown in table 2 (Dennis Harper, Iowa Homeland Security and Emergency Management Division, State Hazard Mitigation Officer, written commun., November 2009).
Purpose and Scope
This report is part of an on-going program of preparing water-surface profiles of major floods on streams in Iowa. The program is managed in cooperation with the Iowa Depart-ment of Transportation (Iowa DOT) and the Iowa Highway Research Board (Project HR-140). Flood-peak and water-sur-face-elevation profile information is needed for the economi-cal and safe location and design of bridges and other structures on or over streams and the adjacent flood plains. Defining the limits of flood inundation and establishing encroachment limits on flood plains are related issues dependent on this information. Data for major floods are needed to compute flood-probability discharges and to calibrate water-surface-elevation profile models for sites along streams. A list of other Iowa flood profile reports can be obtained by accessing http://ia.water.usgs.gov/projects/profiles/.
This report provides information about the May and June 2008 rainfall and floods from May 30 to June 15, 2008, in the Iowa River and Cedar River Basins, and estimated flood-probability ranges at 52 streamgages and 45 crest-stage gages (CSG) in the basins. High-water marks (HWM) at selected sites along the Iowa River are presented in a flood profile from State Highway 99 near Oakville to U.S. Highway 69 at Bel-mond, a distance of 319 river miles (mi). HWMs at selected sites along the Cedar River are presented in a flood profile from Fredonia near the mouth (confluence with the Iowa River) to just north of Charles City, a distance of 236 river mi.
Study Area
The Iowa River and Cedar River Basins are adjacent watersheds draining from the northwest to the southeast across eastern Iowa. The two drainage basins, the river reaches profiled, the location of USGS streamgages within these river basins, and the location of USGS bridge sites used in the June 9–15, 2008, flood profiles are shown in figures 1–2. The Iowa River at its mouth includes the Iowa River and Cedar River Basins with a total drainage area of 12,637 square miles (mi2) (Larimer, 1957). The confluence of the Iowa River and Cedar River is 29.9 mi upstream from the mouth of the Iowa River. The Cedar River Basin at the confluence is the larger basin with a drainage of 7,819 mi2, of which 1,024 mi2 are in Minnesota (Schwob, 1963). Excluding the contributing area
Introduction 5
of the Cedar River Basin, the drainage area of the Iowa River Basin is 4,818 mi2. The Iowa River and Cedar River Basins lie within four of Iowa’s landform regions (fig. 3), the Des Moines Lobe, the Iowan Surface, the Southern Iowa Drift Plain, and the Iowa-Cedar Lowland. The Iowa-Cedar Lowland was formerly included in the Mississippi Alluvial Plain (Prior, 1991), but is now considered a separate landform because of its uniqueness and the further separation of the alluvial plain landform regions (Prior, Kohrt, and Quade, 2009). The Des Moines Lobe landform region was shaped by the most recent period of glaciation and where much of the land surface is flat to gently sloping with localized areas of depressions, lakes, and ponds. Drainage within the Des Moines Lobe generally is poor and subject to ponding after periods of heavy rain (Iowa Natural Resources Council, 1955). The Iowan Surface land-form region is characterized by level to gently rolling land-scape features formed by erosion. Streams draining the Iowan Surface are well established but generally have low gradients. The Southern Iowa Drift Plain landform region generally is characterized by steeper and hillier topography formed by deeply dissected drainageways as a result of long-term erosional activity (Prior, 1991). The Iowa-Cedar Lowland is a broad expansive area which includes, the lower reaches of the Iowa and Cedar Rivers to their confluence, and the Iowa River as it flows southeast into the Mississippi River Alluvial Plain landform region (fig. 3). The Iowa-Cedar Lowland landform region was shaped by historic glacial meltwater and wind-blown processes and is characterized by a broad, flat-floored alluvial floodplain (Prior, Kohrt, and Quade, 2009). More-extensive descriptions of the landform regions are available from Prior (1991) and Prior, Kohrt, and Quade, (2009).
The headwaters of the Iowa River are in Hancock County and small parts of Winnebago and Cerro Gordo Counties. The East Branch Iowa River and West Branch Iowa River join in Wright County to form the mainstem of the Iowa River. Downstream from Belmond, the Iowa River is slow moving and shallow, except, from Alden downstream to below Eldora, where the river flows through a gorge of exposed bedrock outcroppings. Near Le Grand, gorge-like conditions again occur, but in general, the valley floodplain is broad as the river flows through Tama and Iowa Counties. South of Iowa City, the Iowa River flows generally in a southeasterly direction through broad alluvial floodplains to its confluence with the Cedar River. The lower reach of the Iowa River, below its con-fluence with the Cedar River, consists of islands, sloughs, and oxbow lakes as it continues flowing in a southeasterly direc-tion to its mouth at the Mississippi River in southeast Louisa County. Major tributaries to the Iowa River include the South Fork Iowa and English Rivers. The South Fork Iowa River, with a drainage area of 309 mi2 (Larimer, 1957), originates in Hamilton County and flows southeast to its mouth in Hardin County. The English River, with a drainage area of 638 mi2 (Larimer, 1957), originates in Poweshiek County and flows east to its mouth in Washington County. Other major streams flowing into the Iowa River with drainage areas greater than 200 mi2 include Salt Creek, Big Bear Creek, and Old Mans
Creek. Land use in the Iowa River Basin is primarily agricul-tural. The Iowa River flows through the larger urban areas of Marshalltown in Marshall County and Iowa City in Johnson County. Twelve low-head dams have been constructed across the Iowa River (Iowa Conservation Commission, 1979), but the dams have small pools that probably do not substantially affect the peak discharge of the river, as is the case with the Cedar River (Schwob, 1963), during large flood events. The largest dam on the Iowa River is the Coralville Dam (fig. 1, near site 25) at a height of 100 feet (ft) and was completed in 1958 by the U.S. Army Corps of Engineers for flood protec-tion (U.S. Army Corps of Engineers, accessed October 30, 2009 at http://www.mvr.usace.army.mil/Coralville/History.htm). Coralville Lake is approximately 23 mi long and 5,430 acres in area at a normal pool elevation of 683 ft above sea level (U.S. Army Corps of Engineers, accessed October 30, 2009, at http://www.mvr.usace.army.mil/Coralville/project_facts.htm). Coralville Lake is located approximately 3 mi north of Iowa City (fig. 1).
The Cedar River originates in Dodge County, Minnesota, and flows generally in a southeasterly direction to its conflu-ence with the Iowa River in Louisa County (fig. 2). The West Fork Cedar River is the largest tributary to the Cedar River with a drainage area of 2,639 mi2 (Larimer, 1957). The West Fork Cedar River originates in Cerro Gordo County and flows southeast to its mouth in Black Hawk County. The Shell Rock River is the largest tributary to the West Fork Cedar River with a drainage area of 1,783 mi2 (Larimer, 1957). The Shell Rock River originates in Freeborn County, Minnesota, and flows southeast to its mouth in Black Hawk County, which is located 1.8 mi upstream from the mouth of the West Fork Cedar River. The Winnebago River is the largest tributary to the Shell Rock River with a drainage area of 700 mi2 (Larimer, 1957). The Winnebago River flows southeast from its headwaters in Freeborn County, Minnesota, to its mouth in Floyd County. Other major streams flowing into the Cedar River with drain-age areas greater than 200 mi2 include the Little Cedar River, Beaver Creek, Black Hawk Creek, Wolf Creek, Prairie Creek, and Sugar Creek. The upper part of the Cedar River Basin is wide and fan-shaped and the lower part of the basin is narrow. With tributary inflow from the West Fork Cedar River, Beaver Creek, and Black Hawk Creek, the drainage area of the Cedar River Basin increases from 1,661 mi2 at streamgage 05458500 Cedar River at Janesville, Iowa (fig. 2, site 61) to 5,146 mi2 at streamgage 05464000 Cedar River at Waterloo, Iowa (fig. 2, site 79), an increase of 210 percent (Lara, 1987). The distance between the two streamgages is 20.5 river mi. Land use is pri-marily agricultural in the Cedar River Basin. The Cedar River flows through the major urban areas of Waterloo in Black Hawk County and Cedar Rapids in Linn County. Twelve low-head dams have been constructed across the Cedar River (Iowa Conservation Commission, 1979), but the dams have small pools that do not substantially affect the peak discharge of the river during large flood events (Schwob, 1963).
6 Floods of May 30 to June 15, 2008, in the Iowa River and Cedar River Basins, Eastern Iowa
Table 1. National Flood Insurance Program Bureau and Statistical Agent Iowa and Minnesota loss report for selected counties, June 1-30, 2008, as of June 30, 2009.—Continued
[Source: Bonnie Shepard, Federal Emergency Management Agency, National Flood Insurance Program Bureau and Statistical Agent, written commun., August 2009. ND, no data]
County Occupancy Buildings with damage Building damage (dollars) Contents damage (dollars)
1Two to four family residential.2Other residential.
8 Floods of May 30 to June 15, 2008, in the Iowa River and Cedar River Basins, Eastern IowaTa
ble
2.
Iow
a Pu
blic
Ass
ista
nce
Prog
ram
pro
ject
cos
ts fo
r sel
ecte
d co
untie
s fo
r dis
aste
r num
ber 1
763,
May
–Jun
e 20
08, a
s of
Aug
ust 2
4, 2
009.
[Sou
rce:
Den
nis H
arpe
r, Io
wa
Hom
elan
d Se
curit
y an
d Em
erge
ncy
Man
agem
ent D
ivis
ion,
Sta
te H
azar
d M
itiga
tion
Offi
cer,
writ
ten
com
mun
., N
ovem
ber 2
009.
ND
, no
data
]
Coun
tyN
umbe
r of
appl
ican
tsD
ebri
s re
mov
al
(dol
lars
)
Emer
genc
y pr
o-te
ctiv
e m
easu
res
(dol
lars
)
Road
s an
d br
idge
s (d
olla
rs)
Wat
er c
ontr
ol fa
-ci
litie
s (d
olla
rs)
Bui
ldin
gs a
nd
equi
pmen
t (do
l-la
rs)
Util
ities
(dol
lars
)Pa
rks
and
othe
r (d
olla
rs)
Tota
l (do
llars
)
Ben
ton
1013
4,48
8.17
1,95
9,09
6.51
563,
423.
67N
D9,
431,
519.
433,
943,
055.
4618
9,03
4.14
16,2
20,6
17.3
8B
lack
Haw
k27
2,44
4,52
5.45
2,20
3,81
1.08
3,51
3,65
6.37
336,
809.
424,
018,
746.
1383
5,77
7.83
1,66
0,49
0.07
15,0
13,8
16.3
5B
rem
er20
902,
936.
891,
700,
511.
831,
216,
117.
488,
482.
909,
601,
645.
9719
1,61
7.89
395,
009.
8514
,016
,322
.81
Buc
hana
n10
168,
003.
7711
3,37
7.83
382,
941.
7111
,284
.00
826.
0097
,698
.05
34,8
78.5
080
9,00
9.86
But
ler
198,
824,
072.
8197
1,62
9.03
2,03
7,41
6.31
655,
166.
772,
788,
475.
8145
4,00
3.65
757,
318.
7716
,488
,083
.15
Ced
ar3
72,6
87.7
547
,001
.16
31,8
19.5
1N
D4,
723.
60N
D11
1,06
0.46
267,
292.
48C
erro
Gor
do19
1,08
3,90
7.09
242,
671.
2173
2,18
1.18
74,5
93.5
743
0,86
5.43
232,
937.
6924
8,69
9.60
3,04
5,85
5.77
Chi
ckas
aw8
13,2
64.7
367
,447
.24
817,
784.
4321
,430
.52
16,1
61.1
023
1,06
2.21
121,
718.
971,
288,
869.
20Fl
oyd
1123
0,81
2.15
117,
587.
643,
898,
522.
4614
1,90
1.54
174,
986.
2414
,432
.56
345,
281.
564,
923,
524.
15Fr
ankl
in11
45,9
50.2
310
6,84
7.03
888,
862.
0385
,481
.57
13,5
45.4
811
,215
.61
102,
187.
481,
254,
089.
43G
rund
y6
15,2
52.6
445
,306
.07
275,
156.
66N
D6,
177.
6693
,405
.74
21,4
80.8
645
6,77
9.63
Han
cock
864
,260
.20
72,2
82.7
911
0,81
8.63
31,7
98.5
08,
104.
005,
123.
05N
D29
2,38
7.17
Har
din
879
,126
.07
57,2
06.8
113
9,52
4.98
54,7
26.1
393
,628
.16
64,8
52.5
078
,341
.65
567,
406.
30Io
wa
628
,170
.14
167,
731.
231,
237,
798.
42N
D8,
892.
12N
D12
,841
.84
1,45
5,43
3.75
John
son
141,
737,
065.
839,
511,
435.
8764
2,28
5.03
1,40
7,18
0.42
137,
044,
005.
131,
939,
362.
5973
1,89
0.62
153,
013,
225.
49Li
nn29
10,8
44,1
13.8
270
,067
,385
.30
8,35
6,56
4.99
222,
305.
1712
7,65
7,04
1.62
29,3
74,6
09.8
72,
608,
574.
1024
9,13
0,59
4.87
Loui
sa16
670,
979.
712,
500,
408.
621,
135,
026.
8823
9,27
1.87
827,
374.
3762
4,08
7.74
235,
123.
746,
232,
272.
93M
arsh
all
722
,995
.52
76,0
03.7
333
2,30
5.78
ND
104,
323.
0466
9,52
6.16
20,4
07.3
51,
225,
561.
58M
itche
ll7
362,
216.
2236
,838
.17
775,
983.
26N
D1,
530.
5418
,143
.71
49,0
69.8
81,
243,
781.
78M
usca
tine
479
6,68
8.64
53,1
69.0
41,
962,
408.
49N
D49
,411
.81
396,
962.
1744
8,95
8.04
3,70
7,59
8.19
Pow
eshi
ek3
34,1
60.2
57,
582.
5023
2,32
6.48
ND
ND
ND
2,16
1.00
276,
230.
23Ta
ma
1274
,125
.76
186,
933.
4759
8,43
7.47
21,2
47.9
613
9,37
7.73
18,4
39.5
674
4,42
5.88
1,78
2,98
7.83
Was
hing
ton
1N
DN
D12
8,02
7.25
ND
ND
ND
ND
128,
027.
25W
inne
bago
58,
900.
0048
,307
.76
55,3
37.2
8N
D1,
585.
644,
488.
15N
D11
8,61
8.83
Wor
th9
1,67
2,42
7.41
55,4
49.4
333
9,54
8.06
16,9
50.2
7N
DN
D13
,335
.25
2,09
7,71
0.42
Wrig
ht8
33,7
63.3
374
,413
.66
297,
159.
82N
D23
,915
.01
30,8
87.4
210
,741
.34
33,7
63.3
3To
tal
281
30,3
64,8
9590
,490
,435
30,7
01,4
353,
328,
631
292,
446,
862
39,2
51,6
908,
943,
031
495,
089,
860
Floods of May 30 to June 15, 2008 9
Floods of May 30 to June 15, 2008The floods of May 30 to June 15, 2008, are some of the
largest floods on record in the Iowa River Basin and is the largest flood on record in the Cedar River Basin (table 3, at the back of this report). Within the lower part of the Iowa River Basin, the 2008 flood along the mainstem from the streamgage 05453100 Iowa River at Marengo, Iowa (fig. 1, site 22) to the streamgage 05465500 Iowa River at Wapello, Iowa (fig. 1, site 103) is the largest flood on record since regulation of the Iowa River began in 1958 with the operation of the Coralville Dam, with the exception of the streamgage 05455700 Iowa River near Lone Tree, Iowa (fig. 1, site 51) where the 2008 flood is the second largest flood since regulation. Within the Cedar River Basin, the floods of May 30 to June 15, 2008, are the largest on record at all six streamgages located on
the mainstem of the Cedar River from the streamgage 05457700 Cedar River at Charles City, Iowa (fig. 2, site 56) to the streamgage 05465000 Cedar River near Conesville, Iowa (fig. 2, site 101) and at five streamgages located on major tributaries. At the streamgage 05464500 Cedar River at Cedar Rapids, Iowa (fig. 2, site 90), the 2008 flood is the largest known since streamgage operation began in 1903. Down-stream from the confluence of the Iowa and Cedar Rivers, at the 05465500 Iowa River at Wapello, Iowa streamgage, the 2008 flood also is the largest known since 1903.
Flood Probability
Flood probability is an estimate of the likelihood of a flood of a specific magnitude occurring in any 1 year, and a flood-probability range expresses the uncertainty of estimating
Mississippi River Alluvial PlainMissouri River Alluvial PlainNorthwest Iowa PlainsPaleozoic PlateauSouthern Iowa Drift Plain
Main branch Iowa and Cedar RiversDrainage basin boundary
Landform regions from Prior, Kohrt, and Quade,Iowa Geological Survey, 2006 (edited 2009)
Base from U.S. Geological Survey digital data, 1:24,000, 2006Universal Transverse Mercator projection, Zone 15
0 15 30 MILES
0 15 30 KILOMETERS
Figure 3. Iowa River and Cedar River Basins and landform regions of Iowa.
10 Floods of May 30 to June 15, 2008, in the Iowa River and Cedar River Basins, Eastern Iowa
precise flood probabilities. The reporting ranges are: greater than 10 percent, 4 to 10 percent, 2 to 4 percent, 1 to 2 per-cent, 0.2 to 1 percent, and less than 0.2 percent. The range is determined by the estimated flood-probability discharges that bracket the observed flood-peak discharge. If the observed peak discharge is the same value as an estimated flood-prob-ability discharge, the lower flood-probability range is used. In the “Flood Description” section and in appendix 1, flood discharges and their respective flood-probability ranges are discussed and are listed in table 3. Unless noted otherwise, flood-probability estimates listed in table 3 were computed using the Weighting of Independent Estimates (WIE) program (Charles Berenbrock and Tim Cohn, U.S. Geological Survey, written commun., 2008) following guidelines in Appendix 8 of Bulletin 17B (Interagency Advisory Committee on Water Data, 1982). The WIE program uses the variance and estimate of the Bulletin 17B streamgage-probability analysis and the variance and estimate of the regional-regression probability calculation (Eash, 2001) to compute a weighted estimate and variance at a streamgage. As noted in table 3, the WIE program was not used to estimate flood probabilities for streamgages with peak-flow records of less than 10 years, in which case only regional-regression probability calculations were used; nor was the WIE program used to estimate flood probabilities for streamgages with basin characteristic values outside of the applicable range of characteristic values used to develop the regional-regression probability calculations, in which case only Bulletin 17B streamgage-probability analyses were used.
For rivers that are noted as regulated in table 3, flood probabilities were computed by the U.S. Army Corps of Engi-neers (USACE, 2009). Current estimates of flood-probability discharges computed by USACE for regulated streamgages at 05453520 Iowa River below Coralville Dam near Coralville, Iowa (fig.1, site 25), 05454500 Iowa River at Iowa City, Iowa (fig. 1, site 37), 05455700 Iowa River near Lone Tree, Iowa (fig.1, site 51), and at 05465500 Iowa River at Wapello, Iowa (fig. 1, site 103) include the flood-control effect of the Coralville Dam. Current flood-probability estimates for the Iowa City streamgage are lower than those computed for the unregulated streamflow period before the dam was built (Fischer and Eash, 1998), thus the difference in estimated flood-probability ranges listed in table 3 between peak dis-charges that occurred before and after operation of the dam began in 1958.
Flood probabilities change as streamflow records get longer. Bulletin 17B probability analyses are computed for streamgages using annual peak discharges. Annual peak discharges recorded for the streamgages 05454500 Iowa River at Iowa City, Iowa (fig. 1, site 37) and 05464500 Cedar River at Cedar Rapids, Iowa (fig.2, site 90) are shown in figures 4 and 5. As additional annual peak discharges are measured at streamgages, Bulletin 17B probability estimates are updated and become more statistically reliable. Bulletin 17B, 1-percent probability estimates computed for the Cedar River at Cedar Rapids streamgage for annual peak discharge records ranging
from 10 to 106 years is shown in figure 5. A minimum of 10 years of record are required to compute Bulletin 17B prob-ability estimates, thus the 1-percent flood-probability estimates shown in figure 5 range from 10 years (1903–1912) to 106 years (1903–2008) of record (the historic 1851 flood discharge was not included in the probability analyses). The 1-percent flood-probability estimate increases following a large flood event, such as the 1917, 1929, 1933, 1961, 1965, and 2008 floods, and decreases during a period without large flood events, such as the 1918–28 and 1973–89 periods shown on figure 5.
Flood probabilities formerly were reported as flood recur-rence intervals expressed in years. For example, a 1-percent flood-probability discharge is the same as the 100-year recur-rence-interval flood discharge. But, because of widespread confusion caused in recent years by two or more “100-year floods” occurring in a period of much less than 100 years, the scientific and engineering community has begun expressing the annual likelihood of occurrence of flood discharges as a probability. Percent probability is the inverse of the recurrence interval multiplied by 100. Selected flood probabilities and equivalent flood recurrence intervals are listed in table 4.
Storm Description
Heavy rain fell over much of eastern Iowa in late May and the first 2 weeks of June. The storms were part of an exceptionally wet period from May 29 through June 12, when Iowa had a statewide average of 9.03 in. of rainfall; the normal statewide average for the same period is 2.45 in. Leading up to this period of heavy rainfall was a wetter than normal August and October in 2007 followed by an unusually heavy snowpack during the 2007–2008 winter. For a statewide aver-age in February, this snowfall was the third heaviest amount recorded. As a result, the saturated soil and high river levels leading into late May and June 2008 set the stage for severe flooding. Overall, 2008 was the fourth wettest year on record in Iowa, which had an average rainfall of 43.79 in. (Hillaker, 2008a).
The following rainfall and flood information is from the U.S. Department of Commerce, National Oceanic and Atmo-spheric Administration, and National Climatic Data Center (2008a).
Table 4. Flood probability and equivalent flood recurrence interval for selected probabilities.
Flood probability (percent) Recurrence interval (years)
20 510 104 252 501 100.5 200.2 500
Floods of May 30 to June 15, 2008 11
“A very unstable airmass moved into Iowa during the day on May 29 as a warm front lifted north into the state during the afternoon. Thunderstorms erupted quickly during the late afternoon and evening hours over western Iowa and stretch-ing into north central Iowa. The storms became severe with hail and high winds. Most of the hail reported was pea to marble size. Several tornadoes were also reported during the storm. A band of 3 to 5 in. of rain fell between U.S. Highway 30 and U.S. Highway 20 during the event. Extensive flooding occurred along rivers across the central third of the state. On the morning of May 30th heavy rains of 2 to 5 in. resulted in flash flooding in numerous areas across Benton County. U.S. Highway 218 was impassible at several locations due to water flowing over the highway. Other county roads were covered with water as several area streams and creeks overflowed their banks. A bridge on County Road V61 north of Vinton was washed out due to the flash flooding.
A warm front draped across northern Missouri and west central Illinois was the focal point for the repeated develop-ment of heavy rain-producing showers and thunderstorms during the late evening of June 2 through the early morn-ing of June 4. Scattered showers and thunderstorms initially developed along the boundary over southeast Iowa, northeast Missouri, and west central Illinois during the late evening and overnight hours. Between 6 and 10 a.m. on June 3, a bowing line of thunderstorms raced southeast out of central Iowa into central Illinois producing heavy rains and damaging winds. Heavy rains of 1 to 2 in. fell in a short amount of time result-ing in some flash flooding in several parts of Iowa County dur-ing the morning and early afternoon hours of June 3. Heavy rains of 1 to 2.5 in. in a short amount of time resulted in flash flooding of some streets near the intersection of Melrose Ave. and Mormon Trek Blvd. (not shown on map) in Iowa City.
On June 4, a strong surge of very moist and unstable air moved into Iowa as a warm front stretched east to west along the Iowa/Missouri border. Thunderstorms erupted by the evening and a cyclic supercell developed over southwest Iowa. By the time the night was done, three separate supercells took a similar track across southern Iowa. A cluster of thunder-storms formed over northern Iowa as well. Severe weather was isolated with this area of storms. Copious amounts of rain fell with the storms, both the supercells and the cluster across the north. Flooding became widespread with numerous reports of water over the roads along the track of the supercells, and also over parts of north central into northeast Iowa. The heaviest rainfall occurred over southwest Iowa, where north-west of Creston picked up nearly 8 in. of rain.
A very dynamic weather situation unfolded during June 5 and into the day on June 6. A strong upper level low pres-sure area lifted northeast out of the southern Rockies with a negatively tilted trough of low pressure lifting northeast across the central U.S. An intense low pressure area developed over northern Kansas and lifted north into southeast North Dakota by the morning of June 6. Thunderstorms erupted to the southwest of Iowa in central Kansas, along the dry line there. The storms raced northeast into Iowa by sunset. The most
significant feature with this event was the flash flooding. Soil conditions across the state were very saturated. Any significant rainfall resulted in flash flooding. A narrow band of heavier rainfall stretched from south central into central Iowa. Flash flooding occurred in the Des Moines metro area as the airport recorded 4.15 in. of rainfall for the day, with about 3 in. fall-ing in two hours.
Low pressure developed over Kansas with a strong south-erly flow of very moist air streaming into Iowa ahead of it. A semi-stationary front extended northeast from the low, across northern Iowa during the afternoon into the evening hours. During the initial phase of the severe event, high winds and hail were reported along the line of thunderstorms that formed from northern into west central Iowa. There were four reports of tornadoes in Worth, Winnebago and Cerro Gordo Counties during the afternoon hours of June 7. This was with the initial round of storms. The event transitioned into a major Flood/Flash Flood event during the evening and early morning hours with many locations reporting 1 to 2 in. of rainfall, and spotty amounts of around 5 in. in just a few hours time. The line moved very little for a period of several hours. During the predawn hours, the line became broad and weakened to generally below severe limits. A new round of thunderstorms from Nebraska, which was the southwest part of the extensive line, moved into west central and southwest Iowa. The storm generally remained below severe levels for the most part, but they did produce very heavy rains. Another line of thunder-storms formed and re-intensified along the frontal boundary by the early afternoon hours. Initially, the storms produced strong winds and some small hail. The antecedent soil conditions in Iowa were extremely wet, such that flash flooding was caused by rainfall of an in. or more in an hour, even in rural areas. Heavy rainfall of 3 to 6 in. occurred in a broad swath extend-ing from west-central into north-central, and parts of central and northeast Iowa. This resulted in widespread flash flooding. Eventually, the rain led to major record flooding along many of the rivers in the state.
On June 12, an unseasonably strong storm system aloft was located over the northern Rockies. This produced a very strong northward push of moisture into Iowa. An intense line of thunderstorms formed from eastern Nebraska into central Kansas. Many of the storms produced pea to marble size hail, with the stronger storms producing hail around nickel size. After sunset, the storms became more wind producers. The big story became the heavy rain. Many of the storms produced rainfall of 1 to 2 in. per hour, with some areas reporting total rainfall of up to 4 or 5 in. With the very wet soil conditions across the state, it only took between 1/2 and 1 in. of rain to cause flash flooding.
A strong cold front moved through eastern Iowa, north-east Missouri, and northern Illinois from June 12 through midday June 13 bringing widespread heavy rains of 1 to 5 in. (with some areas receiving up to around 10 in.), flash flood-ing, large hail, damaging wind gusts, and two isolated weak tornadoes to the region.”
12 Floods of May 30 to June 15, 2008, in the Iowa River and Cedar River Basins, Eastern Iowa
WAT
ER Y
EAR
0
10,0
00
20,0
00
30,0
00
40,0
00
50,0
00
60,0
00
70,0
00
80,0
00
1851
(70,
000
ft3 /s)
1881
(51,
000
ft3 /s)
1918
(42,
500
ft3 /s)
1944
(31,
100
ft3 /s)
1947
(33,
800
ft3 /s)
1993
(28,
200
ft3 /s)
2008
(41,
100
ft3 /s)
DISCHARGE, IN CUBIC FEET PER SECOND (ft3/s)
1850
1860
1870
1880
1890
1900
1910
1920
1930
1940
1950
1960
1970
1980
1990
2000
2009
Figu
re 4
. An
nual
pea
k di
scha
rge
reco
rd fo
r the
stre
amga
ge 0
5454
500
Iow
a Ri
ver a
t Iow
a Ci
ty, I
owa.
Pea
k di
scha
rges
for 1
851
and
1881
wer
e es
timat
ed fr
om fl
ood
elev
atio
ns c
olle
cted
in 1
851
and
1881
by
loca
l sou
rces
.
Floods of May 30 to June 15, 2008 13
Figu
re 5
. An
nual
pea
k di
scha
rge
reco
rd a
nd 1
-per
cent
floo
d pr
obab
ility
for t
he s
tream
gage
054
6450
0 Ce
dar R
iver
at C
edar
Rap
ids,
Iow
a. P
eak
disc
harg
e fo
r 185
1 w
as
estim
ated
from
floo
d el
evat
ions
col
lect
ed in
185
1 by
loca
l sou
rces
.
WAT
ER Y
EAR
1850
1860
1870
1880
1890
1900
1910
1920
1930
1940
1950
1960
1970
1980
1990
2000
2009
0
20,0
00
40,0
00
60,0
00
80,0
00
100,
000
120,
000
140,
000
160,
000
1851
(65,
000
ft3 /s)
1929
(64,
000
ft3 /s)
1961
(73,
000
ft3 /s)
1965
(66,
800
ft3 /s)
1993
(71,
000
ft3 /s)
2008
(140
,000
ft3 /s
)
1-pe
rcen
tflo
od p
roba
bilit
y
1020
3040
5060
7080
9010
010
6
YEAR
S OF
STR
EAM
FLOW
REC
ORD
USED
TO
COM
PUTE
EAC
H 1-
PERC
ENT
FLOO
D PR
OBAB
ILIT
Y ES
TIM
ATE
DISCHARGE, IN CUBIC FEET PER SECOND (ft3/s)
14 Floods of May 30 to June 15, 2008, in the Iowa River and Cedar River Basins, Eastern Iowa
Four-hour cumulative rainfall amounts for May 29 to June 13, 2008, for rain gages at Iowa Falls, Iowa City, Mason City, and Waterloo are shown in figure 6. The rainfall data are collected hourly at each site (U.S. Department of Com-merce, National Oceanic and Atmospheric Administration, and National Climatic Data Center, 2008d and 2008e). The 4-hour cumulative total begins at midnight. The graphs provide a general indication of the timing and intensity of the rainfall in the Iowa River and Cedar River Basins. The greatest rainfall intensity occurred at Iowa Falls between 8 p.m. and midnight on June 7 during which 2.9 in. of rain fell (fig. 6A). Data from the Iowa Falls, Mason City, and Waterloo rain gages indicate that much of the rainfall occurred from May 29–30, and again with even greater amounts, in a 24-hour period from 8 p.m. on June 7 to 8 p.m. on June 8, and also indicate that Mason City recorded the greatest 24-hour and 48-hour rainfall of 6.30 in. and 6.37 in., respectively. The Iowa Falls rain gage recorded the greatest 16-day total of 14.0 in. Little rain fell across east-ern Iowa from May 31 to June 2.
Isohyetal maps of the areal distribution of rainfall for the 16-day period beginning at 7:00 a.m. on May 29 and ending at 7:00 a.m. on June 13, 2008, are shown in figures 1 and 2; data were provided by Harry Hillaker, State Climatologist, Iowa Department of Agriculture and Land Stewardship (written commun., October 2009). Each 24-hour rainfall amount from May 29 to June 13, 2008, for 34 selected rain gages in the Iowa River and Cedar River Basins is listed in table 5 (U.S. Department of Commerce, National Oceanic and Atmo-spheric Administration, and National Climatic Data Center, 2008b, 2008c, 2008d, 2008e; and Hillaker, 2008b, 2008c). The 16-day rainfall total listed in table 5 from May 29 to June 13 is the time period for which the most significant rainfall could be considered directly contributing to the flooding of May 30 to June 15, 2008. Sixteen-day rainfall totals recorded at Iowa Falls and Clutier on June 13 were 14.0 and 13.83 in., respectively.
The Rainfall Frequency Atlas of the Midwest (Huff and Angel, 1992) provides a table of the mean distribution of theo-retical rainfall amounts for climatological divisions in Iowa for selected rain periods and probabilities (recurrence intervals). The magnitude and probability of theoretical rainfall amounts for selected rain periods (durations) from the table in Huff and Angel (1992) for 5 of the 9 climatological divisions in Iowa are listed in table 6. Twelve of the 34 rain gages listed in table 5 are in the North-Central Iowa Climatological Division, 11 of the rain gages are located in the Central Climatological Division, 8 in the East-Central Climatological Division, 2 in the Northeast Climatological Division, 1 is located in the Southeast Climatological Division (U.S. Department of Com-merce, National Oceanic and Atmospheric Administration, and National Climatic Data Center, 2008b, 2008c, 2008d, 2008e; and Hillaker, 2008b, 2008c). A map showing the location of climatological divisions in Iowa is available at http://www.esrl.noaa.gov/psd/data/usclimdivs/data/map.html. The greatest 48-hour rainfalls listed in table 5 exceeded 5 in. at seven rain gages located in two climatological divisions (Mason City and
Osage rain gages located in the North-Central Climatologi-cal Division, and Clutier, Garwin, Iowa Falls, and Toledo rain gages located in the Central Climatological Division). Rainfall probabilities for greatest 48-hour rainfalls for 6 of these 7 rain gages are all estimated to be 4 to 10 percent. The rainfall probability for the largest 48-hour rainfall value listed in table 5 (6.37 in.) for the Mason City Municipal Airport rain gage is estimated to be 2 to 4 percent (table 6).
Probabilities for two different components of a hydro-logic event – rainfall and runoff, respectively, and for various locations in the Iowa River and Cedar River Basins are listed in tables 6 and 3. Although the probability is an estimate of the likelihood of a rainfall or flood discharge of a specific magni-tude occurring in any one year, more than one rainfall or flood discharge with a specific magnitude and probability could occur in the same year.
Flood Description
Severe flooding occurred in the Iowa River and Cedar River Basins as a result of the long and intense periods of rain that fell in late May and early June. The 2008 peak discharges for 54 streamgages in the Iowa River and Cedar River Basins are listed in table 3. Also listed in the table are selected histori-cal peak discharges.
Hydrographs of instantaneous discharges measured at selected continuous-record streamgages on the Iowa and Cedar Rivers are presented in figures 7A, 7B, 8A, and 8B. The period of record shown is May 29 to July 15, 2008. The streamgages record instantaneous values at 15- or 30-minute time intervals. Gaps in the hydrograph lines indicate missing data that resulted because of equipment malfunction caused by the flooding. Also shown on the hydrographs are lines denoting discharge estimates for selected flood probabilities. The flood-probability range listed in table 3 for the sites is the range between the flood-probability discharges that bracket the flood peak discharge. For example, the 2008 peak discharge at streamgage 05465000 Cedar River near Conesville, Iowa (fig. 2, site 101) falls between the 1-percent and 0.2-percent flood-probability estimates (table 3 and fig. 8B). Flood probability estimates for all streamgages downstream of from Coralville Dam were computed by the USACE (U.S. Army Corps of Engineers, 2009).
Discharge hydrographs for the 2008 water year for the streamgages 05454500 Iowa River at Iowa City, Iowa (fig. 1, site 37) and 05464500 Cedar River at Cedar Rapids, Iowa (fig. 2, site 90) are shown on figures 9 and 10. Also shown are long-term median daily discharges calculated for the regulated period of record (1959–2008) for streamgage 05454500 Iowa River at Iowa City, Iowa and calculated for the entire period of record (1903–2008) for streamgage 05464500 Cedar River at Cedar Rapids, Iowa. The discharge for the National Weather Service (NWS) flood stage at each streamgage also is shown. From October to late May, streamflows at both streamgages stayed almost consistently above the long-term median daily
Floods of May 30 to June 15, 2008 15
X-DATA
0
0.5
1.0
1.5
2.0
2.5
3.0
0
0.5
1.0
1.5
2.0
2.5
3.0
0
0.5
1.0
1.5
2.0
2.5
3.0
0
0.5
1.0
1.5
2.0
2.5
3.0
B. Iowa City
A. Iowa Falls
C. Mason City Municipal Airport
D. Waterloo Municipal Airport
June 3 June 4 June 5 June 6 June 7 June 8 June 9 June 10 June 11 June 12 June 13 June 14
Four-hour cumulative rainfall for hour ending.Greatest 24-hour rainfall shown is 2.2 inchesGreatest 48-hour rainfall shown is 2.5 inches.Total 16-day rainfall shown is 5.8 inches.
Four-hour cumulative rainfall for hour ending.Greatest 24-hour rainfall shown is 5.1 inches.Greatest 48-hour rainfall shown is 5.1 inches.Total 16-day rainfall shown is 14.0 inches.
Three-hour cumulative rainfall for hour ending.Greatest 24-hour rainfall shown is 6.30 inches.Greatest 48-hour rainfall shown is 6.37 inches.Total 16-day rainfall shown is 12.83 inches.
Four-hour cumulative rainfall for hour ending.Greatest 24-hour rainfall shown is 3.41 inches.Greatest 48-hour rainfall shown is 3.41 inches.Total 16-day rainfall shown is 10.69 inches.
June 2June 1May 31May 30May 29
RAIN
FALL
,IN IN
CHES
Figure 6. Four-hour cumulative rainfall for May 29 to June 13, 2008, at four rain gages in the Iowa River and Cedar River Basins (U.S. Department of Commerce, National Oceanic and Atmospheric Administration, and National Climatic Data Center, 2008d, 2008e).
16 Floods of May 30 to June 15, 2008, in the Iowa River and Cedar River Basins, Eastern IowaTa
ble
5.
Twen
ty-fo
ur-h
our r
ainf
all a
mou
nts
at s
elec
ted
rain
gag
es in
eas
tern
Iow
a fro
m M
ay 2
9 to
Jun
e 13
, 200
8.
[ND
, no
data
; T, T
race
; *, r
ainf
all i
nclu
ded
in th
e ne
xt d
ay to
tal]
Rain gage
Observation time
24-h
our r
ainf
all,
in in
ches
1,2,
3
Greatest 48-hour rainfall total, in
inches
16-day rainfall total, in inches
May 29, 2008
May 30, 2008
May 31, 2008
June 1, 2008
June 2, 2008
June 3, 2008
June 4, 2008
June 5, 2008
June 6, 2008
June 7, 2008
June 8, 2008
June 9, 2008
June 10, 2008
June 11, 2008
June 12, 2008
June 13, 2008
Alli
son
7 a.
m.
0.16
2.05
00
00.
210.
291.
600.
910
2.12
0.96
00
1.25
03.
089.
55B
elle
Pla
ine
7 a.
m.
1.62
.02
00
0.52
.71
1.69
.22
00
1.10
1.05
01.
70.3
50
2.40
8.98
Bro
okly
n7
a.m
.0
1.23
00
0.6
21.
121.
58.3
00
.13
1.20
1.13
02.
140.
342.
709.
79B
ucke
ye6
a. m
..4
0N
DN
D0
0.7
8.1
6.8
91.
300
3.22
1.25
.13
01.
570
4.47
9.70
Ced
ar R
apid
s Ap
Mid
nigh
t.3
51.
060
T.3
0.6
1.2
11.
38.1
8T
2.41
.14
.42
.06
1.73
02.
558.
85C
edar
Rap
ids-
15
p.m
..3
81.
350
0.2
2.4
40
1.30
.16
01.
13.4
1.3
6.0
93.
35.4
23.
779.
61C
harle
s City
7 a.
m.
T2.
180
00
.39
.17
1.66
.91
03.
381.
40.0
50
1.59
.07
4.78
11.8
Clu
tier
7 a.
m.
.13
*5.
740
0.7
70
1.24
.03
00
3.28
.73
01.
72.1
95.
7413
.83
Dum
ont
7 a.
m.
.55
2.05
00
0.6
10
2.59
1.20
03.
42.8
30
00
1.59
4.25
12.8
4El
dora
7 a.
m.
.43
2.84
00
0.7
6.0
4.7
11.
590
1.70
.03
.06
02.
230
3.27
10.3
9Fo
rest
City
2 N
NE
Mid
nigh
t31.
500
.20
00
.30
.40
.30
.20
1.40
2.90
00
1.50
.40
04 4
.30
9.10
Gar
win
7 a.
m.
05.
400
00
.30
.44
.64
.54
T2.
760
.54
02.
220
5.40
12.8
4G
ilman
7 a.
m.
02.
150
00
.70
1.0
1.35
.45
0.0
22.
75.8
20
1.84
.25
3.57
11.3
3G
rund
y C
ente
r7
a.m
..5
52.
59T
00
.68
.12
.53
.73
01.
40.7
1.1
30
2.69
.02
3.14
10.1
5H
ampt
on7
a.m
..5
72.
540
00
.48
01.
62.8
50
3.65
.73
.02
01.
11.0
64.
3811
.63
Ioni
a 2
W8
a.m
.0
2.38
00
00
01.
55.8
70
1.93
1.68
.04
01.
650
3.61
10.1
Iow
a C
ityM
idni
ght3
0.5
00
0.1
02.
100
.40
.20
0.7
00
.50
01.
300
4 2.5
05.
80Io
wa
Falls
Mid
nigh
t32.
60.7
00
.10
.20
.50
1.40
.60
1.20
2.90
2.20
00
.60
1.0
04 5
.10
14.0
Lake
Mill
s7
a.m
..4
62.
240
00
.22
.02
.44
.39
02.
60.7
00
.02
3.25
03.
3010
.34
Mar
shal
ltow
n7
a.m
..0
23.
170
00
.79
.40
1.18
.57
0.2
22.
0.4
00
2.62
T3.
1911
.37
Mas
on C
ity7
a.m
..3
12.
63.0
20
0.4
0.0
2.9
4.4
80
3.47
1.61
.01
T1.
360
5.08
11.2
5M
ason
City
Mun
i AP
Mid
nigh
t32.
93.2
50
0.0
3.4
2.5
8.6
2.2
41.
394.
91.0
3T
.99
.44
04 6
.37
12.8
3N
orth
woo
d7
a.m
..6
31.
740
00
.16
0.4
9.4
1.1
93.
63.8
90
.13
2.49
04.
5210
.76
Osa
ge7
p.m
..4
32.
0T
00
.36
.05
.90
.60
03.
631.
500
1.65
1.80
05.
1312
.92
Park
ersb
urg
7 a.
m.
02.
640
00
00
00
03.
500
00
2.10
03.
508.
24Po
pejo
y 1S
7 a.
m.
03.
450
00
.51
01.
70.5
90
4.10
00
1.73
00
4.10
12.0
8Sw
ishe
r7
a.m
.0
2.02
00
00
1.49
1.58
.21
0.0
22.
61.3
00
.80
.84
3.07
9.87
Tipt
on7
a.m
.T
.58
.16
00
.07
.52
.76
.32
0.0
8.5
1.4
00
.04
.76
1.28
4.20
Tole
do 3
N7
a.m
.T
5.22
00
0.3
9.3
3.9
7.3
60
T3.
16.5
70
2.49
.13
5.22
13.6
2V
into
n7
a.m
.0
4.25
00
0.1
2.5
01.
0.2
50
02.
41.4
00
1.57
.84
4.25
11.3
4W
alfo
rd 2
SE
7 a.
m.
01.
770
00
.50
.60
1.48
.30
00
2.54
.44
01.
65.9
52.
9810
.23
Wap
ello
7 a.
m.
00
1.11
00
01.
300
.57
0.3
9.6
6.3
30
03.
523.
527.
88W
ater
loo
Mun
i AP
Mid
nigh
t31.
92.9
10
0.0
4.5
1.0
31.
25.4
61.
521.
89.1
5T
.60
1.41
04 3
.41
10.6
9Ze
arin
g7
a.m
..1
64.
150
00
1.12
.02
.49
1.81
01.
33.1
8.1
5T
2.38
04.
3111
.79
1 Clim
atol
ogic
al D
ata,
Iow
a (U
.S. D
epar
tmen
t of C
omm
erce
, Nat
iona
l Oce
anic
and
Atm
osph
eric
Adm
inis
tratio
n, a
nd N
atio
nal C
limat
ic D
ata
Cen
ter,
2008
b, 2
008c
).2 Io
wa
Clim
ate
Rev
iew
(Iow
a D
epar
tmen
t of A
gric
ultu
re a
nd L
and
Stew
ards
hip,
Sta
te C
limat
olog
ist O
ffice
, 200
8b, 2
008c
).3 H
ourly
Pre
cipi
tatio
n D
ata,
Iow
a (U
.S. D
epar
tmen
t of C
omm
erce
, Nat
iona
l Oce
anic
and
Atm
osph
eric
Adm
inis
tratio
n, a
nd N
atio
nal C
limat
ic D
ata
Cen
ter,
2008
d, 2
008e
).4 C
alcu
late
d fr
om h
ourly
pre
cipi
tatio
n da
ta sh
own
on fi
gure
6.
Floods of May 30 to June 15, 2008 17
discharge (figs. 9 and 10). At Cedar Rapids, snowmelt runoff and rainfall produced flood peaks throughout March and April in 2008 that exceeded the flood stage and are indicative of the high streamflow conditions leading up to the flooding in June (fig. 10). Operation of the Coralville Dam reduced discharges at Iowa City below the flood stage during March and April in 2008 (fig. 9). The hydrograph of the 1993 flood shown in figures 9 and 10 is compared to the 2008 flood in Appendix 1.
Iowa River BasinMajor flooding (flood probability less than 2 percent)
began in the middle part of the Iowa River Basin on May 30, 2008, at the streamgage 05452000 Salt Creek near Elberon, Iowa (fig.1, site 18). The peak discharge at the Elberon streamgage of 22,400 ft3/s is estimated to have a flood prob-ability of 0.2 to 1 percent. Major flooding occurred in the upper part of the Iowa River Basin on June 9, 2008, at the streamgage 05449500 Iowa River near Rowan, Iowa (fig. 1, site 10, and fig. 7A). The peak discharge of 7,890 ft3/s at the Rowan streamgage occurred at 11:30 p.m. on June 9. The flooding that began in the upper and middle parts of the Iowa River Basin became severe flooding on the mainstem of the Iowa River in the lower part of the basin from the vicinity of Marengo to the mouth of the Iowa River. On June 10, a sharp increase in discharge occurred at the streamgage 05453100 Iowa River at Marengo, Iowa (fig. 1, site 22, and fig. 7A), and at 8:20 p.m. on the same day, Coralville Lake overtopped the spillway of the Coralville Dam (http://www.mvr.usace.army.mil/Coralville/Flood1993Facts.htm, accessed December 3, 2009). Peak discharges for the streamgages 05451500 Iowa River at Marshalltown, Iowa (fig.1, site 14) and 05453100 Iowa River at Marengo, Iowa (fig. 7A) occurred on June 13 and June 12, 2008, respectively. The peak discharge at the Marshalltown streamgage was 22,400 ft3/s. At Marengo, the peak discharge was 51,000 ft3/s and is the largest peak dis-charge on record. Between the streamgages at Marshalltown and Marengo the flood probability increased from greater than 2 percent to less than 1 percent as indicated on figure 7A. A number of tributaries flow into the Iowa River between the streamgages at Marshalltown and Marengo (fig.1 and table 3) and the tributaries contributed to the timing and magnitude of the record peak discharge at Marengo. Continuous-record streamgages (hydrographs not shown) located on these tribu-taries include 05451700 Timber Creek near Marshalltown, Iowa (fig. 1, site 15), 05451900 Richland Creek near Haven, Iowa (fig. 1, site 16), 05452000 Salt Creek near Elberon, Iowa (fig 1, site 18), 05452200 Walnut Creek near Hartwick, Iowa (fig. 1, site 19), and 05453000 Big Bear Creek at Ladora, Iowa (fig. 1, site 21). The streamgages at Timber Creek and Richland Creek measured peak-of-the-year discharges on June 8 and the Big Bear Creek streamgage measured peak-of-the-year discharge on June 12 (table 3). The streamgages at Salt Creek and Walnut Creek also measured less significant peak discharges on June 8 and June 12, 2008 (not listed in table 3). The timing of these tributary peak flows to the Iowa River, as well as flood-plain storage effects between Marshalltown and Marengo, probably contributed to the peak discharge at Marengo occurring earlier than the peak discharge at Mar-shalltown. Coralville Lake reached a record maximum pool elevation of 717.02 ft on June 15, 2008, and downstream from Coralville Lake the streamgage 05453520 Iowa River below Coralville Dam near Coralville, Iowa (fig. 1, site 25, and fig. 7B) measured a peak discharge of 39,900 ft3/s on June 15, 2008, at 4:00 a.m. The 2008 peak discharge for the streamgage
Table 6. Magnitude and probability of theoretical rainfall amounts for selected storm periods in the North-Central, Central, East-Central, Northeast, and Southeast Iowa Climatological Divisions.
18 Floods of May 30 to June 15, 2008, in the Iowa River and Cedar River Basins, Eastern Iowa
05453520 Iowa River below the Coralville Dam, Iowa is the largest discharge measured for the period of record, 1993–2008 (flood-probability estimate of 0.2-1 percent, U.S. Army Corps of Engineers, 2009). At 6:30 a.m. on June 15, 2008, a peak discharge of 41,100 ft3/s was measured at the streamgage 05454500 Iowa River at Iowa City, Iowa (fig. 1, site 37, and fig. 7B) and at 9:30 a.m. on the same day, a peak discharge of 53,700 ft3/s was measured at the streamgage 05455700 Iowa River at Lone Tree, Iowa (fig. 1, site 51, and fig. 7B). The 2008 peak discharge for the streamgage at Iowa City is the
fourth highest for the entire peak-flow record (flood-probabil-ity estimate of 0.2-1 percent, U.S. Army Corps of Engineers, 2009) and is the highest peak discharge since operation of Coralville Dam began in 1958. The 2008 peak discharge at the Iowa River near Lone Tree streamgage is the second highest for the period of record (flood-probability estimate of 0.2-1 percent, U.S. Army Corps of Engineers, 2009); the largest peak discharge on record occurred in 1993 (table 3). The largest recorded discharge in the Iowa River Basin occurred at the streamgage 05465500 Iowa River at Wapello, Iowa (fig.
Figure 7. Discharge hydrographs for selected streamgages on the Iowa River upstream from the confluence with the Cedar River, May 29 to July 15, 2008. Also shown are flood probabilities in percent at each streamgage and discharges corresponding to the National Weather Service (NWS) flood stage at two streamgages. Location of streamgages shown in figure 1.
1, site 103, and fig. 8B), which measures the combined flows of the Iowa and Cedar Rivers. The peak discharge at Wapello of 188,000 ft3/s occurred on June 14, 2008, at 12:30 p.m. (flood-probability estimate of less than 0.2 percent, U.S. Army Corps of Engineers, 2009). The timing and magnitude of the 2008 peak on the Iowa River at Wapello coincides with the high flow on the Iowa River near Lone Tree (fig. 7B) and the peak discharge at the streamgage 05465000 Cedar River near Conesville, Iowa (fig. 2, site 101, and fig. 8B), which occurred
on June 14. Flood probabilities along the mainstem of the Iowa River from Marengo to the mouth were all less than 1 percent as shown on figures 7A, 7B and 8B.
The flood stage established by the National Weather Service for the streamgage 05451500 Iowa River at Marshall-town, Iowa is 18.0 ft, which is the stage at which significant flooding occurs on land along State Highway 330 northwest of Marshalltown as well as nearby agricultural land (at http://water.weather.gov/ahps2/hydrograph.php?wfo=dmx&gage
Figure 7. Discharge hydrographs for selected streamgages on the Iowa River upstream from the confluence with the Cedar River, May 29 to July 15, 2008. Also shown are flood probabilities in percent at each streamgage and discharges corresponding to the National Weather Service (NWS) flood stage at two streamgages. Flood probabilities for these three regulated streamgages were computed by the U.S. Army Corps of Engineers (2009). Location of streamgages shown in figure 1.—Continued
05453520 Iowa River below Coralville Dam near Coralville, Iowa
Figure 8. Discharge hydrographs for selected streamgages on the Cedar River, May 29 to July 15, 2008. Also shown are flood probabilities in percent at each streamgage and discharges corresponding to the National Weather Service (NWS) flood stage. Locations of streamgages shown in figure 2.
Floods of May 30 to June 15, 2008 21
=miwi4&view=1,1,1,1,1,1,1,1). The streamgage Iowa River at Marshalltown was above flood stage from May 30 to June 1, and again June 6–17 (fig. 7A), and the peak stage of 21.79 ft (table 3) exceeded the flood stage at this site by 3.79 ft. The flood stage for the streamgage 05453100 Iowa River at Marengo, Iowa is 14.0 ft, which is the stage at which low lying agricultural land along the river is affected (at http://water.weather.gov/ahps2/hydrograph.php?wfo=dvn&gage=mroi4&view=1,1,1,1,1,1,1,1). The streamgage Iowa River
at Marengo was above flood stage from May 30 to July 3, and again on July 8–9 (fig. 7A), and the peak stage of 21.38 ft (table 3) exceeded the flood stage at this site by 7.38 ft. The flood stage for the streamgage 05454500 Iowa River at Iowa City, Iowa is 22.0 ft, which is the stage at which urban flooding occurs in Iowa City and water enters homes along Edgewater Drive (not shown on map) (at http://water.weather.gov/ahps2/hydrograph.php?wfo=dvn&gage=iowi4&view=1,1,1,1,1,1,1,1). The streamgage Iowa River at Iowa
B.
05464500 Cedar River at Cedar Rapids, Iowa
0
20,000
40,000
60,000
80,000
100,000
120,000
140,000
160,000
180,000
200,000
0
20,000
40,000
60,000
80,000
100,000
120,000
140,000
160,000
180,000
200,000
0
20,000
40,000
60,000
80,000
100,000
120,000
140,000
160,000
180,000
200,000
05465000 Cedar River near Conesville, Iowa
05465500 Iowa River at Wapello, Iowa
Discharge for NWS flood stage of 12 feet
2 percent
1 percent
0.2 percent
Dicharge for NWS flood stage of 13 feet
2 percent
1 percent
0.2 percent
Discharge for NWS flood stage of 20 feet
2 percent
1 percent
0.2 percent
Missing data because of equipmentdamage from flood
Missing data because of temporary gages beingmoved because of decreasing water levels
Figure 8. Discharge hydrographs for selected streamgages on the Cedar River and for streamgage Iowa River at Wapello, Iowa, May 29 to July 15, 2008. Also shown are flood probabilities in percent at each streamgage and discharges corresponding to the National Weather Service (NWS) flood stage. Flood probability for the Iowa River at Wapello, Iowa, streamgage was computed by the U.S. Army Corps of Engineers (2009). Locations of streamgages shown in figures 1–2.—Continued
22 Floods of May 30 to June 15, 2008, in the Iowa River and Cedar River Basins, Eastern Iowa
Oct.
1428
Nov
.
1428
Dec.
1428
Jan.
1428
Feb.
1428
Mar
.
1428
Apr.
2008
2007
1428
May14
28
June
1428
July
1428
Aug.
1428
Sept
.
1428
0
10,0
00
20,0
00
30,0
00
40,0
00
50,0
00
2008
Wat
er Y
ear
1993
Wat
er Y
ear
Med
ian
Daily
Sta
tistic
(50
year
s)
0545
4500
Iow
a Ri
ver a
t Iow
a Ci
ty, I
owa
0.2
perc
ent
1 pe
rcen
t
2 pe
rcen
t
Disc
harg
e fo
r Nat
iona
l Wea
ther
Ser
vice
floo
d st
age
of 2
2 fe
et
For t
he 2
008
wat
er y
ear,
daily
mea
n di
scha
rge
valu
es fo
r Mar
ch 1
3−15
and
22−
24 w
ere
estim
ated
be
caus
e of
equ
ipm
ent p
robl
ems
Disc
harg
es a
t ind
icat
edflo
od p
roba
bilti
esDISCHARGE, IN CUBIC FEET PER SECOND
Figu
re 9
. Di
scha
rge
hydr
ogra
phs
of th
e st
ream
gage
054
5450
0 Io
wa
Rive
r at I
owa
City
, Iow
a, O
ctob
er 1
, 200
7, to
Sep
tem
ber 3
0, 2
008
(200
8 w
ater
yea
r), a
nd O
ctob
er 1
, 19
92, t
o Se
ptem
ber 3
0, 1
993
(199
3 w
ater
yea
r). D
isch
arge
s ar
e da
ily m
ean
valu
es. T
he lo
ng-te
rm m
edia
n da
ily d
isch
arge
val
ues
wer
e co
mpu
ted
for 5
0 ye
ars
of re
cord
, 19
59 to
200
8 (p
ost-d
am c
onst
ruct
ion)
. Flo
od p
roba
bilit
y co
mpu
ted
by th
e U.
S. A
rmy
Corp
s of
Eng
inee
rs (2
009)
. Loc
atio
n of
stre
amga
ge s
how
n in
figu
re 1
.
Floods of May 30 to June 15, 2008 23
Figu
re 1
0.
Disc
harg
e hy
drog
raph
s of
the
stre
amga
ge 0
5464
500
Ceda
r Riv
er a
t Ced
ar R
apid
s, Io
wa,
Oct
ober
1, 2
007,
to S
epte
mbe
r 30,
200
8 (2
008
wat
er y
ear),
and
Oc
tobe
r 1, 1
992,
to S
epte
mbe
r 30,
199
3 (1
993
wat
er y
ear).
Dis
char
ges
are
daily
mea
n va
lues
. The
long
-term
med
ian
daily
dis
char
ge v
alue
s w
ere
com
pute
d fo
r 106
ye
ars
of re
cord
, 190
3 to
200
8. L
ocat
ion
of s
tream
gage
sho
wn
in fi
gure
2.
1428
1428
1428
1428
1428
1428
1428
1428
1428
1428
1428
1428
0
20,0
00
40,0
00
60,0
00
80,0
00
100,
000
120,
000
140,
000
160,
000
0546
4500
Ced
ar R
iver
at C
edar
Rap
ids,
Iow
a
0.2
perc
ent
1 pe
rcen
t
2 pe
rcen
t
Disc
harg
e fo
r Nat
iona
l Wea
ther
Ser
vice
floo
d st
age
of 1
2 fe
et
For t
he 2
008
wat
er y
ear,
daily
mea
n di
scha
rge
valu
es w
ere
estim
ated
for m
uch
of th
e pe
riod
Dece
mbe
r 3 to
Mar
ch 1
7 be
caus
e ic
e af
fect
s th
e st
age-
disc
harg
e re
latio
n
For t
he 2
008
wat
er y
ear,
daily
mea
n di
scha
rge
valu
e fo
r May
4 w
as e
stim
ated
bec
ause
of
equi
pmen
t pro
blem
s. D
aily
mea
n di
scha
rge
valu
es
wer
e es
timat
ed fo
r Jun
e 12
, 15,
19,
and
25−
26
beca
use
of fl
ood
rela
ted
equi
pmen
t pro
blem
s
Disc
harg
e at
indi
cate
dflo
od p
roba
bilit
ies
2008
Wat
er Y
ear
1993
Wat
er Y
ear
Med
ian
Daily
Sta
tistic
(106
yea
rs)
Oct.
Nov
.De
c.Ja
n.Fe
b.M
ar.
Apr.
2008
2007
May
June
July
Aug.
Sept
.
DISCHARGE, IN CUBIC FEET PER SECOND
24 Floods of May 30 to June 15, 2008, in the Iowa River and Cedar River Basins, Eastern Iowa
City was above flood stage from June 5 to July 7 (figs. 7B), and the peak stage of 31.53 ft (table 3) exceeded the flood stage at this site by 9.53 ft. The flood stage for the streamgage 05455700 Iowa River near Lone Tree, Iowa is 15.0 ft, which is the stage at which low lying roads are affected (at http://water.weather.gov/ahps2/hydrograph.php?wfo=dvn&gage=lnti4&view=1,1,1,1,1,1,1,1). The streamgage Iowa River near Lone Tree was above flood stage from June 3 to July 10 (fig. 7B), and the peak stage of 23.10 ft (table 3) exceeded the flood stage at this site by 8.10 ft. The flood stage for the streamgage 05465500 Iowa River at Wapello, Iowa, is 20.0 ft, and at 22.0 ft homes near the U.S. Highway 61 bridge are affected by water (at http://water.weather.gov/ahps2/hydrograph.php?wfo=dvn&gage=wapi4&view=1,1,1,1,1,1,1,1). The streamgage Iowa River at Wapello was above flood stage from June 1 to July 6, and again from July 13–15 (fig. 8B), and the peak stage of 32.15 ft (table 3) exceeded the flood stage at this site by 12.15 ft. Flood stages are not available for the streamgage 05449500 Iowa River near Rowan, Iowa, (fig. 7A) and the streamgage 05453520 Iowa River below Coralville Dam, Iowa, (fig. 7B).
Cedar River BasinFlooding in the upper and middle parts of the Cedar
River Basin began on May 30, 2008. The peak discharge at streamgage 05464220 Wolf Creek Creek near Dysart, Iowa, (fig. 2, site 85) was 15,700 ft3/s and is the largest peak discharge for the period of record and has an estimated flood-probability range of 2 to 4 percent. On June 8, the peak discharges at streamgages 05459500 Winnebago River at Mason City, Iowa, (fig. 2, site 68) and 05463000 Beaver Creek at New Hartford, Iowa, (fig. 2, site 76) were 13,100 ft3/s and 25,900 ft3/s, respectively. Peak discharges were the largest for the respective periods of record and have estimated flood probability ranges of 0.2 to 1 percent. On June 9, the peak dis-charges at streamgages 05457700 Cedar River at Charles City, Iowa, (fig. 2, site 56, and fig. 8A) and 05458000 Little Cedar River near Ionia, Iowa, (fig. 2, site 59) were 34,600 ft3/s and 24,700 ft3/s, respectively. These peak discharges also were the largest for the respective periods of record and have estimated flood-probability ranges of 0.2 to 1 percent. On June 10, peak discharges at streamgages 05458300 Cedar River at Waverly, Iowa, (fig. 2, site 60, and fig. 8A) and 05458500 Cedar River at Janesville, Iowa, (fig. 2, site 61, and fig. 8A) were 52,600 ft3/s and 53,400 ft3/s, respectively. These peak discharges were the largest for the respective periods of record. The estimated flood-probability at Waverly is less than 0.2 percent and at Janesville is 0.2 to 1 percent. Also on June 10, a peak dis-charge of 60,400 ft3/s was measured at streamgage 05462000 Shell Rock River at Shell Rock, Iowa, (fig. 2, site 74) and is the largest peak discharge for the period of record with an estimated flood probability of less than 0.2 percent. On June 11 at 3:00 a.m., the Cedar River crested at the streamgage 05464000 Cedar River at Waterloo, Iowa, (fig. 2, site 79, and fig. 8A), with a new peak-record discharge of 112,000 ft3/s
(flood-probability estimate of 0.2 to 1 percent). In Cedar Rap-ids, the maximum discharge at streamgage 05464500 Cedar River at Cedar Rapids, Iowa, (fig. 2, site 90, and fig. 8B) was 140,000 ft3/s, which occurred June 13 at 10:15 a.m. The esti-mated flood-probability of the peak discharge is less than 0.2 percent. The maximum stage was 31.12 ft, which was 11.12 ft higher than the previous maximum stage of 20.00 ft, which occurred March 18, 1929 (table 3). Because the flooded river was approximately 1.6 mi wide and filled with urban obstruc-tions and hazards, it was not possible to measure the peak discharge at the 05464500 Cedar River at Cedar Rapids, Iowa, streamgage. The maximum discharge was prorated from a discharge measurement made 9.9 mi downstream at the Cedar River at Highway 30 (fig. 2; the site was a USGS site used in the profile and also was established to collect water-quality data for the 2008 flood and is otherwise not the location of a streamgage). The discharge measured at the U.S. Highway 30 site was 150,000 ft3/s. On June 14, a record peak discharge at streamgage 05465000 Cedar River near Conesville, Iowa, (fig. 2, site 101, and fig. 8B) was 127,000 ft3/s. The flood-probability range of the peak discharge is 0.2 to 1 percent. The peak discharge at Conesville was less than the peak discharge at Cedar Rapids because of flood-plain storage effects. Within the Cedar River Basin, the May 30 to June 15, 2008, flood is the largest on record at all six streamgages located on the mainstem of the Cedar River and at five streamgages located on the major tributaries. Flood-probability estimates for 10 of these 11 streamgages are less than 1 percent. Flood probabili-ties at all six streamgages along the mainstem of the Cedar River from Charles City to the confluence with the Iowa River were all less than 1 percent as shown in figures 8A and 8B.
The flood stage established by the National Weather Service for the streamgage 05457700 Cedar River at Charles City, Iowa, is 12.0 ft, which is the stage at which localized street flooding begins and barricades are put in place (at http://water.weather.gov/ahps2/hydrograph.php?wfo=arx&gage=ccyi4&view=1,1,1,1,1,1,1,1). The streamgage Cedar River at Charles City was above flood stage from June 8–11, and again from June 12–15 (fig. 8A), and the peak stage of 25.33 ft (table 3) exceeded the flood stage by 13.33 ft. The flood stage at the streamgage 05458300 Cedar River at Waverly, Iowa, is 11.5 ft, which is the stage at which lowland flooding of city parks occurs (at http://water.weather.gov/ahps2/hydrograph.php?wfo=dmx&gage=wvli4&view=1,1,1,1,1,1,1,1). The streamgage Cedar River at Waverly was above flood stage, based on gage-height data (not shown), from June 9–12, and again from June 13–16 (fig. 8A). The flood stage was exceeded by 7.83 ft with a peak stage of 19.33 ft (table 3). At the streamgage 05458500 Cedar River at Janesville, Iowa, the flood stage is 11.0 ft and is the stage at which lowland flooding of the city park occurs (at http://water.weather.gov/ahps2/hydrograph.php?wfo=dmx&gage=jani4&view=1,1,1,1,1,1,1,1). The streamgage Cedar River at Janesville was possibly above flood stage from June 9–16, but because of missing data caused by equipment damage from flooding, it is uncertain whether the stage fell below flood stage sometime on June 12
Floods of May 30 to June 15, 2008 25
or 13 (fig. 8A) as was the case at Charles City and Waverly. The flood stage at the streamgage Cedar River at Janesville was exceeded by 8.45 ft with a peak stage of 19.45 ft (table 3). At the streamgage 05464000 Cedar River at Waterloo, Iowa, the flood stage is 12.0 ft. At 11.5 ft, nearby low-lying agricultural land becomes flooded, and at 13.0 ft, minor street flooding in Evansdale (not shown on map) occurs (at http://water.weather.gov/ahps2/hydrograph.php?wfo=dmx&gage=aloi4&view=1,1,1,1,1,1,1,1). The streamgage Cedar River at Waterloo was above flood stage from June 7–19 (fig. 8A) and was exceeded by 15.01 ft with a peak stage of 27.01 ft (table 3). At the streamgage 05464500 Cedar River at Cedar Rap-ids, Iowa, the flood stage is 12.0 ft. At 11.5 ft, water affects Osborn Park (not shown on map) in Cedar Rapids, and at 12.7 ft, water affects the water treatment plant in Palo (at http://water.weather.gov/ahps2/hydrograph.php?wfo=dvn&gage=cidi4&view=1,1,1,1,1,1,1,1). The streamgage 05464500 Cedar River at Cedar Rapids, Iowa, was above flood stage from June 8–21 (figs. 8B). The flood stage was exceeded by 19.12 ft by a peak stage of 31.12 ft (table 3). Approximately 75 mi downstream at the streamgage 05465000 Cedar River near Conesville, Iowa, the flood stage is 13.0 ft and is the stage at which flooding affects Edgewater Road and 245th Street (not shown on map) near Conesville (at http://water.weather.gov/ahps2/hydrograph.php?wfo=dvn&gage=cnei4&view=1,1,1,1,1,1,1,1). The streamgage Cedar River near Cones-ville was above flood stage from May 31 to June 26 (fig. 8B) and the flood stage was exceeded by 10.37 ft by a peak stage of 23.37 ft (table 3).
Flood Runoff
Flood runoff in 2008 along the mainstem of the Cedar River was greater than along the mainstem of the Iowa River. The relation between unit runoff values (flood runoff) for 2008 peak discharges and drainage area for streamgages on the mainstems of the Iowa and Cedar Rivers is shown in figure 11. Unit runoff values listed in table 3 represent an average discharge per square mile; they are calculated by dividing the peak discharge by the drainage area of the basin upstream from the streamgage. Unit runoff values allow for the comparison of average discharge per square mile between different watersheds with similar sizes of drainage areas. For example, the streamgages 05451500 Iowa River at Marshall-town, Iowa, (fig. 1, site 14) and 05458300 Cedar River at Waverly, Iowa, (fig. 2, site 60) have similar sizes of drainage areas (1,532 mi2 and 1,547 mi2, respectively); but unit runoff values for the 2008 flood peak (table 3, fig. 11) indicate that average discharge per square mile in the Cedar River Basin upstream from the streamgage Cedar River at Waverly, Iowa, was nearly 133 percent greater than average discharge in the Iowa River Basin upstream from the streamgage Iowa River at Marshalltown, Iowa. Along the Iowa River, unit runoff values increased from the streamgage at Marshalltown, Iowa, to the streamgage 05453100 Iowa River at Marengo, Iowa,
(fig. 1, site 22) indicating substantial tributary flow to the Iowa River between these two streamgages (fig. 11). A substantial decrease in runoff values between the streamgage at Marengo, located upstream from the Coralville Dam, and streamgages 05453520 Iowa River below Coralville Dam near Coralville, Iowa, (fig. 1, site 25) and 05454500 Iowa River at Iowa City, Iowa, (fig. 1, site 37), located downstream from the Coralville Dam, show the storage effects of Coralville Lake on peak dis-charge in the Iowa River during the 2008 flood. Overall, flood runoff in 2008 from peak discharges at streamgages along the mainstem of the Cedar River was greater than flood runoff from peak discharges at streamgages along the mainstem of the Iowa River (fig. 11).
Chronology of Flood Impacts
The following flood description information was obtained from newspaper articles in the Cedar Rapids-Iowa City Gazette (Ebaugh, June12, 2008; Belz, June 14, 2008a, and June 15, 2008b; Hennigan and Muller, June 15, 2008; Boshart, June 16, 2008; Dochterman, June 16, 2008; Hennigan, June 17, 2008; Binegar, June 21, 2008; Smith, December 24, 2009), the Hawk Eye, Burlington, Iowa, (John Mangalonzo, June 15, 2008), the Iowa City Press-Citizen (Sharp, June 16, 2008), the Mason City Globe-Gazette (Skipper, June 10, 2008), Quad City Times (Associated Press, June 14, 2008), the Waterloo-Cedar Falls Courier (Courier Staff, June 9, 2008a; Heinsel-man, June 11, 2008; Wind, June 11, 2008; Courier Staff, June 14, 2008b; Courier Des Moines Bureau, November 8, 2009, and from online sources (accessed January 11, 2010, at http://www.rio.iowa.gov/) obtained from the State of Iowa’s Rebuild Iowa Office (RIO). Along the Iowa and Cedar Rivers, the floods of 2008 exceeded the flooding of 1993 and led to the evacuation of many homes and severely disrupted transporta-tion throughout eastern Iowa. Interstates 80 and 380 were closed and bridges in Waterloo, Cedar Rapids, and Iowa City were closed leading to extensive detours. Railroad traffic also was severely disrupted. A bridge between Mason City and Nora Springs (not shown on map) operated by the Iowa, Chicago and Eastern Railroad (IC&E Railroad) was washed out. Amtrak service was rerouted away from Iowa and a number of passengers were put onto buses. On June 8 in Mason City, floodwaters from the Winnebago River inundated the water-treatment plant and city officials reported that the wastewater-treatment plant came within 4 in. of a shut down. Along the Cedar River in Charles City, an estimated 100 residents were evacuated overnight from June 8 to June 9, and more than 500 homes had been damaged by floodwaters. On June 10, 2008, city officials in Waverly estimated 500 homes and businesses were affected by the flooding, about 100 people had been evacuated, and approximately 1,000 homes and businesses were without power. Flooded bridges and roadways blocked east to west traffic through Waverly. On June 10 in Waterloo, the levee system continued to hold back floodwaters from the Cedar River but lift stations could not
26 Floods of May 30 to June 15, 2008, in the Iowa River and Cedar River Basins, Eastern Iowa
DRAI
NAG
E AR
EA, I
N S
QUAR
E M
ILES
200
500
1,00
02,
000
5,00
010
,000
20,0
001020304050
Ceda
r Riv
er s
tream
gage
sIo
wa
Rive
r stre
amga
ges
Stre
amga
ge b
elow
the
conf
luen
ce o
f Iow
a an
d Ce
dar R
iver
s
Row
an
Char
les
City
Wav
erly
Jane
svill
e
Mar
shal
ltow
n
Mar
engo
Wat
erlo
oCe
dar R
apid
s
Cone
svill
e
Wap
ello
Lone
Tre
eCo
ralv
ille
Dam
Iow
a Ci
ty
UNIT RUNOFF VALUE, IN CUBIC FEET PER SECOND PER SQUARE MILE
Figu
re 1
1.
Rela
tion
betw
een
unit
runo
ff va
lues
for t
he 2
008
flood
and
dra
inag
e ar
ea fo
r stre
amga
ges
on th
e Io
wa
and
Ceda
r Riv
ers.
Floods of May 30 to June 15, 2008 27
keep up with stormwater runoff forcing additional mandatory evacuations as stormwater runoff affected new areas of the city. Around 2:45 p.m. on June 10, at least a third of the Union Pacific Railroad Bridge in downtown Waterloo was washed away by the floodwaters. During the evening of June 10, water from the Coralville Lake began to overtop the emergency spillway of the Coralville Dam; reservoir water continued to flow over the spillway until June 24. The chapter, The Coralville Dam and Reservoir, Design and Operation (Castle, 2010), provides information on the operation of Coralville Dam and Reservoir during the 2008 flood. On June 11, the Cedar River flooded a 15-block area in Vinton. The city lost power at 9:50 a.m. when the floors collapsed at the city’s auxiliary power plant and distribution center. The State Highway 150 bridge north of town was closed, as were all the bridges across the Cedar River from Vinton to Cedar Rapids. In the town of Palo, all 890 residents were ordered to evacuate their homes. In Cedar Rapids, on June 12 at 9:43 a.m., the Cedar Rapids and Iowa City Railway Co. (CRANDIC/CIC) bridge was destroyed by the flooding. On June 13, as the Cedar River crested in Cedar Rapids, most of the downtown area was inundated by floodwaters and approximately 25,000 residents in Linn County were ordered to evacuate and about 12,000 people were without power. Mercy Hospital was evacuated the morning of June 13. According to Cedar Rapids Fire Department spokesman, Dave Koch, approximately 3,900 homes covering 1,300 blocks and 9.2 mi2 of the city were flooded. City and Federal government buildings on Mays Island (not shown on map) were flooded up to the second floor. With the exception of one well, all of the wells providing the city’s domestic water supply were compromised and drinking-water supplies for Cedar Rapids became severely threatened. Firefighters and about 14 U.S. Coast Guard personnel in motor boats were rescuing people and pets in flooded areas of Cedar Rapids. Homes and businesses in Cedar Rapids were flooded to a depth of as much as 12 ft. Initial property damage in Cedar Rapids was estimated at $736 million, with approximately $376 million of that damage to people’s homes. The chapter, Linn County and the Flood (Langston, 2010), provides additional information on the 2008 flood in Cedar Rapids. Interstate 80 near Tipton (not shown on map), U.S. Highway 30, State Highway 1, and State Highway 13 were closed because of flooding along the Cedar River, and to the south, Interstate 380 and State Highway 965 (not shown on map) were closed because of flooding along the Iowa River, cutting off major routes between Cedar Rapids and Iowa City. According to National Guard spokesman Lt. Col. Greg Hapgood, as of June 13, 220 National Guard members were deployed to Cedar Rapids and another 540 members to Iowa City in response to the flooding. On June 14 in Colum-bus Junction and Fredonia, just below the confluence of Iowa and Cedar Rivers, authorities ordered evacuations in anticipa-tion of flooding. All of the approximately 250 residents of Fredonia were ordered to evacuate along with those living along the levee and low lying areas of Columbus Junction. On the evening of June 14, the makeshift sand levees along State
Highways 92 and 70 gave way to the Iowa River and flooded several businesses in Columbus Junction with several ft of water. Also on June 14, a levee failure along the Iowa River near the town of Oakville flooded the entire town. Earlier in the day, emergency management officials had ordered a mandatory evacuation from Oakville. In Iowa City, the floodwaters of the Iowa River infiltrated the University of Iowa’s power plant on the morning of June 14 and the power plant was shut down. An estimated 2,000 volunteers helped lay sandbags around several University of Iowa buildings located on the east side of the Iowa River. In Iowa City, the Iowa River crested on June 15, as the Coralville Reservoir remained almost 5 ft above the spillway; during this time, reservoir storage was 28,300 acres and reservoir length was 45 mi (Castle, 2010). An estimated 400 to 500 homes in Iowa City and approximately 310 homes in Coralville were evacu-ated. Many businesses in Coralville were flooded along U.S. Highway 6, water depths were as much as 6 to 8 ft according to Assistant Coralville Fire Chief Bill Horning. As the Coast Guard patrolled 1st Avenue (not shown on map) in Coralville and surrounding neighborhoods, Petty Officer Steve Lehmann observed floodwaters that were halfway up the first story of homes and cars almost totally submerged. The Normandy Drive (not shown on map) area of Iowa City was severely flooded. The chapter, Iowa City and the Flood (Fosse, 2010), provides additional information of the 2008 flood in Iowa City. On the University of Iowa campus in Iowa City, 22 major buildings were flooded; damage to university facilities and their contents were estimated at $232 million. The total anticipated cost of the flood to the University is $743 million, which includes business interruption, leased replacement space, long-term protection of recovered buildings, and replacement of severely flood-damaged facilities. The chapter, The University of Iowa and the Flood (Eckstein and Lehnertz, 2010), provides additional information on the 2008 flooding of the University of Iowa. As of June 15, 2008, there were approximately 36,000 evacuees across 11 counties with 472 displaced Iowans housed in shelters. Statewide, 54 roadways remained closed and more than 4,000 National Guard person-nel were expected to be deployed. Eighty-three of Iowa’s 99 counties experienced substantial damage from the recent storms and flooding. Three deaths attributed to the flooding were reported, one each in Hamilton, Louisa, and Wright Counties. Soil erosion and sediment deposition related to the flooding damaged farmlands in eastern Iowa. Soil erosion rates following high rainfall intensities on June 12 were estimated to average about 3.6 tons per acre across Linn and Johnson Counties; within some counties in eastern Iowa, soil erosion rates were estimated to approach 50 tons per acre (Cruse and others, 2010).
As a result of the flooding and storms in June 2008, an estimated $316 million in FEMA Hazard Mitigation Funds is being allocated statewide for private home buyout assistance and other forms of mitigation. As of December 4, 2009, about $100 million of this total has so far been approved for local or state use (http://www.rio.iowa.gov/funds.html, accessed
28 Floods of May 30 to June 15, 2008, in the Iowa River and Cedar River Basins, Eastern Iowa
January 11, 2010). About another $230 million has been allocated for buyouts under the U.S. Department of Housing and Urban Development’s (HUD) Community Development Block Grant funds and approximately $150 million of that has been appropriated for buyouts (http://www.rio.iowa.gov/funds.html, accessed January 11, 2010). Overall, about $3.3 billion dollars have been allocated statewide by Federal, State, and local partners to help with various types of recovery efforts as a result of the storms and floods in 2008 and this amount is expected to increase as recovery efforts continue (http://www.rio.iowa.gov/funds.html, accessed January 12, 2010). Additional information about the extent of the damage and the financial impacts and estimates of the economic losses associated with the flooding in 2008 in Iowa can be found in the chapters, Flood Effects on Modern Communities (Mutel, 2010) and Economic Losses from the Floods (Otto, 2010). As of November 8, 2009, Community Development Block Grant funds were approved for buyout assistance for 852 properties in Cedar Rapids, 71 properties in Mason City, 101 properties in Cedar Falls, 28 properties in Waverly, 4 properties in Water-loo, 52 properties in Iowa City, 3 properties in Coralville, 124 properties in Oakville, and numerous other properties in other towns and rural areas, bringing the statewide total to 1,352 properties. In Cedar Rapids, as of December 23, 2009, 45 home owners had accepted FEMA-funded buyout offers, whereas another 72 properties had been approved for FEMA buyout assistance. The city estimated that eventually some 1,300 property buyouts may occur with most of the funding coming from HUD Community Development Block Grant funds. Statewide, another 963 properties had qualified for FEMA buyout assistance as of December 21, 2009 (http://www.fema.gov/news/newsrelease.fema?id=50119, accessed January 12, 2010).
Flood Profile To develop profiles of the 2008 floods for the Iowa River
and Cedar River, the USGS measured high-water marks (HWM) at 60 locations. The USGS also used HWMs mea-sured at 155 locations by FEMA (Federal Emergency Agency, 2008b), USACE, Muscatine County Engineers Office, and the City of Iowa City. The HWMs that were used in the profiles were measured at all Federal and State Highway bridges, at USGS streamgages, at selected county and local bridges, and at selected dams. The HWMs at bridges were located immediately downstream from a bridge and one bridge-length upstream from the bridge. With the exception of Coralville Lake and the river reach between U.S. Highway 20 and Iowa Falls which are in the Iowa River Basin (fig. 1), the maxi-mum distance between profile points was about 10 mi. River mi were determined for the locations using a geographic
information system (GIS) to measure the distance along each river reach from its mouth using USGS National Hydrography Dataset (NHD) data.
The HWMs were surveyed to bench marks (see appendix 2) at bridges, dams, and intermediate sites within 4 weeks of the flood peak, and were later referenced to the National Geo-detic Vertical datum of 1929 by differential leveling or differ-ential positioning using a global positioning system (GPS). In addition, bridge deck, bridge low-chord, and reference-point elevations were measured with respect to the bench marks. The elevations for the bridge deck and bridge-low chord were generally measured on the lowest end of the bridge. The refer-ence points were established so that low-flow water-surface elevations could be measured by using a weight suspended on a measuring tape. Low-flow water-surface elevations were obtained to indicate the range in stage along the river and to define the low-water slope.
The HWMs are profiled in figures 12–39 and listed in tables 7 and 8. The profile lines connecting the HWMs in the figures approximate the flood elevation between marks. The lines do not account for any intermediate features that could affect flood elevation such as channel morphology or bridges and dams where HWMs were not measured. Primary high-ways referenced in the report are shown in figures 1 and 2; secondary roads are not shown on the figures.
The May 30 to June 15, 2008, flood along the Iowa River is profiled from State Highway 99 near Oakville (USGS streamgage number 05465700, established April 1, 2009) upstream to U.S. Highway 69 in Belmond (fig. 1). The 319-mi river reach is shown in figure 1, and the 88 stream sites where HWMs were measured are listed in table 7 (at the back of this report). A flood profile measured in July 1969 and a low-water profile measured during October 13–15, 1970 (Heinitz, 1973), are shown (figs. 19–27) for the Iowa River reach upstream from Coralville Lake. For the Iowa River 2008 flood-profile, elevations were estimated for several bridge sites where eleva-tions had not been measured in order to define the 2008 profile line for comparison with the flood profile of 1969. The esti-mated elevations at these bridge sites are noted in the profile (figs. 24–26) but are not listed in table 7. At the streamgage 05451500 Iowa River at Marshalltown, Iowa, (river mile 214.27; fig. 22) the 2008 flood peak was higher than the 1969 flood peak by 2.69 ft (table 3), however, the peak discharge was less than the 1969 peak discharge. This difference between stage and discharge for the 1969 and 2008 floods is most likely because of continuing channel-aggradation at the Marshalltown location. Of 10 bridge sites on the Iowa River upstream from Coralville Lake, the Iowa River at the State Highway 14 bridge was estimated to have the highest channel-aggradation rate (Eash, 1996).
The May 30 to June 15, 2008, flood along the Cedar River is profiled from Fredonia near the mouth (confluence with the Iowa River) upstream to Riverview Drive north of Charles City (fig. 2). The 236-mi river reach is shown in figure 2, and the 127 stream sites where HWMs were measured are listed in table 8 (at the back of this report). A flood profile
References Cited 29
measured in July 1999 and a low-water profile measured in November 1999 (Ballew and Eash, 2001) is shown for the Cedar River reach upstream from the Buchanan-Black Hawk County line. Also shown is a flood profile measured in March, 1961, and low-water profiles measured in August, 1960, and November, 1961 (Schwob, 1963), along the entire Cedar River reach profiled for the 2008 flood.
SummaryInformation on flood-peak and water-surface-elevation
profiles is needed for the planning and safe design of bridges and other structures along rivers and streams and also for effective management of flood plains. Data for major floods are needed to compute flood-peak discharges and calibrate water-surface-elevation models. This report was prepared in cooperation with the Iowa Department of Transportation and the Iowa Highway Research Board.
As a result of prolonged and intense periods of rainfall in late May and early June, 2008, along with heavier than normal snowpack the previous winter, severe flooding occurred in the Iowa and Cedar River Basins. Above normal rainfall lead-ing into the fall of 2007 also contributed to the saturated soil conditions leading up to the flood of May 30 to June 15, 2008. The storms were part of an exceptionally wet period from May 29 through June 12, when an Iowa statewide average of 9.03 in. of rain fell; the normal statewide average for the same period is 2.45 in. From May 29 to June 13, the 16-day total rainfall recorded at rain gages in Iowa Falls and Clutier was 14.0 and 13.83 in., respectively. Within the Iowa River Basin, peak discharges of 51,000 ft3/s (flood-probability estimate of 0.2 to 1 percent) at the streamgage 05453100 Iowa River at Marengo, Iowa on June 12, and 39,900 ft3/s (flood-probability estimate of 0.2 to 1 percent) at the streamgage 05453520 Iowa River below Coralville Dam near Coralville, Iowa, on June 15 are the largest floods on record for those sites. The peak discharge of 41,100 ft3/s (flood-probability estimate of 0.2 to 1 percent) on June 15 at the streamgage 05454500 Iowa River at Iowa City, Iowa, is the fourth highest on record, but is the largest flood since regulation by the Coralville Dam began in 1958.
Within the Cedar River Basin, the May 30 to June 15, 2008, flood is the largest on record at all six streamgages located on the mainstem of the Cedar River and at five streamgages located on the major tributaries. Flood-proba-bility estimates for 10 of these 11 streamgages are less than 1 percent. Peak discharges of 112,000 ft3/s (flood-probability estimate of 0.2 to 1 percent) at the streamgage 05464000 Cedar River at Waterloo, Iowa, on June 11 and of 140,000 ft3/s (flood-probability estimate of less than 0.2 percent) at the streamgage 05464500 Cedar River at Cedar Rapids, Iowa on June 13 are the largest floods on record for those sites. The peak discharge at streamgage 05464500 Cedar River at Cedar Rapids, Iowa, was prorated from a discharge measurement
made 9.9 mi downstream at the Cedar River at U.S. Highway 30. The discharge measured at the U.S. Highway 30 site was 150,000 ft3/s. Downstream from the confluence of the Iowa and Cedar Rivers at the streamgage 05465500 Iowa River at Wapello, Iowa, a peak discharge of 188,000 ft3/s (flood-prob-ability range estimated to be less than 0.2 percent) on June 14, 2008, is the largest flood on record in the Iowa River and Cedar River Basins since 1903.
References Cited
Associated Press, 2008, June 14, Quad City Times, Evacu-ations ordered in Columbus Junction, Fredonia: accessed December, 2009, http://qctimes.com/news/state-and-regional/iowa/article_d36ce8b1-ad78-5ffe-914d-aefb6fef-cbb8.html.
Ballew, J.L., and Eash, D.A., 2001, Floods of July 19–25, 1999, in the Wapsipinicon and Cedar River Basins, north-east Iowa: U.S. Geological Survey Open-File Report 01–13, 45 p.
Belz, Adam, 2008a, June 14, Cedar Rapids-Iowa City Gazette, C.R. struggles to grasp losses: edition F, p. 1A, accessed December, 2009, http://nl.newsbank.com/nl-search/we/Archives?p_action=doc&p_docid=121565A131A38CD0&p_docnum=3.
Belz, Adam, 2008b, June 15, Cedar Rapids-Iowa City Gazette, Cedar River dropping faster than expected: edition F, p. 1A, accessed December, 2009, http://nl.newsbank.com/nl-search/we/Archives?p_action=doc&p_docid=12165DD039E9F938&p_docnum=1.
Binegar, Erika, 2008, June 21, Cedar Rapids-Iowa City Gazette, One life lost to floods in Eastern Iowa: edition F, p. 2B, accessed January, 2010, http://nl.newsbank.com/nl-search/we/Archives?p_action=doc&p_docid=121792DEA6A8BE68&p_docnum=1.
Boshart, Rod, 2008, June 16, Cedar Rapids-Iowa City Gazette, State looking ahead: edition F, p. 4B, accessed December, 2009, http://nl.newsbank.com/nl-search/we/Archives?p_action=doc&p_docid=121647C8EAB44BF8&p_doc-num=1.
Boshart, Rod, 2008, June 17, Cedar Rapids-Iowa City Gazette, Culver planning special legislative session, Lawmakers to decide how best to rebuild Iowa after flood-ing: edition F, p. 1B, accessed December, 2009, http://nl.newsbank.com/nl-search/we/Archives?p_action=doc&p_docid=121647CDF1E47600&p_docnum=1.
Buchmiller, R.C., and Eash, D.A., 2010, Floods of May–June, 2008 in Iowa: U.S. Geological Survey Open-File Report 2010–1096, 10 p. Available online at http://pubs.usgs.gov/of/2010/1096/.
30 Floods of May 30 to June 15, 2008, in the Iowa River and Cedar River Basins, Eastern Iowa
Castle, John, 2010, The Coralville Dam and Reservoir, design and operation, in Mutel, C.F., ed., A watershed year, Anatomy of the Iowa floods of 2008: Iowa City, University of Iowa Press, p. 95–102.
Courier Des Moines Bureau, 2009, November 8, Waterloo-Cedar Falls Courier, Federal funds to buy flood-damaged homes: accessed January, 2010, http://wcfcourier.com/news/local/article_f280ac4e-cc30-11de-9eef-001cc4c03286.html.
Courier, Staff, 2008a, June 9, Waterloo-Cedar Falls Cou-rier, Update: 100 evacuated in Charles City; flood water divides Nashua: accessed January, 2010, http://wcfcourier.com/news/top_story/article_b296369a-62f5-54c4-b9f1-e927258c0966.html.
Courier, Staff, 2008b, June 14, Waterloo-Cedar Falls Courier, Significant damage to IC&E rail lines from floods: accessed January, 2010, http://wcfcourier.com/news/breaking_news/article_961eaeec-6704-5b9c-acb4-daa82b15e8f8.html.
Cruse, Richard, Olson, Hillary, and Laflen, J.M., 2010, How did the floods affect farmland, in Mutel, C.F., ed., A water-shed year, Anatomy of the Iowa floods of 2008: Iowa City, University of Iowa Press, p. 147–154.
Dochterman, Scott, 2008, June 16, Cedar Rapids-Iowa City Gazette, On the process to recovery, Columbus Junction already thinking of reconstruction: edition F, p. 2B, accessed January, 2010, http://nl.newsbank.com/nl-search/we/Archives?p_action=doc&p_docid=121647CA99E862A0&p_docnum=2.
Eash, D.A., 1996, Flood-plain and channel aggradation of selected bridge sites in the Iowa and Skunk River Basins, Iowa: U.S. Geological Survey Water-Resources Investiga-tions Report 95–4290, 44 p.
Eash, D.A., 1997, Effects of the 1993 flood on the determi-nation of flood magnitude and frequency in Iowa: U.S. Geological Survey Circular 1120–K, 23 p. Available online at http://pubs.er.usgs.gov/usgspubs/cir/cir1120K.
Eash, D.A., 2001, Techniques for estimating flood-frequency discharges for streams in Iowa: U.S. Geological Survey Water-Resources Investigations Report 00–4233, 88 p. Available online at http://pubs.er.usgs.gov/usgspubs/wri/wri004233.
Eash, D.A., 2004, Flood of June 4, 2002, in the Indian Creek Basin, Linn County, Iowa: U.S. Geological Survey Open-File Report 2004–1074, 31 p. Available online at http://pubs.usgs.gov/of/2004/1074/.
Ebaugh, Alicia, 2008, June 12, Cedar Rapids-Iowa City Gazette, Raging Cedar River pummels Palo, All 890 resi-dents ordered to evacuate: edition F, p. 1B, accessed Janu-ary, 2010, http://nl.newsbank.com/nl-search/we/Archives?p_action=doc&p_docid=1215040DC243E520&p_docnum=1.
Eckstein, Barbara, and Lehnertz, Rodney, 2010, The Univer-sity of Iowa and the flood, in Mutel, C.F., ed., A watershed year, Anatomy of the Iowa floods of 2008: Iowa City, Uni-versity of Iowa Press, p. 39–44
Federal Emergency Management Agency, 2008a, Federal Reg-ister Notice, accessed November, 2009, http://www.fema.gov/news/dfrn.fema?id=10516.
Federal Emergency Management Agency, 2008b, Iowa June 2008 Rapid Response Riverine High Water Mark Collec-tion, FEMA-1763-DR-IA, 812 p.
Federal Emergency Management Agency, 2009, FEMA marks one-year anniversary of Iowa Disaster, accessed November, 2009, http://www.fema.gov/news/newsrelease.fema?id=48472.
Fischer, E.E., and Eash, D.A., 1998, Statistical summaries of selected Iowa streamflow data through September 1996: U.S. Geological Survey Open-File Report 98–170, 681 p.
Fitzpatrick, F.A., Peppler, M.C., Walker, J.F., Rose, W.J., Was-chbusch, R.J., and Kennedy, J.L., 2008, Flood of June 2008 in southern Wisconsin: U.S. Geological Survey Scientific Investigations Report 2008–5235, 24 p. Available online at http://pubs.usgs.gov/sir/2008/5235/.
Fosse, R.A., 2010, Iowa City and the flood, in Mutel, C.F., ed., A watershed year, Anatomy of the Iowa floods of 2008: Iowa City, University of Iowa Press, p. 31–37.
Funkhouser, J.E., and Eng, Ken, 2009, Floods of selected streams in Arkansas, spring 2008: U.S. Geological Survey Fact Sheet 2008–3103, 4 p. Available online at http://pubs.usgs.gov/fs/2008/3103/.
Heinitz, A.J., 1973, Floods in the Iowa River Basin upstream from Coralville Lake, Iowa: U.S. Geological Survey Open-File Report, 75 p.
Heinselman, Karen, 2008, June 11, Waterloo-Cedar Falls Courier, Cedar falling but still causing major flooding in Waverly: accessed November, 2009, http://wcfcourier.com/news/regional/article_839e8055-6fc5-5ca7-abcc-87dc44f844bb.html.
Hennigan, Gregg, and Muller, Lyle, 2008, June 15, Cedar Rapids-Iowa City Gazette, Water takes plant at UI, but campus, hospital have power sources to keep them work-ing: edition F, p. 3A, accessed December, 2009, http://nl.newsbank.com/nl-search/we/Archives?p_action=doc&p_docid=12165DCF0A1540C8&p_docnum=2.
Hennigan, Gregg, 2008, June 17, Cedar Rapids-Iowa City Gazette, Cities of sorrow Iowa City/Coralville, evacuees face very long wait: edition F, p. 1A, accessed December, 2009, http://nl.newsbank.com/nl-search/we/Archives?p_action=doc&p_docid=121647CB2EA70228&p_docnum=1.
References Cited 31
Hillaker, H.J., 2008a, Iowa Annual Weather Summary: Iowa Department of Agriculture and Land Stewardship, Des Moines, Iowa, accessed October 2008, http://www.agri-culture.state.ia.us/climatology/weatherSummaries/2008/fas2008.pdf.
Hillaker, H.J., 2008b, Iowa climate review, v. 22, no. 5, May 2008: Iowa Department of Agriculture and Land Steward-ship, Des Moines, Iowa, 21p.
Hillaker, H.J., 2008c, Iowa climate review, v. 22, no. 6, June 2008: Iowa Department of Agriculture and Land Steward-ship, Des Moines, Iowa, 21p.
Holmes, R.R., Jr., Koenig, T.A, and Karstensen, K.A., 2010, Midwest floods of 2008: U.S. Geological Survey Profes-sional Paper 1775, 64 p. Available online at http://pubs.usgs.gov/pp/1775/.
Huff, F.A., and Angel, J.R., 1992, Rainfall frequency atlas of the Midwest: Champaign, Illinois State Water Survey, Bul-letin 71, 141 p.
Interagency Advisory Committee on Water Data, 1982, Guidelines for determining flood flow frequency: Reston, Va., Hydrology Subcommittee Bulletin 17B, 28 p. and appendixes. Available online at http://water.usgs.gov/osw/bulletin17b/bulletin_17B.html.
Iowa Conservation Commission, 1979, Iowa’s low-head dams-their past, present, and future roles: Des Moines, Iowa, Iowa State Water Resources Research Institute Special Report no. 96, 312 p.
Iowa Natural Resources Council, 1955, An Inventory of water resources and water problems, Iowa-Cedar River Basin: Des Moines, Iowa, Bulletin 3, 94 p.
Langston, Linda, 2010, Linn County and the flood, in Mutel, C.F., ed., A watershed year, Anatomy of the Iowa floods of 2008: Iowa City, University of Iowa Press, p. 45–51.
Lara, O.G., 1987, Method for estimating the magnitude and frequency of floods at ungaged sites on unregulated rural streams in Iowa: U.S. Geological Survey Water-Resources Investigations Report 87–4132, 34 p.
Larimer, O.J., 1957, Drainage areas of Iowa streams: Iowa Highway Research Board Bulletin No. 7 (reprinted 1974), 439 p. Available online at http://www.iowadot.gov/operationsresearch/reports/reports_pdf/hr_and_tr/reports/HR-29%20Final%20Report%201957.pdf.
Mangalonzo, John, 2008, June 15, The Hawk Eye, Burl-ington, Iowa, Iowa River tops Oakville levee: accessed January, 2010, http://www.thehawkeye.com/print/Flood-Oakville-061508.
Morlock, S.E., Menke, C.D., Arvin, D.V., and Kim, M.H., 2008, Flood of June 7–9, 2008, in central and southern Indi-ana: U.S. Geological Survey Open File Report 2008–1322, 15 p., 3 appendixes. Available online at http://pubs.usgs.gov/of/2008/1322/.
Mutel, Cornelia, 2010, Flood effects on modern communities, in Mutel, C.F., ed., A watershed year, Anatomy of the Iowa floods of 2008: Iowa City, University of Iowa Press, p. 131–137.
National Weather Service, 2009, Central United States flood-ing of June 2008: Service assessment: Silver Spring, Md., National Oceanic and Atmospheric Administration, National Weather Service, 50 p.
Otto, Daniel, 2010, Economic losses from the floods, in Mutel, C.F., ed., A watershed year, Anatomy of the Iowa floods of 2008: Iowa City, University of Iowa Press, p. 139–145.
Parrett, C., Melcher, N.B., and James, R.W., 1993, Flood dis-charges in the upper Mississippi River basin: U.S. Geologi-cal Survey Circular 1120-A, 14 p. Available online at http://pubs.usgs.gov/circ/1993/circ1120-a/.
Prior, J.C., 1991, Landforms of Iowa: Iowa City, University of Iowa Press, 154 p.
Prior, J.C., Kohrt, C.J., and Quade, D.J., 2009, The Landform Regions of Iowa, vector digital data, Iowa Geological Survey, Iowa Department of Natural Resources, Iowa City, Iowa, accessed May 2010, ftp://ftp.igsb.uiowa.edu/gis_library/ia_state/geologic/landform/landform_regions.zip.
Schaap, B.D., and Harvey, C.A., 1995, Delineation of flood-ing within the upper Mississippi River Basin, 1993—Flood of June 29–September 18, 1993, in Iowa City and vicinity, Iowa: U.S. Geological Survey Hydrologic Investigations Atlas HA 735-B.
Schwob, H.H., 1963, Cedar River Basin floods: Iowa Highway Research Board, Bulletin No. 27, 58 p.
Scientific Assessment and Strategy Team, 1994, Science for floodplain management into the 21st century: Washington, D.C., Preliminary Report of the Scientific Assessment and Strategy Team, Report of the Interagency Floodplain Man-agement Review Committee to the Administration Flood-plain Management Task Force, June 1994, 272 p.
Skipper, John, 2008, June 10, Mason City Globe-Gazette, Some water may be available today: accessed Febru-ary, 2010, http://www.globegazette.com/news/local/article_37cc2d00-f8a0-54e2-8bce-f668ca7cbfa0.html.
Sharp, Brian, 2008, June 16, Iowa City Press-Citizen, Reser-voir, river crests bring guarded relief: v. 168, no. 144, p. 1A.
32 Floods of May 30 to June 15, 2008, in the Iowa River and Cedar River Basins, Eastern Iowa
Smith, Rick, 2009, December 24, Cedar Rapids-Iowa City Gazette, Another 17 Cedar Rapids homeowners accept buyouts: accessed January, 2010, http://gazetteonline.com/local-news/flood-recovery/2009/12/24/another-17-cedar-rapids-homeowners-accept-buyouts.
Southard, R.E., Sneck-Fahrer, D., Anderson, C.J., Goodrich, R.D., and Gorman, J.G., 1994, Water resources data Iowa, water year 1993: U.S. Geological Survey Water-Data Report IA–93–1, 388 p.
Southard, R., 1995, Flood volumes in the upper Mississippi River basin, April 1 through September 30, 1993: U.S. Geological Survey Circular 1120–H, 32 p. Available online at http://pubs.usgs.gov/circ/1993/circ1120-h/.
U.S. Army Corps of Engineers, 2009, Rock Island District, Iowa River Regulated Flow Frequency Study, Final Report, 65 p.
U.S. Department of Commerce, National Oceanic and Atmospheric Administration, and National Climatic Data Center, 2008a, National Climatic Data Center Storm Events, accessed October 28, 2009, http://www4.ncdc.noaa.gov/cgi-win/wwcgi.dll?wwEvent~storms (search terms: Iowa, 5/29/2008 to 6/13/2008, flood, precipitation).
U.S. Department of Commerce, National Oceanic and Atmo-spheric Administration, and National Climatic Data Center, 2008b, Climatological data, Iowa, May 2008: Asheville, N.C., Monthly Summaries, v. 119, no. 5, 34 p.
U.S. Department of Commerce, National Oceanic and Atmo-spheric Administration, and National Climatic Data Center, 2008c, Climatological data, Iowa, June 2008: Asheville, N.C., Monthly Summaries, v. 119, no. 6, 34 p.
U.S. Department of Commerce, National Oceanic and Atmo-spheric Administration, and National Climatic Data Center, 2008d, Hourly precipitation data, Iowa, May 2008: Ashe-ville, N.C., Monthly Summaries, v. 58, no. 5, 25 p.
U.S. Department of Commerce, National Oceanic and Atmo-spheric Administration, and National Climatic Data Center, 2008e, Hourly precipitation data, Iowa, June 2008: Ashe-ville, N.C., Monthly Summaries, v. 58, no. 6, 26 p.
Wahl, K.L., Vining, K.C., and Wiche, G.J., 1993, Precipitation in the upper Mississippi River basin, January 1 through July 31, 1993, U.S. Geological Survey Circular 1120–B, 13 p. Available online at http://pubs.usgs.gov/circ/1993/circ1120-b/.
Weber, Irving, 1975, March 19, Iowa City Press-Citizen, Iowa River Floods: v. 134, no. 91, p. 1B.
Weber, Irving, 1979, Historical stories about Iowa City, v. 2: Iowa City, Iowa City Lions Club, 278 p., accessed Novem-ber 2009, http://digital.lib.uiowa.edu/cdm4/document.php?CISOROOT=/weber&CISOPTR=580&REC=16.
64 Floods of May 30 to June 15, 2008, in the Iowa River and Cedar River Basins, Eastern Iowa
Table 3. Maximum stages and discharges for 2008 and selected largest-flood years, and the corresponding flood-probability ranges, at streamgages in the Iowa River and Cedar River Basins, Iowa.
[mi2, square miles; ft, feet; ft3/s, cubic feet per second; (ft3/s)/mi2, cubic feet per second per square mile; ND, not determined; < , less than; >, greater than]
Map number (fig. 1–2)
Streamgage number and name
Peak–flow record (wa-
ter years)
Drainage area (mi2)
Date of peak
Peak stage (ft)
Peak dis-charge (ft3/s)
Flood prob-ability range1
(percent)
Unit runoff [(ft3/s)/mi2]
Iowa River Basin
1 05448285 Eagle Lake Inlet near Britt, Iowa (discontinued)
1976–80 3.83 8/21/1979 5.60 108 3>10 28.2
2 05448290 Eagle Lake Outlet near Britt, Iowa (discontinued)
1976–80 11.3 8/22/1979 4.88 101 3>10 8.9
3 05448400 West Main Drainage Ditch 1 & 2 near Britt, Iowa
1966–08 21.2 4/28/19756/8/2008
83.5983.75
372246
2–4>10
17.511.6
4 05448500 West Branch Iowa River near Kl-emme, Iowa (discon-tinued)
1949–58 112 6/21/1954 14.97 1,920 4–10 17.1
5 05448600 East Branch Iowa River above Hay-field, Iowa
1953–08 2.23 4/11/20016/8/2008
8.126.02
2439178
0.2–1>10
196.979.8
6 05448700 East Branch Iowa River near Hay-field, Iowa (discontin-ued)
1952–86, 1990–91
7.94 6/18/1954 13.01 457 2–4 57.6
7 05448800 East Branch Iowa River near Garner, Iowa (discontinued)
1952–91 45.1 3/26/1961 12.81 1,120 4–10 24.8
8 05448900 East Branch Iowa River tributary near Garner, Iowa (discontinued)
1952–86 5.47 6/7/1984 10.46 660 0.2–1 120.7
9 05449000 East Branch Iowa River near Kl-emme, Iowa (discon-tinued)
1944, 1949–76, 1978–95
133 6/19/19544/8/19653/31/1993
211.209.94
10.82
25,9604,0904,380
0.2–12–41–2
44.830.832.9
10 05449500 Iowa River near Rowan, Iowa
1941–76, 1978–08
429 6/21/19546/17/19846/9/2008
14.8815.0015.89
8,4608,4507,890
1–21–21–2
19.719.718.4
11 05451080 South Fork Iowa River near Blairs-burg, Iowa
2006–08 12.0 6/8/2008 12.50 762 30.2–1 63.5
12 05451210 South Fork Iowa River NE of New Providence, Iowa
1996–08 224 6/8/2008 13.84 7,390 2–4 33.0
13 0545129280 Honey Creek Tributary near Rad-cliffe, Iowa
1991–93, 1995–08
3.29 6/8/2008 100.23 2511 >10 155.3
14 05451500 Iowa River at Marshalltown, Iowa
1903, 1915–27, 1929–30,
1933–08
1,532 6/4/19187/9/19696/13/2008
17.7419.1021.79
42,00031,90022,400
<0.20.2–12–4
27.420.814.6
Table 3 65
Table 3. Maximum stages and discharges for 2008 and selected largest-flood years, and the corresponding flood-probability ranges, at streamgages in the Iowa River and Cedar River Basins, Iowa.—Continued
[mi2, square miles; ft, feet; ft3/s, cubic feet per second; (ft3/s)/mi2, cubic feet per second per square mile; ND, not determined; < , less than; >, greater than]
Map number (fig. 1–2)
Streamgage number and name
Peak–flow record (wa-
ter years)
Drainage area (mi2)
Date of peak
Peak stage (ft)
Peak dis-charge (ft3/s)
Flood prob-ability range1
(percent)
Unit runoff [(ft3/s)/mi2]
Iowa River Basin—Continued
15 05451700 Timber Creek near Marshalltown, Iowa
1947, 1950–08
118 8/16/19776/15/19826/8/2008
17.6917.3016.19
12,0009,9407,010
1–22–44–10
101.784.259.4
16 05451900 Richland Creek near Haven, Iowa
1918, 1950–08
56.1 4/12/19915/28/19746/8/2008
26.7124.0021.10
12,2007,0002,460
0.2–12–4>10
217.5124.843.9
17 05451955 Stein Creek near Clutier, Iowa
1972–08 23.4 6/15/19825/30/2008
77.9278.02
11,40012,200
<0.2<0.2
487.2521.4
18 05452000 Salt Creek near Elberon, Iowa
1944, 1946–08
201 6/16/19446/13/19477/9/19935/30/2008
19.9017.6020.8519.75
230,00035,00036,60022,400
<0.2<0.2<0.20.2–1
149.3174.1182.1111.4
19 05452200 Walnut Creek near Hartwick, Iowa
1947, 1950–08
70.9 4/29/19918/27/20047/18/2008
16.9315.5915.80
7,9007,1804,930
4–104–10>10
111.4101.369.5
20 05452500 Iowa River near Belle Plaine, Iowa (discontinued)
24 05453430 North Fork Tributary to Mill Creek near Solon, Iowa
1990–08 0.78 7/21/2008 13.69 211 52–4 270.5
25 05453520 Iowa River below Coralville Dam near Coralville, Iowa
1993–08 3,115 7/19/19936/15/2008
63.9568.09
625,800639,900
71–27 0.2–1
8.312.8
26 05453600 Rapid Creek below Morse, Iowa (discontinued)
1951–92 8.12 6/21/1987 25.99 3,000 2–4 369.5
27 05453700 Rapid Creek tributary No. 4 near Oasis, Iowa (discon-tinued)
1951–74 1.95 7/20/1953 18.23 956 4–10 490.3
28 05453750 Rapid Creek southwest of Morse, Iowa (discontinued)
1951–87, 1989–92
15.2 5/23/19657/17/1972
29.4229.74
4,2604,300
2–42–4
280.3282.9
29 05453850 Rapid Creek tributary No. 3 near Oasis, Iowa (discon-tinued)
1951–86, 1990–92
1.62 9/21/19657/17/1972
24.1624.11
1,2001,200
4–104–10
740.7740.7
66 Floods of May 30 to June 15, 2008, in the Iowa River and Cedar River Basins, Eastern Iowa
Table 3. Maximum stages and discharges for 2008 and selected largest-flood years, and the corresponding flood-probability ranges, at streamgages in the Iowa River and Cedar River Basins, Iowa.—Continued
[mi2, square miles; ft, feet; ft3/s, cubic feet per second; (ft3/s)/mi2, cubic feet per second per square mile; ND, not determined; < , less than; >, greater than]
Map number (fig. 1–2)
Streamgage number and name
Peak–flow record (wa-
ter years)
Drainage area (mi2)
Date of peak
Peak stage (ft)
Peak dis-charge (ft3/s)
Flood prob-ability range1
(percent)
Unit runoff [(ft3/s)/mi2]
Iowa River Basin—Continued
30 05453900 Rapid Creek tributary near Oasis, Iowa (discontinued)
1951–90 0.97 7/18/1956 18.32 809 54–10 834.0
31 05453950 Rapid Creek tributary near Iowa City, Iowa (discontin-ued)
1951–86, 1988,
1990–92
3.43 7/17/1972 26.57 2,000 2–4 583.1
32 05454000 Rapid Creek near Iowa City, Iowa
1938–08 25.3 5/23/19658/10/19936/13/2008
14.1015.6111.56
6,1006,7001,690
2–41–2>10
241.1264.866.8
33 05454090 Muddy Creek at Coralville, Iowa
2007–08 8.7 6/13/2008 9.44 937 3>10 107.7
34 05454180 Clear Creek tributary near Williams-burg, Iowa
39 05455010 South Branch Ralston Creek at Iowa City, Iowa (discontin-ued)
1962, 1964–95,
1999, 2006
2.94 7/17/1972 9.47 1,070 104–10 363.9
40 05455100 Old Mans Creek near Iowa City, Iowa
1951–08 201 5/15/19827/6/19936/13/2008
415.2517.6115.29
13,50013,0003,420
1–21–2>10
67.264.717.0
41 05455140 North English River near Montezuma, Iowa
1973–08 31.0 3/18/19786/12/2008
28.18223.77
24,64022,060
2–4>10
149.766.5
42 05455150 North English River near Malcom, Iowa (discontinued)
1953–61, 1963,
1965–77
34.0 5/24/1953 13.25 4,240 4–10 124.7
43 05455200 North English River near Guernsey, Iowa (discontinued)
1953–86 68.7 5/24/1953 11.7 7,000 2–4 101.9
Table 3 67
Table 3. Maximum stages and discharges for 2008 and selected largest-flood years, and the corresponding flood-probability ranges, at streamgages in the Iowa River and Cedar River Basins, Iowa.—Continued
[mi2, square miles; ft, feet; ft3/s, cubic feet per second; (ft3/s)/mi2, cubic feet per second per square mile; ND, not determined; < , less than; >, greater than]
Map number (fig. 1–2)
Streamgage number and name
Peak–flow record (wa-
ter years)
Drainage area (mi2)
Date of peak
Peak stage (ft)
Peak dis-charge (ft3/s)
Flood prob-ability range1
(percent)
Unit runoff [(ft3/s)/mi2]
Iowa River Basin—Continued
44 05455210 North English River at Guernsey, Iowa
1960, 1966–98, 2000–08
81.5 6/15/19826/12/2008
87.4386.33
7,4605,400
4–10>10
91.566.3
45 05455230 Deep River at Deep River, Iowa
1960, 1966–72, 1974–08
30.5 5/14/19704/18/2008
83.8581.07
6,2001,920
0.2–1>10
203.363.0
46 05455280 South English River tributary near Barnes City, Iowa (dis-continued)
1953–76 2.51 3/2/1970 9.04 900 >10 358.6
47 05455300 South English River near Barnes City, Iowa (discontinued)
1953–87 11.5 7/18/1982 13.77 2,200 2–4 191.3
48 05455350 South English River tributary No. 2 near Montezuma, Iowa (discontinued)
1953–85 0.52 7/27/1961 13.65 344 52–4 661.5
49 05455500 English River at Kalona, Iowa
1930, 1940–08
574 7/6/19935/11/19966/14/2008
22.5521.0618.01
36,10025,1009,220
0.2–11–2>10
62.943.716.1
50 05455550 Bulgers Run near Riverside, Iowa
1965–08 6.31 9/21/19656/3/2008
89.0486.82
3,080785
0.2–1>10
488.1124.4
51 05455700 Iowa River near Lone Tree, Iowa
1944, 1957–08
4,293 7/7/19936/15/2008
22.9423.10
657,100653,700
70.2–170.2–1
13.312.5
Cedar River Basin
52 05457000 Cedar River near Austin, Minnesota
1910–14, 1945–08
399 7/10/20009/16/20046/12/2008
21.4923.2621.42
15,30020,00015,300
1–2<0.21–2
38.350.138.3
53 05457080 Rose Creek tributary near Dexter, Minnesota (discontin-ued)
1962–85 1.17 7/17/1978 11.82 1,090 5<0.2 931.6
54 05457440 Deer Creek near Carpenter, Iowa
1973–08 91.6 6/8/2008 87.86 11,800 <0.2 128.8
55 05457500 Cedar River at Mitchell, Iowa (discon-tinued)
1934–42, 1961–62
826 3/27/1961 93.6 20,500 32–4 24.8
56 05457700 Cedar River at Charles City, Iowa
1946–53, 1961–62, 1965–08
1,054 3/27/19618/16/19937/21/19996/9/2008
21.5321.4422.8125.33
29,20026,40031,20034,600
1–22–41–2
0.2–1
27.725.029.632.8
57 0545776680 Gizzard Creek tributary near Bassett, Iowa
1990–08 3.42 7/21/19996/9/2008
102.82102.68
1,7301,570
4–104–10
505.8459.1
68 Floods of May 30 to June 15, 2008, in the Iowa River and Cedar River Basins, Eastern Iowa
Table 3. Maximum stages and discharges for 2008 and selected largest-flood years, and the corresponding flood-probability ranges, at streamgages in the Iowa River and Cedar River Basins, Iowa.—Continued
[mi2, square miles; ft, feet; ft3/s, cubic feet per second; (ft3/s)/mi2, cubic feet per second per square mile; ND, not determined; < , less than; >, greater than]
Map number (fig. 1–2)
Streamgage number and name
Peak–flow record (wa-
ter years)
Drainage area (mi2)
Date of peak
Peak stage (ft)
Peak dis-charge (ft3/s)
Flood prob-ability range1
(percent)
Unit runoff [(ft3/s)/mi2]
Cedar River Basin—Continued
58 05457778 Little Cedar River near Johnsburg, Minnesota
62 05458560 Beaverdam Creek near Sheffield, Iowa (discontinued)
1966–89 123 6/25/1969 59.82 218,000 <0.2 146.3
63 05458900 West Fork Ce-dar River at Finchford, Iowa
1929, 1946–08
846 6/27/19517/29/19906/10/2008
17.2818.4520.82
31,90023,30025,900
0.2–12–42–4
37.727.530.6
64 05458960 Bancroft Creek at Bancroft, Minnesota
1986–08 28.7 6/14/20016/12/2008
8.816.48
1,070413
4–10>10
37.314.4
65 05459000 Shell Rock River near Northwood, Iowa (discontinued)
1946–86 300 3/26/19614/8/1965
1211.681212.07
23,00023,400
2–41–2
10.011.3
66 05459010 Elk Creek at Kensett, Iowa (discon-tinued)
1966–89 58.1 3/20/1986 91.91 1,450 2–4 25.0
67 05459490 Spring Creek near Mason City, Iowa
1966–08 29.3 5/22/20046/6/2008
91.1592.91
5,3404,680
0.2–11–2
182.3159.7
68 05459500 Winnebago River at Mason City, Iowa
1933–08 526 3/30/19333/27/19616/8/2008
415.7014.8018.74
10,80010,50013,100
1–21–2
0.2–1
20.520.024.9
69 05460100 Willow Creek near Mason City, Iowa
1966–89, 1991–08
78.6 6/8/2008 93.28 2,380 0.2–1 30.3
70 05460500 Shell Rock River at Marble Rock, Iowa (discontinued)
1933–53, 1961–62
1,318 3/27/19333/28/1961
107.60ND
36,400232,000
0.2–11–2
27.624.3
71 05461000 Shell Rock River at Greene, Iowa (discontinued)
1934–42 1,357 6/25/1938 101.70 12,000 3>10 8.8
72 05461390 Flood Creek near Powersville, Iowa (discontinued)
1996–99 127 7/21/1999 12.57 219,000 3<0.2 149.6
73 05461500 Shell Rock River near Clarksville, Iowa (discontinued)
1916–27, 1933–34, 1961–62
1,626 3/28/1961 ND 233,400 1–2 20.5
Table 3 69
Table 3. Maximum stages and discharges for 2008 and selected largest-flood years, and the corresponding flood-probability ranges, at streamgages in the Iowa River and Cedar River Basins, Iowa.—Continued
[mi2, square miles; ft, feet; ft3/s, cubic feet per second; (ft3/s)/mi2, cubic feet per second per square mile; ND, not determined; < , less than; >, greater than]
Map number (fig. 1–2)
Streamgage number and name
Peak–flow record (wa-
ter years)
Drainage area (mi2)
Date of peak
Peak stage (ft)
Peak dis-charge (ft3/s)
Flood prob-ability range1
(percent)
Unit runoff [(ft3/s)/mi2]
Cedar River Basin—Continued
74 05462000 Shell Rock River at Shell Rock, Iowa
1856, 1954–08
1,746 _/_/18563/28/19616/10/2008
1317.7016.2620.36
245,00033,50060,400
0.2–12–4<0.2
25.819.234.6
75 05462750 Beaver Creek tributary near Apling-ton, Iowa (discontin-ued)
1966–91 11.6 5/19/1983 94.27 23,000 4–10 258.6
76 05463000 Beaver Creek at New Hartford, Iowa
1946–08 347 6/13/19476/8/2008
13.5015.71
18,00025,900
2–40.2–1
51.974.6
77 05463090 Black Hawk Creek at Grundy Cen-ter, Iowa (discontinued)
81 05464130 Fourmile Creek near Lincoln, Iowa (discontinued)
1963–67, 1970–74, 1977–80
13.78 7/3/1979 13.51 1,100 >10 79.8
82 05464133 Half Mile Creek near Gladbrook, Iowa (discontinued)
1963–67, 1970–74, 1977–80
1.33 6/12/1979 9.57 611 4–10 459.4
83 05464137 Fourmile Creek near Traer, Iowa (dis-continued)
1963–74, 1976–80
19.51 3/18/1979 11.93 1,450 4–10 74.3
84 05464145 Twelve Mile Creek near Traer, Iowa (discontinued)
1966–92 43.8 6/16/1990 88.93 24,070 4–10 92.9
85 05464220 Wolf Creek near Dysart, Iowa
1996–98, 2002–08
299 5/23/20045/30/2008
17.3918.25
14,50015,700
2–42–4
48.552.5
86 05464310 Pratt Creek near Garrison, Iowa (discontinued)
1966–94 23.4 6/15/19827/8/1993
96.1796.86
10,80012,300
0.2–10.2–1
461.5525.6
87 05464315 Cedar River at Vinton, Iowa
14ND 6,040 ND ND ND ND ND
88 05464318 East Blue Creek at Center Point, Iowa (discontinued)
1966–87, 1990–93
17.6 7/5/1993 84.27 4,440 4–10 252.3
70 Floods of May 30 to June 15, 2008, in the Iowa River and Cedar River Basins, Eastern Iowa
Table 3. Maximum stages and discharges for 2008 and selected largest-flood years, and the corresponding flood-probability ranges, at streamgages in the Iowa River and Cedar River Basins, Iowa.—Continued
[mi2, square miles; ft, feet; ft3/s, cubic feet per second; (ft3/s)/mi2, cubic feet per second per square mile; ND, not determined; < , less than; >, greater than]
Map number (fig. 1–2)
Streamgage number and name
Peak–flow record (wa-
ter years)
Drainage area (mi2)
Date of peak
Peak stage (ft)
Peak dis-charge (ft3/s)
Flood prob-ability range1
(percent)
Unit runoff [(ft3/s)/mi2]
Cedar River Basin—Continued
89 05464420 Cedar River at Blairs Ferry Road at Palo, Iowa
92 05464560 Prairie Creek at Blairstown, Iowa (discontinued)
1966–84, 1986–87
87.0 6/15/1982 84.65 4,750 4–10 54.6
93 05464562 Thunder Creek at Blairstown, Iowa
1977, 1990–98, 2000–08
0.96 8/16/1977 17.02 2,610 50.2–1 2,718.8
94 05464640 Prairie Creek at Fairfax, Iowa (discon-tinued)
1967–82 178 3/19/1979 14.63 8,140 4–10 45.7
95 05464685 Dry Creek near Alburnett, Iowa (discontinued)
1961–66, 1970
14.0 7/3/1962 15864.14 1,740 3>10 124.3
96 05464690 Dry Creek near Marion, Iowa (discon-tinued)
1961–62, 1965, 1970
25.9 3/2/1970 15799.29 ND ND ND
97 05464695 Indian Creek near Marion, Iowa (discontinued)
1961–66, 1970–71
32.0 6/4/2002 15801.41 ND ND ND
98 05464720 Indian Creek below Cedar Rapids, Iowa (discontinued)
1961–62, 1964–67,
1970
76.2 3/2/1970 15714.14 ND ND ND
99 05464880 Otter Creek at Wilton, Iowa (discon-tinued)
1966–93 10.7 6/16/1990 89.68 5,940 0.2–1 555.1
100 05464942 Hoover Creek at Hoover Natio-nial Historic Site, West Branch, Iowa
1967, 1993, 2001–08
2.58 6/7/19678/16/19936/3/2008
210.50210.30
9.29
21,50021,650
404
34–1032–43>10
581.4639.5156.6
101 05465000 Cedar River near Conesville, Iowa
1929, 1940–08
7,787 4/2/19614/6/19935/29/20046/14/2008
16.6217.1117.00
1623.37
70,80074,00070,200
127,000
54–1054–1054–1050.2–1
9.19.59.0
16.3
Table 3 71
Table 3. Maximum stages and discharges for 2008 and selected largest-flood years, and the corresponding flood-probability ranges, at streamgages in the Iowa River and Cedar River Basins, Iowa.—Continued
[mi2, square miles; ft, feet; ft3/s, cubic feet per second; (ft3/s)/mi2, cubic feet per second per square mile; ND, not determined; < , less than; >, greater than]
Map number (fig. 1–2)
Streamgage number and name
Peak–flow record (wa-
ter years)
Drainage area (mi2)
Date of peak
Peak stage (ft)
Peak dis-charge (ft3/s)
Flood prob-ability range1
(percent)
Unit runoff [(ft3/s)/mi2]
Iowa River Basin
102 05465150 North Fork Long Creek at Ain-sworth, Iowa
1Flood-probability ranges reflect the uncertainty of estimating flood-probability discharges. The flood probability is calculated using established techniques but then reported in one of the following ranges: greater than 10 percent, 4 to 10 percent, 2 to 4 percent, 1 to 2 percent, 0.2 to 1 percent, and less than 0.2 percent. Unless noted otherwise, flood-probability ranges are based on a weighted average of two independent probability estimates. The WIE (weighting of independent estimates) program was used to estimate flood probabilities following guidelines in Appendix 8 of Bulletin 17B (Interagency Advisory Committee on Water Data, 1982; Charles Berenbrock and Tim Cohn, U.S. Geological Survey, written commun., 2008) ). The WIE program uses the variance and estimate of the Bullet in 17B streamgage-probability analysis and the variance and estimate of the regional-regression probability calculation (Eash, 2001) to compute a weighted probability estimate and variance at a streamgage.
2Estimate.3Computed using regional-regression equations (Eash, 2001) because of short peak-flow record.4Streamgage at different datum.5Computed using Bulletin 17B streamgage-probability analysis (Interagency Advisory Committee on Water Data, 1982) because regional-regression equa-
tions are not applicable.6Discharge affected by regulation.7Data source: Rock Island District, U.S. Army Corps of Engineers, Iowa River Regulated Flow Frequency Study, Final Report, October 2009.8Computed using Bulletin 17B streamgage-probability analysis for 1851-1958 unregulated period of record.9Computed using 1925-82 unregulated period of record.10Computed using 1964-80 unregulated period of record.11Computed using weighted estimates from nearby downstream streamgage (05458500) and regional regression estimates for this streamgage (05458300)
(Eash, 2001).12Stage affected by backwater.13Stage measured at bridge 400 ft downstream, from information provided by U.S. Army Corps of Engineers.14Streamgage operation began March 2009.15Sea-level elevation (NGVD 29).16Peak stage on June 15, 2008, at 23.40 ft at discharge of 127,000 ft3/s.17Streamgage operation began April 2009.
72 Floods of May 30 to June 15, 2008, in the Iowa River and Cedar River Basins, Eastern Iowa
Table 7. Locations and elevations of high-water marks used in the Iowa River flood profile from May 30 to June 15, 2008.—Continued
[HWM, high-water mark; NGVD 29, National Geodetic Vertical Datum of 1929; --, not determined; USGS, U.S. Geological Survey; T, township; R, range; N, north; W, west; S, south; E, east]
Distance from mouth (river miles)
Location
Downstream HWM (feet
above NGVD 29)
Upstream HWM (feet
above NGVD 29)
5.49 USGS streamgage 05465700, State Highway 99, near Oakville (T73N R02W 23 SW) 558.86 560.1713.84 SE 1/4 , sec 35, 1.5 miles SE of Wapello (T74N R03W 35 SE) 2566.15 --14.96 123rd Avenue, Wapello (T74N R03W 35 NW) 1567.2 --15.50 USGS streamgage 05465500, State Highway 99, at Wapello (T74N R03W 27 SE) 570.32 --15.72 State Highway 99, Wapello (T74N R03W 27 NE) -- 570.5216.06 North Water Street, Wapello (T74N R03W 27 NE) 1571.4 --19.69 U.S. Highway 61, N of Wapello (T74N R03W 16 NE) 574.42 574.9523.10 Township Road, NW of Wapello (T74N R03W 06 NE) 2577.35 --26.99 140th Street, SE of Fredonia (T75N R04W 34 NW) 2585.15 --29.59 State Highway 92, Columbus Junction (T75N R04W 20 SW) 590.02 590.6730.88 State Highway 70, N of Columbus Junction (T75N R04W 19 NW) 592.82 593.4832.37 State Highway 70, 1.4 miles N of Columbus Junction (T75N R04W 07 SE) 2593.97 --40.85 240th Street, W of Conesville (T76N R05W 22 SW) 2601.92 --47.58 USGS streamgage 05455700, County Road W66, near Lone Tree (T76N R05W 06 NW) 611.26 612.1154.72 State Highway 22, Riverside (T77N R06W 11 NE) 618.98 620.3063.29 County Road F62, Hills (T78N R06W 23 NW) 629.76 631.4470.34 Izaak Walton Road, S of Iowa City (T79N R06W 33 NE) 2640.40 --70.62 Winter Eagle Trail, Iowa City (T79N R06W 27 SW) 1641.0 --71.53 Napoleon Lane, Iowa City (T79N R06W 22 SW) 1644.1 --72.00 Chicago, Rock Island, and Pacific (C.R.I. & P.) Railroad Bridge, Iowa City (T79N R06W 22 NW) 2644.93 --72.32 South Gilbert Street, Iowa City (T79N R06W 22 NW) 1646.3 --72.77 U.S. Highway 6, Iowa City (T79N R06W 15 SW) 646.92 647.0573.06 West Benton Street, Iowa City (T79N R06W 15 NW) 1647.8 2648.1373.30 Riverside Drive, Iowa City (T79N R06W 15 NW) 1648.4 --73.52 USGS streamgage 05454500, at Iowa City (T79N R06W 09 SE) 648.8073.59 State Highway 1 and Burlington Street, Iowa City (T79N R06W 09 SE) -- 651.2373.84 West Iowa Street, Iowa City (T79N R06W 09 SE) -- 3651.6574.08 Art Building, University of Iowa, Iowa City (T79N R06W 09 NE) 1653.4 --74.33 Hancher Auditorium Building, University of Iowa, Iowa City (T79N R06W 10 NW) 2653.53 --74.64 Park Road, Iowa City (T79N R06W 03 SW) 3655.15 --75.12 Dubuque Street, Iowa City (T79N R06W 03 NW) 1655.3 --75.28 Pentire Circle, Iowa City (T79N R06W 03 NW) 1655.5 --76.13 West Park Road, Iowa City (T79N R06W 04 SW) 1656.6 --76.65 2nd Street, Coralville (T79N R06W 08 NE) 1657.6 --77.13 IRP dam (T79N R06W 05 SE) 657.81 --77.47 E 7th Street, Coralville (T79N R06W 05 NE) 1659.2 --78.20 Interstate 80, Coralville (T79N R06W 04 NW) 661.11 --78.38 City of Iowa City Water Treatment Plant (T80N R06W 33 SW) -- 3663.0679.46 Dubuque Street NE, Iowa City (T80N R06W 33 NE) -- 1664.880.86 Longview Knoll, Iowa City (T80N R06W 28 SE) 1666.8 --
Table 7 73
Table 7. Locations and elevations of high-water marks used in the Iowa River flood profile from May 30 to June 15, 2008.—Continued
[HWM, high-water mark; NGVD 29, National Geodetic Vertical Datum of 1929; --, not determined; USGS, U.S. Geological Survey; T, township; R, range; N, north; W, west; S, south; E, east]
Distance from mouth (river miles)
Location
Downstream HWM (feet
above NGVD 29)
Upstream HWM (feet
above NGVD 29)
81.67 Stewart Road NE, Iowa City (T80N R06W 22 SW) 2667.65 --81.83 USGS streamgage, 05453520, below Coralville Dam (T80N R06W 22 SE) 668.07 --82.51 Coralville Lake Reservoir (T80N R06W 22 NE) 2717.02 --98.77 Interstate 380 (T81N R07W 22 SW) 2717.29 --98.99 State Highway 965 (T81N R07W 22 SW) -- 2717.34
104.26 Greencastle Avenue (T80N R08W 01 NE) 2717.41 --115.72 U.S. Highway 151, S of Amana (T81N R09W 35 NW) 2717.41 2717.61125.76 State Highway 220, N of S Amana (T81N R10W 36 NW) 2726.26 2726.40135.46 USGS streamgage 05453100, County Road V66, at Marengo (T81N R11W 24 NE) 741.90 1742.7138.04 F15 Boulevard, Marengo (T81N R11W 14 NE) 1744.2 --141.77 130th Street, Marengo (T81N R11W 21 NW) 1747.1 --146.92 F Avenue, N of Koszta (T81N R12W 12 SW) 2761.34 --155.09 State Highway 21, S of Belle Plaine (T81N R12W 05 NW) 2770.95 --158.75 380th Street, SE of Chelsea (T82N R13W 26 SW) 1776.3 --164.61 County Road V18, Chelsea (T82N R13W 08 SE) 1786.0 --174.90 P Avenue, E of Tama (T82N R14W 04 SE) 1803.2 --183.82 U.S. Highway 63, Tama (T83N R15W 34 SE) 2816.39 2817.50188.86 County Highway E49, W of Tama (T83N R15W 30 SE) 2825.87 2826.03195.51 E Avenue, NE of Montour (T83N R16W 22 NW) 2838.51 --197.08 U.S. Highway 30 (T83N R16W 16 NE) -- 2843.62197.91 C Avenue, E of Le Grand (T83N R16W 09 SW) 1843.9 --202.30 Abbott Avenue, N of Le Grand (T83N R16W 06 SW) 2850.20 --203.57 Zeller Avenue, N of Le Grand (T83N R17W 01 NW) 2853.66 1853.8205.38 Three bridges Road, N of Quarry (T83N R17W 03 SE) 2858.23 --209.49 County Road E35, E of Marshalltown (T84N R17W 29 SE) 2863.23 1865.1211.54 East Marion Street, Marshalltown (T84N R17W 30 SW) 1867.6 --214.27 USGS streamgage 05451500, State Highway 14, at Marshalltown (T84N R18W 23 SE) 874.89 --215.01 N Center Street, Marshalltown (T84N R18W 26 NW) -- 2875.75215.21 NW of N Center Street Bridge, Marshalltown (T84N R18W 26 NW) 1876.2 --221.26 State Highway 330, NW of Marshalltown (T84N R18W 18 NW) 1888.9 2889.33229.28 County Road E18, W of Liscomb (T85N R19W 11 SW) 907.17 909.35235.37 County Road D65, E of Union (T86N R19W 22 SE) 920.19 921.00245.93 State Highway 175, Eldora (T87N R19W 08 SE) 948.33 950.95251.83 County Road D35, Steamboat Rock (T88N R19W 28 NW) 964.74 967.65254.76 U.S. Highway 20 (T88N R19W 16 NW) 977.20 978.58276.12 Hollis Avenue below Iowa Falls Central States Dam, Iowa Falls (T89N R20W 18 SW) 1,047.20 --276.6 River Street, Iowa Falls (T89N R21W 13 SW) 1,059.95 --282.02 County Road D20, E of Alden (T89N R21W 17 SE) 1,093.96 1,094.88291.38 Dogwood Avenue, Popejoy Conservation Area (T90N R22W 27 NW) 11,124.8 --297.50 Interstate 35 (T90N R23W 13 NE) 1,134.51 1,134.91303.25 County Road C47, N of Dows (T91N R22W 30 NW) 1,145.23 1,146.42
74 Floods of May 30 to June 15, 2008, in the Iowa River and Cedar River Basins, Eastern Iowa
Table 7. Locations and elevations of high-water marks used in the Iowa River flood profile from May 30 to June 15, 2008.—Continued
[HWM, high-water mark; NGVD 29, National Geodetic Vertical Datum of 1929; --, not determined; USGS, U.S. Geological Survey; T, township; R, range; N, north; W, west; S, south; E, east]
Distance from mouth (river miles)
Location
Downstream HWM (feet
above NGVD 29)
Upstream HWM (feet
above NGVD 29)
305.23 Youngblood Avenue, NW of Dows (T91N R23W 24 NW) 11,146.5 --310.95 Union Avenue, W of Rowan (T92N R23W 33 SW) 11,153.2 --312.05 State Highway 3, W of Rowan (T92N R23W 32 NE) 1,155.57 1,155.92314.41 U.S. Highway 69, N of State Highway 3 (T92N R23W 30 SW) 1,157.32 1,158.63315.09 USGS streamgage 05449500, County Road C38, near Rowan (T92N R24W 25 NE) 1,159.24 1,160.01322.37 U.S. Highway 69, S of Belmond (T93N R23W 31 SW) 1,167.13 1,168.03324.17 U.S. Highway 69, Belmond (T93N R23W 30 SW) 1,170.39 1,170.78
1Federal Emergency Management Agency (FEMA) high-water mark (Federal Emergency Management Agency, 2008b).2U.S. Army Corps of Engineers (USACE) high-water mark.3City of Iowa City high-water mark.
Table 8 75
Table 8. Locations and elevations of high-water marks used in the Cedar River flood profile from May 30 to June 15, 2008.—Continued
[HWM, high-water mark; NGVD 29, National Geodetic Vertical Datum of 1929; --, not determined; USGS, U.S. Geological Survey; T, township; R, range; N, north; W, west; S, south; E, east]
Distance from mouth (river miles)
LocationDownstream
HWM (feet above NGVD 29)
Upstream HWM (feet above NGVD
29)
0.59 160th Street, NW of Fredonia (T75N R04W 20 NW) 1592.7 --1.12 County Road G40, N of Fredonia (T75N R04W 17 SW) 1594.0 --2.51 178th Street, N of Columbus Junction (T75N R04W 07 NE) 1595.5 --
2.94 State Highway 70, N of Columbus Junction (T75N R04W 06 SE) 1596.1 --4.33 County Road G40, N of Columbus Junction (T75N R04W 05 NE) 1597.9 --8.48 254th Street (Edgewater Road), E of Conesville (T76N R04W 15 SW) 2603.57 --
10.91 USGS streamgage 05465000, near Conesville (T76N R04W 02 SW) 605.35 605.6913.45 Elder Avenue, SE of Nichols (T77N R04W 26 SW) 3607.52 --17.76 State Highway 22, E of Nichols (T77N R03W 21 NW) 614.31 615.6522.72 170th Street, E of Nichols (T77N R03W 03 SW) 3621.49 --24.77 County Road F70, SE of Atalissa (T78N R03W 36 NW) 626.62 629.1930.60 U.S. Highway 6, E of Atalissa (T78N R02W 17 NW) 639.17 641.3231.95 Chicago, Rock Island, and Pacific Railroad, at Moscow (T78N R02W 09 NW) 2644.57 --34.20 Hinkeyville W Road, NW of Moscow (T78N R02W 06 NE) 2649.32 --39.71 Interstate 80, S of Rochester (T79N R03W 13 SE) 658.28 659.0841.85 County Road F44, at Rochester (T79N R03W 11 NE) 2662.04 --48.24 County Roads F36 and X40, at Cedar Valley (T80N R03W 19 NW) 675.76 --51.07 230th Street, N of Nicholson Creek (T80N R04W 11 NE) 2677.90 --53.92 County Road F28 (210th Street), Cedar Bluff (T81N R04W 33 NE) 684.49 684.6259.94 Yellow Pine Avenue, SE of Sutliff (T81N R05W 13 SW) 2689.54 --63.69 County Road F14 (Sutliff Road), Sutliff (T81N R05W 11 NE) 692.90 693.2165.28 McClelland Road, S of Mt. Vernon (T82N R05W 34 SE) 2694.69 --67.25 Spring Creek Road, S of Mt. Vernon (T82N R05W 28 NE) 2698.73 --69.58 State Highway 1, SW of Mt. Vernon (T82N R05W 30 NE) 702.58 703.0770.71 Cedar River Road, SW of Mt. Vernon (T82N R05W 19 SW) 2708.14 --72.20 Palisades-Kepler State Park, W of Mt. Vernon (T82N R06W 23 NE) 2709.98 --76.40 U.S. Highway 30, SE of Cedar Rapids (T82N R06W 09 NW) 717.46 718.4877.22 Anderle Trail, Cedar Rapids (T82N R06W 04 SW) 1719.2 --78.03 Heslane Road, Cedar Rapids (T82N R06W 05 NE) 1719.4 --78.99 Bertram Road, Cedar Rapids (T83N R06W 32 NE) 1720.3 --79.75 Berry Road, Cedar Rapids (T83N R06W 30 NE) 1720.7 --80.60 Old River Road, Cedar Rapids (T83N R06W 31 NW) 1721.1 --82.50 Old River Road, Cedar Rapids (T82N R07W 02 NE) 1724.4 --82.98 Old River Road, Cedar Rapids (T82N R07W 02 NW) 1725.4 --85.42 A Street SW, Cedar Rapids (T83N R07W 27 SW) 1730.0 --85.78 16th Avenue, Cedar Rapids (T83N R07W 28 SE) -- 2731.2886.28 USGS streamgage 05464500, at Cedar Rapids (T83N R07W 28 NE) 731.5986.54 3rd Avenue, Cedar Rapids (T83N R07W 28 NW) 2732.41 --86.71 U.S. Highway 151 (1st Avenue), Cedar Rapids (T83N R07W 28 NW) 734.18 734.3186.83 E Avenue and F Avenue (under I-380 overpass), Cedar Rapids (T83N R07W 21 SW) -- 734.6187.32 8th Street NW, Cedar Rapids (T83N R07W 20 NE) 1735.2 --
76 Floods of May 30 to June 15, 2008, in the Iowa River and Cedar River Basins, Eastern Iowa
Table 8. Locations and elevations of high-water marks used in the Cedar River flood profile from May 30 to June 15, 2008.—Continued
[HWM, high-water mark; NGVD 29, National Geodetic Vertical Datum of 1929; --, not determined; USGS, U.S. Geological Survey; T, township; R, range; N, north; W, west; S, south; E, east]
Distance from mouth (river miles)
LocationDownstream
HWM (feet above NGVD 29)
Upstream HWM (feet above NGVD
29)
87.96 Q Avenue NW, Cedar Rapids (T83N R07W 20 NE) 1735.7 --88.19 Wenig Road, Cedar Rapids (T83N R07W 17 SE) 1736.1 --88.48 Ellis Boulevard Park, Cedar Rapids (T83N R07W 17 SW) 1736.5 --89.07 Ellis Road NW, Cedar Rapids (T83N R07W 17 NW) 1737.0 --90.40 Ellis Road NW, Cedar Rapids (T83N R07W 18 NW) 1738.5 --90.99 Seminole Valley Road NE, Cedar Rapids (T83N R08W 13 NW) 1739.7 --91.92 Ellis Road NW, Cedar Rapids (T83N R08W 14 SE) 1741.0 --92.46 Ross Lane, Cedar Rapids (T83N R08W 14 NW) 1741.6 --93.65 42nd Street NE, Cedar Rapids (T83N R08W 11 NE) 1743.4 --94.16 Greenbranch Lane NE, Cedar Rapids (T83N R08W 02 SE) 1744.1 --96.09 High Point Lane, Cedar Rapids (T84N R08W 35 SW) 1744.7 --98.60 Shae Drive, SE of Palo (T84N R08W 33 NW) 1747.7 --
100.16 USGS streamgage 05464420, at Palo (T84N R08W 21 SW) 748.93 749.03101.98 Duane Arnold Energy Center, N of Palo (T84N R08W 09 SE) 2750.03 --108.58 Lewis Access Road, SW of Center Point (T85N R08W 20 SW) 2763.19 --112.70 County Road W26 (32nd Avenue) (T85N R09W 11 SW) 767.89 769.27116.92 Benton City-Fry Recreation Area, E of Vinton (T85N R09W 20 NE) 2776.32 --120.59 Hoefle-Dulin Recreation Area, E of Vinton (T85N R10W 23 NE) 2777.42 --124.22 E 1st Street, at Vinton (T85N R10W 16 SE) 1786.2 --124.51 USGS streamgage 05464315, at Vinton (T85N R10W 16 SW) 786.58 786.68127.02 22nd Avenue Trail and 22nd Avenue Road, NW of Vinton (T85N R10W 06 SE) 2788.99 --130.56 54th Street Drive, NW of Vinton (T86N R10W 19 SE) 2793.47 --137.03 County Road D65, near Mt. Auburn (T86N R10W 06 NW) 803.54 803.9142.05 Trail Bridge, E of La Porte City (T87N R11W 28 SE) 2814.14 --144.30 Brandon Road, NE of La Porte City (T87N R11W 19 SE) 816.47 817.22151.73 East Washburn Road, Gilbertville (T88N R12W 27 NE) 1825.7 --152.45 County Road D38, Gilbertville (T88N R12W 23 SW) 826.44 827.01156.01 Weiden Road, S of Waterloo (T88N R12W 17 NE) 1832.7 --157.30 Ridge Road, S of Evansdale (T88N R12W 08 NE) 1833.9 --158 Confluence of Elk Run and Cedar River, S of Evansdale (T88N R12W 06 SE) 1835.1 --158.14 Cedar Valley Bike Trail (Old W.C.F & N. R.R. Bridge), S of Evansdale (T88N
R12W 06 SW)-- 2836.86
158.45 River Road, Evansdale (T88N R12W 06 SW) 1839.0 --159.13 Belle Street, Evansdale (T88N R13W 12 NE) 1841.0 --159.57 Interstate 380/U.S. Highway 20, Waterloo (T88N R13W 12 NE) 842.09 842.58160.76 On berm, E of River Forest Road and N of Park Road, Evansdale (T88N R13W 01
NE)1844.1 --
161.18 River Forest Road, Evansdale (T89N R12W 32 SW) 1844.7 --161.63 SW of intersection of River Forest Road and Lafayette Street, Evansdale (T89N
R12W 32 NW)1846.7 --
162.67 S of intersection of Dewar Street and Indiana Street, Waterloo (T89N R12W 31 NW) 1846.8 --163.14 SE of Water Street, Waterloo (T89N R13W 25 SE) 1847.6 --
Table 8 77
Table 8. Locations and elevations of high-water marks used in the Cedar River flood profile from May 30 to June 15, 2008.—Continued
[HWM, high-water mark; NGVD 29, National Geodetic Vertical Datum of 1929; --, not determined; USGS, U.S. Geological Survey; T, township; R, range; N, north; W, west; S, south; E, east]
Distance from mouth (river miles)
LocationDownstream
HWM (feet above NGVD 29)
Upstream HWM (feet above NGVD
29)
163.30 18th Street Bridge, Waterloo (T89N R13W 25 SE) 2848.34 --163.36 18th Street Bridge, Waterloo (T89N R13W 25 SE) -- 1848.4163.86 11th Street Bridge, Waterloo (T89N R13W 25 NW) -- 2848.96163.99 East 9th Street, Waterloo (T89N R13W 25 NW) 1850.8 --164.16 USGS streamgage 05464000, at Waterloo (T89N R13W 25 NW) 851.15 --164.25 5th Street Bridge, Waterloo (T89N R13W 25 NW) 2852.52 --164.37 4th Street Bridge, Waterloo (T89N R13W 25 NW) -- 2852.87164.42 Park Avenue, Waterloo (T89N R13W 26 NE) 853.37 854.49164.71 Mullen Street, Waterloo (T89N R13W 23 SE) 854.88 855.12165.27 SW of Park Road and Fairview Avenue intersection, Waterloo (T89N R13W 23 NW) 1857.2 --165.71 On berm, adjacent to River Road, Waterloo (T89N R13W 22 NE) 1857.9 --166.31 San Souci Drive, Waterloo (T89N R13W 15 SW) 1859.4 --166.91 Bear Cedar Bend Street, Waterloo (T89N R13W 15NW) 1860.2 --168.32 Greenwood Avenue (downstream of U.S. Highway 218 Bridge), Waterloo (T89N
R13W 16 SW)1860.8 --
168.77 Greenwood Avenue (upstream of U.S. Highway 218 Bridge), Waterloo (T89N R13W 16 NW)
-- 1861.6
169.01 Shirley Way, Waterloo (T89N R13W 17 NE) 1862.0 --170.24 Cooley Street, Cedar Falls (T89N R13W 08 SW) 1863.1 --171.27 State Highway 58, Cedar Falls (T89N R13W 08 NW) 2864.29 4865.1172.19 USGS streamgage 05463050, at Cedar Falls (T89N R14W 12 NE) 865.1 --172.34 East Main Street, Cedar Falls (T89N R14W 12 NE) 2866.01 --172.56 1st Street and Clay Street, Cedar Falls (T89N R14W 12 NW) 1867.6 --172.65 Center Street, Cedar Falls (T89N R14W 12 NW) -- 2868.43173.43 Cottage Row Road, Waterloo (T89N R14W 02 SW) 1868.8 --174.16 Cottage Row Road, Waterloo (T89N R14W 02 NW) 1870.8 --174.47 Cottage Row Road, Waterloo (T89N R14W 03 NE) 1871.0 --184.43 Illinois Central Railroad Bridge (T91N R14W 35 SW) -- 2886.07184.66 USGS streamgage 05458500, at Janesville (T91N R14W 35 SW) 887.71 --185.03 U.S. Highway 218, N of Janesville (T91N R14W 35 NW) 888.75 890.41195.59 State Highway 3, Waverly (T91N R14W 02 NW) 2914.05 2917.10196.02 Old CNWTC Railroad Bridge, Waverly (T92N R14W 35 SW) -- 2917.19197.11 USGS streamgage 05458300, County Road V14, at Waverly (T92N R14W 35 NW) 919.73 2920.08202.00 County Road C33, N of Waverly (T92N R14W 21 NW) 2922.83 2925.43209.01 State Highway 188, E of Plainfield (T93N R14W 20 SW) -- 2936.07214.64 U.S. Highway 218 N of 110th Street, S of Nashua (T93N R14W 06 SW) 1950.9 --219.40 Jay Street, Nashua (T94N R14W 20 NW) 1965.0 --220.51 Illinois Central Railroad Bridge, Nashua (T94N R14W 17 SW) 2967.92 --220.66 Sample Street, Nashua (T94N R14W 18 SE) 1968.0 --222.85 Old Highway Road, N of Nashua (T94N R15W 12 NW) 1969.7 --226.24 Ripley Bridge Road, S of Charles City (T95N R15W 34 NW) 1976.3 --
78 Floods of May 30 to June 15, 2008, in the Iowa River and Cedar River Basins, Eastern Iowa
Table 8. Locations and elevations of high-water marks used in the Cedar River flood profile from May 30 to June 15, 2008.—Continued
[HWM, high-water mark; NGVD 29, National Geodetic Vertical Datum of 1929; --, not determined; USGS, U.S. Geological Survey; T, township; R, range; N, north; W, west; S, south; E, east]
Distance from mouth (river miles)
LocationDownstream
HWM (feet above NGVD 29)
Upstream HWM (feet above NGVD
29)
229.44 Underwood Avenue, S of Charles City (T95N R15W 20 SE) 1981.3 --232.61 Shaw Avenue, Charles City (T95N R15W 07 SW) 1994.9 --233.66 Hawkins Street, Charles City (T95N R15W 07 NW) 1997.7 --233.82 USGS streamgage 05457700, at Charles City (T95N R16W 12 NE) 998.35 --234.00 U.S. Highway 18, Charles City (T95N R16W 12 NE) 2998.50 --234.20 Riverside Drive, Charles City (T95N R16W 12 NE) 1998.6 --234.51 Court Street, Charles City (T95N R16W 01 SW) 11,002.3 --236.98 Riverview Drive, N of Charles City (T96N R16W 35 SW) 11,007.4 --
1Federal Emergency Management Agency (FEMA) high-water mark (Federal Emergency Management Agency, 2008b).2U.S. Army Corps of Engineers (USACE) high-water mark.3Muscatine County Engineers Office high-water mark.4Estimated flood elevation.
Appendix 1. Flood History of Iowa River and Cedar River Basins
80 Floods of May 30 to June 15, 2008, in the Iowa River and Cedar River Basins, Eastern Iowa
The earliest large flood in the Iowa River and Cedar River Basins for which any information was recorded occurred in 1851 (Heinitz, 1973). In October 1902 and June 1903 the first U.S. Geological Survey (USGS) streamgages in the State, not located on the Mississippi River, were installed in the basins and streamflow information, including floods, have been collected continuously since then. The streamgages are 05464500 Cedar River at Cedar Rapids, Iowa (fig 2, site 90), and 05454500 Iowa River at Iowa City, Iowa (fig 1, site 37). Streamgages 05451500 Iowa River at Marshalltown, Iowa (fig. 1, site 14), 05458500 Cedar River at Janesville, Iowa (fig 2, site 61), and 05465500 Iowa River at Wapello, Iowa (fig 1, site 103) have complete streamflow record, or almost complete streamflow record, since October 1914.
Maximum stages and discharges, and flood probabilities for the 2008 flood, are listed in table 3 for 54 streamgages in the Iowa River and Cedar River Basins. Also listed in table 3 are selected historical peak discharges. The streamgages listed in table 3 are listed in the USGS National Water Information System (NWIS) database. Users may obtain surface-water data for Iowa streamgages, including information on types of data available and years of data collection, at http://water-data.usgs.gov/ia/nwis/sw. Annual-maximum discharges from the peak-flow records for the Iowa City and Cedar Rapids streamgages and illustrations of the type of record that is col-lected for each continuous-record streamgage, and crest-stage streamgage listed in table 3, for which a maximum discharge is determined for each water year of streamgage operation are shown in figures 4 and 5. The figures also include the peaks from several floods that occurred before the streamgages were installed. The 1-percent flood probabilities for the streamgage 05464500 Cedar River at Cedar Rapids, Iowa are shown in figure 5. The three largest known floods at Iowa City occurred in 1851, 1881, and 1918. All three of these floods occurred before the Iowa River became a regulated stream downstream from the Coralville Dam in 1958. As indicated in figure 4, one effect of the Coralville Lake is to reduce flood discharges in the Iowa River downstream from the Coralville Dam. Since the beginning of the operation of the Coralville Dam in 1958, two major floods in 1993 and 2008 have occurred that exceeded the storage capacity of Coralville Lake and flowed over the spillway at Coralville Dam.
The Iowa Natural Resources Council (1955) reports that before the operation of streamgages in the Iowa River and Cedar River Basins, historical records indicate that major floods occurred in March 1840, June 1851, June 1858, July 1881, and June 1892. Irving B. Weber, an Iowa City historian and former contributor to the Iowa City Press-Citizen news-paper, published a newspaper article on March 19, 1975, titled Iowa River Floods. In the article, which was subsequently included in the publication Historical Stories about Iowa City, Volume 2 (Weber, 1979), Weber included local information and reports from eye-witness accounts of the 1851, 1881, and 1918 floods on the Iowa River in Iowa City. Weber also included an account that described that Native Americans still in the area in 1851 indicated that they knew of one other flood,
which their mark west of the Old Capitol (not shown on map) in Iowa City indicated was 1-foot higher than the 1851 flood. Weber reported that the year of this pre-1851 flood was not known, but that settlers in the area apparently placed credence in the Native American information.
Flood of June 1851
The flood of June 1851 is the largest known flood on the Iowa River at Iowa City and on the Iowa River upstream from the confluence with the Cedar River. Before the 1993 flood (discussed in a following section, Flood of 1993), the 1851 flood was generally recognized as the largest flood on record on some of the upper Mississippi River tributaries, includ-ing those in Iowa (Heinitz, 1973). The 1851 flood evidently covered a large area; however, there is little or no accurate information upon which to evaluate conditions for this flood. Before the 1961 flood (also discussed in a following section, Flood of March and April 1961), the 1851 flood was generally believed to have been the largest flood within the Iowa River and Cedar River Basins (Iowa Natural Resources Council, 1955). The flood probability for the peak discharge of the 1851 flood at the 05454500 Iowa River at Iowa City, Iowa streamgage (about 70,000 ft3/s, table 3, fig. 4) is estimated to be less than 0.2 percent (table 3). At the 05464500 Cedar River at Cedar Rapids, Iowa streamgage, the peak discharge of the 1851 flood (about 65,000 ft3/s, fig. 5) is the fifth larg-est known flood with a flood-probability estimate of 4 to 10 percent (table 3).
Flood of July 1881
The flood of July 1881 is the second largest known flood on the Iowa River at Iowa City. The second wettest year on record in Iowa was 1881, which had an average rainfall for the State of 44.16 in. (Hillaker, 2008a). The flood probabil-ity for the peak discharge of the 1881 flood at the Iowa City streamgage (51,000 ft3/s, table 3, fig. 4) is estimated to be 0.2 to 1 percent (table 3).
Flood of June 1918
The flood of June 1918 is largest known flood on the Iowa River at Marshalltown and near Belle Plaine. Rainfall in May had saturated the ground and heavy rainfall from May 27 to 28 resulted in minor flooding; continued heavy rainfall from June 3 to 5 caused major flooding (Heinitz, 1973). Flood prob-abilities for peak discharges of the 1918 flood at streamgages 05451500 Iowa River at Marshalltown, Iowa and 05452500 Iowa River near Belle Plaine, Iowa (fig. 1, site 20) are esti-mated to be less than 0.2 percent and 0.2 to 1 percent (table 3), respectively. At the 05454500 Iowa River at Iowa City, Iowa streamgage, the peak discharge of the 1918 flood (42,500 ft3/s, table 3, fig. 4) is the third largest known flood with a
Appendix 1 81
flood-probability estimate of 1 to 2 percent (table 3). The 1918 flood was not a significant flood in the Cedar River Basin.
Flood of March 1929
The flood of March 1929 is the sixth largest known flood on the Cedar River at Waterloo and Cedar Rapids. The flood was the result of rapid melting of heavy snow cover, which had accumulated throughout the previous two months (Schwob, 1963); the frozen ground and snowmelt runoff caused moderate flooding. Flood probabilities for peak discharges of the 1929 flood at streamgages 05464000 Cedar River at Waterloo, Iowa (fig. 2, site 79) and 05464500 Cedar River at Cedar Rapids, Iowa (fig. 5) are estimated to be 4 to 10 percent (table 3). The 1929 flood was not a significant flood in the Iowa River Basin.
Flood of March 1933
The flood of March 1933 is the second largest known flood on the Winnebago River at Mason City. This flood primarily was the result of heavy rainfall the last 3 days of March culminating a month that was, at that time, the wet-test since 1878 (Schwob, 1963). The north-central part of the State received the greatest amount of the monthly rainfall. The upper part of the Winnebago River Basin had a total of 6 or more in. of rainfall; the Black Hawk Creek and Beaver Creek Basins received rainfall totals ranging from 5 to 6.58 in.; the remainder of the Cedar River Basin upstream from Waterloo received 4 to 5 in.; and the Cedar River Basin downstream from Waterloo received 2 to 3 in. (Schwob, 1963). The flood probability for the peak discharge of the 1933 flood at streamgage 05459500 Winnebago River at Mason City, Iowa (fig. 2, site 68) is estimated to be 1 to 2 percent (table 3). At the 05458500 Cedar River at Janesville, Iowa streamgage, the peak discharge of the 1933 flood is the sixth largest known flood with a flood-probability estimate of 2 to 4 percent (table 3). Although the 1933 flood is the largest known flood of the short record available at streamgage 05460500 Shell Rock River at Marble Rock, Iowa (fig. 2, site 70), with a flood-probability estimate of 0.2 to 1 percent, the flood record at streamgage 05462000 Shell Rock River at Shell Rock, Iowa (fig. 2, site 74), located about 33-mi downstream, indicates that the 1933 flood may actually be about the third largest known flood on the Shell Rock River. The floods in 2008 and 1856 at the streamgage 05462000 Shell Rock River at Shell Rock were the largest and second largest floods, respectively, on the Shell Rock River (table 3). The 1933 flood was not a significant flood in the Iowa River Basin.
Flood of June 1947
The flood of June 1947 is the second largest known flood on Salt Creek near Elberon. Antecedent conditions of saturated
soils and swollen rivers contributed to this flood (Heinitz, 1973). Total rainfall from May 25 to June 30 ranged from about 7 in. in the extreme north of the Iowa River and Cedar River Basins, to 20 in. near Traer in the central part of the basins (Iowa Natural Resources Council, 1955). The rainfall occurred during several periods, and intermittent flooding occurred at various locations throughout the basins. The great-est rainfall occurred from June 10 to 13, particularly during the last 2 days of this period. The greatest amount of rainfall was reported at Vinton, where 4.70 in. fell in a 24-hour period, and at Shell Rock, where 4.93 in. fell in a 19-hour period on June 12 to13 (Iowa Natural Resources Council, 1955). The smaller tributaries in the central parts of the Iowa River and Cedar River Basins produced large floods and primarily were responsible for the flood that occurred on the mainstems of the Iowa River and Cedar River (Schwob, 1963). Damage along the Iowa River was particularly severe at Tama and Marshall-town, and along the Cedar River was most severe at Waterloo (Iowa Natural Resources Council, 1955). The flood prob-ability for the peak discharge of the 1947 flood at streamgage 05452000 Salt Creek near Elberon, Iowa (fig. 1, site 18) is estimated to be less than 0.2 percent (table 3).
Flood of June 1951
The flood of June 1951 is the largest known flood on the West Fork Cedar River at Finchford. The flood was the result of torrential rainfall from June 25 to 26. One storm occurred in the West Fork Cedar River Basin where as much as to 12.00 in. of rainfall was reported at Dumont (Iowa Natu-ral Resources Council, 1955). Smaller amounts of rainfall occurred in the remainder of the upper part of the Cedar River Basin, which was sufficient to cause flooding in all the larger tributaries (Schwob, 1963). The flood probability for the peak discharge of the 1951 flood at streamgage 05458900 West Fork Cedar River at Finchford, Iowa (fig. 2, site 63) is esti-mated to be 0.2 to 1 percent (table 3). The 1951 flood was not a significant flood in the Iowa River Basin.
Flood of June 1954
The flood of June 1954 is the largest known flood on the East Branch Iowa River near Klemme and the Iowa River near Rowan. Heavy rainfall in the last few days in May and the first half of June saturated the soil throughout much of the northern half of the State (Heinitz, 1973). The flood resulted from heavy rainfall during June 15 to 22 (Heinitz, 1973); rainfall totals from June 17 to 21 of 11.91 and 10.59 in. were recorded at Britt (fig. 1) and Mason City (fig. 2), respectively (Iowa Natural Resources Council, 1955). Severe flooding occurred along the Iowa River upstream from Iowa Falls which included extensive agricultural damage along the East and West Branches of the Iowa River. Willow Creek caused extensive urban damage in Mason City. The report Floods of June 1954 in Iowa (Yost, 1958) documents this flood.
82 Floods of May 30 to June 15, 2008, in the Iowa River and Cedar River Basins, Eastern Iowa
Flood probabilities for peak discharges of the 1954 flood at streamgages 05449000 East Branch Iowa River near Klemme, Iowa (fig. 1, site 9) and 05449500 Iowa River near Rowan, Iowa (fig. 1, site 10) are estimated to be 0.2 to 1 percent and 1 to 2 percent (table 3), respectively.
Flood of March and April 1961
The flood of March and April 1961 is the second larg-est known flood on the Cedar River at Waterloo and Cedar Rapids and is the third largest known flood on the Cedar River at Charles City, Janesville, and near Conesville. The flood resulted from rapid melting of heavy snow cover supple-mented by rainfall (Schwob, 1963). Flood probabilities for peak discharges of the 1961 flood at streamgage 05464000 Cedar River at Waterloo (76,700 ft3/s ) and at streamgage 05464500 Cedar River at Cedar Rapids (73,000 ft3/s, fig. 5) are estimated to be 4 to 10 percent and 2 to 4 percent (table 3), respectively. Flood probabilities for peak discharges of the 1961 flood at streamgages 05457700 Cedar River at Charles City, Iowa (fig. 2, site 56), 05458500 Cedar River at Janes-ville, Iowa, and 05465000 Cedar River near Conesville, Iowa (fig. 2, site 101) are estimated to be 1 to 2 percent for Charles City and Janesville and 4 to 10 percent for Conesville (table 3). The 1961 flood was not a significant flood in the Iowa River Basin.
Flood of July 1969
The flood of July 1969 is the second largest known flood on the Iowa River at Marshalltown. Heavy rainfall of 8 in. or more was reported throughout the upper part of the Iowa River Basin in June (Heinitz, 1973). The flood resulted from intense storms from July 6 to 9 with rainfall of 8.61 and 7.33 in. at Eldora and Iowa Falls, respectively. Severe flooding occurred on streams south of Iowa Falls, particularly on the South Fork Iowa River; however, no streamgages were operated on these streams. The flood probability for the peak discharge of the 1969 flood at streamgage 05451500 Iowa River at Marshall-town, Iowa is estimated to be 0.2 to 1 percent (table 3). At streamgage 05453100 Iowa River at Marengo, Iowa (fig.1, site 22), the peak discharge of the 1969 flood is the fourth larg-est known flood with a flood-probability estimate of 4 to 10 percent (table 3). The 1969 flood was not a significant flood in the Cedar River Basin.
Flood of 1993
The flood of 1993 is the largest known flood on the Iowa River near Lone Tree, on the English River at Kalona, and on Salt Creek near Elberon. From mid-June through early August, severe flooding in a nine-state area of the upper Mississippi River Basin followed an extended period of persistent precipi-tation that began in January. Following a wetter than average
spring, weather patterns that persisted from early June through July caused the Upper Midwest to be deluged with excessive rainfall (Wahl and others, 1993). The wettest year on record in Iowa was 1993, which had an average rainfall of 48.22 in. (Hillaker, 2008a). The 1993 flood in the upper Midwest is significant with respect to the magnitude and duration of flow. Flood-peak discharges equal or less than a 10-percent flood probability were recorded at 154 streamgages in the flooded region during June through August 1993 (Parrett and others, 1993). Not only were previous maximum peak discharges exceeded at many streamgages, but flood volumes were sig-nificantly higher than previous maximums (Southard, 1995). The human and economic costs of the flood were high. Total flood and other related damage in the Upper Mississippi River Basin were estimated in the $10 to $16 billion range, with total Federal expenditures in excess of $5.4 billion (Scientific Assessment and Strategy Team, 1994).
In Iowa, 34 streamgages exceeded previous peak dis-charges in 1993 with the vast majority of peaks occurring in July (Southard and others, 1994). Eleven streamgages in Iowa with 10 or more years of record on unregulated streams had flood-probability estimates equal to or less than 1 percent and every major reservoir in the State had record pool elevations. As a result of the magnitude of the 1993 flood, computed flood-probability discharges increased at most streamgages in Iowa (Eash, 1997). Two periods of significant flooding occurred in the Cedar Basin in 1993. In early April, flooding caused by snowmelt runoff and rainfall produced maximum discharges for 1993 along the Cedar River from Waterloo to Conesville. In mid-August, additional rainfall on saturated soils produced maximum discharges for 1993 along the Cedar River from Charles City to Janesville and at streamgage 05458000 Little Cedar River at Ionia, Iowa (fig. 2, site 59). Maximum discharges for 1993 along the Iowa River primar-ily occurred in July. Local streamflow contributions in August produced the peak discharge at the streamgage 05454500 Iowa River at Iowa City (Schaap and Harvey, 1995).
On the Iowa River upstream from the Coralville Dam, the 1993 flood is the second largest known flood at the streamgage 05453100 Iowa River at Marengo with a flood-probability estimate of 1 to 2 percent (table 3). Downstream from the Coralville Dam, at streamgages 05453520 Iowa River below Coralville Dam near Coralville, Iowa (fig. 1, site 25) and at streamgage 05454500 Iowa River at Iowa City (fig. 1, site 37), Iowa, peak discharges of the 1993 flood are the second largest since operation of the dam began in 1958 with flood-probability estimates of 1 to 2 percent (U.S. Army Corps of Engineers, 2009, table 3). Farther downstream from the dam, the flood probability for the peak discharge of the 1993 flood at streamgage 05455700 Iowa River near Lone Tree, Iowa (fig. 1, site 51) is estimated to be 0.2 to 1 percent (U.S. Army Corps of Engineers, 2009, table 3). Considering the entire peak-flow record for the 05454500 Iowa River at Iowa City, Iowa streamgage, the 1993 flood (28,200 ft3/s, fig. 4) is the seventh largest known flood. Downstream from the conflu-ence of the Iowa and Cedar Rivers, the peak discharge of the
Appendix 1 83
1993 flood is the second largest known flood at the streamgage 05465500 Iowa River at Wapello, Iowa with a flood-probabil-ity estimate of 2 to 4 percent (U.S. Army Corps of Engineers, 2009, table 3). Flood probabilities for peak discharges of the 1993 flood at streamgages 05455500 English River at Kalona, Iowa (fig. 1, site 49) and 05452000 Salt Creek near Elberon, Iowa are estimated to be 0.2 to 1 percent and less than 0.2 percent and (table 3), respectively. At streamgages 05457700 Cedar River at Charles City, Iowa and 05458500 Cedar River at Janesville, Iowa, peak discharges of the 1993 flood are the fourth largest known floods with flood-probabil-ity estimates for the streamgages of 2 to 4 percent (table 3); at the 05464000 Cedar River at Waterloo, Iowa streamgage, the 1993 flood is the fifth largest known flood with a flood-proba-bility estimate of 4 to 10 percent; at the 05464500 Cedar River at Cedar Rapids, Iowa streamgage, the 1993 flood is the third largest known flood (71,000 ft3/s, fig. 5) with a flood-probabil-ity estimate of 2 to 4 percent; and at the 05465000 Cedar River at Conesville, Iowa streamgage, the 1993 flood is the second largest known flood with a flood-probability estimate of 4 to 10 percent. At the 05458000 Little Cedar River near Ionia, Iowa streamgage, the peak discharge of the 1993 flood is the second largest known flood with a flood-probability estimate of 4 to 10 percent (table 3).
Flood of July 1999
The flood of July 1999 is the second largest known flood on the Cedar River at Charles City and Janesville. The flood resulted from the cumulative effect of two thunderstorms in northeast Iowa. From July 18 to 19, as much as 6 in. of rainfall was centered over Cerro Gordo, Floyd, Mitchell, and Worth Counties. From July 20 to 21, a second storm occurred in which an additional rainfall of as much as 8 in. was centered over Chickasaw and Floyd Counties (Ballew and Eash, 2001). Flood probabilities for peak discharges of the 1999 flood at streamgage 05457700 Cedar River at Charles City, Iowa and streamgage 05458500 Cedar River at Janesville, Iowa are estimated to be 1 to 2 percent and 0.2 to 1 percent (table 3), respectively. At streamgage 05461390 Flood Creek near Pow-ersville, Iowa (fig. 2, site 72), the peak discharge of the 1999 flood indicates a major flood with a flood-probability estimate of less than 0.2 percent (table 3). The 1999 flood was not a significant flood in the Iowa River Basin.
Flood of June 2002
The flood of June 2002 was severe along Indian Creek in Linn County following thunderstorm activity in east-central Iowa. A 24-hour rainfall of 4.76 in. was recorded at Cedar Rapids at 6:00 p.m. on June 4. Radar indications estimated as much as 6 in. of rain fell in the headwaters of the Indian Creek Basin. At two ungaged sites on Indian Creek, one north of Marion and the other near the mouth in Cedar Rapids, peak discharges determined for the 2002 flood were estimated to
have flood probabilities of less than 0.2 percent (Eash, 2004). The 2002 flood was not a significant flood on the mainstems of either the Iowa River or the Cedar River.
Comparison of the 2008 flood with the 1993 flood and other significant historical floods
A comparison of discharge hydrographs for the 1993 and 2008 water years for the streamgages 05454500 Iowa River at Iowa City, Iowa and 05464500 Cedar River at Cedar Rapids, Iowa is shown in figures 9 and 10. Also shown are long-term median daily discharges calculated for the regulated period of record (1959-2008) for the Iowa City streamgage and calcu-lated for the entire period of record (1903-2008) for the Cedar Rapids streamgage, and the discharge for the National Weather Service flood stage at each streamgage. From October to late May, streamflows at both streamgages were relatively similar for both water years because they generally stayed consistently above the long-term median-daily discharge (figs. 9 and 10). At Cedar Rapids, snowmelt runoff and rainfall produced flood peaks during March and April in 1993 and 2008 that exceeded the flood stage, including the maximum peak discharge for 1993 on April 4 (fig. 10). Operation of the Coralville Dam reduced discharges at Iowa City below the flood stage during March and April in 1993 and 2008. Peak discharges in June 2008 spike well above 1993 flood peaks at both streamgages; at Iowa City, the 2008 peak discharge (41,100 ft3/s) was nearly 46 percent larger than the 1993 peak discharge (28,200 ft3/s) and at Cedar Rapids, the 2008 peak discharge (140,000 ft3/s) was 97 percent larger than the 1993 peak discharge (71,000 ft3/s). While peak discharges for 2008 at Iowa City and Cedar Rapids were greater than those for 1993, the duration of 1993 discharges above the flood stage at each streamgage was more than twice as long as that for 2008.
Twenty-five streamgages out of the 104 streamgages listed in table 3 were selected to compare the 2008 flood to significant historical floods. They are sites 10, 12, 14, 18, 22, 25, 37, 40, 49, 51, 52, 56, 59, 60, 61, 63, 68, 74, 76, 78, 79, 85, 90, 101, and 103 in figures 1 and 2 and table 3. The drain-age areas of the selected streamgages are all greater than 200 mi2.
The 2008 flood-probability estimates for 23 of the 25 streamgages are less than 4 percent. The two streamgages that have 2008 flood-probability estimates greater than 4 percent are 05455100 Old Mans Creek near Iowa City (fig. 1, site 40) and 05455500 English River at Kalona, Iowa (fig. 1, site 49). The 2008 flood is the largest known flood at 16 sites whereas the 1993 flood is the largest known flood at three sites (the three sites are in the Iowa River Basin); streamgages were operated during the 1993 flood at 22 of the 25 sites. For the remaining six streamgages, the largest known floods occurred in 1851, 1918, 1951, 1954, 1982, and 2004.
Of the 25 streamgages, 10 are located in the Iowa River Basin (above the confluence from the Iowa River and Cedar River), 14 are located in the Cedar River Basin, and one is
84 Floods of May 30 to June 15, 2008, in the Iowa River and Cedar River Basins, Eastern Iowa
located in the Iowa River Basin downstream from the conflu-ence of the Iowa River and Cedar River at Wapello. The 2008 flood is the largest known flood at three of the 10 streamgages in the Iowa River Basin, at 12 of the 14 streamgages in the Cedar River Basin, and at the Wapello streamgage located downstream from the confluence of the Iowa River and Cedar River. Streamgages 05457000 Cedar River near Austin, Min-nesota (fig. 2, site 52) and 05458900 West Fork Cedar River at Finchford, Iowa are the only two streamgages in the Cedar River Basin with drainage areas greater than 200 mi2 for which the 2008 flood did not set a new peak discharge record.
At 21 of the 25 streamgages, flood probabilities for a total of 30 peak discharges from the periods of record are estimated to be less than 1 percent (table 3). Of these 30 flood peaks, 17 are for the 2008 flood and 3 are for the 1993 flood (all 3 1993 flood peaks are for streamgages in the Iowa River Basin); of the 10 remaining flood peaks, they occurred in 1851, 1856, 1881, 1918, 1944, 1947, 1951, 1969, 1999, and 2004. Since 1851, the 2008 flood on the Iowa River at streamgage 05454500 Iowa River at Iowa City, Iowa is the fourth larg-est known flood and the 2008 flood on the Cedar River streamgage 05464500 Cedar River at Cedar Rapids, Iowa is almost twice as large as that of the next largest known flood (the 1961 flood, figs. 4 and 5).
Appendix 2. List of bench marks and reference points
86 Floods of May 30 to June 15, 2008, in the Iowa River and Cedar River Basins, Eastern Iowa
To facilitate measuring and referencing the high-water marks (HWMs) used in the flood profiles to a common datum, bench marks (BMs), temporary bench marks (TBMs), and reference points (RPs) were found or established by the U.S. Geological Survey (USGS) at selected bridges along the profiled river reaches. All BM, TBM, and RP elevations listed in table 9 are referenced to the National Geodetic Vertical Datum of 1929. The list of 215 sites where the USGS, Federal Emergency Management Agency (FEMA, Federal Emergency Agency, 2008b), U.S. Army Corps of Engineers (USACE), Muscatine County Engineer’s Office, and the City of Iowa City, measured HWMs for the June 2008 flood is shown in tables 7 and 8. Of these 215 sites, BMs or TBMs are listed for 79 of the sites and RPs are listed for 61 of the sites in table 9. For 19 of the 79 sites listed in this appendix, BMs and TBMs and corresponding elevations were established by other agen-cies and these agencies are listed in table 9. BMs or reference marks (RMs) established at USGS streamgages are identi-fied in table 9 with a BM or RM number. BM, TBM, and RP elevations established by the USGS were determined from a combination of global positioning system (GPS) technology and differential leveling. Elevations determined using GPS are noted in the BM, TBM, and RP descriptions. GPS data were collected by the USGS and submitted for processing to the Online Positioning User Service (OPUS), an Internet service provided by the National Geodetic Survey (http://www.ngs.noaa.gov/OPUS/). The quality of the GPS data is based on the guidelines of “What to look for in a quality solution” (http://www.ngs.noaa.gov/OPUS/about.html, accessed January 22, 2009).
In general, BMs are points that were specifically designed to mark an elevation, such as USGS elevation disks and Iowa DOT bench marks (round-top rods embedded in concrete at
one or more corners of a bridge). Marks such as squares and crosses, that were chiseled or filed on concrete or metal; or existing bolts on bridges, were used as TBMs or RPs. RPs were established to permit water-surface elevations to be determined by use of a tape and weight. The terms “right” and “left” in the descriptions are determined as viewed while fac-ing in the downstream direction.
The BM, TBMs, and RPs are designated by an index number or legal description derived from their respective locations using Public Land Survey System coordinates (town-ship, range, section). Within the section, the quarter section in which the BM, TBM, or RP is located is designated by NE, SE, NW, and SW. For Example, T73N R02W 23 SW refers to a location in Township 73 North, Range 2 West, southwest quarter of section 23. A number in parentheses following the quarter-section designation indicates the number of the BM, TBM, or RP in that particular quarter section. The index number serves to describe the legal description of the mark without further reference in the body of the description. The physical location of the BM or TBM on a bridge dictates the appropriate legal description. An RP, and any additional BMs or TBMs, are listed with the related BM or TBM and are identified by the same legal description though, at times, they are in a different section, range, or township as determined by upstream or downstream location.
The BMs, TBMs, and RPs are listed in table 9 in upstream order for the Iowa and Cedar Rivers. The user of this information is cautioned that BMs, TBMs, and RPs listed herein might have been disturbed, destroyed, or moved since elevations were established. It is the responsibility of the user to determine the condition and the suitability of the BM, TBM, or RP.
Appendix 2 87Ta
ble
9.
Benc
h m
arks
and
refe
renc
e po
ints
use
d in
the
May
30
to J
une
15, 2
008,
Iow
a Ri
ver a
nd C
edar
Riv
er fl
ood
profi
les.
—Co
ntin
ued
[Ben
ch m
arks
and
refe
renc
e po
ints
are
list
ed in
ups
tream
ord
er. B
M, b
ench
mar
k; T
BM
, tem
pora
ry b
ench
mar
k; R
P, re
fere
nce
poin
t; G
PS, G
loba
l Pos
ition
ing
Syst
em; U
SGS,
U.S
. Geo
logi
cal S
urve
y; T
, to
wns
hip;
R, r
ange
; N, n
orth
; W, w
est;
S, so
uth;
E, e
ast]
Publ
ic L
and
Surv
ey S
ys-
tem
(tow
nshi
p, ra
nge,
se
ctio
n, q
uart
er-s
ectio
n)
Mar
k cl
assi
fi-ca
tion
Loca
tion
Mar
kEl
evat
ion
in
feet
(NG
VD
1929
)
Elev
atio
n de
term
inat
ion
met
hod
Iow
a Ri
ver
T73N
R02
W 2
3 SW
(1)
TBM
Abo
ut 0
.90
mile
s nor
thw
est o
f Oak
ville
, site
of s
tream
gage
054
6570
0 Io
wa
Riv
er a
t Oak
ville
, on
Stat
e H
ighw
ay 9
9 br
idge
ove
r Iow
a R
iver
, on
left
dow
nstre
am e
nd o
f win
gwal
l gird
er, o
n se
cond
bol
t he
ad fr
om a
butm
ent o
n m
etal
gird
er u
nder
gua
rdra
il
File
d cr
oss (
BM
1)56
0.61
Elev
atio
n su
pplie
d by
Lou
isa
Cou
nty
Engi
neer
’s O
ffice
T73N
R02
W 2
3 SW
(2)
RP
Abo
ut 0
.90
mile
s nor
thw
est o
f Oak
ville
, site
of s
tream
gage
054
6570
0 Io
wa
Riv
er a
t Oak
ville
, on
Stat
e H
ighw
ay 9
9 br
idge
ove
r Iow
a R
iver
, fro
m le
ft do
wns
tream
end
of b
ridge
bet
wee
n 10
th a
nd 1
1th
verti
cal s
teel
pos
ts o
n do
wns
tream
gird
er
Thre
e ch
isel
mar
ks56
1.18
Surv
eyed
leve
l lin
e fr
om
TBM
T74N
R03
W 2
7 SE
(1)
BM
At W
apel
lo, s
ite o
f stre
amga
ge 0
5465
500
Iow
a R
iver
at W
apel
lo, o
n St
ate
Hig
hway
99
brid
ge o
ver I
owa
Riv
er, o
n rig
ht u
pstre
am e
nd o
f br
idge
on
conc
rete
win
gwal
l
USG
S br
onze
ben
ch
mar
k st
ampe
d “8
DR
L 19
64”
579.
77St
ream
gage
ele
vatio
n da
ta
T74N
R03
W 1
6 N
W (1
)B
MA
bout
2 m
iles n
orth
of W
apel
lo, o
n U
.S. H
ighw
ay 6
1 br
idge
ove
r Iow
a R
iver
, on
right
dow
nstre
am e
nd o
f brid
ge o
n co
ncre
te ra
ilIo
wa
Dep
artm
ent o
f Tr
ansp
orta
tion
benc
h m
ark.
583.
28El
evat
ion
supp
lied
by Io
wa
Dep
artm
ent o
f Tra
nspo
rta-
tion
T74N
R03
W 1
6 N
W (2
)R
PA
bout
2 m
iles n
orth
of W
apel
lo, o
n U
.S. H
ighw
ay 6
1 br
idge
ove
r Iow
a R
iver
, fro
m ri
ght d
owns
tream
end
of b
ridge
at 3
rd d
rain
on
conc
rete
ra
il
Chi
sele
d sq
uare
584.
68Su
rvey
ed le
vel l
ine
from
BM
T75N
R04
W 2
0 SW
(1)
BM
Abo
ut 0
.7 m
iles e
ast o
f Col
umbu
s Jun
ctio
n, o
n St
ate
Hig
hway
92
brid
ge o
ver I
owa
Riv
er, o
n rig
ht d
owns
tream
end
of b
ridge
on
conc
rete
rail
Iow
a D
epar
tmen
t of
Tran
spor
tatio
n be
nch
mar
k.
597.
32G
PS
T75N
R04
W 2
0 SW
(2)
RP
Abo
ut 0
.7 m
iles e
ast o
f Col
umbu
s Jun
ctio
n, o
n St
ate
Hig
hway
92
brid
ge o
ver I
owa
Riv
er, f
rom
righ
t dow
nstre
am e
nd o
f brid
ge a
bout
33
0 ft
on c
oncr
ete
rail
Chi
sele
d sq
uare
. 59
8.02
GPS
T75N
R04
W 1
9 N
W (1
)B
MA
bout
0.7
mile
s nor
th o
f Col
umbu
s Jun
ctio
n, o
n St
ate
Hig
hway
70
brid
ge o
ver I
owa
Riv
er, o
n rig
ht u
pstre
am e
nd o
f brid
ge o
n co
ncre
te
rail
Iow
a D
epar
tmen
t of
Tran
spor
tatio
n be
nch
mar
k.
601.
75G
PS
T75N
R04
W 1
9 N
W (2
)R
PA
bout
0.7
mile
s nor
th o
f Col
umbu
s Jun
ctio
n, o
n St
ate
Hig
hway
70
brid
ge o
ver I
owa
Riv
er, f
rom
righ
t dow
nstre
am e
nd o
f brid
ge a
t 5th
dr
ain
Chi
sele
d sq
uare
. 60
0.36
GPS
T76N
R05
W 0
6 N
E (1
)TB
MA
bout
5 m
iles s
outh
east
of L
one
Tree
, site
of s
tream
gage
054
5570
0 Io
wa
Riv
er n
ear L
one
Tree
, on
Cou
nty
Roa
d W
66 b
ridge
ove
r Iow
a R
iver
, on
left
upst
ream
end
of b
ridge
on
conc
rete
rail
Chi
sele
d sq
uare
(RM
7)62
0.07
Stre
amga
ge e
leva
tion
data
T76N
R05
W 0
6 N
E (2
)B
MA
bout
5 m
iles s
outh
east
of L
one
Tree
, site
of s
tream
gage
054
5570
0 Io
wa
Riv
er n
ear L
one
Tree
, on
Cou
nty
Roa
d W
66 b
ridge
ove
r Iow
a R
iver
, on
right
ups
tream
end
of b
ridge
on
conc
rete
rail
Iow
a D
epar
tmen
t of
Tran
spor
tatio
n be
nch
mar
k
618.
72St
ream
gage
ele
vatio
n da
ta
88 Floods of May 30 to June 15, 2008, in the Iowa River and Cedar River Basins, Eastern IowaTa
ble
9.
Benc
h m
arks
and
refe
renc
e po
ints
use
d in
the
May
30
to J
une
15, 2
008,
Iow
a Ri
ver a
nd C
edar
Riv
er fl
ood
profi
les.
—Co
ntin
ued
[Ben
ch m
arks
and
refe
renc
e po
ints
are
list
ed in
ups
tream
ord
er. B
M, b
ench
mar
k; T
BM
, tem
pora
ry b
ench
mar
k; R
P, re
fere
nce
poin
t; G
PS, G
loba
l Pos
ition
ing
Syst
em; U
SGS,
U.S
. Geo
logi
cal S
urve
y; T
, to
wns
hip;
R, r
ange
; N, n
orth
; W, w
est;
S, so
uth;
E, e
ast]
Publ
ic L
and
Surv
ey S
ys-
tem
(tow
nshi
p, ra
nge,
se
ctio
n, q
uart
er-s
ectio
n)
Mar
k cl
assi
fi-ca
tion
Loca
tion
Mar
kEl
evat
ion
in
feet
(NG
VD
1929
)
Elev
atio
n de
term
inat
ion
met
hod
Iow
a Ri
ver—
Cont
inue
d
T77N
R06
W 0
2 SE
(1)
BM
Abo
ut 3
.5 m
iles e
ast o
f Riv
ersi
de, o
n St
ate
Hig
hway
22
brid
ge o
ver
Iow
a R
iver
, on
right
ups
tream
end
of b
ridge
on
conc
rete
rail
Iow
a D
epar
tmen
t of
Tran
spor
tatio
n be
nch
mar
k.
630.
53G
PS
T77N
R06
W 1
1 N
E (1
)R
PA
bout
3.5
mile
s eas
t of R
iver
side
, on
Stat
e H
ighw
ay 2
2 ov
er Io
wa
Riv
er, f
rom
righ
t dow
nstre
am e
nd o
f brid
ge, A
bout
3 ft
wes
t of 7
th
drai
n on
con
cret
e ra
il
Chi
sele
d sq
uare
. 63
1.08
GPS
T78N
R06
W 2
3 N
W (1
)TB
MA
bout
0.4
mile
s eas
t of H
ills,
on C
ount
y R
oad
F62
brid
ge o
ver I
owa
Riv
er, o
n rig
ht d
owns
tream
end
of b
ridge
on
conc
rete
win
gwal
lC
hise
led
squa
re.
635.
75G
PS
T78N
R06
W 2
3 N
W (2
)R
PA
bout
0.4
mile
s eas
t of H
ills,
on C
ount
y R
oad
F62
over
Iow
a R
iver
, fr
om ri
ght d
owns
tream
end
of b
ridge
at 4
th d
rain
Chi
sele
d sq
uare
. 63
5.37
GPS
T79N
R06
W 1
5 SW
(1)
BM
At I
owa
City
, on
U.S
. Hig
hway
6 o
ver I
owa
Riv
er, o
n le
ft do
wns
tream
en
d of
brid
ge o
n co
ncre
te w
ingw
all
Iow
a D
epar
tmen
t of
Tran
spor
tatio
n be
nch
mar
k.
648.
72G
PS
T79N
R06
W 1
5 SW
(2)
RP
At I
owa
City
, on
U.S
. Hig
hway
6 o
ver I
owa
Riv
er, f
rom
left
dow
n-st
ream
end
of b
ridge
at 2
0th
rail
post
Thre
e C
hise
led
mar
ks.
651.
63G
PS
T79N
R06
W 0
9 SE
(1)
BM
At I
owa
City
, at s
tream
gage
054
5450
0 Io
wa
Riv
er a
t Iow
a C
ity, o
n St
ate
Hig
hway
1, A
bout
200
ft d
owns
tream
of B
urlin
gton
Stre
et
Dam
on
right
ban
k of
Iow
a R
iver
, abo
ut 3
5 ft
upst
ream
of g
age
hous
e in
con
cret
e at
side
wal
k le
vel
Bra
ss p
lug
(RM
9)65
1.21
Stre
amga
ge e
leva
tion
data
T79N
R06
W 0
9 SE
(2)
RP
At I
owa
City
, on
Bur
lingt
on S
treet
brid
ge o
ver I
owa
Riv
er, f
rom
righ
t do
wns
tream
end
of b
ridge
, bet
wee
n 4t
h an
d 5t
h ve
rtica
l rai
l pos
ts
on c
oncr
ete
lip
Chi
sele
d sq
uare
657.
86Su
rvey
ed fr
om st
ream
gage
be
nch
mar
k
T79N
R06
W 1
0 SW
(1)
BM
At I
owa
City
, at s
outh
east
cor
ner o
f the
inte
rsec
tion
of W
ashi
ngto
n an
d M
adis
on S
treet
s, ne
ar th
e so
uth
end
of a
step
at t
he w
est e
ntra
nce
to
the
Iow
a M
echa
nica
l Lab
orat
ory
Stat
e U
nive
rsity
of
Iow
a st
anda
rd d
isk,
st
ampe
d 10
655.
16El
evat
ion
obta
ined
from
the
Nat
iona
l Geo
detic
Sur
vey
T79N
R06
W 0
5 SE
(1)
TBM
At C
oral
ville
, on
1st A
venu
e, in
par
king
lot a
djac
ent t
o pe
dest
rian
brid
ge o
ver I
owa
Riv
er, o
n so
uthw
est c
orne
r of s
torm
inta
keC
hise
led
cros
s. 65
5.16
GPS
T80N
R06
W 3
3 SW
(1)
RP
Abo
ut 0
.2 m
iles n
orth
of I
nter
stat
e 80
brid
ge o
ver I
owa
Riv
er, o
n le
ft ba
nk, a
t Iow
a C
ity W
ater
Tre
atm
ent P
lant
, on
stre
amw
ard
side
of
inta
ke st
ruct
ure
at d
owns
tream
stee
l pos
t
Four
chi
sel m
arks
. 65
5.17
GPS
T80N
R06
W 2
2 SE
(1)
BM
Abo
ut 0
.6 m
iles d
owns
tream
from
Cor
alvi
lle D
am c
ontro
l hou
se, s
ite
of st
ream
gage
054
5352
0 Io
wa
Riv
er b
elow
Cor
alvi
lle D
am n
ear
Cor
alvi
lle,
on le
ft ba
nk, o
n do
wns
tream
side
of g
age
hous
e ne
ar
clea
n ou
t doo
r
Dril
led
bolt
(RM
6)
655.
25St
ream
gage
ele
vatio
n da
ta
Appendix 2 89Ta
ble
9.
Benc
h m
arks
and
refe
renc
e po
ints
use
d in
the
May
30
to J
une
15, 2
008,
Iow
a Ri
ver a
nd C
edar
Riv
er fl
ood
profi
les.
—Co
ntin
ued
[Ben
ch m
arks
and
refe
renc
e po
ints
are
list
ed in
ups
tream
ord
er. B
M, b
ench
mar
k; T
BM
, tem
pora
ry b
ench
mar
k; R
P, re
fere
nce
poin
t; G
PS, G
loba
l Pos
ition
ing
Syst
em; U
SGS,
U.S
. Geo
logi
cal S
urve
y; T
, to
wns
hip;
R, r
ange
; N, n
orth
; W, w
est;
S, so
uth;
E, e
ast]
Publ
ic L
and
Surv
ey S
ys-
tem
(tow
nshi
p, ra
nge,
se
ctio
n, q
uart
er-s
ectio
n)
Mar
k cl
assi
fi-ca
tion
Loca
tion
Mar
kEl
evat
ion
in
feet
(NG
VD
1929
)
Elev
atio
n de
term
inat
ion
met
hod
Iow
a Ri
ver—
Cont
inue
d
T81N
R07
W 2
2 SW
(1)
BM
Abo
ut 4
.5 m
iles n
orth
wes
t of N
orth
Lib
erty
, on
Inte
rsta
te 3
80 b
ridge
ov
er Io
wa
Riv
er, o
n le
ft do
wns
tream
end
of d
owns
tream
brid
ge
north
boun
d la
nes,
on c
oncr
ete
win
gwal
l
Iow
a D
epar
tmen
t of
Tran
spor
tatio
n be
nch
mar
k
724.
25El
evat
ion
surv
eyed
from
N
atio
nal G
eode
tic S
urve
y be
nch
mar
k lo
cate
d on
H
WY
965
T81N
R07
W 2
2 SW
(2)
BM
Abo
ut 4
.5 m
iles n
orth
wes
t of N
orth
Lib
erty
, on
Inte
rsta
te 3
80 b
ridge
ov
er Io
wa
Riv
er, o
n le
ft up
stre
am e
nd o
f ups
tream
brid
ge so
uth-
boun
d la
nes,
on c
oncr
ete
win
gwal
l
Iow
a D
epar
tmen
t of
Tran
spor
tatio
n be
nch
mar
k
724.
34El
evat
ion
surv
eyed
from
N
atio
nal G
eode
tic S
urve
y be
nch
mar
k lo
cate
d on
H
WY
965
T81N
R07
W 2
2 SW
(3)
BM
Abo
ut 4
.5 m
iles n
orth
wes
t of N
orth
Lib
erty
, on
Stat
e H
ighw
ay 9
65
brid
ge o
ver I
owa
Riv
er, o
n le
ft up
stre
am e
nd o
f brid
ge, o
n co
ncre
te
abut
men
t
Nat
iona
l Geo
detic
Su
rvey
U.S
. Coa
st
& G
eode
tic S
urve
y be
nch
mar
k st
ampe
d “Z
183
199
7.”
719.
52El
evat
ion
obta
ined
from
Na-
tiona
l Geo
detic
Sur
vey
T81N
R07
W 2
2 SW
(4)
RP
Abo
ut 4
.5 m
iles n
orth
wes
t of N
orth
Lib
erty
, on
Stat
e H
ighw
ay 9
65
brid
ge o
ver I
owa
Riv
er, f
rom
left
end
of b
ridge
at 8
th d
rain
on
dow
nstre
am si
de, o
n co
ncre
te li
p
Chi
sele
d sq
uare
720.
47El
evat
ion
surv
eyed
from
N
atio
nal G
eode
tic S
urve
y be
nch
mar
k lo
cate
d on
H
WY
965
T81N
R09
W 3
5 N
W (1
)B
MA
bout
1.6
mile
s sou
th o
f Am
ana,
on
U.S
. Hig
hway
151
brid
ge o
ver
Iow
a R
iver
, on
left
dow
nstre
am e
nd o
f brid
ge, o
n co
ncre
te a
butm
ent
Iow
a D
epar
tmen
t of
Tran
spor
tatio
n be
nch
mar
k
729.
00G
PS
T81N
R09
W 3
5 N
W (2
)R
PA
bout
1.6
mile
s sou
th o
f Am
ana,
on
U.S
. Hig
hway
151
brid
ge o
ver
Iow
a R
iver
, fro
m le
ft do
wns
tream
end
of b
ridge
, Abo
ut 8
ft to
the
right
of 4
th d
rain
, on
conc
rete
lip
Chi
sele
d ar
row
735.
05G
PS
T81N
R10
W 3
6 N
W (1
)B
MA
bout
0.6
mile
s nor
th o
f Sou
th A
man
a, o
n St
ate
Hig
hway
220
brid
ge
over
Iow
a R
iver
, on
right
ups
tream
end
of b
ridge
, on
conc
rete
w
ingw
all
Iow
a D
epar
tmen
t of
Tran
spor
tatio
n be
nch
mar
k
735.
02G
PS
T81N
R10
W 3
6 N
W (2
)R
PA
bout
0.6
mile
s nor
th o
f Sou
th A
man
a, o
n St
ate
Hig
hway
220
brid
ge
over
Iow
a R
iver
, fro
m ri
ght d
owns
tream
end
of b
ridge
, bet
wee
n 13
th a
nd 1
4th
drai
ns
Chi
sele
d ar
row
735.
26G
PS
T81N
R10
W 1
9 SW
(1)
BM
Abo
ut 0
.6 m
iles n
orth
of M
aren
go, s
ite o
f stre
amga
ge 0
5453
100
Iow
a R
iver
at M
aren
go, o
n C
ount
y R
oad
V66
brid
ge o
ver I
owa
Riv
er, o
n rig
ht d
owns
tream
end
of b
ridge
, on
conc
rete
abu
tmen
t
Iow
a D
epar
tmen
t of
Tran
spor
tatio
n be
nch
mar
k
746.
30St
ream
gage
ele
vatio
n da
ta
T81N
R12
W 1
2 SW
(1)
BM
Abo
ut 0
.9 m
iles n
orth
of K
oszt
a, o
n C
ount
y R
oad
V44
/F A
venu
e br
idge
ove
r Iow
a R
iver
, on
left
dow
nstre
am e
nd o
f brid
ge, o
n co
n-cr
ete
abut
men
t
Chi
sele
d sq
uare
763.
55G
PS
90 Floods of May 30 to June 15, 2008, in the Iowa River and Cedar River Basins, Eastern IowaTa
ble
9.
Benc
h m
arks
and
refe
renc
e po
ints
use
d in
the
May
30
to J
une
15, 2
008,
Iow
a Ri
ver a
nd C
edar
Riv
er fl
ood
profi
les.
—Co
ntin
ued
[Ben
ch m
arks
and
refe
renc
e po
ints
are
list
ed in
ups
tream
ord
er. B
M, b
ench
mar
k; T
BM
, tem
pora
ry b
ench
mar
k; R
P, re
fere
nce
poin
t; G
PS, G
loba
l Pos
ition
ing
Syst
em; U
SGS,
U.S
. Geo
logi
cal S
urve
y; T
, to
wns
hip;
R, r
ange
; N, n
orth
; W, w
est;
S, so
uth;
E, e
ast]
Publ
ic L
and
Surv
ey S
ys-
tem
(tow
nshi
p, ra
nge,
se
ctio
n, q
uart
er-s
ectio
n)
Mar
k cl
assi
fi-ca
tion
Loca
tion
Mar
kEl
evat
ion
in
feet
(NG
VD
1929
)
Elev
atio
n de
term
inat
ion
met
hod
Iow
a Ri
ver—
Cont
inue
d
T81N
R12
W 1
2 SW
(2)
RP
Abo
ut 0
.9 m
iles n
orth
of K
oszt
a, o
n C
ount
y R
oad
V44
/F A
venu
e br
idge
ove
r Iow
a R
iver
, fro
m le
ft do
wns
tream
end
of b
ridge
, at 4
3rd
verti
cal r
ail p
ost
Thre
e ch
isel
mar
ks76
6.80
GPS
T81N
R12
W 0
6 N
E (1
)B
MA
bout
1.8
mile
s sou
th o
f Bel
le P
lain
e, o
n St
ate
Hig
hway
21
brid
ge
over
Iow
a R
iver
, on
right
ups
tream
end
of b
ridge
, on
conc
rete
br
idge
rail
Iow
a D
epar
tmen
t of
Tran
spor
tatio
n be
nch
mar
k.
779.
69G
PS
T81N
R12
W 0
5 N
W (1
)R
PA
bout
1.8
mile
s sou
th o
f Bel
le P
lain
e, o
n St
ate
Hig
hway
21
brid
ge
over
Iow
a R
iver
, fro
m ri
ght d
owns
tream
end
of b
ridge
, bet
wee
n 7t
h an
d 8t
h dr
ain,
on
conc
rete
brid
ge ra
il
Chi
sele
d sq
uare
780.
55G
PS
T82N
R13
W 1
9 N
E (1
)TB
MA
bout
0.5
mile
s sou
th o
f Che
lsea
, on
Cou
nty
Roa
d V
18 b
ridge
ove
r Io
wa
Riv
er, o
n rig
ht u
pstre
am e
nd o
f brid
ge, o
n cu
rbTo
p of
bol
t79
3.00
GPS
T82N
R13
W 2
0 N
W (1
)R
PA
bout
0.5
mile
s sou
th o
f Che
lsea
, on
Cou
nty
Roa
d V
18 b
ridge
ove
r Io
wa
Riv
er, f
rom
righ
t dow
nstre
am e
nd o
f brid
ge, b
etw
een
7th
and
8th
drai
ns
Thre
e ch
isel
mar
ks
794.
48G
PS
T82N
R14
W 0
4 SE
(1)
TBM
Abo
ut 4
.7 m
iles s
outh
east
of T
ama,
on
P Av
enue
brid
ge o
ver I
owa
Riv
er, o
n rig
ht d
owns
tream
end
of b
ridge
, on
win
gwal
lC
hise
led
squa
re80
7.45
GPS
T82N
R14
W 0
4 SE
(2)
TBM
Abo
ut 4
.7 m
iles s
outh
east
of T
ama,
on
P Av
enue
brid
ge o
ver I
owa
Riv
er, o
n rig
ht u
pstre
am e
nd o
f brid
ge, o
n ab
utm
ent
Chi
sele
d sq
uare
805.
26G
PS
T82N
R14
W 0
4 SE
(3)
RP
Abo
ut 4
.7 m
iles s
outh
east
of T
ama,
on
P Av
enue
brid
ge o
ver I
owa
Riv
er, f
rom
righ
t dow
nstre
am e
nd o
f brid
ge, a
bout
10
ft le
ft of
4th
dr
ain
Thre
e fil
e m
arks
808.
44G
PS
T83N
R15
W 3
4 SE
(1)
BM
Abo
ut 0
.3 m
iles s
outh
of T
ama,
on
U.S
. Hig
hway
63
brid
ge o
ver I
owa
Riv
er, o
n le
ft do
wns
tream
end
of b
ridge
, on
conc
rete
brid
ge ra
ilIo
wa
Dep
artm
ent o
f Tr
ansp
orta
tion
benc
h m
ark
828.
44G
PS
T83N
R15
W 3
4 SE
(2)
RP
Abo
ut 0
.3 m
iles s
outh
of T
ama,
on
U.S
. Hig
hway
63
brid
ge o
ver
Iow
a R
iver
, fro
m le
ft do
wns
tream
end
of b
ridge
nea
r 13t
h dr
ain,
on
conc
rete
brid
ge ra
il
Chi
sele
d sq
uare
829.
69G
PS
T83N
R16
W 1
6 N
E (1
)B
MA
bout
3 m
iles e
ast o
f Le
Gra
nd, o
n U
.S. H
ighw
ay 3
0 br
idge
ove
r Iow
a R
iver
, on
right
ups
tream
end
of u
pstre
am b
ridge
wes
tbou
nd la
nes,
on w
ingw
all
Iow
a D
epar
tmen
t of
Tran
spor
tatio
n be
nch
mar
k
850.
85G
PS
T83N
R16
W 1
6 N
E (2
)TB
MA
bout
3 m
iles e
ast o
f Le
Gra
nd, o
n U
.S. H
ighw
ay 3
0 br
idge
ove
r Io
wa
Riv
er, o
n rig
ht d
owns
tream
end
of u
pstre
am b
ridge
wes
tbou
nd
lane
s, on
win
gwal
l
Chi
sele
d cr
oss
850.
86G
PS
Appendix 2 91Ta
ble
9.
Benc
h m
arks
and
refe
renc
e po
ints
use
d in
the
May
30
to J
une
15, 2
008,
Iow
a Ri
ver a
nd C
edar
Riv
er fl
ood
profi
les.
—Co
ntin
ued
[Ben
ch m
arks
and
refe
renc
e po
ints
are
list
ed in
ups
tream
ord
er. B
M, b
ench
mar
k; T
BM
, tem
pora
ry b
ench
mar
k; R
P, re
fere
nce
poin
t; G
PS, G
loba
l Pos
ition
ing
Syst
em; U
SGS,
U.S
. Geo
logi
cal S
urve
y; T
, to
wns
hip;
R, r
ange
; N, n
orth
; W, w
est;
S, so
uth;
E, e
ast]
Publ
ic L
and
Surv
ey S
ys-
tem
(tow
nshi
p, ra
nge,
se
ctio
n, q
uart
er-s
ectio
n)
Mar
k cl
assi
fi-ca
tion
Loca
tion
Mar
kEl
evat
ion
in
feet
(NG
VD
1929
)
Elev
atio
n de
term
inat
ion
met
hod
Iow
a Ri
ver—
Cont
inue
d
T83N
R16
W 1
6 N
E (3
)R
PA
bout
3 m
iles e
ast o
f Le
Gra
nd, o
n U
.S. H
ighw
ay 3
0 br
idge
ove
r Iow
a R
iver
, fro
m ri
ght d
owns
tream
end
of u
pstre
am b
ridge
wes
tbou
nd
lane
s, ne
ar 1
3th
drai
n, o
n br
idge
rail
Chi
sele
d ar
row
850.
98G
PS
T84N
R17
W 2
9 SE
(1)
BM
Abo
ut 1
.9 m
iles e
ast o
f Mar
shal
ltow
n, o
n C
ount
y R
oad
E35
brid
ge
over
Iow
a R
iver
, on
right
dow
nstre
am e
nd o
f brid
ge, o
n w
ingw
all
Iow
a D
epar
tmen
t of
Tran
spor
tatio
n be
nch
mar
k
874.
25G
PS
T84N
R17
W 2
9 SE
(2)
RP
Abo
ut 1
.9 m
iles e
ast o
f Mar
shal
ltow
n, o
n C
ount
y R
oad
E35
brid
ge
over
Iow
a R
iver
, fro
m ri
ght d
owns
tream
end
of b
ridge
, bet
wee
n 4t
h an
d 5t
h dr
ains
Chi
sele
d ar
row
874.
82G
PS
T84N
R18
W 2
3 SE
(1)
BM
At M
arsh
allto
wn,
site
of s
tream
gage
054
5150
0 Io
wa
Riv
er a
t M
arsh
allto
wn,
on
Stat
e H
ighw
ay 1
4 br
idge
ove
r Iow
a R
iver
, on
right
dow
nstre
am e
nd o
f dow
nstre
am b
ridge
nor
thbo
und
lane
s, on
co
ncre
te g
uard
rail
USG
S be
nch
mar
k (R
M16
)88
2.23
Stre
amga
ge e
leva
tion
data
T84N
R19
W 1
3 N
E (1
)TB
MA
bout
4 m
iles n
orth
wes
t of M
arsh
allto
wn,
on
Stat
e H
ighw
ay 3
30
brid
ge o
ver I
owa
Riv
er, o
n rig
ht u
pstre
am e
nd o
f brid
ge, o
n w
ing-
wal
l
Chi
sele
d cr
oss
900.
47G
PS
T84N
R18
W 1
8 N
W (1
)R
PA
bout
4 m
iles n
orth
wes
t of M
arsh
allto
wn,
on
Stat
e H
ighw
ay 3
30
brid
ge o
ver I
owa
Riv
er, f
rom
righ
t dow
nstre
am e
nd o
f brid
ge,
Abo
ut 2
0 ft
to th
e rig
ht o
f 4th
dra
in, o
n gu
ardr
ail
Chi
sele
d ar
row
901.
37G
PS
T85N
R19
W 1
1 SW
(1)
TBM
Abo
ut 1
.4 m
iles w
est o
f Lis
com
b, o
n C
ount
y R
oad
E18
brid
ge o
ver
Iow
a R
iver
, on
right
dow
nstre
am e
nd o
f brid
ge, o
n w
ingw
all
Chi
sele
d sq
uare
920.
38G
PS
T85N
R19
W 1
1 SW
(2)
RP
Abo
ut 1
.4 m
iles w
est o
f Lis
com
b, o
n C
ount
y R
oad
E18
brid
ge o
ver
Iow
a R
iver
, fro
m ri
ght d
owns
tream
end
of b
ridge
, at 1
3th
pilla
rTh
ree
chis
eled
mar
ks92
0.89
GPS
T86N
R19
W 2
2 SE
(1)
BM
Abo
ut 0
.8 m
iles e
ast o
f Uni
on, o
n C
ount
y R
oad
D65
brid
ge o
ver I
owa
Riv
er, o
n le
ft up
stre
am e
nd o
f brid
ge, o
n w
ingw
all
Iow
a D
epar
tmen
t of
Tran
spor
tatio
n be
nch
mar
k
933.
18G
PS
T86N
R19
W 2
2 SE
(2)
RP
Abo
ut 0
.8 m
iles e
ast o
f Uni
on, o
n C
ount
y R
oad
D65
brid
ge o
ver
Iow
a R
iver
, fro
m le
ft do
wns
tream
end
of b
ridge
, nea
r 5th
dra
in, o
n gu
ardr
ail
Chi
sele
d ar
row
933.
15G
PS
T87N
R19
W 0
8 SE
(1)
BM
At E
ldor
a, o
n St
ate
Hig
hway
175
brid
ge o
ver I
owa
Riv
er, o
n rig
ht
dow
nstre
am e
nd o
f brid
ge, o
n w
ingw
all
Iow
a D
epar
tmen
t of
Tran
spor
tatio
n be
nch
mar
k
1023
.72
GPS
T87N
R19
W 0
8 SE
(2)
TBM
At E
ldor
a, o
n St
ate
Hig
hway
175
brid
ge o
ver I
owa
Riv
er, o
n le
ft do
wns
tream
end
of b
ridge
, on
win
gwal
lC
hise
led
cros
s10
05.8
3G
PS
92 Floods of May 30 to June 15, 2008, in the Iowa River and Cedar River Basins, Eastern IowaTa
ble
9.
Benc
h m
arks
and
refe
renc
e po
ints
use
d in
the
May
30
to J
une
15, 2
008,
Iow
a Ri
ver a
nd C
edar
Riv
er fl
ood
profi
les.
—Co
ntin
ued
[Ben
ch m
arks
and
refe
renc
e po
ints
are
list
ed in
ups
tream
ord
er. B
M, b
ench
mar
k; T
BM
, tem
pora
ry b
ench
mar
k; R
P, re
fere
nce
poin
t; G
PS, G
loba
l Pos
ition
ing
Syst
em; U
SGS,
U.S
. Geo
logi
cal S
urve
y; T
, to
wns
hip;
R, r
ange
; N, n
orth
; W, w
est;
S, so
uth;
E, e
ast]
Publ
ic L
and
Surv
ey S
ys-
tem
(tow
nshi
p, ra
nge,
se
ctio
n, q
uart
er-s
ectio
n)
Mar
k cl
assi
fi-ca
tion
Loca
tion
Mar
kEl
evat
ion
in
feet
(NG
VD
1929
)
Elev
atio
n de
term
inat
ion
met
hod
Iow
a Ri
ver—
Cont
inue
d
T87N
R19
W 0
8 SE
(3)
RP
At E
ldor
a, o
n St
ate
Hig
hway
175
brid
ge o
ver I
owa
Riv
er, f
rom
left
dow
nstre
am e
nd o
f brid
ge, b
etw
een
7th
and
8th
drai
ns, o
n gu
ardr
ail
Chi
sele
d ar
row
10
14.9
3G
PS
T88N
R19
W 2
8 N
W (1
)B
MA
t Ste
ambo
at R
ock,
on
Cou
nty
Roa
d D
35 b
ridge
ove
r Iow
a R
iver
, on
left
dow
nstre
am e
nd o
f brid
ge, o
n w
ingw
all
Iow
a D
epar
tmen
t of
Tran
spor
tatio
n be
nch
mar
k (to
p of
bol
t)
975.
81G
PS
T88N
R19
W 2
8 N
W (2
)R
PA
t Ste
ambo
at R
ock,
on
Cou
nty
Roa
d D
35 b
ridge
ove
r Iow
a R
iver
, fr
om le
ft do
wns
tream
end
of b
ridge
, at 3
rd d
rain
, on
guar
drai
lC
hise
led
arro
w97
5.73
GPS
T88N
R19
W 1
6 N
W (1
)B
MA
bout
2 m
iles n
orth
of S
team
boat
Roc
k, o
n U
.S. H
ighw
ay 2
0 br
idge
ov
er Io
wa
Riv
er, o
n rig
ht u
pstre
am e
nd o
f brid
ge, o
n w
ingw
all
Iow
a D
epar
tmen
t of
Tran
spor
tatio
n be
nch
mar
k
1094
.79
GPS
T89N
R21
W 1
3 SE
(1)
TBM
At I
owa
Falls
, on
U.S
. Hig
hway
65
brid
ge o
ver I
owa
Riv
er, o
n le
ft up
stre
am e
nd o
f brid
ge, o
n w
ingw
all
Chi
sele
d sq
uare
11
05.8
8G
PS
T89N
R21
W 1
3 SE
(2)
RP
At I
owa
Falls
, on
U.S
. Hig
hway
65
brid
ge o
ver I
owa
Riv
er, f
rom
left
dow
nstre
am e
nd o
f brid
ge, b
etw
een
14th
and
15t
h st
eel p
osts
on
guar
drai
l
Thre
e ch
isel
mar
ks
1102
.35
GPS
T89N
R21
W 1
3 SE
(3)
TBM
At I
owa
Falls
, on
Riv
er S
treet
brid
ge o
ver I
owa
Riv
er, o
n rig
ht d
own-
stre
am e
nd o
f brid
ge, o
n w
ingw
all
Chi
sele
d cr
oss
1074
.85
GPS
T89N
R21
W 1
7 SE
(1)
BM
Abo
ut 1
mile
s eas
t of A
lden
, on
Cou
nty
Roa
d D
20 b
ridge
ove
r Iow
a R
iver
, on
right
dow
nstre
am e
nd o
f brid
ge, o
n w
ingw
all
Iow
a D
epar
tmen
t of
Tran
spor
tatio
n be
nch
mar
k
1106
.32
GPS
T89N
R21
W 1
7 SE
(2)
RP
Abo
ut 1
mile
s eas
t of A
lden
, on
Cou
nty
Roa
d D
20 b
ridge
ove
r Iow
a R
iver
, fro
m ri
ght d
owns
tream
end
of b
ridge
, nea
r 3rd
dra
in, o
n st
eel
post
Thre
e ch
isel
ed m
arks
11
06.4
2G
PS
T90N
R23
W 1
3 N
E (1
)B
MA
bout
2.8
mile
s sou
th o
f Dow
s, on
Inte
rsta
te 3
5 br
idge
ove
r Iow
a R
iver
, on
left
upst
ream
end
of u
pstre
am b
ridge
sout
hbou
nd la
nes,
on
conc
rete
gua
rdra
il
Iow
a D
epar
tmen
t of
Tran
spor
tatio
n be
nch
mar
k
1147
.44
GPS
T90N
R23
W 1
3 N
E (2
)R
PA
bout
2.8
mile
s sou
th o
f Dow
s, on
Inte
rsta
te 3
5 br
idge
ove
r Iow
a R
iver
, fro
m le
ft do
wns
tream
end
of u
pstre
am b
ridge
sout
hbou
nd
lane
s, at
4th
dra
in o
n co
ncre
te li
p
Chi
sele
d ar
row
1145
.91
GPS
T91N
R22
W 3
0 N
W (1
)TB
MA
bout
0.7
mile
s nor
thea
st o
f Dow
s, on
Cou
nty
Roa
d C
47 b
ridge
ove
r Io
wa
Riv
er, o
n le
ft do
wns
tream
end
of b
ridge
, on
conc
rete
cur
bC
hise
led
cros
s 11
50.9
7G
PS
T91N
R22
W 3
0 N
W (2
)R
PA
bout
0.7
mile
s nor
thea
st o
f Dow
s, on
Cou
nty
Roa
d C
47 b
ridge
ove
r Io
wa
Riv
er, f
rom
left
dow
nstre
am e
nd o
f brid
ge, o
n 9t
h st
eel p
ost
Thre
e ch
isel
mar
ks
1152
.99
GPS
Appendix 2 93Ta
ble
9.
Benc
h m
arks
and
refe
renc
e po
ints
use
d in
the
May
30
to J
une
15, 2
008,
Iow
a Ri
ver a
nd C
edar
Riv
er fl
ood
profi
les.
—Co
ntin
ued
[Ben
ch m
arks
and
refe
renc
e po
ints
are
list
ed in
ups
tream
ord
er. B
M, b
ench
mar
k; T
BM
, tem
pora
ry b
ench
mar
k; R
P, re
fere
nce
poin
t; G
PS, G
loba
l Pos
ition
ing
Syst
em; U
SGS,
U.S
. Geo
logi
cal S
urve
y; T
, to
wns
hip;
R, r
ange
; N, n
orth
; W, w
est;
S, so
uth;
E, e
ast]
Publ
ic L
and
Surv
ey S
ys-
tem
(tow
nshi
p, ra
nge,
se
ctio
n, q
uart
er-s
ectio
n)
Mar
k cl
assi
fi-ca
tion
Loca
tion
Mar
kEl
evat
ion
in
feet
(NG
VD
1929
)
Elev
atio
n de
term
inat
ion
met
hod
Iow
a Ri
ver—
Cont
inue
d
T92N
R23
W 2
9 SE
(1)
BM
Abo
ut 1
.6 m
iles w
est o
f Row
an, o
n St
ate
Hig
hway
3 br
idge
ove
r Iow
a R
iver
, on
left
upst
ream
end
of b
ridge
, on
win
gwal
lIo
wa
Dep
artm
ent o
f Tr
ansp
orta
tion
benc
h m
ark
1167
.68
GPS
T92N
R23
W 3
2 N
E (1
)R
PA
bout
1.6
mile
s wes
t of R
owan
, on
Stat
e H
ighw
ay3
brid
ge o
ver I
owa
Riv
er, f
rom
left
dow
nstre
am e
nd o
f brid
ge, a
t 3rd
dra
inC
hise
led
squa
re
1164
.75
GPS
T92N
R23
W 3
0 SW
(1)
BM
Abo
ut 0
.5 m
iles n
orth
of S
tate
Hig
hway
3, o
n U
.S. H
ighw
ay 6
9 br
idge
ov
er Io
wa
Riv
er, o
n rig
ht d
owns
tream
end
of b
ridge
, on
abut
men
t gu
ardr
ail
Iow
a D
epar
tmen
t of
Tran
spor
tatio
n be
nch
mar
k
1167
.30
GPS
T92N
R23
W 3
0 SW
(2)
RP
Abo
ut 0
.5 m
iles n
orth
of S
tate
Hig
hway
3, o
n U
.S. H
ighw
ay 6
9 br
idge
ov
er Io
wa
Riv
er, f
rom
righ
t dow
nstre
am e
nd o
f brid
ge, a
t sec
ond
drai
n on
gua
rdra
il
Chi
sele
d sq
uare
11
67.1
5G
PS
T92N
R24
W 2
5 N
E (1
)B
MA
bout
3.8
mile
s nor
thw
est o
f Row
an, s
ite o
f stre
amga
ge 0
5449
500
Iow
a R
iver
nea
r Row
an, o
n C
ount
y H
ighw
ay C
38 b
ridge
ove
r Iow
a R
iver
, on
left
dow
nstre
am e
nd o
f brid
ge, o
n ab
utm
ent g
uard
rail
USG
S be
nch
mar
k (R
M
9)11
68.3
0St
ream
gage
ele
vatio
n da
ta
T92N
R23
W 0
6 N
W (1
)TB
MA
bout
1.3
mile
s sou
th o
f Bel
mon
d, o
n U
.S. H
ighw
ay 6
9 br
idge
ove
r Io
wa
Riv
er, o
n le
ft do
wns
tream
end
of b
ridge
, on
win
gwal
lC
hise
led
squa
re
1169
.63
GPS
T93N
R23
W 3
1 SW
(1)
RP
Abo
ut 1
.3 m
iles s
outh
of B
elm
ond,
on
U.S
. Hig
hway
69
brid
ge o
ver
Iow
a R
iver
, fro
m le
ft do
wns
tream
end
of b
ridge
at 3
rd d
rain
Chi
sele
d ar
row
11
70.6
6G
PS
T93N
R23
W 3
0 SW
(1)
TBM
At B
elm
ond,
on
U.S
. Hig
hway
69
brid
ge o
ver I
owa
Riv
er, o
n rig
ht
dow
nstre
am e
nd o
f brid
ge, o
n ab
utm
ent g
uard
rail
Chi
sele
d cr
oss
1179
.10
GPS
T93N
R23
W 3
0 SW
(2)
RP
At B
elm
ond,
on
U.S
. Hig
hway
69
brid
ge o
ver I
owa
Riv
er, f
rom
left
dow
nstre
am e
nd o
f brid
ge a
t 3rd
dra
in, o
n gu
ardr
ail
Chi
sele
d ar
row
11
79.4
8G
PS
Ceda
r Riv
er
T76N
R04
W 0
2 SW
(1)
BM
Abo
ut 3
.4 m
iles n
orth
east
of C
ones
ville
, site
of s
tream
gage
054
6500
0 C
edar
Riv
er n
ear C
ones
ville
, on
Cou
nty
Roa
d G
28 b
ridge
ove
r C
edar
Riv
er, o
n rig
ht d
owns
tream
abu
tmen
t of b
ridge
, on
upst
ream
la
ndw
ard
rivet
in a
gro
up o
f 4 o
n st
eel c
urb
Chi
sele
d cr
oss (
RM
9)
607.
00St
ream
gage
ele
vatio
n da
ta
T76N
R04
W 0
2 SW
(2)
RP
Abo
ut 3
.4 m
iles n
orth
east
of C
ones
ville
, site
of s
tream
gage
054
6500
0 C
edar
Riv
er n
ear C
ones
ville
, on
Cou
nty
Roa
d G
28 b
ridge
ove
r C
edar
Riv
er, o
n do
wns
tream
lip
of b
ridge
, abo
ve th
ird d
rain
from
rig
ht e
nd o
f brid
ge
Chi
sele
d sq
uare
610.
08St
ream
gage
ele
vatio
n da
ta
T77N
R03
W 2
1 N
W (1
)B
MA
bout
5.5
mile
s eas
t of N
icho
ls, a
t Sta
te H
ighw
ay 2
2 br
idge
ove
r C
edar
Riv
er, o
n rig
ht d
owns
tream
gua
rdra
ilIo
wa
Dep
artm
ent o
f Tr
ansp
orta
tion
benc
h m
ark
624.
96G
PS
94 Floods of May 30 to June 15, 2008, in the Iowa River and Cedar River Basins, Eastern IowaTa
ble
9.
Benc
h m
arks
and
refe
renc
e po
ints
use
d in
the
May
30
to J
une
15, 2
008,
Iow
a Ri
ver a
nd C
edar
Riv
er fl
ood
profi
les.
—Co
ntin
ued
[Ben
ch m
arks
and
refe
renc
e po
ints
are
list
ed in
ups
tream
ord
er. B
M, b
ench
mar
k; T
BM
, tem
pora
ry b
ench
mar
k; R
P, re
fere
nce
poin
t; G
PS, G
loba
l Pos
ition
ing
Syst
em; U
SGS,
U.S
. Geo
logi
cal S
urve
y; T
, to
wns
hip;
R, r
ange
; N, n
orth
; W, w
est;
S, so
uth;
E, e
ast]
Publ
ic L
and
Surv
ey S
ys-
tem
(tow
nshi
p, ra
nge,
se
ctio
n, q
uart
er-s
ectio
n)
Mar
k cl
assi
fi-ca
tion
Loca
tion
Mar
kEl
evat
ion
in
feet
(NG
VD
1929
)
Elev
atio
n de
term
inat
ion
met
hod
Ceda
r Riv
er—
Cont
inue
d
T77N
R03
W 2
1 N
W (2
)R
PA
bout
5.5
mile
s eas
t of N
icho
ls, a
t Sta
te H
ighw
ay 2
2 br
idge
ove
r C
edar
Riv
er, n
ear 7
th d
rain
from
righ
t dow
nstre
am e
nd o
f brid
geC
hise
led
arro
w
626.
00G
PS
T78N
R03
W 3
6 N
W (1
)TB
MA
bout
5.0
mile
s sou
thea
st o
f Ata
lissa
, at C
ount
y R
oad
F70/
155t
h St
reet
brid
ge o
ver C
edar
Riv
er, o
n le
ft up
stre
am w
ingw
all g
uard
rail
Chi
sele
d sq
uare
635.
74El
evat
ion
obta
ined
from
Mus
-ca
tine
Cou
nty
Engi
neer
’s
Offi
ceT7
8N R
03W
36
NW
(2)
RP
Abo
ut 5
.0 m
iles s
outh
east
of A
talis
sa, a
t Cou
nty
Roa
d F7
0/15
5th
Stre
et b
ridge
ove
r Ced
ar R
iver
, at 5
th d
rain
from
righ
t dow
nstre
am
end
of b
ridge
on
stee
l rai
l
Thre
e ch
isel
mar
ks63
8.00
Surv
eyed
leve
l lin
e fr
om
TBM
T78N
R02
W 0
8 SW
(1)
TBM
Abo
ut 3
.0 m
iles e
ast o
f Ata
lissa
, at U
.S. H
ighw
ay 6
brid
ge o
ver C
edar
R
iver
, on
right
ups
tream
brid
ge ra
ilC
hise
led
squa
re
654.
57G
PS
T78N
R02
W 1
7 N
W (1
)R
PA
bout
3.0
mile
s eas
t of A
talis
sa, a
t U.S
. Hig
hway
6 b
ridge
ove
r Ced
ar
Riv
er, f
rom
righ
t dow
nstre
am e
nd o
f brid
ge, a
cros
s fro
m 2
nd d
rain
on
ups
tream
side
of b
ridge
Chi
sele
d sq
uare
65
4.56
GPS
T79N
R03
W 1
3 SE
(1)
BM
Abo
ut 2
.3 m
iles s
outh
east
of R
oche
ster
, at I
nter
stat
e 80
brid
ge o
ver
Ced
ar R
iver
, on
right
dow
nstre
am g
uard
rail
of e
astb
ound
lane
sIo
wa
Dep
artm
ent o
f Tr
ansp
orta
tion
benc
h m
ark
665.
69G
PS
T79N
R03
W 1
3 SE
(2)
BM
Abo
ut 2
.3 m
iles s
outh
east
of R
oche
ster
, at I
nter
stat
e 80
brid
ge o
ver
Ced
ar R
iver
, on
right
ups
tream
gua
rdra
il of
new
brid
ge, l
ocat
ed
dow
nstre
am o
f exi
stin
g ea
stbo
und
lane
brid
ge
Iow
a D
epar
tmen
t of
Tran
spor
tatio
n be
nch
mar
k
666.
45G
PS
T80N
R03
W 1
9 N
W (1
)TB
MA
t Ced
ar V
alle
y on
Cou
nty
Roa
ds F
36 a
nd X
40/C
edar
Val
ley
brid
ge
over
Ced
ar R
iver
, on
right
dow
nstre
am e
nd o
f brid
ge, o
n st
ream
-w
ard
corn
er o
f old
hor
izon
tal c
emen
t abu
tmen
t at a
bout
cur
b le
vel
Chi
sele
d cr
oss
688.
09G
PS
T80N
R03
W 1
9 N
W (2
)R
PA
t Ced
ar V
alle
y on
Cou
nty
Roa
ds F
36 a
nd X
40/C
edar
Val
ley
brid
ge
over
Ced
ar R
iver
, fro
m ri
ght d
owns
tream
end
of b
ridge
, nea
r 6th
de
ck d
rain
on
guar
drai
l
Two
chis
el m
arks
68
5.93
GPS
T81N
R04
W 3
3 N
E (1
)B
MA
t Ced
ar B
luff
on C
ount
y R
oad
F28/
210t
h St
reet
brid
ge o
ver C
edar
R
iver
, on
right
ups
tream
brid
ge ra
ilIo
wa
Dep
artm
ent o
f Tr
ansp
orta
tion
benc
h m
ark
691.
92G
PS
T81N
R04
W 3
3 N
E (2
)R
PA
t Ced
ar B
luff
on C
ount
y R
oad
F28/
210t
h St
reet
brid
ge o
ver C
edar
R
iver
, fro
m ri
ght d
owns
tream
end
of b
ridge
, nea
r 7th
dec
k dr
ain
on
rail
post
Chi
sele
d ar
row
694.
54G
PS
T81N
R05
W 1
1 N
E (1
)TB
MA
t Sut
liff o
n C
ount
y R
oad
F14/
Sutli
ff R
oad
brid
ge o
ver C
edar
Riv
er,
on le
ft do
wns
tream
brid
ge ra
ilC
hise
led
squa
re
696.
93G
PS
T81N
R05
W 1
1 N
E (2
)R
PA
t Sut
liff o
n C
ount
y R
oad
F14/
Sutli
ff R
oad
brid
ge o
ver C
edar
Riv
er,
from
left
dow
nstre
am e
nd o
f brid
ge, n
ear 7
th d
eck
drai
nC
hise
led
squa
re
698.
37G
PS
Appendix 2 95Ta
ble
9.
Benc
h m
arks
and
refe
renc
e po
ints
use
d in
the
May
30
to J
une
15, 2
008,
Iow
a Ri
ver a
nd C
edar
Riv
er fl
ood
profi
les.
—Co
ntin
ued
[Ben
ch m
arks
and
refe
renc
e po
ints
are
list
ed in
ups
tream
ord
er. B
M, b
ench
mar
k; T
BM
, tem
pora
ry b
ench
mar
k; R
P, re
fere
nce
poin
t; G
PS, G
loba
l Pos
ition
ing
Syst
em; U
SGS,
U.S
. Geo
logi
cal S
urve
y; T
, to
wns
hip;
R, r
ange
; N, n
orth
; W, w
est;
S, so
uth;
E, e
ast]
Publ
ic L
and
Surv
ey S
ys-
tem
(tow
nshi
p, ra
nge,
se
ctio
n, q
uart
er-s
ectio
n)
Mar
k cl
assi
fi-ca
tion
Loca
tion
Mar
kEl
evat
ion
in
feet
(NG
VD
1929
)
Elev
atio
n de
term
inat
ion
met
hod
Ceda
r Riv
er—
Cont
inue
d
T82N
R05
W 3
0 N
E (1
)B
MA
bout
3.1
mile
s sou
th o
f Mt.
Vern
on o
n St
ate
Hig
hway
1 b
ridge
ove
r C
edar
Riv
er, o
n le
ft do
wns
tream
win
gwal
lIo
wa
Dep
artm
ent o
f Tr
ansp
orta
tion
benc
h m
ark
708.
22G
PS
T82N
R05
W 3
0 N
E (2
)R
PA
bout
3.1
mile
s sou
th o
f Mt.
Vern
on o
n St
ate
Hig
hway
1 b
ridge
ove
r C
edar
Riv
er, f
rom
left
dow
nstre
am e
nd o
f brid
ge, n
ear 8
th d
eck
drai
n, o
n br
idge
rail
Chi
sele
d sq
uare
70
8.29
GPS
T82N
R06
W 0
9 N
E (1
)B
MA
bout
3.5
mile
s eas
t of C
edar
Rap
ids o
n U
.S. H
ighw
ay 3
0 br
idge
ove
r C
edar
Riv
er, o
n le
ft do
wns
tream
win
gwal
l of u
pstre
am b
ridge
Iow
a D
epar
tmen
t of
Tran
spor
tatio
n be
nch
mar
k
721.
72G
PS
T82N
R06
W 0
9 N
W (2
)R
PA
bout
3.5
mile
s eas
t of C
edar
Rap
ids o
n U
.S. H
ighw
ay 3
0 br
idge
ove
r C
edar
Riv
er, f
rom
left
dow
nstre
am e
nd o
f brid
ge, n
ear 5
7th
old
rail
post
bas
e on
con
cret
e lip
Chi
sele
d sq
uare
72
1.46
GPS
T83N
R07
W 2
8 N
E (1
)B
MA
t Ced
ar R
apid
s, si
te o
f stre
amga
ge 0
5464
500
Ced
ar R
iver
at C
edar
R
apid
s, on
righ
t ban
k of
Ced
ar R
iver
Abo
ut 4
00 ft
nor
th o
f the
8th
Av
enue
SW
brid
ge o
ver C
edar
Riv
er a
nd a
bout
5 ft
shor
ewar
d of
th
e ga
ge h
ouse
, on
top
of c
oncr
ete
mon
umen
t
USG
S br
onze
ben
ch
mar
k (R
M2)
714.
17St
ream
gage
ele
vatio
n da
ta
T83N
R07
W 2
8 N
W (1
)B
MA
t Ced
ar R
apid
s, at
the
inte
rsec
tion
of 1
st st
reet
and
2nd
Ave
nue
near
th
e no
rthea
st e
nd o
f a re
tain
ing
wal
l for
the
base
men
t of t
he F
eder
al
Bui
ldin
g an
d ab
out 4
.3 ft
sout
heas
t of t
he so
uthe
ast f
ace
of th
e Fe
dera
l Bui
ldin
g
Nat
iona
l Geo
detic
Su
rvey
U.S
. Coa
st
& G
eode
tic S
urve
y be
nch
mar
k di
sk
stam
ped
“C 7
6 19
34”
726.
66El
evat
ion
obta
ined
from
Na-
tiona
l Geo
detic
Sur
vey
T83N
R07
W 2
8 N
W (2
)TB
MA
t Ced
ar R
apid
s, on
U.S
. Hig
hway
151
/1st
Ave
nue
brid
ge o
ver C
edar
R
iver
, on
left
dow
nstre
am c
oncr
ete
deck
, lan
dwar
d of
con
cret
e en
d po
st a
nd d
owns
tream
of b
ridge
rail
Chi
sele
d sq
uare
728.
78El
evat
ion
surv
eyed
from
N
atio
nal G
eode
tic S
urve
y U
.S. C
oast
& G
eode
tic
Surv
ey b
ench
mar
kT8
3N R
07W
28
NW
(3)
RP
At C
edar
Rap
ids,
on U
.S. H
ighw
ay 1
51/1
st A
venu
e br
idge
ove
r Ced
ar
Riv
er, o
n do
wns
tream
side
on
brid
ge ra
il ne
ar 2
3rd
post
from
righ
t en
d of
brid
ge
Thre
e ch
isel
mar
ks73
3.87
Surv
eyed
leve
l lin
e fr
om
TBM
T84N
R08
W 2
1 SW
(1)
BM
Abo
ut 0
.5 m
iles e
ast o
f Pal
o, si
te o
f stre
amga
ge 0
5464
420
Ced
ar
Riv
er a
t Pal
o, o
n C
ount
y R
oad
E36
brid
ge o
ver C
edar
Riv
er, o
n rig
ht d
owns
tream
win
gwal
l
Linn
Cou
nty
benc
h m
ark
disk
No.
812
(BM
1)75
3.83
Elev
atio
n ob
tain
ed fr
om L
inn
Cou
nty
Engi
neer
’s O
ffice
T84N
R08
W 2
1 SW
(2)
RP
Abo
ut 0
.5 m
iles e
ast o
f Pal
o, si
te o
f stre
amga
ge 0
5464
420
Ced
ar
Riv
er a
t Pal
o, o
n C
ount
y R
oad
E36
brid
ge o
ver C
edar
Riv
er, f
rom
rig
ht d
owns
tream
end
of b
ridge
, on
11th
stee
l pos
t
Thre
e ch
isel
ed m
arks
754.
01Su
rvey
ed le
vel l
ine
from
BM
T85N
R09
W 1
1 SW
(1)
TBM
Abo
ut 2
.4 m
iles s
outh
of U
rban
a, o
n C
ount
y R
oad
W26
/32n
d Av
enue
br
idge
ove
r Ced
ar R
iver
, on
right
dow
nstre
am w
ingw
all
Chi
sele
d cr
oss
777.
12G
PS
96 Floods of May 30 to June 15, 2008, in the Iowa River and Cedar River Basins, Eastern IowaTa
ble
9.
Benc
h m
arks
and
refe
renc
e po
ints
use
d in
the
May
30
to J
une
15, 2
008,
Iow
a Ri
ver a
nd C
edar
Riv
er fl
ood
profi
les.
—Co
ntin
ued
[Ben
ch m
arks
and
refe
renc
e po
ints
are
list
ed in
ups
tream
ord
er. B
M, b
ench
mar
k; T
BM
, tem
pora
ry b
ench
mar
k; R
P, re
fere
nce
poin
t; G
PS, G
loba
l Pos
ition
ing
Syst
em; U
SGS,
U.S
. Geo
logi
cal S
urve
y; T
, to
wns
hip;
R, r
ange
; N, n
orth
; W, w
est;
S, so
uth;
E, e
ast]
Publ
ic L
and
Surv
ey S
ys-
tem
(tow
nshi
p, ra
nge,
se
ctio
n, q
uart
er-s
ectio
n)
Mar
k cl
assi
fi-ca
tion
Loca
tion
Mar
kEl
evat
ion
in
feet
(NG
VD
1929
)
Elev
atio
n de
term
inat
ion
met
hod
Ceda
r Riv
er—
Cont
inue
d
T85N
R09
W 1
1 SW
(2)
RP
Abo
ut 2
.4 m
iles s
outh
of U
rban
a, o
n C
ount
y R
oad
W26
/32n
d Av
enue
br
idge
ove
r Ced
ar R
iver
, fro
m ri
ght d
owns
tream
end
of b
ridge
, on
19th
stee
l pos
t
Thre
e ch
isel
ed m
arks
77
8.67
GPS
T85N
R10
W 1
6 SW
(1)
BM
At V
into
n, si
te o
f stre
amga
ge 0
5464
315
Ced
ar R
iver
at V
into
n, o
n St
ate
Hig
hway
150
brid
ge o
ver C
edar
Riv
er, o
n rig
ht u
pstre
am
win
gwal
l
Iow
a D
epar
tmen
t of
Tran
spor
tatio
n be
nch
mar
k (R
M1)
791.
69G
PS
T85N
R10
W 1
6 SW
(2)
RP
At V
into
n, si
te o
f stre
amga
ge 0
5464
315
Ced
ar R
iver
at V
into
n, o
n St
ate
Hig
hway
150
brid
ge o
ver C
edar
Riv
er, f
rom
righ
t dow
nstre
am
end
of b
ridge
, nea
r 12t
h ra
il po
st o
n co
ncre
te li
p
Chi
sele
d sq
uare
791.
80G
PS
T85N
R10
W 1
6 SW
(3)
RP
At V
into
n, si
te o
f stre
amga
ge 0
5464
315
Ced
ar R
iver
at V
into
n, fr
om
right
ups
tream
end
of b
ridge
, at 3
rd d
eck
drai
n on
con
cret
e gu
ardr
ail
Chi
sele
d sq
uare
795.
09G
PS
T86N
R10
W 0
6 N
W (1
)TB
MA
bout
3 m
iles n
orth
east
of M
t. A
ubur
n, o
n C
ount
y R
oad
D65
/22n
d Av
enue
brid
ge o
ver C
edar
Riv
er, o
n le
ft do
wns
tream
abu
tmen
t co
rner
brid
ge se
at
Chi
sele
d cr
oss
801.
06G
PS
T86N
R10
W 0
6 N
W (2
)R
PA
bout
3 m
iles n
orth
east
of M
t. A
ubur
n, o
n C
ount
y R
oad
D65
/22n
d Av
enue
brid
ge o
ver C
edar
Riv
er, f
rom
left
dow
nstre
am e
nd o
f br
idge
, nea
r 62n
d st
eel p
ost
Thre
e ch
isel
ed m
arks
81
0.44
GPS
T87N
R11
W 1
9 N
E (1
)B
MA
bout
1.5
mile
s nor
thea
st o
f La
Porte
City
, on
Cou
nty
Roa
d D
48/
Bra
ndon
Roa
d br
idge
ove
r Ced
ar R
iver
, on
left
dow
nstre
am c
urb
Nat
iona
l Geo
detic
Su
rvey
U.S
. Coa
st
& G
eode
tic S
urve
y be
nch
mar
k di
sk
816.
05El
evat
ion
obta
ined
from
Na-
tiona
l Geo
detic
Sur
vey
T87N
R11
W 1
9 N
E (2
)R
PA
bout
1.5
mile
s nor
thea
st o
f La
Porte
City
, on
Cou
nty
Roa
d D
48/
Bra
ndon
Roa
d br
idge
ove
r Ced
ar R
iver
, on
guar
drai
l and
righ
t of
10th
gua
rdra
il po
st fr
om le
ft do
wns
tream
end
of b
ridge
File
d ar
row
818.
10Su
rvey
ed le
vel l
ine
from
BM
T88N
R12
W 2
3 SW
(1)
BM
At G
ilber
tvill
e, o
n C
ount
y R
oad
D38
/Eas
t Was
hbur
n R
oad
brid
ge o
ver
Ced
ar R
iver
, on
left
dow
nstre
am c
oncr
ete
win
gwal
lU
SGS
bras
s cap
stam
ped
“USG
S 88
12-2
3 SW
R
e-Se
t”
843.
94El
evat
ion
obta
ined
from
B
lack
Haw
k C
ount
y En
gi-
neer
’s O
ffice
T88N
R12
W 2
3 SW
(2)
RP
At G
ilber
tvill
e, o
n C
ount
y R
oad
D38
/Eas
t Was
hbur
n R
oad
brid
ge o
ver
Ced
ar R
iver
, fro
m le
ft do
wns
tream
end
of b
ridge
, at 2
1st c
oncr
ete
post
Chi
sele
d sq
uare
841.
27Su
rvey
ed le
vel l
ine
from
BM
T88N
R13
W 1
2 N
W (1
)B
MA
t Wat
erlo
o, o
n In
ters
tate
380
/U.S
. Hig
hway
20
brid
ge o
ver C
edar
R
iver
, on
right
dow
nstre
am w
ingw
all o
f dow
nstre
am b
ridge
mai
n ea
st b
ound
lane
s
Iow
a D
epar
tmen
t of
Tran
spor
tatio
n be
nch
mar
k
882.
09El
evat
ion
supp
lied
by Io
wa
Dep
artm
ent o
f Tra
nspo
rta-
tion
T89N
R13
W 2
5 N
W (1
)B
MA
t Wat
erlo
o, si
te o
f stre
amga
ge 0
5464
000
Ced
ar R
iver
at W
ater
loo,
on
left
bank
of C
edar
Riv
er n
ear E
ast S
even
th S
treet
brid
ge a
nd a
bout
30
ft u
pstre
am fr
om g
age
hous
e, o
n up
stre
am la
ndw
ard
corn
er o
f co
ncre
te fo
unda
tion
for p
umpi
ng
USG
S br
onze
ben
ch
mar
k (R
M 1
)84
6.96
Stre
amga
ge e
leva
tion
data
Appendix 2 97Ta
ble
9.
Benc
h m
arks
and
refe
renc
e po
ints
use
d in
the
May
30
to J
une
15, 2
008,
Iow
a Ri
ver a
nd C
edar
Riv
er fl
ood
profi
les.
—Co
ntin
ued
[Ben
ch m
arks
and
refe
renc
e po
ints
are
list
ed in
ups
tream
ord
er. B
M, b
ench
mar
k; T
BM
, tem
pora
ry b
ench
mar
k; R
P, re
fere
nce
poin
t; G
PS, G
loba
l Pos
ition
ing
Syst
em; U
SGS,
U.S
. Geo
logi
cal S
urve
y; T
, to
wns
hip;
R, r
ange
; N, n
orth
; W, w
est;
S, so
uth;
E, e
ast]
Publ
ic L
and
Surv
ey S
ys-
tem
(tow
nshi
p, ra
nge,
se
ctio
n, q
uart
er-s
ectio
n)
Mar
k cl
assi
fi-ca
tion
Loca
tion
Mar
kEl
evat
ion
in
feet
(NG
VD
1929
)
Elev
atio
n de
term
inat
ion
met
hod
Ceda
r Riv
er—
Cont
inue
d
T89N
R13
W 2
5 N
W (2
)TB
MA
t Wat
erlo
o, o
n 4t
h St
reet
brid
ge o
ver C
edar
Riv
er, o
n co
ncre
te g
uard
-ra
il at
left
upst
ream
end
of b
ridge
Chi
sele
d cr
oss
855.
30G
PS
T89N
R13
W 2
6 N
E (1
)TB
MA
t Wat
erlo
o, o
n Pa
rk A
venu
e br
idge
ove
r Ced
ar R
iver
, on
curb
at l
eft
upst
ream
end
of b
ridge
, top
of m
ost u
pstre
am a
nd la
ndw
ard
bolt
Chi
sele
d cr
oss
853.
02G
PS
T89N
R13
W 2
6 N
E (2
)R
PA
t Wat
erlo
o, o
n Pa
rk A
venu
e br
idge
ove
r Ced
ar R
iver
, on
top
of
guar
drai
l and
righ
t of 5
th g
uard
rail
post
from
left
dow
nstre
am e
nd
of b
ridge
File
d ar
row
857.
09G
PS
T89N
R13
W 2
3 SE
(1)
BM
At W
ater
loo,
on
1st A
venu
e br
idge
ove
r Ced
ar R
iver
, on
right
up-
stre
am w
ingw
all a
butm
ent
Iow
a D
epar
tmen
t of
Tran
spor
tatio
n be
nch
mar
k
856.
34El
evat
ion
surv
eyed
from
be
nch
mar
k on
Mul
len
Aven
ue b
ridge
T89N
R13
W 2
3 SE
(2)
RP
At W
ater
loo,
on
1st S
treet
brid
ge o
ver C
edar
Riv
er, o
n 15
th m
etal
gu
ardr
ail p
ost f
rom
righ
t dow
nstre
am e
nd o
f brid
geC
hise
led
cros
s86
4.34
Surv
eyed
leve
l lin
e fr
om B
M
T89N
R13
W 2
3 SE
(3)
TBM
At W
ater
loo,
on
Mul
len
Aven
ue b
ridge
ove
r Ced
ar R
iver
, on
right
do
wns
tream
win
gwal
l abu
tmen
t beh
ind
conc
rete
gua
rdra
ilC
hise
led
cros
s85
6.80
Elev
atio
n su
rvey
ed fr
om C
ity
of W
ater
loo
benc
h m
ark
T89N
R13
W 2
3 SE
(4)
RP
At W
ater
loo,
on
Mul
len
Aven
ue b
ridge
ove
r Ced
ar R
iver
, on
ledg
e be
hind
con
cret
e gu
ardr
ail a
nd b
etw
een
15th
and
16t
h ol
d gu
ardr
ail
base
s fro
m ri
ght d
owns
tream
end
of b
ridge
Two
chis
eled
mar
ks86
1.33
Surv
eyed
leve
l lin
e fr
om
TBM
T89N
R13
W 1
6 SW
(1)
BM
At W
ater
loo,
on
U.S
. Hig
hway
218
brid
ge o
ver C
edar
Riv
er, o
n to
p of
rig
ht d
owns
tream
end
of c
oncr
ete
barr
ier w
all
Iow
a D
epar
tmen
t of
Tran
spor
tatio
n be
nch
mar
k
868.
73G
PS
T89N
R13
W 1
6 SW
(2)
RP
At W
ater
loo,
on
U.S
. Hig
hway
218
brid
ge o
ver C
edar
Riv
er, o
n co
n-cr
ete
guar
drai
l and
abo
ve fi
fth d
rain
from
righ
t dow
nstre
am e
nd o
f br
idge
Two
chis
eled
mar
ks86
9.00
GPS
T89N
R13
W 1
8 N
W (1
)B
MA
t Ced
ar F
alls
, on
Stat
e H
ighw
ay 5
8 br
idge
ove
r Ced
ar R
iver
, on
left
dow
nstre
am c
oncr
ete
abut
men
t wal
lIo
wa
Dep
artm
ent o
f Tr
ansp
orta
tion
benc
h m
ark
879.
50El
evat
ion
supp
lied
by C
ity o
f C
edar
Fal
ls, L
and
Surv
ey
Offi
ceT8
9N R
13W
18
NW
(2)
BM
At C
edar
Fal
ls, o
n St
ate
Hig
hway
58
brid
ge o
ver C
edar
Riv
er, o
n le
ft up
stre
am c
oncr
ete
abut
men
tC
hise
led
cros
s87
3.44
Elev
atio
n su
pplie
d by
City
of
Ced
ar F
alls
, Lan
d Su
rvey
O
ffice
T89N
R13
W 1
8 N
W (3
)R
PA
t Ced
ar F
alls
, on
Stat
e H
ighw
ay 5
8 br
idge
ove
r Ced
ar R
iver
, on
top
of c
oncr
ete
guar
drai
l and
at c
ente
r of b
ridge
at 4
1st d
rain
from
righ
t do
wns
tream
end
of b
ridge
Two
chis
eled
mar
ks88
7.48
Surv
eyed
leve
l lin
e fr
om B
M
T89N
R14
W 1
2 N
E (1
)B
MA
t Ced
ar F
alls
, site
of s
tage
onl
y st
ream
gage
054
6305
0 C
edar
Riv
er a
t C
edar
Fal
ls o
n St
ate
Hig
hway
57
brid
ge o
ver C
edar
Riv
er, o
n rig
ht
dow
nstre
am si
de o
f brid
ge, o
n th
e co
ncre
te b
ase
of th
e ga
ge sh
elte
r
Chi
sele
d sq
uare
(RM
1)86
8.09
Stre
amga
ge e
leva
tion
data
98 Floods of May 30 to June 15, 2008, in the Iowa River and Cedar River Basins, Eastern IowaTa
ble
9.
Benc
h m
arks
and
refe
renc
e po
ints
use
d in
the
May
30
to J
une
15, 2
008,
Iow
a Ri
ver a
nd C
edar
Riv
er fl
ood
profi
les.
—Co
ntin
ued
[Ben
ch m
arks
and
refe
renc
e po
ints
are
list
ed in
ups
tream
ord
er. B
M, b
ench
mar
k; T
BM
, tem
pora
ry b
ench
mar
k; R
P, re
fere
nce
poin
t; G
PS, G
loba
l Pos
ition
ing
Syst
em; U
SGS,
U.S
. Geo
logi
cal S
urve
y; T
, to
wns
hip;
R, r
ange
; N, n
orth
; W, w
est;
S, so
uth;
E, e
ast]
Publ
ic L
and
Surv
ey S
ys-
tem
(tow
nshi
p, ra
nge,
se
ctio
n, q
uart
er-s
ectio
n)
Mar
k cl
assi
fi-ca
tion
Loca
tion
Mar
kEl
evat
ion
in
feet
(NG
VD
1929
)
Elev
atio
n de
term
inat
ion
met
hod
Ceda
r Riv
er—
Cont
inue
d
T89N
R14
W 1
2 N
E (2
)R
PA
t Ced
ar F
alls
, on
Stat
e H
ighw
ay 5
7 br
idge
ove
r Ced
ar R
iver
, on
con-
cret
e gu
ardr
ail a
t 10t
h dr
ain
from
righ
t dow
nstre
am e
nd o
f brid
geC
hise
led
arro
w87
2.95
Surv
eyed
from
stre
amga
ge
benc
h m
ark
T89N
R14
W 1
2 N
W (1
)B
MA
t Ced
ar F
alls
, on
Cen
ter S
treet
brid
ge o
ver C
edar
Riv
er, o
n rig
ht
dow
nstre
am e
nd o
f sid
ewal
k co
ncre
te b
arrie
r wal
lIo
wa
Dep
artm
ent o
f Tr
ansp
orta
tion
benc
h m
ark
873.
69El
evat
ion
supp
lied
by C
ity o
f C
edar
Fal
ls, L
and
Surv
ey
Offi
ceT8
9N R
14W
12
NW
(2)
BM
At C
edar
Fal
ls, o
n C
ente
r Stre
et b
ridge
ove
r Ced
ar R
iver
, on
left
dow
nstre
am e
nd o
f sid
ewal
k co
ncre
te b
arrie
r wal
lIo
wa
Dep
artm
ent o
f Tr
ansp
orta
tion
benc
h m
ark
874.
47El
evat
ion
supp
lied
by C
ity o
f C
edar
Fal
ls, L
and
Surv
ey
Offi
ceT8
9N R
14W
12
NW
(3)
RP
At C
edar
Fal
ls, o
n C
ente
r Stre
et b
ridge
ove
r Ced
ar R
iver
, on
conc
rete
gu
ardr
ail a
nd b
elow
43r
d m
etal
pos
t fro
m le
ft do
wns
tream
end
of
brid
ge
Two
chis
eled
mar
ks87
6.93
Surv
eyed
leve
l lin
e fr
om B
M
T91N
R14
W 3
5 SW
(1)
BM
At J
anes
ville
, site
of s
tream
gage
054
5850
0 C
edar
Riv
er a
t Jan
esvi
lle,
on le
ft ba
nk o
f Ced
ar R
iver
and
300
ft d
owns
tream
from
Cou
nty
Roa
d C
50 2
75th
Stre
et, s
et in
con
cret
e ju
st a
bove
gro
und
surf
ace
and
3 ft
north
east
of g
age
hous
e
USG
S be
nch
mar
k (R
M
16)
877.
95St
ream
gage
ele
vatio
n da
ta
T91N
R14
W 3
5 N
W (1
)B
MA
bout
0.5
0 m
iles n
orth
of J
anes
ville
, on
north
boun
d la
ne o
f U.S
. H
ighw
ay 2
18 b
ridge
ove
r Ced
ar R
iver
ups
tream
brid
ge, o
n rig
ht
dow
nstre
am e
nd o
f con
cret
e ba
rrie
r wal
l
Iow
a D
epar
tmen
t of
Tran
spor
tatio
n be
nch
mar
k
904.
70El
evat
ion
supp
lied
by Io
wa
Dep
artm
ent o
f Tra
nspo
rta-
tion
T91N
R14
W 3
5 N
W (2
)B
MA
bout
0.5
0 m
iles n
orth
of J
anes
ville
, on
sout
hbou
nd la
ne o
f U.S
. H
ighw
ay 2
18 b
ridge
ove
r Ced
ar R
iver
dow
nstre
am b
ridge
, on
left
upst
ream
end
of c
oncr
ete
barr
ier w
all
Iow
a D
epar
tmen
t of
Tran
spor
tatio
n be
nch
mar
k
911.
14El
evat
ion
supp
lied
by Io
wa
Dep
artm
ent o
f Tra
nspo
rta-
tion
T91N
R14
W 3
5 N
W (3
)R
PA
bout
0.5
0 m
iles n
orth
of J
anes
ville
, on
sout
hbou
nd la
ne o
f U.S
. H
ighw
ay 2
18 b
ridge
ove
r Ced
ar R
iver
dow
nstre
am b
ridge
, on
top
of c
oncr
ete
guar
drai
l and
abo
ut 8
5 ft
from
righ
t dow
nstre
am e
nd o
f br
idge
Two
chis
eled
mar
ks90
7.31
Surv
eyed
leve
l lin
e fr
om B
M
T91N
R14
W 0
2 N
W (1
)TB
MA
t Wav
erly
, on
Stat
e H
ighw
ay 3
brid
ge o
ver C
edar
Riv
er, o
n rig
ht
dow
nstre
am h
andr
ail a
nd n
orth
of l
amp
post
Chi
sele
d sq
uare
920.
27G
PS
T91N
R14
W 0
2 N
W (2
)TB
MA
t Wav
erly
, on
Stat
e H
ighw
ay 3
brid
ge o
ver C
edar
Riv
er, a
bout
30
ft up
stre
am fr
om ri
ght u
pstre
am e
nd o
f brid
ge, o
n to
p of
stre
amw
ard
corn
er o
f con
cret
e re
tain
ing
wal
l
Chi
sele
d sq
uare
914.
69G
PS
T91N
R14
W 0
2 N
W (3
)R
PA
t Wav
erly
, on
Stat
e H
ighw
ay 3
brid
ge o
ver C
edar
Riv
er, f
rom
left
dow
nstre
am e
nd o
f brid
ge, o
n ha
ndra
il to
the
left
of 1
5th
post
File
d ar
row
921.
19Su
rvey
ed le
vel l
ine
from
TB
MT9
2N R
14W
35
NW
(1)
BM
At W
aver
ly, s
ite o
f stre
amga
ge 0
5458
300
Ced
ar R
iver
at W
aver
ly, o
n C
ount
y R
oad
V14
brid
ge o
ver C
edar
Riv
er, o
n rig
ht d
owns
tream
co
ncre
te g
uard
rail
base
Top
of 3
/8 in
anc
hor b
olt
(RM
1)
921.
21St
ream
gage
ele
vatio
n da
ta
Appendix 2 99Ta
ble
9.
Benc
h m
arks
and
refe
renc
e po
ints
use
d in
the
May
30
to J
une
15, 2
008,
Iow
a Ri
ver a
nd C
edar
Riv
er fl
ood
profi
les.
—Co
ntin
ued
[Ben
ch m
arks
and
refe
renc
e po
ints
are
list
ed in
ups
tream
ord
er. B
M, b
ench
mar
k; T
BM
, tem
pora
ry b
ench
mar
k; R
P, re
fere
nce
poin
t; G
PS, G
loba
l Pos
ition
ing
Syst
em; U
SGS,
U.S
. Geo
logi
cal S
urve
y; T
, to
wns
hip;
R, r
ange
; N, n
orth
; W, w
est;
S, so
uth;
E, e
ast]
Publ
ic L
and
Surv
ey S
ys-
tem
(tow
nshi
p, ra
nge,
se
ctio
n, q
uart
er-s
ectio
n)
Mar
k cl
assi
fi-ca
tion
Loca
tion
Mar
kEl
evat
ion
in
feet
(NG
VD
1929
)
Elev
atio
n de
term
inat
ion
met
hod
Ceda
r Riv
er—
Cont
inue
d
T92N
R14
W 2
1 N
W (1
)B
MA
bout
3.5
mile
s nor
th o
f Wav
erly
, on
Cou
nty
Roa
d C
33 b
ridge
ove
r C
edar
Riv
er, o
n rig
ht d
owns
tream
cur
b ne
ar w
ingw
all
Chi
sele
d sq
uare
enc
los-
ing
Iow
a D
epar
tmen
t of
Tra
nspo
rtatio
n be
nch
mar
k
931.
77El
evat
ion
obta
ined
from
B
rem
er C
ount
y Fl
ood
Insu
ranc
e St
udy
Fede
ral
Emer
genc
y M
anag
emen
t A
genc
y, 1
990
T92N
R14
W 2
1 N
W (2
)R
PA
bout
3.5
mile
s nor
th o
f Wav
erly
, on
Cou
nty
Roa
d C
33 b
ridge
ove
r C
edar
Riv
er, o
n to
p of
gua
rdra
il po
st a
t sec
ond
drai
n fr
om ri
ght
dow
nstre
am e
nd o
f brid
ge
Thre
e fil
ed m
arks
934.
50Su
rvey
ed le
vel l
ine
from
BM
T93N
R14
W 2
9 N
E (1
)B
MA
bout
0.5
mile
s eas
t of P
lain
field
, on
Stat
e H
ighw
ay 1
88 b
ridge
ove
r C
edar
Riv
er, o
n le
ft up
stre
am w
ingw
all
Iow
a D
epar
tmen
t of
Tran
spor
tatio
n be
nch
mar
k
946.
59El
evat
ion
supp
lied
by Io
wa
Dep
artm
ent o
f Tra
nspo
rta-
tion
T93N
R14
W 2
9 N
E (2
)B
MA
bout
0.5
mile
s eas
t of P
lain
field
, on
Stat
e H
ighw
ay 1
88 b
ridge
ove
r C
edar
Riv
er, o
n rig
ht u
pstre
am w
ingw
all
Iow
a D
epar
tmen
t of
Tran
spor
tatio
n be
nch
mar
k
947.
22El
evat
ion
supp
lied
by Io
wa
Dep
artm
ent o
f Tra
nspo
rta-
tion
T93N
R14
W 2
9 N
E (3
)R
PA
bout
0.5
mile
s eas
t of P
lain
field
, on
Stat
e H
ighw
ay 1
88 b
ridge
ove
r C
edar
Riv
er, o
n co
ncre
te c
urb
at th
ird d
rain
from
righ
t dow
nstre
am
end
of b
ridge
Two
Chi
sele
d m
arks
945.
63Su
rvey
ed le
vel l
ine
from
BM
T94N
R14
W 1
8 SE
(1)
BM
At N
ashu
a, o
n St
ate
Hig
hway
346
brid
ge o
ver C
edar
Riv
er, o
n rig
ht
upst
ream
win
gwal
lIo
wa
Dep
artm
ent o
f Tr
ansp
orta
tion
benc
h m
ark
973.
28El
evat
ion
supp
lied
by Io
wa
Dep
artm
ent o
f Tra
nspo
rta-
tion
T94N
R14
W 1
8 SE
(2)
RP
At N
ashu
a, o
n St
ate
Hig
hway
346
brid
ge o
ver C
edar
Riv
er, o
n to
p of
co
ncre
te g
uard
rail
at th
ird d
rain
from
righ
t ups
tream
end
of b
ridge
Two
chis
eled
mar
ks97
5.48
Surv
eyed
leve
l lin
e fr
on B
M
T95N
R16
W 1
2 N
E (1
)B
MA
t Cha
rles C
ity, s
ite o
f stre
amga
ge 0
5457
700
Ced
ar R
iver
at C
harle
s C
ity, o
n rig
ht b
ank
of C
edar
Riv
er a
nd 8
00 ft
dow
nstre
am fr
om U
.S.
Hig
hway
18
brid
ge, 2
5 ft
land
war
d of
gag
e ho
use,
and
on
land
war
d do
wns
tream
cor
ner o
f con
cret
e pe
dest
al to
wal
kway
USG
S br
onze
ben
ch
mar
k (R
M5)
993.
28St
ream
gage
ele
vatio
n da
ta
T95N
R16
W 1
2 N
E (2
)TB
MA
t Cha
rles C
ity, n
ear M
ain
Stre
et b
ridge
ove
r Ced
ar R
iver
, on
top
of
bolt
head
on
stre
amw
ard
and
upst
ream
side
of fi
re h
ydra
nt lo
cate
d on
sout
heas
t cor
ner o
f Mai
n an
d C
ourt
Stre
ets
Chi
sele
d cr
oss
1003
.52
GPS
T95N
R16
W 1
2 N
E (3
)R
PA
t Cha
rles C
ity, o
n M
ain
Stre
et b
ridge
ove
r Ced
ar R
iver
, on
conc
rete
si
dew
alk
and
belo
w se
vent
h ha
ndra
il po
st fr
om ri
ght d
owns
tream
en
d of
brid
ge
Two
chis
eled
mar
ks
1002
.32
GPS
Publishing support provided by:Rolla Publishing Service Center
For more information concerning this publication, contact:Director, USGS Iowa Water Science CenterP.O. Box 1230Iowa City, IA 52244(319) 337–4191
Or visit the Iowa Water Science Center website at:http://ia.water.usgs.gov
Linhart and Eash—Floods of M
ay 30 to June 15, 2008, in the Iowa River and Cedar River B