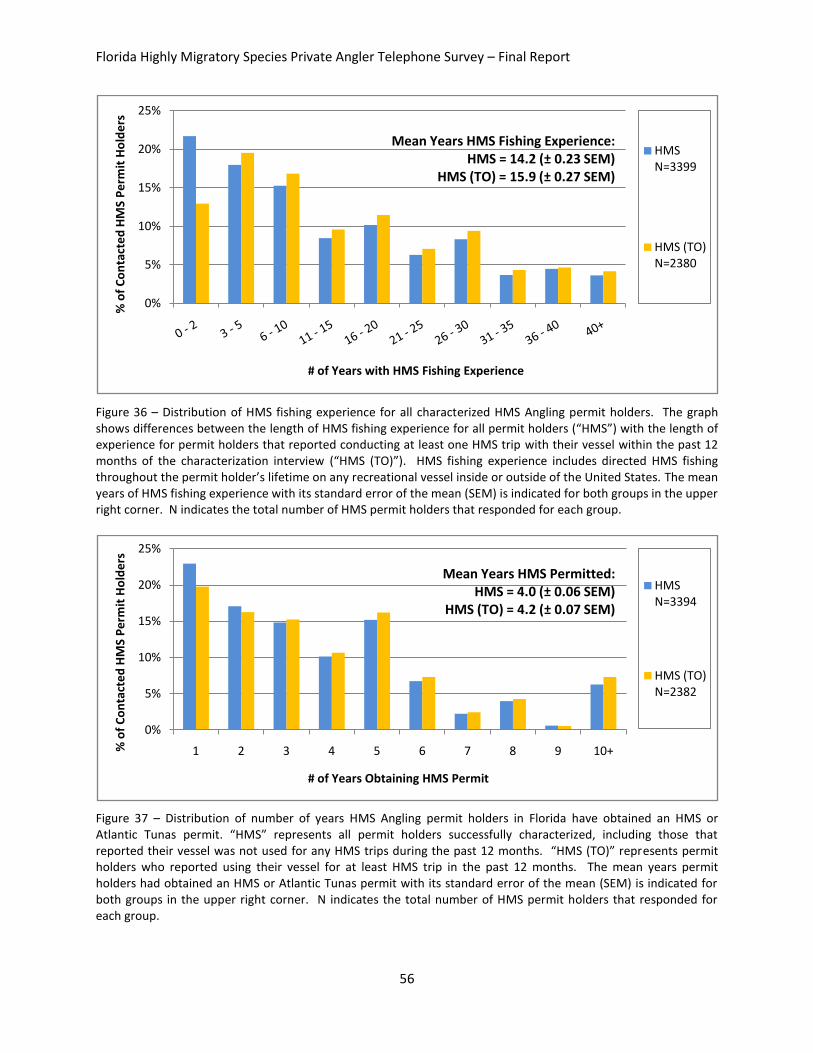
Florida Highly Migratory Species Private Angler Telephone Survey Final Report Prepared by: MRIP Highly Migratory Species Work Group & Florida Fish & Wildlife Conservation Commission Fish & Wildlife Research Institute April 2010
Transcript
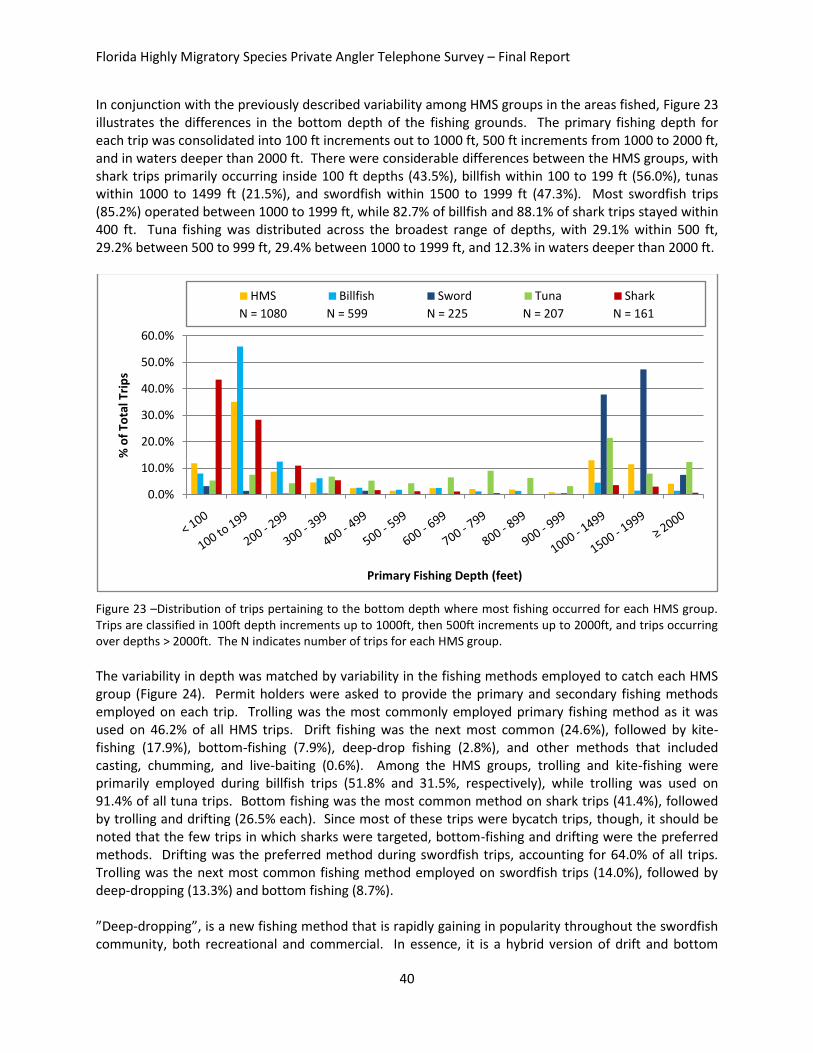
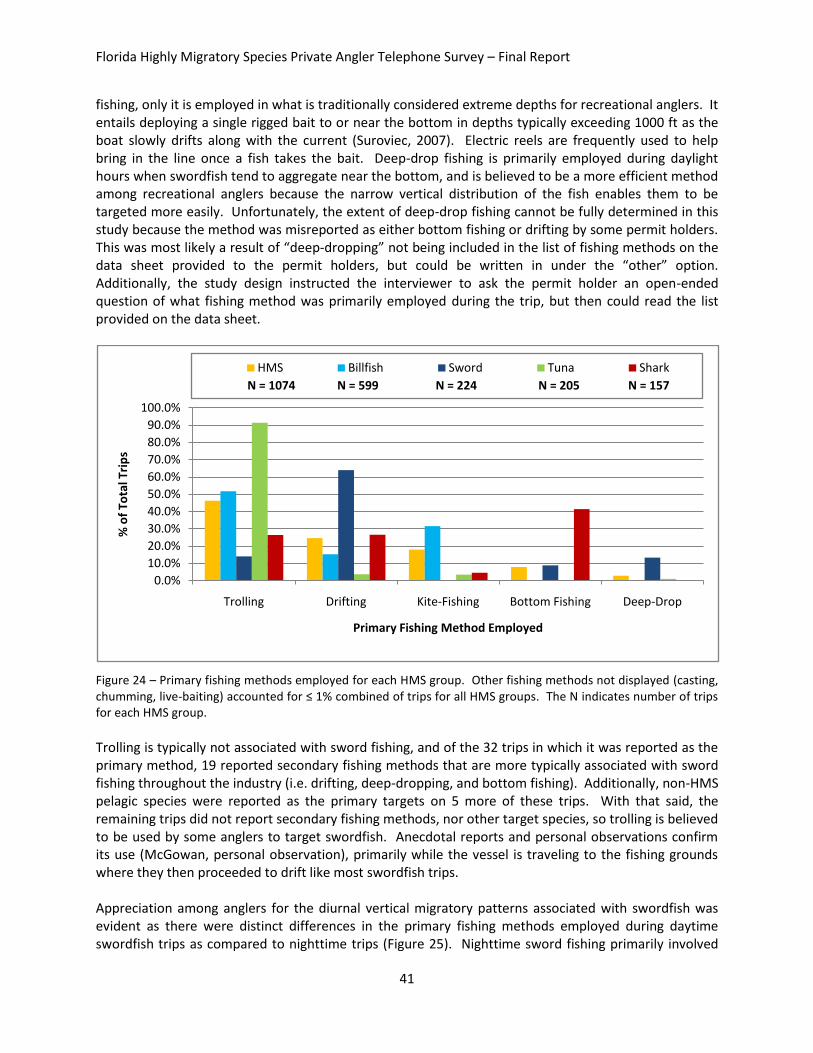
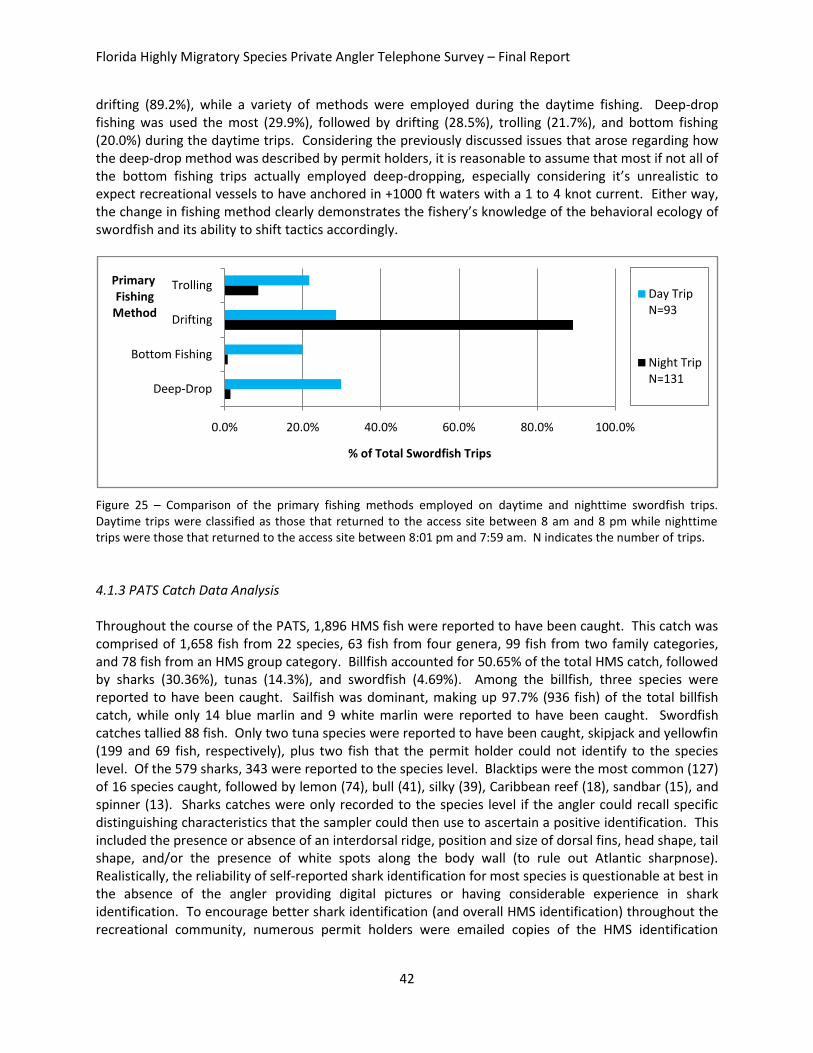
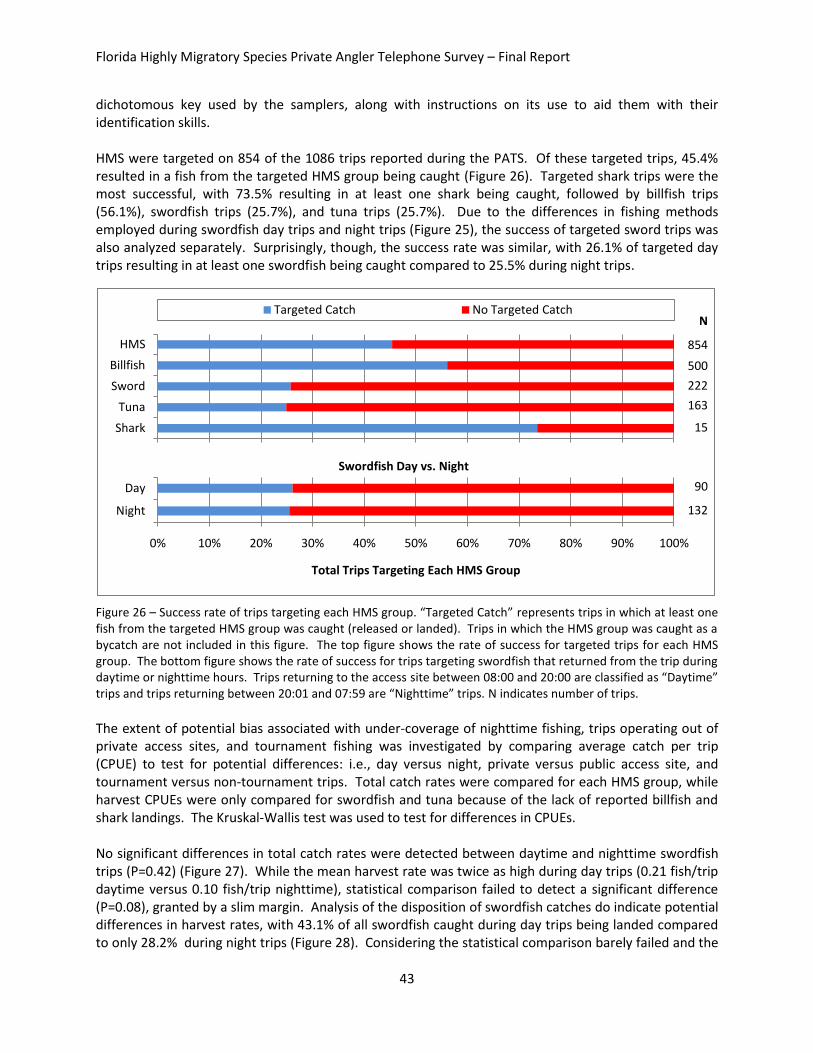
Florida Highly Migratory Species Private Angler Telephone Survey – Final Report
1
Florida Highly Migratory Species Private Angler Telephone Survey
Final Report
Prepared by:
MRIP Highly Migratory Species Work Group
&
Florida Fish & Wildlife Conservation Commission
Fish & Wildlife Research Institute
April 2010
Florida Highly Migratory Species Private Angler Telephone Survey – Final Report
2
This study was designed by the Marine Recreational Information Program’s (MRIP) HMS Work Group and conducted by the Fish & Wildlife Research Institute of the Florida Fish & Wildlife Conservation Commission (FWC). Logistical support for the project was provided by the Gulf States Marine Fisheries Commission (GSMFC) and NOAA Fisheries Office of Science & Technology staff, while NOAA Fisheries assumed responsibility for project oversight. Acknowledgements: The project team would like to thank the FWC samplers that conducted the study: A. Adamson, R. Eguino, S. Faulkner, S. McCutcheon, K. Reger, S. Sharpe, and R. Wilborn. Special thanks to FWC staff S. DeMay for developing data entry programs, E. Sanders for HMS identification training, R. Beaver for providing supervision and logistical support for Florida Keys staff, and L. Erwin and the rest of the St. Petersburg FDM Office for mailing pre-contact letters. The project team would especially like to thank all of the permit holders who participated in this study for offering their time and information. The project team would also like to thank members of the MRIP HMS Work Group (listed below) for providing project guidance and reviewing this report. MRIP HMS Work Group Members: Ronald Salz (Chair, NOAA Fisheries, Fisheries Statistics Division), Guillermo Diaz (NOAA Fisheries, Science & Technology), Josh Demello (Western Pacific Fishery Management Council), Mark Terceiro (NOAA Fisheries, NEFSC), Stephen Stohs (NOAA Fisheries, SWFSC), Joe Desfosse (NOAA Fisheries, Highly Migratory Species Division), Craig Brown (NOAA Fisheries, SEFSC), Ron Coddington (HMS Advisory Panel; Southeast Swordfish Club), Dave McGowan (Florida Fish and Wildlife Conservation Commission), Greg Skomal (Massachusetts Division of Marine Fisheries), Grisel Rodriguez (Puerto Rico Department of Natural and Environmental Resources), Hiram Quinones (Puerto Rico Sport Fishing Association), and Corey Niles (Washington Division of Fish and Wildlife).
Project Team Organization
David W. McGowan (project lead/co-author)
Florida Fish & Wildlife Conservation Commission, Fish & Wildlife Research Institute
Ronald Salz (co-author) NOAA Fisheries, Fisheries Statistics Division
Richard Cody (co-author) Florida Fish & Wildlife Conservation Commission, Fish & Wildlife Research Institute
Randy Blankinship NOAA Fisheries, Highly Migratory Species Management Division
Gregory S. Bray Gulf States Marine Fisheries Commission
Ronald Coddington HMS Advisory Panel, Southeast Swordfish Club
David M. Donaldson Gulf States Marine Fisheries Commission
Russell Dunn NOAA Fisheries, Highly Migratory Species Management Division
John Foster NOAA Fisheries, Fisheries Statistics Division
Beverly Sauls Florida Fish & Wildlife Conservation Commission, Fish & Wildlife Research Institute
Florida Highly Migratory Species Private Angler Telephone Survey – Final Report
3
Table of Contents 1. Executive Summary ............................................................................................................................... 5
3.4 Data Quality Control ....................................................................................................................... 17
3.5 Data Analysis .................................................................................................................................. 18
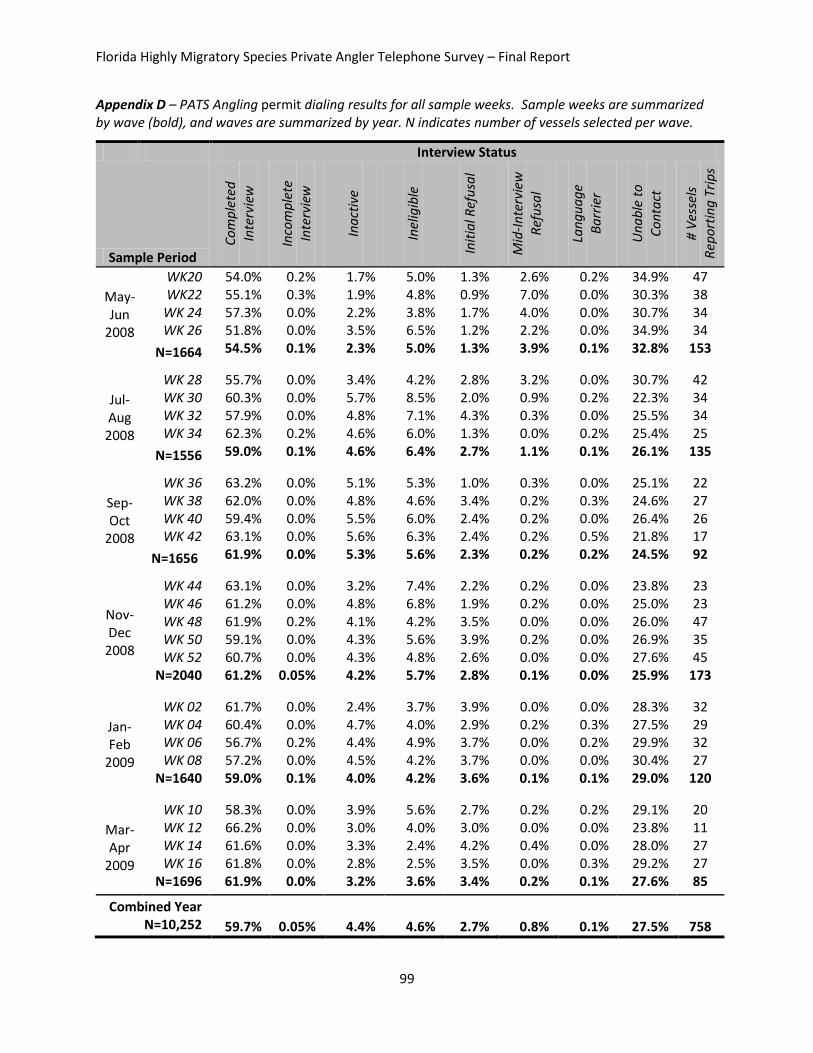
Appendix D: PATS Angling permit dialing results for all sample weeks .............................................. 99
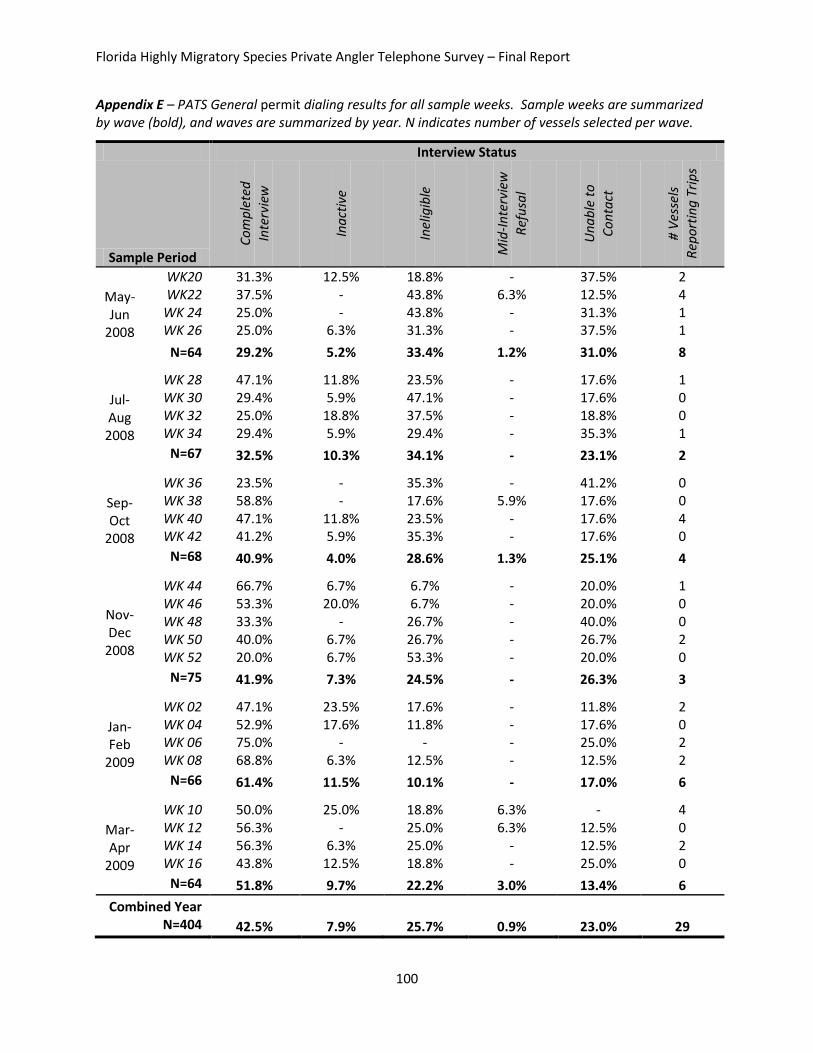
Appendix E: PATS General permit dialing results for all sample weeks ............................................ 100
Appendix F: List of all tournaments by Florida subregion ................................................................. 101
Florida Highly Migratory Species Private Angler Telephone Survey – Final Report
5
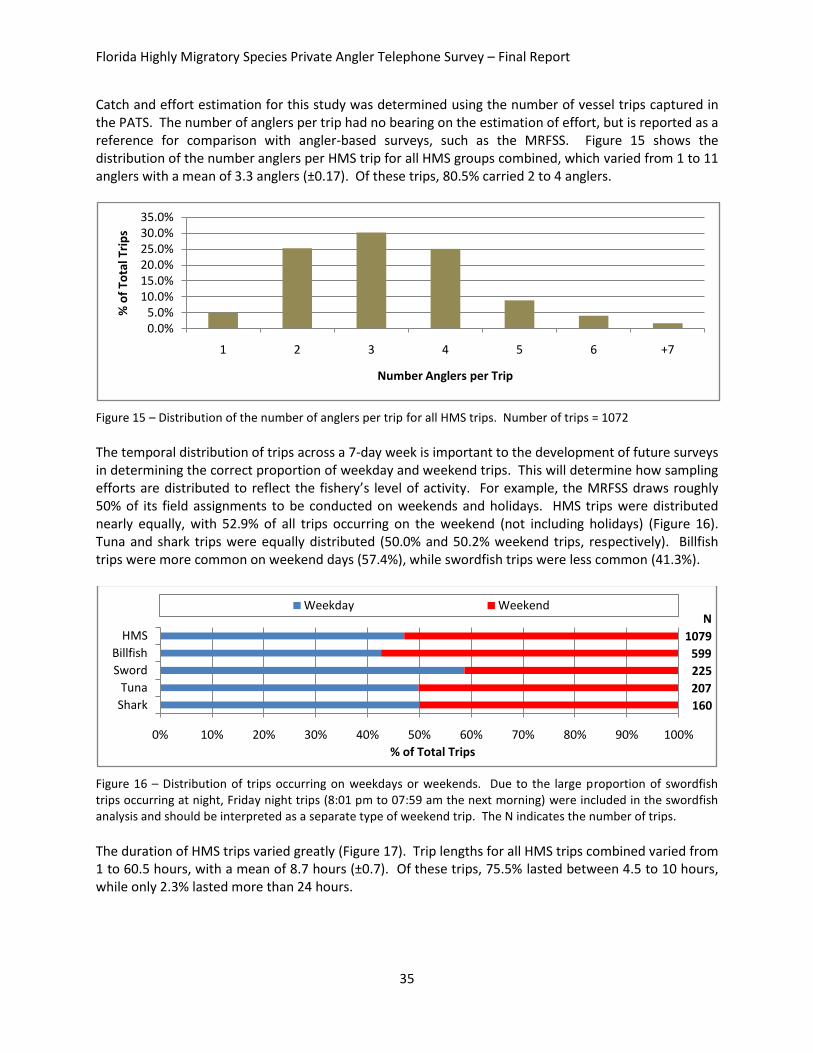
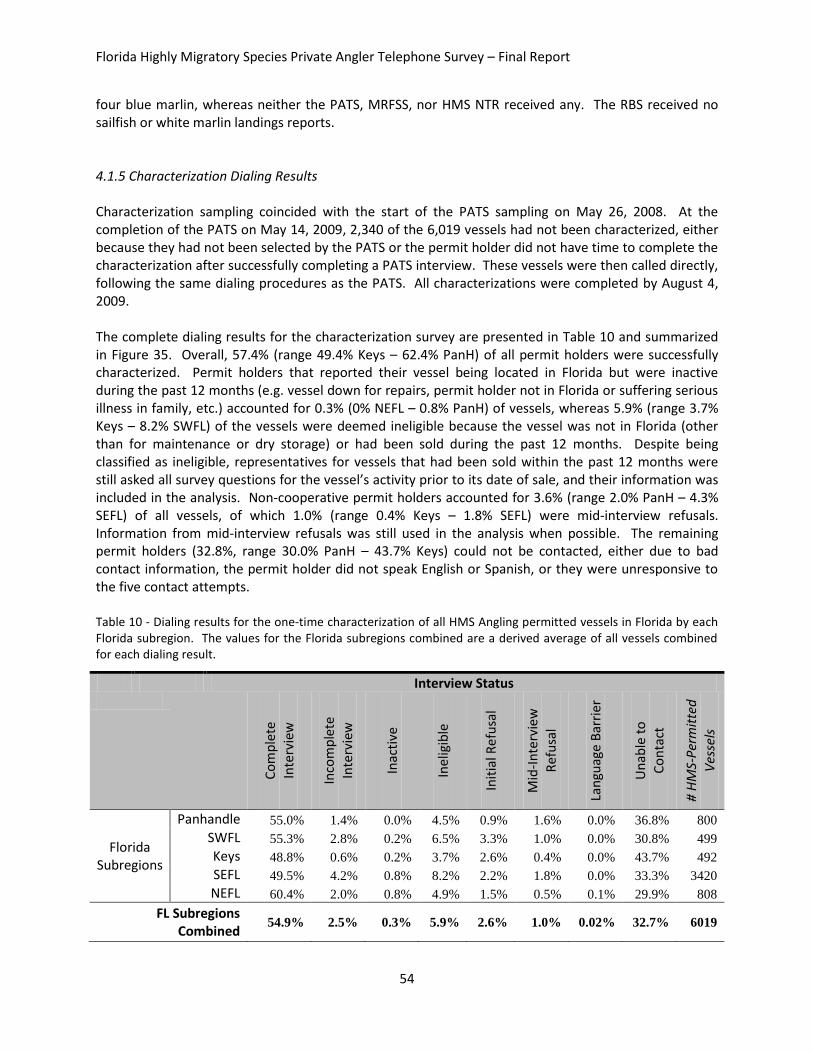
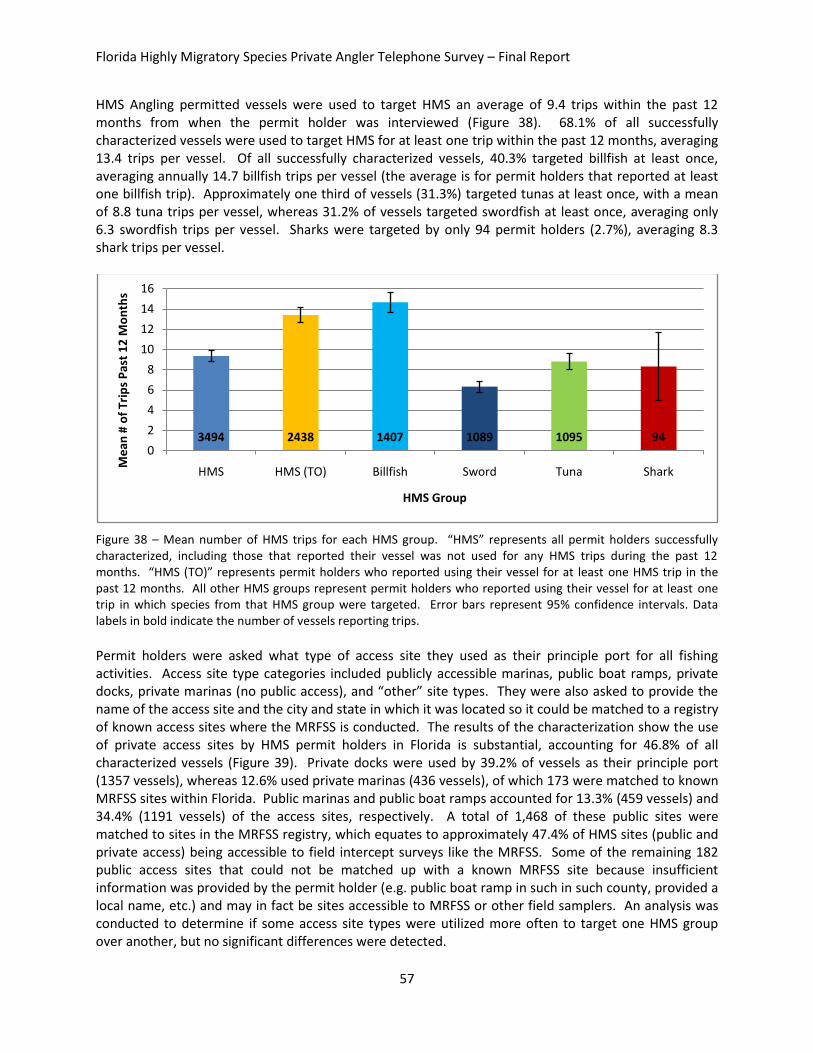
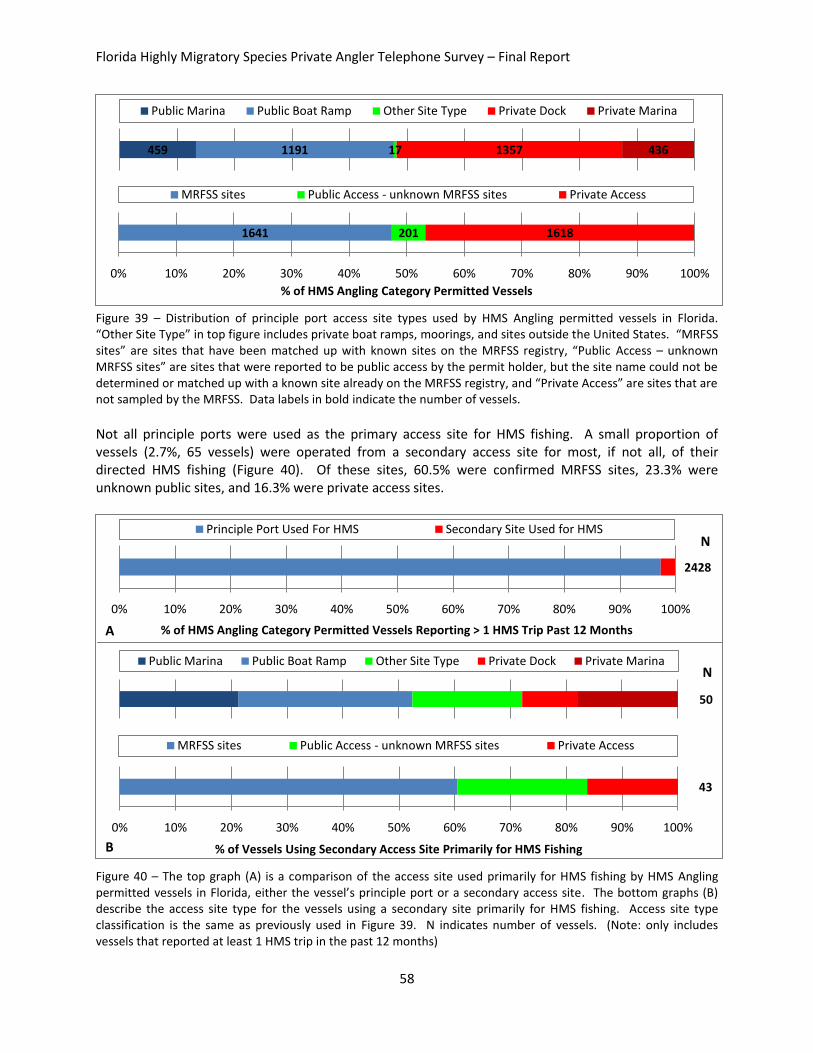
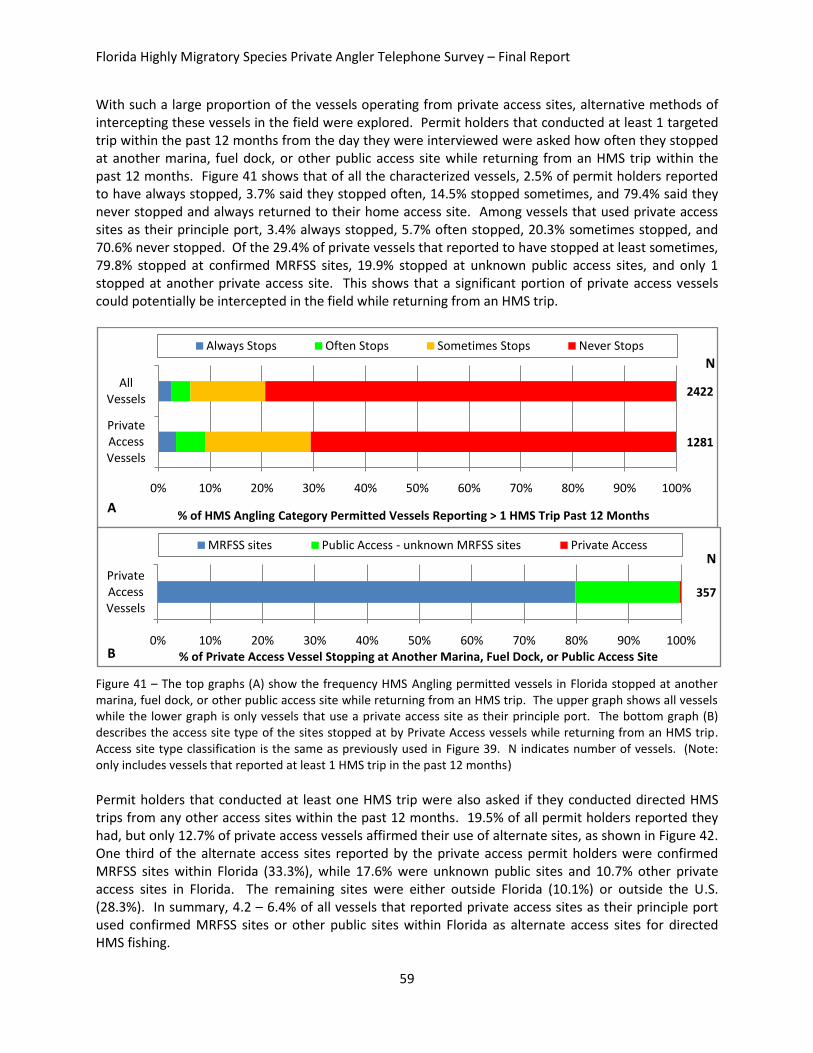
1. Executive Summary Florida’s recreational fisheries have targeted Highly Migratory Species (HMS), including billfish, swordfish, tunas, and sharks, since the early 20th century. Widely distributed across the state from shallow nearshore waters out to cold, bottom depths exceeding 2000 ft in the Straits of Florida, these fisheries draw anglers from across the world and are relied upon on as a significant source of income for thousands of Floridians. The primary method for monitoring these fisheries since 1980 has been through the Marine Recreational Fishing Statistics Survey (MRFSS). Conducted by the state’s Fish & Wildlife Research Institute for the past decade, the MRFSS has averaged over 40,000 field intercepts annually. HMS-targeted trips comprise a small portion of all recreational fishing trips combined, though, which makes them a “rare event” in any survey that is not directly targeting this specific segment of the recreational fishery. As a result, catch estimates for nearly all HMS species are highly imprecise due to typically low MRFSS intercept sample sizes. A more directed sampling approach is required to adequately monitor HMS fisheries. Under the Marine Recreational Information Program (MRIP), this study was initiated to estimate the relative scope and magnitude of HMS recreational fishing by private anglers in Florida. The survey estimated fishing effort and total catches for private angler recreational HMS trips in Florida. It also characterized the extent of nighttime fishing activity, the use of private access sites, and tournament participation among private HMS anglers. Additional information was collected to identify access sites and characterize the spatial and temporal patterns of HMS fisheries. This study was conducted to guide the development and implementation of future data collection programs to more effectively monitor HMS recreational fisheries throughout the South Atlantic and Gulf of Mexico. The HMS Angling permit and Atlantic Tunas General permit lists (6,019 and 244 vessels, respectively) were utilized as separate sample frames to collect recreational trip data via a telephone survey over a 12-month period. Despite being a commercial permit for Atlantic tunas only, General-permitted vessels were included in this study because the permit does allow these vessels to participate in recreational HMS tournaments for billfish, sharks, and swordfish. The Large Pelagic Survey (LPS), conducted from Maine through Virginia, currently includes General-permitted vessels due to many permit holders retaining their catches for personal consumption rather than to be sold. Since the extent of recreational fishing among General-permitted vessels in Florida was unknown, their inclusion in this study was deemed appropriate. Vessels possessing the HMS Charter/Headboat permit were excluded from this study because they were the focus of a separate MRIP pilot study conducted simultaneously in Florida. The survey was comprised of two components: a biweekly survey of a randomly selected subset of each sample frame, and a one-time characterization census of all eligible permit holders. Florida was divided into five geographic subregions, based on the stratification used for the For-Hire Telephone Survey. The biweekly survey proportionally selected 10% (later decreased to 8% for the Angling permit frame) of the permitted vessels from each subregion to collect trip level data during a two-week sample period for any trip in which HMS were targeted or caught. Permit holders were immediately contacted by telephone samplers at the conclusion of the sample period. Sample periods ran concurrently with each other and were pooled into two-month waves. The characterization survey was conducted opportunistically while permit holders were contacted for the biweekly survey. Permit holders that were not selected for the biweekly survey, or did not have time to complete it during an initial contact, were later contacted after the conclusion of the 12-month survey.
Florida Highly Migratory Species Private Angler Telephone Survey – Final Report
6
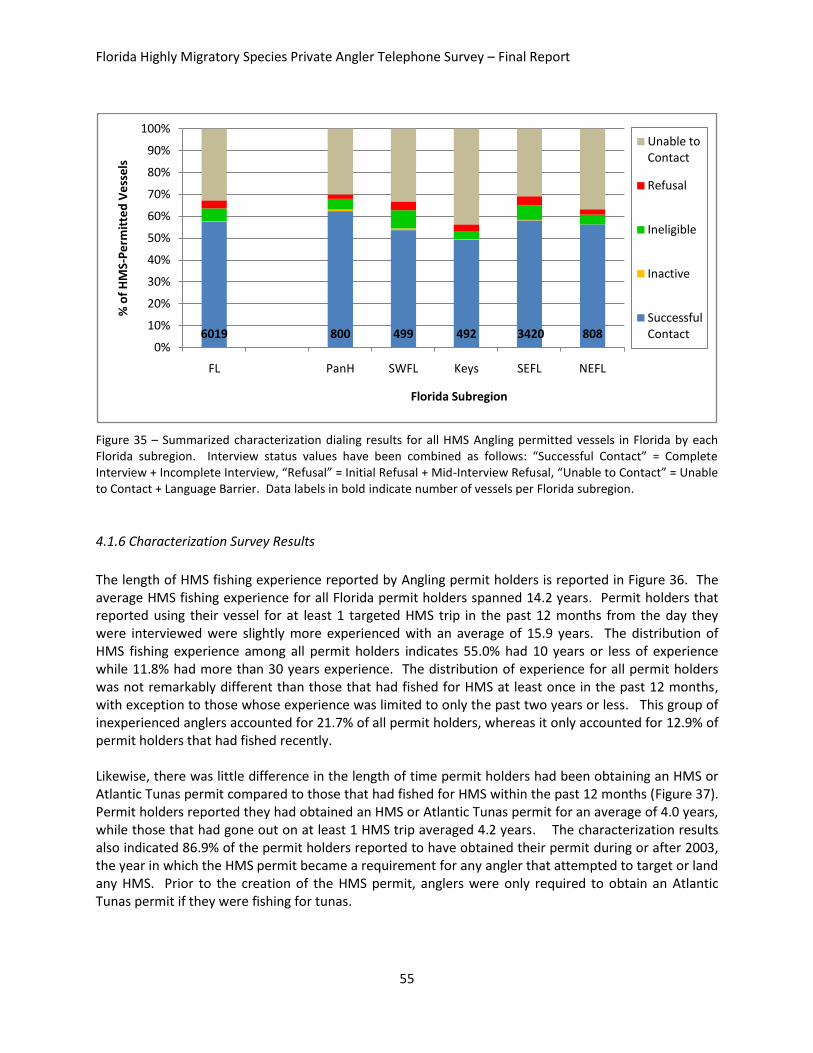
The biweekly survey was initiated in May 2008 and completed in April 2009. The one-time characterization survey was also initiated in May 2008 and completed in early August 2009. Over the course of the 12-month biweekly survey, 10,252 vessel samples were drawn from the Angling frame and 404 vessel samples were drawn from the General frame. Overall, 68.8% of selected Angling permit holders were contacted and cooperative, 27.6% were unable to be contacted, and only 3.6% were non-cooperative. If ineligible and inactive vessels were excluded from those that were contacted, 59.8% of all selected permit holders were successfully interviewed. Contact rates for the General frame were equally successful, as 76.1% of all selected permit holders were contacted and cooperative. Only 42.5% of all General permit holders were successfully interviewed, though, due to a large proportion of them being ineligible for the survey (25.7%), primarily because they were commercial fishermen that did not target HMS. Most of these permit holders obtained the permit in the rare event they caught a yellowfin tuna (YFT) incidentally while commercially fishing for non-HMS species. Due to the small frame size and ineligibility of one-fourth of the General permit holders, the survey collected a limited amount of data from this frame to produce catch and effort estimates. Survey results for the Angling permit frame were sufficiently robust to produce catch and effort estimates as 1,086 HMS trips were reported over the course of the study. HMS trips were disproportionately concentrated in southeast Florida (SEFL), accounting for 67.9% of the estimated 19,047 total HMS trips (proportional standard error (PSE) 4.1%); despite only accounting for 56.8% of the 6,019 permitted vessels that comprised the Angling frame. The Florida Keys accounted for the second most trips (18.2%), followed by the Florida Panhandle (6.4%), northeast Florida (5.9%), and southwest Florida (1.6%). Like SEFL, the 18.2% of total fishing activity reported in the Keys was significantly higher compared to its proportion of the sample frame (8.2%); whereas the other three subregions reported lower proportions of fishing activity relative to their share of the frame. HMS trips were classified into four HMS groups for the trip-level analysis: billfish, swordfish, tunas, and sharks. The survey results showed catches for all HMS groups occurred throughout the year, with seasonal shifts among the preferred target species. Given consideration that this was only a 12-month study, the pattern of higher directed fishing activity for each HMS group in Florida appears to be sailfish during the late fall and winter, marlin, tuna and shark during the spring and summer, and swordfish during the summer and fall. The Characterization survey successfully interviewed 57.4% of the Angling permit holders. While over 77% of the General permit holders were contacted and cooperative, only 42.6% were successfully interviewed (32.0% ineligible, 2.9% inactive). Angling permit holders reported having conducted an average of 9.4 directed HMS trips within the past 12 months of the interview being completed, while General permit holders similarly averaged 9.2 HMS trips. If only the 68.1% of Angling and 70.4% of General permit holders that reported conducting at least one HMS trip in the past 12 months were considered, the average increased to 13.4 and 13.1 trips per year, respectively. Billfish were targeted an average of 14.7 and 12.6 trips per year by the 40.3% of Angling and 37.0% of General permit holders, respectively, that reported taking at least 1 directed billfish trip in the past 12 months. Likewise, 31.2% of Angling and 20.4% of General permit holders targeting swordfish on at least one trip averaged 6.3 and 4.5 swordfish trips per year, while those targeting tuna at least once (31.3% Angling and 41.6% General) averaged 8.8 tuna trips per year (same for both permit frames). Sharks were targeted by only 2.7% of Angling and 4.6% of General permit holders, averaging 8.3 and 9.4 shark trips per year, respectively. Despite the similar trip frequencies for each HMS group among both permit frames, the large proportion of commercial permit holders within the General frame suggests this permit list should be monitored separately from recreational HMS permitted vessels. Likewise, the significant number of General-
Florida Highly Migratory Species Private Angler Telephone Survey – Final Report
7
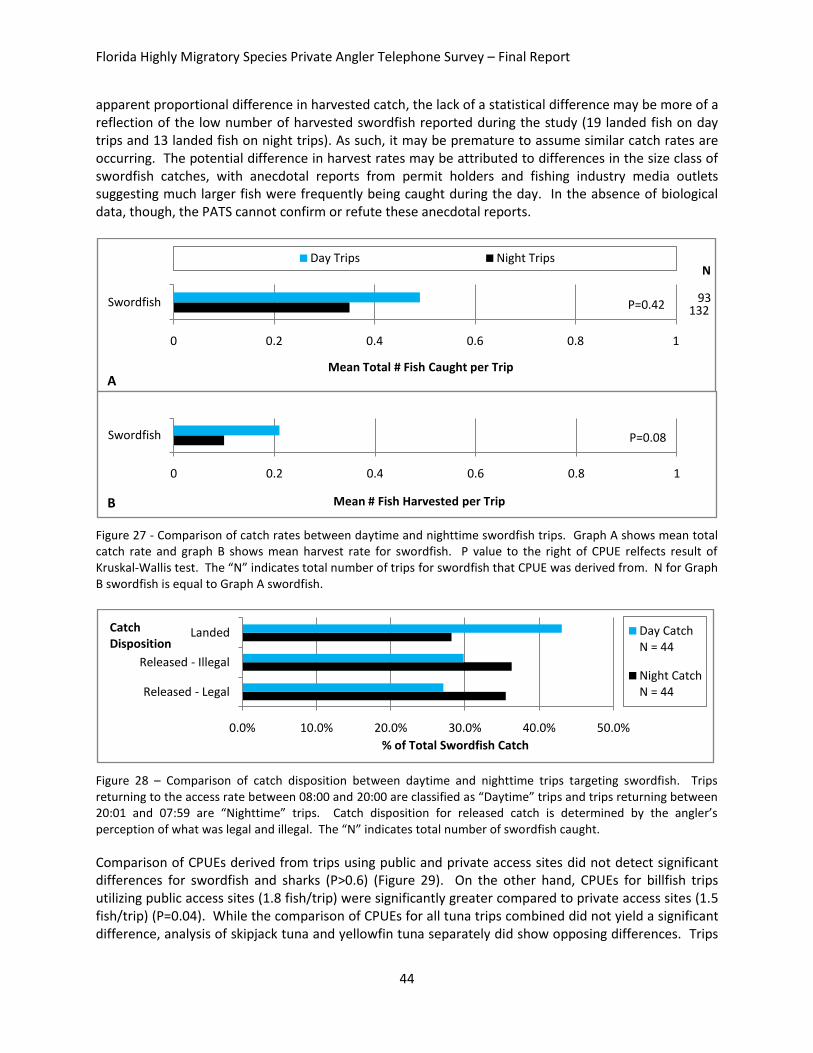
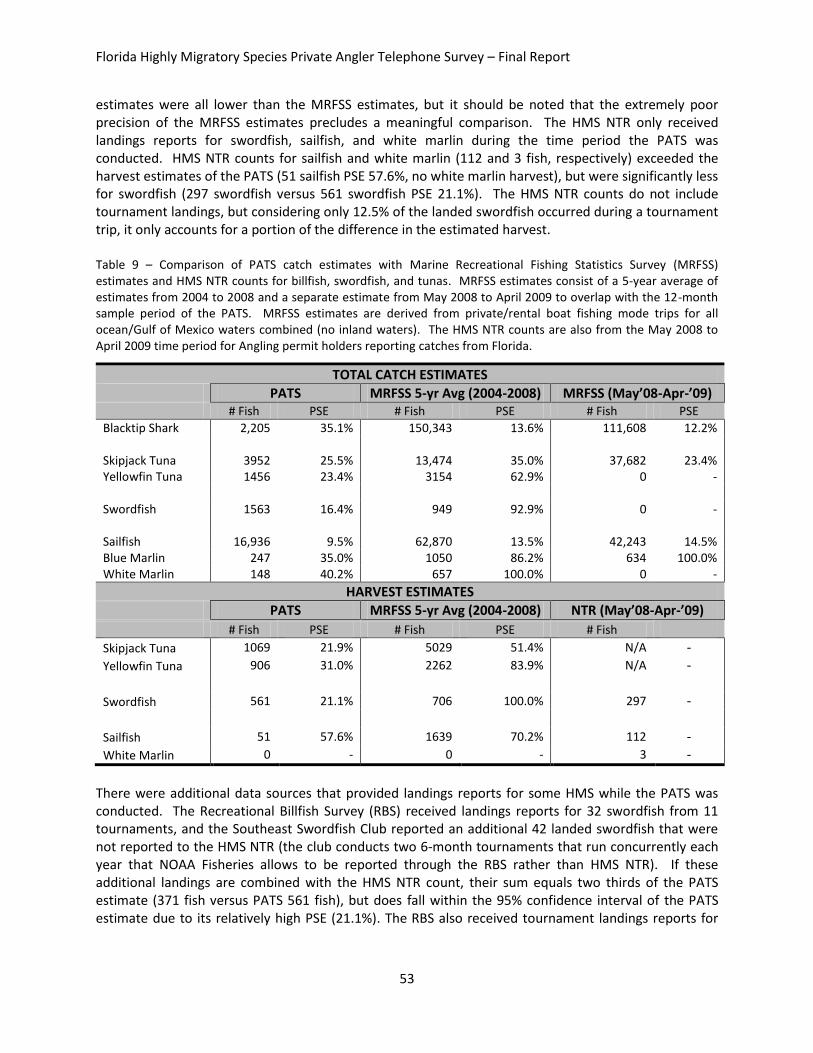
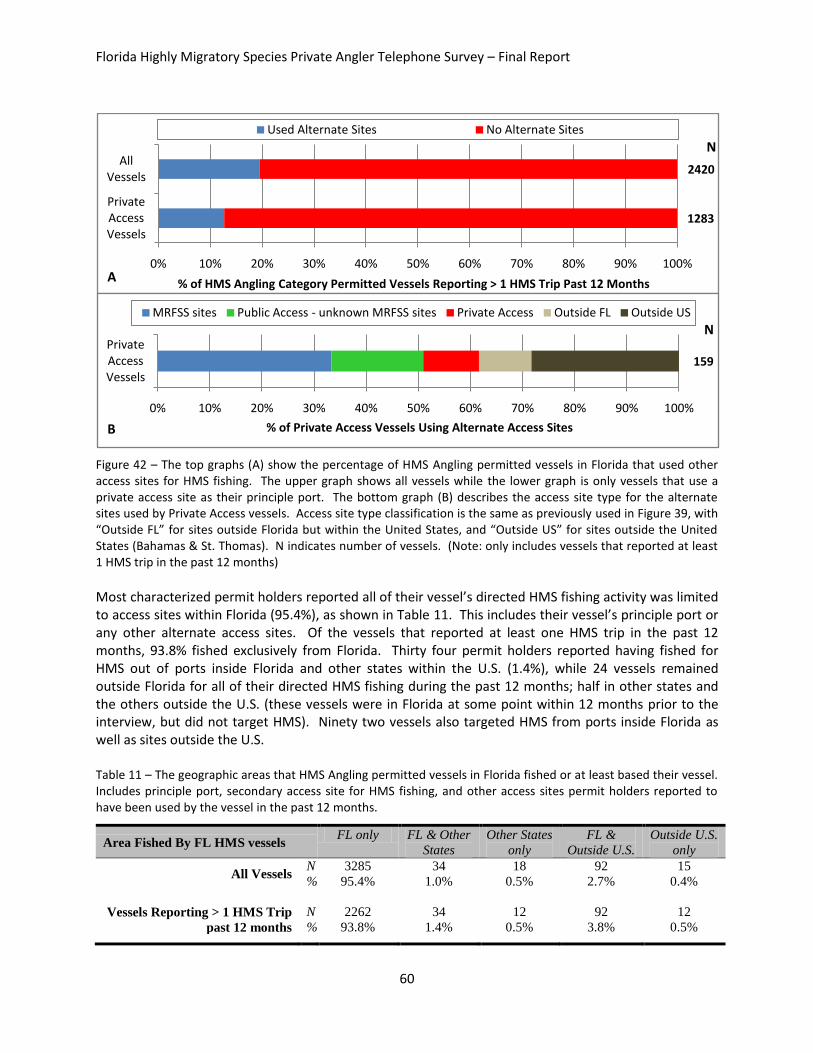
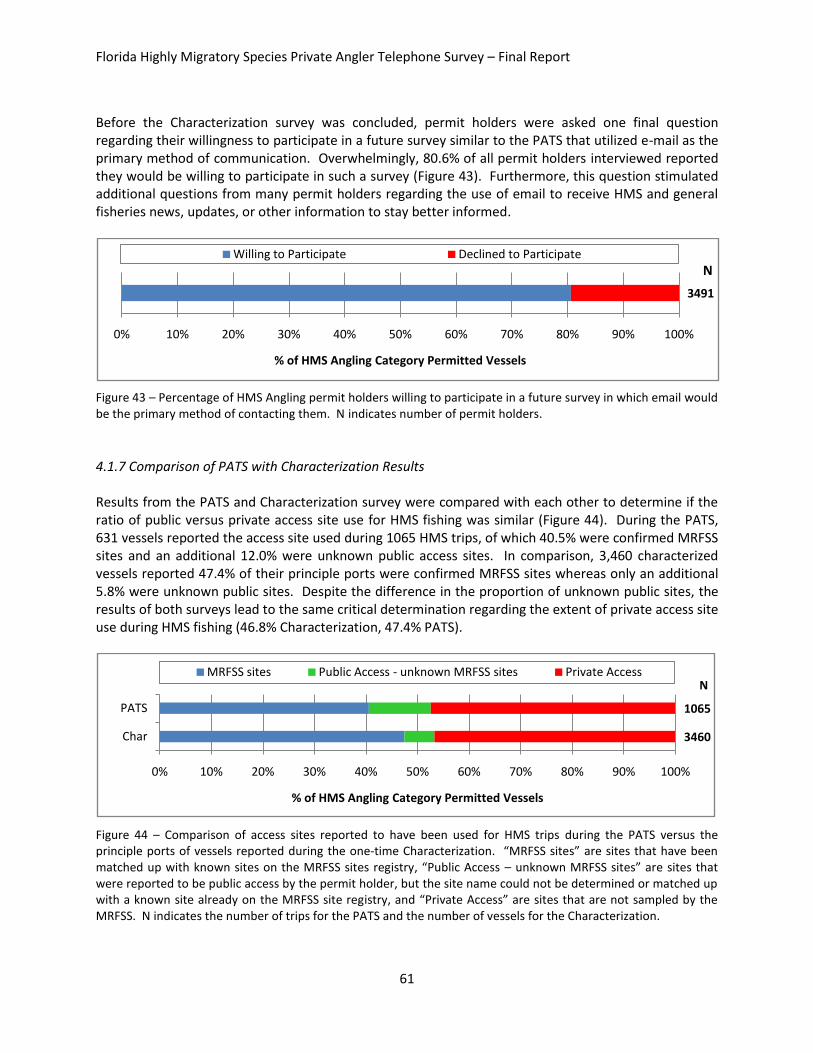
permitted anglers that were recreationally fishing in violation of the permit rules warrants increased education efforts to ensure recreational anglers obtain the appropriate permit for their fishing activities. Billfish accounted for the largest proportion of HMS trips (55.5%) and catches (50.0%), of which sailfish was the dominant species. The sailfish total catch estimate of 16,936 fish (PSE 9.5%) accounted for approximately 98% of the total billfish catch and all of its estimated landings (51 sailfish, PSE 57.6%). Swordfish accounted for next highest proportion of HMS trips (20.8%), with an estimated 1,563 fish (PSE 16.4%) caught, of which 561 were landed (PSE 21.1%). Tuna were targeted or caught during 19.2% of all HMS trips, with an estimated 3,952 skipjack caught (PSE 25.5%) and 1,069 landed (PSE 21.9%) and 1,456 YFT caught (PSE 23.4%) and 906 landed (PSE 31.0%). Sharks accounted for only 14.9% of all HMS trips, but comprised 29.7% of the total estimated HMS catch (10,294 sharks, PSE 14.9%, 33 landed, PSE 57.6%). Shark catches were comprised of 16 individual species, plus 3 genera, 2 family, and 1 unidentified shark categories, but the precision of the species-level catch estimates was poor for all shark species (PSE >27.7%). Analysis of catch dispositions revealed more than 99% of billfish and shark catches were released, while significant proportions of swordfish and tunas were landed (35.6% and 35.8%, respectively). The catch estimates generated by the PATS represented a marked improvement in precision from the MRFSS, especially for swordfish and yellowfin tuna. MRFSS estimates for yellowfin tuna, swordfish, blue and white marlin over the past five years varied from 62.9 to 100% PSE, whereas the PATS estimates varied from 16.4 to 40.2% PSE. The improved precision for these and other species does not automatically equate to greater accuracy, though. Sailfish and skipjack tuna PATS estimates had similar levels of precision with the MRFSS, but the estimates themselves were substantially lower. The PATS estimate of 16,936 sailfish (PSE 9.5%) was a fraction of the MRFSS May 2008 to April 2009 estimate of 42,243 sailfish (PSE 14.5%), while the MRFSS 2004-2008 annual average of 62,870 sailfish (PSE 13.5%) was even greater. The differences between the PATS skipjack catch estimate of 3,952 fish (PSE 25.5%) and the MRFSS estimates for the same time period and the 5-yr average (37,682 fish, PSE 23.4% and 13,474 fish, PSE 35.0%, respectively) were even greater. The blacktip shark PATS total catch estimate (2,205 sharks, PSE 35.1%) had lower precision and was a fraction of the MRFSS May 2008 – April 2009 estimate (111,608 sharks, PSE 12.2%) and MRFSS 5-yr average (150,343 sharks, PSE 13.6%). The differences between the PATS and MRFSS estimates can be attributed to both coverage gaps in the PATS sample frame and design limitations and coverage biases in the MRFSS. Exemptions to the HMS permit for vessels operating in State waters (< 3 miles Atlantic, <10 miles Gulf of Mexico) result in a significant coverage gap for the HMS fishing activity of some species in the PATS. HMS permit holders reported 45.6% of billfish trips and 29.3% of shark trips occurred primarily in State waters. Additionally, HMS bycatch during non-HMS targeted trips constituted 70.4% of total shark trips overall, and accounted for 90.5% of trips that targeted other HMS groups that resulted in shark bycatch. Although this study was only 12 months in duration, there were some indications of seasonal trends for other HMS groups. There were seasonal increases in which HMS bycatch on non-HMS targeted trips comprised a significant proportion of total the number of HMS trips, including 42.5% of winter (January-February) tuna trips and 30.8% of late summer (July-August) billfish trips. If HMS catches in State waters and HMS bycatch make up such large proportions of HMS-permitted fishing activity, then it reasonable to assume the same would be true for non-HMS-permitted vessels employing similar targeting practices. The unknown proportion of the fishery that conducts HMS-targeted trips in Federal waters or lands HMS bycatch without a permit must also be considered. This suggests the PATS may have missed a substantial proportion of the private angler fishery for sailfish, sharks, and skipjack tunas by solely relying on the HMS Angling permit as its sample frame.
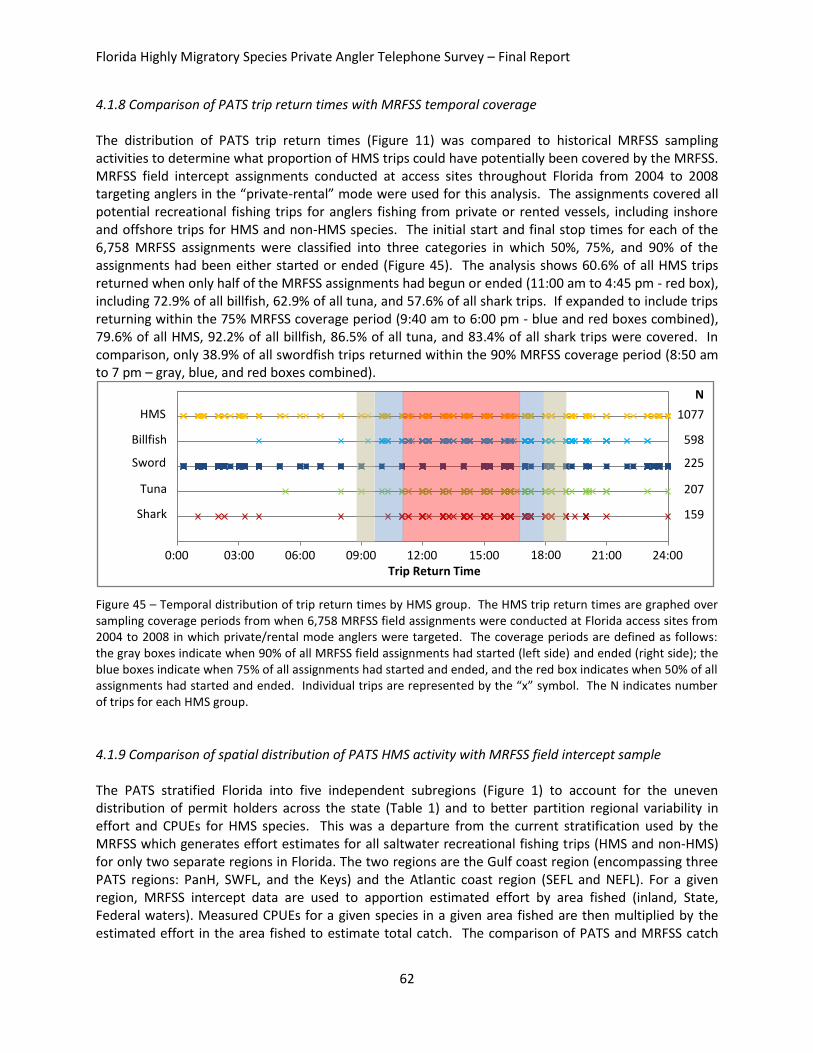
Florida Highly Migratory Species Private Angler Telephone Survey – Final Report
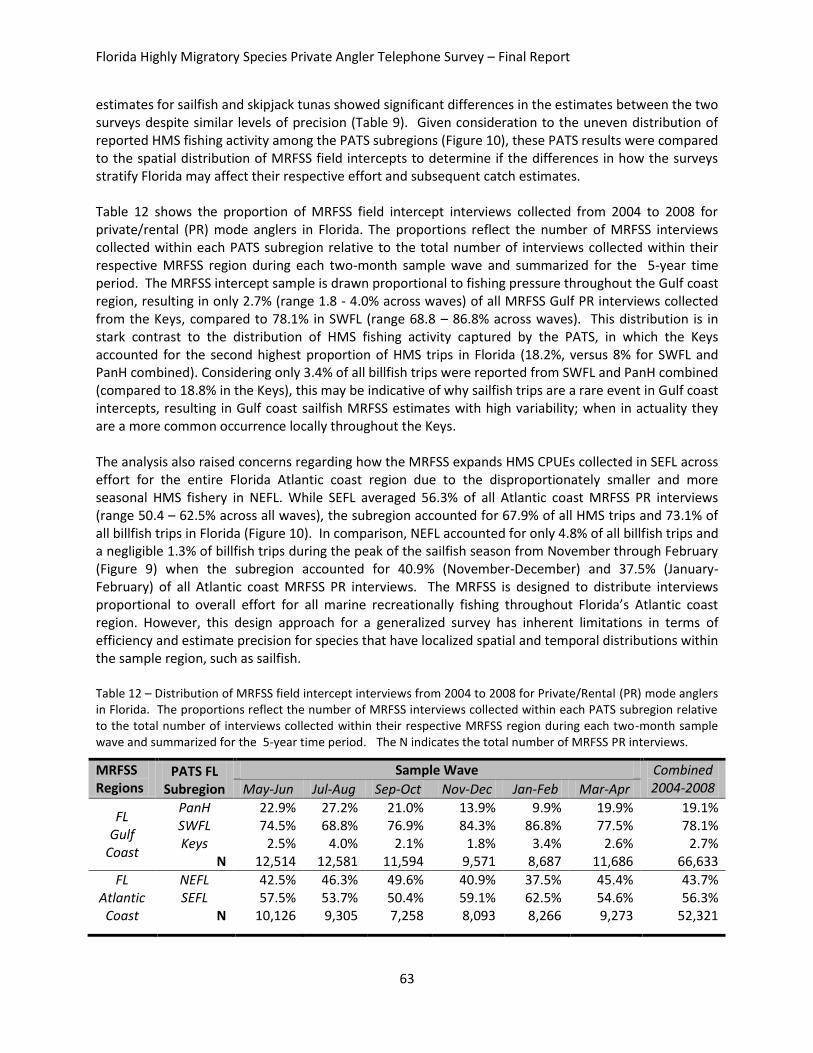
8
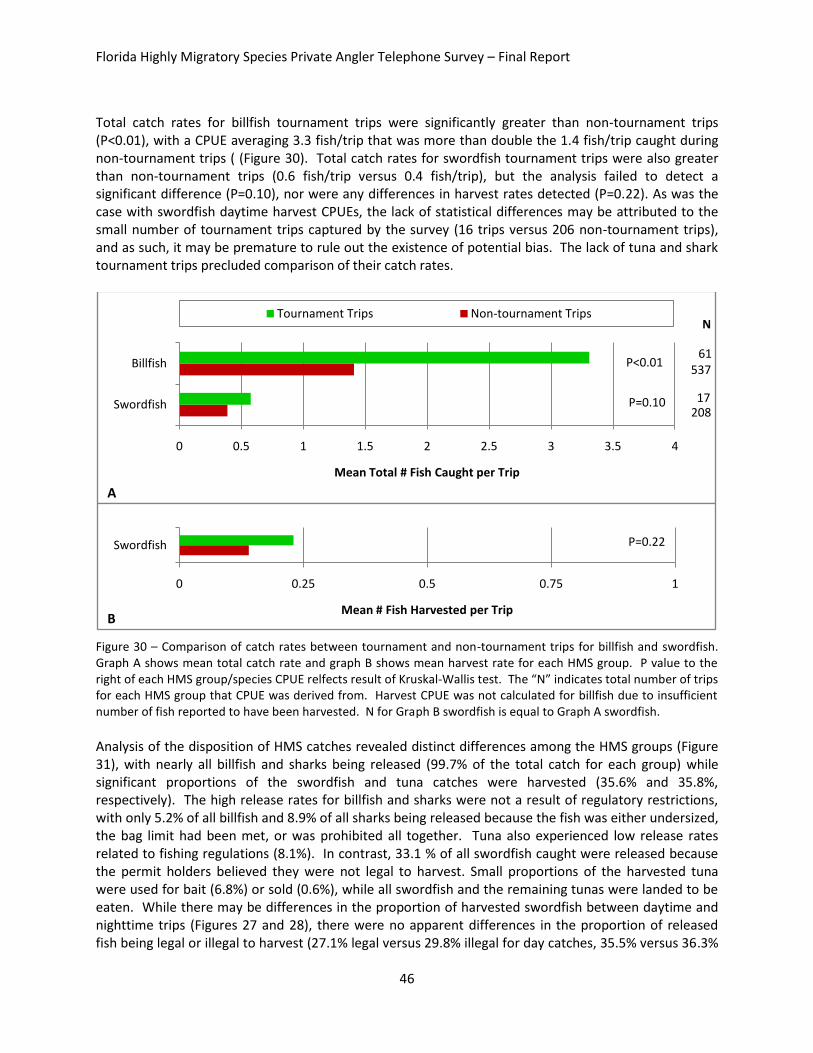
At the same time, the localized distribution of some HMS fisheries within Florida’s two regions (Gulf and Atlantic) makes it difficult to efficiently or precisely monitor HMS catches using the current MRFSS design. For example, sailfish are a rare event in the Gulf coast sample, despite being locally common throughout the Keys, because the Keys only account for 2.7% of all MRFSS private boat intercepts in the region. In contrast, sailfish CPUEs collected in southeast Florida, where 73.1% of all Florida billfish trips occurred, are expanded out to the Florida Atlantic coast region's total effort estimate, despite the fishery being disproportionately smaller and more seasonal in northeast Florida (accounting for only 4.8% of all billfish trips). In addition, analysis of the PATS results confirm the existence of under coverage biases in the MRFSS intercept survey related to trips returning at night, trips made from private access sites, and tournament fishing in many of Florida’s HMS fisheries. A majority of swordfish trips (58.7%) returned between 8 pm and 8 am the following morning. Comparison of catch rates from these trips with daytime swordfish trips did not detect any significant differences, despite the use of different fishing techniques for each time period. Nighttime trips primarily involved drift fishing at varied depths throughout the water column while daytime trips primarily involved deep-drop bottom fishing. A potential bias was detected in the harvest rates, though, with daytime trips landing 43.1% of all swordfish caught compared to only 28.2% landed during night trips. While the CPUE comparison was not statistically significant (P=0.08), it should not be dismissed considering the sample size consisted of only 32 landed fish (19 day versus 13 night). HMS trip return times were also compared with the start and end times of Florida MRFSS field intercept assignments to assess the MRFSS sampling coverage for daytime trips. The comparison suggested long-range HMS trips for YFT and marlin were being missed due to their late afternoon and evening return times. Favorable weather conditions are usually required to conduct these specialized trips that often travel more than 50 miles offshore. MRFSS assignments conducted on those same “good weather” days at busy access sites near inlets or passes were more likely to end earlier because the sampler would have reached the 30-interview maximum limit for vessels returning earlier in the day, thus increasing the coverage bias for these long-range trips. The use of access sites not accessible to MRFSS samplers by HMS anglers was extensive, including at least 47% of Angling and 51% of General permit holders. With such a large proportion of the fishery being excluded from field sampling efforts, the concern has been whether or not catch rates on these trips differ from those on trips returning to public access sites. The survey results clearly indicate these concerns are warranted because significant differences in catch rates were detected for billfish and tuna trips between vessels using public and private access sites. Angling permit holders reported catching significantly more billfish and YFT during trips that returned to public access sites, while catch rates for skipjack tunas were significantly higher for trips returning to private access sites. The study also confirmed that tournament fishing results in significantly higher HMS catch rates compared to non-tournament trips. Catch rates for billfish tournament trips were more than double those of non-tournament trips. Tournament trips accounted for nearly 10% of all billfish trips and 20% of the total sailfish catch, yet they are not included in MRFSS sampling. Reliance upon the Recreational Billfish Survey (RBS) to monitor tournament catches is inadequate because only half (51.3%) of the HMS tournaments identified during this study had registered with NOAA Fisheries’ HMS Management Division as required. This does not include HMS bycatch caught by non-permitted anglers fishing in the hundreds of non-HMS tournaments targeting king mackerel, dolphin, wahoo, blackfin tuna, and other species that take place every year throughout Florida and the rest of the southeastern U.S. Although
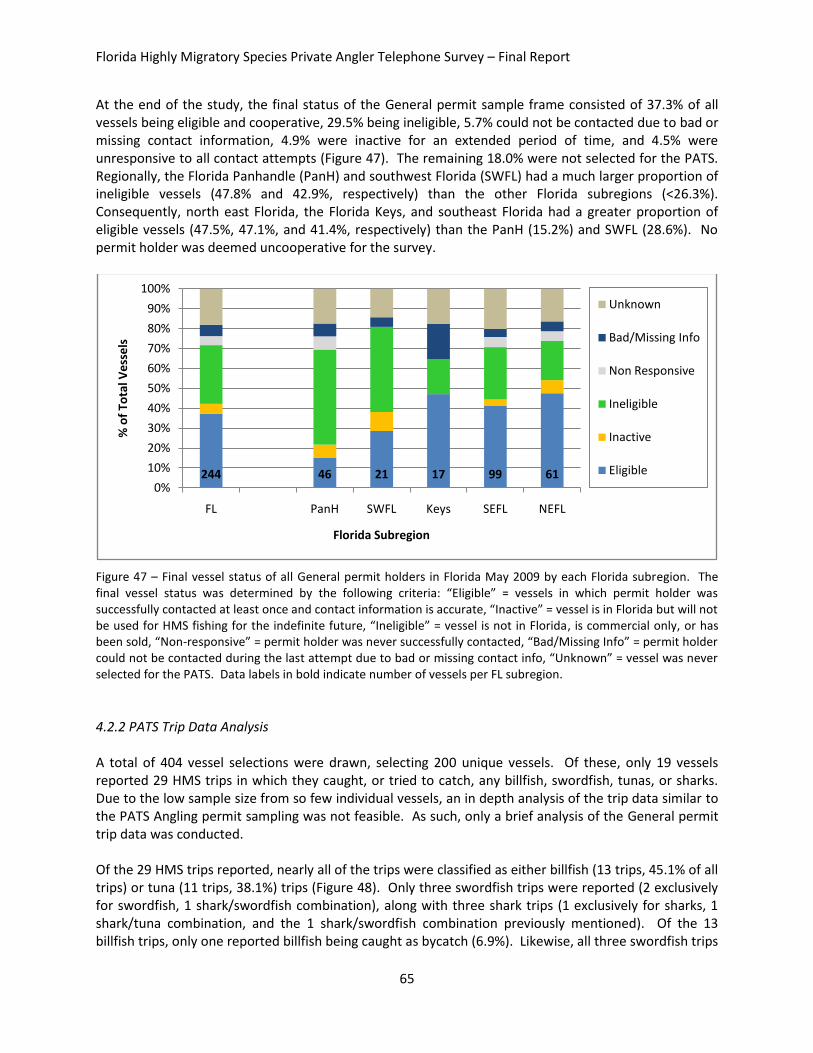
Florida Highly Migratory Species Private Angler Telephone Survey – Final Report
9
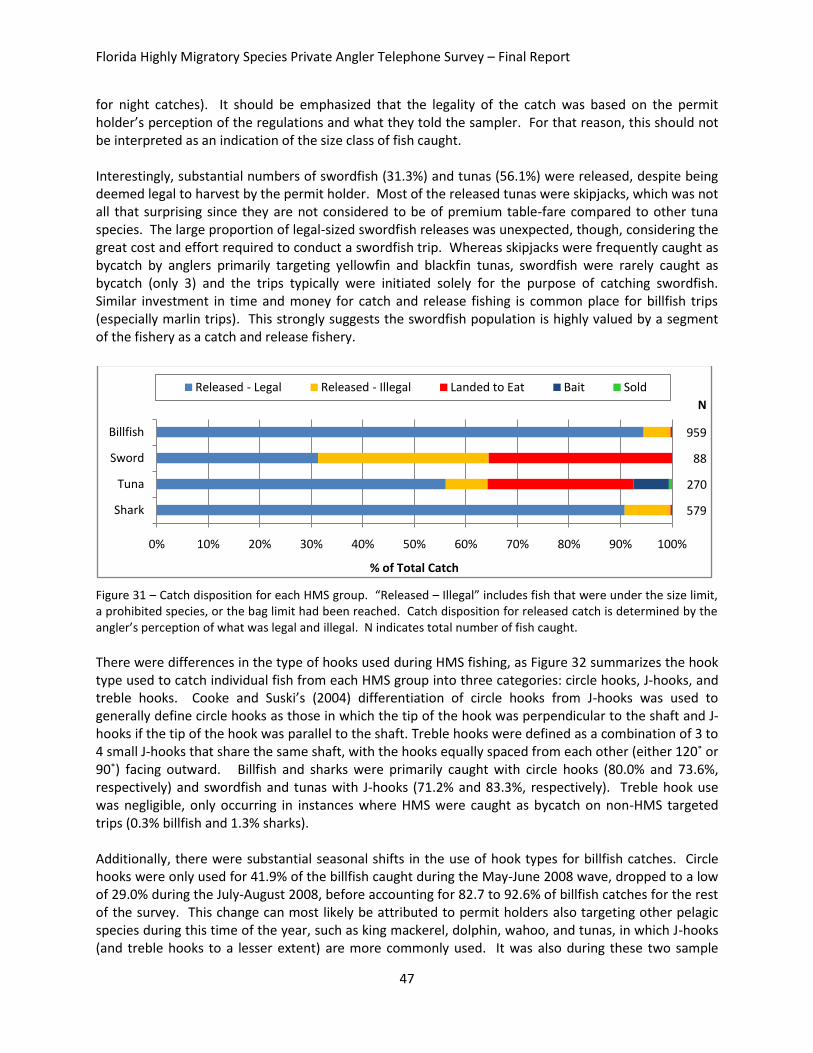
swordfish tournament catches were not significantly different from non-tournament catches, the fishery needs further investigation due to the small sample size of tournament trips; especially considering the average tournament catch rate was 1.5x greater than for non-tournament trips. 1.1 Management Recommendations Florida’s HMS fisheries are highly diversified, requiring different approaches to adequately monitor each segment. The following recommendations address identified deficiencies and data gaps and are aimed at improving future monitoring efforts:
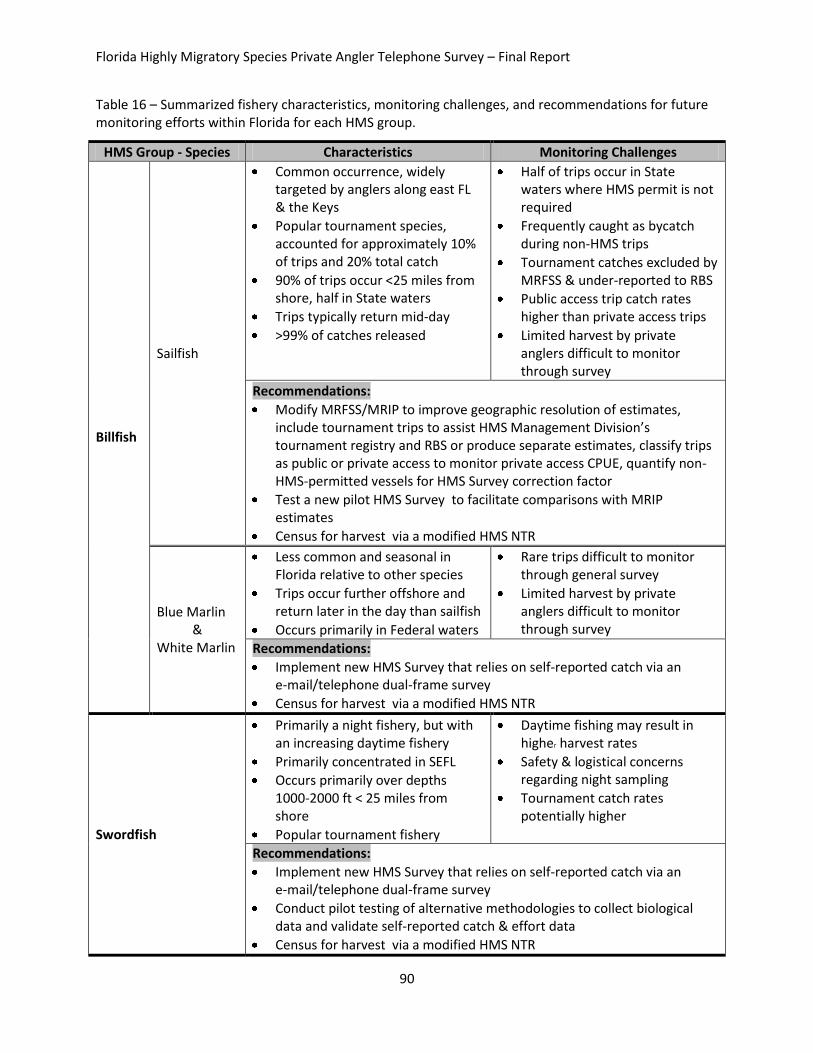
1. The study reaffirms the need for significant modifications to the MRFSS that should be incorporated into the new MRIP. Adoption of these specific MRIP improvements, in addition to other design changes currently being evaluated by the MRIP Design and Analysis work group, should result in improved coverage and accuracy of estimates for sailfish, skipjack tuna, sharks, and possibly YFT. These changes should include:
Increasing the spatial stratification of Florida into smaller subregions from the current two (Florida Gulf coast and Florida Atlantic coast) to improve geographic resolution of catch and effort estimates relative to the distribution of HMS fisheries. This should reduce variability in measured catch rates and the overestimation of effort for fisheries disproportionately concentrated in one subregion of the state, such as sailfish in SEFL for which catches are expanded to effort collected over a much larger area where the fishery is significantly smaller and more seasonal.
Instituting proportional stratification to the temporal distribution of access point survey assignment start and end times to provide adequate coverage to trips returning in the late afternoon and evening. This is especially important for long-range trips targeting YFT and marlin that are typically absent from the MRFSS.
Classifying vessels as either public or private access during field intercepts. This will provide some coverage to private access fishing, facilitating long-term CPUE comparisons and possible catch adjustments.
Addressing the exclusion of tournament fishing, either by fully including tournament fishing in the survey or by a separate tournament monitoring program.
2. Implement a specialized HMS survey to monitor the total catch for marlin, swordfish, and YFT.
The survey would utilize the HMS permit list as a sample frame for effort estimation and the collection of self-reported catch data. A dual-frame approach may be appropriate, possibly with a saltwater fishing license frame, to minimize off-frame adjustments.
E-mail or other electronic communication formats should be employed in conjunction with follow-up telephone sampling to lessen the reporting burden for permit holders. This is especially important considering 80% of Angling and 74% of General permit holders expressed support for this format.
Due to the reliance upon self-reported catches for catch estimation, new catch and effort validation methodologies will be necessary to assess the accuracy of the survey. MRIP should authorize a pilot study to evaluate the effectiveness and costs of various approaches that quantify the proportion of the fishery covered by the survey and validate self-reported catches and trip reports.
Florida Highly Migratory Species Private Angler Telephone Survey – Final Report
10
Include trips in the Bahamas within the scope of the survey. Permit holders reported frequently fishing in or just north of Bahamian waters for YFT (and marlin) prior to returning to U.S. ports along the east coast of Florida. Inclusion of these trips, as well as multiday trips within the Bahamas, should be included in the data collection to provide additional information on distribution of the fishery.
3. The monitoring of HMS landings for billfish, swordfish, and some shark species should be
primarily conducted by a census program due to the limitations of any survey to accurately estimate limited harvests. Improvements to the existing NOAA Fisheries census programs (Automated Landings Reporting System and HMS non-tournament reporting hotline and website) that may aid in improving the reporting rate include:
Elimination of the 24-hour grace period allotted to anglers to report landed billfish, swordfish, and bluefin tuna upon returning from a trip because the grace period makes enforcement of the reporting requirement nearly impossible. Landed catches will have to be reported prior to the removal of the fish from the vessel.
Provide additional reporting options to anglers to reduce reporting burden and facilitate timelier reporting. These include text messaging, e-mail, and smart phone applications.
The addition of five shark species to the HMS reporting requirement is strongly recommended. These include species of concern (great hammerhead, scalloped hammerhead, and tiger), as well as more common species (bull and shortfin mako).
The proposed HMS Survey catch estimates would be used to evaluate the effectiveness of these proposed modifications.
4. Increased education and outreach efforts to better inform anglers about the need and methods for reporting HMS landings. The efforts should focus on the following issues:
Increasing awareness of the permit requirements for the HMS fishery and better explain the differences between permit types. The latter would primarily focus on reducing the number of recreational anglers that mistakenly (or deliberately) obtain a commercial Atlantic Tunas General permit when the HMS Angling permit is more appropriate.
Emphasizing the conservation and management benefits of reporting landed HMS catches, registering HMS tournaments, and participating in monitoring programs.
Providing timely information regarding HMS management changes and stock assessment updates.
In the spirit of this recommendation, a summary of this report will be emailed to all permit holders that provided email addresses during the course of this study. They will also be provided a link to the MRIP website where they can download the complete report, while also being able to learn more about other MRIP studies conducted as part of this effort.
These recommendations are not exclusively for Florida’s recreational HMS fisheries. A characterization study of HMS permit holders throughout the Gulf of Mexico and South Atlantic also revealed wide-spread participation in HMS fisheries, but identified similar monitoring challenges in most states. These included vessels returning late in the evening after MRFSS sampling was completed, private access fishing, and tournament fishing. A comprehensive, specialized HMS data collection program that covers the full range of HMS stocks throughout the U.S. would greatly improve the ability of managers to effectively monitor these valuable fisheries.
Florida Highly Migratory Species Private Angler Telephone Survey – Final Report
11
2. INTRODUCTION Throughout the territorial waters of the United States and its territories exists directed recreational fisheries that target a group of highly migratory species (HMS). This HMS group is comprised of billfish, swordfish, tunas, and sharks and is currently managed within the United States Exclusive Economic Zone (EEZ) under a federal fishery management plan. Several of these species are also managed through strict international quotas. Despite decades of management, assessing the impact of the recreational fisheries for most of these species continues to be a challenge due to a lack of accurate fisheries statistics data. In the southeastern United States, the NOAA Fisheries Marine Recreational Fishing Statistics Survey (MRFSS) is the primary method for monitoring recreational catch and harvest of these species. HMS-targeted trips comprise a small portion of all recreational fishing trips combined, which makes them a “rare event” in any survey that is not directly targeting this specific segment of the recreational fishery. Additionally, many HMS-targeted trips originate from private access sites and return late at night, making them particularly difficult to intercept in traditional dockside surveys. In Florida, recreational HMS fisheries have been well established since the early 20th Century targeting billfish, swordfish, tunas, and sharks (Gregg, 1902; Burgess, 1966; Jolly, 1974; Rivkin, 2009). The MRFSS has averaged over 40,000 field intercepts annually collected throughout Florida since 1999, yet catch estimates for nearly all HMS species are highly imprecise due to typically low MRFSS positive catch intercept sample sizes for these species. Even for relatively common HMS such as Atlantic sharpnose sharks and sailfish that the MRFSS has consistently produced total catch estimates with relatively high precision, estimates of harvest are even more problematic. For example, the MRFSS has annually recorded approximately 300 positive catch intercepts for the popular catch and release sailfish fishery since 2001, resulting in catch estimates with relatively low proportional standard errors (PSE) that range from 10.0 to 12.8%. Sailfish harvest estimates, on the other hand, have high variance (26.2 to 60.7% PSE) due to the low number of landed sailfish observed dockside (9 to 36 sailfish per year). Less common species of concern, such as blue marlin, white marlin, bigeye thresher, Caribbean reef, dusky, scalloped hammerhead, smooth hammerhead, and great hammerhead sharks have all been observed on south Florida docks within the past decade. However, neither the MRFSS nor other current sampling programs in the South Atlantic and Gulf of Mexico regions, such as the For-Hire Telephone Survey, Southeast Region Headboat Survey, and Texas Harvest Monitoring Program, are designed to reliably assess the impact of the recreational fishery on these species because of their rare occurrence. Apart from being rare-event species in general recreational surveys, the spatial and temporal characteristics of some well established HMS fisheries also makes them especially difficult to monitor. These include directed fisheries for yellowfin tuna and marlin that typically occur in waters far off shore, resulting in late afternoon-evening return times (MRIP 2009a). There are also the difficulties associated with sampling night fisheries, such as is the case with swordfish. The Straits of Florida has long supported commercial and recreational fisheries targeting swordfish since the 1960’s (Berkeley & Irby, 1982; Taylor & Murphy, 1992). Prior to the 2001 pelagic longline ban, commercial swordfish landings along the east coast of Florida annually accounted for 23.3% of the total landings from the U.S. Atlantic and Gulf of Mexico waters combined (NOAA Fisheries, Fisheries Statistics Division, personal communication). The current absence of pelagic longlining has coincided with a renewed interest among recreational anglers, primarily in southeast Florida and the Florida Keys (Coddington, 2006; Levesque & Herstetter, 2007). The recreational fishery has been actively promoted by industry related media outlets since 2002; most recently to promote techniques for daytime bottom fishing in over 1000 ft depths (Suroviec, 2007). While anecdotal reports of hundreds of recreational vessels targeting swordfish on weekend nights have been common since 2002 (McGowan, personal observation), the
Florida Highly Migratory Species Private Angler Telephone Survey – Final Report
12
MRFSS has recorded a total of 9 swordfish intercepts (5 landed and 4 released) in Florida from 2001 to 2008. In addition, the impact from incidental catches of juvenile swordfish and protected shark species including night, bigeye thresher, and longfin mako is currently unknown. To address the apparent difficulties involved with monitoring recreational HMS fisheries, NOAA Fisheries and Florida’s Fish & Wildlife Conservation Commission require that all billfish, swordfish, and bluefin tuna landed by recreational anglers during a non-tournament trip be reported to NOAA Fisheries within 24 hours. These landing reports are tracked by the HMS non-tournament reporting hotline and website (billfish and swordfish) and the Automated Landings Reporting System (bluefin tuna). Unfortunately, compliance with this attempted census of quota-managed species is believed to be poor, likely due to difficulty in enforcing the reporting requirement. Subsequently, landing estimates for these HMS in this region may be under-estimated. Tournament fishing effort is currently monitored by requiring all HMS tournaments to register with the HMS Management Division of NOAA Fisheries. Tournament catches are monitored by the Recreational Billfish Survey, which uses the HMS Management Division tournament registry to select tournaments to provide catch reports (all billfish tournaments are selected and required to report). Similar to the non-tournament reporting census, the shortcomings of these programs relates to enforcing and validating the registration and reporting requirements. No reliable mechanism is currently in place across the South Atlantic or Gulf of Mexico that can determine the proportion of unregistered tournaments, and hence, the accuracy of the census. As a result, a degree of uncertainty exists regarding the extent of tournament effort and landings in Florida and the southeastern U.S. These apparent deficiencies and data gaps were further highlighted by the National Resource Council’s (NRC) recent review of the MRFSS. The 2006 NRC report assessed the effectiveness of the MRFSS to adequately monitor recreational fisheries, including HMS. The review identified the under coverage of sampling night fishing, trips returning to private access sites, and tournament fishing as potential biases with access point surveys. To adequately monitor HMS fisheries, a more directed sampling approach is required. Under the Marine Recreational Information Program (MRIP), the HMS Work Group has implemented a series of pilot studies to collect baseline information on HMS fisheries throughout the United States and its territories to assess the effectiveness of current monitoring programs and to design and employ new methodologies to fill data gaps. This study was initiated to estimate the relative scope and magnitude of HMS recreational fishing by private anglers in Florida. The HMS permit list was utilized as a sample frame to collect trip data via a telephone survey over a 12-month period. The survey estimated fishing effort and total catches for recreational HMS trips in Florida. It also characterized the extent of nighttime fishing activity, the use of private access sites, and tournament participation among private HMS anglers. Additional information was collected to identify access sites and characterize the spatial and temporal patterns of HMS fisheries. This study was conducted to guide the development and implementation of a future field intercept survey or alternative data collection methods to more effectively monitor HMS recreational fisheries throughout the South Atlantic and Gulf of Mexico.
Florida Highly Migratory Species Private Angler Telephone Survey – Final Report
13
3. METHODS 3.1 Survey Design The NOAA Fisheries HMS permit list was utilized to conduct a telephone survey with anglers believed to be actively fishing for billfish, swordfish, tunas, or sharks in Florida state territorial seas and adjacent Federal waters (EEZ). Recreational anglers in the United States that target or land Highly Migratory Species (HMS) in the Atlantic, Gulf of Mexico, and Caribbean Sea are required to obtain a vessel-based permit from NOAA Fisheries on an annual basis. Vessel owners or captains may obtain one of three permit types depending on the fishing activity they are engaged in for that year: the HMS Angling permit, the Atlantic Tunas General permit, or the HMS Charter/Headboat permit. The three permit types are defined by NOAA Fisheries as follows:
1) HMS Angling - owners/operators of vessels fishing recreationally for HMS in the Atlantic, Gulf of Mexico and Caribbean Sea must obtain this permit. This permit is for recreational fishing only; no sale of catch is permitted. 2) Atlantic Tunas General - owners/operators of vessels fishing commercially (in Federal or State waters) in the Atlantic, Gulf of Mexico and Caribbean Sea for Atlantic bluefin, bigeye, yellowfin, albacore, or skipjack tunas using a combination of rod and reel, harpoon, and/or handlines must obtain this permit. Sale of tuna catch is permitted with this permit. 3) HMS Charter/Headboat - owners/operators of charter/headboat vessels fishing for and/or retaining regulated HMS (in Federal or State waters) in the Atlantic, Gulf of Mexico and Caribbean Sea, must obtain this permit. This permit allows a vessel to fish both commercially for tunas and recreationally for HMS, although not on the same day. Trips cannot be combined.
The vessel registries for the Angling and General permits were used to generate (independent) sample frames to conduct the telephone survey. Despite being a commercial permit for Atlantic tunas only, General-permitted vessels were included in this study because the permit allows these vessels to participate in recreational HMS tournaments for billfish, sharks, and swordfish. The Large Pelagic Survey (LPS) currently includes General-permitted vessels due to many permit holders retaining their catches for personal consumption rather than selling them. Since the extent of recreational fishing among General-permitted vessels in Florida was unknown, their inclusion in this study was deemed appropriate. Vessels possessing the HMS Charter/Headboat permit were excluded from this study because they were the focus of a separate MRIP pilot study conducted simultaneously in Florida. Permit holders for each permit type that indicated Florida as the principle port, home port, billing address, and/or shipping address were deemed eligible for this study. Due to an uneven distribution of vessels across Florida, the Angling permit sample frame was stratified into five subregions: the Florida Panhandle (PanH - Escambia to Dixie County), Southwest Florida (SWFL - Levy to Collier County), the Florida Keys (Keys - Monroe County), Southeast Florida (SEFL - Miami-Dade to Indian River County), and Northeast Florida (NEFL - Brevard to Nassau County) (Figure 1). This geographic stratification matches the regions used in the For-Hire Telephone Survey (FHTS), and facilitates comparison of the phone survey methodology. Due to the small size of the General permit sample frame (<200 vessels), a similar stratification was not applied.
Florida Highly Migratory Species Private Angler Telephone Survey – Final Report
14
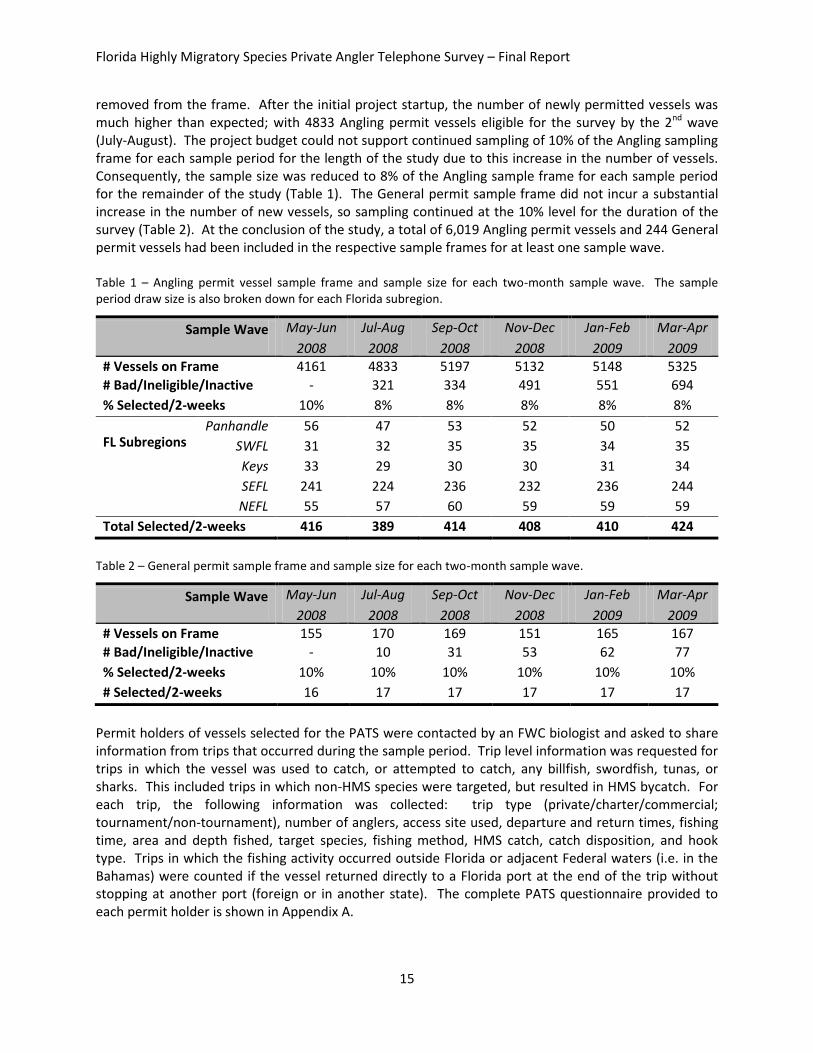
Figure 1 – Stratification of the Angling permit sample frame into five subregions: the Florida Panhandle (Escambia to Dixie County), Southwest Florida (Levy to Collier County), the Florida Keys (Monroe County), Southeast Florida (Miami-Dade to Indian River County), and Northeast Florida (Brevard to Nassau County).
The survey was comprised of two components: a biweekly survey of a randomly selected subset of each sample frame and a one-time characterization census of all eligible permit holders. In the Private Angler Telephone Survey (PATS) 10% of the vessels were drawn from each sample frame biweekly (the vessel draw selected 10% from each subregion of the Angling frame). Sample periods began on a Monday and ended 14 days later on a Sunday. Sample periods ran concurrently with each other and were pooled into two month sample waves (January-February, March-April, etc.). Sample periods that overlapped waves were assigned to the wave based on the month of the sample period’s first day (e.g. sample period 08 began on February 16, 2009 and ended March 1, 2009, so it was assigned to the January-February 2009 wave). The Characterization survey was conducted once, opportunistically as permit holders were selected for the PATS. All permit holders that were not characterized upon the conclusion of PATS sampling were contacted directly to complete the Characterization survey. Upon initiation of the survey on May 12, 2008 there were 4,161 Angling permit vessels and 155 General permit vessels that had obtained a permit on or after June 1, 2007. Updates to the sample frames occurred two weeks prior to the end of each wave. Newly permitted vessels were added to the registry at this time while vessels determined to be inactive, ineligible, or to have bad contact information were
Florida Highly Migratory Species Private Angler Telephone Survey – Final Report
15
removed from the frame. After the initial project startup, the number of newly permitted vessels was much higher than expected; with 4833 Angling permit vessels eligible for the survey by the 2nd wave (July-August). The project budget could not support continued sampling of 10% of the Angling sampling frame for each sample period for the length of the study due to this increase in the number of vessels. Consequently, the sample size was reduced to 8% of the Angling sample frame for each sample period for the remainder of the study (Table 1). The General permit sample frame did not incur a substantial increase in the number of new vessels, so sampling continued at the 10% level for the duration of the survey (Table 2). At the conclusion of the study, a total of 6,019 Angling permit vessels and 244 General permit vessels had been included in the respective sample frames for at least one sample wave. Table 1 – Angling permit vessel sample frame and sample size for each two-month sample wave. The sample period draw size is also broken down for each Florida subregion.
Table 2 – General permit sample frame and sample size for each two-month sample wave.
Sample Wave May-Jun
2008
Jul-Aug
2008
Sep-Oct
2008
Nov-Dec
2008
Jan-Feb
2009
Mar-Apr
2009 # Vessels on Frame 155 170 169 151 165 167
# Bad/Ineligible/Inactive - 10 31 53 62 77
% Selected/2-weeks 10% 10% 10% 10% 10% 10%
# Selected/2-weeks 16 17 17 17 17 17
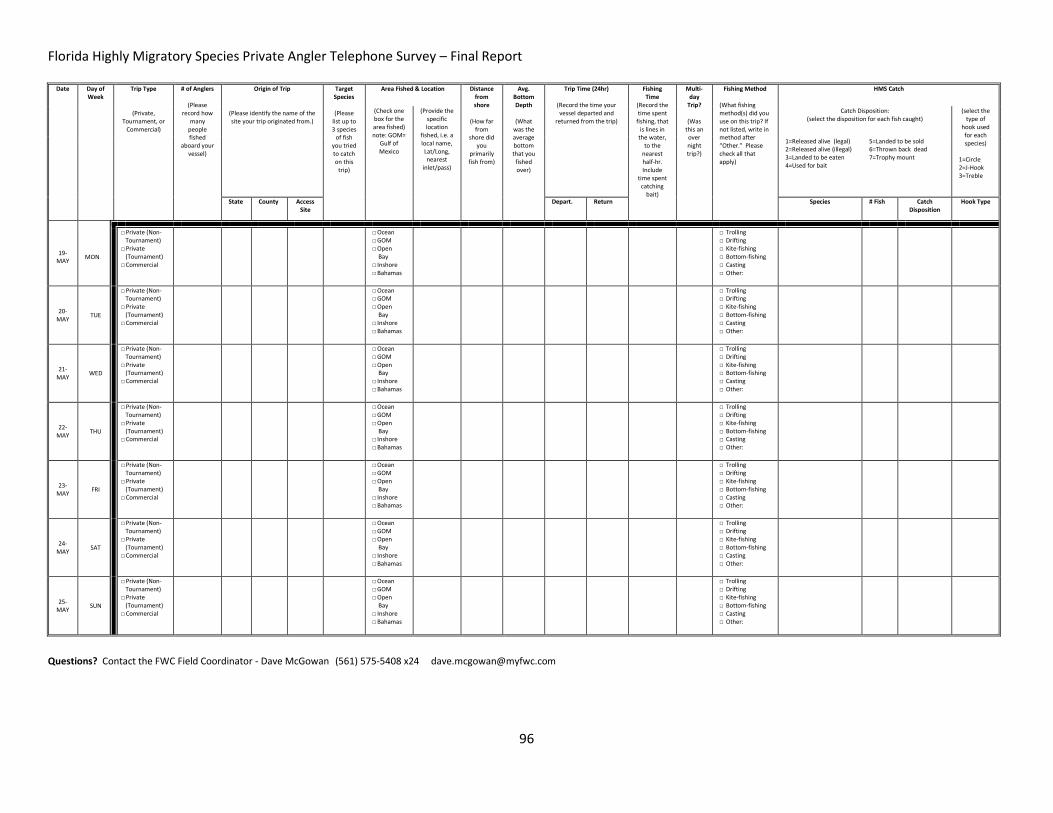
Permit holders of vessels selected for the PATS were contacted by an FWC biologist and asked to share information from trips that occurred during the sample period. Trip level information was requested for trips in which the vessel was used to catch, or attempted to catch, any billfish, swordfish, tunas, or sharks. This included trips in which non-HMS species were targeted, but resulted in HMS bycatch. For each trip, the following information was collected: trip type (private/charter/commercial; tournament/non-tournament), number of anglers, access site used, departure and return times, fishing time, area and depth fished, target species, fishing method, HMS catch, catch disposition, and hook type. Trips in which the fishing activity occurred outside Florida or adjacent Federal waters (i.e. in the Bahamas) were counted if the vessel returned directly to a Florida port at the end of the trip without stopping at another port (foreign or in another state). The complete PATS questionnaire provided to each permit holder is shown in Appendix A.
Florida Highly Migratory Species Private Angler Telephone Survey – Final Report
16
Concerns regarding the collection of catch data over the telephone were thoroughly discussed by the project team during the design phase of the survey. After much deliberation, it was assumed recall of HMS catches would be relatively high with a two-week sample period, while minimizing the reporting burden for the permit holders. Non-HMS catches were not recorded to minimize interview length. Additionally, two tuna species (little tunny and blackfin) and three shark species (Atlantic sharpnose, bonnethead, and nurse) were excluded from qualifying as an HMS trip. The tunas were excluded because they are not managed under the Consolidated HMS Fishery Management Plan, while the sharks were excluded because they are frequently caught as bycatch on trips that target non-HMS. The MRFSS has produced catch estimates with adequate precision for all five excluded species in Florida over the past decade, so it was assumed their exclusion would not affect management data needs. On the other hand, inclusion of these species would have increased the number of eligible trips disproportionately when the objective of the study was to investigate unknown aspects of Florida’s HMS fisheries. The Characterization survey was designed to describe the extent of each vessel’s HMS fishing activity, species preferences, and accessibility to a field intercept survey or alternative sampling methods. The questionnaire collected information regarding the permit holder’s fishing experience, length of time obtaining HMS or Atlantic Tunas permits, the location and types of primary and secondary access sites used by the vessel, the number of targeted HMS trips by species the vessel conducted in the past 12 months. The complete questionnaire is shown in Appendix B. 3.2 Interviewer Training, Supervision, and Monitoring The FWC samplers recruited to conduct this study were all experienced field biologists. All samplers had prior experience conducting recreational fisheries surveys in the study area. As such, they all had received training regarding approaching anglers, stating the Privacy Act disclosure, reading survey questions verbatim, conducting interviews without biasing the respondents’ answers, and dealing with uncooperative or hostile permit holders. Training for the survey included an overview of the survey design and its objectives, extensive familiarization with the PATS and Characterization questionnaires, guidelines for what qualified as an HMS trip, dialing procedures, procedures on how to fill out datasheets, and computer training for key-entering data into MS Access database. In addition, HMS-related training included species identification, historical overview of Florida’s HMS fisheries, current stock assessment updates for species of interest, and a briefing on current HMS management and fishery related issues. All samplers were issued bulleted points provided by NOAA Fisheries HMS Management regarding these topics to enable them to answer basic HMS fishery-related questions from permit holders. The reasoning for using experienced field biologists that were briefed on these fishery issues was to facilitate outreach opportunities with a segment of the recreational fishery that had little to no prior experience with telephone sampling in this region of the U.S. A key objective of this study was to establish a positive rapport and good working relationship with the recreational HMS fishing community to facilitate their support for the survey and future data collection efforts. Samplers were remotely distributed to simultaneously conduct the HMS For-Hire field intercept pilot survey. This prevented direct supervision of samplers while telephone interviews were being conducted. Samplers were in regular contact with the project coordinator to provide updates on sampling and to receive corrective feed-back. Key-entered data for each sample period was submitted to the project coordinator two weeks after calls were initiated in order to update permit holder contact information prior to the commencement of the next sample period’s telephone sampling. A subset of
Florida Highly Migratory Species Private Angler Telephone Survey – Final Report
17
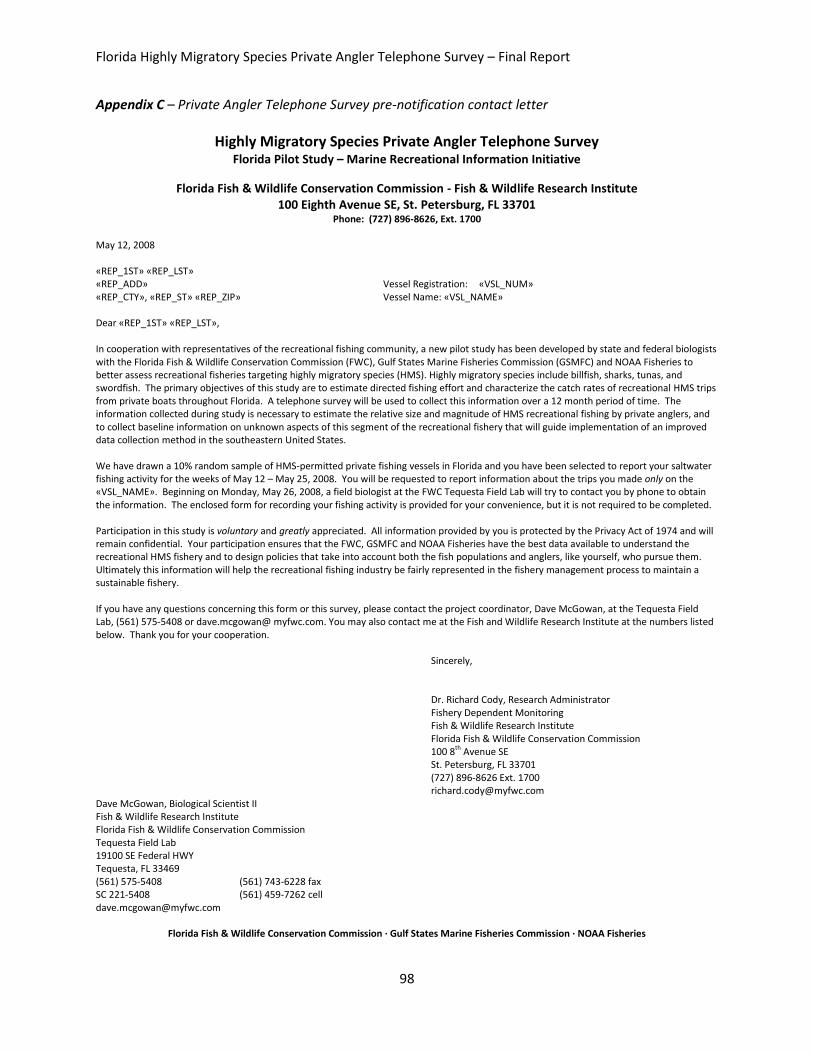
data for each sampler was manually reviewed to ensure that samplers were following the study’s protocols. 3.3 Sampling procedures Selected permit holders were mailed a pre-contact letter prior to the start of the sample period, notifying them of their selection for the study (Appendix C). The pre-contact letter stated the purpose and objectives of the study, the time period for which they would be asked to share trip data, from whom they could expect to be contacted, and the Project Coordinator’s contact information in the event they had additional questions or concerns. The letter also emphasized that their participation was voluntary and all responses would remain confidential. Included with the pre-contact letter was the PATS questionnaire-datasheet the permit holder could refer to and be aware of the questions they would be asked (Appendix A). Some anglers filled out the datasheet to use as a reference during the call, while a handful mailed or faxed in the datasheet. Datasheets that were submitted by the permit holder typically arrived weeks (and occasionally months) after the sample period was concluded and telephone contact attempts had already been completed. These data were only used if all key questions had been properly recorded and only for vessels whose permit holder could not be successfully contacted by telephone. Dialing procedures were designed to complete interviews within as short a period of time upon the end of the sample period to optimize recall, while minimizing the reporting burden on permit holders. Attempts to contact the permit holders were initiated the first Monday after the sample period ended and would be concluded after either a successful contact was made, the permit holder refused to participate, or five contacts attempts were made. All attempts were made between 08:00 and 20:00 local time for the permit holder on business days, unless alternative times or days of the week were requested by the permit holder. Upon the completion of interviews, permit holders were asked to provide their preferred time of day, contact number(s), and any other special instructions for future contacts to facilitate their schedule, minimize their reporting burden, and increase the likelihood of a successful future contact. In the event the permit holder did not speak English, the sampler first attempted to speak with someone else in the household. Permit holders that spoke Spanish were re-contacted by one of two bilingual samplers. Permit holders that did not speak English or Spanish were classified as language barrier. 3.4 Data Quality Control The survey design included the audio recording of all interviews for post-validation of 10% or 30 of the contacts (whichever was less). Once sampling commenced, technical difficulties precluded the recording of interviews because the samplers were not centrally located and recording devices could not be made compatible with the cell phones issued to the samplers. Alternative quality assurance measures were conducted, including scrutinizing phone records to ensure calls were being completed on the date and time reported, monitoring each sampler’s contact rate, and reviewing key-entered data on a biweekly basis to check for omissions, errors, or inconsistencies. All data were key-entered into MS Access forms in which all response codes were preprogrammed and drop-down lists were utilized to prevent invalid entries. SAS data check programs were created to search for omissions, errors, or inconsistencies. SAS-generated error reports were reviewed by the Project Coordinator. Flagged
Florida Highly Migratory Species Private Angler Telephone Survey – Final Report
18
responses were scrutinized by first reviewing the raw datasheet and then contacting the sampler for clarification. Any discrepancies or errors that could not be reconciled were changed to missing. Trip records in which no HMS was targeted and no HMS was caught were dropped from the analysis since they did not qualify as eligible HMS trips. 3.5 Data Analyses Data analysis and catch and effort estimation were conducted separately for the two permit types. For the characterization of the private recreational HMS fishery, data were pooled into four HMS groups depending on the species targeted and/or caught: Billfish, Swordfish, Tuna, and Shark. The four groups were not mutually exclusive and trips in which species from multiple HMS groups were targeted and/or caught were included for both HMS groups’ analyses (Note: due to inherent overlap in trip categories, the sum of the trips for the Billfish, Swordfish, Tuna, and Shark groups would be greater than the HMS group). Analyses were also conducted with all HMS trips combined; reflecting the true total number of trips that permit holders provided responses for. To report dialing results and the distribution of effort, results were presented at the Florida subregion and sample wave levels. Temporal differences in trip classification were also presented at the sample wave level. For all other analyses, data were pooled across all Florida regions and for all sample waves. Basic descriptive statistics derived from the results of the PATS were used to describe differences throughout the fishery in regards to access site type used, mode of fishing, spatial and temporal patterns of fishing activity, fishing method, number of anglers per trip, hook type used, and catch disposition. Descriptive statistics derived from the Characterization survey describe the fishing experience and permit history of the permit holders, the frequency of directed HMS fishing trips, the use and type of primary and alternate access sites, and the willingness of permit holders to participate in future e-mail surveys. Comparison of the PATS and Characterization survey results was conducted to compare the type of access sites used for HMS fishing. Following the PATS sample design, standard estimation methodology for equal probability stratified random sampling was used to calculate weighted catch and effort point estimates and estimate variances. Strata cells were defined by each unique combination of year, two-month wave, two-week sample period, MRIP sub-region, Florida region, and HMS permit. Weights were calculated for the responding primary sampling units (PSU’s), HMS permitted vessels, as the inverse of selection probability with a simple adjustment for unit non-response. Separate weights were calculated for each cell:
Where: h is a stratum cell (unique combination of year, wave, sample period, MRIP sub-region, FL
region, HMS permit type), is the weight for responding PSU’s in stratum cell h, is the frame size, count of HMS permitted vessels in h, is the actual or responding sample size (total sample size – non-responding units) in h.
Florida Highly Migratory Species Private Angler Telephone Survey – Final Report
19
Catch estimates (numbers of fish by species) and effort estimates (qualified vessel trips) were calculated as weighted totals using standard equations for stratified samples:
where: is the count (fish caught or vessel trips) reported by unit i in cell h,
is the weighted total in h, H is the total number of strata,
is the weighted grand total summed over all H cells. PROC SURVEYMEANS in SAS was used to calculate variances for estimated totals, which incorporates Taylor series approximation. Variances were estimated from the following equations:
where: is the weighted mean count (fish caught or vessel trips) reported in cell h,
is the variance of the weighted total in h,
is the variance of the weighted grand total summed over all H cells.
Estimate standard errors were calculated as the square root of the variance: . Proportional standard errors (PSE) were calculated as the standard error divided by the estimate
expressed as percent: .
Confidence intervals at 95% level ( ), were calculated using the normal approximation:
. Total catch and harvest estimates were compared with historic MRFSS estimates and self-reported landings from the NOAA Fisheries Automated Landings Reporting System. The Kruskal-Wallis test was used to test for differences in catch rates between day and nighttime trips, trips returning to public and private access sites, and tournament and non-tournament trips. The non-parametric test was used because the data were not normally distributed. SAS 9.2 was used to conduct the data analysis, using the PROC FREQ NPAR1WAY, and MEANS procedures.
Florida Highly Migratory Species Private Angler Telephone Survey – Final Report
20
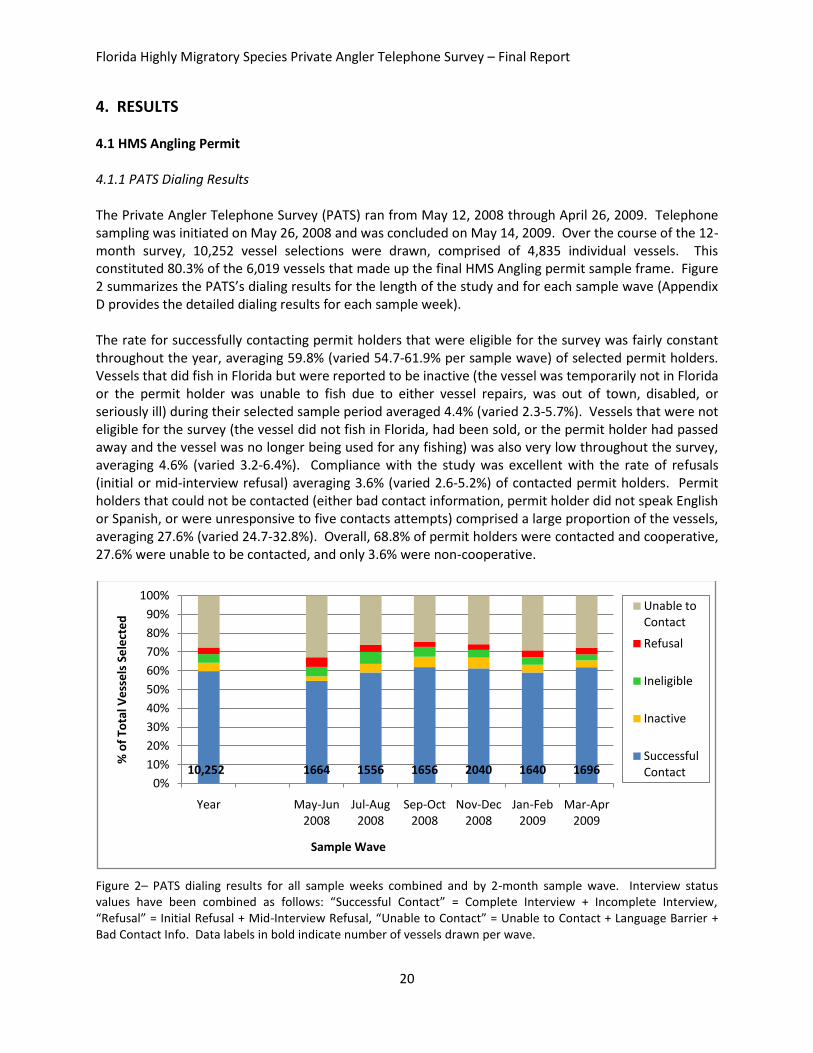
4. RESULTS 4.1 HMS Angling Permit 4.1.1 PATS Dialing Results The Private Angler Telephone Survey (PATS) ran from May 12, 2008 through April 26, 2009. Telephone sampling was initiated on May 26, 2008 and was concluded on May 14, 2009. Over the course of the 12-month survey, 10,252 vessel selections were drawn, comprised of 4,835 individual vessels. This constituted 80.3% of the 6,019 vessels that made up the final HMS Angling permit sample frame. Figure 2 summarizes the PATS’s dialing results for the length of the study and for each sample wave (Appendix D provides the detailed dialing results for each sample week). The rate for successfully contacting permit holders that were eligible for the survey was fairly constant throughout the year, averaging 59.8% (varied 54.7-61.9% per sample wave) of selected permit holders. Vessels that did fish in Florida but were reported to be inactive (the vessel was temporarily not in Florida or the permit holder was unable to fish due to either vessel repairs, was out of town, disabled, or seriously ill) during their selected sample period averaged 4.4% (varied 2.3-5.7%). Vessels that were not eligible for the survey (the vessel did not fish in Florida, had been sold, or the permit holder had passed away and the vessel was no longer being used for any fishing) was also very low throughout the survey, averaging 4.6% (varied 3.2-6.4%). Compliance with the study was excellent with the rate of refusals (initial or mid-interview refusal) averaging 3.6% (varied 2.6-5.2%) of contacted permit holders. Permit holders that could not be contacted (either bad contact information, permit holder did not speak English or Spanish, or were unresponsive to five contacts attempts) comprised a large proportion of the vessels, averaging 27.6% (varied 24.7-32.8%). Overall, 68.8% of permit holders were contacted and cooperative, 27.6% were unable to be contacted, and only 3.6% were non-cooperative.
Figure 2– PATS dialing results for all sample weeks combined and by 2-month sample wave. Interview status values have been combined as follows: “Successful Contact” = Complete Interview + Incomplete Interview, “Refusal” = Initial Refusal + Mid-Interview Refusal, “Unable to Contact” = Unable to Contact + Language Barrier + Bad Contact Info. Data labels in bold indicate number of vessels drawn per wave.
10,252 1664 1556 1656 2040 1640 16960%
10%
20%
30%
40%
50%
60%
70%
80%
90%
100%
Year May-Jun 2008
Jul-Aug 2008
Sep-Oct 2008
Nov-Dec 2008
Jan-Feb 2009
Mar-Apr 2009
% o
f To
tal V
ess
els
Se
lect
ed
Sample Wave
Unable to Contact
Refusal
Ineligible
Inactive
Successful Contact
Florida Highly Migratory Species Private Angler Telephone Survey – Final Report
21
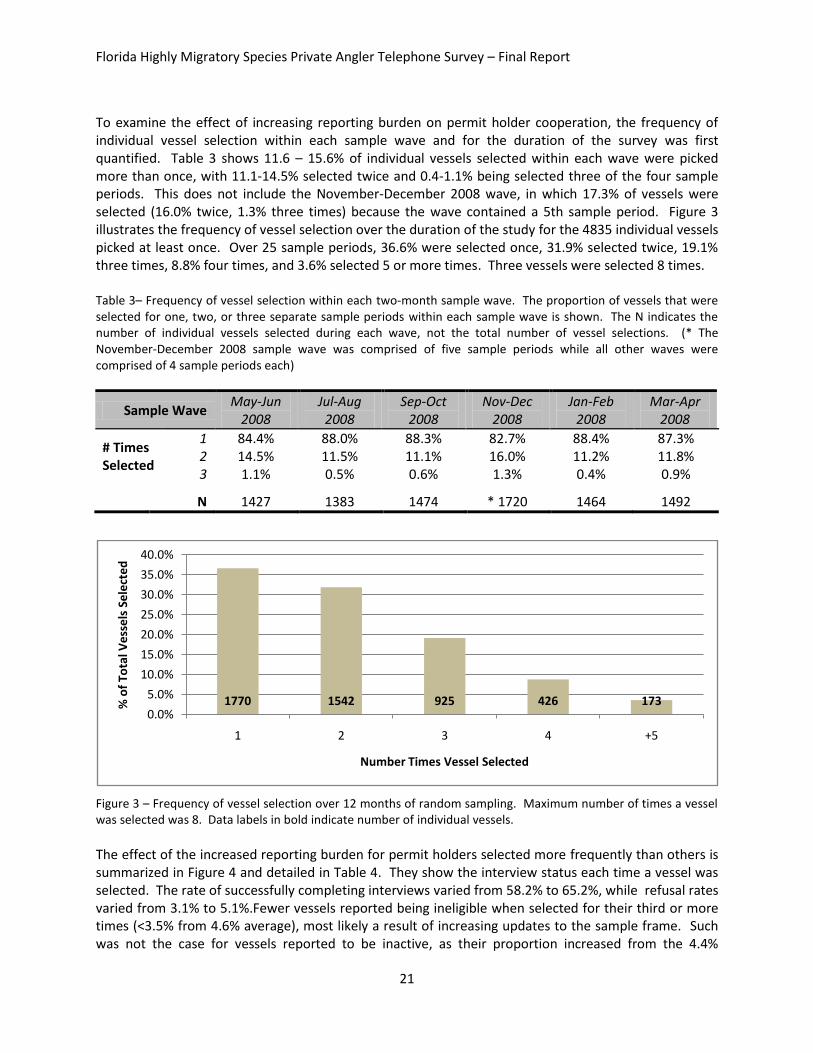
To examine the effect of increasing reporting burden on permit holder cooperation, the frequency of individual vessel selection within each sample wave and for the duration of the survey was first quantified. Table 3 shows 11.6 – 15.6% of individual vessels selected within each wave were picked more than once, with 11.1-14.5% selected twice and 0.4-1.1% being selected three of the four sample periods. This does not include the November-December 2008 wave, in which 17.3% of vessels were selected (16.0% twice, 1.3% three times) because the wave contained a 5th sample period. Figure 3 illustrates the frequency of vessel selection over the duration of the study for the 4835 individual vessels picked at least once. Over 25 sample periods, 36.6% were selected once, 31.9% selected twice, 19.1% three times, 8.8% four times, and 3.6% selected 5 or more times. Three vessels were selected 8 times. Table 3– Frequency of vessel selection within each two-month sample wave. The proportion of vessels that were selected for one, two, or three separate sample periods within each sample wave is shown. The N indicates the number of individual vessels selected during each wave, not the total number of vessel selections. (* The November-December 2008 sample wave was comprised of five sample periods while all other waves were comprised of 4 sample periods each)
Figure 3 – Frequency of vessel selection over 12 months of random sampling. Maximum number of times a vessel was selected was 8. Data labels in bold indicate number of individual vessels.
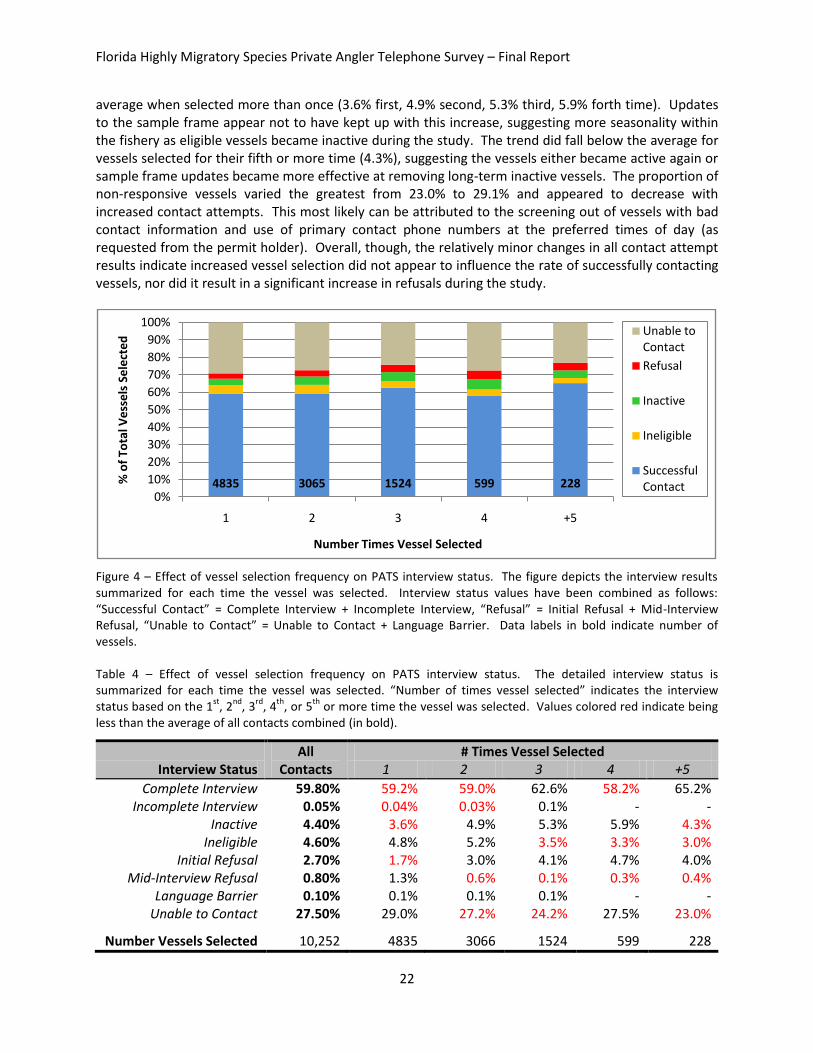
The effect of the increased reporting burden for permit holders selected more frequently than others is summarized in Figure 4 and detailed in Table 4. They show the interview status each time a vessel was selected. The rate of successfully completing interviews varied from 58.2% to 65.2%, while refusal rates varied from 3.1% to 5.1%.Fewer vessels reported being ineligible when selected for their third or more times (<3.5% from 4.6% average), most likely a result of increasing updates to the sample frame. Such was not the case for vessels reported to be inactive, as their proportion increased from the 4.4%
1770 1542 925 426 1730.0%
5.0%
10.0%
15.0%
20.0%
25.0%
30.0%
35.0%
40.0%
1 2 3 4 +5
% o
f To
tal V
ess
els
Se
lect
ed
Number Times Vessel Selected
Florida Highly Migratory Species Private Angler Telephone Survey – Final Report
22
average when selected more than once (3.6% first, 4.9% second, 5.3% third, 5.9% forth time). Updates to the sample frame appear not to have kept up with this increase, suggesting more seasonality within the fishery as eligible vessels became inactive during the study. The trend did fall below the average for vessels selected for their fifth or more time (4.3%), suggesting the vessels either became active again or sample frame updates became more effective at removing long-term inactive vessels. The proportion of non-responsive vessels varied the greatest from 23.0% to 29.1% and appeared to decrease with increased contact attempts. This most likely can be attributed to the screening out of vessels with bad contact information and use of primary contact phone numbers at the preferred times of day (as requested from the permit holder). Overall, though, the relatively minor changes in all contact attempt results indicate increased vessel selection did not appear to influence the rate of successfully contacting vessels, nor did it result in a significant increase in refusals during the study.
Figure 4 – Effect of vessel selection frequency on PATS interview status. The figure depicts the interview results summarized for each time the vessel was selected. Interview status values have been combined as follows: “Successful Contact” = Complete Interview + Incomplete Interview, “Refusal” = Initial Refusal + Mid-Interview Refusal, “Unable to Contact” = Unable to Contact + Language Barrier. Data labels in bold indicate number of vessels. Table 4 – Effect of vessel selection frequency on PATS interview status. The detailed interview status is summarized for each time the vessel was selected. “Number of times vessel selected” indicates the interview status based on the 1
st, 2
nd, 3
rd, 4
th, or 5
th or more time the vessel was selected. Values colored red indicate being
less than the average of all contacts combined (in bold).
Language Barrier 0.10% 0.1% 0.1% 0.1% - - Unable to Contact 27.50% 29.0% 27.2% 24.2% 27.5% 23.0%
Number Vessels Selected 10,252 4835 3066 1524 599 228
4835 3065 1524 599 2280%
10%
20%
30%
40%
50%
60%
70%
80%
90%
100%
1 2 3 4 +5
% o
f To
tal V
ess
els
Se
lect
ed
Number Times Vessel Selected
Unable to Contact
Refusal
Inactive
Ineligible
Successful Contact
Florida Highly Migratory Species Private Angler Telephone Survey – Final Report
23
Upon completion of the PATS, the final status of the 6,019 vessels that comprised the Angling sample frame for at least one sample wave is shown in Figure 5. State-wide, 52.1% of the permit holders were eligible for the survey and fully cooperative. Among the Florida subregions, the Keys had the lowest proportion of eligible permit holders (44.3%) and Northeast Florida (NEFL) had the highest (57.2%). Permit holders that were inactive or ineligible comprised 4.2% (range: 3.1% NEFL – 8.1% PanH) and 5.6% (range: 4.7% Keys & NEFL – 6.8% Southwest Florida - SWFL) of the sample frame, respectively, while non-cooperative permit holders made up only 2.1% (range: 0.2% NEFL – 2.8% Keys). Of the permit holders that could not be contacted, 4.0% (range: 3.6% SEFL & NEFL – 4.9% Panhandle - PanH) were due to bad contact information from the HMS permit registry and 12.3% (range: 9.9% PanH – 18.5% Keys) were non-responsive to all contact attempts. 19.3% (range: 17.4% SWFL – 22.5% PanH) of the vessels were not selected for the study, primarily because the permit holder first obtained an HMS permit towards the end of the study.
Figure 5– Final vessel status of all permit holders in Florida May 2009 by each Florida subregion. The final vessel status was determined by the following criteria: “Eligible” = vessels in which permit holder was successfully contacted at least once and contact information is accurate, “Inactive” = vessel is in Florida but will not be used for HMS fishing for the indefinite future, “Ineligible” = vessel is not in Florida or has been sold, “Non-Cooperative” = permit holder or vessel representative was non-cooperative during the last contact attempt, “Non-responsive” = permit holder was never successfully contacted, “Bad/Missing Info” = permit holder could not be contacted during the last attempt due to bad or missing contact info, “Unknown” = vessel was never selected for the PATS. Data labels in bold indicate number of vessels per FL subregion.
4.1.2 PATS Trip Data Analysis
A total of 10,252 vessel selections were drawn, selecting 4,835 unique vessels. Of these, 631 vessels reported 1,086 HMS trips in which they caught, or tried to catch, any billfish, swordfish, tunas, or sharks (Table 5). Six trips were dropped from the analysis due to insufficient information. Of 68.8% of selected vessels that were successfully interviewed (Figure 4), the proportion of contacted vessels reporting trips averaged 10.7%, varying from 7.3% during the March-April 2009 wave to 14.8% during the May-June 2008 wave. The lowest percentage of trips (3.5%) was reported in sample week 12 whereas the highest occurred in sample week 20 (18.5%). The number of trips per number of vessels successfully
6019 800 499 492 3420 8080%
10%
20%
30%
40%
50%
60%
70%
80%
90%
100%
FL PanH SWFL Keys SEFL NEFL
% o
f To
tal V
ess
els
Florida Subregion
Unknown
Bad/Missing Info
Non Responsive
NonCooperative
Ineligible
Inactive
Eligible
Florida Highly Migratory Species Private Angler Telephone Survey – Final Report
24
interviewed for the year was 1 trip per 6.5 vessels interviewed, with a range of 1 trip per 10.1 vessels interviewed during the September-October 2008 and March-April 2009 waves and 1 trip per 4.3 vessels interviewed during the May-June 2008 wave. The lowest activity ratio was reported during sample week 12 (1 trip : 22.2 vessels interviewed) and the highest activity during sample week 20 (1 trip : 3.1 vessels interviewed). The species composition for the 1,080 HMS trips reported is summarized in Figure 6. Trips were classified into four HMS groups (billfish, swordfish, tunas, and sharks) and combinations of HMS groups. The trip classification was determined by a species from the HMS group being reported as one of the trip’s three potential target species or the species was caught as bycatch while targeting a different HMS group or non-HMS species. Combination trips could entail both HMS groups being targeted, one targeted while the other was caught as bycatch, or both caught as bycatch while targeting non-HMS species. Billfish were the dominant HMS group, solely accounting for approximately half of all trips across Florida (48.4%). Swordfish accounted for the second largest proportion of trips (18.5%), followed by tuna (12.3%), shark (11.0%), and all combinations of HMS groups (9.7%). There were seasonal shifts in species composition; billfish trips varied from a low of 24.8% of all trips during the summer July-August 2008 wave, to a peak of 72.3% during the winter January-February 2009 wave. Swordfish trips varied from a low of 10.9% of all HMS trips during the late spring May-June 2008 wave to a high of 25.8% during the July-August 2008 wave. Tuna was least prevalent during the November-December 2008 wave (4.5%) and peaked during the May-June 2008 wave (25.9%). Shark trips accounted for a minimal proportion of HMS trips during the winter months (3.3%) and peaked during the summer (21.2%). No HMS group combination accounted for >5% of all HMS trips for the year, with Billfish/Tuna trips being the most common (4.7%). With the exception to billfish/tuna trips that occurred during the May-June 2008 wave (12.8 %), all other multiple HMS group trips accounted for < 10% of HMS trips within each wave. Consequently, all results for the remainder of this report are presented for individual HMS groups only. Multiple HMS group trips are reflected in both individual HMS groups’ summaries, whether they were targeted or caught as bycatch.
Florida Highly Migratory Species Private Angler Telephone Survey – Final Report
25
Table 5 – PATS reported trips for all sample weeks. Sample weeks are summarized by wave (bold), and sample waves are summarized by year. * Includes the same vessel reporting trips during multiple sample periods (Total number of vessels reporting trips 631)
Florida Highly Migratory Species Private Angler Telephone Survey – Final Report
26
Figure 6 – HMS Trip classification by HMS Species Group. Trip classification was determined by the HMS group being reported as one of the trip’s three target species or the HMS group was caught as bycatch while targeting a different HMS group or non-HMS species. Combination trips could entail both HMS groups being targeted, one targeted while the other was caught as bycatch, or both caught as bycatch while targeting non-HMS species. Data labels in bold represent number of reported trips per wave.
HMS trips were classified into five trip result categories:
Target only – trips in which an HMS species, genus, or family was one of three targeted preferences, but resulted in no catches of any HMS.
Bycatch only – trips in which only non-HMS species were targeted, and resulted in an HMS species being unintentionally caught.
Target with catch - trips in which an HMS species, genus, or family was one of three targeted preferences, and resulted in a species from the targeted HMS group being caught.
Target with bycatch only - trips in which an HMS species, genus, or family was one of three targeted preferences, but resulted in no catches of species from the targeted HMS group while a species from a non-targeted HMS group was unintentionally caught.
Target with catch and bycatch - trips in which an HMS species, genus, or family was one of three targeted preferences, and resulted in both a species from the targeted HMS group and a species from a non-targeted HMS group being caught.
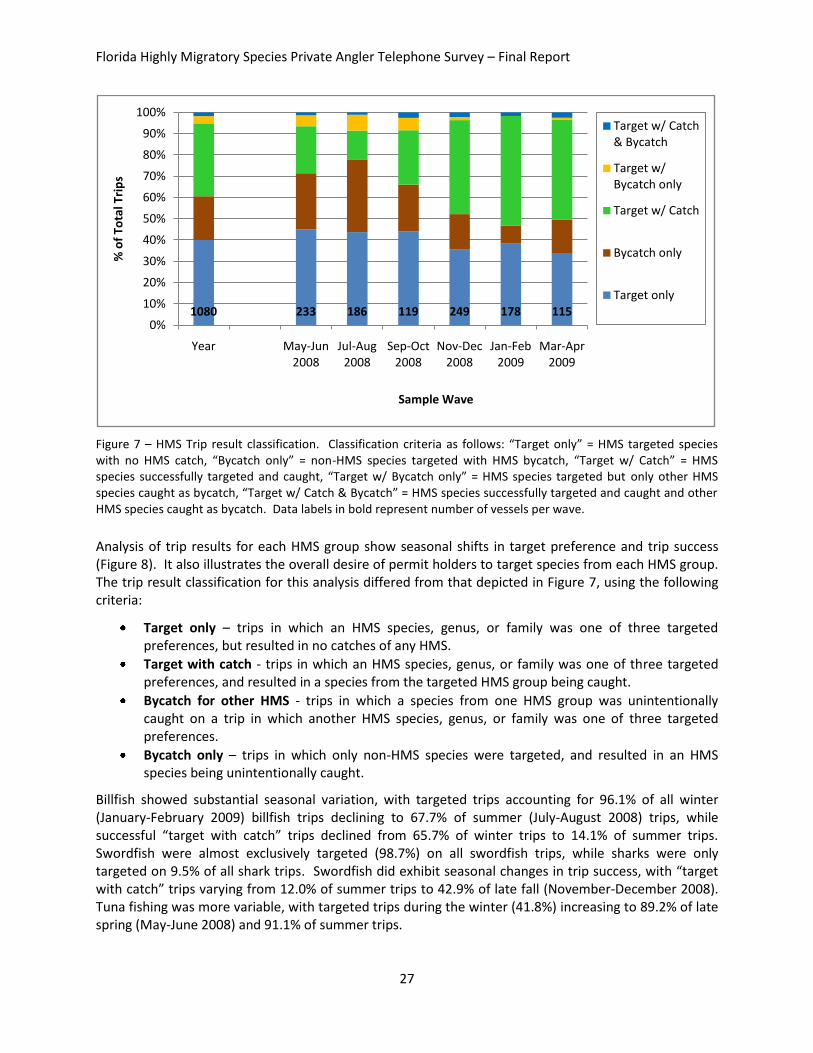
Results from all HMS trips are summarized for all HMS groups combined in Figure 7. “Target only” were the most common, accounting for 40.0% of all trips, followed by “target with catch” (34.3%), “bycatch only” (20.6%), “target with bycatch only” (3.4%), and “target with catch and bycatch” (1.8%). Seasonal shifts in “bycatch only” trips were apparent, increasing from 8.5% during the winter (January-February 2009) to 34.2% in the summer (July-August 2008). Likewise, “target with catch” trips showed the opposite tendency, increasing from 13.5% in the summer to a peak 51.5% of all trips in the winter.
1080 233 186 119 249 178 1150%
10%
20%
30%
40%
50%
60%
70%
80%
90%
100%
Year May-Jun 2008
Jul-Aug 2008
Sep-Oct 2008
Nov-Dec 2008
Jan-Feb 2009
Mar-Apr 2009
% o
f To
tal T
rip
s
Sample Wave
Misc HMS Combos
Shark
Shark/Tuna
Tuna
Bill/Tuna
Bill
Sword
Florida Highly Migratory Species Private Angler Telephone Survey – Final Report
27
Figure 7 – HMS Trip result classification. Classification criteria as follows: “Target only” = HMS targeted species with no HMS catch, “Bycatch only” = non-HMS species targeted with HMS bycatch, “Target w/ Catch” = HMS species successfully targeted and caught, “Target w/ Bycatch only” = HMS species targeted but only other HMS species caught as bycatch, “Target w/ Catch & Bycatch” = HMS species successfully targeted and caught and other HMS species caught as bycatch. Data labels in bold represent number of vessels per wave.
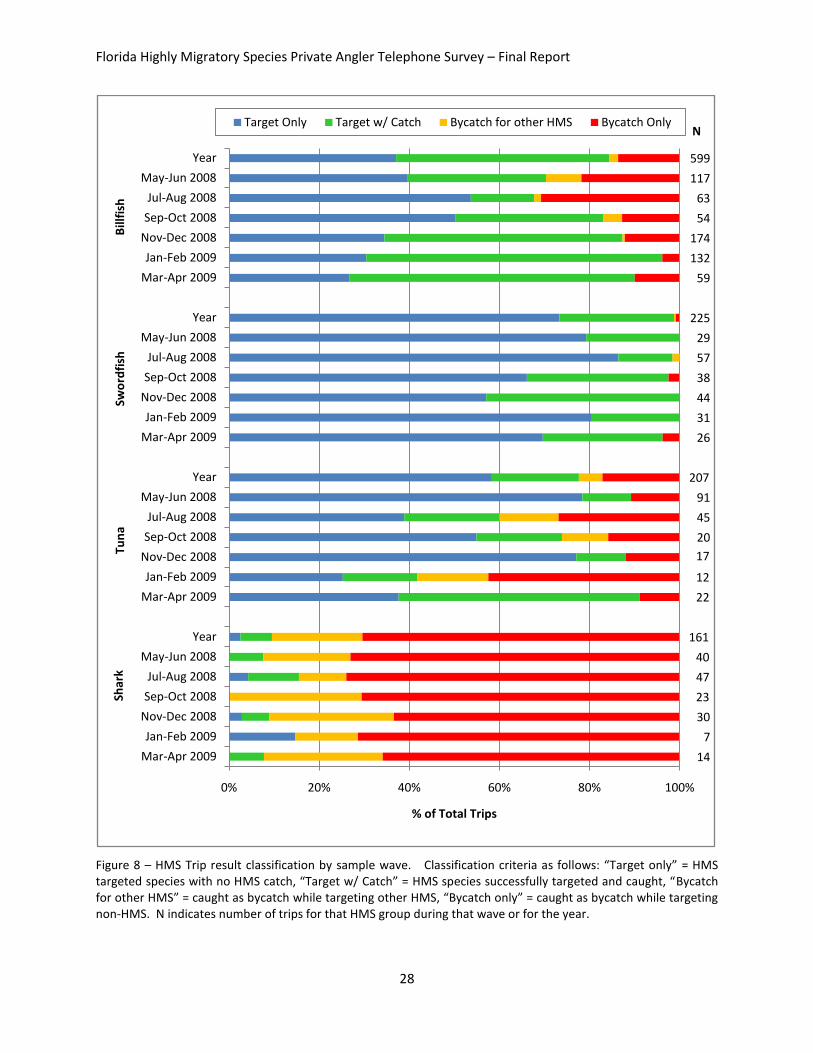
Analysis of trip results for each HMS group show seasonal shifts in target preference and trip success (Figure 8). It also illustrates the overall desire of permit holders to target species from each HMS group. The trip result classification for this analysis differed from that depicted in Figure 7, using the following criteria:
Target only – trips in which an HMS species, genus, or family was one of three targeted preferences, but resulted in no catches of any HMS.
Target with catch - trips in which an HMS species, genus, or family was one of three targeted preferences, and resulted in a species from the targeted HMS group being caught.
Bycatch for other HMS - trips in which a species from one HMS group was unintentionally caught on a trip in which another HMS species, genus, or family was one of three targeted preferences.
Bycatch only – trips in which only non-HMS species were targeted, and resulted in an HMS species being unintentionally caught.
Billfish showed substantial seasonal variation, with targeted trips accounting for 96.1% of all winter (January-February 2009) billfish trips declining to 67.7% of summer (July-August 2008) trips, while successful “target with catch” trips declined from 65.7% of winter trips to 14.1% of summer trips. Swordfish were almost exclusively targeted (98.7%) on all swordfish trips, while sharks were only targeted on 9.5% of all shark trips. Swordfish did exhibit seasonal changes in trip success, with “target with catch” trips varying from 12.0% of summer trips to 42.9% of late fall (November-December 2008). Tuna fishing was more variable, with targeted trips during the winter (41.8%) increasing to 89.2% of late spring (May-June 2008) and 91.1% of summer trips.
1080 233 186 119 249 178 1150%
10%
20%
30%
40%
50%
60%
70%
80%
90%
100%
Year May-Jun 2008
Jul-Aug 2008
Sep-Oct 2008
Nov-Dec 2008
Jan-Feb 2009
Mar-Apr 2009
% o
f To
tal T
rip
s
Sample Wave
Target w/ Catch & Bycatch
Target w/ Bycatch only
Target w/ Catch
Bycatch only
Target only
Florida Highly Migratory Species Private Angler Telephone Survey – Final Report
28
Figure 8 – HMS Trip result classification by sample wave. Classification criteria as follows: “Target only” = HMS targeted species with no HMS catch, “Target w/ Catch” = HMS species successfully targeted and caught, “Bycatch for other HMS” = caught as bycatch while targeting other HMS, “Bycatch only” = caught as bycatch while targeting non-HMS. N indicates number of trips for that HMS group during that wave or for the year.
14
7
30
23
47
40
161
22
12
17
20
45
91
207
26
31
44
38
57
29
225
59
132
174
54
63
117
599
0% 20% 40% 60% 80% 100%
Mar-Apr 2009
Jan-Feb 2009
Nov-Dec 2008
Sep-Oct 2008
Jul-Aug 2008
May-Jun 2008
Year
Mar-Apr 2009
Jan-Feb 2009
Nov-Dec 2008
Sep-Oct 2008
Jul-Aug 2008
May-Jun 2008
Year
Mar-Apr 2009
Jan-Feb 2009
Nov-Dec 2008
Sep-Oct 2008
Jul-Aug 2008
May-Jun 2008
Year
Mar-Apr 2009
Jan-Feb 2009
Nov-Dec 2008
Sep-Oct 2008
Jul-Aug 2008
May-Jun 2008
Year
% of Total Trips
Shar
kTarget Only Target w/ Catch Bycatch for other HMS Bycatch Only
Tun
aSw
ord
fish
Bill
fish
N
Florida Highly Migratory Species Private Angler Telephone Survey – Final Report
29
Based on the total number of HMS trips reported, there were seasonal shifts in overall fishing activity for HMS and for the separate HMS groups (Figure 9). Assuming a uniform distribution of effort would equal 16.7% across the six sample waves, fishing activity started high in the late spring (May-June 2008) accounting for 18.6% of all HMS trips. It declined slightly during the summer (17.7%) before dropping off in the early fall (September-October 2008) to only 11.0% of all HMS trips. Activity sharply increased in the late fall (November-December 2008), accounting for 23.8% of all HMS trips, before steadily declining over the winter (17.8%) and dropping off again in the early spring (11.1%). It should be noted the November-December 2008 sample wave was unique in that it was comprised of five sample periods compared to four in the other waves. Nonetheless, this time period would be still have been the busiest; even if activity was down-weighted by 0.8 to make it equivalent to the other waves, it still accounted for more fishing activity than the next busiest wave, May-June 2008. Additionally, the study area experienced rough seas and high winds for extended periods of time during both the September-October 2008 and March-April 2009 sample waves that limited opportunities for offshore angling. Among the HMS groups, billfish fishing activity started relatively flat, accounting for 16.5% of all billfish trips, dropped off substantially during the summer (10.9%) and early fall (8.9%), and then peaked in the late fall (30.0%) and winter months (23.5%) before declining again in the late spring (10.3%). Swordfish fishing activity peaked in the summer months (24.8% of all swordfish trips), remained fairly active throughout the fall (>16.7%), then dropped off during the winter and early spring. Tuna fishing activity peaked in the late spring (39.9% of all tuna trips) and steadily declined over the rest of year before showing indications of picking back up in the survey’s last sample wave. Shark fishing activity followed a similar pattern, peaking in the late spring and summer (21.8% and 30.8% of all shark trips, respectively) and subsequently dropping off to reduced activity levels for the rest of the 12 month study. Keeping in mind that this was only a 12-month study, the seasonal pattern of higher fishing activity for each HMS group in Florida appears to be sailfish during the late fall and winter, marlin, tuna and shark during the spring and summer, and swordfish during the summer and fall.
Florida Highly Migratory Species Private Angler Telephone Survey – Final Report
30
Figure 9 – Temporal distribution of HMS trips by two-month sample waves for each HMS group. The top graph is a summary of all HMS trips combined while the remaining graphs show the proportion of trips within each HMS group by wave. The N in the lower left corner of each graph indicates the total number of vessel trips for each HMS group. (*Wave Nov-Dec 2008 had 5 sample periods)
Florida Highly Migratory Species Private Angler Telephone Survey – Final Report
31
The distribution of HMS trips across Florida was primarily concentrated in Southeast FL (SEFL), accounting for 67.9% of all HMS trips (Figure 10). The Keys reported the second highest number of trips (18.2%), followed by the Panhandle (PanH – 6.4%), Northeast FL (NEFL – 5.9%), and Southwest FL (SWFL – 1.6%). There were differences in the distribution of trips for each HMS group. Whereas billfish followed a similar distribution pattern to that of all HMS trips combined, swordfish trips were even more concentrated in SEFL (82.0% of all swordfish trips), while being completely absent from SWFL. Tuna trips were not as clustered in SEFL (48.9% of all tuna trips), with the Keys (32.0%) and the PanH (10.2%) accounting for a greater share. Sharks trips exhibited the broadest distribution, with only 38.4% of all shark trips occurring in SEFL, followed by the PanH (23.1%), NEFL (16.4%), the Keys (13.4%), and SWFL (8.8%). Despite the very low number of total trips, shark trips accounted for the most HMS trips among the HMS groups in the PanH (39 trips) and SWFL (13 trips).
Figure 10 – Spatial distribution of HMS trips across the 5 Florida subregions. The figure on the left is a summary of all HMS trips combined while the figure on the right shows each HMS group. Data labels in bold on left figure indicate percentage of total vessel trips for the year for each Florida subregion.
The temporal distribution of vessels returning from HMS trips over a 24-hour time period is summarized in Figure 11. Vessels returned at all hours of the day, with the 3:01 pm to 6:00 pm time period being the most common for all HMS groups except swordfish (all HMS – 44.2%, Billfish - 47.0%, Tuna - 53.2%, Shark - 49.0%). The noon to 3:00 pm and 6:01 pm to 9:00 pm time periods were next most common return times for billfish (37.3% and 9.6%), tunas (23.8% and 15.2%), and sharks (25.9% and 15.9%). The 6:01 pm to 9:00 pm time period accounted for a greater proportion of trips for both tunas and sharks than it did for billfish. The midnight to 3:00 am time period was the most common return time for swordfish (27.5%), followed by the 3:01 pm to 6:00 pm (24.0%) and 3:01 am to 6 am (14.7%) time periods. Vessel return times were also analyzed to detect any seasonal differences, but there were few apparent shifts. The only discernable change (that was not a result of low sample size) occurred during the May-
6.4% 1.6% 18.2% 67.9% 5.9%0
100
200
300
400
500
600
700
800
PanH SWFL Keys SEFL NEFL
Nu
mb
er
Trip
s
Florida Subregion
HMS
0
50
100
150
200
250
300
350
400
450
500
PanH SWFL Keys SEFL NEFL
Florida Subregion
Billfish Sword Tuna Shark
Florida Highly Migratory Species Private Angler Telephone Survey – Final Report
32
June 2008 wave in which 27.9% of billfish trips ended between 6:01 pm – 9:00 pm compared to an average of 9.6% over the length of the study. This change was more a result of a regional difference as both the PanH and NEFL reported their most billfish trips during that time period, and return times in these sub-regions were much later compared to other areas of the state. Billfish trips returning between 6:01 pm – 9:00 pm accounted for 42.6% of PanH and 27.4% of NEFL trips, compared to < 8% in the Keys and SEFL which constituted the overwhelming majority of billfish trips. Vessels on tuna trips in the PanH and NEFL also tended to return later, with trips ending between 6:01 pm – 9:00 pm accounting for 22.8% of PanH (plus an additional 14.9% returning between 9:01 pm – midnight) and 26.4% of NEFL trips, compared to 15.2% of Keys and 12.7% of SEFL tuna trips.
Figure 11 – Temporal distribution of trip return times by HMS group. Trip return times are summarized in 3-hour increments over a 24-hour cycle. The N indicates number of trips for each HMS group.
The broad distribution of swordfish trip return times occurring both during the day and night are better illustrated in Figure 12. Trips that ended between 8:01 pm and 7:59 am were considered “nighttime” returns. Nighttime returns accounted for 58.4% of all swordfish trips, compared to less than 5% for all billfish, tuna, and shark trips. Additionally, there were regional differences with all swordfish trips in the PanH and NEFL returning during daytime hours compared to only 36.2% in SEFL. The distribution of return times during daytime swordfish trips in SEFL was also significantly different, with only 6.7% of all SEFL swordfish trips returning between 9:01 am – 3:00 pm compared to 21.3% between 3:01 pm – 6:00 pm (nearly 60% of all daytime trips). In comparison, billfish trips tended to end in nearly equal proportions, with 43.9% returning between 12:01 pm – 3:00 pm and 42.4% between 3:01 pm – 6:00 pm. The significance of this for a field intercept survey could possibly mean most daytime swordfish trips would be sampled within a more narrow time period compared to other HMS in SEFL.
0.0%
10.0%
20.0%
30.0%
40.0%
50.0%
60.0%
% o
f To
tal T
rip
s
Trip Return Time
HMS Billfish Sword Tuna Shark
N = 1077 N = 598 N = 225 N = 207 N = 159
Florida Highly Migratory Species Private Angler Telephone Survey – Final Report
33
Figure 12 – Comparison of daytime vs. nighttime trips based on the vessel’s return time. Daytime trips were classified as those that returned to the access site between 8 am and 8 pm while nighttime trips were those that returned to the access site between 8:01 pm and 7:59 am. The N indicates number of trips for each HMS group.
The use of private access sites inaccessible to the MRFSS field intercept survey for HMS fishing was substantial, accounting for 47.4 % of all HMS trips (range 43.0% sharks – 54.8% tunas) (Figure 13). In addition, 12.0% of reported HMS trips utilized public access sites that could not be matched to a known site on the MRFSS site registry for either East Florida or West Florida (range 7.7% swordfish – 16.0% sharks). Some of these sites are believed to be MRFSS sites, because the permit holder would only say the site was a public boat ramp located in a particular city or county. This means that, depending on the status of these unmatched public sites, anywhere between 40.5% to 52.5 % of all HMS trips returned to access sites in which a traditional dock-side survey could potentially intercept these anglers.
Figure 13 – Comparison of trips returning to public access sites vs. private access sites for each HMS group. “MRFSS sites” are sites that have been matched up with known sites on the MRFSS sites registry, “Public Access – unknown MRFSS sites” are sites that were reported to be public access by the permit holder, but the site name could not be determined or matched up with a known site already on the MRFSS site registry, and “Private Access” are sites that are not sampled by the MRFSS. The N indicates number of trips for each HMS group.
A total of 85 tournament trips were reported during the PATS, accounting for 7.6% of all HMS trips (Figure 14). Among the HMS groups, the largest proportion of tournament fishing was reported during billfish trips (9.9%), followed by swordfish (7.2%), tuna (5.0%), and shark (4.1%) trips. Permit holders provided tournament names for 56 trips, from which 26 separate tournaments were identified. Of these, 13 were registered with the HMS Management Division as required by NOAA Fisheries for any tournament in which HMS are targeted. In addition, eight tournaments in which the permit holder did not provide the name were also successfully matched up to the NOAA Fisheries tournament registry by a combination of the city, date, and target species. All remaining tournaments were considered
159
207
225
598
0% 10% 20% 30% 40% 50% 60% 70% 80% 90% 100%
Shark
Tuna
Sword
Billfish
% of Total Trips
Day = Return Time 08:00 - 20:00 Night = Return Time 20:01 - 07:59
N
160
198
222
589
1065
0% 10% 20% 30% 40% 50% 60% 70% 80% 90% 100%
Shark
Tuna
Sword
Billfish
HMS
% of Total Trips
MRFSS sites Public Access - unknown MRFSS sites Private Access
N
Florida Highly Migratory Species Private Angler Telephone Survey – Final Report
34
unregistered, including 13 in which tournament names were provided and 12 others without, due to the absence of a NOAA Fisheries-registered tournament having taken place anywhere in the vicinity of the trip on the same day. Tournament trips occurring on consecutive days with similar targeted species were considered to be the same tournament for those in which no tournament information was provided. Of all the tournaments combined, only 51.3% were registered with NOAA Fisheries (not including six tournaments targeting non-HMS species that were not required to register with NOAA Fisheries) (Table 6). Appendix F lists all tournaments HMS permit holders reported to have participated in during the PATS and identifies NOAA Fisheries-registered tournaments. The proportion of tournaments by targeted HMS group is shown in Table 6. Since some tournaments targeted multiple species from multiple HMS groups, the proportion of these tournaments was also calculated. Billfish were the primary target of HMS tournament anglers, accounting for 46.2% of all tournaments, followed by swordfish (30.8%), tuna (10.3%), and billfish-tuna (7.7%). There was only 1 tournament in which sharks were targeted (shortfin mako) and another targeting billfish-swordfish (2.6%).
Figure 14 – Comparison of tournament vs. non-tournament trips for each HMS group. The N indicates number of trips for each HMS group. Table 6 – The types of tournaments permit holders participated in during the 85 tournament trips reported throughout the PATS. Tournaments are listed by the HMS group of the target species reported by the permit holder, as well as by HMS group combinations when multiple HMS groups were targeted. Tournaments that matched up with NOAA Fisheries HMS Management Division tournament registry are listed in the “Registered” column by their number and proportion of all tournaments, while those that could not be matched are listed in the “Unregistered” column. All “registered” and “unregistered” tournaments are combined in the “All Tournament” column. (* Does not include 6 non-HMS tournaments that were not required to register with NOAA Fisheries)
Tournament Target Species
Registered Tournaments Unregistered Tournaments All Tournaments
# % # % # %
Billfish 9 50.% 9 50.0% 18 46.2%
Swordfish 7 58.3% 5 41.7% 12 30.8%
Tuna 1 25.0% 3 75.0% 4 10.3%
Shark - - 1 100% 1 2.6%
Billfish/Sword 1 100% - - 1 2.6%
Billfish/Tuna 2 66.7% 1 33.3% 3 7.7%
TOTAL 20 51.3% *19 48.7% *39 100%
161
207225599
1080
0% 10% 20% 30% 40% 50% 60% 70% 80% 90% 100%
SharkTuna
SwordBillfish
HMS
% of Total Trips
Tournament Non-Tournament
N
Florida Highly Migratory Species Private Angler Telephone Survey – Final Report
35
Catch and effort estimation for this study was determined using the number of vessel trips captured in the PATS. The number of anglers per trip had no bearing on the estimation of effort, but is reported as a reference for comparison with angler-based surveys, such as the MRFSS. Figure 15 shows the distribution of the number anglers per HMS trip for all HMS groups combined, which varied from 1 to 11 anglers with a mean of 3.3 anglers (±0.17). Of these trips, 80.5% carried 2 to 4 anglers.
Figure 15 – Distribution of the number of anglers per trip for all HMS trips. Number of trips = 1072
The temporal distribution of trips across a 7-day week is important to the development of future surveys in determining the correct proportion of weekday and weekend trips. This will determine how sampling efforts are distributed to reflect the fishery’s level of activity. For example, the MRFSS draws roughly 50% of its field assignments to be conducted on weekends and holidays. HMS trips were distributed nearly equally, with 52.9% of all trips occurring on the weekend (not including holidays) (Figure 16). Tuna and shark trips were equally distributed (50.0% and 50.2% weekend trips, respectively). Billfish trips were more common on weekend days (57.4%), while swordfish trips were less common (41.3%).
Figure 16 – Distribution of trips occurring on weekdays or weekends. Due to the large proportion of swordfish trips occurring at night, Friday night trips (8:01 pm to 07:59 am the next morning) were included in the swordfish analysis and should be interpreted as a separate type of weekend trip. The N indicates the number of trips. The duration of HMS trips varied greatly (Figure 17). Trip lengths for all HMS trips combined varied from 1 to 60.5 hours, with a mean of 8.7 hours (±0.7). Of these trips, 75.5% lasted between 4.5 to 10 hours, while only 2.3% lasted more than 24 hours.
0.0%5.0%
10.0%15.0%20.0%25.0%30.0%35.0%
1 2 3 4 5 6 +7
% o
f To
tal T
rip
s
Number Anglers per Trip
160
207
225
599
1079
0% 10% 20% 30% 40% 50% 60% 70% 80% 90% 100%
Shark
Tuna
Sword
Billfish
HMS
% of Total Trips
Weekday WeekendN
Florida Highly Migratory Species Private Angler Telephone Survey – Final Report
36
Figure 17 – Distribution of total trip time for all HMS trips. Number of trips = 1077
The duration of fishing time (lines in the water) for HMS trips also varied greatly (Figure 18). Fishing time for all HMS trips combined varied from 0.5 to 48 hours, with a mean of 6.3 hours (±0.5). Of these trips, 76.6% reported 3.5 to 8 hours of fishing time, whereas only 1.0% reported fishing time of more than 24 hours.
Figure 18 – Length of fishing time per trip for all HMS trips. Number of trips = 1077
Despite only 2.3% of all trips lasting more than 24 hours (Figure 19), a considerable portion of HMS trips (13.3%) extended into the next day (Figure 20). “Multiday” trips are defined as those that continue past midnight into the next day and potentially several days afterwards. For billfish, they comprised only a small portion of trips (2.3%), but did make up 9.5% of tuna and 8.6% of shark trips. The frequency of night fishing for swordfish resulted in 53.9% of all swordfish trips being classified as multiday trips. The significance of this pertains to the estimation of effort by existing surveys, such as the For-Hire Telephone Survey (FHTS). The FHTS counts multiday trips as two or more trips, depending on the return day, but regardless of the return time or trip duration. This may be appropriate for traditional daytime fishing trips, but not for overnight fishing trips that may end only an hour or two after midnight (i.e. swordfish trips). A more informative classification is one in which multiday trips are separated into “overnight” trips (those ending before 08:00 am), “next day” trips (those ending at 08:00 am or later but within 24 hours
0.0%
5.0%
10.0%
15.0%
20.0%%
of
Tota
l Tri
ps
Total Trip Time (hours)
0.0%
5.0%
10.0%
15.0%
20.0%
% o
f To
tal T
rip
s
Total Trip Fishing Time (hours)
Florida Highly Migratory Species Private Angler Telephone Survey – Final Report
37
of departure), and true “multiday” (those ending more than 24 hours after departure). Under such a classification, 43.8% of all swordfish trips would be considered overnight, 6.6% next day, and 3.6% multiday. Along those lines, 3.6% of shark trips would also be considered overnight, and only 3.6% true multiday. 7.1% of tuna trips would also be considered multiday trips, the largest proportion for any HMS group.
Figure 19 – Distribution of single day trips vs. multiday trips. The top figure classifies single day trips as those that ended by midnight (24:00) and multiday trips as those that ended anytime afterwards. The bottom graphs further classifies the multiday trips into three subcategories: “Overnight” = trips that started one day and ended before 08:00 am the following morning, “Next day < 24hr” = trips that start one day and end the next day at 08:00 am or later but within 24 hours of the departure, “Multiday” = trips that exceed 24 hours in duration. The N indicates number of trips for each HMS group.
There was some variability in the spatial distribution of the areas fished for all HMS groups (Figure 20). Most trips took place in the Atlantic Ocean (90.0% of all HMS trips) primarily due to the disproportionate number of permit holders being located in SEFL. Fishing in the Atlantic accounted for an even greater proportion of billfish (96.4%) and swordfish trips (95.6%), but a much smaller percentage of trips for tunas (82.6%) and sharks (62.7%). Shark trips frequently occurred in the Gulf of Mexico (34.8%), but this was mostly due to sharks being caught on non-HMS targeted trips seeking groupers (Family Serranidae), snappers (Family Lutjanidae), mackerels (Family Scombridae), cobia (Rachycentron canadum), red drum (Sciaenops ocellatus), and dolphin (Coryphaena hippurus). This is in contrast to the 12.7% of all tuna trips also conducted in the Gulf of Mexico; all of which were targeted trips, including 15 of the 26 trips being long-range trips specifically targeting yellowfin tuna (Thunnus albacores).
159
207
225
598
1077
0% 10% 20% 30% 40% 50% 60% 70% 80% 90% 100%
Shark
Tuna
Sword
Billfish
HMS
Day Trip Multiday Trip
N
159
207
225598
1077
0% 10% 20% 30% 40% 50% 60% 70% 80% 90% 100%
Shark
Tuna
Sword
Billfish
HMS
% of Total Trips
Day Overnight Next day < 24 hr Multiday > 24 hrN
Florida Highly Migratory Species Private Angler Telephone Survey – Final Report
38
Figure 20 – Distribution of area fished for each HMS group within each Florida subregion. The N indicates number of trips for each HMS group.
Differences in the spatial distribution of the fishing grounds for all HMS groups are shown in Figure 21. The distance from shore vessels traveled were consolidated into the following categories: State waters (<3 miles in the Atlantic and <10 miles in the Gulf of Mexico – includes all inshore trips), U.S. waters in 25 miles increments from shore out to 100 miles, U.S. waters outside 100 miles, and Bahamian waters. Most HMS trips occurred in Federal waters within 25 miles from shore (51.7%), followed by State waters (30.1%). Most swordfish (82.1%), tuna (42.1%) and shark (47.5%) trips fished in Federal waters within 25 miles from shore. Tuna trips tended to travel greater distances from shore, with 44.7% of tuna trips taking place in U.S. waters outside 50 miles and only 8.5% in State waters. In contrast, nearly half of all billfish trips occurred within State waters (45.6%), as well as a large proportion of shark trips (29.3%). A federal permit (HMS or Atlantic Tunas) is required to fish for and harvest tunas within the management unit including state waters; however, a federal permit may not be required to target or land some other HMS caught in state waters (NOAA Fisheries, HMS Management Division, personal communication). Florida regulations described in FWC rule 68B-33.005, F.A.C. only require that landed billfish and swordfish are reported to NOAA Fisheries. This confirmation of substantial fishing activity by permit holders outside the jurisdiction of the HMS permit strongly suggests there may also be considerable fishing pressure by non-federally permitted vessels within State waters. It should also be noted that 4.7% of tuna trips were in Bahamian waters, primarily targeting yellowfin tuna. These trips were only deemed within the survey’s scope because the vessels did not stop at a Bahamian port before returning to their home access site in Florida. Many other Bahamian trips were reported to samplers, but were excluded from the survey because these vessels stopped in the Bahamian port before returning to the U.S., thereby officially landing the fish in the Bahamas. In addition to the Bahamas trips, 8.8% of all tuna trips traveled distances > 76 miles from their Florida access site to fish in U.S. waters north of the Bahamas (Figure 22). Most of these trips were also targeting yellowfin tuna. To complicate matters, numerous permit holders reported confusion as to whether they were fishing in Bahamian waters or the U.S. E.E.Z. Such confusion on the part of the angler may result in some long-range trips being wrongly included from or excluded in the MRFSS due to misreporting of waters fished.
161
207
225
599
1080
0% 10% 20% 30% 40% 50% 60% 70% 80% 90% 100%
Shark
Tuna
Sword
Billfish
HMS
% of Total Trips
Atlantic Gulf of Mexico Florida Bay Inshore Bahamas
N
Florida Highly Migratory Species Private Angler Telephone Survey – Final Report
39
Figure 21 – Distribution of trips pertaining to the primary distance from shore where most fishing occurred for each HMS group. Trips are classified as occurring inside state waters (< 3 miles from shore in the Atlantic and < 10 miles from shore in the Gulf of Mexico), in increments of 25miles from shore in Federal waters, and outside U.S. territorial waters in the Bahamas. The N indicates number of trips for each HMS group.
Figure 22 – Map of approximate YFT fishing grounds north of Bahamas frequented by HMS permit holders conducting single day trips that return to FL ports.
0.0%
10.0%
20.0%
30.0%
40.0%
50.0%
60.0%
70.0%
80.0%
90.0%
% o
f To
tal T
rip
s
Distance From Shore (miles)
HMS Billfish Sword Tuna Shark
N = 1080 N = 599 N = 225 N = 207 N = 161
Florida Highly Migratory Species Private Angler Telephone Survey – Final Report
40
In conjunction with the previously described variability among HMS groups in the areas fished, Figure 23 illustrates the differences in the bottom depth of the fishing grounds. The primary fishing depth for each trip was consolidated into 100 ft increments out to 1000 ft, 500 ft increments from 1000 to 2000 ft, and in waters deeper than 2000 ft. There were considerable differences between the HMS groups, with shark trips primarily occurring inside 100 ft depths (43.5%), billfish within 100 to 199 ft (56.0%), tunas within 1000 to 1499 ft (21.5%), and swordfish within 1500 to 1999 ft (47.3%). Most swordfish trips (85.2%) operated between 1000 to 1999 ft, while 82.7% of billfish and 88.1% of shark trips stayed within 400 ft. Tuna fishing was distributed across the broadest range of depths, with 29.1% within 500 ft, 29.2% between 500 to 999 ft, 29.4% between 1000 to 1999 ft, and 12.3% in waters deeper than 2000 ft.
Figure 23 –Distribution of trips pertaining to the bottom depth where most fishing occurred for each HMS group. Trips are classified in 100ft depth increments up to 1000ft, then 500ft increments up to 2000ft, and trips occurring over depths > 2000ft. The N indicates number of trips for each HMS group.
The variability in depth was matched by variability in the fishing methods employed to catch each HMS group (Figure 24). Permit holders were asked to provide the primary and secondary fishing methods employed on each trip. Trolling was the most commonly employed primary fishing method as it was used on 46.2% of all HMS trips. Drift fishing was the next most common (24.6%), followed by kite-fishing (17.9%), bottom-fishing (7.9%), deep-drop fishing (2.8%), and other methods that included casting, chumming, and live-baiting (0.6%). Among the HMS groups, trolling and kite-fishing were primarily employed during billfish trips (51.8% and 31.5%, respectively), while trolling was used on 91.4% of all tuna trips. Bottom fishing was the most common method on shark trips (41.4%), followed by trolling and drifting (26.5% each). Since most of these trips were bycatch trips, though, it should be noted that the few trips in which sharks were targeted, bottom-fishing and drifting were the preferred methods. Drifting was the preferred method during swordfish trips, accounting for 64.0% of all trips. Trolling was the next most common fishing method employed on swordfish trips (14.0%), followed by deep-dropping (13.3%) and bottom fishing (8.7%). ”Deep-dropping”, is a new fishing method that is rapidly gaining in popularity throughout the swordfish community, both recreational and commercial. In essence, it is a hybrid version of drift and bottom
0.0%
10.0%
20.0%
30.0%
40.0%
50.0%
60.0%
% o
f To
tal T
rip
s
Primary Fishing Depth (feet)
HMS Billfish Sword Tuna Shark
N = 1080 N = 599 N = 225 N = 207 N = 161
Florida Highly Migratory Species Private Angler Telephone Survey – Final Report
41
fishing, only it is employed in what is traditionally considered extreme depths for recreational anglers. It entails deploying a single rigged bait to or near the bottom in depths typically exceeding 1000 ft as the boat slowly drifts along with the current (Suroviec, 2007). Electric reels are frequently used to help bring in the line once a fish takes the bait. Deep-drop fishing is primarily employed during daylight hours when swordfish tend to aggregate near the bottom, and is believed to be a more efficient method among recreational anglers because the narrow vertical distribution of the fish enables them to be targeted more easily. Unfortunately, the extent of deep-drop fishing cannot be fully determined in this study because the method was misreported as either bottom fishing or drifting by some permit holders. This was most likely a result of “deep-dropping” not being included in the list of fishing methods on the data sheet provided to the permit holders, but could be written in under the “other” option. Additionally, the study design instructed the interviewer to ask the permit holder an open-ended question of what fishing method was primarily employed during the trip, but then could read the list provided on the data sheet.
Figure 24 – Primary fishing methods employed for each HMS group. Other fishing methods not displayed (casting, chumming, live-baiting) accounted for ≤ 1% combined of trips for all HMS groups. The N indicates number of trips for each HMS group.
Trolling is typically not associated with sword fishing, and of the 32 trips in which it was reported as the primary method, 19 reported secondary fishing methods that are more typically associated with sword fishing throughout the industry (i.e. drifting, deep-dropping, and bottom fishing). Additionally, non-HMS pelagic species were reported as the primary targets on 5 more of these trips. With that said, the remaining trips did not report secondary fishing methods, nor other target species, so trolling is believed to be used by some anglers to target swordfish. Anecdotal reports and personal observations confirm its use (McGowan, personal observation), primarily while the vessel is traveling to the fishing grounds where they then proceeded to drift like most swordfish trips. Appreciation among anglers for the diurnal vertical migratory patterns associated with swordfish was evident as there were distinct differences in the primary fishing methods employed during daytime swordfish trips as compared to nighttime trips (Figure 25). Nighttime sword fishing primarily involved
Florida Highly Migratory Species Private Angler Telephone Survey – Final Report
42
drifting (89.2%), while a variety of methods were employed during the daytime fishing. Deep-drop fishing was used the most (29.9%), followed by drifting (28.5%), trolling (21.7%), and bottom fishing (20.0%) during the daytime trips. Considering the previously discussed issues that arose regarding how the deep-drop method was described by permit holders, it is reasonable to assume that most if not all of the bottom fishing trips actually employed deep-dropping, especially considering it’s unrealistic to expect recreational vessels to have anchored in +1000 ft waters with a 1 to 4 knot current. Either way, the change in fishing method clearly demonstrates the fishery’s knowledge of the behavioral ecology of swordfish and its ability to shift tactics accordingly.
Figure 25 – Comparison of the primary fishing methods employed on daytime and nighttime swordfish trips. Daytime trips were classified as those that returned to the access site between 8 am and 8 pm while nighttime trips were those that returned to the access site between 8:01 pm and 7:59 am. N indicates the number of trips.
4.1.3 PATS Catch Data Analysis Throughout the course of the PATS, 1,896 HMS fish were reported to have been caught. This catch was comprised of 1,658 fish from 22 species, 63 fish from four genera, 99 fish from two family categories, and 78 fish from an HMS group category. Billfish accounted for 50.65% of the total HMS catch, followed by sharks (30.36%), tunas (14.3%), and swordfish (4.69%). Among the billfish, three species were reported to have been caught. Sailfish was dominant, making up 97.7% (936 fish) of the total billfish catch, while only 14 blue marlin and 9 white marlin were reported to have been caught. Swordfish catches tallied 88 fish. Only two tuna species were reported to have been caught, skipjack and yellowfin (199 and 69 fish, respectively), plus two fish that the permit holder could not identify to the species level. Of the 579 sharks, 343 were reported to the species level. Blacktips were the most common (127) of 16 species caught, followed by lemon (74), bull (41), silky (39), Caribbean reef (18), sandbar (15), and spinner (13). Sharks catches were only recorded to the species level if the angler could recall specific distinguishing characteristics that the sampler could then use to ascertain a positive identification. This included the presence or absence of an interdorsal ridge, position and size of dorsal fins, head shape, tail shape, and/or the presence of white spots along the body wall (to rule out Atlantic sharpnose). Realistically, the reliability of self-reported shark identification for most species is questionable at best in the absence of the angler providing digital pictures or having considerable experience in shark identification. To encourage better shark identification (and overall HMS identification) throughout the recreational community, numerous permit holders were emailed copies of the HMS identification
0.0% 20.0% 40.0% 60.0% 80.0% 100.0%
Deep-Drop
Bottom Fishing
Drifting
Trolling
% of Total Swordfish Trips
PrimaryFishing
Method
Day Trip N=93
Night Trip N=131
Florida Highly Migratory Species Private Angler Telephone Survey – Final Report
43
dichotomous key used by the samplers, along with instructions on its use to aid them with their identification skills. HMS were targeted on 854 of the 1086 trips reported during the PATS. Of these targeted trips, 45.4% resulted in a fish from the targeted HMS group being caught (Figure 26). Targeted shark trips were the most successful, with 73.5% resulting in at least one shark being caught, followed by billfish trips (56.1%), swordfish trips (25.7%), and tuna trips (25.7%). Due to the differences in fishing methods employed during swordfish day trips and night trips (Figure 25), the success of targeted sword trips was also analyzed separately. Surprisingly, though, the success rate was similar, with 26.1% of targeted day trips resulting in at least one swordfish being caught compared to 25.5% during night trips.
Figure 26 – Success rate of trips targeting each HMS group. “Targeted Catch” represents trips in which at least one fish from the targeted HMS group was caught (released or landed). Trips in which the HMS group was caught as a bycatch are not included in this figure. The top figure shows the rate of success for targeted trips for each HMS group. The bottom figure shows the rate of success for trips targeting swordfish that returned from the trip during daytime or nighttime hours. Trips returning to the access site between 08:00 and 20:00 are classified as “Daytime” trips and trips returning between 20:01 and 07:59 are “Nighttime” trips. N indicates number of trips.
The extent of potential bias associated with under-coverage of nighttime fishing, trips operating out of private access sites, and tournament fishing was investigated by comparing average catch per trip (CPUE) to test for potential differences: i.e., day versus night, private versus public access site, and tournament versus non-tournament trips. Total catch rates were compared for each HMS group, while harvest CPUEs were only compared for swordfish and tuna because of the lack of reported billfish and shark landings. The Kruskal-Wallis test was used to test for differences in CPUEs. No significant differences in total catch rates were detected between daytime and nighttime swordfish trips (P=0.42) (Figure 27). While the mean harvest rate was twice as high during day trips (0.21 fish/trip daytime versus 0.10 fish/trip nighttime), statistical comparison failed to detect a significant difference (P=0.08), granted by a slim margin. Analysis of the disposition of swordfish catches do indicate potential differences in harvest rates, with 43.1% of all swordfish caught during day trips being landed compared to only 28.2% during night trips (Figure 28). Considering the statistical comparison barely failed and the
15
163
222
500
854
Shark
Tuna
Sword
Billfish
HMS
Targeted Catch No Targeted CatchN
132
90
0% 10% 20% 30% 40% 50% 60% 70% 80% 90% 100%
Night
Day
Total Trips Targeting Each HMS Group
Swordfish Day vs. Night
Florida Highly Migratory Species Private Angler Telephone Survey – Final Report
44
apparent proportional difference in harvested catch, the lack of a statistical difference may be more of a reflection of the low number of harvested swordfish reported during the study (19 landed fish on day trips and 13 landed fish on night trips). As such, it may be premature to assume similar catch rates are occurring. The potential difference in harvest rates may be attributed to differences in the size class of swordfish catches, with anecdotal reports from permit holders and fishing industry media outlets suggesting much larger fish were frequently being caught during the day. In the absence of biological data, though, the PATS cannot confirm or refute these anecdotal reports.
Figure 27 - Comparison of catch rates between daytime and nighttime swordfish trips. Graph A shows mean total catch rate and graph B shows mean harvest rate for swordfish. P value to the right of CPUE relfects result of Kruskal-Wallis test. The “N” indicates total number of trips for swordfish that CPUE was derived from. N for Graph B swordfish is equal to Graph A swordfish.
Figure 28 – Comparison of catch disposition between daytime and nighttime trips targeting swordfish. Trips returning to the access rate between 08:00 and 20:00 are classified as “Daytime” trips and trips returning between 20:01 and 07:59 are “Nighttime” trips. Catch disposition for released catch is determined by the angler’s perception of what was legal and illegal. The “N” indicates total number of swordfish caught.
Comparison of CPUEs derived from trips using public and private access sites did not detect significant differences for swordfish and sharks (P>0.6) (Figure 29). On the other hand, CPUEs for billfish trips utilizing public access sites (1.8 fish/trip) were significantly greater compared to private access sites (1.5 fish/trip) (P=0.04). While the comparison of CPUEs for all tuna trips combined did not yield a significant difference, analysis of skipjack tuna and yellowfin tuna separately did show opposing differences. Trips
13293
0 0.2 0.4 0.6 0.8 1
Swordfish
Mean Total # Fish Caught per Trip
Day Trips Night TripsN
P=0.42
A
0 0.2 0.4 0.6 0.8 1
Swordfish
Mean # Fish Harvested per Trip
P=0.08
B
0.0% 10.0% 20.0% 30.0% 40.0% 50.0%
Released - Legal
Released - Illegal
Landed
% of Total Swordfish Catch
CatchDisposition
Day Catch N = 44
Night Catch N = 44
Florida Highly Migratory Species Private Angler Telephone Survey – Final Report
45
returning to public access sites caught and harvested yellowfin tuna in significantly greater quantities than those returning to private access sites (total CPUE: 0.59 fish/trip public access versus 0.14 fish/trip private access, P=0.02; harvest CPUE: 0.37 fish/trip public access versus 0.1 fish/trip private access, P=0.01). In contrast, trips returning to private access sites caught and harvested significantly greater quantities of skipjack tuna (total CPUE: 0.5 fish/trip public access versus 1.29 fish/trip private access, P<0.01; harvest CPUE: 0.18 fish/trip public access versus 0.35 fish/trip private access, P=0.01).
Figure 29 - Comparison of catch rates between trips originating from public vs. private access sites for each HMS group and two tuna species, yellowfin and skipjack tuna. Graph A shows mean total catch rate and graph B shows mean harvest rate for each HMS group and two tuna species. P value to the right of each HMS group/species CPUE relfects result of Kruskal-Wallis test. The “N” indicates total number of trips for each HMS group that CPUE was derived from. Harvest CPUE was not calculated for billfish or sharks due to insufficient number of fish reported to have been harvested. N for Graph B swordfish and tunas are equal to Graph A swordfish and tunas, respectively. (Note, both tuna species were derived from all tuna HMS group trips)
68
108
108
108
109
275
92
91
91
91
113
313
0 1 2 3 4
Shark
Skipjack
Yellowfin
Tuna
Swordfish
Billfish
Mean Total # Fish Caught per Trip
Public Access Trips Private Access TripsN
P=0.04
P=0.61
P=0.11
P=0.02
P<0.01
P=0.66
A
0 0.25 0.5 0.75 1
Skipjack
Yellowfin
Tuna
Swordfish
Mean # Fish Harvested per Trip
P=0.91
P=0.84
P=0.01
P=0.01
B
Florida Highly Migratory Species Private Angler Telephone Survey – Final Report
46
Total catch rates for billfish tournament trips were significantly greater than non-tournament trips (P<0.01), with a CPUE averaging 3.3 fish/trip that was more than double the 1.4 fish/trip caught during non-tournament trips ( (Figure 30). Total catch rates for swordfish tournament trips were also greater than non-tournament trips (0.6 fish/trip versus 0.4 fish/trip), but the analysis failed to detect a significant difference (P=0.10), nor were any differences in harvest rates detected (P=0.22). As was the case with swordfish daytime harvest CPUEs, the lack of statistical differences may be attributed to the small number of tournament trips captured by the survey (16 trips versus 206 non-tournament trips), and as such, it may be premature to rule out the existence of potential bias. The lack of tuna and shark tournament trips precluded comparison of their catch rates.
Figure 30 – Comparison of catch rates between tournament and non-tournament trips for billfish and swordfish. Graph A shows mean total catch rate and graph B shows mean harvest rate for each HMS group. P value to the right of each HMS group/species CPUE relfects result of Kruskal-Wallis test. The “N” indicates total number of trips for each HMS group that CPUE was derived from. Harvest CPUE was not calculated for billfish due to insufficient number of fish reported to have been harvested. N for Graph B swordfish is equal to Graph A swordfish.
Analysis of the disposition of HMS catches revealed distinct differences among the HMS groups (Figure 31), with nearly all billfish and sharks being released (99.7% of the total catch for each group) while significant proportions of the swordfish and tuna catches were harvested (35.6% and 35.8%, respectively). The high release rates for billfish and sharks were not a result of regulatory restrictions, with only 5.2% of all billfish and 8.9% of all sharks being released because the fish was either undersized, the bag limit had been met, or was prohibited all together. Tuna also experienced low release rates related to fishing regulations (8.1%). In contrast, 33.1 % of all swordfish caught were released because the permit holders believed they were not legal to harvest. Small proportions of the harvested tuna were used for bait (6.8%) or sold (0.6%), while all swordfish and the remaining tunas were landed to be eaten. While there may be differences in the proportion of harvested swordfish between daytime and nighttime trips (Figures 27 and 28), there were no apparent differences in the proportion of released fish being legal or illegal to harvest (27.1% legal versus 29.8% illegal for day catches, 35.5% versus 36.3%
208
537
17
61
0 0.5 1 1.5 2 2.5 3 3.5 4
Swordfish
Billfish
Mean Total # Fish Caught per Trip
Tournament Trips Non-tournament TripsN
P<0.01
P=0.10
A
0 0.25 0.5 0.75 1
Swordfish
Mean # Fish Harvested per Trip
P=0.22
B
Florida Highly Migratory Species Private Angler Telephone Survey – Final Report
47
for night catches). It should be emphasized that the legality of the catch was based on the permit holder’s perception of the regulations and what they told the sampler. For that reason, this should not be interpreted as an indication of the size class of fish caught. Interestingly, substantial numbers of swordfish (31.3%) and tunas (56.1%) were released, despite being deemed legal to harvest by the permit holder. Most of the released tunas were skipjacks, which was not all that surprising since they are not considered to be of premium table-fare compared to other tuna species. The large proportion of legal-sized swordfish releases was unexpected, though, considering the great cost and effort required to conduct a swordfish trip. Whereas skipjacks were frequently caught as bycatch by anglers primarily targeting yellowfin and blackfin tunas, swordfish were rarely caught as bycatch (only 3) and the trips typically were initiated solely for the purpose of catching swordfish. Similar investment in time and money for catch and release fishing is common place for billfish trips (especially marlin trips). This strongly suggests the swordfish population is highly valued by a segment of the fishery as a catch and release fishery.
Figure 31 – Catch disposition for each HMS group. “Released – Illegal” includes fish that were under the size limit, a prohibited species, or the bag limit had been reached. Catch disposition for released catch is determined by the angler’s perception of what was legal and illegal. N indicates total number of fish caught.
There were differences in the type of hooks used during HMS fishing, as Figure 32 summarizes the hook type used to catch individual fish from each HMS group into three categories: circle hooks, J-hooks, and treble hooks. Cooke and Suski’s (2004) differentiation of circle hooks from J-hooks was used to generally define circle hooks as those in which the tip of the hook was perpendicular to the shaft and J-hooks if the tip of the hook was parallel to the shaft. Treble hooks were defined as a combination of 3 to 4 small J-hooks that share the same shaft, with the hooks equally spaced from each other (either 120˚ or 90˚) facing outward. Billfish and sharks were primarily caught with circle hooks (80.0% and 73.6%, respectively) and swordfish and tunas with J-hooks (71.2% and 83.3%, respectively). Treble hook use was negligible, only occurring in instances where HMS were caught as bycatch on non-HMS targeted trips (0.3% billfish and 1.3% sharks). Additionally, there were substantial seasonal shifts in the use of hook types for billfish catches. Circle hooks were only used for 41.9% of the billfish caught during the May-June 2008 wave, dropped to a low of 29.0% during the July-August 2008, before accounting for 82.7 to 92.6% of billfish catches for the rest of the survey. This change can most likely be attributed to permit holders also targeting other pelagic species during this time of the year, such as king mackerel, dolphin, wahoo, and tunas, in which J-hooks (and treble hooks to a lesser extent) are more commonly used. It was also during these two sample
579
270
88
959
0% 10% 20% 30% 40% 50% 60% 70% 80% 90% 100%
Shark
Tuna
Sword
Billfish
% of Total Catch
Released - Legal Released - Illegal Landed to Eat Bait Sold
N
Florida Highly Migratory Species Private Angler Telephone Survey – Final Report
48
waves that billfish caught as bycatch were at their highest levels (21.8% May-June 2008 and 30.8% July-August 2008, Figure 8).
Figure 32 – Temporal distribution of hook type used for each HMS group by sample wave. Hook type refers to the type of hook used for each fish reported to have been caught. N indicates total number of fish caught.
66
36
100
118
126
133
579
39
29
8
17
110
67
270
11
13
29
18
8
5
84
153
262
287
77
36
143
958
0% 20% 40% 60% 80% 100%
Mar-Apr 2009
Jan-Feb 2009
Nov-Dec 2008
Sep-Oct 2008
Jul-Aug 2008
May-Jun 2008
Year
Mar-Apr 2009
Jan-Feb 2009
Nov-Dec 2008
Sep-Oct 2008
Jul-Aug 2008
May-Jun 2008
Year
Mar-Apr 2009
Jan-Feb 2009
Nov-Dec 2008
Sep-Oct 2008
Jul-Aug 2008
May-Jun 2008
Year
Mar-Apr 2009
Jan-Feb 2009
Nov-Dec 2008
Sep-Oct 2008
Jul-Aug 2008
May-Jun 2008
Year
% of Total Trips
Shar
k
Circle Hook J-Hook Treble Hook
Tun
aSw
ord
fish
Bill
fish
N
Florida Highly Migratory Species Private Angler Telephone Survey – Final Report
49
Hook type use also varied between catches that were targeted as opposed to bycatch for some HMS groups. Figure 33 highlights these differences, with circle hooks accounting for 86.8% of all targeted billfish catches, but only 45.9% of billfish bycatch. Likewise, 95.0% of targeted sharks were caught on circle hooks compared to only 69.9% of shark bycatch. Unlike billfish, though, seasonal variability among hook types for shark catches (circle hooks used for 45.2% to 86.5% of shark catches) was probably more a reflection of anglers altering their hook type in accordance with the non-HMS species they were targeting considering how many sharks were caught as bycatch. There were no differences in hook type use between targeted and non-targeted catches for swordfish or tunas. The proportion of J-hooks used to catch swordfish did vary from 23.5 to 100% across the sample waves. There was no clear seasonal pattern, though, and this shift may reflect low sample sizes rather than an indicating a seasonal shift in hook type use.
Figure 33 - Distribution of hook type used by trip type for each HMS group. Hook type refers to the type of hook used for each fish reported to have been caught. N indicates total number of fish caught.
4.1.4 PATS Catch & Effort Estimates Final estimates of the total HMS fishing effort is presented in Table 7. Estimates were produced for each sample wave and Florida subregion. Overall, 19,047 HMS trips with a proportional standard error (PSE) of 4.1% were estimated to have occurred during the time period of May 12, 2008 to April 26, 2009. Figure 34 shows the seasonal differences in effort, with November-December 2008 being the most active wave (4,420 trips, PSE 8.5%), followed by May-June 2008 (3,565 trips, PSE 9.7%), July-August 2008
502
77
154
116
4
80
175
783
0% 10% 20% 30% 40% 50% 60% 70% 80% 90% 100%
Bycatch
Targeted
Bycatch
Targeted
Bycatch
Targeted
Bycatch
Targeted
% of Total Catch
Circle Hook J-Hook Treble Hook
NBillfish
Shark
Tuna
Sword
Florida Highly Migratory Species Private Angler Telephone Survey – Final Report
50
(3,371 PSE 9.6%), January-February 2009 (3,352 trips, PSE 9.7%), September-October 2008 (2,233 trips, PSE 11.3%), and March-April 2009 (2,105 trips PSE 12.1%). Among the subregions, SEFL had the greatest number of trips for the year with 13,121 trips (PSE 4.6%), followed by the Keys (2,216 trips, PSE 15.1%), NEFL (1,452 trips, PSE 15.6%), Panhandle (1,220 trips, PSE 13.6%), and SWFL (1,038 trips, PSE 20.4%). Table 7 – Effort estimates by Florida subregion and sample wave.
Figure 34 – Effort estimates by wave and summarized by year.
0
1000
2000
3000
4000
5000
May-Jun 2008
Jul-Aug 2008
Sep-Oct 2008
Nov-Dec 2008
Jan-Feb 2009
Mar-Apr 2009
Tota
l Nu
mb
er
of
Trip
s
Sample Wave
0
4000
8000
12000
16000
20000
All Waves Combined
Florida Highly Migratory Species Private Angler Telephone Survey – Final Report
51
Final catch estimates for each species is presented in Table 8. Catch estimates were produced for landed (landed to be eaten or sold), released alive, and released dead (including fish used for bait) catches. Catch estimates were consolidated into “harvest” (landed + released dead), “released” (released alive), and “total catch” (harvest + released). Table 8 – Catch estimates by species and summarized by HMS group. “# Landed” = all fish caught that were eaten, sold, or used for bait, “# Released” = all fish caught and released alive, “Total Catch” = all fish caught. “PSE” = proportional standard error. HMS group summaries are in bold.
A total of 10,294 sharks (PSE 14.9%) were estimated to have been caught, with only 33 harvested (PSE 71.1%). Blacktip sharks were the most common shark species to be caught (total catch 2,205, PSE 35.1%), followed by Requiem sharks (1,700, PSE 30.0%), lemon sharks (1,423, PSE 61.6%), and unidentified sharks (1,372, PSE 34.5%).
Florida Highly Migratory Species Private Angler Telephone Survey – Final Report
52
A total of 5,437 tunas (PSE 19.5%) were estimated to have been caught, with 1,965 harvested (PSE 18.6%) and 3,461 released (PSE 28.8%). Most of these were skipjack tunas, with a total catch estimate of 3,952 fish (PSE 25.5%), of which 27.1% were harvested (PSE 21.9%). This is in contrast to yellowfin tuna, of which 62.2% were harvested (PSE 31.0%) out of the 1,456 that were estimated to have been caught (PSE 23.4%). The swordfish total catch was estimated to be 1,563 fish (PSE 16.4%), with approximately one third of the swordfish being harvested (PSE 21.1%). The combined billfish total catch estimate totaled 17,331 fish (PSE 9.3%), of which 16,936 were sailfish (PSE 9.5%). A total of 247 blue marlin were estimated to have been caught (PSE 35.0%), along with 148 white marlin (PSE 40.2%). Although, no marlin landings were reported, a total of 51 sailfish were estimated to have been harvested (PSE 57.6%). The primary objective of this study was to improve upon data collection methods for HMS fisheries compared to existing monitoring programs. As such, the total catch estimates produced by the PATS for seven species (blacktip shark, skipjack tuna, yellowfin tuna, swordfish, sailfish, blue marlin, and white marlin) were directly compared to MRFSS estimates for Florida during the same time period, as well to a five year average of MRFSS estimates for Florida from 2004 to 2008 (Table 9). This comparison revealed the PATS achieved greater precision for all species except blacktip sharks and skipjack tuna. The precision of MRFSS estimates for yellowfin tuna, swordfish, blue and white marlin over the past five years varied from 62.9 to 100% PSE, whereas the PSE for PATS estimates varied from 16.4 to 40.2%. While none of the estimates reached a level of precision <10% PSE, this represented a marked improvement from the status quo, especially for swordfish and yellowfin tuna. Sailfish and skipjack tuna PATS estimates had similar levels of precision with the MRFSS, but the estimates themselves were substantially lower. The PATS estimate of 16,936 sailfish (PSE 9.5%) was a fraction of the MRFSS May 2008 to April 2009 estimate of 42,243 sailfish (PSE 14.5%), while the MRFSS 5-yr average of 62,870 sailfish (PSE 13.5%) was even greater. The differences between the PATS skipjack catch estimate of 3,952 fish (PSE 25.5%) and the MRFSS estimates for the same time period and the 5-yr average (37,682 fish, PSE 23.4% and 13,474 fish, PSE 35.0%, respectively) were even greater. The blacktip shark PATS total catch estimate (2,205 sharks, PSE 35.1%) had lower precision and was a fraction of the MRFSS May 2008 – April 2009 estimate (111,608 sharks, PSE 12.2%) and MRFSS 5-yr average (150,343 sharks, PSE 13.6%). Potential methodological bias accepted, Figure 21 highlights one possible explanation for the difference in the sailfish estimates, with 45.6% of all billfish trips occurring in State waters where the HMS permit is not required. Additionally, some HMS species like skipjack tuna are regularly caught by non-HMS permitted anglers while targeting non-HMS pelagic species like dolphin, wahoo, and blackfin tunas. The overwhelming difference between the PATS and MRFSS shark estimates is most likely due to the lack of directed shark fishing by HMS permit holders (<10% total shark trips, Figure 8) and the frequency sharks were caught during non-HMS trips targeting widely popular sport fish such as snapper, grouper, and king mackerel. Table 9 also shows the differences in harvest estimates between the PATS, the MRFSS 5-yr average, and self-reported landings received by the NOAA Fisheries via the HMS non-tournament reporting hotline or website (HMS NTR). Permit holders are required to report all landed billfish, swordfish, and bluefin tuna to NOAA Fisheries, but not other tuna species. The HMS NTR counts presented were received during the May 2008 to April 2009 time period for Angling permit holders that reported catches from Florida. The precision of the PATS harvest estimates (PSE 21.9% to 57.6%) were much better than the MRFSS estimates (PSE 51.4% to 100%), especially for swordfish, yellowfin and skipjack tunas. The PATS harvest
Florida Highly Migratory Species Private Angler Telephone Survey – Final Report
53
estimates were all lower than the MRFSS estimates, but it should be noted that the extremely poor precision of the MRFSS estimates precludes a meaningful comparison. The HMS NTR only received landings reports for swordfish, sailfish, and white marlin during the time period the PATS was conducted. HMS NTR counts for sailfish and white marlin (112 and 3 fish, respectively) exceeded the harvest estimates of the PATS (51 sailfish PSE 57.6%, no white marlin harvest), but were significantly less for swordfish (297 swordfish versus 561 swordfish PSE 21.1%). The HMS NTR counts do not include tournament landings, but considering only 12.5% of the landed swordfish occurred during a tournament trip, it only accounts for a portion of the difference in the estimated harvest. Table 9 – Comparison of PATS catch estimates with Marine Recreational Fishing Statistics Survey (MRFSS) estimates and HMS NTR counts for billfish, swordfish, and tunas. MRFSS estimates consist of a 5-year average of estimates from 2004 to 2008 and a separate estimate from May 2008 to April 2009 to overlap with the 12-month sample period of the PATS. MRFSS estimates are derived from private/rental boat fishing mode trips for all ocean/Gulf of Mexico waters combined (no inland waters). The HMS NTR counts are also from the May 2008 to April 2009 time period for Angling permit holders reporting catches from Florida.
TOTAL CATCH ESTIMATES
PATS MRFSS 5-yr Avg (2004-2008) MRFSS (May’08-Apr-’09) # Fish PSE # Fish PSE # Fish PSE
There were additional data sources that provided landings reports for some HMS while the PATS was conducted. The Recreational Billfish Survey (RBS) received landings reports for 32 swordfish from 11 tournaments, and the Southeast Swordfish Club reported an additional 42 landed swordfish that were not reported to the HMS NTR (the club conducts two 6-month tournaments that run concurrently each year that NOAA Fisheries allows to be reported through the RBS rather than HMS NTR). If these additional landings are combined with the HMS NTR count, their sum equals two thirds of the PATS estimate (371 fish versus PATS 561 fish), but does fall within the 95% confidence interval of the PATS estimate due to its relatively high PSE (21.1%). The RBS also received tournament landings reports for
Florida Highly Migratory Species Private Angler Telephone Survey – Final Report
54
four blue marlin, whereas neither the PATS, MRFSS, nor HMS NTR received any. The RBS received no sailfish or white marlin landings reports. 4.1.5 Characterization Dialing Results Characterization sampling coincided with the start of the PATS sampling on May 26, 2008. At the completion of the PATS on May 14, 2009, 2,340 of the 6,019 vessels had not been characterized, either because they had not been selected by the PATS or the permit holder did not have time to complete the characterization after successfully completing a PATS interview. These vessels were then called directly, following the same dialing procedures as the PATS. All characterizations were completed by August 4, 2009. The complete dialing results for the characterization survey are presented in Table 10 and summarized in Figure 35. Overall, 57.4% (range 49.4% Keys – 62.4% PanH) of all permit holders were successfully characterized. Permit holders that reported their vessel being located in Florida but were inactive during the past 12 months (e.g. vessel down for repairs, permit holder not in Florida or suffering serious illness in family, etc.) accounted for 0.3% (0% NEFL – 0.8% PanH) of vessels, whereas 5.9% (range 3.7% Keys – 8.2% SWFL) of the vessels were deemed ineligible because the vessel was not in Florida (other than for maintenance or dry storage) or had been sold during the past 12 months. Despite being classified as ineligible, representatives for vessels that had been sold within the past 12 months were still asked all survey questions for the vessel’s activity prior to its date of sale, and their information was included in the analysis. Non-cooperative permit holders accounted for 3.6% (range 2.0% PanH – 4.3% SEFL) of all vessels, of which 1.0% (range 0.4% Keys – 1.8% SEFL) were mid-interview refusals. Information from mid-interview refusals was still used in the analysis when possible. The remaining permit holders (32.8%, range 30.0% PanH – 43.7% Keys) could not be contacted, either due to bad contact information, the permit holder did not speak English or Spanish, or they were unresponsive to the five contact attempts. Table 10 - Dialing results for the one-time characterization of all HMS Angling permitted vessels in Florida by each Florida subregion. The values for the Florida subregions combined are a derived average of all vessels combined for each dialing result.
Florida Highly Migratory Species Private Angler Telephone Survey – Final Report
55
Figure 35 – Summarized characterization dialing results for all HMS Angling permitted vessels in Florida by each Florida subregion. Interview status values have been combined as follows: “Successful Contact” = Complete Interview + Incomplete Interview, “Refusal” = Initial Refusal + Mid-Interview Refusal, “Unable to Contact” = Unable to Contact + Language Barrier. Data labels in bold indicate number of vessels per Florida subregion.
4.1.6 Characterization Survey Results
The length of HMS fishing experience reported by Angling permit holders is reported in Figure 36. The average HMS fishing experience for all Florida permit holders spanned 14.2 years. Permit holders that reported using their vessel for at least 1 targeted HMS trip in the past 12 months from the day they were interviewed were slightly more experienced with an average of 15.9 years. The distribution of HMS fishing experience among all permit holders indicates 55.0% had 10 years or less of experience while 11.8% had more than 30 years experience. The distribution of experience for all permit holders was not remarkably different than those that had fished for HMS at least once in the past 12 months, with exception to those whose experience was limited to only the past two years or less. This group of inexperienced anglers accounted for 21.7% of all permit holders, whereas it only accounted for 12.9% of permit holders that had fished recently. Likewise, there was little difference in the length of time permit holders had been obtaining an HMS or Atlantic Tunas permit compared to those that had fished for HMS within the past 12 months (Figure 37). Permit holders reported they had obtained an HMS or Atlantic Tunas permit for an average of 4.0 years, while those that had gone out on at least 1 HMS trip averaged 4.2 years. The characterization results also indicated 86.9% of the permit holders reported to have obtained their permit during or after 2003, the year in which the HMS permit became a requirement for any angler that attempted to target or land any HMS. Prior to the creation of the HMS permit, anglers were only required to obtain an Atlantic Tunas permit if they were fishing for tunas.
6019 800 499 492 3420 8080%
10%
20%
30%
40%
50%
60%
70%
80%
90%
100%
FL PanH SWFL Keys SEFL NEFL
% o
f H
MS-
Pe
rmit
ted
Ve
sse
ls
Florida Subregion
Unable to Contact
Refusal
Ineligible
Inactive
Successful Contact
Florida Highly Migratory Species Private Angler Telephone Survey – Final Report
56
Figure 36 – Distribution of HMS fishing experience for all characterized HMS Angling permit holders. The graph shows differences between the length of HMS fishing experience for all permit holders (“HMS”) with the length of experience for permit holders that reported conducting at least one HMS trip with their vessel within the past 12 months of the characterization interview (“HMS (TO)”). HMS fishing experience includes directed HMS fishing throughout the permit holder’s lifetime on any recreational vessel inside or outside of the United States. The mean years of HMS fishing experience with its standard error of the mean (SEM) is indicated for both groups in the upper right corner. N indicates the total number of HMS permit holders that responded for each group.
Figure 37 – Distribution of number of years HMS Angling permit holders in Florida have obtained an HMS or Atlantic Tunas permit. “HMS” represents all permit holders successfully characterized, including those that reported their vessel was not used for any HMS trips during the past 12 months. “HMS (TO)” represents permit holders who reported using their vessel for at least HMS trip in the past 12 months. The mean years permit holders had obtained an HMS or Atlantic Tunas permit with its standard error of the mean (SEM) is indicated for both groups in the upper right corner. N indicates the total number of HMS permit holders that responded for each group.
0%
5%
10%
15%
20%
25%%
of
Co
nta
cte
d H
MS
Pe
rmit
Ho
lde
rs
# of Years with HMS Fishing Experience
HMS N=3399
HMS (TO) N=2380
Mean Years HMS Fishing Experience:HMS = 14.2 (± 0.23 SEM)
HMS (TO) = 15.9 (± 0.27 SEM)
0%
5%
10%
15%
20%
25%
1 2 3 4 5 6 7 8 9 10+% o
f C
on
tact
ed
HM
S P
erm
it H
old
ers
# of Years Obtaining HMS Permit
HMS N=3394
HMS (TO) N=2382
Mean Years HMS Permitted:HMS = 4.0 (± 0.06 SEM)
HMS (TO) = 4.2 (± 0.07 SEM)
Florida Highly Migratory Species Private Angler Telephone Survey – Final Report
57
HMS Angling permitted vessels were used to target HMS an average of 9.4 trips within the past 12 months from when the permit holder was interviewed (Figure 38). 68.1% of all successfully characterized vessels were used to target HMS for at least one trip within the past 12 months, averaging 13.4 trips per vessel. Of all successfully characterized vessels, 40.3% targeted billfish at least once, averaging annually 14.7 billfish trips per vessel (the average is for permit holders that reported at least one billfish trip). Approximately one third of vessels (31.3%) targeted tunas at least once, with a mean of 8.8 tuna trips per vessel, whereas 31.2% of vessels targeted swordfish at least once, averaging only 6.3 swordfish trips per vessel. Sharks were targeted by only 94 permit holders (2.7%), averaging 8.3 shark trips per vessel.
Figure 38 – Mean number of HMS trips for each HMS group. “HMS” represents all permit holders successfully characterized, including those that reported their vessel was not used for any HMS trips during the past 12 months. “HMS (TO)” represents permit holders who reported using their vessel for at least one HMS trip in the past 12 months. All other HMS groups represent permit holders who reported using their vessel for at least one trip in which species from that HMS group were targeted. Error bars represent 95% confidence intervals. Data labels in bold indicate the number of vessels reporting trips.
Permit holders were asked what type of access site they used as their principle port for all fishing activities. Access site type categories included publicly accessible marinas, public boat ramps, private docks, private marinas (no public access), and “other” site types. They were also asked to provide the name of the access site and the city and state in which it was located so it could be matched to a registry of known access sites where the MRFSS is conducted. The results of the characterization show the use of private access sites by HMS permit holders in Florida is substantial, accounting for 46.8% of all characterized vessels (Figure 39). Private docks were used by 39.2% of vessels as their principle port (1357 vessels), whereas 12.6% used private marinas (436 vessels), of which 173 were matched to known MRFSS sites within Florida. Public marinas and public boat ramps accounted for 13.3% (459 vessels) and 34.4% (1191 vessels) of the access sites, respectively. A total of 1,468 of these public sites were matched to sites in the MRFSS registry, which equates to approximately 47.4% of HMS sites (public and private access) being accessible to field intercept surveys like the MRFSS. Some of the remaining 182 public access sites that could not be matched up with a known MRFSS site because insufficient information was provided by the permit holder (e.g. public boat ramp in such in such county, provided a local name, etc.) and may in fact be sites accessible to MRFSS or other field samplers. An analysis was conducted to determine if some access site types were utilized more often to target one HMS group over another, but no significant differences were detected.
3494 2438 1407 1089 1095 940
2
4
6
8
10
12
14
16
HMS HMS (TO) Billfish Sword Tuna Shark
Me
an #
of
Trip
s P
ast
12
Mo
nth
s
HMS Group
Florida Highly Migratory Species Private Angler Telephone Survey – Final Report
58
Figure 39 – Distribution of principle port access site types used by HMS Angling permitted vessels in Florida. “Other Site Type” in top figure includes private boat ramps, moorings, and sites outside the United States. “MRFSS sites” are sites that have been matched up with known sites on the MRFSS registry, “Public Access – unknown MRFSS sites” are sites that were reported to be public access by the permit holder, but the site name could not be determined or matched up with a known site already on the MRFSS registry, and “Private Access” are sites that are not sampled by the MRFSS. Data labels in bold indicate the number of vessels.
Not all principle ports were used as the primary access site for HMS fishing. A small proportion of vessels (2.7%, 65 vessels) were operated from a secondary access site for most, if not all, of their directed HMS fishing (Figure 40). Of these sites, 60.5% were confirmed MRFSS sites, 23.3% were unknown public sites, and 16.3% were private access sites.
Figure 40 – The top graph (A) is a comparison of the access site used primarily for HMS fishing by HMS Angling permitted vessels in Florida, either the vessel’s principle port or a secondary access site. The bottom graphs (B) describe the access site type for the vessels using a secondary site primarily for HMS fishing. Access site type classification is the same as previously used in Figure 39. N indicates number of vessels. (Note: only includes vessels that reported at least 1 HMS trip in the past 12 months)
459 1191 17 1357 436
Public Marina Public Boat Ramp Other Site Type Private Dock Private Marina
1641 201 1618
0% 10% 20% 30% 40% 50% 60% 70% 80% 90% 100%
% of HMS Angling Category Permitted Vessels
MRFSS sites Public Access - unknown MRFSS sites Private Access
2428
0% 10% 20% 30% 40% 50% 60% 70% 80% 90% 100%
% of HMS Angling Category Permitted Vessels Reporting > 1 HMS Trip Past 12 Months
Principle Port Used For HMS Secondary Site Used for HMSN
A
50
Public Marina Public Boat Ramp Other Site Type Private Dock Private MarinaN
43
0% 10% 20% 30% 40% 50% 60% 70% 80% 90% 100%
% of Vessels Using Secondary Access Site Primarily for HMS Fishing
MRFSS sites Public Access - unknown MRFSS sites Private Access
B
Florida Highly Migratory Species Private Angler Telephone Survey – Final Report
59
With such a large proportion of the vessels operating from private access sites, alternative methods of intercepting these vessels in the field were explored. Permit holders that conducted at least 1 targeted trip within the past 12 months from the day they were interviewed were asked how often they stopped at another marina, fuel dock, or other public access site while returning from an HMS trip within the past 12 months. Figure 41 shows that of all the characterized vessels, 2.5% of permit holders reported to have always stopped, 3.7% said they stopped often, 14.5% stopped sometimes, and 79.4% said they never stopped and always returned to their home access site. Among vessels that used private access sites as their principle port, 3.4% always stopped, 5.7% often stopped, 20.3% sometimes stopped, and 70.6% never stopped. Of the 29.4% of private vessels that reported to have stopped at least sometimes, 79.8% stopped at confirmed MRFSS sites, 19.9% stopped at unknown public access sites, and only 1 stopped at another private access site. This shows that a significant portion of private access vessels could potentially be intercepted in the field while returning from an HMS trip.
Figure 41 – The top graphs (A) show the frequency HMS Angling permitted vessels in Florida stopped at another marina, fuel dock, or other public access site while returning from an HMS trip. The upper graph shows all vessels while the lower graph is only vessels that use a private access site as their principle port. The bottom graph (B) describes the access site type of the sites stopped at by Private Access vessels while returning from an HMS trip. Access site type classification is the same as previously used in Figure 39. N indicates number of vessels. (Note: only includes vessels that reported at least 1 HMS trip in the past 12 months)
Permit holders that conducted at least one HMS trip were also asked if they conducted directed HMS trips from any other access sites within the past 12 months. 19.5% of all permit holders reported they had, but only 12.7% of private access vessels affirmed their use of alternate sites, as shown in Figure 42. One third of the alternate access sites reported by the private access permit holders were confirmed MRFSS sites within Florida (33.3%), while 17.6% were unknown public sites and 10.7% other private access sites in Florida. The remaining sites were either outside Florida (10.1%) or outside the U.S. (28.3%). In summary, 4.2 – 6.4% of all vessels that reported private access sites as their principle port used confirmed MRFSS sites or other public sites within Florida as alternate access sites for directed HMS fishing.
1281
2422
0% 10% 20% 30% 40% 50% 60% 70% 80% 90% 100%
Private Access Vessels
All Vessels
% of HMS Angling Category Permitted Vessels Reporting > 1 HMS Trip Past 12 Months
Always Stops Often Stops Sometimes Stops Never Stops
N
A
357
0% 10% 20% 30% 40% 50% 60% 70% 80% 90% 100%
Private Access Vessels
% of Private Access Vessel Stopping at Another Marina, Fuel Dock, or Public Access Site
MRFSS sites Public Access - unknown MRFSS sites Private AccessN
B
Florida Highly Migratory Species Private Angler Telephone Survey – Final Report
60
Figure 42 – The top graphs (A) show the percentage of HMS Angling permitted vessels in Florida that used other access sites for HMS fishing. The upper graph shows all vessels while the lower graph is only vessels that use a private access site as their principle port. The bottom graph (B) describes the access site type for the alternate sites used by Private Access vessels. Access site type classification is the same as previously used in Figure 39, with “Outside FL” for sites outside Florida but within the United States, and “Outside US” for sites outside the United States (Bahamas & St. Thomas). N indicates number of vessels. (Note: only includes vessels that reported at least 1 HMS trip in the past 12 months)
Most characterized permit holders reported all of their vessel’s directed HMS fishing activity was limited to access sites within Florida (95.4%), as shown in Table 11. This includes their vessel’s principle port or any other alternate access sites. Of the vessels that reported at least one HMS trip in the past 12 months, 93.8% fished exclusively from Florida. Thirty four permit holders reported having fished for HMS out of ports inside Florida and other states within the U.S. (1.4%), while 24 vessels remained outside Florida for all of their directed HMS fishing during the past 12 months; half in other states and the others outside the U.S. (these vessels were in Florida at some point within 12 months prior to the interview, but did not target HMS). Ninety two vessels also targeted HMS from ports inside Florida as well as sites outside the U.S. Table 11 – The geographic areas that HMS Angling permitted vessels in Florida fished or at least based their vessel. Includes principle port, secondary access site for HMS fishing, and other access sites permit holders reported to have been used by the vessel in the past 12 months.
Area Fished By FL HMS vessels FL only FL & Other
States
Other States
only
FL &
Outside U.S.
Outside U.S.
only
All Vessels N 3285 34 18 92 15
% 95.4% 1.0% 0.5% 2.7% 0.4%
Vessels Reporting > 1 HMS Trip
past 12 months
N 2262 34 12 92 12
% 93.8% 1.4% 0.5% 3.8% 0.5%
1283
2420
0% 10% 20% 30% 40% 50% 60% 70% 80% 90% 100%
Private Access Vessels
All Vessels
% of HMS Angling Category Permitted Vessels Reporting > 1 HMS Trip Past 12 Months
Used Alternate Sites No Alternate Sites
N
A
159
0% 10% 20% 30% 40% 50% 60% 70% 80% 90% 100%
Private Access Vessels
% of Private Access Vessels Using Alternate Access Sites
MRFSS sites Public Access - unknown MRFSS sites Private Access Outside FL Outside US
N
B
Florida Highly Migratory Species Private Angler Telephone Survey – Final Report
61
Before the Characterization survey was concluded, permit holders were asked one final question regarding their willingness to participate in a future survey similar to the PATS that utilized e-mail as the primary method of communication. Overwhelmingly, 80.6% of all permit holders interviewed reported they would be willing to participate in such a survey (Figure 43). Furthermore, this question stimulated additional questions from many permit holders regarding the use of email to receive HMS and general fisheries news, updates, or other information to stay better informed.
Figure 43 – Percentage of HMS Angling permit holders willing to participate in a future survey in which email would be the primary method of contacting them. N indicates number of permit holders.
4.1.7 Comparison of PATS with Characterization Results Results from the PATS and Characterization survey were compared with each other to determine if the ratio of public versus private access site use for HMS fishing was similar (Figure 44). During the PATS, 631 vessels reported the access site used during 1065 HMS trips, of which 40.5% were confirmed MRFSS sites and an additional 12.0% were unknown public access sites. In comparison, 3,460 characterized vessels reported 47.4% of their principle ports were confirmed MRFSS sites whereas only an additional 5.8% were unknown public sites. Despite the difference in the proportion of unknown public sites, the results of both surveys lead to the same critical determination regarding the extent of private access site use during HMS fishing (46.8% Characterization, 47.4% PATS).
Figure 44 – Comparison of access sites reported to have been used for HMS trips during the PATS versus the principle ports of vessels reported during the one-time Characterization. “MRFSS sites” are sites that have been matched up with known sites on the MRFSS sites registry, “Public Access – unknown MRFSS sites” are sites that were reported to be public access by the permit holder, but the site name could not be determined or matched up with a known site already on the MRFSS site registry, and “Private Access” are sites that are not sampled by the MRFSS. N indicates the number of trips for the PATS and the number of vessels for the Characterization.
3491
0% 10% 20% 30% 40% 50% 60% 70% 80% 90% 100%
% of HMS Angling Category Permitted Vessels
Willing to Participate Declined to Participate
N
3460
1065
0% 10% 20% 30% 40% 50% 60% 70% 80% 90% 100%
Char
PATS
% of HMS Angling Category Permitted Vessels
MRFSS sites Public Access - unknown MRFSS sites Private AccessN
Florida Highly Migratory Species Private Angler Telephone Survey – Final Report
62
4.1.8 Comparison of PATS trip return times with MRFSS temporal coverage The distribution of PATS trip return times (Figure 11) was compared to historical MRFSS sampling activities to determine what proportion of HMS trips could have potentially been covered by the MRFSS. MRFSS field intercept assignments conducted at access sites throughout Florida from 2004 to 2008 targeting anglers in the “private-rental” mode were used for this analysis. The assignments covered all potential recreational fishing trips for anglers fishing from private or rented vessels, including inshore and offshore trips for HMS and non-HMS species. The initial start and final stop times for each of the 6,758 MRFSS assignments were classified into three categories in which 50%, 75%, and 90% of the assignments had been either started or ended (Figure 45). The analysis shows 60.6% of all HMS trips returned when only half of the MRFSS assignments had begun or ended (11:00 am to 4:45 pm - red box), including 72.9% of all billfish, 62.9% of all tuna, and 57.6% of all shark trips. If expanded to include trips returning within the 75% MRFSS coverage period (9:40 am to 6:00 pm - blue and red boxes combined), 79.6% of all HMS, 92.2% of all billfish, 86.5% of all tuna, and 83.4% of all shark trips were covered. In comparison, only 38.9% of all swordfish trips returned within the 90% MRFSS coverage period (8:50 am to 7 pm – gray, blue, and red boxes combined).
Figure 45 – Temporal distribution of trip return times by HMS group. The HMS trip return times are graphed over sampling coverage periods from when 6,758 MRFSS field assignments were conducted at Florida access sites from 2004 to 2008 in which private/rental mode anglers were targeted. The coverage periods are defined as follows: the gray boxes indicate when 90% of all MRFSS field assignments had started (left side) and ended (right side); the blue boxes indicate when 75% of all assignments had started and ended, and the red box indicates when 50% of all assignments had started and ended. Individual trips are represented by the “x” symbol. The N indicates number of trips for each HMS group.
4.1.9 Comparison of spatial distribution of PATS HMS activity with MRFSS field intercept sample The PATS stratified Florida into five independent subregions (Figure 1) to account for the uneven distribution of permit holders across the state (Table 1) and to better partition regional variability in effort and CPUEs for HMS species. This was a departure from the current stratification used by the MRFSS which generates effort estimates for all saltwater recreational fishing trips (HMS and non-HMS) for only two separate regions in Florida. The two regions are the Gulf coast region (encompassing three PATS regions: PanH, SWFL, and the Keys) and the Atlantic coast region (SEFL and NEFL). For a given region, MRFSS intercept data are used to apportion estimated effort by area fished (inland, State, Federal waters). Measured CPUEs for a given species in a given area fished are then multiplied by the estimated effort in the area fished to estimate total catch. The comparison of PATS and MRFSS catch
Florida Highly Migratory Species Private Angler Telephone Survey – Final Report
63
estimates for sailfish and skipjack tunas showed significant differences in the estimates between the two surveys despite similar levels of precision (Table 9). Given consideration to the uneven distribution of reported HMS fishing activity among the PATS subregions (Figure 10), these PATS results were compared to the spatial distribution of MRFSS field intercepts to determine if the differences in how the surveys stratify Florida may affect their respective effort and subsequent catch estimates. Table 12 shows the proportion of MRFSS field intercept interviews collected from 2004 to 2008 for private/rental (PR) mode anglers in Florida. The proportions reflect the number of MRFSS interviews collected within each PATS subregion relative to the total number of interviews collected within their respective MRFSS region during each two-month sample wave and summarized for the 5-year time period. The MRFSS intercept sample is drawn proportional to fishing pressure throughout the Gulf coast region, resulting in only 2.7% (range 1.8 - 4.0% across waves) of all MRFSS Gulf PR interviews collected from the Keys, compared to 78.1% in SWFL (range 68.8 – 86.8% across waves). This distribution is in stark contrast to the distribution of HMS fishing activity captured by the PATS, in which the Keys accounted for the second highest proportion of HMS trips in Florida (18.2%, versus 8% for SWFL and PanH combined). Considering only 3.4% of all billfish trips were reported from SWFL and PanH combined (compared to 18.8% in the Keys), this may be indicative of why sailfish trips are a rare event in Gulf coast intercepts, resulting in Gulf coast sailfish MRFSS estimates with high variability; when in actuality they are a more common occurrence locally throughout the Keys. The analysis also raised concerns regarding how the MRFSS expands HMS CPUEs collected in SEFL across effort for the entire Florida Atlantic coast region due to the disproportionately smaller and more seasonal HMS fishery in NEFL. While SEFL averaged 56.3% of all Atlantic coast MRFSS PR interviews (range 50.4 – 62.5% across all waves), the subregion accounted for 67.9% of all HMS trips and 73.1% of all billfish trips in Florida (Figure 10). In comparison, NEFL accounted for only 4.8% of all billfish trips and a negligible 1.3% of billfish trips during the peak of the sailfish season from November through February (Figure 9) when the subregion accounted for 40.9% (November-December) and 37.5% (January-February) of all Atlantic coast MRFSS PR interviews. The MRFSS is designed to distribute interviews proportional to overall effort for all marine recreationally fishing throughout Florida’s Atlantic coast region. However, this design approach for a generalized survey has inherent limitations in terms of efficiency and estimate precision for species that have localized spatial and temporal distributions within the sample region, such as sailfish. Table 12 – Distribution of MRFSS field intercept interviews from 2004 to 2008 for Private/Rental (PR) mode anglers in Florida. The proportions reflect the number of MRFSS interviews collected within each PATS subregion relative to the total number of interviews collected within their respective MRFSS region during each two-month sample wave and summarized for the 5-year time period. The N indicates the total number of MRFSS PR interviews.
MRFSS Regions
PATS FL Subregion
Sample Wave Combined 2004-2008
Average May-Jun Jul-Aug Sep-Oct Nov-Dec Jan-Feb Mar-Apr
Florida Highly Migratory Species Private Angler Telephone Survey – Final Report
64
4.2 Atlantic Tunas General Permit
4.2.1 PATS Dialing Results Telephone sampling for the Atlantic Tunas General permit holders was conducted simultaneously along with the PATS sampling for the HMS Angling permit holders. Dialing was initiated May 12, 2008 and concluded May 13, 2009. During the study, 404 vessel selections were drawn, comprised of 200 individual vessels. This constituted 82.0% of the 244 vessels that made up the final General permit sample frame. Figure 46 summarizes the PATS’s General permit dialing results for the length of the study and for each sample wave (Appendix E provides the detailed dialing results for each sample week). Successful contact rates for the survey were much lower than the Angling permit sampling, with an average of only 42.5% (varied 29.2-61.4% per sample wave) of the selected permit holders resulting in completed interviews (compared to 59.8% for Angling permit sampling). The lower success rate was primarily due to a large proportion of selected vessels being ineligible for the survey (25.7%, varied 10.1-34.1%), primarily because they were commercial fishing vessels (45 out of 72 ineligible vessels). Most of the commercial vessels reported to have obtained the permit “just in case” they ever caught an Atlantic Tuna (i.e. yellowfin tuna) as bycatch while commercial fishing for non-HMS species, but did not conduct targeted commercial or recreational HMS trips. Additionally, the low successful contact rate was also affected by an average of 7.9% (varied 4.0-11.5%) of selected vessels being inactive compared to only 4.6% during the Angling permit sampling. Although, this was canceled out by a lower proportion of vessels that could not be contacted (23.0%, varied 13.4-31.0%) compared to 27.6% during the Angling permit sampling. Refusals were extremely rare, averaging <1% (compared to 3.6% Angling permit) with no refusals occurring during half of the sample waves. Overall, successful contact rates steadily increased over the 12-month study as vessel frame updates removed the ineligible vessels from the selection pool and incorporated permit holders’ contact preferences (i.e. time of day and primary phone number) to reduce the number of failed contact attempts.
Figure 46 – PATS General permit dialing results for all sample weeks combined and by 2-month sample wave. The interview status values have been combined as follows: “Unable to Contact” = Unable to Contact + Bad Contact Info. Data labels in bold indicate number of vessels drawn per wave.
404 64 67 68 75 66 640%
10%20%30%40%50%60%70%80%90%
100%
% o
f To
tal V
ess
els
Se
lect
ed
Sample Wave
Unable to ContactMid-Interview RefusalIneligible
Inactive
Successful Contact
Florida Highly Migratory Species Private Angler Telephone Survey – Final Report
65
At the end of the study, the final status of the General permit sample frame consisted of 37.3% of all vessels being eligible and cooperative, 29.5% being ineligible, 5.7% could not be contacted due to bad or missing contact information, 4.9% were inactive for an extended period of time, and 4.5% were unresponsive to all contact attempts (Figure 47). The remaining 18.0% were not selected for the PATS. Regionally, the Florida Panhandle (PanH) and southwest Florida (SWFL) had a much larger proportion of ineligible vessels (47.8% and 42.9%, respectively) than the other Florida subregions (<26.3%). Consequently, north east Florida, the Florida Keys, and southeast Florida had a greater proportion of eligible vessels (47.5%, 47.1%, and 41.4%, respectively) than the PanH (15.2%) and SWFL (28.6%). No permit holder was deemed uncooperative for the survey.
Figure 47 – Final vessel status of all General permit holders in Florida May 2009 by each Florida subregion. The final vessel status was determined by the following criteria: “Eligible” = vessels in which permit holder was successfully contacted at least once and contact information is accurate, “Inactive” = vessel is in Florida but will not be used for HMS fishing for the indefinite future, “Ineligible” = vessel is not in Florida, is commercial only, or has been sold, “Non-responsive” = permit holder was never successfully contacted, “Bad/Missing Info” = permit holder could not be contacted during the last attempt due to bad or missing contact info, “Unknown” = vessel was never selected for the PATS. Data labels in bold indicate number of vessels per FL subregion. 4.2.2 PATS Trip Data Analysis A total of 404 vessel selections were drawn, selecting 200 unique vessels. Of these, only 19 vessels reported 29 HMS trips in which they caught, or tried to catch, any billfish, swordfish, tunas, or sharks. Due to the low sample size from so few individual vessels, an in depth analysis of the trip data similar to the PATS Angling permit sampling was not feasible. As such, only a brief analysis of the General permit trip data was conducted. Of the 29 HMS trips reported, nearly all of the trips were classified as either billfish (13 trips, 45.1% of all trips) or tuna (11 trips, 38.1%) trips (Figure 48). Only three swordfish trips were reported (2 exclusively for swordfish, 1 shark/swordfish combination), along with three shark trips (1 exclusively for sharks, 1 shark/tuna combination, and the 1 shark/swordfish combination previously mentioned). Of the 13 billfish trips, only one reported billfish being caught as bycatch (6.9%). Likewise, all three swordfish trips
244 46 21 17 99 610%
10%
20%
30%
40%
50%
60%
70%
80%
90%
100%
FL PanH SWFL Keys SEFL NEFL
% o
f To
tal V
ess
els
Florida Subregion
Unknown
Bad/Missing Info
Non Responsive
Ineligible
Inactive
Eligible
Florida Highly Migratory Species Private Angler Telephone Survey – Final Report
66
were targeted. Tuna trips were split, with seven targeted and five bycatch trips reported. Sharks were not targeted on any of these trips, only caught as bycatch.
Figure 48 – HMS Trip classification for General permit holders by HMS Species Group. Trip classification was determined by the HMS group being reported as one of the trip’s three target species or the HMS group was caught as bycatch while targeting a different HMS group or non-HMS species. Combination trips could entail both HMS groups being targeted, one targeted while the other was caught as bycatch, or both caught as bycatch while targeting non-HMS species. Data labels in bold represent number of reported trips per HMS group.
Figure 49 – HMS Trip result classification. Classification criteria as follows: “Target only” = HMS targeted species with no HMS catch, “Bycatch only” = non-HMS species targeted with HMS bycatch, “Target w/ Catch” = HMS species successfully targeted and caught, “Target w/ Bycatch only” = HMS species targeted but only other HMS species caught as bycatch, “Target w/ Catch & Bycatch” = HMS species successfully targeted and caught and other HMS species caught as bycatch. Data labels in bold represent number of vessels per HMS group.
13 2 11 1 1 10.0%
5.0%
10.0%
15.0%
20.0%
25.0%
30.0%
35.0%
40.0%
45.0%
50.0%
% o
f To
tal T
rip
s
HMS Group / Combination
29 13 3 12 30%
10%
20%
30%
40%
50%
60%
70%
80%
90%
100%
HMS Billfish Sword Tuna Shark
% o
f To
tal T
rip
s
HMS Group
Target w/ Catch & Bycatch
Target w/ Catch
Bycatch only
Target only
Florida Highly Migratory Species Private Angler Telephone Survey – Final Report
67
These limited results indicate some General permit holders are targeting billfish and swordfish in Florida, which is not permissible for vessels with this permit unless fishing in an HMS tournament. No tournament trips were reported by General permit holders. Furthermore, three trips were reported to be charters targeting sailfish, which is also not permissible with a General permit (Table 13). For-Hire vessels that wish to take paying customers on trips targeting HMS must obtain the HMS Charter/Headboat category permit. Considering the General permit is a commercial permit, it was surprising that only one commercial HMS trip was reported throughout the study, during which one yellowfin tuna was landed by a permit holder that was commercially targeting dolphin and wahoo. In fact despite being a commercial trip, the permit holder reported he did not sell the yellowfin tuna; rather he kept it for personal consumption. It is apparent that some anglers may be confused in regards to which permit they are required to obtain. Table 13 – Composition of trip modes for HMS trips reported by General permit holders. The number of trips and proportion of all HMS trips is summarized for each mode: charter, private, and commercial.
Trip Mode
Charter Private Commercial # Trips % of all Trips # Trips % of all Trips # Trips % of all Trips
3 9.8% 25 86.9% 1 3.3%
4.2.3 PATS Catch & Effort Estimates Final estimates of the total catch and fishing effort for General permit holders is presented in Table 14. A total of 356 trips (PSE 21.6%) were estimated to have occurred during the time period of May 12, 2008 to April 26, 2009. The total catch estimates for tunas consisted of 274 yellowfin tuna (PSE 39.8% - 131 fish harvested, PSE 51.8% and 142 released alive, PSE 59.8%) and 389 skipjack tunas (PSE 54.1% - 101 harvested, PSE 61.3% and 288 released alive, PSE 69.8%). No sailfish, swordfish, or sharks were harvested, with release estimates of 236 sailfish (PSE 40.7%), 24 swordfish (PSE 100%), and 33 requiem sharks (PSE 58.0%). The poor precision for all of the estimates are attributed to the small sample frame and few reported trips. Table 14 – Total catch and effort estimates for General permit holders by species.
Florida Highly Migratory Species Private Angler Telephone Survey – Final Report
68
4.2.4 Characterization Dialing Results Characterization sampling coincided with the start of the PATS sampling on May 26, 2008. At the completion of the PATS on May 14, 2009, 69 of the 244 vessels had not been characterized, either because they had not been selected by the PATS or the permit holder did not have time to complete the characterization after successfully completing a PATS interview. These vessels were then called directly, following the same dialing procedures as the PATS. All characterizations were completed by June 30, 2009. The characterization sampling resulted in 42.6% of all General permit holders successfully completing the survey (Figure 50). Similar to the PATS sampling, a large proportion of permit holders were deemed ineligible (32.0%), mostly because they were commercial, while 2.9% reported to be inactive and only two permit holders refused to participate (0.8%). Permit holders that could not be contacted or did not respond to contact attempts accounted for 21.7%. The PanH accounted for the largest proportion of ineligible vessels (55.6%) while only 17.6% of permit holders in the Keys were deemed ineligible. As was the case with the Angling sample frame, permit holders in the Keys were the most difficult to contact, with 35.3% being unresponsive while accounting for <22.2% in all other Florida subregions and only 10.0% in SWFL.
Figure 50 – Summarized characterization dialing results for all General permitted vessels in Florida by each Florida subregion. Interview status values have been combined as follows: “Successful Contact” = Complete Interview + Incomplete Interview and “Refusal” = Initial Refusal + Mid-Interview Refusal. Data labels in bold indicate number of vessels per Florida subregion.
4.2.5 Characterization Survey Results The length of HMS fishing experience reported by General permit holders is reported in Figure 51. The average HMS fishing experience for all Florida permit holders spanned 19.5 years (19.9 years for permit holders that reported conducting at least one HMS trip in the past 12 months), compared to only 14.2 years for Angling permit holders (Figure 36). The distribution of HMS fishing experience among all permit holders indicates only 37.4 had 10 years of experience or less, compared to 55.0% for Angling permit holders. Likewise, 19.2% had at least 30 years of HMS fishing experience, compared to only 11.8% of Angling permit holders.
244 45 20 17 99 610%
10%
20%
30%
40%
50%
60%
70%
80%
90%
100%
FL PanH SWFL Keys SEFL NEFL
% o
f H
MS-
Pe
rmit
ted
Ve
sse
ls
Florida Subregion
Unable to Contact
Refusal
Ineligible
Inactive
Successful Contact
Florida Highly Migratory Species Private Angler Telephone Survey – Final Report
69
General permit holders reported they had obtained an HMS or Atlantic Tunas permit for an average of 5.9 years (Figure 52), while Angling permit holders averaged 4.0 years (Figure 37). Since the creation of the HMS permit in 2003, 76.0% of the permit holders reported to have obtained their permit, slightly less than the 86.9% of Angling permit holders. Considering the General permit was first required in 1982 (initially for bluefin tuna, and later for all Atlantic tunas in 1996), it is not surprising that General permit holders have more experience and a longer history of obtaining permits than Angling permit holders.
Figure 51 - Distribution of HMS fishing experience for all characterized General permit holders. HMS fishing experience includes directed HMS fishing throughout the permit holder’s lifetime on any recreational vessel inside or outside of the United States. The mean years of HMS fishing experience with its standard error of the mean (SEM) is indicated in the upper right corner. N indicates the total number of HMS permit holders.
Figure 52 - Distribution of number of years General permit holders in Florida have obtained an HMS or Atlantic Tunas permit. The mean years permit holders had obtained a permit with its standard error of the mean (SEM) is indicated in the upper right corner. N indicates the number of HMS permit holders.
General permit vessel representatives reported using their permitted vessels to target HMS an average of 9.2 trips within the past 12 months from when they were interviewed (Figure 53). 70.4% of all successfully characterized vessels were used to target HMS for at least one trip within the past 12
9 14 14 9 12 9 12 5 7 70%
5%
10%
15%
20%
25%
% o
f C
on
tact
ed
HM
S P
erm
it H
old
ers
# of Years Fishing for HMS
Mean Years HMS Fishing Experience:HMS = 19.5 (± 1.41 SEM)
N = 99
0%
5%
10%
15%
20%
25%
1 2 3 4 5 6 7 8 9 10+
% o
f C
on
tact
ed
HM
S P
erm
it
Ho
lde
rs
# of Years Obtaining HMS Permit
Mean Years HMS Permitted:HMS = 5.9 (± 0.65 SEM)
N = 104 vessels
Florida Highly Migratory Species Private Angler Telephone Survey – Final Report
70
months, averaging 13.1 trips per vessel. Of all successfully characterized vessels, 41.6% targeted tunas at least once, averaging annually 8.8 tuna trips per vessel (the average is for permit holders that reported at least one tuna trip). Trips that targeted billfish at least once accounted for 37.0% of all trips, with a mean of 12.6 billfish trips per vessel, whereas 20.4% of vessels targeted swordfish at least once, averaging only 4.5 swordfish trips per vessel. Sharks were targeted by only five permit holders (4.6%), averaging 9.4 shark trips per vessel. The mean number of trips for each HMS group was within the confidence intervals associated with the respective Angling permit mean number of trips (except sharks), suggesting similar trip frequencies among the two groups of permit holders (Figure 38). The proportion of permit holders targeting each HMS group did differ (as expected), with more General permit holders targeting tunas (41.6% General versus 31.3% Angling) while more Angling permit holders were inclined to target swordfish (20.4% General versus 31.2% Angling) and billfish (37.0% General versus 40.3% Angling). Very few anglers from both permit types expressed interest in targeting sharks (<100 permit holders out of >3600 interviewed permit holders combined). In combination with the trip data analysis (Figure 49), the significant proportions of General permit holders conducting targeted billfish and swordfish trips indicate they are either unaware of the permit requirements that restrict fishing for billfish, swordfish, and sharks unless during an HMS tournament, or they are choosing to disregard the regulations. Considering no permit holders appeared to be concealing their fishing activities during the survey and freely shared information that was in violation of their permit, as well as the lack of catches being sold, it is reasonable to conclude there is considerable confusion among the recreational community regarding the permit regulations.
Figure 53 – Mean number of HMS trips for each HMS group. “HMS” represents all permit holders successfully
characterized, including those that reported their vessel was not used for any HMS trips during the past 12 months. “HMS (TO)” represents permit holders who reported using their vessel for at least one HMS trip in the past 12 months. All other HMS groups represent permit holders who reported using their vessel for at least one trip in which species from that HMS group were targeted. Error bars represent 95% confidence intervals. Data labels in bold indicate the number of vessels reporting trips.
108 76 40 22 45 50
2
4
6
8
10
12
14
16
18
20
HMS HMS (Trips only) Billfish Sword Tuna Shark
Me
an #
of
Trip
s P
ast
12
Mo
nth
s
HMS Group
Florida Highly Migratory Species Private Angler Telephone Survey – Final Report
71
The characterization survey showed extensive use of private access sites by General permit holders, accounting for 51.5% of all principle ports (Figure 54). Private docks were used by 41.1% of vessels as their principle port (44 vessels), whereas 11.2% used private marinas (12 vessels). Public marinas and public boat ramps accounted for 15.0% (16 vessels) and 29.9% (32 vessels) of the access sites, respectively. A total of 45 of these sites were matched to sites in the MRFSS registry, which equates to approximately 43.7% of HMS sites (public and private access) being accessible to field intercept surveys like the MRFSS. The results are similar to the Angling permit characterization survey and PATS results (Figure 44), albeit with slightly higher proportions of overall private access use (51.5% General, 46.8% Angling permit characterization, and 47.4% Angling PATS).
Figure 54 – Distribution of principle port access site types used by General permitted vessels in Florida. “Other Site Type” in top figure includes private boat ramps and sites outside the United States. “MRFSS sites” are sites that have been matched up with known sites on the MRFSS registry, “Public Access – unknown MRFSS sites” are sites that were reported to be public access by the permit holder, but the site name could not be determined or matched up with a known site already on the MRFSS registry, and “Private Access” are sites that are not sampled by the MRFSS. Data labels in bold indicate the number of vessels.
Not all principle ports were used as the primary access site for HMS fishing. A large proportion of vessels (24.0%, 18 vessels) were operated from a secondary access site for most, if not all, of their directed HMS fishing (Figure 55). Of these vessels, 12 operated within Florida while the others primarily fished for HMS in other states (22.2%, 4 vessels) or in the Bahamas (11.1%, 2 vessels). Of the vessels that used secondary sites within Florida, six used private access sites (50.0%), 5 used confirmed MRFSS sites (41.7%), and the last boat operated out of an unknown public access site.
16 32 3 44 12
Public Marina Public Boat Ramp Other Site Type Private Dock Private Marina
45 5 53
0% 10% 20% 30% 40% 50% 60% 70% 80% 90% 100%
% of General Category Permitted Vessels
MRFSS sites Public Access - unknown MRFSS sites Private Access
Florida Highly Migratory Species Private Angler Telephone Survey – Final Report
72
Figure 55 - The top graph (A) is a comparison of the access site used primarily for HMS fishing by General permitted vessels in Florida, either the vessel’s principle port or a secondary access site. The middle graph (B) shows the proportion of vessels using secondary access sites by their geographic area (i.e. inside Florida, outside Florida in another U.S. state, or in the Bahamas). The bottom graph (C) shows the proportion of secondary site accessibility for the vessels operating inside Florida from the top graph (A). N indicates number of vessels. (Note: only includes vessels that reported at least 1 HMS trip in the past 12 months)
Most General permit vessels did not stop at another marina, fuel dock, or other public access site while returning from an HMS trip within the past 12 months (Figure 56). Of all the characterized permit holders, only 4.0% reported to have always stopped, 1.3% said they stopped often, 4.0% stopped sometimes, and 90.7% said they never stopped and always returned to their home access site. Permit holders for vessels operating out of private access sites reported similar results.
Figure 56 – The figure shows the frequency General permitted vessels in Florida stopped at another marina, fuel
dock, or other public access site while returning from an HMS trip. N indicates number of vessels. (Note: only includes vessels that reported at least 1 HMS trip in the past 12 months)
75
0% 10% 20% 30% 40% 50% 60% 70% 80% 90% 100%
% of General Category Permitted Vessels Reporting > 1 HMS Trip Past 12 Months
Principle Port Used For HMS Secondary Site Used for HMSN
A
18
0% 10% 20% 30% 40% 50% 60% 70% 80% 90% 100%
% of General Category Vessels Using a Secondary Access Site Primarily for HMS Fishing
Florida Outside FL Bahamas
B
N
12
0% 10% 20% 30% 40% 50% 60% 70% 80% 90% 100%
% of Vessels Using Secondary Access Site Primarily for HMS Fishing in Florida
MRFSS sites Public Access - unknown MRFSS sites Private Access
C
N
38
75
0% 10% 20% 30% 40% 50% 60% 70% 80% 90% 100%
Private Access Vessels
All Vessels
% of General Category Permitted Vessels Reporting > 1 HMS Trip Past 12 Months
Always Stops Often Stops Sometimes Stops Never Stops
N
Florida Highly Migratory Species Private Angler Telephone Survey – Final Report
73
Over one third of all General permit holders (35.1%) reported using an alternate access site within the past 12 months to target HMS (Figure 57). This was a considerably larger proportion than reported by all Angling permit holders (19.5%), as well as by those operating out of private access principle ports (32.4% General versus 12.7% Angling) (Figure 42). Most characterized permit holders reported all of their vessel’s directed HMS fishing activity was limited to access sites within Florida (79.4%), whether operating solely out of their principle port or using additional access sites (Table 15). A larger proportion of permit holders reported at least some of their targeted HMS trips occurred outside Florida in other states (11.2%) compared to Angling permit holders (1.5%). The same was true for those reporting at least some directed HMS activity outside the U.S. (12.1% General compared to 3.1% Angling).
Figure 57 – The figure show the percentage of General permitted vessels in Florida that used other access sites
for HMS fishing. The upper bar shows all vessels while the lower bar is only vessels that use a private access site as their principle port. N indicates number of vessels. (Note: only includes vessels that reported at least 1 HMS trip in the past 12 months)
Table 15 – The geographic areas that Atlantic Tunas General permitted vessels in Florida fished or at least based
their vessel. Includes principle port, secondary access site for HMS fishing, and other access sites permit holders reported to have been used by the vessel in the past 12 months.
Area Fished By FL HMS vessels
FL only FL & Other States
Other States only
FL & Outside
U.S.
Other States & Outside
U.S.
FL, Other States, & Outside
U.S.
# of Vessels 85 6 3 10 2 1 % of Vessels 79.4% 5.6% 2.8% 9.3% 1.9% 0.9%
Similar to Angling permit holders, General permit holders responded favorably to participate in a future survey similar to the PATS that utilized e-mail as the primary method of communication (Figure 58). Of those successfully interviewed, 74.1% of the permit holders were willing to participate.
37
74
0% 10% 20% 30% 40% 50% 60% 70% 80% 90% 100%
Private Access Vessels
All Vessels
% of HMS Angling Category Permitted Vessels Reporting > 1 HMS Trip Past 12 Months
Used Alternate Sites No Alternate Sites
N
Florida Highly Migratory Species Private Angler Telephone Survey – Final Report
74
Figure 58 – Percentage of Atlantic Tunas General permit holders willing to participate in a future survey in which
email would be the primary method of contacting them. N indicates number of permit holders.
108
0% 10% 20% 30% 40% 50% 60% 70% 80% 90% 100%
% of General Category Permitted Vessels
Willing to Participate Declined to Participate
N
Florida Highly Migratory Species Private Angler Telephone Survey – Final Report
75
5. DISCUSSION & MANAGEMENT RECOMMENDATIONS 5.1 HMS Recreational Fisheries: General Characteristics The results of the two surveys lead to the following general characterizations of the HMS Angling permit recreational fishery in Florida:
Directed HMS fishing activity occurs year-round throughout Florida, but most trips are concentrated in southeast Florida and the Florida Keys.
Sailfish was the most frequently targeted and caught HMS species, followed by swordfish and tunas. Sharks were rarely targeted in Florida (<3% of characterized permit holders), but were frequently caught as bycatch on trips targeting other HMS and non-HMS species.
Directed HMS fishing tends to focus on sailfish during the late fall through winter, shifts to tuna (and to a lesser extent marlin) during the spring and summer, and then to swordfish from the summer through fall, although catches for all HMS groups were reported year-round.
A majority of all swordfish trips (58.4%) ended between 8pm and 8am while 95% of all other HMS trips for other species ended during daytime hours.
Swordfish were targeted during the day and at night using different fishing methods, but anglers reported similar total catch rates regardless of the time fished. Day trips did result in catches being landed more frequently and, therefore, may be selecting for a larger size class of fish.
A substantial proportion of vessels (approx. 47%) used private access sites inaccessible to the MRFSS or other access point surveys for HMS fishing.
Catch rates for billfish and yellowfin tuna trips operating out of public access sites were significantly higher than similar trips using private access sites. In contrast, catch rates for skipjack tuna trips were significantly higher for those using private access sites.
Tournament fishing accounted for nearly 10% of all billfish trips and over 7% of all swordfish trips, yet only 51.3% of the 39 reported HMS tournaments were registered with NOAA Fisheries HMS Management Division.
Catch rates for billfish tournament trips were significantly higher than non-tournament trips, while there are strong indications swordfish tournament trips also resulted in higher catch rates.
Approximately half of all HMS fishing activity (51.7%) took place in Federal waters within 25 miles from shore, and nearly half of all billfish trips occurred within State waters (45.6%).
Long-range trips primarily targeting yellowfin tuna (YFT) occur in both the South Atlantic and Gulf of Mexico, with many Atlantic trips entering or fishing just north of Bahamian waters before returning to U.S. ports. Many of these trips last more than 24 hours in duration.
Nearly one third of swordfish were released, despite being of legal size to harvest.
Billfish and sharks were rarely harvested, with release rates exceeding 99%.
Circle hooks were used for 80% of all billfish catches, but their use was limited during the late spring and summer (<42%) as anglers switched to J-hooks to target other pelagic species during which billfish were caught primarily as bycatch.
Over half of HMS Angling permit holders have targeted HMS for less than 10 years.
Over 80% of interviewed HMS Angling permit holders were willing to participate in future HMS surveys that utilized e-mail as the primarily method of correspondence.
Florida Highly Migratory Species Private Angler Telephone Survey – Final Report
76
The results of the two surveys lead to the following general characterizations of the Atlantic Tunas General permit recreational fishery in Florida:
Nearly one third of General permit holders were ineligible for the surveys (29.5 % PATS and 32.0% characterization survey), most of whom were exclusively commercial vessels that obtained the permit in the rare event they caught an Atlantic tuna as bycatch.
Significant proportions of General permit holders conducted directed, non-tournament trips for billfish and swordfish. Additionally, some permit holders reported charter fishing trips for billfish. It is apparent there is great confusion among many recreational anglers regarding HMS permit regulations in this region and outreach efforts are strongly recommended.
General permit holders on average reported more HMS fishing experience than Angling permit holders (19.5 years versus 14.2 years). In addition, they reported having obtained HMS or Atlantic Tunas permits for a longer period of time than Angling permit holders (5.9 years versus 4.0 years).
The frequency of conducting directed trips for billfish, swordfish, and tunas was similar to that of Angling permit holders, although the proportion of permit holders targeting tunas and swordfish did defer between the two permit types.
A greater proportion of General permit holders reported using multiple access sites for HMS fishing than Angling permit holders (35.1% versus 19.5%). In addition, a greater proportion reported at least some of their HMS fishing occurred outside Florida in other states (11.2% versus 1.5%) and outside the U.S. (12.1% versus 3.1%).
Similar to Angling permit holders, over 74% of interviewed General permit holders were willing to participate in future HMS surveys that utilized e-mail as the primarily method of correspondence.
5.2 Evaluation of Sample Frame The list of HMS permit holders was used as the study’s sample frame to mirror the design of the Large Pelagic Survey (LPS) conducted from Maine to Virginia. The LPS’s field intercept survey (LPIS) produces an off-frame correction factor for its sample frame by determining the percentage of intercepted HMS vessels that are permitted and considered to be on-frame. Due to logistical and cost constraints, no such method of validation to determine the number of non-HMS-permitted vessels actively engaged in HMS fishing was conducted for this pilot study. This was deemed acceptable as the goal of this pilot study was to primarily characterize recreational HMS fishing activity and assess the magnitude of the fishery in Florida rather than produce harvest estimates for quota monitoring. It was also logical to assume that the best approach to begin to describe the fishery was to first focus on anglers that have expressed an interest in these species by obtaining an HMS permit. Nonetheless, the information provided by the permit holders in this study provides some indication of the effectiveness of using the HMS permit registry to build a sample frame in a future survey that has similar objectives to the LPS. First, exemptions to the HMS permit for vessels operating in State waters (< 3 miles Atlantic, <10 miles GOM) result in a significant coverage gap for the HMS fishing activity of some species. HMS permit holders reported 45.6% of billfish trips and 29.3% of shark trips occurred primarily in State waters (Figure 21). Additionally, HMS bycatch during non-HMS targeted trips constituted 70.4% of total shark trips overall, and was 90.5% of trips that targeted other HMS groups that resulted in shark bycatch. For other HMS groups, there were seasonal increases in which HMS bycatch on non-HMS targeted trips comprised a significant proportion of total the number of HMS trips, including 42.5% of winter (January-
Florida Highly Migratory Species Private Angler Telephone Survey – Final Report
77
February) tuna trips and 30.8% of late summer (July-August) billfish trips (Figure 8). If HMS catches in State waters and HMS bycatch make up such large proportions of HMS-permitted fishing activity, then it is reasonable to assume the same would be true for non-HMS-permitted vessels employing similar targeting practices. The unknown proportion of the fishery that conducts HMS-targeted trips in Federal waters or lands HMS bycatch without a permit must also be considered. Based on numerous conversations with Florida anglers it is believed that a large portion of the sport fishery actively targets billfish without an HMS permit because of a misperception that the permit is only required for harvesting billfish, not for strictly catch and release fishing (whether or not they’re in State or Federal waters). Furthermore, the comparison of the PATS total catch estimates for sailfish with the MRFSS sailfish catch estimates may provide weight to this argument (Table 10). The analysis shows that despite the relatively high level of precision associated with catch estimates produced by both surveys, the overwhelming difference in the estimated number of fish caught (PATS=16,989 sailfish PSE 9.5%, MRFSS May’08-April’09=42,243 sailfish PSE 14.5%, MRFSS 2004-2008 annual average=62,870 sailfish PSE 13.5%) suggests the PATS may have missed a substantial proportion of the private angler fishery for this species by solely relying on the HMS Angling permit as its sample frame. At the same time, though, it may also be a strong indication that the MRFSS is overestimating effort attributable to the HMS fishery by not accounting for variance associated with regional/temporal differences in sample distribution. Billfish catch data collected in southeast Florida during the MRFSS intercept survey, where nearshore sailfish trips are common, is expanded out to the total effort estimate produced for all of east Florida, despite the disproportionately smaller and more seasonal billfish fishery in northeast Florida. Consequently, the use of the HMS permit list as a future sample frame in a specialized HMS survey may not be sufficient alone for some catch and release species (i.e. sailfish), or species regularly caught either as bycatch or in nearshore waters (skipjack tunas and sharks). For these species, a dual-frame approach should be considered for estimating effort from both permitted HMS anglers and non-permitted HMS anglers in Florida (Currivan and Roe, 2004). The Florida saltwater fishing license would be a good option for the second frame. On the other hand, the HMS permit frame may be very effective for species such as swordfish and YFT, because of 1) the specialized nature of these trips that results in relatively low bycatch (<1% swordfish), 2) the location of the fishing grounds almost exclusively in Federal waters (i.e. 70-100+ miles offshore for YFT, Figure 21; 1000-2000 ft bottom depths for swordfish, Figure 23), and 3) the fact that these species are primarily harvested. The HMS permit should also be considered for blue and white marlin fishing due to the specialization necessary to target them and that they are primarily targeted in Federal waters. Field validation to determine the proportion of “on-frame” vessels would continue to be a necessary component of any survey for all HMS species. A regionalized sample draw by the new MRIP could potentially provide a correction factor as long as it is vessel trip based rather than angler based. The Atlantic Tunas General permit list was too small to be used to produce independent catch and effort estimates with adequate precision. The frame size was further reduced by the large proportion of ineligible commercial fishermen that obtained the permit in the event they ever caught a YFT as bycatch while commercially targeting non-HMS species (e.g. snapper, grouper, or king mackerel). Overall, General permit holders appeared to recreationally fish for HMS at relatively the same frequency as Angling permit holders, even though their permit did not allow it. Despite the similar trip frequencies for each HMS group among both permit frames, the large proportion of commercial permit holders within the General frame suggests this permit list should be monitored separately from recreational HMS permitted vessels. Likewise, the significant number of General-permitted anglers that were
Florida Highly Migratory Species Private Angler Telephone Survey – Final Report
78
recreationally fishing in violation of the permit rules warrants increased education efforts to ensure recreational anglers obtain the appropriate permit for their fishing activities. 5.3 Evaluation of Sampling Efficiency During the design of the PATS, great consideration was given to the reporting burden on private vessel permit holders selected to participate with the PATS and any future monitoring program. To balance the need for greater recall while minimizing the reporting burden, the two-week sample period was selected. This also had the added benefit of matching the sample period currently used by the LPS telephone survey component that estimates private angler fishing effort for large pelagic species. The two-week recall period also has half the response burden of the For-Hire Telephone Survey (FHTS) that estimates total fishing effort for all For-Hire vessels (HMS and non-HMS). Over the duration of the PATS, an average of only 10.7% of selected vessels that were successfully contacted reported HMS trips (targeted or bycatch) on a biweekly basis (Table 5). The low frequency of fishing activity among the fishery was partially a result of the record fuel prices endured at the beginning of the survey and the economic recession in the latter half. Permit holders anecdotally reported changes in their fishing behavior in response to economic hardships, both in terms of how often they fished and how they fished (e.g. range, bait type). The Characterization survey results revealed permit holders that fished at least once in the past 12 months for HMS averaged 13.4 targeted trips per year, or went on HMS trips a little more than once a month (Figure 38). If eligible permit holders that didn’t report any directed trips (but may have caught HMS as bycatch) were included, this average drops to 9.4 trips per year. For species like swordfish that require significant fuel, bait, and time expenditures to conduct a trip, permit holders that targeted swordfish at least once in the past year reported an average of only 6.3 trips per year, while tuna fishermen reported an average of only 8.8 trips. The low frequency of these trips suggests a one-month sample period may be sufficient for anglers to recall details for recent trips while minimizing their reporting burden in a future specialized HMS survey. The 10% selection of the PATS sample frame for each sample period was reduced to 8% of the frame by the second sample wave to adjust to the unanticipated increase in the number of newly permitted vessels. Even with this adjustment, over 30% of the vessels selected for the survey were selected 3 or more times over the course of 25 sample periods, while 173 permit holders were selected 5 or more times (Figure 3). The increased reporting burden on these permit holders did not negatively affect the study’s results as successful contact rates steadily increased each time an angler was selected. This was primarily due to the incorporation of primary phone numbers and preferred calling times provided by the permit holder to coordinate subsequent contact attempts. In essence, the more often permit holders were selected, the easier it was to get a hold of them. For some permit holders selected multiple times, they became non-cooperative despite expressing support for the study and management efforts, because they felt they were being selected more frequently than others, and hence bearing an unequal burden. Long-term monitoring programs similar to the design of the PATS would benefit over time from the repeated selection of most permit holders, but would also need to balance the frequency between selections to maintain high levels of support and participation. Longer sample periods or using a weighted selection process that reduces the probability of back-to-back selections would help alleviate the perception that some vessels were being selected more than others. The incorporation of e-mail, text, or other alternative communication formats, in conjunction with follow-up telephone contacts when necessary, could also be beneficial to maintaining support over an extended period of time, while also potentially producing substantial cost savings (Baker and Oeschger, 2009). Permit holders
Florida Highly Migratory Species Private Angler Telephone Survey – Final Report
79
overwhelmingly expressed support for such a program (80%), not only because it allowed them to respond to the survey at times of their convenience, but that it would also lead to an improved exchange of information in the form of updates on survey results and management changes. 5.4 HMS Trip Sampling Coverage Issues: Nighttime Fishing, Private Access, and Tournament Fishing In direct response to the National Research Council’s (NRC) 2006 review of the MRFSS and the attention brought to potential coverage bias associated with the exclusion from catch sampling of trips returning at night, trips made from private access sites, and tournament fishing, this study was designed to ascertain the extent of each factor and determine if bias exists in coverage. The return times for each HMS trip were categorized into daytime trips (8am – 8pm) and nighttime trips (8:01pm – 07:59am). Nighttime fishing was only prevalent for swordfish trips (58.4%), with less than 5% of all other HMS trips returning during nighttime hours (Figure 12). Comparison of the average catch rates between daytime and nighttime swordfish did not detect any statistically significant differences. This was in spite of the different fishing method employed between the two time periods, as nighttime trips primarily involved drift fishing while daytime trips primarily involved deep-drop bottom fishing. Both methods were employed within the same fishing areas; with over 85% of the trips conducted between 1000 – 2000 ft bottom depths in Federal waters within 25 miles from shore (Figures 21 and 23). The primary difference between the two methods is that drift fishing typically entails four to six lines being deployed from the vessel, set at fishing depths of 150-450 ft, depending on ambient light conditions (darker nights, either new moon or overcast skies, would result in lines soaked at a shallower depth, and brighter nights would result in lines at greater fishing depths), passively drifting along with the current anywhere from a few minutes to several hours. Deep-drop fishing usually entails only a single line being deployed, with the rigged bait sent to or near the bottom for short periods of time (5 to 30 minutes), as the vessel drifts along or slowly stays in gear to adjust to the speed of the current to keep the bait near the bottom. Whereas total catch rates between daytime and nighttime trips were not significantly different, harvest rates potentially were, as landed swordfish accounted for a much larger percentage of daytime catches (43.1% daytime versus 28.2% nighttime) (Figure 28). While this comparison was not statistically significant (P=0.08), it should not be dismissed considering the sample size consisted of only 32 fish (19 daytime versus 13 nighttime). The potential difference in catch disposition cannot be directly interpreted as a difference in size class. At the same time, though, the potential difference in size selection by gear cannot be ruled out in the absence of biological data due to wide-spread anecdotal accounts among recreational anglers of significantly larger fish (+200 lbs) frequently being caught during the day. The rapid expansion of daytime fishing since 2007 should make increased field sampling for this fishery a high priority, especially considering the Straits of Florida and western Gulf of Mexico are a major spawning area for the western Atlantic swordfish population (Govoni et al, 2003). Given that return times for the other HMS groups primarily occurred during daytime hours, coverage of these trips by MRFSS sampling was explored (Figure 45). The analysis showed that nearly 73% of billfish trips returned after the median start time (11:00 am) and before the median end time (4:45 pm) for MRFSS assignments conducted from 2004 to 2008. If the coverage period was expanded to when 25% of all MRFSS assignments had begun (9:40 am) and 75% had ended (6:00 pm), 92% of billfish trips, 87% of tuna trips, and 83% of shark trips returned during this time period. This indicates a small proportion of these HMS trips returned after most MRFSS sampling was concluded, primarily the long-range trips that target YFT and marlin, which would partially explain why these species are rarely observed by
Florida Highly Migratory Species Private Angler Telephone Survey – Final Report
80
MRFSS field samplers in this region. What this basic analysis did not consider was how many of these MRFSS assignments ended early either due to the absence of fishing activity or the sampler had reached the 30 interview limit for the target mode. The likelihood of a sampler obtaining 30 interviews goes up when weather conditions are favorable. Hence, an assignment conducted on a good weather day at a busy access site is more likely to end early. Unfortunately, it is on those same days when an HMS angler is more likely to attempt a long-range trip for tuna or marlin. The HMS trip would still return in the late afternoon as reported in the PATS (Figure 11), but more than likely after the MRFSS assignment had ended because the sampler had already reached the 30 interview limit. Considering over 1,000 permit holders in Florida reported targeting tuna within the past 12 months, this is the more probable reason YFT catches have been missed by the MRFSS (Figure 38). A potential solution to address this bias is currently being tested in a North Carolina-based pilot study; to proportionally stratify the start and end times of MRFSS assignments to ensure better temporal coverage of trips returning at different times of the day. This should increase the probability of long-range HMS and non-HMS trips being intercepted. The use of sites not accessible to MRFSS samplers by HMS Angling permit holders was extensive, including at least 47% of all vessels (Figure 13). Potentially as many as 59.5% of permit holders used inaccessible sites if all unconfirmed public sites are included in this proportion. The results of the Characterization survey determined over 97% of the vessels used their principle port for HMS fishing (Figure 40), whereas nearly 20% reported using other access sites within the past year for targeted HMS fishing both inside and outside of Florida (Figure 42). It also showed that only one-fourth of all private access vessels could potentially be intercepted at fuel docks or other public sites while returning from HMS trips (Figure 41). Accounting for the under coverage of private access vessel fishing activities is especially important considering significant differences in catch rates were detected for billfish and tuna trips between vessels using public and private access sites (Figure 29). Permit holders reported catching more billfish and YFT during trips that returned to public access sites, while catch rates for skipjack tunas were higher for trips returning to private access sites. The ability to sample private access vessels returning from HMS trips at fuel docks or other public access sites (e.g. waterfront restaurants, bars, and bait shops) would be a good first step at addressing this bias. While it would most likely only expand coverage to a portion of private access vessels, it would allow for long-term comparisons and calibration of catch rates with public access vessels. Care would have to be exercised in the sample selection of these intermediate sites, so as not to create a bias toward sites primarily used as cleaning stations. The incorporation of self-reported catches via the effort estimation survey should also be given more consideration, either for CPUE comparisons with field intercept data or for direct catch estimation in conjunction with the fuel dock field sampling as a validation mechanism. The survey results also confirm that tournament fishing results in significantly higher catch rates compared to non-tournament trips (Figure 30). Catch rates for billfish tournament trips were more than double those of non-tournament trips (3.3 fish/trip versus 1.5 fish/trip). Moreover, tournament trips accounted for nearly 10% of all billfish trips (Figure 14). Yet they are excluded from the MRFSS and are being oversampled by the LPS in the northeast U.S. (MRIP 2009b). Reliance upon the Recreational Billfish Survey (RBS) to monitor tournament catches is inadequate with only half of the reported HMS tournaments in Florida being registered with NOAA Fisheries HMS Management Division (51.3%) (Table 6). This also does not include HMS bycatch caught by non-permitted anglers fishing in the hundreds of non-HMS tournaments targeting king mackerel, dolphin, wahoo, blackfin tuna, and other species that take place every year throughout Florida and the rest of the southeastern U.S. Although swordfish tournament catches were not significantly different from non-tournament catches, the tournament and non-tournament portions of the fishery need further investigation due to the small sample size,
Florida Highly Migratory Species Private Angler Telephone Survey – Final Report
81
especially considering the average catch rate was 1.5x greater than for non-tournament trips (0.6 fish/trip versus 0.4 fish/trip) (Figure 30). The tournament analysis also drew attention to the lack of directed shark tournament fishing currently taking place in Florida. During all but one of the 7 shark tournament trips, the sharks were caught as bycatch. This is in stark contrast to tournament trips for the other HMS groups, in which tunas were targeted on 10 of 12 of their trips, swordfish were targeted on 16 of 17 trips, and billfish were targeted on 55 of 61 trips. The HMS Management Division tournament registry also reported sharks were targeted during only 6 of the 80 registered tournaments conducted in Florida within the time frame of this study, of which five were exclusively for sharks only. The lack of shark tournament fishing in Florida is quite a change from the historical shark fishery that supported over 200 shark tournaments in Florida during the 1970s and 1980s (Heuter, 1991). Taken in consideration with the 99.7% release rate of all shark catches during this study, this marks a significant change in perceptions and attitudes regarding the harvest of sharks among Florida private anglers. 5.5 Data Collection Recommendations Florida’s HMS fisheries are highly diversified, requiring different approaches to adequately monitor each segment. These include sailfish, a widely popular sport fish that is frequently caught in coastal waters during both targeted trips and as bycatch during non-HMS targeted trips. In contrast, there is the highly specialized fishery targeting swordfish. Dormant since the early 1980’s, renewed interest in this fishery quickly developed following implementation of the 2001 pelagic longline ban in the Straits of Florida, with over 1000 vessels reported to have conducted at least 1 targeted trip within the past year. The directed fishery for tunas has two groups: 1) one that targets skipjack and non-HMS managed blackfin tunas in waters that range from near shore out to great distances over bottom depths exceeding 1000 ft, 2) one that seasonally conducts long-range trips (>50 miles) primarily targeting YFT during the spring and summer. Finally, there is the shark fishery, which has primarily become a bycatch fishery with some targeted trips for catch and release fishing. Due to the differences distinguishing each fishery from its counterparts, an all inclusive monitoring program may not be adequate to sufficiently detect changes in these fisheries over time, nor to assess the impact of the recreational fishery on these resources. The following discussion addresses parameters for each HMS group and makes recommendations for future monitoring efforts. 5.5.1 Billfish
Billfish were targeted or caught during more than half of all the HMS trips reported during the PATS, while also being targeted by nearly 58% of all Angling permit holders that reported to have conducted at least 1 targeted HMS trip within the past year. Sailfish was the most frequently targeted and caught species during this study, accounting for nearly 98% of the 17,331 billfish and approximately 50% of all HMS estimated to have been caught. Primarily caught in the South Atlantic along the east coast of Florida and throughout the Florida Keys, nearly 90% of all billfish trips occurred within 25 miles from shore, half of which were in State waters where the HMS permit is not required. Marlin trips were not as common, but tended to occur further offshore in both the Atlantic and Gulf of Mexico. All species of billfish caught by private anglers in Florida are overwhelmingly released.
Florida Highly Migratory Species Private Angler Telephone Survey – Final Report
82
The regular occurrence of sailfish catches in coastal waters throughout the year and the high level of participation by Florida anglers facilitates sufficient monitoring through a general survey like the MRFSS. The close proximity to shore and daytime nature of the fishery resulted in most trips returning to their docks during hours when MRFSS assignments were primarily being conducted. It is no surprise then that the MRFSS has produced sailfish catch estimates with adequate precision over the past decade due to these factors. High precision does not necessarily equate to accurate estimates, though, as the disparity between the PATS and MRFSS sailfish catch estimates point out. Analysis of the PATS results identified limitations in the MRFSS design for estimating some aspects of the HMS fishery and the existence of coverage biases initially identified by the 2006 NRC report. The comparison of the spatial distribution of HMS activity reported during the PATS with the proportional distribution of the MRFSS field intercept sample draws attention to the limited effectiveness of the MRFSS to efficiently or precisely estimate catch for species that have localized spatial and temporal distributions within a sample region. The MRFSS is designed such that the intercept sample proportions are approximately representative of the proportional effort throughout each region for all recreational fishing. Results of this study clearly showed that this sample distribution does not reflect the distribution of effort for HMS across Florida. For example, sailfish are a rare event in the Gulf coast sample but they are locally common throughout the Keys. Similarly, the sailfish fishery in northeast Florida is significantly smaller and more seasonal than southeast Florida. The recognized inefficiency of this approach to monitor localized HMS (and non-HMS) fisheries across such large sample regions can be improved by stratifying Florida into smaller subregions. Essig and Holliday (1991) acknowledge that geographic area is a significant factor that should be considered in any recreational survey design, and on-site surveys that cover large geographic areas require a sufficient allocation of resources to be successful. The new MRIP can better monitor these localized fisheries by creating strata that are more homogeneous internally than the population as a whole, which would help ensure that a sample is representative of the population and reduces the variance of the population estimates (Pollock et al, 1994; Levy and Lemeshow, 1999). With a stratified sampling design, parameters can be estimated for the strata themselves with known precision, which would provide more valuable information to support the increasing demand for recreational data at finer management scales and for use in assessments (NRC 2006). By adopting a stratification of Florida similar to the one employed by the PATS, it would improve geographic resolution to provide better catch and effort estimates that more appropriately match the spatial and temporal distribution of the fishery. The existence of coverage biases were confirmed as billfish trips returning to public access sites reported significantly higher catch rates than similar trips returning to private access sites, potentially resulting in an overestimate of sailfish catches. Additionally, tournament fishing accounted for nearly 10% of all billfish trips, during which catch rates were more than twice as much as non-tournament fishing. The exclusion of tournament trips presents significant bias in the underestimation of sailfish catches. Reliance upon the RBS to document these catches is inadequate due to a large proportion of tournaments not registering with NOAA Fisheries HMS Management Division as required. These biases are not unique to just sailfish or billfish trips, and solutions to address them are currently being developed, tested, and eventually implemented by the new MRIP. Tournament trips could be included in the new MRIP to correct for non-registered tournaments in the HMS Management Division tournament registration census, while also allowing for CPUE comparisons with the RBS or even catch estimation. A separate MRIP pilot study recently examined HMS tournament sampling activities by the LPIS in the northeast U.S. and its recommendations for future monitoring efforts can potentially be applied to Florida, the Gulf of Mexico and South Atlantic HMS fisheries (MRIP, 2009b). Improvements to address under coverage of private access trips could start simply by adding a question to the MRIP
Florida Highly Migratory Species Private Angler Telephone Survey – Final Report
83
questionnaire that asks if the vessel will return to a private dock at the end of the trip. In its current format, MRFSS interviews can be conducted with anglers that have stopped fishing for the day, but have not necessarily returned to their home access site. Since fuel docks and waterfront restaurants are already included in the MRFSS site registry, classifying interviews as public and private access could produce sufficient numbers of interviews to allow CPUE adjustments for private access fishing. Based on the Characterization survey results, this would still miss at least 70% of private access vessels, but it would be an improvement. Sailfish total catch estimates should improve with the modifications to MRIP, but they would not adequately address marlin fishing which remain less common and more seasonal. The small number of directed marlin trips (8.3% of all billfish trips, including “billfish family” trips) recorded by the PATS are a challenge for any field intercept survey to provide sufficient sampling coverage. Not only were they rare, but marlin trips tended to occur further offshore and return later in the day than sailfish trips. In the Panhandle and northeast Florida, marlin trips would frequently return after MRFSS assignments were typically concluded for the day. A separate program that relies primarily on self-reported catch may be the best option and merits further consideration. Such a survey would utilize the HMS permit list as a sample frame since most marlin fishing occurs in Federal waters and the specialized tackle necessary limits the fishery to a smaller segment of the fishery. It would provide more complete coverage for private access fishing (adjusting for non-compliance and non-responsive anglers) than MRFSS or an improved MRIP. Coordination with the RBS is recommended since blue and white marlin remain popular species to target by tournament anglers. If the dedicated HMS Survey incorporates the previously discussed improvements to the PATS methodology (i.e. exploring the effectiveness of a longer sample period and utilizing email with telephone sampling), in conjunction with an increase in the vessel selection draw size during the spring-summer marlin (and YFT) season, it should result in capturing more marlin/YFT trips while minimizing the permit holders’ reporting burden. The inclusion of Bahamas fishing should also be considered due to U.S. vessels frequently traveling between U.S. and Bahamian waters to target marlin and YFT (landings would continue to be allocated to the appropriate country based on the location of the port catches are landed at). Since the new HMS Survey would rely upon the HMS permit list as its sample frame, a reliable method for determining what proportion of the fishery is “off-frame” (the proportion of non-permitted vessels) would be a necessary component. The addition of an HMS permit question to the modified MRIP would be the preferred mechanism for producing a correction factor for off-frame vessels conducting HMS trips. Heavy reliance on correction factors, though, can negatively impact the precision and reliability of the data. Considering this would probably be more of an issue if sailfish were also included in the HMS Survey (which is why the modified MRIP is still the preferred method to monitor sailfish), supplementing the HMS permit list with a second frame to improve coverage (e.g. Florida saltwater fishing license) in a dual-frame survey may be an appropriate solution (Currivan and Roe, 2004). The recommended changes to MRIP and proposed implementation of a new HMS Survey address the estimation of total effort and catches for billfish fishing activity by private recreational anglers. However, none of these changes would significantly improve upon monitoring efforts of the small number of billfish that are believed to be harvested each year. The rarity of such an event cannot be ignored; both due to management needs for ensuring harvest rates remain sustainable as well as to make certain the U.S. is in compliance with recommended quotas set by the International Commission for the Conservation of Atlantic Tunas (ICCAT). The existing HMS non-tournament reporting (HMS NTR) hotline/website attempts to do this by census, requiring all non-tournament landed billfish and swordfish to be reported to NOAA Fisheries within 24 hours upon the conclusion of the trip (the RBS
Florida Highly Migratory Species Private Angler Telephone Survey – Final Report
84
covers tournament landed billfish). The State of Florida also requires all landed billfish and swordfish to be reported to NOAA Fisheries via the HMS NTR, even though anglers are not required to obtain an HMS permit while fishing in State waters (anglers landing Atlantic tunas in State waters are still required to first obtain a Federal HMS or Atlantic Tunas permit and report bluefin tuna landings to NOAA Fisheries via the Automated Landings Reporting System – ALRS). Unfortunately, in its present format, NOAA Fisheries’ attempted landings census is difficult to validate and enforce; and the harvest counts it generates are believed to underestimate the true number of landed fish. Therefore, modifications to the HMS NTR (and ALRS for bluefin tuna) to enhance enforcement while minimizing the reporting burden for anglers are necessary for the census to be more effective. Currently, upon returning from a trip during which the angler lands a billfish, swordfish, or bluefin tuna they are granted a 24-hour grace period to report their catch to NOAA Fisheries either by the HMS NTR telephone or website (billfish and swordfish) or the ALRS (bluefin tuna). While the rule is designed to ease the burden of the reporting requirement, it makes enforcement extremely difficult if not impossible. Rules that are deemed necessary to effectively monitor the sustainability of the harvest have to be enforceable. Consequently, the 24-hour grace period should be eliminated and landed catches would have to be reported prior to the fish being removed from the vessel. At the same time, the reporting burden for anglers can be minimized by providing additional reporting options. The reporting telephone hotlines can be upgraded to accept landings reports and automatically produce a landing report number to confirm the report has been received. Furthermore, anglers should be able to submit landings reports via text messaging, e-mail, or through smart phone applications (Baker and Oeschger, 2009). The HMS NTR and ALRS should also be capable of accepting landings reports from anglers that do not possess an HMS permit as Florida does not require the permit if the fish was landed in State waters (with exception to bluefin tuna). Law Enforcement officers should be able to instantly access a landings report database from the field to verify a report has been submitted by an angler; either by the HMS permit number, vessel registration number, Florida saltwater fishing license number, or other identifying number. In conjunction with these changes, public outreach that emphasizes the conservation and management benefits of the reporting requirement should be initiated and/or expanded to target industry-related forums (e.g. fishing magazines, television and radio programs, fishing clubs, fishing seminars). Throughout the study, permit holders frequently asked samplers what was the purpose and/or benefit of their participation in the survey and reporting landed catches. Based on the positive support expressed by permit holders during the telephone sampling, monitoring efforts for all programs will benefit greatly if the “why” is effectively and consistently communicated to the recreational fishery. 5.5.2 Swordfish The reemergence of the recreational fishery for swordfish in the South Atlantic in 2001, developed over a relatively short period of time. In less than 10 years, at least 1,000 vessels are actively fishing for swordfish out of Florida ports in both the Atlantic and Gulf of Mexico. While the fishery is still primarily a nighttime fishery (58.7% of all swordfish trips), the expansion of the daytime fishery from being a rare event is now well established throughout the region. The fishery primarily operates in Federal waters within the Straits of Florida, usually within 25 miles from shore between bottom depths of 1000-2000 ft. Swordfish bycatch was rare due to the specialized nature of the fishing methods and area fished.
Florida Highly Migratory Species Private Angler Telephone Survey – Final Report
85
These characteristics make this fishery challenging to monitor with existing surveys like the MRFSS, and alternative sampling methods are likely needed to provide adequate coverage. First, the large proportion of nighttime trips immediately poses a coverage bias for the MRFSS. Whereas nighttime sampling pilot studies are currently being conducted in other areas of the country, significant safety and sampling efficiency issues may make standard field intercept sampling procedures ill-suited for this fishery. Safety concerns for samplers and the anglers returning from trips cannot be understated, especially in urban areas of southeast Florida. Nighttime assignments require two samplers for added safety, thereby doubling the costs. Additionally, the inefficiency of conducting dockside surveys in the middle of the night when only a small number of vessels may be actively fishing would require significantly more field assignments compared to daytime surveys (that would have the potential to also sample other HMS trips) to achieve a sufficient sample size. In consideration of these factors, a directed survey for swordfish is recommended. Swordfish would be included in the new HMS Survey described for billfish. The HMS permit list would be a suitable frame since compliance with HMS permit registration is believed to be high for swordfish anglers because the fishery is highly specialized, primarily occurs in Federal waters, and catches are regularly landed. Unlike the seasonal marlin (and YFT) fishery, swordfish were targeted year-round. As such, the proportion of vessels selected in southeast Florida and the Keys should be consistent year-round, while the lack of HMS activity in the Florida Panhandle and northeast Florida during the late fall and winter months justifies a seasonal adjustment in the vessel draw size. A method for determining the proportion of off-frame vessels would still be necessary because MRIP field assignments may not be suitable for generating off-frame correction factors for swordfish trips (especially nighttime). Furthermore, methods for validating catch and effort data would need to be employed. Catch rates would be generated from self-reported catches via the effort estimation program, with a census program serving as the primary data source for quantifying landings. The census could initially be continued through the proposed modified HMS NTR, with the accuracy of the census counts assessed by comparison with the self-reported catch data and some new form of field validation. Field validation of self-reported catch data could be conducted through a variety of methods. With the increasing popularity of targeting swordfish during the day, an improved MRIP may encounter more swordfish anglers, and MRIP field intercepts could be used to validate self-reported catches rather than be used to produce less precise catch estimates directly. Along those lines, some night sampling could be conducted with the goal of sampling a sufficient number of trips strictly for catch validation, thereby reducing the number of assignments and minimizing costs. This approach may not be adequate given the same concerns with using MRIP to generate an off-frame correction factor; whether this approach would achieve a large enough sample size given the rarity of swordfish trip intercepts by the MRFSS. Alternatively, dockside sampling at tournament weigh stations could be conducted along with a vessel-based roving creel survey for non-tournament and private access trips. The advantages of this approach would be to focus sampling efforts where more swordfish are likely to be encountered to increase access to biological data. The tournament sampling should be coordinated with the RBS or future tournament sampling program (MRIP, 2009b). The vessel-based roving creel survey would allow coverage of a broader area than a shore-based survey. It would also allow for a more equitable sampling of public and private access vessels. This would improve the efficiency of the survey, provides coverage to private access vessels, and would alleviate some safety concerns by keeping samplers in a safer environment that clearly identifies them as government staff when they approach vessels. Conversely, it addresses safety concerns anglers may have by clearly identifying the samplers. The use
Florida Highly Migratory Species Private Angler Telephone Survey – Final Report
86
of boats is potentially cost prohibitive, but is worth investigating before dismissing prematurely. Initial testing should consider pairing samplers with Law Enforcement officers as is currently done at some wildlife check stations. Validation of the effort estimates would also be a necessary component for the HMS Survey. The limited temporal and spatial nature of the fishery creates opportunities to successfully monitor it. The narrow fishing grounds may allow aerial surveys to be employed to validate the number of vessels actively fishing in a defined area within a standardized time period. Alternatively, roving surveys that count vessels offshore and shore-based vessel counts at natural choke points (i.e. inlets and passes), either by samplers or electronic monitoring devices, could also be explored as effort validation methods. Aerial surveys have been effectively employed to directly estimate effort in conjunction with a roving creel survey that collected CPUE data in the Delaware Bay, U.S.A. (Volstad et al, 2006). Rather than being relied upon to provide the primary effort estimate, aerial surveys would strictly be used for validation, thereby reducing the number of required missions and significantly reducing costs. Missions could be flown periodically for short time periods (three hours) to complete two passes (counts) over the longitudinally narrow fishing grounds off southeast Florida that accounted for 82.0% of swordfish trips. Aerial counts would be compared with trip reports for that night for effort adjustments. The advantages to this approach are that while the missions would primarily be flown at night, vessels fishing for swordfish would be well lighted, making them easy to count from a safe altitude, while also being spatially isolated from other vessels night fishing in much shallower depths for snapper, king mackerel, or tarpon. Daytime missions would be more problematic because other vessels targeting pelagic species could also be fishing in the same area. A shore-based coastal roving vessel count could feasibly count vessels fishing offshore and be considerably cheaper than an aerial mission. Counts would be limited to line of sight and would potentially miss vessels over the horizon. The survey would also take significantly longer to conduct and would have to move away from the coastline periodically due to the coastal roadway, potentially resulting in missed or double-counted vessels. Direct monitoring of inlets could either attempt to census all access points within the primary fishing area (up to eight inlets in southeast Florida) or randomly select inlets to sub-sample effort. Monitoring swordfish vessels passing through an inlet would be possible by observing the tackle necessary to target swordfish on each vessel that passes by. In addition, vessel names and registration numbers could potentially be recorded to be later matched up with the HMS permit list to determine the proportion of off-frame vessels. The use of samplers as spotters would make the census approach cost-prohibitive, while also raising similar safety concerns pertaining to nighttime field sampling. A census could be conducted more efficiently over the long-term by remote video cameras after the initial investment in equipment and installation. Assuming a multitude of factors are overcome to employ the monitoring equipment (e.g. getting permission to install and maintain equipment, ensuring sufficient lighting is available, etc.), simply distinguishing swordfish vessels passing through an inlet from other fishing vessels would be problematic if the anglers have stowed the specialized tackle away. Post-analysis of video data from multiple cameras would also be time consuming. Sub-sampling vessel counts at the inlets would be a more cost effective way using samplers, but in addition to having difficulty identifying swordfish vessels, they would also potentially encounter problems with vessels departing through one inlet, returning through another inlet after drifting north all night, and then transiting the Intra-Coastal Waterway to return to their access site (a common occurrence, especially when weather conditions are poor).
Florida Highly Migratory Species Private Angler Telephone Survey – Final Report
87
5.5.3 Tuna The tuna fishery shares many similarities to the billfish fishery, but on a smaller scale. A substantial portion of tuna trips occurred in coastal waters (< 25 miles from shore), primarily targeting skipjack and blackfin tunas. Blackfin tunas were not considered an HMS for this study because they are not managed under the Consolidated HMS Management Plan (hence, an HMS permit is not required to catch them) and are more adequately monitored than some HMS in Florida by the MRFSS. Many permit holders reported targeting “Tuna genus Thunnus” which did qualify as an HMS trip, even though this usually meant they expected to catch a blackfin, but that YFT were preferred. These skipjack/ “Tuna genus”/ blackfin tuna trips typically occurred in Federal waters within 25 miles from shore (42% of all tuna trips), with some occurring inside State waters (<9% of all tuna trips). Unlike sailfish, these trips were widely distributed across a broad range of depths, which was more of a reflection of bathymetric differences across the Florida subregions rather than on the distance from shore. Due to the frequency of these trips and the proximity of the fishing grounds to land, they are a relatively common occurrence in the MRFSS, especially trips with blackfin tuna catches. Tournament trips were not common for skipjack tunas and most of the trips returned during the daytime. Trips returning to private access sites, though, did report significantly higher catch rates than those using public access sites. Despite the higher catch rates, this does not appear to be resulting in underestimation of skipjack catches by the MRFSS considering the great disparity between the PATS and MRFSS estimates (3,952 fish versus 13,474-37,682 fish, respectively). It is more indicative that a large proportion of skipjack tunas are being caught by non-HMS-permitted anglers. Assuming implementation of the previously described changes to the MRFSS, especially in regards to attempting to improve coverage of private access fishing, these study results suggest skipjack tunas should be sufficiently monitored by the new MRIP. Yellowfin tuna is a very different fishery from the other tuna species fisheries in Florida, and as such has different characteristics that affect monitoring efforts. Directed trips that were really targeting YFT usually occurred great distances from shore (>50 miles), and mostly returned after 5pm. Some of these trips would often enter or fish just north of Bahamian waters before returning to a Florida port along the east coast of central Florida. The rarity of these trips and the later return times are the primary reasons why YFT are not represented in the MRFSS more often. This in despite of the presence of an established fishery as 628 vessels reported to have targeted YFT at least once within the past year, along with an additional 445 vessels that targeted “Tuna genus.” To improve monitoring efforts for YFT, the first step should be the stratification of MRFSS field intercept assignment start and end times as previously discussed. This would ensure more assignments are conducted during the late afternoon and evening hours to intercept these long-range trips. Future implementation of this temporal stratification in Florida, as well as throughout other areas of the South Atlantic and Gulf of Mexico, should determine if a general survey like the new MRIP is capable of adequately covering this fishery. In the interim, YFT should be included in the implementation of the new HMS Survey proposed for billfish and swordfish to collect more information on the fishery, both within Florida and the Bahamas. The HMS Survey would continue to fill the data gap for this species until the new MRIP is implemented. While self-reported catches for YFT are not used in other areas of the country, it will provide comparative CPUEs to help assess the effectiveness of the new MRIP. If YFT intercepts continue to be under represented by MRIP, its field access survey may still generate off-frame correction factors for the HMS Survey and provide some catch data to help validate self-reported catch rates as proposed for billfish and swordfish. In the event the new MRIP fails to provide a sufficient level of data even for validation purposes, directed field sampling for YFT trips could be seasonally conducted to help fill the data gap.
Florida Highly Migratory Species Private Angler Telephone Survey – Final Report
88
5.5.4 Sharks The recreational shark fishery for private anglers with HMS permits is almost exclusively a catch and release fishery for both bycatch and the limited number of directed trips. Due to the frequency of shark bycatch reported by permit holders while targeting non-HMS species (>70% of all shark trips) and the limited number of directed shark trips (only 15 of the 1086 HMS trips reported), it is reasonable to assume sharks are primarily being caught by non-HMS permitted anglers throughout Florida. Unlike the other HMS groups, the value of self-reported catches for sharks is limited due to the difficulty most anglers have in correctly identifying shark catches. Even in the field during MRFSS interviews when recall is highest, it is extremely difficult to ascertain an angler’s unobserved shark catch to the species level. The high live release rates for sharks (>99%) by recreational anglers is an encouraging development from a conservation stand point, but makes monitoring efforts more challenging. As such, the shark fishery should continue to be monitored primarily by the MRFSS and the future MRIP. Shark identification materials should be made available to samplers to hand out to recreational anglers and be used as a tool to help key out unobserved catches during field interviews. The extremely high release rates for sharks present a monitoring challenge for the limited harvest that continues to occur. Like billfish, any survey will be greatly challenged to adequately monitor exceptionally low harvest rates, but that does not eliminate the management need for harvest estimates and biological data to ensure shark populations are continuing to rebuild to more stable levels. Establishing a mandatory reporting requirement for some shark species of concern, such as great hammerhead, scalloped hammerhead, and tiger, as well as more common species like bull and shortfin mako. Despite not being quota-managed species, it is strongly recommended the modified HMS NTR or ALRS be capable of accepting landings reports for these more easily identifiable shark species. 5.6 Final Summary The final recommendations to better monitor Florida’s recreational HMS fisheries are summarized in Table 16. The results and subsequent recommendations of this study reaffirm the need for significant modifications to the MRFSS that should be incorporated during the development of its replacement, MRIP. These changes should include: 1) increasing the spatial stratification of Florida into smaller subregions from the current two (east Florida and west Florida) to improve geographic resolution of catch and effort estimates relative to the distribution of HMS fisheries, 2) instituting proportional stratification to the distribution of access point survey assignment start and end times to provide more coverage to trips returning in the late afternoon and evening, 3) classifying vessels as either public or private access during field intercepts and increasing sampling at fuel docks or other public access sites where private vessels may stop at, and 4) addressing the exclusion of tournament fishing, either by fully including tournament fishing in the survey as a new mode or by facilitating improvements to the RBS or a future tournament monitoring program. Adoption of these specific improvements, in addition to other design changes currently being evaluated by the MRIP Design and Analysis work group, should result in improved coverage and accuracy of estimates for sailfish, skipjack tuna, sharks, and possibly YFT. The MRIP modifications will not be sufficient for all HMS fisheries, though, as a specialized survey is necessary to adequately monitor marlin, swordfish, and YFT. The proposed HMS survey would utilize the HMS permit list as a sample frame for effort estimation and the collection of self-reported catch data. A dual-frame approach may be appropriate for this survey, possibly with a saltwater fishing
Florida Highly Migratory Species Private Angler Telephone Survey – Final Report
89
license frame, to minimize off-frame adjustments. The survey should be based on a monthly sample period (rather than biweekly) and attempt to employ e-mail or other electronic communication formats in conjunction with follow-up telephone sampling to alleviate the reporting burden for permit holders. Seasonal increases in the vessel selection draw size in the Florida Panhandle and northeast Florida subregions during the spring and summer months should also be considered. Due to the reliance upon self-reported catches for catch estimation, new catch and effort validation methodologies will be necessary to assess the accuracy of the survey. MRIP should authorize a pilot study to evaluate various approaches, including but not limited to 1) using MRIP catch data for comparing CPUEs for self-reported catch validation and generating correction factors for off-frame vessels (rather than being the primary data source for catch estimation), 2)conducting dockside sampling at HMS tournaments in conjunction with the RBS for increasing biological data and catch validation, 3) conducting limited field sampling during the day and at night in the form of either a shore-based or vessel-based roving creel survey for increasing biological data and catch validation for swordfish and YFT, and 4) conducting aerial surveys, shore-based roving surveys, and/or vessel counts at inlets or passes for effort validation. The monitoring of HMS landings for billfish, swordfish, and some shark species should be primarily conducted by a census program. Improvements to the HMS NTR and ALRS have been proposed to enhance enforceability of the reporting requirement, while attempting to reduce reporting burdens for anglers. The addition of some shark species to the HMS reporting requirement has been strongly recommended due to the limitations of any survey to accurately estimate limited harvests. The HMS Survey catch estimates would be used to evaluate the effectiveness of these proposed modifications. Implementation of these changes should coincide with an expanded public outreach initiative to more effectively communicate the conservation and management needs and benefits for these programs and reporting requirements. Monitoring efforts will benefit greatly from an informed recreational fishery that actively participates with these programs. In addition, outreach efforts should attempt to increase awareness of the permit requirements for the HMS fishery and better explain the differences between the HMS and Atlantic Tunas permits to ensure recreational anglers obtain the appropriate permit for their fishing activities. These recommendations are not exclusively for Florida’s recreational HMS fisheries. A characterization study of HMS permit holders throughout the Gulf of Mexico and South Atlantic also revealed wide-spread participation in HMS fisheries, but identified similar monitoring challenges in most states; these included vessels returning late in the evening after MRFSS sampling was completed, private access fishing, and/or tournament fishing (MRIP 2009a). The proposed modifications to MRIP, implementation of the specialized HMS Survey, and improved census program for some HMS landings are fully applicable to addressing the coverage gaps for HMS fisheries throughout the South Atlantic and Gulf of Mexico. States that have more established YFT fisheries, like Louisiana and North Carolina, may be better suited to a specialized HMS access point survey like the LPIS. That is not to say the HMS Survey is not compatible with the needs for those states, though. Rather, catch estimations could be produced primarily from field data and validated by the self-reported phone data. A comprehensive HMS Survey that extended from Texas through North Carolina, and included the Bahamas, would dramatically improve the ability of managers to effectively monitor HMS fisheries throughout the region. The dual-frame survey would primarily use an e-mail-telephone format, augmented by an improved MRIP, RBS, ALRS/HMS NTR census, and a series of alternative sampling methodologies appropriate for each state/area’s needs to validate the self-reported data.
Florida Highly Migratory Species Private Angler Telephone Survey – Final Report
90
Table 16 – Summarized fishery characteristics, monitoring challenges, and recommendations for future monitoring efforts within Florida for each HMS group.
HMS Group - Species Characteristics Monitoring Challenges
Billfish
Sailfish
Common occurrence, widely targeted by anglers along east FL & the Keys
Popular tournament species, accounted for approximately 10% of trips and 20% total catch
90% of trips occur <25 miles from shore, half in State waters
Trips typically return mid-day
>99% of catches released
Half of trips occur in State waters where HMS permit is not required
Frequently caught as bycatch during non-HMS trips
Tournament catches excluded by MRFSS & under-reported to RBS
Public access trip catch rates higher than private access trips
Limited harvest by private anglers difficult to monitor through survey
Recommendations:
Modify MRFSS/MRIP to improve geographic resolution of estimates, include tournament trips to assist HMS Management Division’s tournament registry and RBS or produce separate estimates, classify trips as public or private access to monitor private access CPUE, quantify non-HMS-permitted vessels for HMS Survey correction factor
Test a new pilot HMS Survey to facilitate comparisons with MRIP estimates
Census for harvest via a modified HMS NTR
Blue Marlin &
White Marlin
Less common and seasonal in Florida relative to other species
Trips occur further offshore and return later in the day than sailfish
Occurs primarily in Federal waters
Rare trips difficult to monitor through general survey
Limited harvest by private anglers difficult to monitor through survey
Recommendations:
Implement new HMS Survey that relies on self-reported catch via an e-mail/telephone dual-frame survey
Census for harvest via a modified HMS NTR
Swordfish
Primarily a night fishery, but with an increasing daytime fishery
Primarily concentrated in SEFL
Occurs primarily over depths 1000-2000 ft < 25 miles from shore
Popular tournament fishery
Daytime fishing may result in higher harvest rates
Safety & logistical concerns regarding night sampling
Tournament catch rates potentially higher
Recommendations:
Implement new HMS Survey that relies on self-reported catch via an e-mail/telephone dual-frame survey
Conduct pilot testing of alternative methodologies to collect biological data and validate self-reported catch & effort data
Census for harvest via a modified HMS NTR
Florida Highly Migratory Species Private Angler Telephone Survey – Final Report
91
HMS Group - Species Characteristics Monitoring Challenges
Tuna
Skipjack
Fairly common occurrence, frequently caught as bycatch by anglers targeting blackfin & YFT, as well as other pelagic species
Trips widely range from nearshore State waters out to >100 miles
Trips typically return during the daytime
Frequently caught as bycatch during non-HMS trips
Public access trip catch rates higher than private access trips
Limited harvest by private anglers difficult to monitor through survey
Recommendations:
Modify MRFSS/MRIP to improve geographic resolution of estimates, , classify trips as public or private access to monitor private access CPUE, quantify non-HMS-permitted vessels for HMS Survey correction factor
Yellowfin
Less common and seasonal in Florida relative to other species
Long-range trips occur primarily >75 miles from shore & return later in afternoon or evening
East Florida trips frequently fish in or just north of Bahamian waters
Some tournament fishing
Public access trip catch rates higher than private access trips
Long-range trips typically return later in the day when MRFSS sampling has concluded
Tournament catches excluded by MRFSS & under-reported to RBS
Recommendations:
Modify MRFSS/MRIP to improve geographic resolution of estimates, proportionally stratify field assignment start and end times to increase coverage for trips returning during the late afternoon and evening, include tournament trips to assist HMS Management Division’s tournament registry and RBS or produce separate estimates, classify trips as public or private access to monitor private access CPUE
Implement new HMS Survey that relies on self-reported catch via an e-mail/telephone dual-frame survey
Shark
Primarily a bycatch fishery, very few directed trips
Very limited tournament fishing
>99% of catches were released
Poor identification of shark catches to species level by anglers
Primarily caught by non-HMS-permitted anglers as bycatch
Limited harvest by private anglers difficult to monitor through survey
Recommendations:
Modified MRFSS/MRIP (all proposals)
Census for harvest via a modified HMS NTR or ALRS for bull, great hammerhead, scalloped hammerhead, shortfin mako, & tiger sharks
Florida Highly Migratory Species Private Angler Telephone Survey – Final Report
92
6. REFERENCES Baker, Scott M. Jr. and Ian Oeschger. 2009. Description and initial evaluation of a text message based
reporting method for marine recreational anglers. Marine and Coastal Fisheries: Dynamics, Management, and Ecosystem Science, 1:143-154.
Berkeley, S.A. and E.W. Irby. Analysis of catch, effort, and landing data in the swordfish longline fishery of the Florida Straits. International Council for the Exploration of the Sea CM 1982/H:53, 12 p.
Burgess, R. 1966. New billfish discovery. Field and Stream, September, 1966.
Coddington, R. 2006. Defending the Capital. Florida Sportsman, March, 2006: 144-149.
Cooke, S.J. and C.D. Suski. 2004. Are circle hooks an effective tool for conserving marine and freshwater recreational catch-and-release fisheries? Aquatic Conserv. Mar. Freshw. Ecosyst. 14:299-326.
Currivan, D.B. and D.J. Roe. 2004. Using a dual-frame sample design to increase the efficiency of reaching population subgroups in a telephone survey. Paper presented at the American Association of Public Opinion Research 59th annual meeting.
Essig, R.J. and M.C. Holliday. 1991. Development of a recreational fishing survey: the Marine Recreational Fishery Statistics Survey case study. In: Guthrie, D., J. Hoenig, M. Holliday, C. Jones, M. Mills, S. Moberly, K. Pollock and D. Talhelm, editors. Creel and Angler Surveys in Fisheries Management. American Fisheries Society Symposium 12: 245-254.
Govoni, J.J, E.H. Laban and J.A. Hare. 2003. The early life history of swordfish in the western North Atlantic. Fishery Bulletin, 101:778-789.
Gregg, W.H. 1902. Where, When, and How to Catch Fish on the East Coast of Florida. Mathews-Northrup Works, 268 p.
Heuter, R.E. 1991. Survey of the Florida recreational shark fishery utilizing shark tournament and selected longline data. Mote Marine Laboratory Technical Report 232A. 94 p.
Jolley, J. 1974. On the biology of Florida east coast Atlantic sailfish (Istiophorus playtpterus). NOAA Tech. Report NMFS SSRF-675.
Levesque, J.C. and D.W. Kerstetter. 2007. First observations on the re-established southeast Florida recreational swordfish tournament fishery. Florida Scientist 70(3):284-296.
Levy, P.S. and S. Lemehow. 1999. Sampling of Populations, Methods and Applications. Third Edition. John Wiley & Sons, New York.
Marine Recreational Information Program (MRIP). 2009a. Characterization of rod and reel Highly Migratory Species fisheries in the U.S. south Atlantic & Gulf of Mexico. HMS Work Group report
Marine Recreational Information Program (MRIP). 2009b. Evaluation of the sampling distribution of tournament versus non-tournament trips in the Large Pelagic Survey. HMS Work Group report
National Research Council of the National Academies (NRC). 2006. Review of Recreational Fisheries Survey Methods. The National Academies Press, Washington, D.C.
Pollock, K.H., C.M. Jones, and T.L. Brown. 1994. Angler Survey Methods and Their Applications in Fisheries Management. Special Publication 25, American Fisheries Society, Bethesda, MD.
Rivkin, M. 2009. The West Palm Beach Fishing Club: A 75-Year History. Silverfish Press, 245 p.
Florida Highly Migratory Species Private Angler Telephone Survey – Final Report
Taylor, R.G. and M.D. Murphy. 1992. Reproductive biology of the swordfish Xiphias gladius in the Straits of Florida and adjacent waters. Fishery Bulletin, 90:809-816.
Volstad, J.H, K.H. Pollock and W.A. Richkus. 2006. Comparing and combining effort and catch estimates from aerial-access designs as applied to a larger-scale angler survey in the Delaware River. North American Journal of Fisheries Management, 26:727-741.
Florida Highly Migratory Species Private Angler Telephone Survey – Final Report
94
APPENDICES
Florida Highly Migratory Species Private Angler Telephone Survey – Final Report
95
Appendix A – Private Angler Telephone Survey questionnaire. (Questionnaire text size has been reduced to fit page)
Highly Migratory Species Private Angler Telephone Survey – Florida Pilot Study
Sample week: MAY 12 – MAY 25, 2008 Privacy Act Statement: This study is being conducted in accordance with the Privacy Act of 1974. You are not required to answer any question that you consider to be an invasion of your privacy.
Date Day of Week
Trip Type
(Private, Tournament, or
Commercial)
# of Anglers
(Please record how
many people fished
aboard your vessel)
Origin of Trip
(Please identify the name of the site your trip originated from.)
Target Species
(Please
list up to 3 species
of fish you tried to catch on this
trip)
Area Fished & Location Distance from shore
(How far
from shore did
you primarily fish from)
Avg. Bottom Depth
(What
was the average bottom that you
fished over)
Trip Time (24hr)
(Record the time your vessel departed and
returned from the trip)
Fishing Time
(Record the time spent
fishing, that is lines in
the water, to the
nearest half-hr. Include
time spent catching
bait)
Multi-day
Trip?
(Was this an over night trip?)
Fishing Method
(What fishing method(s) did you use on this trip? If not listed, write in
method after “Other.” Please
check all that apply)
HMS Catch
(Check one box for the area fished) note: GOM=
Gulf of Mexico
(Provide the specific location
fished, i.e. a local name, Lat/Long, nearest
inlet/pass)
Catch Disposition: (select the disposition for each fish caught)
(select the type of
hook used for each species)
1=Circle 2=J-Hook 3=Treble
1=Released alive (legal) 2=Released alive (illegal) 3=Landed to be eaten 4=Used for bait
5=Landed to be sold 6=Thrown back dead 7=Trophy mount
Questions? Contact the FWC Field Coordinator - Dave McGowan (561) 575-5408 x24 [email protected]
Florida Highly Migratory Species Private Angler Telephone Survey – Final Report
97
Appendix B – HMS Characterization questionnaire. (Questionnaire text size has been reduced to fit page)
Florida Recreational Highly Migratory Species Fisheries Characterization Survey
VSL Name: ___________________ VSL ID#:___________ VSL Rep: ________________ Smplr ID: _________ Date: ___________ Q1. How many years total have you been saltwater fishing for highly migratory species, including billfish, sharks, tunas, or swordfish? ____ Years Q2. How many years have you gotten an HMS fishing permit for any vessel? ____ Years Q3. What is the current principle port for the [vsl name]?
____ Public Marina ____ Public Ramp ____ Private Dock ____ Private Marina ____ Other
<MRFSS site code or site name/location> Q4. Did you primarily use this site for the [vsl name] when fishing for highly migratory species in the past 12 months?
Y / N Q4a. If no, what access site did you primarily use for HMS trips?
____ Public Marina ____ Public Ramp ____ Private Dock ____ Private Marina ____ Other
<MRFSS site code or site name/location> Q5. Did the [vsl name] stop at another marina, fuel dock, or other public access site when returning from highly migratory species fishing trips? Always - Go to Q5a Often - Go to Q5a Sometimes - Go to Q5a Never - Go to Q6 Q5a. What is the name(s) of the marina/access site that the [vsl name] stopped at when returning from HMS fishing?
<MRFSS site code or site name/location> Q6. Did you ever use any other access sites for the [vsl name] when fishing for highly migratory species in the past 12 months?
Y / N
If yes, what other access sites did you use for HMS trips?
<MRFSS site code or site name/location> Q7. During the past 12 months, approximately how many recreational saltwater fishing trips targeting any highly migratory species did the [vsl name] make? ____ Trips Of these trips, approximately how many or what proportion was targeting:
Billfish # Trips % Trips
<Species name>
<Species name>
Sharks
<Species name>
<Species name>
Tunas
<Species name>
<Species name>
Swordfish
Q8. During the past 2 months, approximately how many recreational saltwater fishing trips targeting billfish, sharks, tunas, or swordfish did the [vsl name] make? ____ Trips Of these trips, approximately how many or what proportion was targeting:
Billfish # Trips % Trips
<Species name>
<Species name>
Sharks
<Species name>
<Species name>
Tunas
<Species name>
<Species name>
Swordfish
Q9. In the future, would you be willing to participate in a similar survey conducted via email?
Y / N Q9a. If yes, would you be willing to provide an active email address?
Florida Highly Migratory Species Private Angler Telephone Survey – Final Report
98
Appendix C – Private Angler Telephone Survey pre-notification contact letter
Highly Migratory Species Private Angler Telephone Survey Florida Pilot Study – Marine Recreational Information Initiative
Florida Fish & Wildlife Conservation Commission - Fish & Wildlife Research Institute 100 Eighth Avenue SE, St. Petersburg, FL 33701
Phone: (727) 896-8626, Ext. 1700 May 12, 2008
«REP_1ST» «REP_LST» «REP_ADD» Vessel Registration: «VSL_NUM» «REP_CTY», «REP_ST» «REP_ZIP» Vessel Name: «VSL_NAME» Dear «REP_1ST» «REP_LST», In cooperation with representatives of the recreational fishing community, a new pilot study has been developed by state and federal biologists with the Florida Fish & Wildlife Conservation Commission (FWC), Gulf States Marine Fisheries Commission (GSMFC) and NOAA Fisheries to better assess recreational fisheries targeting highly migratory species (HMS). Highly migratory species include billfish, sharks, tunas, and swordfish. The primary objectives of this study are to estimate directed fishing effort and characterize the catch rates of recreational HMS trips from private boats throughout Florida. A telephone survey will be used to collect this information over a 12 month period of time. The information collected during study is necessary to estimate the relative size and magnitude of HMS recreational fishing by private anglers, and to collect baseline information on unknown aspects of this segment of the recreational fishery that will guide implementation of an improved data collection method in the southeastern United States. We have drawn a 10% random sample of HMS-permitted private fishing vessels in Florida and you have been selected to report your saltwater fishing activity for the weeks of May 12 – May 25, 2008. You will be requested to report information about the trips you made only on the «VSL_NAME». Beginning on Monday, May 26, 2008, a field biologist at the FWC Tequesta Field Lab will try to contact you by phone to obtain the information. The enclosed form for recording your fishing activity is provided for your convenience, but it is not required to be completed. Participation in this study is voluntary and greatly appreciated. All information provided by you is protected by the Privacy Act of 1974 and will remain confidential. Your participation ensures that the FWC, GSMFC and NOAA Fisheries have the best data available to understand the recreational HMS fishery and to design policies that take into account both the fish populations and anglers, like yourself, who pursue them. Ultimately this information will help the recreational fishing industry be fairly represented in the fishery management process to maintain a sustainable fishery. If you have any questions concerning this form or this survey, please contact the project coordinator, Dave McGowan, at the Tequesta Field Lab, (561) 575-5408 or dave.mcgowan@ myfwc.com. You may also contact me at the Fish and Wildlife Research Institute at the numbers listed below. Thank you for your cooperation. Sincerely, Dr. Richard Cody, Research Administrator
Fishery Dependent Monitoring Fish & Wildlife Research Institute Florida Fish & Wildlife Conservation Commission 100 8th Avenue SE St. Petersburg, FL 33701
(727) 896-8626 Ext. 1700 [email protected] Dave McGowan, Biological Scientist II Fish & Wildlife Research Institute Florida Fish & Wildlife Conservation Commission Tequesta Field Lab 19100 SE Federal HWY Tequesta, FL 33469 (561) 575-5408 (561) 743-6228 fax SC 221-5408 (561) 459-7262 cell [email protected]
Florida Fish & Wildlife Conservation Commission · Gulf States Marine Fisheries Commission · NOAA Fisheries
Florida Highly Migratory Species Private Angler Telephone Survey – Final Report
99
Appendix D – PATS Angling permit dialing results for all sample weeks. Sample weeks are summarized by wave (bold), and waves are summarized by year. N indicates number of vessels selected per wave.
Florida Highly Migratory Species Private Angler Telephone Survey – Final Report
100
Appendix E – PATS General permit dialing results for all sample weeks. Sample weeks are summarized by wave (bold), and waves are summarized by year. N indicates number of vessels selected per wave.
Combined Year N=404 42.5% 7.9% 25.7% 0.9% 23.0% 29
Florida Highly Migratory Species Private Angler Telephone Survey – Final Report
101
Appendix F – List of all tournaments by Florida subregion in which HMS Angling permit holders participated. “REG” identifies tournaments registered with NOAA Fisheries HMS Management Div.
COUNTY Tournament Name Date Range REG HMS Grp
PANH
Okaloosa 2008 Emerald Coast Blue Marlin Classic 26-Jun-08 Y Bill/Sword
Escambia 2008 Pensacola International Billfish Tourn. 3-Jul-08 Y Bill/Tuna
Escambia No name provided 8-Aug-08 N Shark
Escambia No name provided 26-Jul-08 N Tuna
Escambia No name provided 21-Jun-08 N Non-HMS
KEYS
Keys No name provided 1-Aug-08 N Billfish
Keys Paradise Ocean Reef Sailfish Tourn. 27-FEB to 1-MAR-09 N Billfish
Keys World Sailfish Championship 15-APR to 18-APR-09 Y Billfish
Keys Islamorada Swordfish Tourn. 15-AUG to 16-AUG-08 Y Sword
SEFL
Martin Treasure Coast Association 24-MAY to 25-MAY-08 N Billfish
St. Lucie No name provided 8-Jun-08 N Billfish
Broward ABC 13-JUN to 14-JUN-08 N Billfish
Martin No name provided 28-Jun-08 N Billfish
Martin Stuart Sailfish Club Member's Tournament 2008 8-Nov-08 Y Billfish
Martin Sailfish Point Tournament 10-JAN to 11-JAN-09 N Billfish
Palm Bch Palm Beach Doubleshot 2009 22-JAN to 24-JAN-09 Y Billfish
Miami Mayor's Cup 2009 24-JAN to 25-JAN-09 Y Billfish
Broward 44th Annual Fort Lauderdale Billfish 2009 7-FEB to 8-FEB-09 Y Billfish
Broward ABC/World Diamond Source Billfish Challenge 21-Feb-09 Y Billfish
Miami Captain Bob Lewis Billfish Challenge 2009 28-FEB to 1-MAR-09 Y Billfish
Miami Miami Beach Billfish Tournament 3-APR to 5-APR-09 N Billfish
Palm Bch No name provided 16-May-08 N Bill/Tuna
Miami Fisherama 2008 31-May-08 Y Bill/Tuna
Palm Bch 'Swordfish Kickoff 2008 23-May-08 Y Sword
Palm Bch Hydro Glow Summer Swordfish Slam 2008 21-JUN to 22-JUN-08 Y Sword
Palm Bch Hydro Glow 28-Jun-08 N Sword
Broward No name provided 28-Jun-08 N Sword
Miami Miami Swordfish Tournament 2008 12-SEP to 13-SEP-08 Y Sword
Palm Bch Grand Slam Castaways Summer Broadbill Classic 11-Oct-08 Y Sword
Miami Sailfish Cup 12-Oct-08 Y Sword
Broward Hydro Glow 3-Dec-08 N Sword
Broward Full Moon Winter Swordfest 2008 6-Dec-08 Y Sword