December 29, 2017 L-2017-149 GL 2004-02 U. S. Nuclear Regulatory Commission Attn: Document Control Desk Washington, DC 20555-0001 Re: Turkey Point Units 3 and 4 Docket Nos. 50-250 and 50-251 Renewed Facility Operating Licenses DPR-31 and DPR-41 Updated Final Response to NRC Generic Letter 2004-02 With this letter, Florida Power & Light Company (FPL) provides an updated final response to Generic Letter (GL) 2004-02, Potential Impact of Debris Blockage on Emergency Recirculation During Design Basis Accidents at Pressurized-Water Reactors, for Turkey Point Nuclear Units 3 and 4 (Turkey Point). In GL 2004-02, the U.S. Nuclear Regulatory Commission (NRC) requested licensees to evaluate the potential for post-accident debris blockage and debris-laden fluids to impede or prevent Emergency Core Cooling System (ECCS) and Containment Spray System (CSS) recirculation phase performance following a postulated design basis accident, and to implement any plant modifications determined necessary to ensure ECCS and CSS system functionality. GL 2004-02 cited the findings of Generic Safety Evaluation (GSI) 191, Assessment of Debris Accumulation on PWR Sump Performance, which identified that recirculation sump clogging at Pressurized Water Reactors (PWR) is a credible concern, and established a schedule for licensee response. Attachment 1 to this letter identifies the documents referenced herein. In References 1 and 2, FPL, the licensee for Turkey Point, submitted responses to the information requested in GL 2004-02. In References 3 through 19, FPL responded to requests for additional information (RAI) that the NRC determined were necessary to complete its review, established commitments for completion of specified corrective actions and provided supplemental information summarizing testing, analyses and modifications that were planned or completed at Turkey Point. In Reference 20, the NRC Commission approved staff's recommendation to provide licensees three options for resolution of GSI-191 with recognition that licensee measures completed thus far have contributed greatly to the safety of U.S. nuclear power plants. In Reference 21, FPL notified staff of its selection for resolution of GSI-191 in accordance with the closure options specified in Reference 20 and additionally summarized the remaining GL 2004-02 related actions requiring completion. Throughout this time, FPL has implemented plant upgrades, defense in-depth measures and mitigation strategies at Turkey Point which have bolstered the capacity of the Containment sump screens, minimized the generation of debris that could affect ECCS and CSS recirculation phase performance, and managed Containment sump inventory to ensure proper ECCS and CSS performance. In addition, recent industry and plant-specific analyses have demonstrated that the risk of GSI-191 related failures is very low. Based upon these significant improvements in plant safety, FPL hereby rescinds the GSI-191/GL 2004-02 related commitments described in previous correspondence submitted on behalf of Turkey Point and submits the enclosed bases for resolution of GSI-191 and thereby closure of GL 2004-02. Consistent with the recommendations specified in Option 2a of Reference 20, FPL can conclude with reasonable assurance that the long-term core cooling requirements of 10 CFR 50.46(b)(5) will be satisfied for any design basis accident requiring Containment sump recirculation phase performance at Turkey Point. Florida Power & Light Company 9760 SW 344 th St., Florida City, FL 33035
Transcript
December 29, 2017 L-2017-149 GL 2004-02
U. S. Nuclear Regulatory Commission Attn: Document Control Desk Washington, DC 20555-0001
Re: Turkey Point Units 3 and 4 Docket Nos. 50-250 and 50-251 Renewed Facility Operating Licenses DPR-31 and DPR-41
Updated Final Response to NRC Generic Letter 2004-02
With this letter, Florida Power & Light Company (FPL) provides an updated final response to Generic Letter (GL) 2004-02, Potential Impact of Debris Blockage on Emergency Recirculation During Design Basis Accidents at Pressurized-Water Reactors, for Turkey Point Nuclear Units 3 and 4 (Turkey Point). In GL 2004-02, the U.S. Nuclear Regulatory Commission (NRC) requested licensees to evaluate the potential for post-accident debris blockage and debris-laden fluids to impede or prevent Emergency Core Cooling System (ECCS) and Containment Spray System (CSS) recirculation phase performance following a postulated design basis accident, and to implement any plant modifications determined necessary to ensure ECCS and CSS system functionality. GL 2004-02 cited the findings of Generic Safety Evaluation (GSI) 191, Assessment of Debris Accumulation on PWR Sump Performance, which identified that recirculation sump clogging at Pressurized Water Reactors (PWR) is a credible concern, and established a schedule for licensee response.
Attachment 1 to this letter identifies the documents referenced herein. In References 1 and 2, FPL, the licensee for Turkey Point, submitted responses to the information requested in GL 2004-02. In References 3 through 19, FPL responded to requests for additional information (RAI) that the NRC determined were necessary to complete its review, established commitments for completion of specified corrective actions and provided supplemental information summarizing testing, analyses and modifications that were planned or completed at Turkey Point.
In Reference 20, the NRC Commission approved staff's recommendation to provide licensees three options for resolution of GSI-191 with recognition that licensee measures completed thus far have contributed greatly to the safety of U.S. nuclear power plants. In Reference 21, FPL notified staff of its selection for resolution of GSI-191 in accordance with the closure options specified in Reference 20 and additionally summarized the remaining GL 2004-02 related actions requiring completion.
Throughout this time, FPL has implemented plant upgrades, defense in-depth measures and mitigation strategies at Turkey Point which have bolstered the capacity of the Containment sump screens, minimized the generation of debris that could affect ECCS and CSS recirculation phase performance, and managed Containment sump inventory to ensure proper ECCS and CSS performance. In addition, recent industry and plant-specific analyses have demonstrated that the risk of GSI-191 related failures is very low.
Based upon these significant improvements in plant safety, FPL hereby rescinds the GSI-191/GL 2004-02 related commitments described in previous correspondence submitted on behalf of Turkey Point and submits the enclosed bases for resolution of GSI-191 and thereby closure of GL 2004-02. Consistent with the recommendations specified in Option 2a of Reference 20, FPL can conclude with reasonable assurance that the long-term core cooling requirements of 10 CFR 50.46(b)(5) will be satisfied for any design basis accident requiring Containment sump recirculation phase performance at Turkey Point.
Florida Power & Light Company
9760 SW 344th St., Florida City, FL 33035
Turkey Point Units 3 and 4 L-2017-149 Docket Nos. 50-250 and 50-251 Page 2 of 6
Enclosure 1 to this letter provides FPL’s bases for closure of GL 2004-02, which contains input based on both sound engineering judgement as well as documents verified through a 10 CFR 50 Appendix B program. The inputs from engineering judgement have been prepared, verified, and approved by knowledgeable engineers. The bases for closure include the completion of an alternate evaluation as described in Section 6 of NEI 04-07, Pressurized Water Reactor Sump Performance Evaluation Methodology (Reference 22), using NRC accepted methods as described in the associated safety evaluation (SE) for NEI 04-07 (Reference 23), and a core blockage analysis using the methodology described in WCAP-17788, Comprehensive Analysis and Test Program for GSI-191 Closure (Reference 24). FPL recognizes that the NRC’s review of WCAP-17788 has not been finalized. Accordingly, upon NRC approval of WCAP-17788, the completed in-vessel blockage analysis for Turkey Point will be reviewed and if warranted, a reanalysis will be performed.
Additionally, changes to the Turkey Point licensing basis have been implemented which allowed FPL to complete plant modifications that have enhanced Turkey Point’s capability to withstand GSI-191 related failures and thereby assure compliance with the long-term cooling requirements of 10 CFR 50.46(b)(5). Accordingly, the assumptions and inputs used to establish the bases for GL 2004-02 closure are consistent with the Turkey Point licensing basis and no new changes pursuant to 10 CFR 50.90 are being proposed as a result of this submittal. Upon NRC acceptance of FPL’s closure of GL 2004-02, the Turkey Point updated final safety analysis report (UFSAR) will be reviewed to determine if further changes to the licensing basis are appropriate in accordance with 10 CFR 50.71(e).
Section 1 of Enclosure 1 provides FPL’s statement of compliance with the Applicable Regulatory Requirements section of GL 2004-02 on behalf of Turkey Point. Section 2 of Enclosure 1 describes the corrective actions that were completed in response to GL 2004-02, provides a schedule for the remaining actions requiring completion and lists the significant margins and conservatisms that were utilized in the analyses. In keeping with the NRC’s Revised Content Guide for GL 2004-02 (Reference 25), Section 3 provides an evaluation of the sixteen identified issue areas, including the methodologies employed to arrive at a determination of acceptable performance and their bases for use. Section 3 also describes key aspects of completed plant modifications, process changes and supporting analyses that were applied in order to demonstrate with high confidence that the risk of GSI-191 related failures at Turkey Point has been reduced to an acceptable level. Section 4 lists the documents referenced in Enclosure 1.
This letter contains the following regulatory commitment (below). This letter supersedes all prior regulatory commitments identified in References 1 through 19, Reference 21, and related correspondence on behalf of Turkey Point.
Regulatory Commitment
Upon NRC approval of WCAP-17788, Comprehensive Analysis and Test Program for GSI-191 Closure, the completed in-vessel blockage analysis for Turkey Point will be reviewed and if warranted, a reanalysis will be performed within six months following approval of the WCAP-17788 methodology. (Enclosure 1, Section 2, General Description of and Schedule for Corrective Actions)
If you have any questions or require additional information, please contact Mr. Mitch Guth, Licensing Manager, at 305-246-6698.
Turkey Point Units 3 and 4 Docket Nos. 50-250 and 50-251
I declare under penalty of perjury that the foregoing is true and correct.
Executed on December 29, 2017.
Sincerely, L--~~mmeffi
Regional Vice President - Southern Region Florida Power & Light Company
Attachments: Attachment 1 - List of References Enclosure 1 - Updated Final Response to NRC Generic Letter 2004-02
cc: USNRC Regional Administrator, Region II USNRC Project Manager, Turkey Point Nuclear Plant USNRC Senior Resident Inspector, Turkey Point Nuclear Plant Ms. Cindy Becker, Florida Department of Health
L-2017-149 Page 3 of 6
Turkey Point Units 3 and 4 L-2017-149 Docket Nos. 50-250 and 50-251 Page 4 of 6
ATTACHMENT 1
REFERENCES
1. Florida Power and Light (FPL) Company/FPL Energy-Seabrook LLC letter L-2005-034, NRCGeneric Letter 2004-02 Potential Impact of Debris Blockage on Emergency Recirculation DuringDesign Basis Accidents at Pressurized Water Reactors, dated March 4, 2005 (ADAMS AccessionNumber ML050670429)
2. FPL/FPL Energy-Seabrook LLC letter L-2005-181, NRC Generic Letter 2004-02, Potential Impactof Debris Blockage on Emergency Recirculation During Design Basis Accidents at PressurizedWater Reactors - Second Response, September 1, 2005 (ADAMS Accession NumberML052490339)
3. FPL/FPL Energy-Seabrook LLC letter L-2005-145, NRC Generic Letter 2004-02 Request forAdditional Information Potential Impact of Debris Blockage on Emergency Recirculation DuringDesign Basis Accidents at Pressurized Water Reactors, dated July 20, 2005 (ADAMS AccessionNumber ML052080038)
4. FPL/FPL Energy-Seabrook LLC letter L-2006-028, GL 2004-02 Supplement to Response to NRCGeneric Letter 2004-02, Potential Impact of Debris Blockage on Emergency Recirculation DuringDesign Basis Accidents at Pressurized Water Reactors, dated January 27, 2006 (ADAMSAccession Number ML060310245)
5. FPL/FPL Energy-Seabrook LLC letter L-2007-155, Request for Extension of Completion Date ofthe St. Lucie Unit 1, St. Lucie Unit 2 and Turkey Point Unit 3, Generic Letter 2004-02 Actions,dated December 7, 2007 (ADAMS Accession Number ML073450338)
6. FPL letter L-2007-194, Response to Questions Regarding Request for Extension of CompletionDate of the St. Lucie Unit 1, St. Lucie Unit 2 and Turkey Point Unit 3 Generic Letter 2004-02Actions, dated December 20, 2007 (ADAMS Accession Number ML080090147)
7. FPL letter L-2008-033, Supplemental Response to NRC Generic Letter 2004-02, Potential Impactof Debris Blockage on Emergency Recirculation During Design Basis Accidents at Pressurized-Water Reactors, dated February 28, 2008 (ADAMS Accession Number ML080710429)
8. FPL letter L-2008-071, Generic Letter 2004-02, Downstream Effects Evaluation Status, datedMarch 28, 2008 (ADAMS Accession Number ML081050032)
9. FPL letter L-2008-073, NRC Generic Letter 2004-02, Request for an Extension to the CompletionDate for Ex-Vessel Downstream Effects Evaluations, dated April 15, 2008 (ADAMS AccessionNumber ML081070252)
10. FPL letter L-2008-099, Completion of Single Active Failure Analysis Related to NRC GenericLetter 2004-02,Potential Impact of Debris Blockage on Emergqency Recirculation During DesignBasis Accidents at Pressurized-Water Reactors, dated April 28, 2008 (ADAMS AccessionNumber MLML081340350)
11. FPL letter L-2008-138, Supplemental Response to NRC Generic Letter 2004-02, Potential Impactof Debris Blockage on Emergency Recirculation During Design Basis Accidents at Pressurized-Water Reactors, dated June 30, 2008 (ADAMS Accession Number ML081960386)
Turkey Point Units 3 and 4 L-2017-149 Docket Nos. 50-250 and 50-251 Page 5 of 6
12. FPL letter L-2008-160, Updated Supplemental Response to NRC Generic Letter 2004-02,Potential Impact of Debris Blockage on Emergency Recirculation During Design Basis Accidentsat Pressurized-Water Reactors, dated August 11, 2008 (ADAMS Accession NumberML082380244)
13. FPL letter L-2008-226, Request for Extension of Completion Date of the Turkey Point Unit 3Generic Letter 2004-02 Actions, dated October 31, 2008 (ADAMS Accession NumberML083190054)
14. FPL letter L-2009-062, Response to NRC Request for Additional Information Regarding theResponsesto GL 2004-02, Potential Impact of Debris Blockage on Emergency RecirculationDuring Design Basis Accidents at Pressurized-Water Reactors, TAC NO. MC4726, dated March24, 2009 (ADAMS Accession Number ML090930452)
15. FPL letter L-2009-063, Response to NRC Request for Additional Information Regarding theResponses to GL 2004-02, Potential Impact of Debris Blockage on Emergency RecirculationDuring Design Basis Accidents at Pressurized-Water Reactors, TAC NO. MC 4725, dated March19, 2009 (ADAMS Accession Number ML090920410)
16. FPL letter L-2009-176, Response in Support of Turkey Point Unit 3 Extension Request –Alternative Approach for Demonstrating Turkey Point Unit 3 Compliance with Generic Letter (GL)2004-02 Using Turkey Point Unit 4 Integrated Test Data, dated July 30, 2009 (ADAMS AccessionNumber ML092260601)
17. FPL letter L-2010-205, Turkey Point Unit 4 Responses to the NRC's Request for AdditionalInformation (RAI) Dated February 18, 2010 Regarding Generic Letter (GL) 2004-02, PotentialImpact Of Debris Blockage On Emergency Recirculation During Design Basis Accidents atPressurized-Water Reactors (TAC NO. 4726), dated September 17, 2010 (ML102650040)
18. FPL letter L-2010-211, Supplemental Information in Support of the Turkey Point Unit 3Responses in Letter L-2009-063 to the NRC's Request for Additional Information RegardingGeneric Letter (GL) 2004-02, "Potential Impact of Debris Blockage on Emergency Recirculationduring Design Basis Accidents at Pressurized-Water Reactors", dated September 20, 2010(ADAMS Accession Number ML102660026)
19. FPL/FPL Energy Seabrook LLC/FPL Energy Point Beach LLC letter L-2012-323, Strainer FiberBypass Test Protocol, dated August 10, 2012 (ADAMS Accession Number ML12228A330)
20. Staff Requirements Memorandum - SECY-12-0093 - Closure Options for Generic Safety Issue -191, Assessment of Debris Accumulation on Pressurized-Water Reactor Sump Performance,dated December 14, 2012 (ADAMS Accession Number ML12349A378)
21. FPL letter L-2013-163, Path Forward for Resolution of GSl-191, May 9, 2013, (ADAMS AccessionNumber ML13179A349)
22. Nuclear Energy Institute (NEI) 04-07, Volume 1, Pressurized Water Reactor Sump PerformanceEvaluation Methodology, Revision 0, December 2004 (ADAMS Accession No. ML050550138)
23. NEI 04-07, Volume 2, Pressurized Water Reactor Sump Performance Evaluation Methodology;Safety Evaluation by the Office of Nuclear Reactor Regulation Related to NRC Generic Letter2004-02, Revision 0, December 6, 2004 (ADAMS Accession No. ML050550156)
24. Westinghouse WCAP-17788, Volume 1, Comprehensive Analysis and Test Program for GSI-191Closure, Revision 0, July 2015 (ADAMS Accession No. ML15210A669)
Turkey Point Units 3 and 4 L-2017-149 Docket Nos. 50-250 and 50-251 Page 6 of 6
25. Revised Content Guide for Generic Letter 2004-02 Supplemental Responses, Enclosure,
November 2007 (ADAMS Accession No. ML073110278)
Enclosure 1 to FPL Letter L-2017-149 Updated Final Response to NRC Generic Letter 2004-02
Turkey Point Nuclear Power Plant
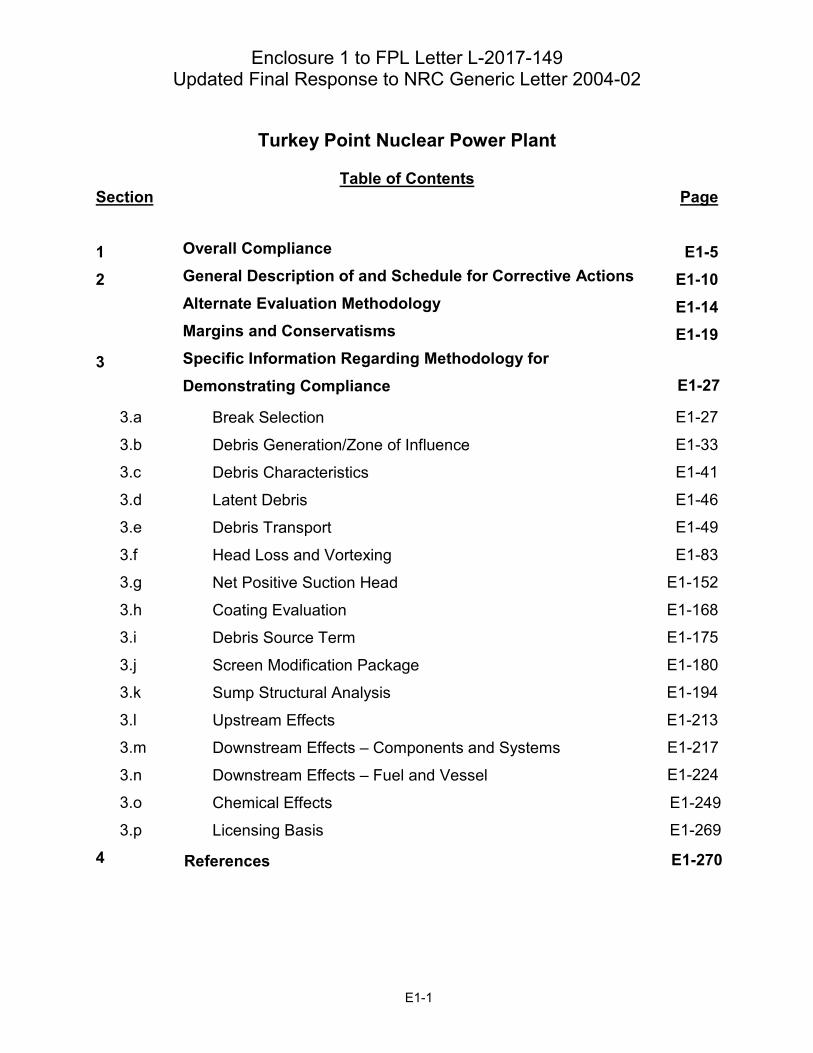
Table of Contents Section Page
1 2
3
3.a
3.b
3.c
3.d
3.e
3.f
3.g
3.h
3.i
3.j
3.k
3.l
3.m
3.n
3.o
3.p
4
Overall Compliance General Description of and Schedule for Corrective Actions Alternate Evaluation Methodology Margins and Conservatisms Specific Information Regarding Methodology for Demonstrating Compliance
Break Selection
Debris Generation/Zone of Influence
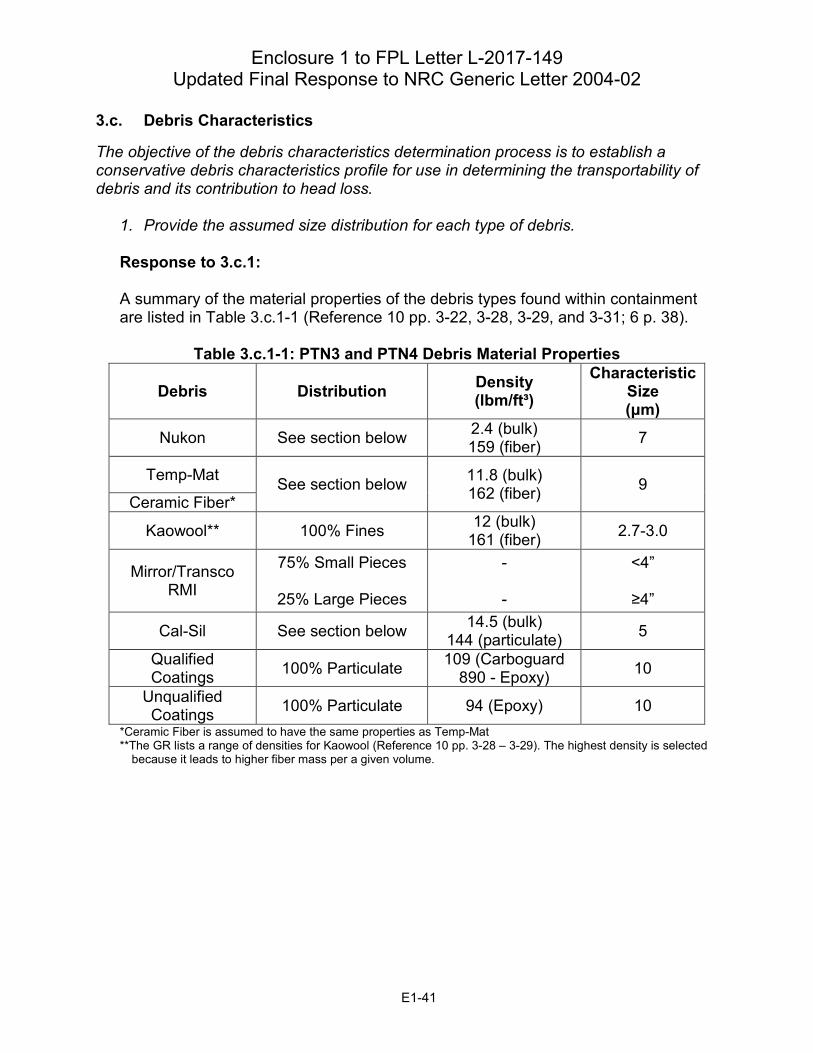
Debris Characteristics
Latent Debris
Debris Transport
Head Loss and Vortexing
Net Positive Suction Head
Coating Evaluation
Debris Source Term
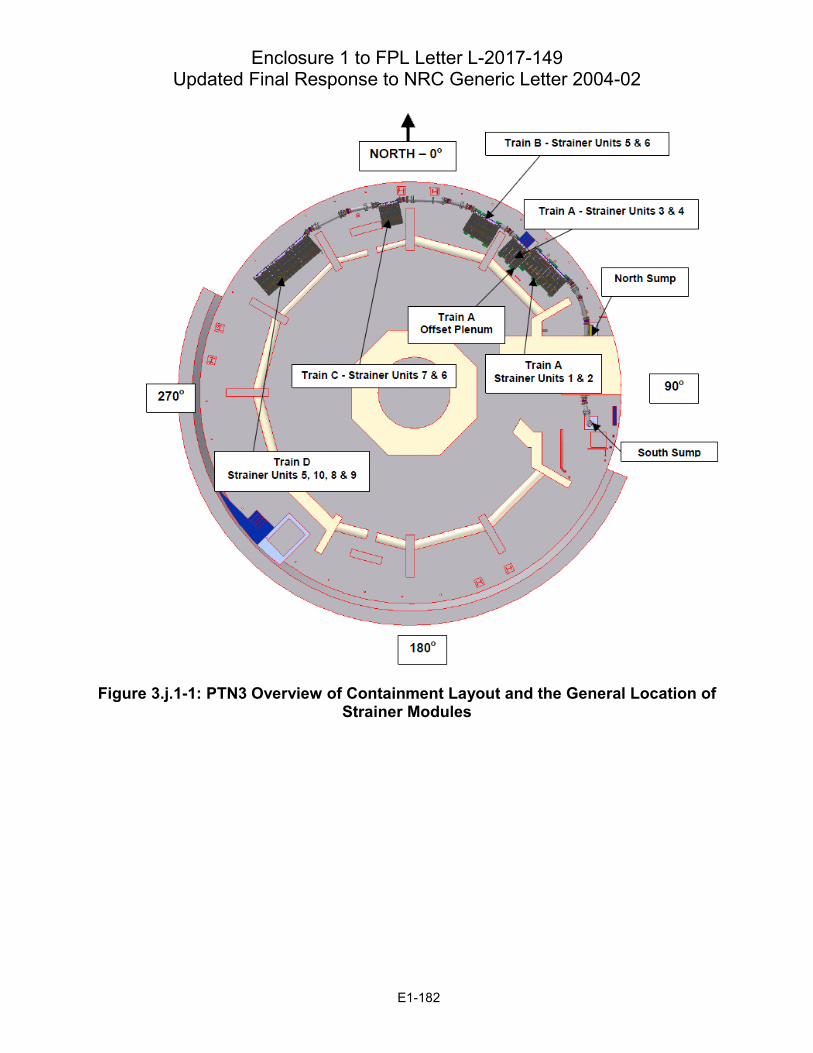
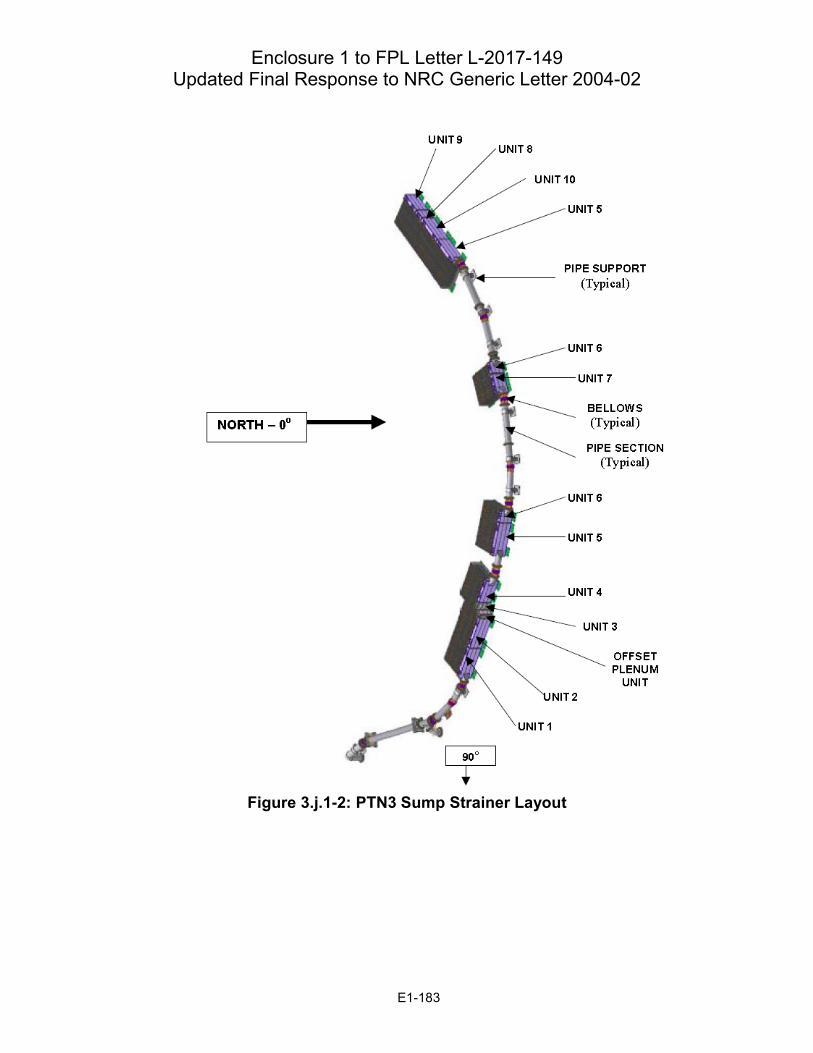
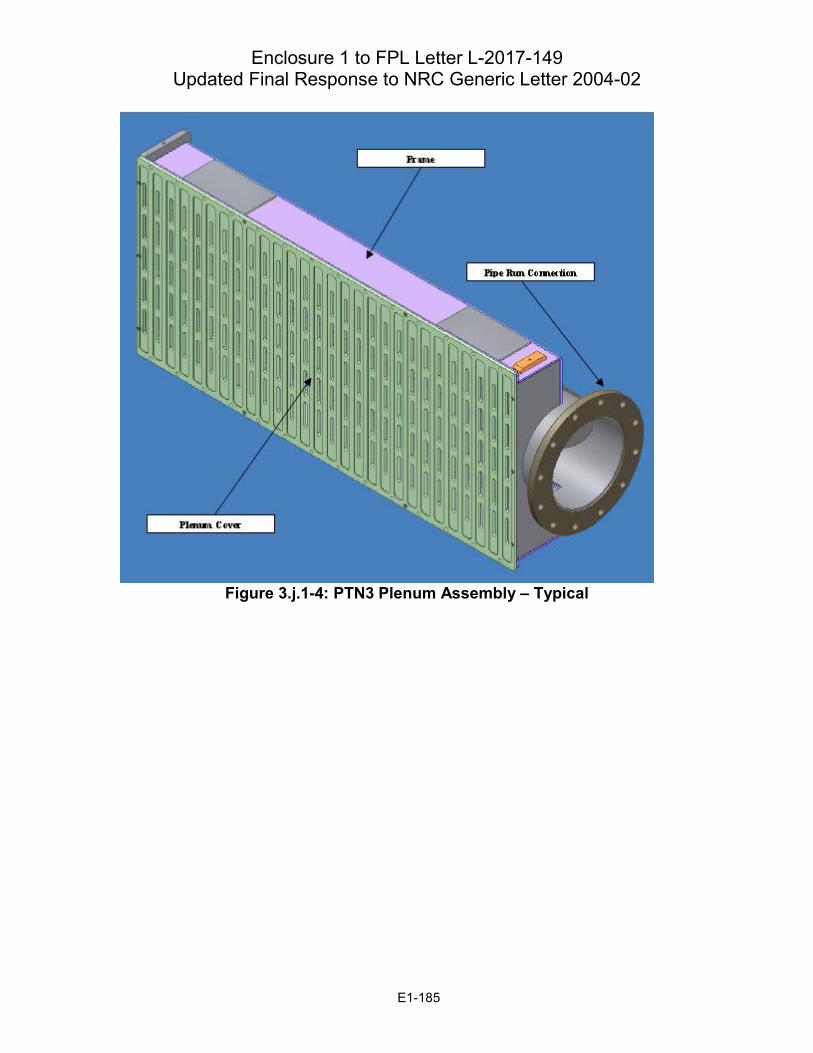
Screen Modification Package
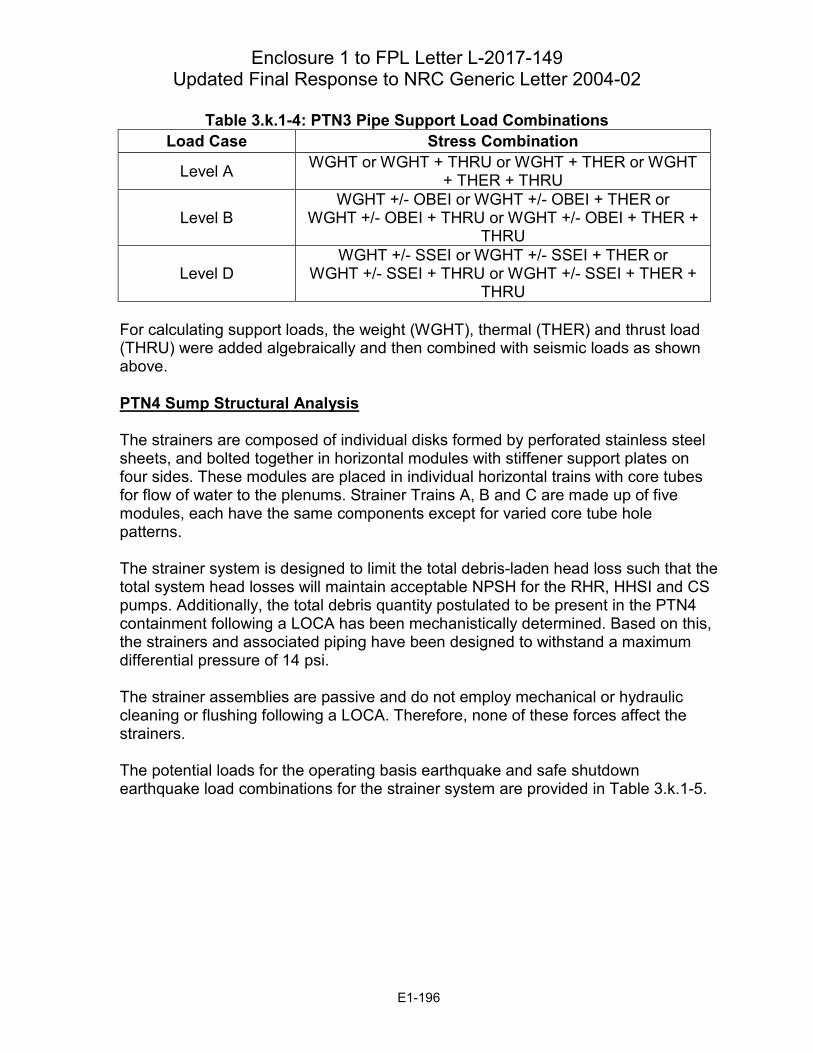
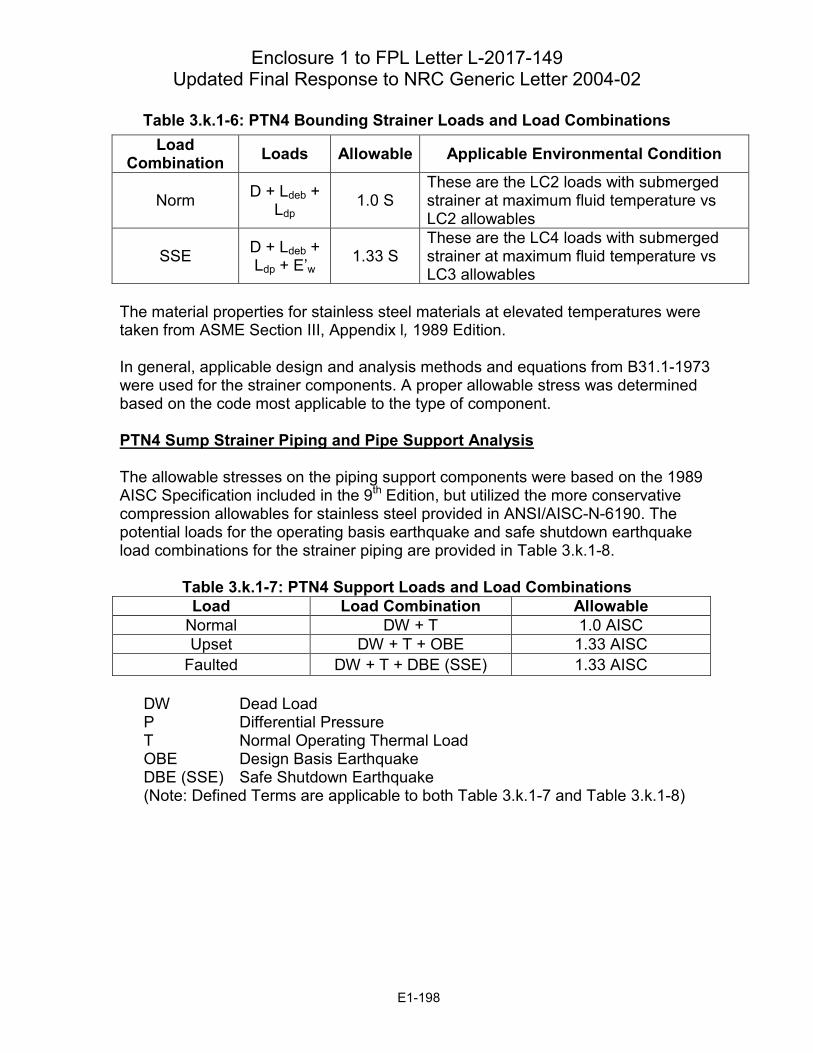
Sump Structural Analysis
Upstream Effects
Downstream Effects – Components and Systems
Downstream Effects – Fuel and Vessel
Chemical Effects
Licensing Basis
References
E1-5 E1-10 E1-14 E1-19
E1-27
E1-27
E1-33
E1-41
E1-46
E1-49
E1-83
E1-152
E1-168
E1-175
E1-180
E1-194
E1-213
E1-217
E1-224
E1-249
E1-269
E1-270
E1-1
Enclosure 1 to FPL Letter L-2017-149 Updated Final Response to NRC Generic Letter 2004-02
This enclosure provides Florida Power and Light’s (FPL’s) final response to Generic Letter (GL) 2004-02 (Reference 1) in the form of a stand-alone document that supersedes all previous GL 2004-02 submittals for Turkey Point Unit 3 (PTN3) and Unit 4 (PTN4). Previous requests for additional information (RAIs) are not specifically addressed in this submittal since this document is providing the information necessary to address the required information delineated in GL 2004-02. This enclosure follows the format and guidance provided by the Nuclear Regulatory Commission (NRC) (Reference 2; 3; 4; 5) and addresses all topical areas in those documents. The text from the NRC guidance is presented in italic script.
NRC Request, Summary-Level Description
The GL supplemental response should begin with a summary-level description of the approach chosen. This summary should identify key aspects of design modifications, process changes, and supporting analyses that the licensee believes are relevant or important to the NRC staff’s verification that corrective actions to address the GL are adequate. The summary should address significant conservatisms and margins that are used to provide high confidence the issue has been addressed even with uncertainties remaining. Licensees should address commitments and/or descriptions of plant programs that support conclusions.
Summary-Level Description for PTN
The key aspects of the approach chosen by FPL to resolve the concerns identified in GL 2004-02 are stated below for clarity:
• Extensive design modifications to significantly reduce the potential effects ofpost-accident debris and latent material on the functions of the emergency corecooling system (ECCS) and containment spray system (CSS) during therecirculation phase of accident mitigation.
• Extensive testing and analysis to determine break locations, identify and quantifydebris sources, quantify debris transport, determine upstream and downstreameffects, and confirm the recirculation function.
• Changes to the PTN3 and PTN4 licensing basis, including the final safetyanalysis report (FSAR) updates to account for the mechanistic sump strainerblockage evaluation.
• Extensive changes to plant programs, processes, and procedures to limit theintroduction of materials into containment that could adversely impact therecirculation function, and establish monitoring programs to ensure containmentconditions will continue to support the recirculation function.
• Application of conservative measures to assure adequate margins throughout theactions taken to address the GL 2004-02 concerns.
More details are provided for the plant-specific analyses, changes to the licensing basis, improvements in processes and programs, and conservatisms and margins.
E1-2
Enclosure 1 to FPL Letter L-2017-149
Updated Final Response to NRC Generic Letter 2004-02
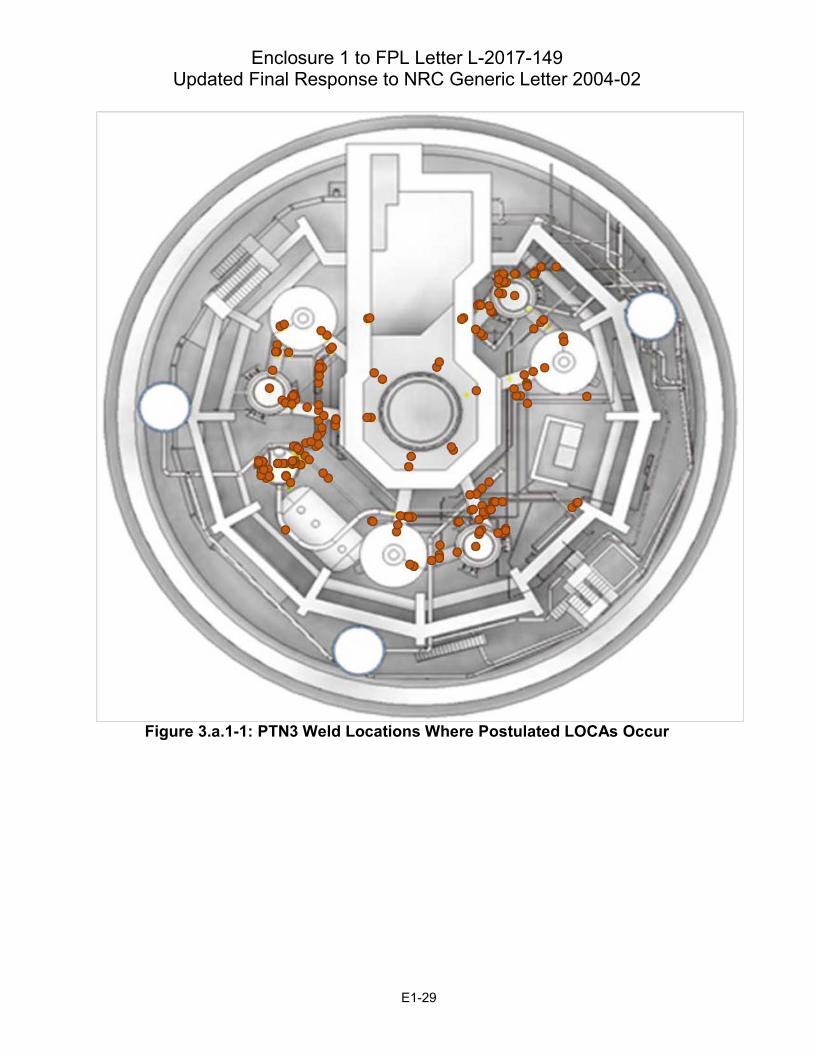
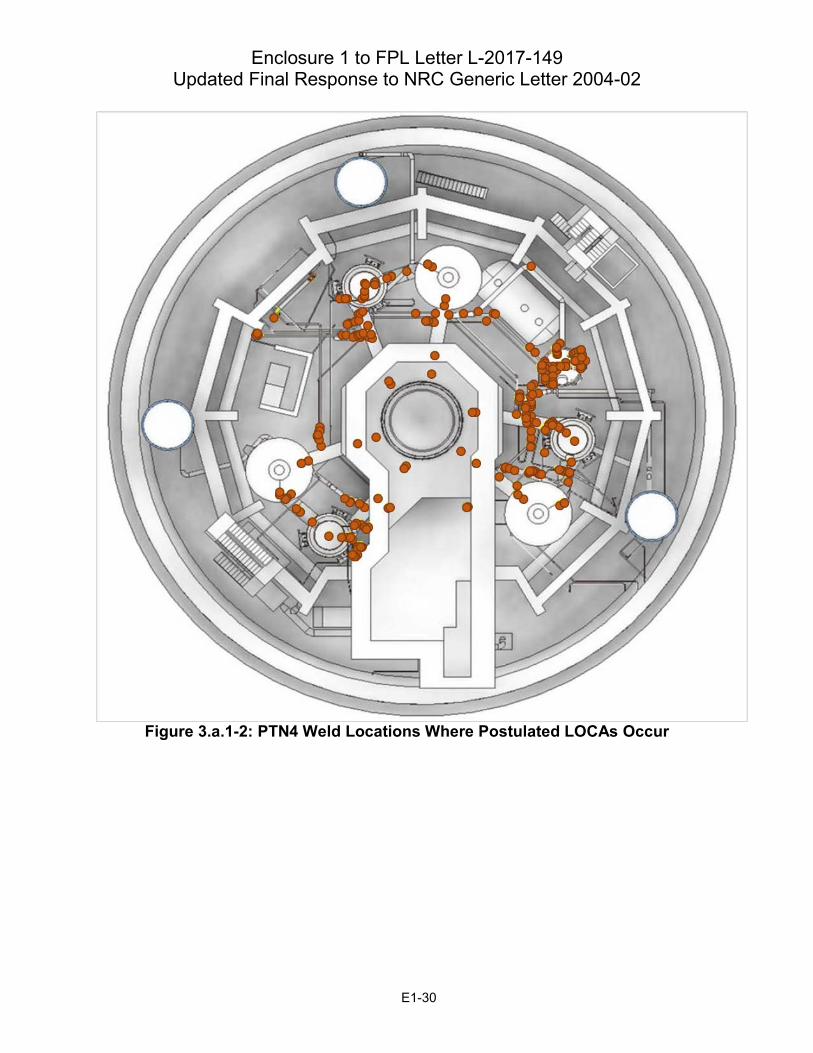
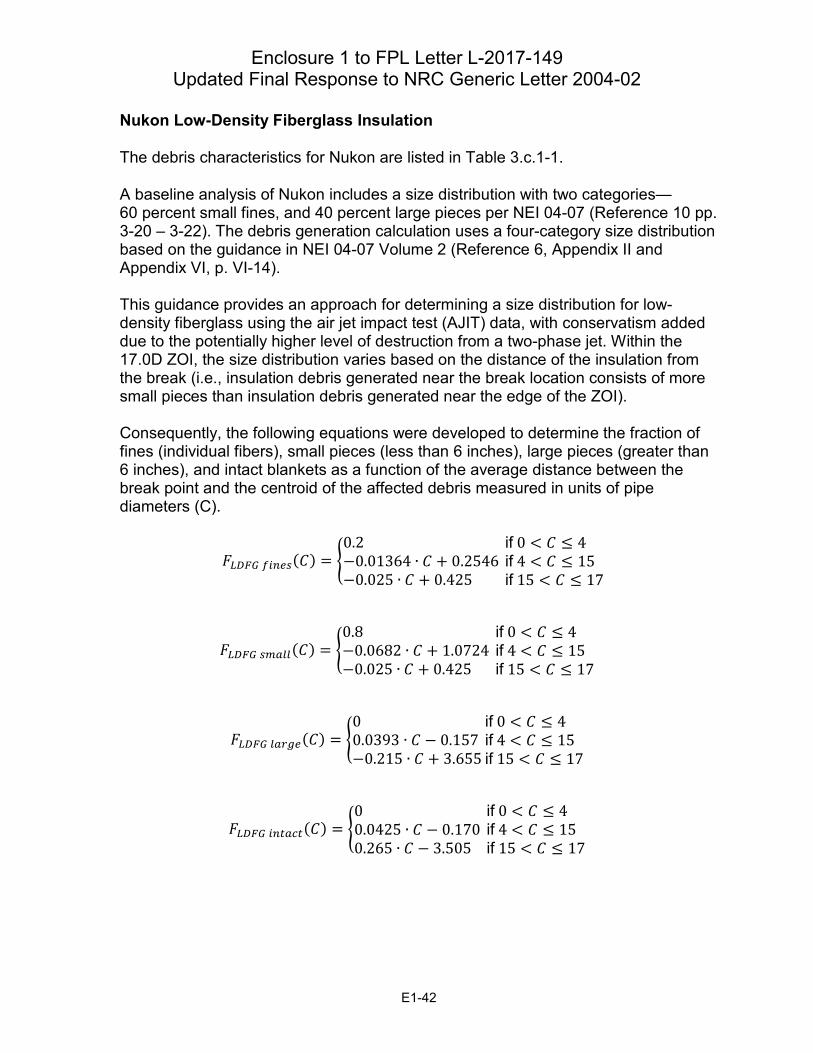
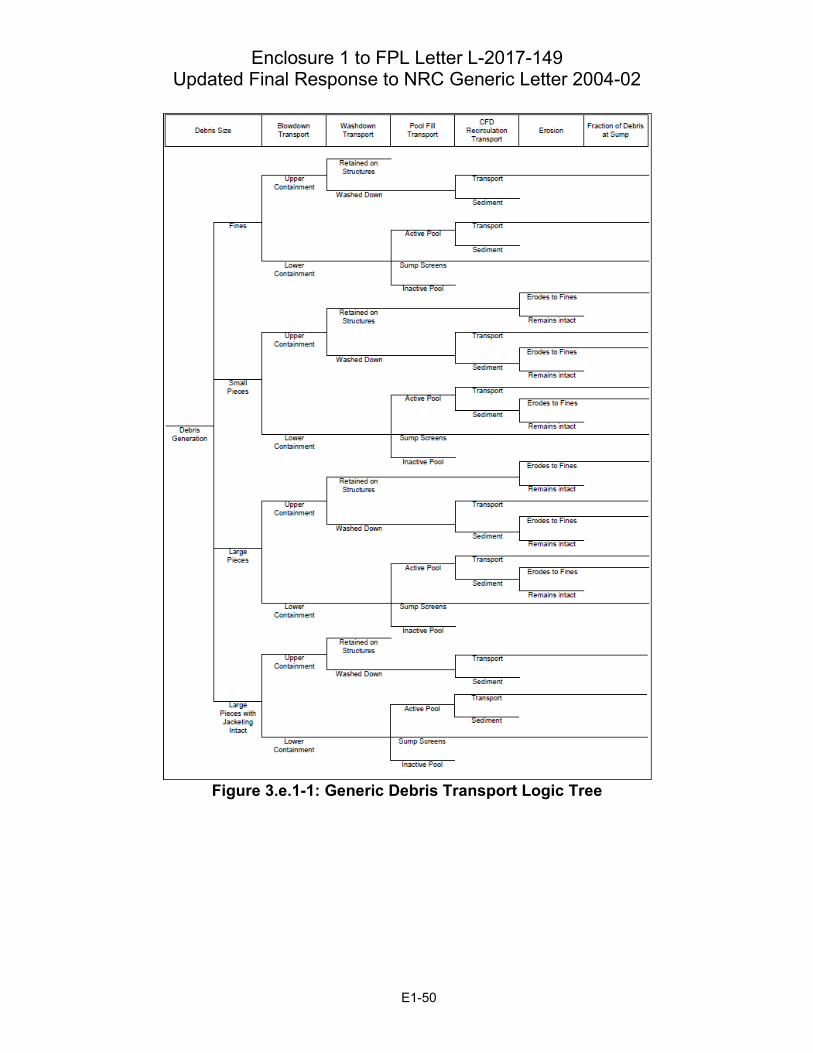
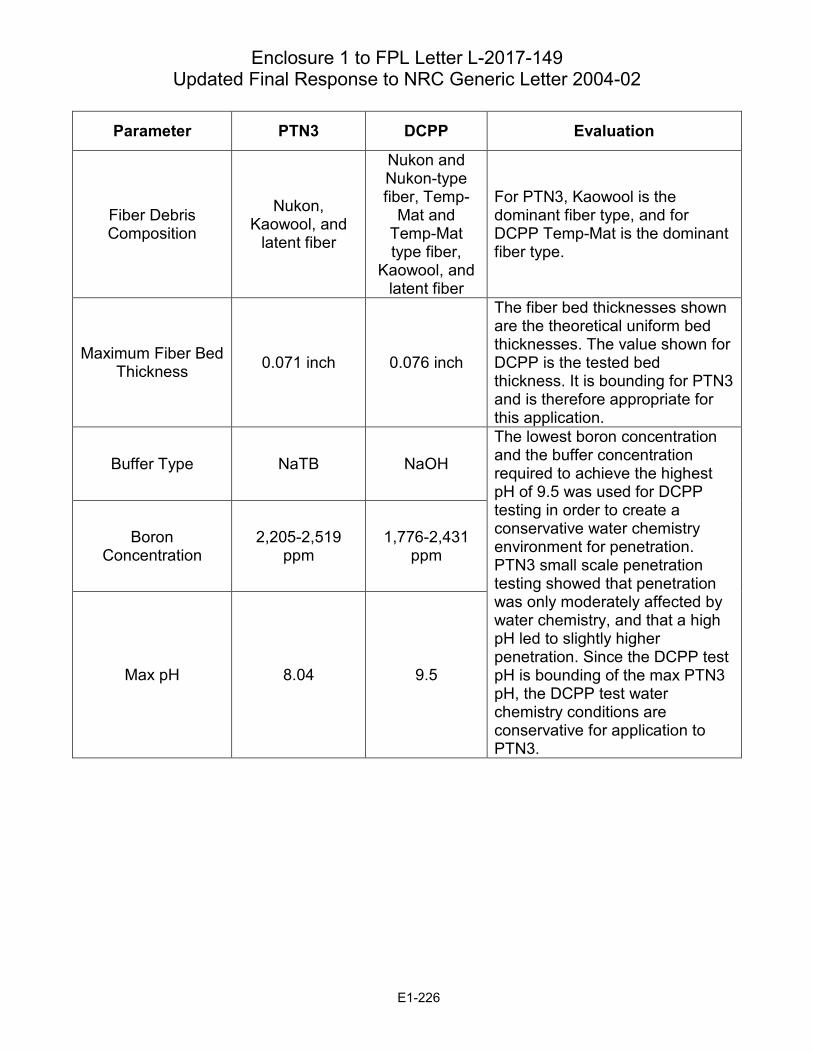
Analyses An extensive debris generation analysis has been performed for PTN3 and PTN4, which determined the debris generated for all break sizes from 0.5 inches up to 31 inches at all Class 1 in-service inspection (ISI) welds inside the first isolation valve at locations where reactor coolant system (RCS) pressure is expected to be present. The locations were analyzed as double-ended guillotine breaks (DEGBs), single-ended guillotine breaks (SEGBs) (where a closed valve is within 10 pipe diameters), and partial breaks at 45 degree intervals around the circumference of the pipe. This debris generation analysis was an automated evaluation based on a detailed computer-aided design (CAD) model of containment. Additional discussion of the debris generation analysis is provided in the Response to 3.b. There were no reductions in the zone of influence (ZOI) sizes from the accepted values in Nuclear Energy Institute (NEI) Report 04-07 (Reference 6 p. 27) for any materials except qualified coatings, which used a ZOI size based on testing that has been reviewed and accepted by the NRC (Reference 7 p. 2). The ZOI size that is being used for qualified coatings is 4.0D. Additional discussion is provided in the Responses to 3.b and 3.h. PTN4 has performed testing for strainer head loss and debris bypass (or penetration). The testing used conservative methods including the NRC reviewed protocols for fibrous debris preparation (Reference 8) and strainer bypass testing. PTN4 strainer head loss testing bounded all breaks at PTN4 up to 23 inches. The head loss for the largest breaks at PTN4 (including the 31-inch DEGBs) was established through comparison with Point Beach large-scale head loss testing. PTN3 has not performed strainer head loss or debris bypass testing. Instead, the PTN3 analysis was based on a comparison with the large-scale head loss testing for St. Lucie Unit 1 (PSL1) and the large-scale debris bypass testing for Diablo Canyon (DCPP). Additional discussion is provided in the Responses to 3.f, 3.n, and 3.o. The core blockage analysis methodology documented in WCAP-17788 (Reference 9) has not yet been finalized and the safety evaluation (SE) has not been issued by the NRC. The methodology currently contained in WCAP-17788, which is under NRC review, was used to determine the core inlet and in-vessel debris quantities for PTN3 and PTN4. PTN3 and PTN4 meet the debris limits currently identified in WCAP-17788. Following receipt of the NRC SE on WCAP-17788, any changes from the current methodology will be evaluated to determine if the current results still apply, and if they do, an update is not anticipated.
E1-3
Enclosure 1 to FPL Letter L-2017-149
Updated Final Response to NRC Generic Letter 2004-02
Changes to the Licensing Basis
FPL had previously completed changes to the PTN3 and PTN4 updated final safety analysis report (UFSAR) to recognize the mechanistic evaluation of the effect of post-accident debris on the ECCS and CSS recirculation function, as described in this letter. It is not anticipated that further changes to the UFSAR will be required, but the UFSAR will be reviewed after NRC acceptance of information presented in this submittal to determine whether any further changes are necessary. If changes are determined to be necessary, then the UFSAR updates will occur after receipt of the final closeout letter from the NRC. This is discussed in the Response to 3.p. Improvements in Processes and Programs FPL has completed a review of plant procedures, processes, and programs and has updated those procedures and design specifications or standards that will ensure the analysis inputs and assumptions can be maintained. This is discussed in the Response to 3.i. The changes to those programs and processes determined to be necessary to support the transition to the mechanistic evaluation methodology licensing basis were in place prior to, or at the time of the change to the licensing basis. Conservatisms and Margins FPL applied conservative measures to assure adequate margins throughout the actions taken to address the GL 2004-02 concerns. The key areas in which these conservative measures were applied are discussed later in the Margins and Conservatisms section.
E1-4
Enclosure 1 to FPL Letter L-2017-149
Updated Final Response to NRC Generic Letter 2004-02
1. Overall Compliance:
Provide information requested in GL 2004-02 Requested Information Item 2(a) regarding compliance with regulations.
GL 2004-02 Requested Information Item 2(a) Confirmation that the ECCS and CSS recirculation functions under debris loading conditions are or will be in compliance with regulatory requirements listed in the Applicable Regulatory Requirements section of this GL. This submittal should address the configuration of the plant that will exist once all modifications required for regulatory compliance have been made and this licensing basis has been updated to reflect the results of the analysis described above.
Response to 1: Confirmation FPL has completed all necessary analyses, with the exception of NRC acceptance of the in-vessel blockage analysis. FPL has updated the PTN licensing basis to reflect that the ECCS and CSS recirculation functions under debris loading conditions are in compliance with the regulatory requirements listed in the Applicable Regulatory Requirements section of GL 2004-02. FPL has completed all associated plant modifications in PTN3 and PTN4. See the Responses to 3.n and 3.p. Applicable Regulatory Requirements
The applicable regulatory requirements identified in GL 2004-02 (Table 1-1 and Table 1-2) are:
10 CFR 50.46 "Acceptance Criteria for Emergency Core Cooling Systems for Light-
Water Nuclear Power Reactors" 10 CFR 50.67 "Accident Source Term" 10 CFR 100 "Reactor Site Criteria"
Turkey Point Units 3 and 4 were designed prior to the implementation of 10 CFR 50, Appendix A, General Design Criteria (GDC) for Nuclear Power Plants, and utilized the 1967 Proposed GDC criteria recommended by the U.S. Atomic Energy Commission (AEC) for inclusion in applications for Commission construction permits.
E1-5
Enclosure 1 to FPL Letter L-2017-149
Updated Final Response to NRC Generic Letter 2004-02
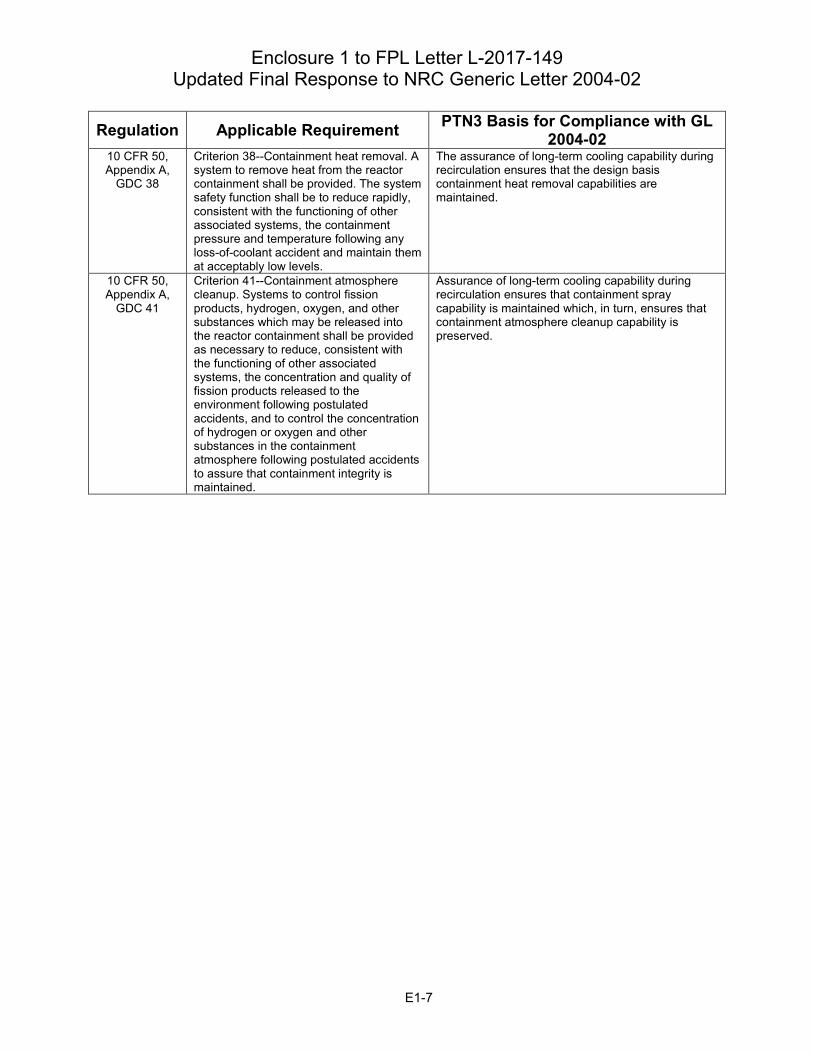
Table 1-1: PTN3 GL 2004-02 Regulatory Compliance
Regulation Applicable Requirement PTN3 Basis for Compliance with GL 2004-02
10 CFR 50.46 (b)(5)
Long-term cooling. After any calculated successful initial operation of the ECCS, the calculated core temperature shall be maintained at an acceptably low value and decay heat shall be removed for the extended period of time required by the long-lived radioactivity remaining in the core.
• New sump strainers ensure adequate structural integrity and net positive suction head (NPSH) during recirculation with margin for chemical effects.
• Aluminum inventory reductions reduced the quantity of aluminum precipitates generated in the post-loss-of-coolant accident (LOCA) sump.
• Installation of sodium tetraborate (NaTB) baskets within containment ensures proper post-LOCA sump and containment spray (CS) pH without need for operator action.
• Insulation replacements reduced the quantity of fibrous and particulate debris that could be generated within containment.
• Containment integrity and foreign material exclusion procedures track and control foreign material to ensure adequate sump strainer performance.
• Containment closeout procedures were revised to ensure that the refueling canal (RFC) drain covers are removed prior to unit restart to eliminate a potential upstream blockage.
• Periodic sump strainer inspections ensure the strainers are maintained in accordance with their design basis.
• Permanent and temporary design processes and procedures ensure all design changes evaluate impacts to post-LOCA sump strainer performance.
• Walkdowns and sump water level calculation confirm that design basis sump water supply will be available.
• Downstream effects evaluations confirm that no other modifications are required to ensure long-term cooling capability is maintained.
• Coating adhesion tests confirm that current inspection methods are adequate to control quantity of degraded qualified coatings.
• Evaluation of in-vessel chemical effects confirms that fuel temperatures will be maintained at an acceptably low value.
10 CFR 50, Appendix A,
GDC 35
Criterion 35--Emergency core cooling. A system to provide abundant emergency core cooling shall be provided. The system safety function shall be to transfer heat from the reactor core following any loss of reactor coolant at a rate such that (1) fuel and clad damage that could interfere with continued effective core cooling is prevented and (2) clad metal-water reaction is limited to negligible amounts.
The assurance of long-term cooling capability during recirculation ensures that the design basis emergency core cooling capabilities are maintained.
E1-6
Enclosure 1 to FPL Letter L-2017-149
Updated Final Response to NRC Generic Letter 2004-02
Regulation Applicable Requirement PTN3 Basis for Compliance with GL 2004-02
10 CFR 50, Appendix A,
GDC 38
Criterion 38--Containment heat removal. A system to remove heat from the reactor containment shall be provided. The system safety function shall be to reduce rapidly, consistent with the functioning of other associated systems, the containment pressure and temperature following any loss-of-coolant accident and maintain them at acceptably low levels.
The assurance of long-term cooling capability during recirculation ensures that the design basis containment heat removal capabilities are maintained.
10 CFR 50, Appendix A,
GDC 41
Criterion 41--Containment atmosphere cleanup. Systems to control fission products, hydrogen, oxygen, and other substances which may be released into the reactor containment shall be provided as necessary to reduce, consistent with the functioning of other associated systems, the concentration and quality of fission products released to the environment following postulated accidents, and to control the concentration of hydrogen or oxygen and other substances in the containment atmosphere following postulated accidents to assure that containment integrity is maintained.
Assurance of long-term cooling capability during recirculation ensures that containment spray capability is maintained which, in turn, ensures that containment atmosphere cleanup capability is preserved.
E1-7
Enclosure 1 to FPL Letter L-2017-149
Updated Final Response to NRC Generic Letter 2004-02
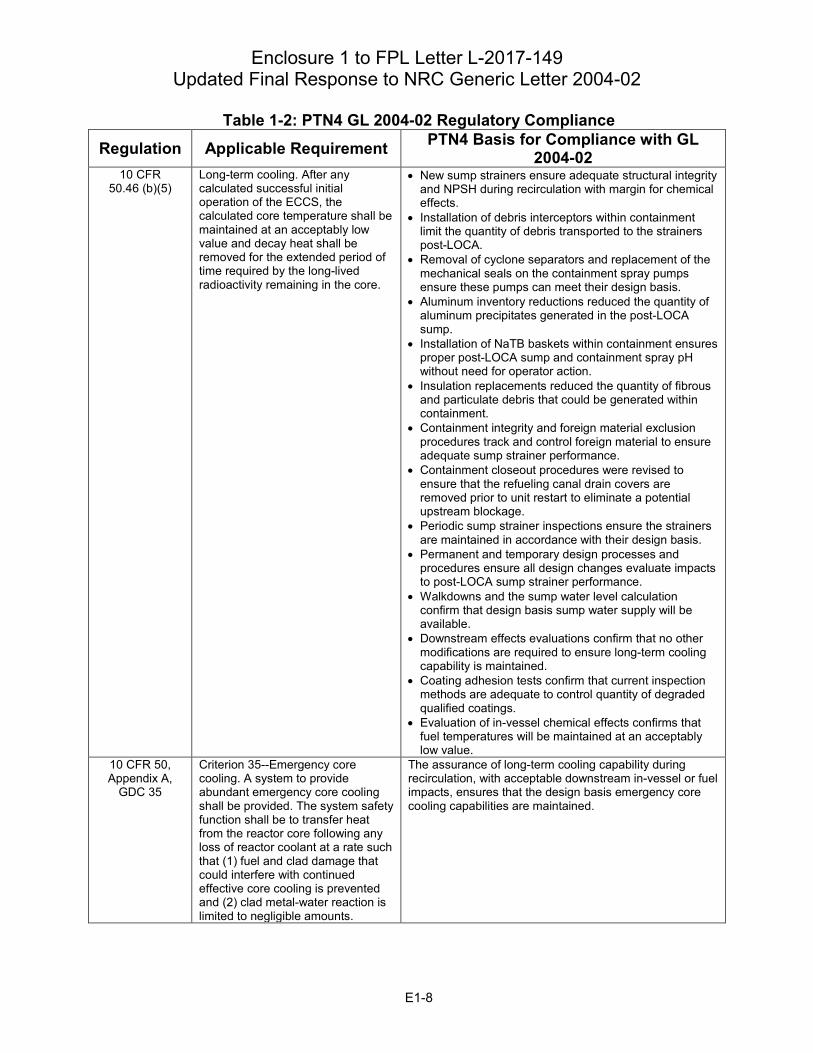
Table 1-2: PTN4 GL 2004-02 Regulatory Compliance
Regulation Applicable Requirement PTN4 Basis for Compliance with GL 2004-02
10 CFR 50.46 (b)(5)
Long-term cooling. After any calculated successful initial operation of the ECCS, the calculated core temperature shall be maintained at an acceptably low value and decay heat shall be removed for the extended period of time required by the long-lived radioactivity remaining in the core.
• New sump strainers ensure adequate structural integrity and NPSH during recirculation with margin for chemical effects.
• Installation of debris interceptors within containment limit the quantity of debris transported to the strainers post-LOCA.
• Removal of cyclone separators and replacement of the mechanical seals on the containment spray pumps ensure these pumps can meet their design basis.
• Aluminum inventory reductions reduced the quantity of aluminum precipitates generated in the post-LOCA sump.
• Installation of NaTB baskets within containment ensures proper post-LOCA sump and containment spray pH without need for operator action.
• Insulation replacements reduced the quantity of fibrous and particulate debris that could be generated within containment.
• Containment integrity and foreign material exclusion procedures track and control foreign material to ensure adequate sump strainer performance.
• Containment closeout procedures were revised to ensure that the refueling canal drain covers are removed prior to unit restart to eliminate a potential upstream blockage.
• Periodic sump strainer inspections ensure the strainers are maintained in accordance with their design basis.
• Permanent and temporary design processes and procedures ensure all design changes evaluate impacts to post-LOCA sump strainer performance.
• Walkdowns and the sump water level calculation confirm that design basis sump water supply will be available.
• Downstream effects evaluations confirm that no other modifications are required to ensure long-term cooling capability is maintained.
• Coating adhesion tests confirm that current inspection methods are adequate to control quantity of degraded qualified coatings.
• Evaluation of in-vessel chemical effects confirms that fuel temperatures will be maintained at an acceptably low value.
10 CFR 50, Appendix A,
GDC 35
Criterion 35--Emergency core cooling. A system to provide abundant emergency core cooling shall be provided. The system safety function shall be to transfer heat from the reactor core following any loss of reactor coolant at a rate such that (1) fuel and clad damage that could interfere with continued effective core cooling is prevented and (2) clad metal-water reaction is limited to negligible amounts.
The assurance of long-term cooling capability during recirculation, with acceptable downstream in-vessel or fuel impacts, ensures that the design basis emergency core cooling capabilities are maintained.
E1-8
Enclosure 1 to FPL Letter L-2017-149
Updated Final Response to NRC Generic Letter 2004-02
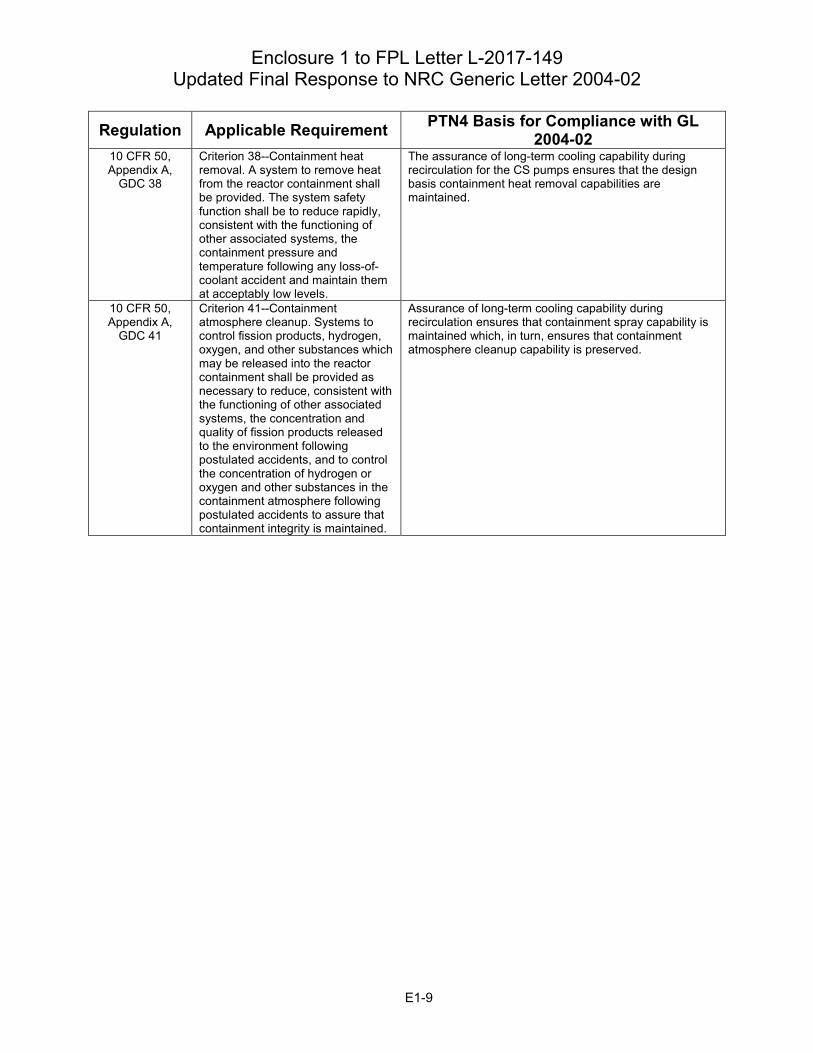
Regulation Applicable Requirement PTN4 Basis for Compliance with GL 2004-02
10 CFR 50, Appendix A,
GDC 38
Criterion 38--Containment heat removal. A system to remove heat from the reactor containment shall be provided. The system safety function shall be to reduce rapidly, consistent with the functioning of other associated systems, the containment pressure and temperature following any loss-of-coolant accident and maintain them at acceptably low levels.
The assurance of long-term cooling capability during recirculation for the CS pumps ensures that the design basis containment heat removal capabilities are maintained.
10 CFR 50, Appendix A,
GDC 41
Criterion 41--Containment atmosphere cleanup. Systems to control fission products, hydrogen, oxygen, and other substances which may be released into the reactor containment shall be provided as necessary to reduce, consistent with the functioning of other associated systems, the concentration and quality of fission products released to the environment following postulated accidents, and to control the concentration of hydrogen or oxygen and other substances in the containment atmosphere following postulated accidents to assure that containment integrity is maintained.
Assurance of long-term cooling capability during recirculation ensures that containment spray capability is maintained which, in turn, ensures that containment atmosphere cleanup capability is preserved.
E1-9
Enclosure 1 to FPL Letter L-2017-149
Updated Final Response to NRC Generic Letter 2004-02
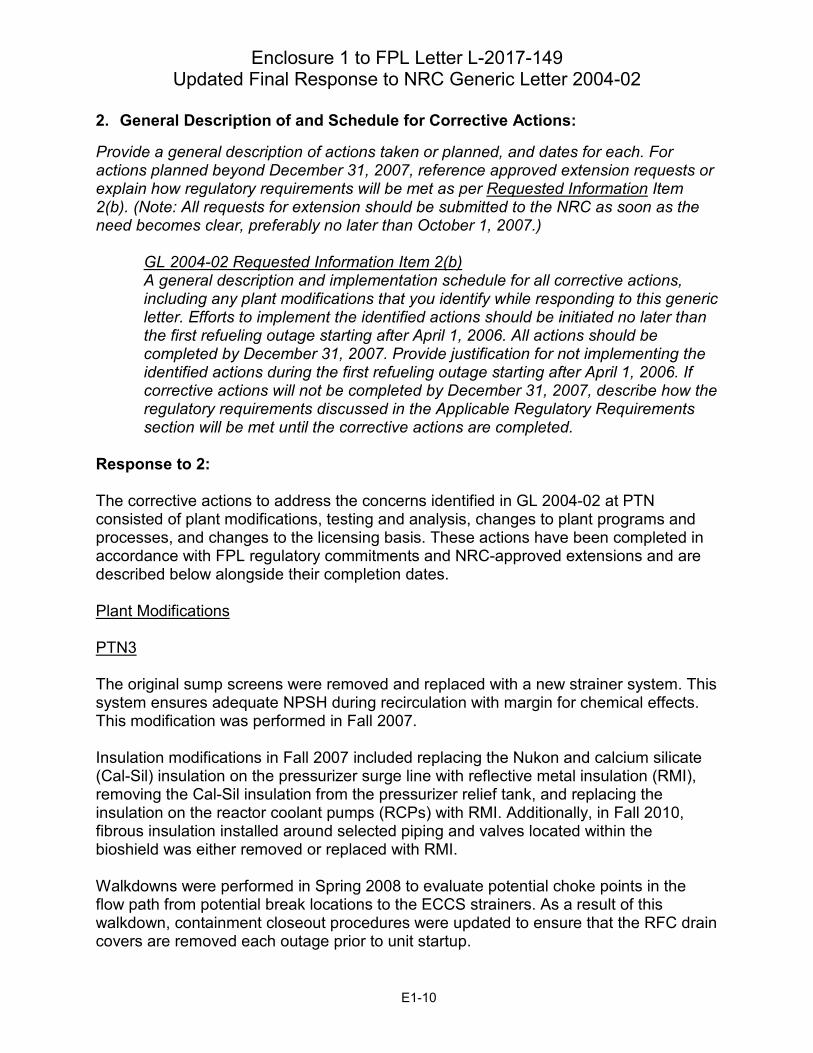
2. General Description of and Schedule for Corrective Actions:
Provide a general description of actions taken or planned, and dates for each. For actions planned beyond December 31, 2007, reference approved extension requests or explain how regulatory requirements will be met as per Requested Information Item 2(b). (Note: All requests for extension should be submitted to the NRC as soon as the need becomes clear, preferably no later than October 1, 2007.)
GL 2004-02 Requested Information Item 2(b) A general description and implementation schedule for all corrective actions, including any plant modifications that you identify while responding to this generic letter. Efforts to implement the identified actions should be initiated no later than the first refueling outage starting after April 1, 2006. All actions should be completed by December 31, 2007. Provide justification for not implementing the identified actions during the first refueling outage starting after April 1, 2006. If corrective actions will not be completed by December 31, 2007, describe how the regulatory requirements discussed in the Applicable Regulatory Requirements section will be met until the corrective actions are completed.
Response to 2: The corrective actions to address the concerns identified in GL 2004-02 at PTN consisted of plant modifications, testing and analysis, changes to plant programs and processes, and changes to the licensing basis. These actions have been completed in accordance with FPL regulatory commitments and NRC-approved extensions and are described below alongside their completion dates. Plant Modifications PTN3 The original sump screens were removed and replaced with a new strainer system. This system ensures adequate NPSH during recirculation with margin for chemical effects. This modification was performed in Fall 2007. Insulation modifications in Fall 2007 included replacing the Nukon and calcium silicate (Cal-Sil) insulation on the pressurizer surge line with reflective metal insulation (RMI), removing the Cal-Sil insulation from the pressurizer relief tank, and replacing the insulation on the reactor coolant pumps (RCPs) with RMI. Additionally, in Fall 2010, fibrous insulation installed around selected piping and valves located within the bioshield was either removed or replaced with RMI. Walkdowns were performed in Spring 2008 to evaluate potential choke points in the flow path from potential break locations to the ECCS strainers. As a result of this walkdown, containment closeout procedures were updated to ensure that the RFC drain covers are removed each outage prior to unit startup.
E1-10
Enclosure 1 to FPL Letter L-2017-149
Updated Final Response to NRC Generic Letter 2004-02
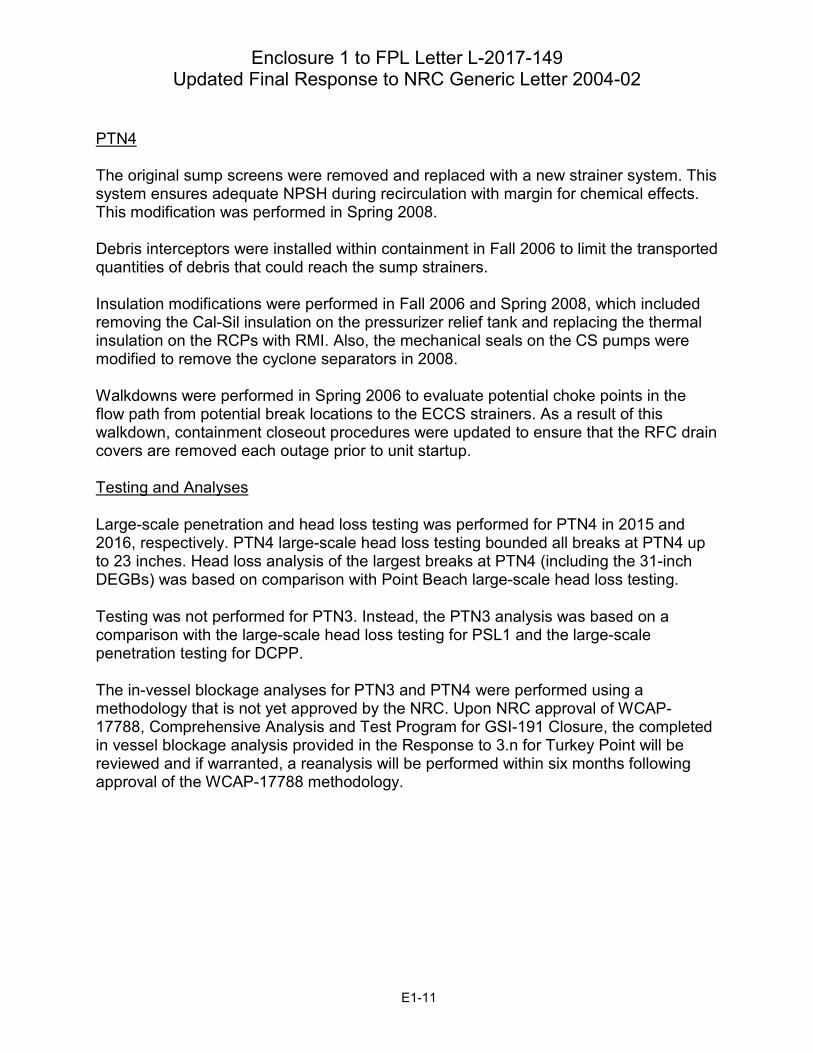
PTN4 The original sump screens were removed and replaced with a new strainer system. This system ensures adequate NPSH during recirculation with margin for chemical effects. This modification was performed in Spring 2008. Debris interceptors were installed within containment in Fall 2006 to limit the transported quantities of debris that could reach the sump strainers. Insulation modifications were performed in Fall 2006 and Spring 2008, which included removing the Cal-Sil insulation on the pressurizer relief tank and replacing the thermal insulation on the RCPs with RMI. Also, the mechanical seals on the CS pumps were modified to remove the cyclone separators in 2008. Walkdowns were performed in Spring 2006 to evaluate potential choke points in the flow path from potential break locations to the ECCS strainers. As a result of this walkdown, containment closeout procedures were updated to ensure that the RFC drain covers are removed each outage prior to unit startup. Testing and Analyses
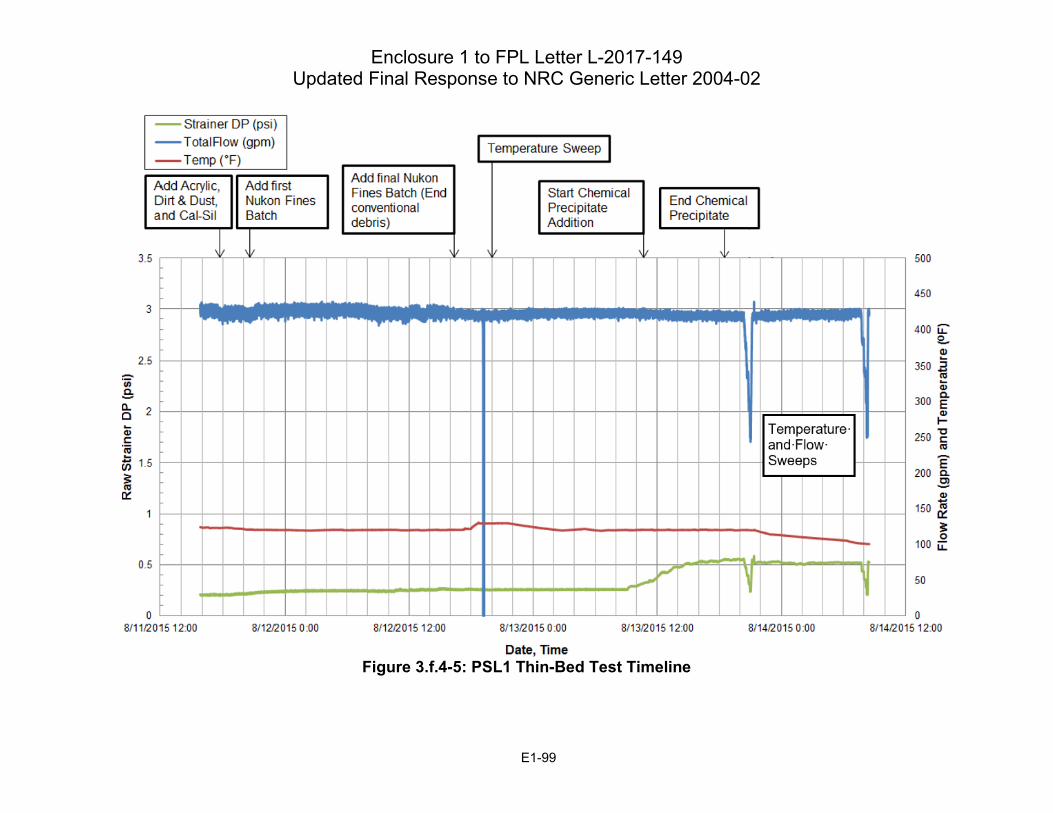
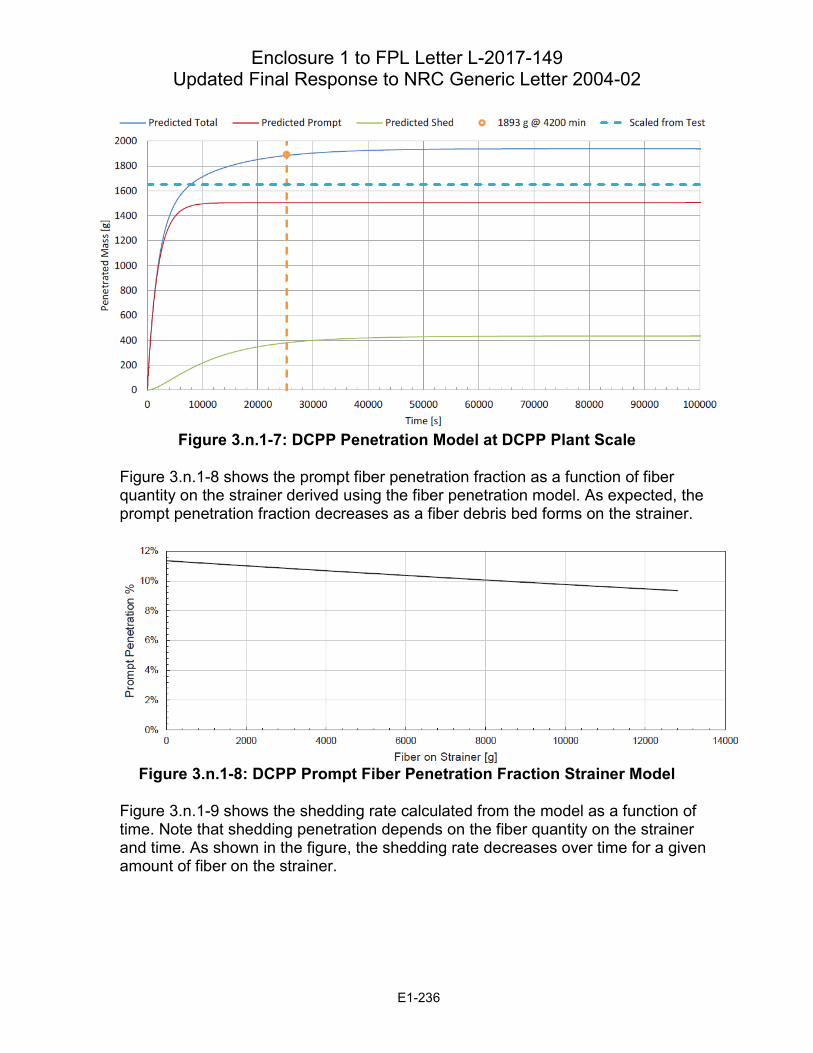
Large-scale penetration and head loss testing was performed for PTN4 in 2015 and 2016, respectively. PTN4 large-scale head loss testing bounded all breaks at PTN4 up to 23 inches. Head loss analysis of the largest breaks at PTN4 (including the 31-inch DEGBs) was based on comparison with Point Beach large-scale head loss testing.
Testing was not performed for PTN3. Instead, the PTN3 analysis was based on a comparison with the large-scale head loss testing for PSL1 and the large-scale penetration testing for DCPP.
The in-vessel blockage analyses for PTN3 and PTN4 were performed using a methodology that is not yet approved by the NRC. Upon NRC approval of WCAP-17788, Comprehensive Analysis and Test Program for GSI-191 Closure, the completed in vessel blockage analysis provided in the Response to 3.n for Turkey Point will be reviewed and if warranted, a reanalysis will be performed within six months following approval of the WCAP-17788 methodology.
E1-11
Enclosure 1 to FPL Letter L-2017-149
Updated Final Response to NRC Generic Letter 2004-02
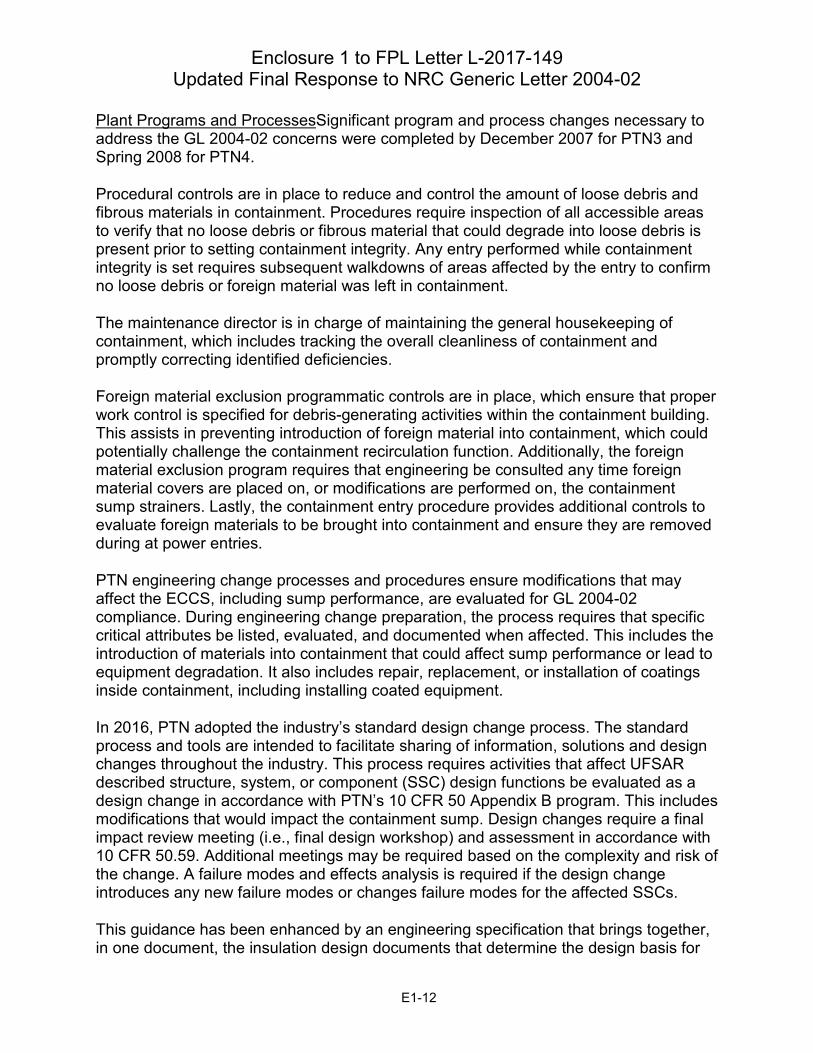
Plant Programs and ProcessesSignificant program and process changes necessary to address the GL 2004-02 concerns were completed by December 2007 for PTN3 and Spring 2008 for PTN4.
Procedural controls are in place to reduce and control the amount of loose debris and fibrous materials in containment. Procedures require inspection of all accessible areas to verify that no loose debris or fibrous material that could degrade into loose debris is present prior to setting containment integrity. Any entry performed while containment integrity is set requires subsequent walkdowns of areas affected by the entry to confirm no loose debris or foreign material was left in containment.
The maintenance director is in charge of maintaining the general housekeeping of containment, which includes tracking the overall cleanliness of containment and promptly correcting identified deficiencies.
Foreign material exclusion programmatic controls are in place, which ensure that proper work control is specified for debris-generating activities within the containment building. This assists in preventing introduction of foreign material into containment, which could potentially challenge the containment recirculation function. Additionally, the foreign material exclusion program requires that engineering be consulted any time foreign material covers are placed on, or modifications are performed on, the containment sump strainers. Lastly, the containment entry procedure provides additional controls to evaluate foreign materials to be brought into containment and ensure they are removed during at power entries.
PTN engineering change processes and procedures ensure modifications that may affect the ECCS, including sump performance, are evaluated for GL 2004-02 compliance. During engineering change preparation, the process requires that specific critical attributes be listed, evaluated, and documented when affected. This includes the introduction of materials into containment that could affect sump performance or lead to equipment degradation. It also includes repair, replacement, or installation of coatings inside containment, including installing coated equipment.
In 2016, PTN adopted the industry’s standard design change process. The standard process and tools are intended to facilitate sharing of information, solutions and design changes throughout the industry. This process requires activities that affect UFSAR described structure, system, or component (SSC) design functions be evaluated as a design change in accordance with PTN’s 10 CFR 50 Appendix B program. This includes modifications that would impact the containment sump. Design changes require a final impact review meeting (i.e., final design workshop) and assessment in accordance with 10 CFR 50.59. Additional meetings may be required based on the complexity and risk of the change. A failure modes and effects analysis is required if the design change introduces any new failure modes or changes failure modes for the affected SSCs.
This guidance has been enhanced by an engineering specification that brings together, in one document, the insulation design documents that determine the design basis for
E1-12
Enclosure 1 to FPL Letter L-2017-149
Updated Final Response to NRC Generic Letter 2004-02
the insulation debris component of the containment recirculation strainer design. This specification provides guidance for evaluating and maintaining piping and component insulation configuration within the containment buildings at PTN3 and PTN4.
The containment closeout procedure was updated to include all of the strainer system components in the final containment closeout inspection. The effect of these changes is to ensure that all components (strainer modules, piping, and pipe connections) are inspected, and that there are no holes, gaps, or tears greater than 3/32 inch in any strainer system component.
Temporary configuration changes are controlled by plant procedure, which maintain configuration control for non-permanent changes to plant structures, systems, and components while ensuring the applicable technical reviews and administrative reviews and approvals are obtained.
In accordance with 10 CFR 50.65 (Maintenance Rule), an assessment of risk resulting from the performance of maintenance activities is required. Prior to performing maintenance, PTN assesses and manages the increase in risk that may result from the proposed maintenance activities. In general, the risk assessment ensures that the maintenance activity will not adversely impact a dedicated/protected train, which ensures that a system is capable of performing its intended safety function.
Licensing Basis
The licensing basis changes needed to address the GL 2004-02 concerns consist of changes to the UFSAR related to the plant modifications implemented and evaluations performed to resolve the concerns identified in GL 2004-02. Changes to the Technical Specification (TS) Bases were made to expand the definition of the recirculation sump inspection requirements to include the entire distributed sump strainer system.
Although it is not anticipated that further changes will be required, the UFSAR will be reviewed after NRC acceptance of information presented in this submittal to determine if any further changes are necessary. If changes are determined to be necessary, the UFSAR updates will occur after receipt of the final closeout letter from the NRC.
E1-13
Enclosure 1 to FPL Letter L-2017-149
Updated Final Response to NRC Generic Letter 2004-02
Alternate Evaluation Methodology
Section 6 of the NEI 04-07 Guidance Report (GR) describes an alternate evaluation methodology for demonstrating acceptable containment sump performance (Reference 10 p. 6−18). The alternate evaluation methodology proposes separate analysis methods for two distinct break size regions (Reference 6 p. 113):
• Region I:
o Defined as all breaks up to and including DEGBs on the largest piping connected to the RCS loop piping AND partial breaks on the RCS loop piping up to a diameter of 196.6 in2 (equivalent to a 15.8-inch diameter break). This is referred to as the alternate break size in the GR (Reference 10 p. 6−1). The terms alternate break size and debris generation break size (DGBS) are used synonymously in the NRC SE (Reference 6 pp. 110-115).
o Analysis methods must meet the typical design basis rules for a deterministic evaluation.
• Region II: o Defined as breaks larger than the Region I break size up to and
including DEGBs on the RCS loop piping. o Mitigative capabilities must be demonstrated, but the fully deterministic
design basis rules do not necessarily apply.
The alternate evaluation methodology can be used to demonstrate reasonable assurance of adequate long term core cooling for the bounding breaks in Region II by allowing for the use of more realistic assumptions and methods, credit for mitigative operator actions, and use of non-safety related equipment. Based on various considerations, the NRC staff determined that the division of the pipe break spectrum proposed for evaluating debris generation is acceptable based on operating experience, application of sound engineering judgment, and consideration of risk-informed principles. Licensees using the methods described in Section 6 of the GR can apply the DGBS for distinguishing between Region I and Region II analyses (Reference 6 p. 114). As shown in this submittal, only PTN4 is using the alternate evaluation methodology; PTN3 did not require use of this methodology. Additionally, there is reasonable assurance that none of the PTN4 Region II breaks would fail because of debris and that these breaks would be successfully mitigated. Region I Evaluation
The PTN4 evaluation for Region I considered DEGBs for Class 1 ISI welds on piping connected to the RCS main loops inside the first isolation valve, which have a maximum nominal pipe diameter of 14 inches, as well as 23-inch partial breaks on the main loop piping (including multiple break orientations at each main loop ISI weld locations). As shown in various sections of this submittal, these bounding Region I breaks were evaluated in accordance with NRC-approved methods for a deterministic evaluation
E1-14
Enclosure 1 to FPL Letter L-2017-149
Updated Final Response to NRC Generic Letter 2004-02
(with the exception of the WCAP-17788 methodology, which is still being reviewed by the NRC), and were shown to meet all acceptance criteria. The details of this evaluation are described in Section 3. Region II Evaluation The Region II evaluation for PTN4 was limited to breaks larger than 23 inches on the main loop piping, and these breaks were analyzed using bounding DEGB quantities at the worst-case break locations. The debris quantities for the bounding Region II break locations are described in the Response to 3.b. Downstream effects (both in-vessel and ex-vessel) were evaluated for the bounding Region II breaks in accordance with NRC-approved methods for a deterministic evaluation (with the exception of the WCAP-17788 methodology, which is still being reviewed by the NRC), and were shown to meet the relevant acceptance criteria. Therefore, the use of the alternate evaluation methodology is limited to strainer head loss concerns. The bounding PTN4 Region II debris quantities exceed the debris quantities that were used in the PTN4 prototypical strainer head loss testing. Therefore, these breaks cannot be addressed using the standard deterministic methodology and were evaluated using the alternate evaluation methodology. There is reasonable assurance that these breaks would not fail based on:
• Proceduralized operator actions • Realistic assumptions and methods
Operator Actions Following a LOCA at PTN4, the operators would take the following actions in accordance with the plant emergency operating procedures (EOPs):
• Upon receipt of a prerequisite safety actuation signal, both trains of residual heat removal (RHR) pumps, high head safety injection (HHSI) pumps, and CS pumps would be started automatically at PTN4 with suction from the refueling water storage tank (RWST). Additionally, two emergency containment coolers at PTN4 would be placed into service and both HHSI pumps at PTN3 would also start.
• One RHR pump would be aligned for recirculation after the RWST level reaches 60,000 gallons and the sump water level reaches the minimum water level for strainer submergence.
• Two HHSI pumps and one CS pump would then be aligned for cold leg recirculation piggy-backed off of the one RHR pump.
• 5.5 hours after initiation of the LOCA, the PTN4 ECCS would be aligned to hot leg recirculation with the HHSI and CS pumps piggy-backed off of one RHR pump. This step is taken to prevent boric acid precipitation.
E1-15
Enclosure 1 to FPL Letter L-2017-149
Updated Final Response to NRC Generic Letter 2004-02
• 10.5 hours after aligning the PTN4 ECCS to hot leg recirculation, the ECCS would be realigned to cold leg recirculation, as described above. This step is taken to prevent boric acid precipitation.
• For the remainder of the event, the ECCS is realigned every 16 hours between hot leg recirculation and cold leg recirculation until it is no longer deemed necessary.
• If, at any point, PTN4 containment sump recirculation cannot be verified, the operators would enter an emergency contingency action (ECA) procedure. In this procedure, they would monitor for indications of abnormal ECCS pump operation by observing HHSI pump flow and RHR pump motor amps.
• If abnormal PTN4 ECCS pump operation is indicated during recirculation, the operators would reestablish adequate core cooling flow by aligning a single PTN3 HHSI pump to inject the minimum required makeup flow into the PTN4 core using the PTN3 RWST, and will begin to provide makeup to the PTN3 and PTN4 RWSTs in order to provide a viable water supply to the PTN3 and PTN4 ECCS pumps. Use of the minimum required makeup flow from a single PTN3 HHSI pump and makeup to the PTN3 RWST provide additional time for other mitigating actions.
Analysis The quantity of debris generated and transported for bounding Region II breaks at PTN4 exceeds the quantity that was tested during PTN4 large-scale head loss testing. Therefore, a bounding head loss for Region II breaks was conservatively calculated using the conventional head loss associated with Point Beach Nuclear (PBN) large-scale head loss testing, chemical head loss associated with PTN4 large-scale head loss testing, and significant safety margin. This conservatively calculated head loss for Region II breaks is judged to produce a head loss that exceeds the current PTN4 ECCS pump NPSH margins using a standard deterministic methodology (see the Responses to 3.f and 3.g). The operators would be directed to add additional water from the PTN3 RWST if necessary. Adding additional inventory to the PTN4 sump from the PTN3 RWST will increase the ECCS recirculation NPSH margin by increasing the water level in the containment sump. Stopping the PTN4 ECCS pumps following indications of strainer blockage and aligning a single PTN3 HHSI pump, taking suction from the PTN3 RWST, will result in a change to the debris bed on the PTN4 strainer (i.e., the debris bed will either shift or debris would fall off the strainer due to a pressure pulse when the pumps are stopped). When the PTN4 ECCS pumps are placed back into service after restoration of recirculation capability, the resulting head loss would be lower than it was at the time the pumps were stopped. Industry testing has shown that stopping a pump and then restarting it will result in changes to the debris bed with a lower final head loss.
E1-16
Enclosure 1 to FPL Letter L-2017-149
Updated Final Response to NRC Generic Letter 2004-02
Lastly, as shown in NEI 04-07 Section 6, the use of more realistic assumptions and methods includes the ability to take credit for initial containment air pressure during Region II NPSH evaluations (Reference 10 p. 6−12; 6 pp. 120-124). As described in the Responses to 3.g and 3.f (using a highly conservative estimate of the head loss for the PTN4 Region II breaks), the conservatively estimated initial air pressure provides sufficient NPSH margin for the PTN4 Region II breaks. Note that additional credit was not taken for an increased water level within containment or reduced strainer head loss due to cycling of the PTN4 ECCS pumps; use of best estimate water level was not solely sufficient to preclude the need to consider initial containment air pressure. See the Response to 3.g.14. Risk Evaluation The relaxation of requirements for Region II breaks is appropriate based on the low frequency associated with breaks that are greater than or equal to 15.8 inches. Based on NUREG-1829 Table 7.19, the mean frequency of breaks greater than or equal to 14 inches is only 2.0E-07 yr-1 (Reference 11 p. 7−55). In other words, even if all Region II breaks were to fail due to the effects of debris, the risk associated with these failures (in terms of change in core damage frequency, or ΔCDF) would be less than 1.0E-06 yr-1, which is defined as a very small change in Regulatory Guide (RG) 1.174 (Reference 12 pp. 15-17). Defense-in-Depth As described in the NEI document with defense-in-depth measures for GSI-191, there are a range of measures at operating pressurized water reactors (PWRs) that either currently exist or could be developed to detect or mitigate potential sump blockage issues (Reference 13). Detection of potential sump blockage issues would be performed as discussed above. Operators will monitor for a combination of abnormal HHSI pump flow and RHR pump motor amps, which will indicate that the ECCS is being affected by sump blockage. This could be accompanied by an increase in core exit thermocouple temperatures and a decrease in reactor vessel water level indication due to inadequate core cooling flow. Additional mitigative measures applicable to PTN4 are considered below. In the event that the PTN4 and PTN3 ECCS pumps cannot provide adequate long term core cooling, Loss of Emergency Coolant Recirculation procedures direct operators to bring a PTN4 non-safety related charging pump online to provide makeup flow to the core. In the event of a loss of offsite power (LOOP), non-essential loads would be shed from the diesel generators to provide power to the non-safety related charging pumps. The PTN4 strainers could be back-flushed by opening the RHR pump sump suction isolation valves and the RHR pump RWST suction isolation valves to allow the PTN4 RWST to gravity flow backflush the PTN4 strainer. Gravity flow backflushing could also be accomplished using the PTN3 RWST. While these backflush steps are not currently
E1-17
Enclosure 1 to FPL Letter L-2017-149
Updated Final Response to NRC Generic Letter 2004-02
proceduralized, the valves could be opened for a short amount of time to dislodge debris from the strainer surface and improve NPSH margin. The backflush steps could be added to the loss of recirculation ECA and could be performed in parallel with other actions. This proposed change will be evaluated and the necessary procedure changes made to provide for performance of these actions and establish the necessary alignment between the procedures. This evaluation will occur upon NRC review and acceptance of the approach provided in this submittal. If PTN4 continues to experience inadequate core cooling, additional operator actions will be taken through the PTN4 core cooling functional restoration procedures to ensure all possible options are explored to establish adequate long term core cooling. These include aligning three non-safety related charging pumps to provide maximum core cooling flow, as well as starting RCPs under off-normal conditions to increase flow through the core. In the event that adequate long term core cooling cannot be established and core damage occurred, the severe accident mitigation guidelines (SAMGs) for PTN4 would be implemented to effectively mitigate the event and protect plant personnel and the public. Conclusion Region I breaks for PTN4 (including all breaks smaller than 23 inches) have been fully addressed using deterministic methods. There is reasonable assurance that long term core cooling can be provided for the bounding Region II breaks at PTN4 based on the combination of proceduralized operator actions, approved refinements to the NPSH evaluation, significant margins and conservatisms (described in the following section), and the ability to use additional mitigative measures as described above. Finally, a bounding evaluation shows that the risk associated with the loss of long-term core cooling due to the effects of debris in Region II is very small.
E1-18
Enclosure 1 to FPL Letter L-2017-149
Updated Final Response to NRC Generic Letter 2004-02
Margins & Conservatisms
The following list documents the margins and conservatisms utilized in the GSI-191 analysis. Debris Generation Margins:
• The amount of latent debris at PTN3 and PTN4 was conservatively increased to 200 lbm, rather than using the walkdown values (77.22 lbm and 154.44 lbm)
• The amount of miscellaneous debris at PTN3 and PTN4 was conservatively increased to 266 ft2, rather than using the walkdown values (93.192 ft2 and 116.5 ft2).
• The quantities of unqualified coatings at PTN3 and PTN4 were conservatively increased by 10% over the values from the coating logs.
Conservatisms: • Shadowing by the reactor or structures was not considered for reactor nozzle
breaks. ZOIs at these breaks were truncated to the primary shield wall and a line-of sight cone projecting out the closest primary shield penetration to the radius of the ZOI sphere.
• 100% of the unqualified coatings were assumed to fail for all breaks, conservatively maximizing the potential unqualified coatings load in the recirculation pool.
• Qualified epoxy was assumed to fail as 100% particulate, conservatively treating it as the most easily transportable debris type.
Debris Transport Margins:
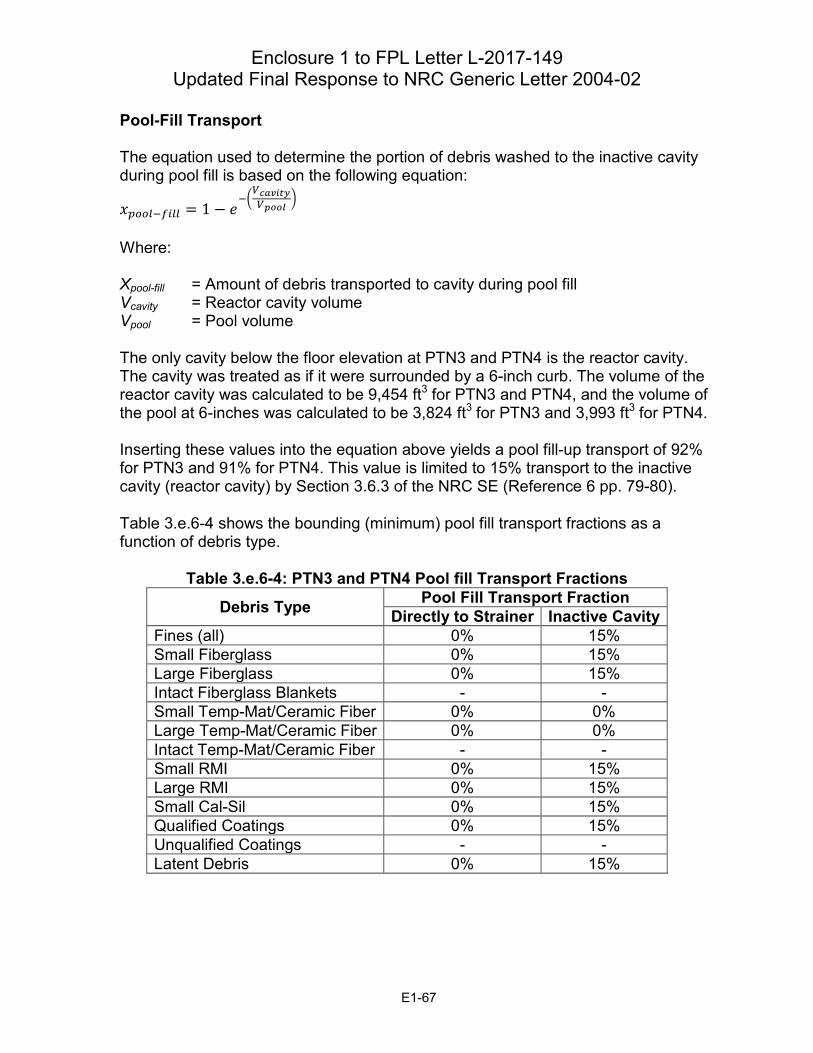
• During pool fill, the transport to the inactive cavity (reactor cavity) was conservatively limited to 15% for fine debris. Note that the transport to the inactive cavity without the limitation was calculated to be 92% for PTN3 and 91% for PTN4.
Conservatisms: • It was conservatively assumed that all unqualified coatings are located in lower
containment and fail at the start of the event (t=0). This is conservative since it results in 100% of unqualified coatings being present in the pool at the start of recirculation and results in 100% transport of this debris.
• All fine debris blown to upper containment was conservatively assumed to be washed back down by the containment spray flow. This conservatively includes debris blown up onto holdup areas protected from the containment spray path
E1-19
Enclosure 1 to FPL Letter L-2017-149
Updated Final Response to NRC Generic Letter 2004-02
(on the primary shield walls, the shield walls around the pressurizer, and the bottom side of the over-head floor slabs).
• Small pieces of debris on the operating deck were assumed to wash to lower containment without any retention on grating.
• Additional levels of grating below the operating deck were neglected during washdown. This is conservative, since the maximum amount of debris will be washed down to lower containment without any credit for additional retention on gratings .
• Turbulent kinetic energy (TKE) and velocity plots were created to determine the recirculation transport fractions. The TKE sufficient to suspend debris was conservatively assumed to exist at any elevation in the pool, when it may only exist at a discreet elevation. This conservatism results in all applicable debris at that location being assumed to remain in suspension and transport, when in some cases, the TKE would only keep debris at select elevations (such as the pool surface) in suspension.
• The flow of water falling from the reactor coolant system breach was assumed to do so without encountering any structures before reaching the containment pool. This is conservative since any impact with structures would dissipate the momentum of the water and decrease the turbulent energy in the pool.
• When given a size range for insulation debris, the debris was conservatively treated as if it existed entirely at the smaller end of the size range. For example, large pieces of fiberglass debris (larger than 6 inches on a side) were treated as 6-inch pieces. This ignores the fact that larger pieces in the size range would be less easily transported, conservatively increasing transport fractions overall.
• It was assumed that all Temp-Mat debris would float in the recirculation pool until it was transported to the strainers (100% recirculation transport). This assumption ignores the potential for a portion of the debris to become saturated with water and settle to the floor.
Water Volume and Level Conservatisms:
• Initial RWST level was taken at the TS minimum level. This is the minimum required water volume for the RWST. Using this smallest value decreases the total amount of inventory creditable for injection; thus, minimizing the final pool volume.
• Final RWST level was assumed to be at the low-low level with instrument uncertainty accounted for in the positive direction (meaning a volume larger than the low-low level volume remains). This is the maximum amount of water remaining in the RWST post-injection. Using this largest value decreases the total amount of inventory creditable for injection; thus, minimizing the final pool volume.
• For small-break loss-off-coolant accidents (SBLOCA), the RCS inventory was not credited as part of the injection inventory. This is a consequence of assuming that the RCS pressure does not decrease sufficiently to allow the accumulators
E1-20
Enclosure 1 to FPL Letter L-2017-149
Updated Final Response to NRC Generic Letter 2004-02
to inject (at least by the time of switchover to recirculation). Since the RCS does not depressurize, it does not lose inventory, so this inventory does not contribute to the pool volume.
• For SBLOCAs, the accumulators were assumed not to inject. Neglecting the accumulator injection volume reduces the amount of creditable volume.
• The pre-LOCA containment atmosphere was assumed to be at 0% relative humidity, and the post-LOCA containment atmosphere was assumed to be at 100% relative humidity. The amount of steam hold-up in the atmosphere was calculated by subtracting the water vapor holdup pre-LOCA from the steam holdup post-LOCA. Thus, the water vapor holdup in the containment atmosphere was maximized; thereby, reducing the pool volume.
• The containment surface area exposed to CS and steam condensation was increased by 5% to account for uncertainty in the surface area values. This increase results in an increased holdup of condensation and water droplets on the surfaces of containment.
NPSH Margins:
• After accounting for debris and clean strainer head losses, the RHR pump at PTN3 has a minimum NPSH margin of 2.24 ft-H2O.
• After accounting for debris and clean strainer head losses, the RHR pump at PTN4 for Region II breaks has a minimum NPSH margin of 21.41 ft-H2O.
Conservatisms:
• Suction piping losses were maximized by using the longest possible flow path through the strainer piping.
Strainer Structural Analysis Margins: • The strainer system analysis (which includes strainer structure, piping, pipe
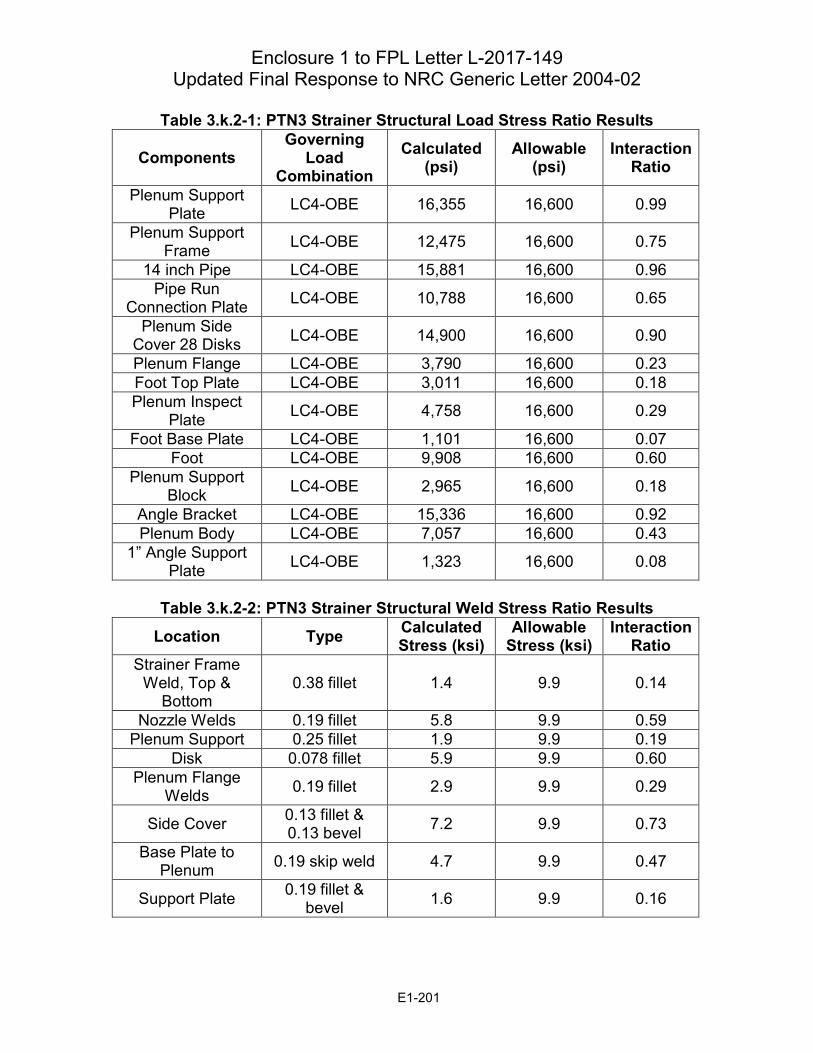
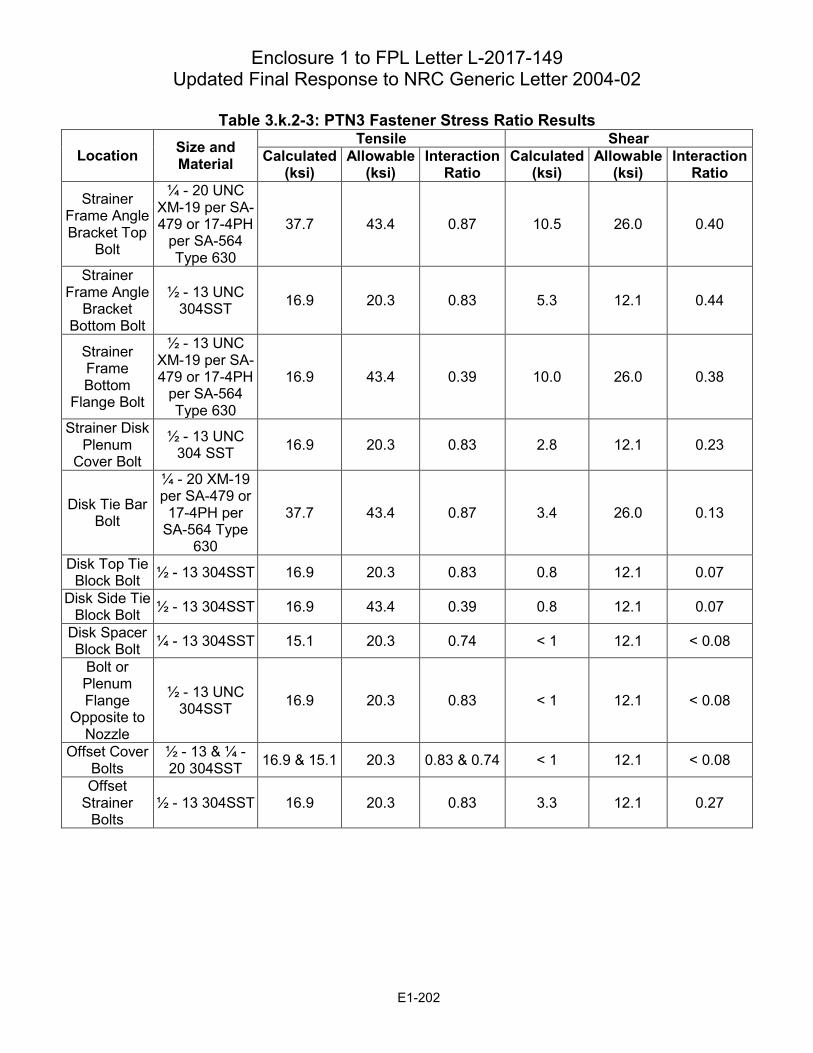
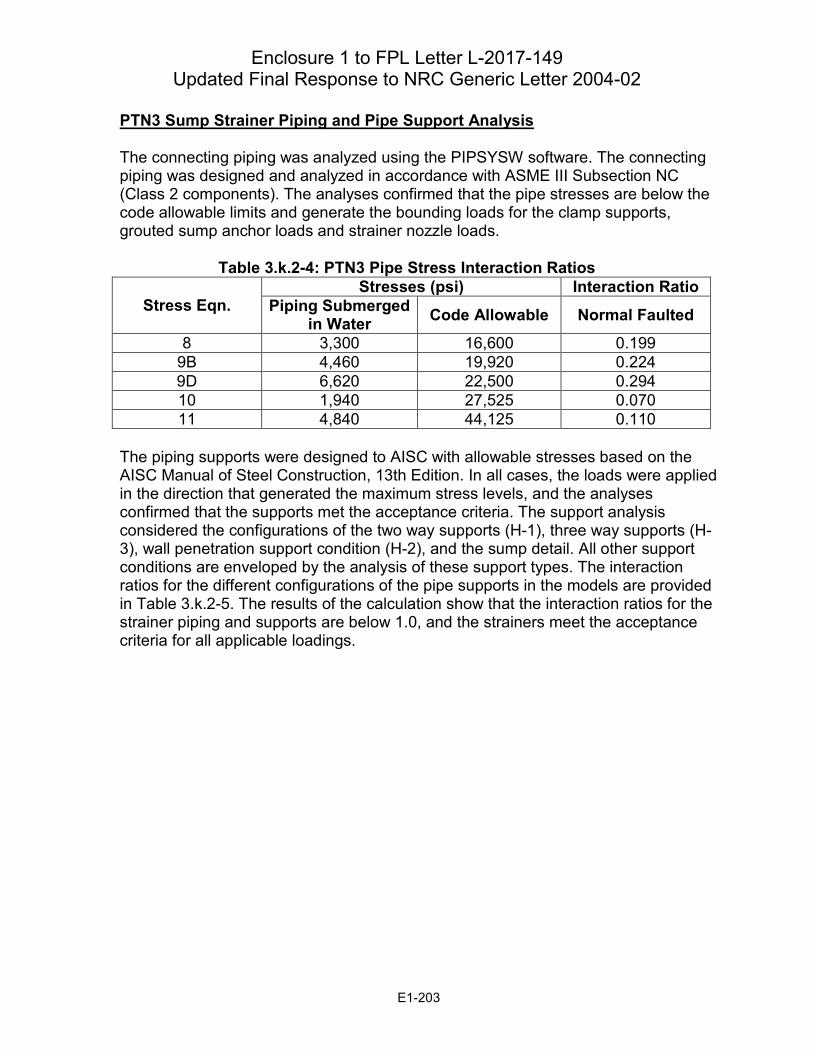
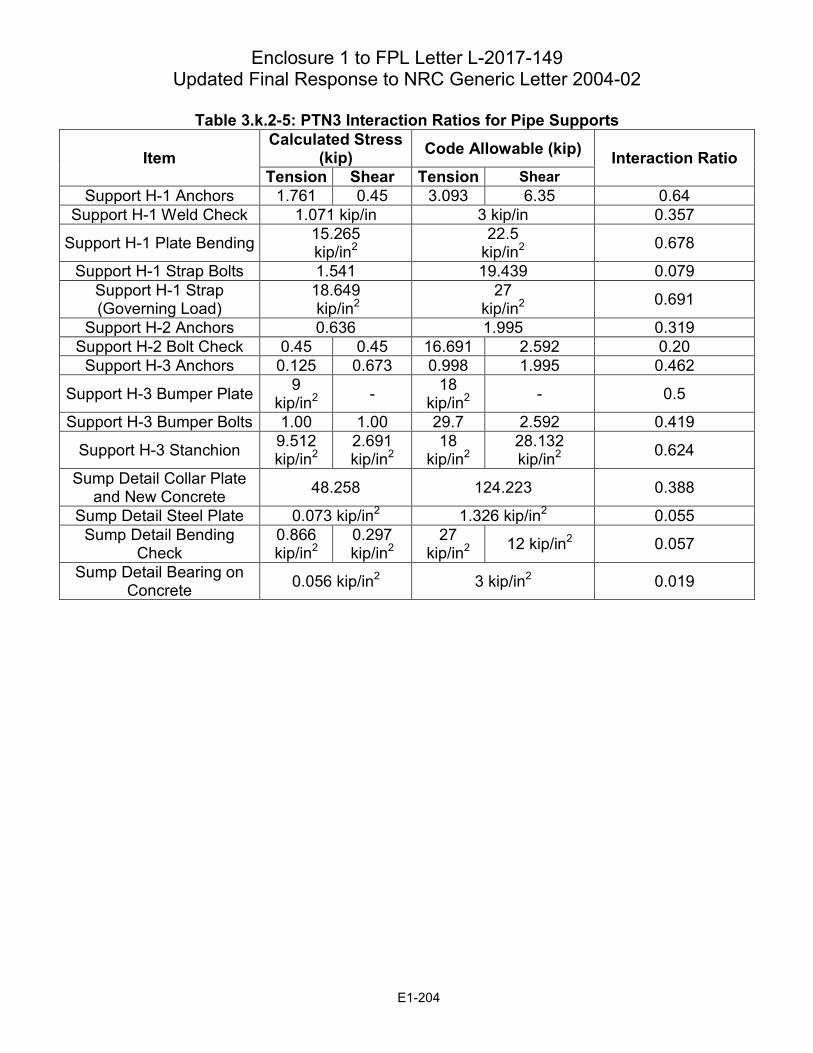
supports and debris interceptors) provides margin to design allowable stresses, which ensures that the strainer system will perform its function as long as necessary following an event that requires its use. Table 3.k.2-1 through Table 3.k.2-5 for PTN3, and Table 3.k.2-6 and Table 3.k.2-9 for PTN4 in the Response to 3.k.2 contain itemized strainer component lists and the margins for each component.
Conservatisms: • The system only operates once containment is flooded with water and the entire
system is fully submerged, following a LOCA event. Thereafter, the maximum differential pressure across the strainer is produced during steady state recirculation. The strainer assembly weight, debris weight and crush pressure (differential pressure) was included in the maximum earthquake analysis (SSE)
E1-21
Enclosure 1 to FPL Letter L-2017-149
Updated Final Response to NRC Generic Letter 2004-02
to develop the stresses and loads on the strainer (see the Response to 3.k.1, Table 3.k.1-1 and Table 3.k.1-4 for PTN3, Table 3.k.1-5 and Table 3.k.1-9 for PTN4).
• Use of the code of record provides the conservatism inherit within the code itself. Vortexing Evaluation Conservatisms: • PSL1 vortex testing was used to determine if vortexing is expected to occur at
PTN3. The PSL1 clean strainer vortexing test used a strainer submergence of 1” and an average approach velocity of up to 0.00618 ft/s, and the debris laden vortexing test used an average approach velocity of 0.0026 ft/s. This is conservative as vortexes are more prone to form at higher velocities and lower submergences. For comparison, the minimum SBLOCA submergence for PTN3’s strainer is 2.88”, and the average approach velocity is 0.00171 ft/s during recirculation (see the Response to 3.f.3). Plant strainer minimum submergence at the start of the recirculation was compared with the submergence limit established by the debris-laden vortex tests. It should be noted that these tests were performed after all conventional and chemical debris had been added to the test tank. This is conservatively bounding because the strainer is expected to be clear of debris at the start of recirculation.
• Testing was conducted to determine if vortexing is expected to occur at PTN4. The vortex tests were performed at both clean strainer and debris-laden conditions. All vortex tests used a strainer approach velocity of 0.00228 ft/s, which is based on a conservatively smaller strainer surface area by accounting for a sacrificial area of 200 ft2 for miscellaneous debris. As shown in the PTN4 debris generation calculation, the actual reduction in strainer surface area due to blockage by the miscellaneous debris is less than 100 ft2. This is conservative as vortexes are more prone to form at higher velocities. The plant strainer minimum submergence at the start of the recirculation was compared with the submergence limit established by the debris-laden vortex tests. It should be noted that these tests were performed after all conventional and chemical debris had been added to the test tank. This is conservatively bounding because the strainer is expected to be clear of debris at the start of recirculation (see the Response to 3.f.3).
Head Loss Conservatisms: PTN3 • The quantity of latent debris used to determine the strainer head loss was 200
lbm, but the actual amount of latent debris documented for the plant is 77.2 lbm. Similarly, a sacrificial strainer area of 200 ft2 was used when determining the testing parameters (see the Response to 3.f.4). In reality, the reduction in strainer
E1-22
Enclosure 1 to FPL Letter L-2017-149
Updated Final Response to NRC Generic Letter 2004-02
surface area due to blockage of miscellaneous debris is 70 ft2 (93.192 ft2 x 75%) (Reference 6 p. 49).
• The total quantities of conventional debris used for the thin-bed test were greater than the maximum amount of conventional debris calculated to transport to the strainer (see the Response to 3.f.7).
• The approach velocity used in the thin-bed test was greater than the plant strainer’s average approach velocities (see the Response to 3.f.7).
• Although the head loss test was performed at more conservative conditions (lower temperatures and higher flow rate) than those in the actual plant, head loss test data was not scaled to greater temperatures and lower flow rates for NPSH and flashing evaluations (see the Response to 3.f.10).
• A significant conservatism is that the debris transport analysis conservatively predicted the quantity of material that would be transported to the strainer. Testing required extraordinary measures to ensure fine debris would be transported to the strainer during the test. The reality is that a large portion of the debris would never make it to the strainer due to agglomeration effects, the propensity for fiber to become wrapped around or entangled with plant equipment, and the settling of debris in low flow regions.
PTN4 • The quantity of latent debris used to determine the strainer head loss was 200
lbm, but the actual amount of latent debris documented for the plant is 154.4 lbm. Similarly, a sacrificial strainer area of 200 ft2 was used when determining the testing parameters (see the Response to 3.f.4). In reality, the reduction in strainer surface area due to blockage of miscellaneous debris (with a total surface area of 116.5 ft2 determined from walkdowns is 87 ft2 (116.5 ft2 x 75%) (Reference 6 p. 49).
• The total quantities of conventional debris used for the PTN4 full debris load tests were greater than the maximum amount of conventional debris calculated to transport to the sump for 23-inch and smaller breaks (see the Response to 3.f.7).
• The approach velocities used in the PTN4 head loss tests were greater than the plant strainer’s average approach velocities (see the Response to 3.f.7).
• The PTN4 clean strainer head losses calculated for different components were increased by either 10% or 6% in the clean screen head loss calculation to bound the uncertainties (see the Response to 3.f.9).
• Although the head loss tests were performed at more conservative conditions (lower temperatures and higher flow rates) than those in the actual plant, head loss test data was not scaled to greater temperatures and lower flow rates for NPSH and flashing evaluations (see the Response to 3.f.10).
• A significant conservatism is that the debris transport analysis conservatively predicted the quantity of material that would be transported to the strainer. Testing required extraordinary measures to ensure fine debris would be transported to the strainer during the test. The reality is that a large portion of the debris would never make it to the strainer due to agglomeration effects, the
E1-23
Enclosure 1 to FPL Letter L-2017-149
Updated Final Response to NRC Generic Letter 2004-02
propensity for fiber to become wrapped around or entangled with plant equipment, and the settling of debris in low flow regions.
Penetration Conservatisms: PTN4 • As discussed in the Response to 3.n.1, for penetration testing, some of the disks
of a prototypical strainer module were removed to increase the spacing between adjacent disks. This decreased the likelihood of the development of a fiber bridge across adjacent disks. This is conservative because fiber bridges can block flow paths to certain interstitial parts of the strainer, effectively reducing the penetrable surface area of the strainer.
Chemical Effects Margins: • At PTN3, the aluminum inventory includes a design contingency of 269 ft2 of
submerged aluminum, 515 ft2 of unsubmerged aluminum, and 882 ft2 (4 lbm) of thin aluminum.
• At PTN4, the aluminum inventory includes a design contingency of 353 ft2 of submerged aluminum, 161 ft2 of unsubmerged aluminum, and 596 ft2 (3 lbm) of thin aluminum.
Conservatisms: • Debris quantities bound the maximum amount of debris predicted from the
bounding LOCA break. • Maximum pH values were conservatively used to increase the calculated
aluminum release and minimum pH values were conservatively used to decrease the calculated aluminum solubility.
• The maximum containment sump pool mass was conservatively used to increase the calculated aluminum release.
• The minimum containment sump pool mass was conservatively used to increase the calculated maximum aluminum precipitation temperature.
• Maximum temperature profiles were conservatively assumed. • All destroyed and latent debris was conservatively assumed to be submerged. • All unsubmerged aluminum in containment was assumed to be exposed to
containment sprays and the containment sprays were assumed to be active for the full 30-day event.
• Aluminum inventory bounds the maximum surface area of aluminum available for release in containment.
• All of the aluminum RMI on the reactor vessel was conservatively assumed to be submerged and available for aluminum release for the reactor cavity breaks. Realistically, only the RMI destroyed as a result of the break jet and a portion of
E1-24
Enclosure 1 to FPL Letter L-2017-149
Updated Final Response to NRC Generic Letter 2004-02
the aluminum RMI below the flood elevation (e.g. panels with holes for instrumentation penetrations) would be available for aluminum release.
• The total quantity of aluminum in solution was assumed to precipitate as aluminum oxyhydroxide (AlOOH) after the concentration exceeds the calculated solubility limit.
In-Vessel Conservatisms: PTN3 • The values presented for core inlet and total reactor vessel fiber loads in the
Response to 3.n.1 are for the entire 30-day mission time. This is conservative because the in-vessel fiber loads should be compared to the acceptance criteria prior to the conclusion of the 30-day mission time according to the methodology in WCAP-17788 (Reference 9).
PTN4 • All fiber that penetrates the strainers was assumed to transport to the reactor
vessel. Diversion of fiber to the containment spray system was not credited. This maximizes the debris that reaches the reactor vessel (see the Response to 3.n.1).
• The fiber that is delivered to the reactor vessel was assumed to accumulate at the core inlet. This is the most conservative and challenging scenario to pass in-vessel effects according to WCAP-17788 (see the Response to 3.n.1).
LOCADM (Loss of Coolant Accident Deposition Model) Margins: • The maximum peak cladding temperature (PCT) in the LOCADM analysis is
346.1 °F with an acceptance criterion of 800 °F, resulting in a margin of 453.9 °F • The maximum deposition thickness (DT) in the LOCADM analysis is 27.16 mils,
resulting in a margin of 22.84 mils.
Conservatisms: • The containment sump pool pH was assumed to remain at the maximum final pH
throughout the duration of the analysis. • The maximum sump temperature profile and the maximum containment
temperature profile were used in the analysis because higher temperatures yield conservatively higher amounts of calculated aluminum releases, thereby increasing the total amount of deposition.
• The amount of fibrous debris that bypasses the sump strainer and is available for deposition in the core was assumed to be 100 grams per fuel assembly (g/FA). This value, which is greater than the bypassed fiber mass determined from
E1-25
Enclosure 1 to FPL Letter L-2017-149
Updated Final Response to NRC Generic Letter 2004-02
testing, conservatively accounts for additional operating margin and leads to greater deposition thickness.
• When calculating fuel rod DT and PCT, no credit was taken for accumulation of fine particulate or chemical precipitate collecting on the strainer; thus, accumulation on the fuel rods was maximized, resulting in greater DT and PCT .
• The amount of fibrous debris that bypasses the sump strainer and is available for deposition on the fuel rods was assumed to be 100 g/FA. This value, which is greater than the bypassed fiber mass determined from testing (see the Response to 3.n.1), conservatively accounts for additional operating margins and leads to greater deposition thickness.
Ex-Vessel Conservatisms:
• It was conservatively assumed that the maximum quantity of each debris type transports to the strainer, rather than using the quantities of each debris type generated by a single bounding break. This means that the debris quantities presented do not represent a single break, but instead maximize each debris type, conservatively bounding all break scenarios presented in the debris transport quantity summary calculation.
• The minimum sump pool volume was combined with the maximum debris loads from a large-break loss-of-coolant accident (LBLOCA) to determine debris concentration. This is conservative because minimizing the mass of recirculating water maximizes the debris concentration, and thus the amount of wear. Additionally, water volumes such as portions of the RCS inventory or the volume of water in the RHR piping could also be proven to be part of the recirculation flow path, but were conservatively excluded for the downstream effects calculations.
• Although the actual maximum spherical size particulate that is expected to bypass the strainer is 0.103 inches, the maximum particulate size that bypasses the strainer was assumed to be 0.125 inches for the downstream effects evaluations.
• The concentrations of debris at PTN3 and PTN4 have been revised since the downstream effects evaluations were initially performed. However, the current debris concentrations remain bounded by those originallyly used in the downstream effects evaluations.
E1-26
Enclosure 1 to FPL Letter L-2017-149
Updated Final Response to NRC Generic Letter 2004-02
3. Specific Information Regarding Methodology for Demonstrating Compliance:
3.a. Break Selection
The objective of the break selection process is to identify the break size and location that present the greatest challenge to post-accident sump performance.
1. Describe and provide the basis for the break selection criteria used in the
evaluation. Response to 3.a.1: The PTN3 and PTN4 debris generation calculations followed the methodology of NEI 04-07 (Reference 10 pp. 3-5 - 3-26, 4-1 - 4-5 ; 6 pp. 12-35, 85-91) and associated NRC SE (Reference 6), with the exception that they analyzed a full range of breaks, not just the worst-case breaks as suggested by NEI 04-07 (Reference 10 pp. 3-6, 3-7). The purpose of the calculation was to obtain debris quantities for a range of possible break scenarios. The calculation evaluated debris generation quantities on every ISI weld inside the first isolation valve, including breaks at the reactor nozzles. The following types of LOCA breaks were considered:
• DEGBs with the largest break being a DEGB of the 31” crossover leg, • Partial breaks, orientated 45 degrees apart, at size increments of 0.5, 2, 4, 6,
8, 10, 12, 14, 17, 20, 23, and 26 inches, • SEGBs within 10 pipe diameters of a normally closed isolate valve or
termination point. In the debris generation calculations, three-dimensional CAD models of the PTN3 and PTN4 containment buildings were updated to work with ENERCON’s BADGER software. BADGER was used to place ZOIs representing possible breaks on every ISI weld inside the first isolation valve in containment. Figure 3.a.1-1 shows the graphical representation of these weld locations for PTN3 and Figure 3.a.1-2 shows the graphical representation of these weld locations for PTN4. Per Section 3.3.5.2 of the NRC SE of NEI 04-07, evaluating breaks at equal increments is “only a reminder to be systematic and thorough” (Reference 6 p. 17). The use of Class 1 ISI welds as break locations is both systematic and thorough because they are closer to the components that contain the greatest quantity of debris sources as opposed to a span of straight pipe further way from these sources (see Figures 3.a.1-1 and 3.a.1-2). Also, welds are almost exclusively recognized as likely failure locations because they can have relatively high residual stress, are preferentially-attacked by many degradation mechanisms, and are most likely to have preexisting fabrication defects (Reference 11 p. xviii). Since each of the weld locations were evaluated for determination of the quantity of debris that would be generated, these locations, by observation, represent the limiting break locations.
E1-27
Enclosure 1 to FPL Letter L-2017-149
Updated Final Response to NRC Generic Letter 2004-02
As discussed in the Response to 3.b.1, the insulation types within PTN3 and PTN4 include RMI, Cal-Sil, and a variety of fibrous insulation types. As RMI tends to be a non-problematic debris source for non-pit type strainers (Reference 3, Appendix A pg. 4-5), maximizing the generation of Cal-Sil and fibrous insulation was the focus of the break selection process. The combination of Cal-Sil and fiber can form tight debris beds with limited porosity, which can cause high head losses even at low approach velocities (Reference 3, Appendix A pg. 4). The breaks presented in the Response to 3.a.3, for PTN3, maximize the quantities of these problematic debris types. As discussed previously, the alternate evaluation methodology was used for PTN4. In the alternate evaluation methodology, the breaks are separated into two regions based on an alternate break size (Reference 10 pp. 6-1, 6-2). Breaks less than or equal to the threshold break size (23”) are considered to be in Region I (see Alternate Evaluation Methodology section and the Response to 3.a.3). Break sizes greater than the threshold break size are considered to be in Region II (see Alternate Evaluation Methodology section and the Response to 3.a.3). Since the debris generation calculations evaluate the full range of break sizes (up to a DEGB) for each ISI weld in containment inside the first isolation valve, there is a complete set of breaks to choose from for either Region I or Region II analysis. As discussed earlier in this section, the most limiting breaks are those that contain sufficient fiber and Cal-Sil to result in sufficient head loss across the strainer to challenge the NPSH margin. Strainer head loss testing provided the basis for the debris quantities that would result in either acceptable or unacceptable strainer head loss (see the Response to 3.f). Additional information for PTN4 is provided in the Response to 3.a.3.
E1-28
Enclosure 1 to FPL Letter L-2017-149
Updated Final Response to NRC Generic Letter 2004-02
Figure 3.a.1-1: PTN3 Weld Locations Where Postulated LOCAs Occur
E1-29
Enclosure 1 to FPL Letter L-2017-149
Updated Final Response to NRC Generic Letter 2004-02
Figure 3.a.1-2: PTN4 Weld Locations Where Postulated LOCAs Occur
E1-30
Enclosure 1 to FPL Letter L-2017-149
Updated Final Response to NRC Generic Letter 2004-02
2. State whether secondary line breaks were considered in the evaluation (e.g., main steam and feedwater lines) and briefly explain why or why not.
Response to 3.a.2:
Feedwater and main steam piping were not considered for potential break locations because ECCS in recirculation mode is not required for main steam or feedwater line breaks.
3. Discuss the basis for reaching the conclusion that the break size(s) and locations chosen present the greatest challenge to post-accident sump performance.
Response to 3.a.3: The debris generation calculations for PTN3 and PTN4 take into account a spectrum of break sizes on every ISI weld within the Class 1 pressure boundary inside the first isolation valve. The purpose is to characterize the debris generation for the range of possible break scenarios. This includes the debris generated by the worst-case scenario LOCAs (typically DEGBs on the main loop piping). Given that most large breaks generate similar quantities of latent dirt/dust, miscellaneous debris (stickers, tags, labels, tape), coatings in the ZOI (particulate), and unqualified coatings, the breaks that present the greatest challenge to post-accident sump performance are breaks that generate limiting amounts of Cal-Sil and fibrous debris (as discussed in the Response to 3.a.1). Areas with the potential to generate significant quantities of Cal-Sil and fibrous debris were identified. PTN3 In each loop, the two most bounding breaks that maximize the debris load from Cal-Sil and fiber were chosen; see Table 3.a.3-1 for descriptions of these locations and see the Response to 3.b.4 for quantities
Unit Loop Limiting Debris Type Weld Location Location Description
PTN3 B DEGB Cal-Sil 31-RCS-1302-10 Loop B Crossover Leg at RCP
PTN3 N/A DEGB Fiber 12-RC-1301-8 Surge Line Near Pressurizer Nozzle
E1-31
Enclosure 1 to FPL Letter L-2017-149
Updated Final Response to NRC Generic Letter 2004-02
PTN4 For PTN4, the alternate evaluation methodology was used. The breaks are separated into two regions based on a threshold break size. For PTN4, large-scale head loss testing used particulate and debris loads sufficient to bound all 23” partial breaks. Breaks less than or equal to 23” are considered to be in Region I. Breaks greater than 23” are considered to be in Region II. In both regions, the breaks that generated the largest quantities of Cal-Sil and fibrous debris were selected (see Table 3.a.3-2).
Unit Region Loop Limiting Debris Type Weld Location Location
Description
PTN4 I A DEGB Cal-Sil 31-RCS-1401-10 Loop A Crossover Leg at RCP
PTN4 II A 23” Cal-Sil 29-RCS-1404-3, 180° Loop A Hot Leg at Elbow
PTN4 I B DEGB Fiber 29-RCS-1405-3 Loop B Hot Leg at Elbow
PTN4 II A 23” Fiber 29-RCS-1404-3, 0° Loop A Hot Leg at Elbow
E1-32
Enclosure 1 to FPL Letter L-2017-149
Updated Final Response to NRC Generic Letter 2004-02
3.b. Debris Generation/Zone of Influence (excluding coatings)
The objective of the debris generation/ZOI process is to determine, for each postulated break location: (1) the zone within which the break jet forces would be sufficient to damage materials and create debris; (2) the amount of debris generated by the break jet forces.
1. Describe the methodology used to determine the ZOIs for generating debris. Identify which debris analyses used approved methodology default values. For debris with ZOIs not defined in the guidance report/SE, or if using other than default values, discuss method(s) used to determine ZOI and the basis for each.
Response to 3.b.1:
In a PWR reactor containment building, the worst-case pipe break would typically be a DEGB. In a DEGB, jets of water and steam would blow in opposite directions from the severed pipe. One or both jets could impact obstacles and be reflected in different directions. To take into account the double jets and potential jet reflections, NEI 04-07 (Reference 10 p. 1−3; 6 p. vi) proposes using a spherical ZOI centered at the break location to determine the quantity of debris that could be generated by a given line break. For DEGBs, the ZOI is defined as a spherical volume about the break in which the jet pressure is higher than the destruction/damage pressure for a certain type of insulation, coatings, or other materials impacted by the break jet. For any break smaller than a DEGB (i.e., a partial break) NEI 04-07, Volume 2 accepts the use of a hemispherical ZOI centered at the edge of the pipe (Reference 6 p. 117). Because these types of breaks could occur anywhere along the circumference of the pipe, the partial breaks were analyzed using hemispheres at eight different angles that are 45 degrees apart from each other around the pipe. Because different insulation types have different destruction pressures, different ZOIs were determined for each type of insulation. Table 3.b.1-1 shows the primary side break equivalent ZOI radii divided by the break diameter (L/D) for each representative material in the PTN3 and PTN4 containment buildings.
E1-33
Enclosure 1 to FPL Letter L-2017-149
Updated Final Response to NRC Generic Letter 2004-02
Table 3.b.1-1: Primary Side Break ZOI Radii for PTN3 and PTN4 Insulation Types Insulation Type Destruction Pressure
* NRC SE for NEI 04-07 (Reference 6 pp. 30 and II-20) ** Revised Guidance Regarding Coatings Zone of Influence for Review of Final Licensee Responses to Generic
Letter 2004-02 (Reference 7 p. 2) *** The destruction pressure of Kaowool (PTN3) was assumed to be the same as Mirror RMI. **** 40 psi corresponds to a 4D ZOI in Table 3-1 of the NRC SE (Reference 6 p. 27) *****Ceramic Fiber is assumed to have the same properties as Temp-Mat. In some cases, if the ZOI for a particular material is very large (i.e., it has a low destruction pressure or is located on a large pipe), the radius of the sphere may extend beyond robust barriers located near the break. Robust barriers consist of structures, such as concrete walls that are impervious to jet flow and prevent further expansion of the jet. Insulation in the shadow of large robust barriers can be assumed to remain intact to a certain extent (Reference 10 pp. 3-14 – 3-15). Due to the compartmentalization of containment in PTN3 and PTN4, the insulation on the opposite side of the compartment walls can be assumed to remain intact. All ZOIs were truncated to account for robust barriers per NEI 04-07 Volume 2 (Reference 6 p. vii). ZOIs at the reactor nozzle break locations were also analyzed. Volumetric debris quantities were determined by measuring the interference between a ZOI and its corresponding debris source. This was done within the CAD model environment. No insulation debris would be generated outside of the ZOIs (Reference 10 pp. 3-19 – 3-20). This practice is considered acceptable by the NRC as stated in the SE on NEI 04-07 (Reference 6 pp. 35-37).
E1-34
Enclosure 1 to FPL Letter L-2017-149
Updated Final Response to NRC Generic Letter 2004-02
2. Provide destruction ZOIs and the basis for the ZOIs for each applicable debris constituent.
Response to 3.b.2:
See the Response to 3.b.1.
3. Identify if destruction testing was conducted to determine ZOIs. If such testing has not been previously submitted to the NRC for review or information, describe the test procedure and results with reference to the test report(s).
Response to 3.b.3:
PTN applied the ZOI refinement discussed in NEI 04-07 Volume 2 (Reference 6 pp. 92-93), which allows the use of debris-specific spherical ZOIs. The only ZOI that is being used that is different from those listed in NEI 04-07 is that for qualified coatings. This is discussed in the Response to 3.h. 4. Provide the quantity of each debris type generated for each break location
evaluated. If more than four break locations were evaluated, provide data only for the four most limiting locations.
Response to 3.b.4:
Using the ZOIs listed in this section, the breaks selected in the Response to 3.a, and the size distribution provided in the Response to 3.c of this enclosure, quantities of generated debris for each break case were calculated for each type of insulation. Table 3.b.4-1 and Table 3.b.4-2 show the quantities of debris generated for the two most limiting DEGB locations with respect to Cal-Sil and fiber at PTN3, respectively. Table 3.b.4-3 shows the quantities of debris generated for the two most limiting DEGB locations and the two most limiting 23” breaks with respect to Cal-Sil at PTN4. Table 3.b.4-4 shows the quantities of debris generated for the two most limiting DEGB locations and the two most limiting 23” breaks with respect to fiber at PTN4. Note that coatings quantities are provided in the tables for completeness, but are discussed further in the Response to 3.h. The fiber quantities presented in Table 3.b.4-1 through Table 3.b.4-4 have been converted to mass (lb) by multiplying the volumes by their associated density.
E1-35
Enclosure 1 to FPL Letter L-2017-149
Updated Final Response to NRC Generic Letter 2004-02
Table 3.b.4-1: PTN3 Worst-Case Breaks for Mass of Cal-Sil Break Location 31-RCS-1302-10 31-RCS-1303-10
Fine 0.97 0.97 Small 3.87 3.87 Large 0.00 0.00 Intact 0.00 0.00
Kaowool (lb) Fine 205.11 205.11
Ceramic Fiber (lb)
Fine 0.00 0.00 Small 0.00 0.00 Large 0.00 0.00 Intact 0.00 0.00
Cal-Sil (lb)
Fine 0.00 0.00 Small 0.00 0.00 Intact 0.00 0.00
Mirror and Transco RMI (ft2)
Small (<4”) <1 54
Large (≥ 4”) <1 18
Carboguard 890N Fine 2.63
lb 0.02 ft3
5.35 lb
0.05 ft3
E1-37
Enclosure 1 to FPL Letter L-2017-149
Updated Final Response to NRC Generic Letter 2004-02
Table 3.b.4-3: PTN4 Worst-Case Breaks for Mass of Cal-Sil, DEGB and 23”
Break Location 31-RCS-1401-10
31-RCS-1401-7
29-RCS-1404-3
29-RCS-1404-3
Location Description
Loop A Crossover
Leg at RCP
Loop A Crossover Leg
at RCP
Loop A Hot Leg at Elbow
Loop A Hot Leg at Elbow
Break Size 31” 31” 23" 23"
Break Type DEGB DEGB Partial (Angle – 225°)
Partial (Angle –
180°)
Nukon (lb)
Fine 99.99 117.87 5.85 1.77 Small 306.92 392.96 18.24 3.86 Large 266.69 224.80 14.74 9.28 Intact 288.19 242.89 15.93 10.03
Temp-Mat (lb)
Fine 119.26 176.26 6.47 4.88 Small 133.00 314.90 6.92 5.11 Large 190.61 68.78 10.86 8.39 Intact 205.56 74.01 11.72 9.05
Cal-Sil (lb) Fine 800.43 783.83 338.22 327.59 Small 547.39 564.91 243.62 218.85 Intact 1,156.43 1,003.57 433.67 496.41
Mirror and Transco RMI (ft2)
Small (<4”) 7,030 6,179 5,208 3,729
Large (≥4”) 2,343 2,060 1,736 1,243
Carboguard 890N Fine 89.73
lb 0.82 ft3
127.35 lb
1.17 ft3
18.71 lb
0.17 ft3
23.74 lb
0.22 ft3
E1-38
Enclosure 1 to FPL Letter L-2017-149
Updated Final Response to NRC Generic Letter 2004-02
Table 3.b.4-4: PTN4 Worst-Case Breaks for Mass of Fiber, DEGB and 23”
Break Location 29-RCS-1405-3
31-RCS-1402-5
29-RCS-1408-3
29-RCS-1404-3
Location Description Loop B Hot Leg at Elbow
Loop B Crossover Leg at SG
Nozzle
Loop C Hot Leg at Elbow
Loop A Hot Leg at Elbow
Break Size 29” 31” 23" 23"
Break Type DEGB DEGB Partial (Angle – 0°)
Partial (Angle – 0°)
Nukon (lb)
Fine 142.44 160.37 96.01 95.47 Small 498.08 588.53 321.13 318.94 Large 205.06 151.12 180.10 180.20 Intact 221.53 163.19 194.59 194.70
Temp-Mat (lb)
Fine 174.44 187.35 115.90 121.63 Small 313.63 366.53 206.99 219.01 Large 64.47 15.84 45.33 44.36 Intact 69.36 16.86 48.78 47.72
Cal-Sil (lb) Fine 460.30 478.32 7.39 8.53 Small 338.73 323.45 3.94 4.99 Intact 558.16 707.39 15.64 16.11
Mirror and Transco RMI (ft2)
Small (<4”) 7,687 7,687 358 363
Large (≥ 4”) 2,562 2,562 119 121
Carboguard 890N Fine 43.62
lb 0.40 ft3
69.18 lb
0.63 ft3
8.80 lb
0.08 ft3
9.90 lb
0.09 ft3
E1-39
Enclosure 1 to FPL Letter L-2017-149
Updated Final Response to NRC Generic Letter 2004-02
5. Provide total surface area of all signs, placards, tags, tape, and similar miscellaneous materials in containment.
Response to 3.b.5:
Labels, tags, stickers, placards, and other miscellaneous or foreign materials were evaluated via walkdown. The amount of foreign materials recorded for PTN3 and PTN4 was 93.192 ft2 and 116.5 ft2, respectively. However, for conservatism, a total surface area of 266 ft2 was assumed for both PTN units.
E1-40
Enclosure 1 to FPL Letter L-2017-149
Updated Final Response to NRC Generic Letter 2004-02
3.c. Debris Characteristics
The objective of the debris characteristics determination process is to establish a conservative debris characteristics profile for use in determining the transportability of debris and its contribution to head loss.
1. Provide the assumed size distribution for each type of debris. Response to 3.c.1: A summary of the material properties of the debris types found within containment are listed in Table 3.c.1-1 (Reference 10 pp. 3-22, 3-28, 3-29, and 3-31; 6 p. 38).
Table 3.c.1-1: PTN3 and PTN4 Debris Material Properties
Debris Distribution Density (lbm/ft³)
Characteristic Size (μm)
Nukon See section below 2.4 (bulk) 159 (fiber) 7
Temp-Mat See section below 11.8 (bulk) 162 (fiber) 9
Ceramic Fiber*
Kaowool** 100% Fines 12 (bulk) 161 (fiber) 2.7-3.0
Mirror/Transco RMI
75% Small Pieces
25% Large Pieces
- -
<4”
≥4”
Cal-Sil See section below 14.5 (bulk) 144 (particulate) 5
*Ceramic Fiber is assumed to have the same properties as Temp-Mat **The GR lists a range of densities for Kaowool (Reference 10 pp. 3-28 – 3-29). The highest density is selected because it leads to higher fiber mass per a given volume.
E1-41
Enclosure 1 to FPL Letter L-2017-149
Updated Final Response to NRC Generic Letter 2004-02
Nukon Low-Density Fiberglass Insulation
The debris characteristics for Nukon are listed in Table 3.c.1-1.
A baseline analysis of Nukon includes a size distribution with two categories—60 percent small fines, and 40 percent large pieces per NEI 04-07 (Reference 10 pp. 3-20 – 3-22). The debris generation calculation uses a four-category size distribution based on the guidance in NEI 04-07 Volume 2 (Reference 6, Appendix II and Appendix VI, p. VI-14). This guidance provides an approach for determining a size distribution for low-density fiberglass using the air jet impact test (AJIT) data, with conservatism added due to the potentially higher level of destruction from a two-phase jet. Within the 17.0D ZOI, the size distribution varies based on the distance of the insulation from the break (i.e., insulation debris generated near the break location consists of more small pieces than insulation debris generated near the edge of the ZOI). Consequently, the following equations were developed to determine the fraction of fines (individual fibers), small pieces (less than 6 inches), large pieces (greater than 6 inches), and intact blankets as a function of the average distance between the break point and the centroid of the affected debris measured in units of pipe diameters (C).
Updated Final Response to NRC Generic Letter 2004-02
Temp-Mat High-Density Fiberglass and Ceramic Fiber Insulation The debris characteristics for Temp-Mat and ceramic fiber are listed in Table 3.c.1-1. Similar to Nukon, a refinement to the standard methodology was used and takes into account a size distribution for Temp-Mat and ceramic fiber using AJIT data. The following equations were developed to determine the fraction of fines (individual fibers), small pieces (less than 6 inches), large pieces (greater than 6 inches), and intact blankets as a function of the average distance within an 11.7D ZOI between the break point and the centroid of the affected debris measured in units of pipe diameters (C).
Updated Final Response to NRC Generic Letter 2004-02
Cal-Sil Insulation The debris characteristics for Cal-Sil are listed in Table 3.c.1-1. Similar to Nukon, a refinement to the standard methodology was used and takes into account a size distribution for Cal-Sil using jet test data. The following equations were developed to determine the fraction of fines (particulate), small pieces (less than 1 inch up to 3 inches), and intact pieces (remains on the target) as a function of the average distance within a 6.4D ZOI between the break point and the centroid of the affected debris measured in units of pipe diameters (C).
Updated Final Response to NRC Generic Letter 2004-02
2. Provide bulk densities (i.e., including voids between the fibers/particles) and material densities (i.e., the density of the microscopic fibers/particles themselves) for fibrous and particulate debris.
Response to 3.c.2:
See the Response to 3.c.1 for the material and bulk densities of the various types of debris.
3. Provide assumed specific surface areas for fibrous and particulate debris.
Response to 3.c.3:
Specific surface areas could be calculated for each debris type based on the characteristic diameter described in the Response to 3.c.1. However, testing was used to determine strainer head loss and not an analytical method, so specific surface areas were not calculated or used for the PTN head loss evaluations (see the Response to 3.f).
4. Provide the technical basis for any debris characterization assumptions that deviate from NRC-approved guidance.
Response to 3.c.4:
The debris characterizations for all debris types follow NRC-approved guidance.
E1-45
Enclosure 1 to FPL Letter L-2017-149
Updated Final Response to NRC Generic Letter 2004-02
3.d. Latent Debris
The objective of the latent debris evaluation process is to provide a reasonable approximation of the amount and types of latent debris existing within the containment and its potential impact on sump-screen head loss.
1. Provide the methodology used to estimate the quantity and composition of latent debris.
Response to 3.d.1:
Walkdowns have been completed for PTN3 specifically for the purpose of characterizing latent and miscellaneous debris. These walkdowns utilized the guidance in NEI 02-01 and the NRC SE on NEI 04-07 (Reference 6 pp. 44-54). Samples were collected from eight surface types including floors, the containment liner, ventilation ducts, cable trays, walls, equipment, piping and grating. For each surface type, a minimum of four samples were collected, bagged and weighed to determine the quantity of debris that was collected. A statistical approach was used to estimate an upper limit of the mean debris loading on each surface. The horizontal and vertical surface areas were conservatively estimated. The total latent debris mass for a surface type was calculated using the upper limit of the mean debris loading multiplied by the conservatively estimated area for that surface type. The total latent debris was calculated using the sum of the latent debris for each surface type. See the Response to 3.d.2 for the PTN4 results.
2. Provide the basis for assumptions used in the evaluation.
Response to 3.d.2:
It was assumed that the latent debris found at PTN3 is representative of PTN4 and that a margin of 100% could be added to compensate for any deviations. Furthermore, a conservative value of 200 lb was used for analyses for both PTN3 and PTN4.
E1-46
Enclosure 1 to FPL Letter L-2017-149
Updated Final Response to NRC Generic Letter 2004-02
3. Provide results of the latent debris evaluation, including amount of latent debris types and physical data for latent debris as requested for other debris under c. above.
Response to 3.d.3:
The results of the latent debris calculation found that PTN3 had 77.22 lb of latent debris in containment. The amount of latent debris for PTN3 was assumed to be representative of PTN4 and doubled for conservatism to 154.44 lb. However, a more conservative value of 200 lb was used for the analyses for both units. Table 3.d.3-1 lists the assumed latent fiber and particulate constituents and their material characteristics. Latent debris was assumed to consist of 15 percent fiber and 85 percent particulate by mass per NEI 04-07 Volume 2 (Reference 6 p. 50). Based on NEI 04-07 Volume 2 (Reference 6 pp. 50-52, V-II), the size and density of latent particulate were assumed to be 17.3 µm (specific surface area of 106,000 ft-1) and 168.6 lbm/ft3 (2.7 g/cm3), respectively. Additionally, the bulk density and microscopic density of latent fiber were assumed to be 2.4 lbm/ft3 and 93.6 lbm/ft3 (1.5 g/cm3), respectively. Latent fiber was assumed to have a characteristic size of 5.5 µm. This is reasonably conservative, as it is the smallest fiber diameter listed in Table 3-2 of the general reference for low-density fiberglass found in NEI 04-07 (Reference 10 pp. 3-28 – 3-29).
Table 3.d.3-1: PTN3 and PTN4 Latent Fiber and Particulate Constituents Latent
Updated Final Response to NRC Generic Letter 2004-02
4. Provide amount of sacrificial strainer surface area allotted to miscellaneous latent debris.
Response to 3.d.4:
A total surface area of 266 ft2 of miscellaneous debris was conservatively assumed in the PTN3 and PTN4 debris generation calculations. This surface area would result in a 200 ft2 sacrificial strainer area (75% of 266 ft2) (Reference 6 p. 49).
E1-48
Enclosure 1 to FPL Letter L-2017-149
Updated Final Response to NRC Generic Letter 2004-02
3.e. Debris Transport
The objective of the debris transport evaluation process is to estimate the fraction of debris that would be transported from debris sources within containment to the sump suction strainers.
1. Describe the methodology used to analyze debris transport during blowdown, washdown, pool-fill-up, and recirculation phases of an accident.
Response to 3.e.1:
The methodology used in the transport analysis was based on the NEI 04-07 guidance (Reference 10 pp. 3-42 - 3-54, 4-14 - 4-34) and the associated NRC SE (Reference 6 pp. 55-61, 98-101) for refined analyses, as well as the refined methodologies suggested by the SE in Appendices III, IV, and VI (Reference 6 pp. III-1 - III-73, IV-1 - IV-6, VI-1 - VI-71). The specific effect of each of four modes of transport was analyzed in the debris transport calculations for each type of debris generated. These modes of transport are:
• Blowdown Transport – the vertical and horizontal transport of debris to all areas of containment by the break jet
• Washdown Transport – the vertical (downward) transport of debris by the containment sprays, break flow, and condensation
• Pool Fill-Up Transport – the transport of debris by break and containment spray flows from the RWST to regions that may be active or inactive during recirculation
• Recirculation Transport – the horizontal transport of debris from the active portions of the recirculation pool to the sump screens by the flow through the ECCS
The logic tree approach was applied for each type of debris determined from the debris generation calculation. The logic tree shown in Figure 3.e.1-1 is slightly different from the baseline. This departure was made to account for certain non-conservative assumptions identified by the NRC SE (Reference 6 pp. 55-61, 98-101) including the transport of large pieces, erosion of small and large pieces, the potential for washdown debris to enter the pool after inactive areas have been filled, and the direct transport of debris to the sump screens during pool fill-up.
E1-49
Enclosure 1 to FPL Letter L-2017-149
Updated Final Response to NRC Generic Letter 2004-02
Figure 3.e.1-1: Generic Debris Transport Logic Tree
E1-50
Enclosure 1 to FPL Letter L-2017-149
Updated Final Response to NRC Generic Letter 2004-02
The basic methodology for the PTN3 and PTN4 transport analysis is summarized below.
1. The CAD model was provided as input to determine break locations and sizes. 2. The debris generation calculation was provided as input into the calculation for
debris types and sizes. 3. Potential upstream blockage points were qualitatively addressed. 4. The fraction of debris blown into upper containment and lower containment for
each compartment was determined based on the volumes of upper and lower containment.
5. The fraction of debris washed down by containment spray flow was determined along with the locations where the debris would be washed down.
6. The quantity of debris transported to inactive areas or directly to the sump strainers was calculated based on the volume of the inactive and sump cavities proportional to the water volume at the time these cavities are filled.
7. The location of each type/size of debris at the beginning of recirculation was determined based on the break location.
8. A computational fluid dynamics (CFD) model was developed to simulate the flow patterns that would develop during recirculation.
9. A graphical determination of the transport fraction of each type of debris was made using the velocity and TKE profiles from the CFD model output, along with the determined initial distribution of debris.
10. The initial recirculation transport fractions from the CFD analysis were gathered to determine the final recirculation transport fractions for input into the logic trees.
11. The quantity of debris that could experience erosion due to the break flow or spray flow was determined.
12. The overall transport fraction for each type/size of debris was determined by combining each of the previous steps into logic trees.
Potential Upstream Blockage Points
Potential upstream blockage points were qualitatively addressed in the debris transport calculation. It was determined that there are not any upstream blockage points in the PTN3 and PTN4 containment buildings. Upstream effects are discussed in the Response to 3.l.
CFD Model of Containment Recirculation Pool
A diagram showing the significant parts of the CFD model is shown in Figure 3.e.1-2 for PTN3, and Figure 3.e.1-3 for PTN4. The strainer module mass sinks and the various direct and runoff spray regions are highlighted.
E1-51
Enclosure 1 to FPL Letter L-2017-149
Updated Final Response to NRC Generic Letter 2004-02
Figure 3.e.1-2: PTN3 Significant Features in CFD Model
Figure 3.e.1-3: PTN4 Significant Features in CFD Model
E1-52
Enclosure 1 to FPL Letter L-2017-149
Updated Final Response to NRC Generic Letter 2004-02
The key CFD modeling attributes/considerations included the following:
Computational Mesh
A rectangular mesh was defined in the CFD model that was fine enough to resolve important features, but not so fine that the simulation would take excessively long to run. A 6-inch cell length was chosen as the largest cell size that could reasonably resolve the concrete and steel structures that compose the containment floor. For the cells right above the containment floor, the mesh was set to 3 inches tall in order to closely resolve the vicinity (area right above the floor where tumbling velocities are analyzed) of settled debris. The total cell count in the model was 1,193,696 for both PTN3 and PTN4.
Modeling of Containment Spray Flows
Various plan and section drawings, as well as the containment building CAD model, were considered when determining the spray flow path to the pool. Spray water would drain to the pool through many pathways. Some of these pathways include the steam generator compartments through the open area above the steam generators, through the annulus via the various sections of grating, and through the RFC drains. The sprays were defined as regions and populated with discrete mass source particles. The appropriate flow rate and velocity was set for the sprays in each region.
Modeling of Break Flow
The water falling from the postulated break would introduce momentum into the containment pool that influences the flow dynamics. This break stream momentum was accounted for by introducing the break flow to the pool at the velocity a freefalling object would have if it fell the vertical distance from the location of the break to the surface of the pool.
Modeling of the Sump Strainers
Each of the sump strainers were modeled as having flow across their surfaces. A negative flow rate was set for the strainer modules, which tells the CFD model to draw the specified amount of water from the pool over the entire exposed surface area of the mass sink obstacle.
E1-53
Enclosure 1 to FPL Letter L-2017-149
Updated Final Response to NRC Generic Letter 2004-02
Turbulence Modeling
Several different turbulence-modeling approaches can be selected for a Flow-3D calculation. The approaches (ranging from least to most sophisticated) are:
• Prandtl mixing length • Turbulent energy model • Two-equation k-ε model • Renormalized group theory (RNG) model • Large eddy simulation model
The RNG turbulence model was determined to be the most appropriate for this CFD analysis. The RNG model has a large spectrum of length scales that would likely exist in a containment pool during emergency recirculation. The RNG approach applies statistical methods in a derivation of the averaged equations for turbulence quantities (such as TKE and its dissipation rate). RNG-based turbulence schemes rely less on empirical constants while setting a framework for the derivation of a range of models at different scales.
Steady-State Metrics
The CFD model was started from a stagnant state at a defined pool depth and run long enough for steady-state conditions to develop. A plot of mean kinetic energy was used to determine when steady-state conditions were reached. Checks were also made of the velocity and turbulent energy patterns in the pool to verify that steady-state conditions were reached.
Debris Transport Metrics
The metrics for predicting debris transport during recirculation are the TKE necessary to keep debris suspended, and the flow velocity necessary to tumble sunken debris along the floor or lift it over a curb. Debris transport metrics have been derived or adopted from data. The metrics utilized in the PTN3 and PTN4 transport analyses originate from the sources below.
• NUREG/CR-6772 Tables 3.1, 3.5, and C.19(a) (Reference 14, pp. 16, 22, and C-16)
• NUREG/CR-6808 Figure 5.2, Table 5-1 and Table 5-3 (Reference 15, pp. 5-14, 5-22, and 5-33)
E1-54
Enclosure 1 to FPL Letter L-2017-149
Updated Final Response to NRC Generic Letter 2004-02
Graphical Determination of Debris Transport Fractions for Recirculation
The following steps were taken to determine what percentage of a particular type of debris could be expected to transport through the containment pool to the emergency sump screens. Detailed explanations of each bullet are provided in the paragraphs below.
• Colored contour velocity and TKE maps were generated from the Flow-3D results in the form of bitmap files indicating regions of the pool through which a particular type of debris could be expected to transport.
• The bitmap images were overlaid on the initial debris distribution plots and imported into CAD with the appropriate scaling factor to convert the length scale of the color maps to ft.
• Closed polylines were drawn around the contiguous areas where velocity and TKE were high enough that debris could be carried in suspension or tumbled along the floor to the sump strainers for uniformly distributed debris.
• The areas within the closed polylines were determined using an CAD querying feature.
• The combined area within the polylines was compared to the initial debris distribution area.
• The percentage of a particular debris type that would transport to the sump strainers was determined based on the above comparison.
Plots showing the TKE and the velocity magnitude in the pool were generated for each case to determine areas where specific types of debris would be transported. The limits on the plots were set according to the minimum TKE or velocity metrics necessary to move each type of debris. The overlying yellow areas represent regions where the debris would be suspended, and the red areas represent regions where the debris would be tumbled along the floor (see Figure 3.e.1-6 and Figure 3.e.1-8). The yellow TKE portion of the plots is a three-dimensional representation of the TKE. Since the TKE is a three-dimensional representation, the plots do not show the TKE at any specific elevation. Rather, any debris that is shown to be present in this yellow area will transport, regardless of the elevation of TKE in the pool. The velocity portion of the plots represents the velocity magnitude just above the floor level (1.5 inches), where tumbling of sunken debris could occur. Directional flow vectors were also included in the plots to determine whether debris in certain areas would be transported to the sump strainers or transported to less active regions of the pool where it could settle to the floor (blue regions).
The following figures and discussion are presented as an example of how the transport analysis was performed for a generic small debris type. This same approach was used for other debris types analyzed at PTN3 and PTN4.
E1-55
Enclosure 1 to FPL Letter L-2017-149
Updated Final Response to NRC Generic Letter 2004-02
As shown in Figure 3.e.1-4 (PTN3) and Figure 3.e.1-5 (PTN4), the small debris (depicted by green shading) was initially assumed to be distributed in the vicinity of the break location at the beginning of recirculation.
Figure 3.e.1-4: PTN3 Distribution of Small Debris in Lower Containment
E1-56
Enclosure 1 to FPL Letter L-2017-149
Updated Final Response to NRC Generic Letter 2004-02
Figure 3.e.1-5: PTN4 Distribution of Small Debris in Lower Containment
For PTN3, Figure 3.e.1-6 shows that the turbulence (yellow regions) and the velocity (red regions) in the pool (blue regions) are high enough to transport the generic small debris present in the pool due to the break flow to the sump strainers during recirculation. The initial distribution area (Figure 3.e.1-4) was overlaid on top of the plot showing tumbling velocity, TKE, and flow vectors (Figure 3.e.1-6) to determine the recirculation transport fraction, represented by the hatched portion (Figure 3.e.1-7).
E1-57
Enclosure 1 to FPL Letter L-2017-149
Updated Final Response to NRC Generic Letter 2004-02
Figure 3.e.1-6: PTN3 TKE and Velocity with Limits Set at Suspension/
Tumbling of Small Generic Debris
E1-58
Enclosure 1 to FPL Letter L-2017-149
Updated Final Response to NRC Generic Letter 2004-02
Figure 3.e.1-7: PTN3 Floor Area where Small Generic Debris Would Transport to
the Sump Strainers (Hatched Area)
The same methodology was applied for PTN4. Figure 3.e.1-8 shows that the turbulence (yellow regions) and the velocity (red regions) in the pool (blue regions) are high enough to transport the generic small debris present in the pool due to the break flow to the sump strainers during recirculation. The initial distribution area (Figure 3.e.1-5) was overlaid on top of the plot showing tumbling velocity, TKE, and flow vectors (Figure 3.e.1-8) to determine the recirculation transport fraction, represented by the hatched portion (Figure 3.e.1-9).
E1-59
Enclosure 1 to FPL Letter L-2017-149
Updated Final Response to NRC Generic Letter 2004-02
Figure 3.e.1-8: PTN4 TKE and Velocity with Limits Set at Suspension/
Tumbling of Small Generic Debris
E1-60
Enclosure 1 to FPL Letter L-2017-149
Updated Final Response to NRC Generic Letter 2004-02
Figure 3.e.1-9: PTN4 Floor Area where Small Generic Debris Would Transport to
the Sump Strainers (Hatched Area)
This same analysis was applied for each type of debris at PTN3 and PTN4. Recirculation pool transport fractions were identified for each debris type associated with the location of its initial distribution. This includes a recirculation transport fraction for debris blown to lower containment, debris washed down inside the secondary shield wall, and debris washed down through the annulus.
E1-61
Enclosure 1 to FPL Letter L-2017-149
Updated Final Response to NRC Generic Letter 2004-02
Erosion Discussion
Due to the turbulence in the recirculation pool and the force of break and spray flow, Nukon, Temp-Mat, ceramic fiber (PTN3 only), and Cal-Sil debris may erode into smaller pieces, making transport of this debris to the strainer more likely. To estimate erosion in the recirculation pool at PTN, generic 30-day erosion testing was performed. Based on a validation that the test results apply to PTN3 and PTN4 (ensuring that flow rates and turbulence values are similar to what is expected in the PTN recirculation pools), an erosion fraction of 10% was used for the small and large pieces of fiberglass debris in the pool. An erosion fraction of 17% was assumed for the small chunks of Cal-Sil in the pool. This fraction was applied to both transportable debris and sediment debris present in the pool to maximize the amount of erosion. For pieces of debris held up on grating above the pool, an erosion fraction of 1% was used for fiberglass debris, and 17% for Cal-Sil debris.
2. Provide the technical basis for assumptions and methods used in the analysis that deviate from the approved guidance.
Response to 3.e.2:
The methodology used in the transport analysis was based on and does not deviate from the NRC approved NEI 04-07 guidance (Reference 10 pp. 3-42 - 3-54, 4-14 - 4-34) and the associated NRC SE (Reference 6 pp. 55-61, 98-101) for refined analyses, as well as the refined methodologies suggested by the SE in Appendices III, IV, and VI VI (Reference 6 pp. III-1 - III-73, IV-1 - IV-6, VI-1 - VI-71).
3. Identify any computational fluid dynamics codes used to compute debris transport fractions during recirculation and summarize the methodology, modeling assumptions, and results.
Response to 3.e.3:
To assist in the determination of recirculation transport fractions, several CFD simulations were performed using Flow-3D, a commercially available software package.
For each unit, two break cases form the basis for the debris transport analyses to determine the recirculation transport fractions – a Loop A break and a Loop C break. Cases were chosen to represent and bound the different LOCA scenarios that could occur at PTN3 and PTN4. All cases were run with maximum ECCS flow rates (total RHR and CS flow rate of 5,898 gpm) and with the minimum water level (17.24 ft). Using the maximum flow rates and minimum water level maximize the turbulence and velocity in the pool.
E1-62
Enclosure 1 to FPL Letter L-2017-149
Updated Final Response to NRC Generic Letter 2004-02
In general, a break close to the sump strainer tends to transport a larger fraction of small and large debris than a break farther from the sump. The simulation results include a series of contour plots of velocity and TKE. These results have been combined with settling and tumbling velocities from the GSI-191 literature to determine the recirculation transport fractions for all debris types present in the PTN3 and PTN4 containment buildings. See the Response to 3.e.1 for additional discussion of the CFD methodology.
4. Provide a summary of, and supporting basis for, any credit taken for debris interceptors.
Response to 3.e.4:
Debris interceptors are not installed at PTN3. See the Response to 3.j.1.
At PTN4, the debris interceptors were assumed to be completely blocked during the simulation in the CFD model, which forces the water to travel over the interceptor during recirculation. The transport analysis does not credit the capture of debris because the debris may be able to transport up and over the interceptors.
5. State whether fine debris was assumed to settle and provide basis for any settling credited.
Response to 3.e.5:
No credit was taken for settling of fine debris.
6. Provide the calculated debris transport fractions and the total quantities of each type of debris transported to the strainers.
Response to 3.e.6:
The following debris transport fractions are shown for blowdown, washdown, pool fill, and recirculation. Note that these fractions result in the bounding quantity of debris transported to the strainer. Cells with a “-“ in the tables of this subsection represent values that are not applicable (i.e., debris type not generated for a specific location, debris type not available for washdown/pool-fill, etc.).
E1-63
Enclosure 1 to FPL Letter L-2017-149
Updated Final Response to NRC Generic Letter 2004-02
Blowdown Transport Table 3.e.6-1 and Table 3.e.6-2 show the bounding blowdown transport fractions (the minimum amount of debris remaining in the compartment) as a function of break location and debris type. Note that only the limiting break locations with respect to the maximum overall debris transport fractions are listed in these tables.
Table 3.e.6-1: PTN3 Blowdown Transport Fractions Break
Location Debris Type Transport Fraction
To Upper Containment (UC)
To Lower Containment (LC)
Remaining in Compartment
Steam Generator (SG) Compartments
Fines (all) 79% 21% 0% Small Fiberglass 74% 21% 5% Large Fiberglass 50% 15% 35% Intact Fiberglass Blankets 0% 0% 100% Small RMI 79% 21% 0% Large RMI 50% 20% 30% Small Cal-Sil 79% 21% 0% Qualified Coatings 79% 21% 0% Unqualified Coatings - - - Latent Debris - - -
Reactor Cavity
Fines (all) 79% 21% 0% Small Fiberglass - - - Large Fiberglass - - - Intact Fiberglass Blankets - - - Small RMI not in Cavity 79% 21% 0% Small RMI in Cavity 25% 25% 50% Large RMI not in Cavity 50% 20% 30% Large RMI in Cavity 0% 0% 100% Small Cal-Sil not in Cavity 79% 21% 0% Small Cal-Sil in Cavity 25% 25% 50% Qualified Coatings 79% 21% 0% Unqualified Coatings - - - Latent Debris - - -
Pressurizer Compartment
Fines (all) 79% 21% 0% Small Fiberglass 100% 0% 0% Large Fiberglass 100% 0% 0% Intact Fiberglass Blankets 0% 0% 100% Small RMI 100% 0% 0% Large RMI 100% 0% 0% Small Cal-Sil 100% 0% 0% Qualified Coatings 79% 21% 0% Unqualified Coatings - - - Latent Debris - - -
Table 3.e.6-2: PTN4 Blowdown Transport Fractions
Break Debris Type Transport Fraction
E1-64
Enclosure 1 to FPL Letter L-2017-149
Updated Final Response to NRC Generic Letter 2004-02
Location To Upper Containment
(UC)
To Lower Containment
(LC) Remaining in Compartment
Steam Generator (SG) Compartments
Fines (all) 79% 21% 0% Small Fiberglass 74% 21% 5% Large Fiberglass 50% 15% 35% Intact Fiberglass Blankets 0% 0% 100% Small RMI 79% 21% 0% Large RMI 50% 20% 30% Small Cal-Sil 79% 21% 0% Qualified Coatings 79% 21% 0% Unqualified Coatings - - - Latent Debris - - -
Reactor Cavity
Fines (all) 79% 21% 0% Small Fiberglass 74% 21% 5% Large Fiberglass 50% 15% 35% Intact Fiberglass Blankets 0% 0% 100% Small RMI not in Cavity 79% 21% 0% Small RMI in Cavity 25% 25% 50% Large RMI not in Cavity 50% 20% 30% Large RMI in Cavity 0% 0% 100% Small Cal-Sil not in Cavity 79% 21% 0% Small Cal-Sil in Cavity 25% 25% 50% Qualified Coatings 79% 21% 0% Unqualified Coatings - - - Latent Debris - - -
Pressurizer Compartment
Fines (all) 79% 21% 0% Small Fiberglass - - - Large Fiberglass - - - Intact Fiberglass Blankets - - - Small RMI 100% 0% 0% Large RMI 100% 0% 0% Small Cal-Sil 100% 0% 0% Qualified Coatings 79% 21% 0% Unqualified Coatings - - - Latent Debris - - -
E1-65
Enclosure 1 to FPL Letter L-2017-149
Updated Final Response to NRC Generic Letter 2004-02
Washdown Transport
Table 3.e.6-3 shows the bounding washdown transport fractions (maximum amount of debris washed to lower containment) for each debris type. Note that these transport fractions do not depend on the location of the break.
Table 3.e.6-3: PTN3 and PTN4 Washdown Transport Fractions
Debris Type Transport Fraction
Washed Down in Annulus
Washed Down Inside SSW
Washed Down RFC Drains
Fines (all) 79% 8% 13% Small Fiberglass 57% 8% 13% Large Fiberglass 0% 8% 13% Intact Fiberglass Blankets - - - Small RMI 79% 8% 13% Large RMI 0% 8% 13% Small Cal-Sil 79% 8% 13% Qualified Coatings 79% 8% 13% Unqualified Coatings - - - Latent Debris - - -
E1-66
Enclosure 1 to FPL Letter L-2017-149
Updated Final Response to NRC Generic Letter 2004-02
Pool-Fill Transport The equation used to determine the portion of debris washed to the inactive cavity during pool fill is based on the following equation:
Where: Xpool-fill = Amount of debris transported to cavity during pool fill Vcavity = Reactor cavity volume Vpool = Pool volume The only cavity below the floor elevation at PTN3 and PTN4 is the reactor cavity. The cavity was treated as if it were surrounded by a 6-inch curb. The volume of the reactor cavity was calculated to be 9,454 ft3 for PTN3 and PTN4, and the volume of the pool at 6-inches was calculated to be 3,824 ft3 for PTN3 and 3,993 ft3 for PTN4. Inserting these values into the equation above yields a pool fill-up transport of 92% for PTN3 and 91% for PTN4. This value is limited to 15% transport to the inactive cavity (reactor cavity) by Section 3.6.3 of the NRC SE (Reference 6 pp. 79-80).
Table 3.e.6-4 shows the bounding (minimum) pool fill transport fractions as a function of debris type.
Table 3.e.6-4: PTN3 and PTN4 Pool fill Transport Fractions
Debris Type Pool Fill Transport Fraction Directly to Strainer Inactive Cavity
Fines (all) 0% 15% Small Fiberglass 0% 15% Large Fiberglass 0% 15% Intact Fiberglass Blankets - - Small Temp-Mat/Ceramic Fiber 0% 0% Large Temp-Mat/Ceramic Fiber 0% 0% Intact Temp-Mat/Ceramic Fiber - - Small RMI 0% 15% Large RMI 0% 15% Small Cal-Sil 0% 15% Qualified Coatings 0% 15% Unqualified Coatings - - Latent Debris 0% 15%
E1-67
Enclosure 1 to FPL Letter L-2017-149
Updated Final Response to NRC Generic Letter 2004-02
Recirculation Transport
For the recirculation transport fractions, two different break cases form the basis for each transport analysis, and were evaluated for PTN3 and PTN4. Note that the recirculation transport fractions are presented separately for each unit. This is because the location of the strainers and the presence of debris interceptors are different between the two units. These cases are listed below for both PTN3 and PTN4:
• Case 1: LBLOCA in SG Compartment Loop A, One Train Operational • Case 2: LBLOCA in SG Compartment Loop C, One Train Operational
It was assumed that for any breaks that could occur in the reactor cavity or in the pressurizer compartment, the recirculation transport fractions for a break inside the secondary shield wall (Loop A or Loop C for a reactor cavity break, and Loop A for a pressurizer break) could be applied.
The bounding (maximum) recirculation transport fractions for fibrous debris as a function of evaluation case are shown in Table 3.e.6-5 and Table 3.e.6-6.
E1-68
Enclosure 1 to FPL Letter L-2017-149
Updated Final Response to NRC Generic Letter 2004-02
Table 3.e.6-5: PTN3 Recirculation Transport Fractions for Fibrous Debris
Case Debris Size Debris in
Lower Containment
Washed Inside Secondary Shield Wall
Washed In
Annulus
Washed Down RFC
Case 1
Fines 100% 100% 100% 100% Small 33% 29% 49% 0% Large 0% 0% - 0%
Intact Blankets - - - -
Case 2
Fines 100% 100% 100% 100% Small 37% 45% 49% 0% Large 0% 0% - 0%
Intact Blankets - - - -
Table 3.e.6-6: PTN4 Recirculation Transport Fractions for Fibrous Debris
Case Debris Size Debris in
Lower Containment
Washed Inside Secondary Shield Wall
Washed In
Annulus
Washed Down RFC
Case 1
Fines 100% 100% 100% 100% Small 53% 45% 42% 0% Large 0% 0% - 0%
Intact Blankets - - - -
Case 2
Fines 100% 100% 100% 100% Small 39% 38% 41% 0% Large 0% 0% - 0%
Intact Blankets - - - -
E1-69
Enclosure 1 to FPL Letter L-2017-149
Updated Final Response to NRC Generic Letter 2004-02
The bounding (maximum) recirculation transport fractions for Temp-Mat debris as a function of evaluation case are shown in Table 3.e.6-7. It was assumed that Temp-Mat debris would float in the recirculation pool until it is transported to the vicinity of the strainers, which results in a recirculation transport fraction of 100%.
Table 3.e.6-7: PTN3 and PTN4 Recirculation Transport Fractions for Temp-Mat/ Kaowool (Fines Only) Debris
Case Debris Size Debris in
Lower Containment
Washed Inside Secondary Shield Wall
Washed In
Annulus
Washed Down RFC
Case 1
Fines 100% 100% 100% 100% Small 100% 100% 100% 100% Large 100% 100% - 100%
Intact Blankets - - - -
Case 2
Fines 100% 100% 100% 100% Small 100% 100% 100% 100% Large 100% 100% - 100%
Intact Blankets - - - -
The bounding recirculation transport fractions for RMI debris as a function of evaluation case are shown in Table 3.e.6-8 and Table 3.e.6-9.
Table 3.e.6-8: PTN3 Recirculation Transport Fractions for RMI Debris
Case Debris Size Debris in
Lower Containment
Washed Inside Secondary Shield Wall
Washed In
Annulus
Washed Down RFC
Case 1 Small 0% 0% 4% 0% Large 0% 0% - 0%
Case 2 Small 0% 0% 4% 0% Large 0% 0% - 0%
Table 3.e.6-9: PTN4 Recirculation Transport Fractions for RMI Debris
Case Debris Size Debris in
Lower Containment
Washed Inside Secondary Shield Wall
Washed In
Annulus
Washed Down RFC
Case 1 Small 0% 0% 13% 0% Large 0% 0% - 0%
Case 2 Small 0% 0% 12% 0% Large 0% 0% - 0%
The bounding (maximum) recirculation transport fractions for Cal-Sil debris as a function of evaluation case are shown in Table 3.e.6-10 and Table 3.e.6-11.
E1-70
Enclosure 1 to FPL Letter L-2017-149
Updated Final Response to NRC Generic Letter 2004-02
Table 3.e.6-10: PTN3 Recirculation Transport Fractions for Cal-Sil Debris
Case Debris Size Debris in
Lower Containment
Washed Inside Secondary Shield Wall
Washed In
Annulus
Washed Down RFC
Case 1 Particulate 100% 100% 100% 100% Small 0% 0% 5% 0%
Case 2 Particulate 100% 100% 100% 100% Small 1% 0% 8% 0%
Table 3.e.6-11: PTN4 Recirculation Transport Fractions for Cal-Sil Debris
Case Debris Size Debris in
Lower Containment
Washed Inside Secondary Shield Wall
Washed In
Annulus
Washed Down RFC
Case 1 Particulate 100% 100% 100% 100% Small 0% 0% 14% 0%
Case 2 Particulate 100% 100% 100% 100% Small 0% 0% 13% 0%
The bounding (maximum) recirculation transport fractions for qualified coatings, unqualified coatings, and latent debris as a function of evaluation case are shown in Table 3.e.6-12.
Table 3.e.6-12: PTN3 and PTN4 Recirculation Transport Fractions for Qualified Coatings, Unqualified Coatings, Latent Debris
Case Debris Size Debris in
Lower Containment
Washed Inside Secondary Shield Wall
Washed In
Annulus
Washed Down RFC
Case 1 Fine/Particulate 100% 100% 100% 100% Case 2 Fine/Particulate 100% 100% 100% 100%
Overall Debris Transport
Transport logic trees were developed for each size and type of debris generated. These trees were used to determine the total fraction of debris that would reach the sump strainers in each of the postulated cases. The bounding overall transport fractions are presented in Table 3.e.6 13 through Table 3.e.6 18.
E1-71
Enclosure 1 to FPL Letter L-2017-149
Updated Final Response to NRC Generic Letter 2004-02
Table 3.e.6-13: PTN3 Overall Transport Fractions for Breaks in the SG Compartment
Debris Type Debris Size Loop A Loop C
Nukon
Fines - - Small Pieces
Erosion Fines - - Small Pieces - -
Large Pieces
Erosion Fines - - Large Pieces - -
Intact Blankets - -
Temp-Mat
Fines 97% - Small Pieces
Erosion Fines 8% - Small Pieces 69% -
Large Pieces
Erosion Fines 3% - Large Pieces 24% -
Intact Blankets 0% -
Ceramic Fiber
Fines - - Small Pieces
Erosion Fines - - Small Pieces - -
Large Pieces
Erosion Fines - - Large Pieces - -
Intact Blankets - - Kaowool Fines - -
Mirror RMI Fines (<4” a side) 3% 3% Large Pieces 0% 0%
Transco RMI Fines (<4” a side) 3% 3% Large Pieces 0% 0%
The transported debris quantities were calculated for the most limiting break cases identified in the Response to 3.b.4. Overall debris transport fractions were taken from
E1-77
Enclosure 1 to FPL Letter L-2017-149
Updated Final Response to NRC Generic Letter 2004-02
Table 3.e.6-13 for PTN3 (Loop A) and Table 3.e.6-16 for PTN4 (Loop A), and applied to the debris generated values from Table 3.b.4-1 and Table 3.b.4-2 for PTN3 and Table 3.b.4-3 and Table 3.b.4-4 for PTN4. Note that the overall transport values developed for a DEGB are bounding for all other breaks (including partial breaks) because the flow rates and water level used for the transport analysis are bounding (maximum flow rates and minimum water levels). Table 3.e.6-19 shows the quantities of debris transported for the PTN3 worst-case Cal-Sil and fiber breaks, respectively. Note that the transported amount of fine debris includes the quantity of fines plus the fines generated due to erosion of small and large pieces.
E1-78
Enclosure 1 to FPL Letter L-2017-149
Updated Final Response to NRC Generic Letter 2004-02
Fine 1.25 1.25 Small 1.04 1.04 Large 0.00 0.00 Intact 0.00 0.00
Kaowool (lb) Fine 198.96 198.96
Cal-Sil (lb) Fine 0.00 0.00
Small 0.00 0.00 Intact 0.00 0.00
Mirror and Transco RMI (ft2)
Small (<4”) <1 1.62
Large (≥ 4”) <1 0
Carboguard 890N Fine 2.55
lbm 0.02 ft3
5.19 lbm
0.05 ft3
Table 3.e.6-21 and Table 3.e.6-22 show the quantities of debris transported for the PTN4 worst-case Cal-Sil and fiber breaks, respectively. Note that the transported amount of fine debris includes the quantity of fines plus the fines generated due to erosion of small and large pieces.
E1-80
Enclosure 1 to FPL Letter L-2017-149
Updated Final Response to NRC Generic Letter 2004-02
Table 3.e.6-21: PTN4 Transported Quantities for Worst-Case Cal-Sil Breaks
Break Location 31-RCS-1401-10
31-RCS-1401-7
29-RCS-1404-3
29-RCS-1404-3
Location Description Loop A
Crossover Leg at RCP
Loop A Crossover Leg
at RCP
Loop A Hot Leg at Elbow
Loop A Hot Leg at Elbow
Break Size 31” 31” 23" 23"
Break Type DEGB DEGB Partial (Angle – 225°)
Partial (Angle – 180°)
Nukon (lb)
Fine 129.54 152.51 7.58 2.30 Small 82.87 106.10 4.92 1.04 Large 0.00 0.00 0.00 0.00 Intact 0.00 0.00 0.00 0.00
Temp-Mat (lb)
Fine 133.95 198.92 7.26 5.48 Small 94.43 223.58 4.91 3.63 Large 49.56 17.88 2.82 2.18 Intact 0.00 0.00 0.00 0.00
Cal-Sil (lb) Fine 869.47 856.35 369.49 354.97 Small 38.32 39.54 17.05 15.32 Intact 0.00 0.00 0.00 0.00
Mirror and Transco RMI (ft2)
Small (<4”) 562.40 494.32 416.64 298.32
Large (≥ 4”) 0.00 0.00 0.00 0.00 Carboguard 890N Fine 87.04
lbm 0.80 ft3
123.53 lbm
1.13 ft3
18.14 lbm
0.16 ft3
23.03 lbm
0.21 ft3
E1-81
Enclosure 1 to FPL Letter L-2017-149
Updated Final Response to NRC Generic Letter 2004-02
Table 3.e.6-22: PTN4 Transported Quantities for Worst-Case Fiber Breaks
Break Location 29-RCS-1405-3
31-RCS-1402-5
29-RCS-1408-3
29-RCS-1404-3
Location Description Loop B Hot Leg at Elbow
Loop B Crossover Leg at SG Nozzle
Loop C Hot Leg at Elbow
Loop A Hot Leg at Elbow
Break Size 29” 31” 23" 23"
Break Type DEGB DEGB Partial (Angle – 0°)
Partial (Angle – 0°)
Nukon (lb)
Fine 184.17 207.17 124.22 123.53 Small 134.48 158.90 77.07 86.11 Large 0.00 0.00 0.00 0.00 Intact 0.00 0.00 0.00 0.00
Temp-Mat (lb)
Fine 196.88 211.69 130.80 137.28 Small 222.68 260.24 146.96 155.50 Large 16.76 4.12 11.79 11.53 Intact 0.00 0.00 0.00 0.00
Cal-Sil (lb) Fine 504.08 518.96 7.84 9.12 Small 23.71 22.64 0.28 0.35 Intact 0.00 0.00 0.00 0.00
Mirror and Transco RMI (ft2)
Small (<4”) 614.96 614.96 28.64 29.04
Large (≥ 4”) 0.00 0.00 0.00 0.00 Carboguard 890N Fine 42.31
lbm 0.39 ft3
67.10 lbm
0.61 ft3
8.54 lbm
0.08 ft3
9.60 lbm
0.09 ft3
The quantity of latent debris that transports to the strainers for all breaks in both units is 144.5 lbm latent particulate and 25.5 lbm (10.625 ft3) latent fiber.
E1-82
Enclosure 1 to FPL Letter L-2017-149
Updated Final Response to NRC Generic Letter 2004-02
3.f. Head Loss and Vortexing
The objectives of the head loss and vortexing evaluations are to calculate head loss across the sump strainer and to evaluate the susceptibility of the strainer to vortex formation. 1. Provide a schematic diagram of the emergency core cooling system (ECCS) and
containment spray systems (CSS).
Response to 3.f.1:
A schematic diagram of the PTN3 ECCS and CSS is provided in Figure 3.f.1-1. This schematic diagram is also representative of PTN4.
E1-83
Enclosure 1 to FPL Letter L-2017-149
Updated Final Response to NRC Generic Letter 2004-02
Figure 3.f.1-1: PTN3 ECCS/ CSS Piping Schematic
E1-84
Enclosure 1 to FPL Letter L-2017-149
Updated Final Response to NRC Generic Letter 2004-02
2. Provide the minimum submergence of the strainer under small-break loss-of-coolant accident (SBLOCA) and large-break loss-of-coolant (LBLOCA) conditions.
Response to 3.f.2:
PTN3 and PTN4 Response
The minimum strainer submergence for PTN3 and PTN4 are provided in Table 3.f.2-1 and Table 3.f.2-2. See the Response to 3.g.1 for additional information on the minimum strainer submergence for PTN3 and PTN4 due to an SBLOCA and LBLOCA.
Table 3.f.2-1: PTN3 Minimum Strainer Submergence for SBLOCA and LBLOCA
Break Size
Break Elevation
Strainer Submergence
(ft) SBLOCA At top of pressurizer 0.24
SBLOCA Elevation of the
centerline of the hot legs
0.29
LBLOCA At top of pressurizer 0.40
LBLOCA Elevation of the
centerline of the hot legs
1.26
Table 3.f.2-2: PTN4 Minimum Strainer Submergence for SBLOCA and LBLOCA
Break Size
Break Elevation
Strainer Submergence
(ft) SBLOCA At top of pressurizer 0.17
SBLOCA Elevation of the
centerline of the hot legs
0.21
LBLOCA At top of pressurizer 0.32
LBLOCA Elevation of the
centerline of the hot legs
1.17
E1-85
Enclosure 1 to FPL Letter L-2017-149
Updated Final Response to NRC Generic Letter 2004-02
3. Provide a summary of the methodology, assumptions, and results of the vortexing evaluation. Provide bases for key assumptions.
Response to 3.f.3:
PTN3 Response:
The maximum flow rate from one RHR pump is 3,446 gpm, supplying flow to two HHSI pumps and one CS pump in a “piggy-back” mode. This flow rate corresponds to an average approach velocity of 0.00171 ft/s for a total net strainer surface area of 4,499 ft2. As shown in the Response to 3.f.2, the minimum water level results in a strainer submergence of 0.24 ft (or 2.88”) for an SBLOCA and 0.40 ft (or 4.80”) for an LBLOCA at the start of recirculation for breaks at the top of the pressurizer. An LBLOCA at the hot leg centerline elevation results in a submergence of 1.26 ft (or 15.12”) at the start of recirculation. Vortexing observations from the PSL1 head loss test were used to evaluate vortexing for PTN3. See the Response to 3.f.4 for additional discussion on the PSL1 test strainer.
For PSL1, a clean strainer vortex test was performed prior to addition of conventional and chemical debris to the test tank. The strainer was submerged 1 inch and the test flow rate was increased from 400 gpm (average approach velocity of 0.00247 ft/s) to 1,000 gpm (average approach velocity of 0.00618 ft/s) in approximately 200 gpm increments, and vortexing was not observed under these conditions.
Under clean strainer conditions for both the PSL1 test strainer and PTN3 plant strainer, flow is unevenly distributed along the length of a strainer disk. The local flow rate and approach velocity is greatest closest to the plenum, and the arrangement of the suction plenum of the PSL1 test strainer and the PTN3 plant strainer is different. The PSL1 test strainer’s disks are mounted on top of the suction plenum, and flow passes from the bottom edge of the disk into the plenum. For PTN3 the suction plenum is oriented vertically and on the side edge of the strainer disk, and flow passes from the side edge of the disk into the plenum. Because of the plenum’s vertical orientation, the disk-to-plenum interface has less submergence than the disk-to-plenum interface of the PSL1 test strainer. However, vortexing is not expected to occur because the PSL1 clean strainer vortexing test submergence was less than the PTN3 SBLOCA minimum submergence, and the average approach velocity was approximately a factor of 3.6 times greater than the average approach velocity of the PTN3 strainer for clean strainer conditions. As stated previously, no vortexing was observed even with these conservatisms.
E1-86
Enclosure 1 to FPL Letter L-2017-149
Updated Final Response to NRC Generic Letter 2004-02
Under debris laden conditions, vortexing is not expected to occur because the minimum water levels above were calculated at the start of sump recirculation when the strainer is mostly clear of debris for breaks above the pressurizer. The breaks above the pressurizer would be at the minimum strainer submergence only momentarily while the pool continues to rise due to CS injection from the RWST. For the PSL1 Thin-Bed Test, while chemical debris batches were introduced to the test tank during testing, the water level in the test tank was regularly reduced to a strainer submergence of 6.5”. Vortexing was not observed at any time during the test. The nominal flow rate during head loss testing was 417 gpm, corresponding to an approach velocity of 0.00258 ft/s, which is about 1.5 times greater than the PTN3 average approach velocity for debris laden conditions.
PTN4 Response: PTN4 Region I: The maximum recirculation flow rate of one RHR pump is 3,446 gpm, supplying flow to two HHSI pumps and one CS pump in a “piggy-back” mode. This flow rate corresponds to an average approach velocity of 0.00225 ft/s for a total net strainer surface area of 3,413.9 ft2. As shown in the Response to 3.f.2, for breaks at the top of the pressurizer, the minimum water level results in a strainer submergence of 0.17 ft (or 2.04”) for an SBLOCA and 0.32 ft (or 3.84”) for an LBLOCA at start of recirculation. For breaks at the hot leg centerline elevation, the minimum strainer submergence is 0.21 ft (or 2.52”) for an SBLOCA and 1.17 ft (or 14.04”) for an LBLOCA at the start of recirculation. Vortex testing was incorporated into the head loss test program (see the Response to 3.f.4) and was performed on a strainer module prototypical of the PTN4 strainer design. A clean strainer vortex test was performed prior to debris additions. No vortexing was observed at a strainer submergence of 2” and a strainer approach velocity of 0.00228 ft/s. Debris laden vortex tests were performed during the full-load head loss test at two different debris loads. The first debris laden vortex test was performed after adding the first two batches of conventional debris which bounded the debris loads of SBLOCAs. The strainer submergence was gradually lowered to 3” and no vortices were observed. The water level was not lowered further in order to keep the debris accumulated on top of the test strainer fully submerged. Vortexing was also monitored during and after the addition of chemical precipitate debris where the total debris loads bound all 23-inch and smaller breaks (see the Response to 3.f.7). No vortices were observed for strainer submergences at or slightly less than 14”. During the debris laden vortex tests, the test strainer approach velocity was maintained at -0/+5% of 0.00228 ft/s.
E1-87
Enclosure 1 to FPL Letter L-2017-149
Updated Final Response to NRC Generic Letter 2004-02
Vortexing was not observed when the debris laden strainer’s submergence (14”) was less than the PTN4 minimum LBLOCA submergence of 14.04”. In addition, the approach velocity used during vortex testing (0.00228 ft/s) was greater than that expected for the plant strainer. Because the tested debris loads bounded all 23-inch and smaller breaks, vortexing during sump recirculation is not a concern for LBLOCAs up to 23 inches at PTN4.
Vortexing was not observed when the strainer submergence (2”) was less than the plant minimum SBLOCA submergence (2.04”) at clean conditions. Additionally, vortexing was not observed when the debris laden strainer submergence (3”) was near the minimum SBLOCA submergence (2.04” for breaks at the top of pressurizer and 2.52” for breaks at hot leg centerline elevation). These minimum water levels were calculated at the start of sump recirculation when the strainer is mostly clear of debris and the water level continues to rise due to continued CS injection. Additionally, the approach velocity used during vortex testing (0.00228 ft/s) was greater than that expected for the plant strainer. Therefore, it is reasonable to conclude that vortexing during sump recirculation is not a concern for SBLOCAs at PTN4.
In summary, vortexing is not a concern for any of the PTN4 Region I breaks (23” or smaller).
PTN4 Region II:
No vortexing occurred during the PTN4 testing at any tested debris quantity (see the Response to 3.f.4 for tested debris loads). It can be reasonably concluded that vortexing would also not occur for the Region II breaks at PTN4 as these are the largest breaks and the strainer would be at its LBLOCA submergence of 14.04”, which is bounded by the tested submergence of 14”.
4. Provide a summary of methodology, assumptions, and results of prototypical head loss testing for the strainer, including chemical effects. Provide bases for key assumptions.
Response to 3.f.4:
Head loss tests were performed to measure the head losses caused by conventional debris (fiber and particulate) and chemical precipitate debris generated and transported to the sump strainers following a LOCA. The test programs used test strainers, debris quantities, and flow rates that were prototypical or representative of the plants’ strainers. Different test cases were performed with both the thin-bed and full debris load protocols, following the 2008 NRC Staff Review Guidance (Reference 3).
E1-88
Enclosure 1 to FPL Letter L-2017-149
Updated Final Response to NRC Generic Letter 2004-02
The objective of the full debris load test protocol was to measure debris head losses associated with the fiber, particulate, and chemical debris quantities calculated to transport to the sump strainer after a LOCA. The objective of the thin-bed test protocol was to measure debris head losses associated with the maximum particulate debris quantities postulated to occur with the minimum amount of fiber on the strainer required to filter particulate out of the water.
A PSL1 head loss test is discussed in this response for PTN3. This test followed the thin-bed protocol.
Three head loss tests are discussed in this response for PTN4. Two head loss tests followed the full debris load protocol and one test followed the thin-bed protocol. In this submittal, the two full debris load protocol tests are referred to as PTN4 Full Debris Load Test 1 and PTN4 Full Debris Load Test 2, respectively. The thin-bed test is referred to as the PTN4 Thin-Bed Test.
Comparison of PSL1 Head Loss Test Configuration with PTN3 Plant Strainer
Head loss test data from the PSL1 Thin-Bed test was used to determine the head loss for the PTN3 strainer. The test setup and parameters used for the PSL1 test bound or are representative of the PTN3 plant strainer. A summary of the PSL1 head loss test parameters and the PTN3 plant strainer parameters are provided in Table 3.f.4-1.
E1-89
Enclosure 1 to FPL Letter L-2017-149
Updated Final Response to NRC Generic Letter 2004-02
Table 3.f.4-1: Comparison of PTN3 Plant and PSL1 Test Strainer Parameters
Parameter PTN3 Plant Strainer
PSL1 Test Strainer Parameter PTN3 Plant
Strainer PSL1 Test Strainer
Strainer Design GE GE Wire Cloth
Diameter 0.12 inches 0.12 inches
Disk Orientation Vertical Vertical Wire Cloth
Openings 0.38 inches 0.38 inches
Strainer Perforated Plate Hole Diameter
0.094 inches
0.0625 inches
Perforated Plate Open
Area 32% 30%
Strainer Perforated Plate Hole
Pitch
0.156 inches
0.109 inches
Center to Center Disk
Spacing
2.556 inches 3.07 inches
Strainer Perforated
Plate Thickness
0.078 inches
0.048 inches
Width of Gap
Between Disks
1.3 inches 1.874 inches
Average Approach Velocity
0.00171 ft/s 0.0026 ft/s
The PSL1 test strainer and the PTN3 plant strainer are both GE designs that use vertically aligned disks, and each disk is mounted to a plenum that combines the flow from adjacent disks. The PSL1 test strainer and the PTN3 plant strainer both use perforated plate with wire cloth as filtering surfaces. The wire cloth dimensions between the two strainers are identical. The PTN3 plant strainer perforated plate has a slightly larger hole diameter, pitch, and thickness compared to the PSL1 test strainer, but the open area of the perforated plate is similar for the two strainers.
For PSL1, the strainer disks are installed on top of the plenums while for PTN3, the disks are on one side of the plenums. This difference would not impact the debris head loss significantly because for either strainer, the disks are not flow controlled and the majority of flow enters the disks through the portion close to the disk-plenum interface.
The PSL1 head loss test was performed at an approach velocity 51% greater than the PTN3 plant strainer approach velocity, which is conservative because head loss increases as velocity increases.
The PSL1 head loss test used a keyway around the test strainer to represent the restrictive configuration of the PSL1 plant strainer. The PTN3 plant strainer is
E1-90
Enclosure 1 to FPL Letter L-2017-149
Updated Final Response to NRC Generic Letter 2004-02
located in an unconfined area (i.e., less restrictive) outside the bioshield wall. See additional discussion in the Response to 3.f.5 about why this is conservative for testing.
Comparison of PSL1 Head Loss Test and PTN3 Plant Debris Types
As shown in the Response to 3.e.6, for PTN3, fiber fines (Nukon and Kaowool), Cal-Sil, epoxy coatings and latent debris could be generated and transported to the sump strainer following a LOCA. The PSL1 Thin-Bed test used Nukon fines, pulverized Cal-Sil, pulverized acrylic as a surrogate for coatings, and Performance Contracting, Inc. (PCI) dirt/dust mix as a surrogate for latent particulate. If PTN3 had performed their unit-specific head loss testing, both Nukon and Kaowool would have been processed to fines per the NEI guidance, and the processed debris would contain primarily Class 2 fiber (Reference 16 p. B−16). Therefore, the Nukon fines used for the PSL1 testing can adequately represent the Kaowool in the PTN3 debris mix, especially considering the much larger tested Nukon fines quantity, as shown in the Response to 3.f.7. For all other PTN3 debris types (Cal-Sil, coatings, and latent particulate), either the debris itself or an acceptable surrogate was used in the PSL1 testing.
Test Setup
The test facility was designed to represent the most common module configuration at PSL1. A keyway was modeled using three acrylic boxes along the sides and the top of the test strainer module, and one obstructing suction pipe was modeled using a pipe in the test tank with the same outside diameter as that installed at PSL1.
The test strainer module had 13 strainer disks mounted on a plenum. Suction was taken from the top of the plenum to match the PSL1 strainer (Figure 3.f.4-2). The surface area of the test strainer module was 360.6 ft2.
E1-91
Enclosure 1 to FPL Letter L-2017-149
Updated Final Response to NRC Generic Letter 2004-02
The test strainer, modeled keyway, and suction pipe were installed in a test tank (see Figure 3.f.4-1 and Figure 3.f.4-2). The test tank consisted of two mixing sections, one on each side of the strainer. The “front” side of the test strainer, as designated in Figure 3.f.4-2, models the side of the PSL1 strainer that faces the PSL1 reactor vessel. The other side of the strainer is referred to as the “rear” side and models the side of the PSL1 strainer facing away from the PSL1 reactor vessel. Debris and recirculating test loop water flow, which provided mixing, was introduced both on the front side and rear side of the test strainer to represent how debris would reach a PSL1 strainer module installed inside a keyway. The test loop debris introduction and recirculation flow to the front and rear sides of the strainer was split approximately 50/50. See also the discussion on debris introduction below.
Figure 3.f.4-1: PSL1 Head Loss Test Tank and Strainer
E1-92
Enclosure 1 to FPL Letter L-2017-149
Updated Final Response to NRC Generic Letter 2004-02
Figure 3.f.4-2: PSL1 Isometric of Head Loss Test Strainer Assembly Inside Test
Tank A schematic piping diagram of the PSL1 test loop is provided in Figure 3.f.4-3. Note that the filter bag housings were used to clean the test loop before each test but were bypassed during head loss testing. The test loop had a recirculation pump that took suction from the plenum and returned the water back into the test tank. The return flow exits into the tank were located such that the turbulence from the flow did not affect the debris bed on the test strainer, but allowed for thorough mixing of debris in the water column as it was introduced into the test tank. Flow elements were used to measure the flow rate through the test loop and the flow split between the front and rear of the strainer. Flow control valves, and heating and cooling loops were used to control the test flow rate and water temperature. The test water was maintained at 120 °F ± 5 °F during conventional and chemical debris introduction.
E1-93
Enclosure 1 to FPL Letter L-2017-149
Updated Final Response to NRC Generic Letter 2004-02
After chemical debris introduction was completed and the head loss was allowed to stabilize, the test loop temperature was decreased to approximately 100 °F.
Figure 3.f.4-3: PSL1 Piping Diagram of Head Loss Test Loop
E1-94
Enclosure 1 to FPL Letter L-2017-149
Updated Final Response to NRC Generic Letter 2004-02
Test Parameters and Debris Materials and Preparation The test strainer replicated all hydraulic dimensions of the PSL1 strainer. For a test strainer area of 360.6 ft2, the nominal test flow rate was 417 gpm. The following materials were used as conventional debris for head loss testing: Nukon, pulverized acrylic (or paint base material), pulverized Cal-Sil, and PCI dirt/dust mix. The method of preparation prior to introduction to the test tank for each material is discussed below. Nukon fines were used as a surrogate for latent fiber, as recommended in the NRC SE on NEI 04-07 (Reference 6 p. 71). Nukon was also used to represent fines of low density fiberglass (LDFG) insulation debris. Nukon fines were prepared in accordance with the NEI fibrous debris preparation protocol (Reference 17). Nukon fiberglass sheets were cut into approximately 2” x 2” squares, and the heat treated base blanket material was examined for a binder burn-out gradient reaching halfway through the blanket. After being weighed out into required batches, Nukon pieces were then placed inside a debris preparation vessel that included a manifold with three high pressure nozzles. Test water was added to the vessel using a low-pressure water spray until the fiber debris was completely wetted and a slurry was formed. The debris was then sprayed with test water pressurized to 1,500 psi. The initial amount of water, the high-pressure spray nozzle position within the vessel, and the amount of time the high-pressure spray was applied were controlled during debris preparation so that fine fiber batches had similar characteristics. Acceptable debris characteristics were documented by photographing each batch of prepared debris over a light table. Fiber fines were acceptable once their composition was predominantly Class 2 fibers as defined in NUREG/CR-6224, consisting mainly of individual fibers with lesser quantities of fiber shards and small clumps (Reference 16 p. B−16). See Figure 3.f.4-4 for photographs of Nukon fines prepared using this process.
E1-95
Enclosure 1 to FPL Letter L-2017-149
Updated Final Response to NRC Generic Letter 2004-02
Figure 3.f.4-4: Nukon Fines Prepared for PSL1 Head Loss Testing
Pulverized acrylic was used as a surrogate for failed coatings (epoxy, enamel, inorganic zinc, and cold galvanizing) on an equal volume basis, and had a median size of 12.7 µm. The required amount of pulverized acrylic for a debris batch was weighed out and placed in a bucket. The particulate was then wetted with test water while being gently stirred to avoid the formation of foam. Pulverized Cal-Sil was prepared for test introduction using a similar method as the pulverized acrylic. The PCI dirt/dust mix was used as a surrogate for latent particulate. Two types of chemical debris surrogates were used for the head loss testing, sodium aluminum silicate (SAS) and AlOOH. The chemical debris was prepared in accordance with WCAP-16530-NP-A (Reference 18). See the Response to 3.o.2.12 for additional information. Debris Introduction For the PSL1 Thin-Bed Test, the pulverized acrylic and pulverized Cal-Sil were individually introduced to the test loop via the debris introduction hoppers, and the PCI dirt/dust mix was added directly to the test tank’s mixing regions. All particulate debris was added in quick succession, and no fiber was added to the test until all particulate was introduced. Nukon fiber fines were incrementally added in small batches until a particulate filtering debris bed was formed on the test strainer. The fiber was added to the test loop via the debris introduction hoppers. The hoppers used a portion of recirculating loop flow to suspend the fiber fines as it was added into the hopper and carried to the front and rear mixing regions of the test tank. The hopper functioned to provide mixing prior to introduction to prevent agglomeration of the debris materials. The mixing regions used recirculating test loop water to help
E1-96
Enclosure 1 to FPL Letter L-2017-149
Updated Final Response to NRC Generic Letter 2004-02
transport the debris to the strainer and minimize debris settling. Each fiber batch was equivalent to a 1/16” thick theoretical uniform debris bed. Six batches of fiber fines were introduced to the thin-bed test, which resulted in a cumulative theoretical uniform debris bed thickness. A particulate filtering debris bed was observed to form when the test loop water began to clear and when the head loss increase from a batch of fiber fines was observed to be smaller than the preceding batches. After conventional debris introduction, chemical precipitate debris was added to the test tank. SAS and AlOOH were simultaneously added in several batches to the test loop via a pump and hose from the chemical precipitate debris storage tanks. Once chemical precipitate debris introduction was completed, a flow sweep was performed, the test loop was cooled to about 100 °F, and a final flow sweep was performed. PTN3 Head Loss Test Results The conventional debris load for the PSL1 Thin-Bed test was scaled to the PTN3 plant scale based on the ratio of the PSL1 test strainer surface area (360.6 ft2) to the PTN3 plant strainer net surface area (4,499 ft2). The results are summarized in Table 3.f.4-2. The peak conventional debris head loss observed for this test is shown in Table 3.f.4-4.
Table 3.f.4-2: Conventional Debris Load for the PSL1 Thin-Bed Test Scaled to the PTN3 Plant Strainer
Dirt & Dust (lbm)
Pulverized Acrylic (ft3)
Cal-Sil (lbm)
Nukon Fines (lbm)
46.18 7.48 747.7 281.2 After all conventional debris was added, the head loss had stabilized (<1% increase in two consecutive 30 minute periods), and a temperature sweep had been performed, chemical precipitate debris was added to the test tank. The chemical precipitate debris batches for the full debris load protocol head loss test are summarized in the table below and scaled to equivalent plant debris load.
Note that the tested chemical precipitate debris in Table 3.f.4-3 does not bound the expected chemical precipitate formation at PTN3. This is deemed acceptable as discussed below.
E1-97
Enclosure 1 to FPL Letter L-2017-149
Updated Final Response to NRC Generic Letter 2004-02
Table 3.f.4-3: Chemical Precipitate Debris Batches for the PSL1 Thin-Bed Test Scaled to the PTN3 Plant Strainer
Total 124.78 212.06 77.99 The head loss increased relatively quickly when the first several batches of chemicals were added to the test tank. However, the incremental change in head loss declined as subsequent batches were added. Eventually, additional batches did not result in higher head loss peaks. Chemical debris batches were no longer added when a firm head loss plateau occurred accompanying chemical debris batch additions. The maximum chemical debris bed head loss observed during the thin-bed test is shown in Table 3.f.4-4. Figure 3.f.4-5 shows a plot of raw head loss test data for the thin-bed test with time to demonstrate the key testing activities. Note that the flow rates shown in this figure are at the test scale and the head loss values have not been adjusted to subtract the test strainer’s clean screen head loss.
E1-98
Enclosure 1 to FPL Letter L-2017-149
Updated Final Response to NRC Generic Letter 2004-02
Figure 3.f.4-5: PSL1 Thin-Bed Test Timeline
E1-99
Enclosure 1 to FPL Letter L-2017-149
Updated Final Response to NRC Generic Letter 2004-02
Summary of Thin-Bed Test Data A summary of the debris head loss results from the thin-bed test is provided in Table 3.f.4-4. The equivalent plant scale flow rates were determined using the ratio of the net plant strainer surface area to the test strainer surface area. As discussed in the Response to 3.f.10, the maximum chemical debris head loss was used to evaluate pump NPSH, void fraction, flashing, and strainer integrity for PTN3. The clean screen head loss of the test strainer ranged from 0.19 psi to 0.20 psi for a test flow rate range between 417 gpm to 428 gpm and a nominal temperature of 120 °F.
Table 3.f.4-4: Summary of PSL1 Thin-Bed Test Results
Test Point Debris Head
Loss (psi)
Test Flow Rate (at Plant Scale)
(gpm) Temperature
(°F)
Conventional Debris Max Head Loss 0.06 427.5
(5,334) 120.0
Conventional Debris Stable Head Loss 0.05 423.2
(5,280) 121.4
Aluminum Precipitate Max Head Loss 0.35 414.4
(5,170) 120.2
Aluminum Precipitate Stable Head Loss 0.35 417.8
(5,213) 120.0
PTN4 Response: PTN4 Region I: Test Setup The PTN4 containment sump strainer consists of three assemblies and each assembly has five strainer modules. Each strainer module features a number of perforated strainer disks installed vertically around a core tube running through the center of the module. The strainer assemblies were connected to the containment exit by suction piping. The design of the core tubes ensures a uniform flow distribution across the strainer. The test strainer consisted of one strainer module that is prototypical to the plant strainer design. The test strainer disks matched all critical dimensions (such as perforated plate thickness, hole opening size, and hole pitch) of the plant strainer modules. The test strainer had 13 disks with a total surface area of 240.9 ft2. The test strainer was placed at the downstream end of a test tank (see Figure 3.f.4-6). Flow that passes through the strainer disks collects inside the core tube and exits through the suction pipe to the side of test tank. The gaps between the test strainer and side and back walls of the test tank simulated the plant strainer configuration.
E1-100
Enclosure 1 to FPL Letter L-2017-149
Updated Final Response to NRC Generic Letter 2004-02
Debris and recirculating test loop water flow, which provided mixing, were introduced at the upstream end of the test strainer.
Figure 3.f.4-6: PTN4 Head Loss Test Strainer Assembly inside Test Tank
A schematic piping diagram of the test loop is provided in Figure 3.f.4-7 below. Note that the filter bag housings were used for cleaning the test loop before testing but were bypassed during head loss testing. The test loop had a recirculation pump that took suction through the test strainer and returned the water back to the test tank. The return flow exits into the tank were located such that the turbulence from the flow did not affect the debris bed on the test strainer, but allowed for thorough mixing of debris in the water column as it was introduced into the test tank. Flow elements were used to measure the flow rate through the test loop and debris hopper. Flow control valves and heating and cooling loops were used to control the test flow rate and water temperature (120 °F ± 5 °F).
E1-101
Enclosure 1 to FPL Letter L-2017-149
Updated Final Response to NRC Generic Letter 2004-02
Figure 3.f.4-7: Piping Diagram of PTN4 Head Loss Test Loop
The test loop also included a continuously mixed transition tank that was brought online during conventional and chemical debris introduction to increase the test loop water capacity and decrease the amount of draining required during testing.
Test Parameters and Scaling
The test strainer replicates all hydraulic dimensions of the plant strainer except for the number of strainer disks. The test debris quantities and test flow rate were scaled from plant values based on the ratio of the test strainer surface area to the plant strainer surface area. During testing, the test flow rate was maintained within (-0/+5%) of 247 gpm, which corresponds to an approach velocity of 0.00228 ft/s. As
E1-102
Enclosure 1 to FPL Letter L-2017-149
Updated Final Response to NRC Generic Letter 2004-02
discussed later in this response, flow sweeps were performed on the clean strainer and after addition of debris by measuring head losses for a range of flow rates. The Response to 3.f.10 has additional discussion on correcting test data to plant conditions. Debris Materials and Preparation The following materials were used as conventional debris for head loss testing: Nukon, Temp-Mat, silica flour, pulverized Cal-Sil, and PCI dirt/dust mix. The method of preparation prior to introduction to the test tank for each material is discussed below. Nukon fines were used as a surrogate for latent fiber, as recommended in NEI 04-07 and the associated NRC SE (Reference 6 p. 71). Nukon was also used to represent fines of LDFG insulation debris. Nukon fines were prepared in accordance with the NEI fibrous debris preparation protocol (Reference 8). Nukon fiberglass sheets were cut into approximately 2” x 2” squares, and the heat treated base blanket material was examined for a binder burn-out gradient reaching halfway through the blanket. Temp-Mat was pre-shredded by the vendor and heat treated. Each batch of Temp-Mat fines consisted of equal amount of heat treated and non-heat treated Temp-Mat. Figure 3.f.4-8 shows the cut or shredded debris that was ready for pressure washing.
Nukon Temp-Mat
Figure 3.f.4-8: Base Debris Material before Pressure Wash for PTN4 Head Loss Tests
The debris was weighed out into required batches. For batches that had both Nukon and Temp-Mat, the two materials were prepared separately. Nukon or Temp-Mat pieces were placed inside a debris preparation vessel that included a manifold with three high pressure nozzles. Test water was added to the vessel using a low-pressure water spray until the fiber debris was completely wetted and a slurry was formed. The debris was then sprayed with test water pressurized to 1,500 psi. The initial amount of water, the high-pressure spray nozzle position within the vessel,
E1-103
Enclosure 1 to FPL Letter L-2017-149
Updated Final Response to NRC Generic Letter 2004-02
and the amount of time the high-pressure spray was applied were controlled during debris preparation so that fine fiber batches had similar characteristics. Fiber fines were acceptable once their composition was predominantly Class 2 fibers as defined in NUREG/CR-6224, consisting mainly of individual fibers with lesser quantities of fiber shards and small clumps. Each batch of prepared fiber was photographed over a light table. See Figure 3.f.4-9 for photographs of Nukon fines prepared using this process.
Figure 3.f.4-9: Prepared Nukon (Left) and Temp-Mat (Right) Debris for PTN4 Head
Loss Tests Silica flour was used as a surrogate for qualified and unqualified coatings on an equal volume basis, and had a median size of 13.4 μm and a density of 165.4 lbm/ft3. Pulverized Cal-Sil was prepared for test introduction using a similar method as silica flour. The PCI dirt/dust mix was used as a surrogate for latent particulate and was sprinkled in its dry form directly into the test tank upstream of the strainer. Two types of chemical debris surrogates were used for the head loss testing, SAS and AlOOH. The chemical debris was prepared in accordance with WCAP-16530-NP-A (Reference 18) and met the settling volume acceptance requirements specified in WCAP-16530-NP-A. See the Response to 3.o.2.12 for additional information. Debris Introduction As previously discussed, Nukon and Temp-Mat debris was prepared separately. The fiber debris slurry for the individual fiber types of a given batch were combined with each other before introduction. The combined fiber slurry was gently mixed to avoid agglomeration.
E1-104
Enclosure 1 to FPL Letter L-2017-149
Updated Final Response to NRC Generic Letter 2004-02
For the full debris load tests, the prepared particulates (silica flour and pulverized Cal-Sil) of a given batch were added to the fiber slurry and gently stirred until a homogenous fiber and particulate debris mixture was formed. The fiber and particulate slurry was added to the test loop via the debris introduction hopper. The hopper used a portion of recirculating loop flow to suspend the debris slurry with fiber fines as it was added into the hopper and carried to the mixing region of the test tank. The hopper functioned to provide mixing prior to introduction to prevent agglomeration of the debris materials. The mixing regions used recirculating test loop water to help transport the debris to the strainer and minimize debris settling. The PCI dirt/dust for the given batch was added directly to the test tank. During the thin-bed test, the particulate debris was added before any fibrous debris. First the prepared silica flour was added, followed by the concurrent introduction of pulverized Cal-Sil and PCI dirt/dust. Silica flour and pulverized Cal-Sil were added through the debris hopper while the PCI dirt/dust was added directly to the test tank. After all the particulate debris was added to the test tank, homogeneous mixed batches of fibrous fines were added through the debris hopper. The size of the fiber batches was equivalent to a 1/16” theoretical uniform debris bed thickness for the test strainer. After conventional debris introduction and debris bed characterization (flow sweep) were completed for each test, chemical precipitate debris was added to the test tank. For the full debris load tests, two types of chemical precipitates were used: AlOOH and SAS. The SAS debris was added first before AlOOH. For the thin-bed test, only AlOOH was used. The prepared chemical debris was pumped into the mixing region of the test tank. Head Loss Test Cases and Results PTN4 Full Debris Load Test 1 The total conventional debris loads for the PTN4 Full Debris Load Test 1 are provided in Table 3.f.4-5 and scaled to equivalent plant debris loads. The peak conventional debris head loss observed for this test is shown in Table 3.f.4-11.
Table 3.f.4-5: Total Conventional Debris Loads for PTN4 Full Debris Load Test 1 Latent
Particulate (lbm)
Silica Flour (ft3)
Cal-Sil (lbm)
Nukon (lbm)
Temp-Mat (lbm)
144.5 2.936 294.7 168.8 146.4
E1-105
Enclosure 1 to FPL Letter L-2017-149
Updated Final Response to NRC Generic Letter 2004-02
After all conventional debris was added, the head loss had stabilized, and a flow sweep had been performed, chemical precipitate debris was added to the test tank. The chemical precipitate debris batches for the PTN4 Full Debris Load Test 1 are summarized in Table 3.f.4-6 and scaled to equivalent plant debris loads. Table 3.f.4-6: Chemical Precipitate Debris Batches for PTN4 Full Debris Load
Head loss increased relatively quickly and was unstable after the first batch of chemical debris (SAS) was added to the test tank. The maximum chemical debris head loss was observed, followed by a debris bed shift and a drop in head loss. The addition of the second batch of SAS created a moderate increase in head loss but did not result in new head loss peaks. The next two batches of chemical debris had little effect on head loss. Chemical debris addition was therefore ended. The maximum chemical debris head loss for the PTN4 Full Debris Load Test 1 is considered to be the first peak observed after introducing the first batch of debris. The chemical debris head loss results are provided in Table 3.f.4-11. Figure 3.f.4-10 shows a plot of raw head loss test data for the PTN4 Full Debris Load Test 1 over time to identify the key testing activities. Note that the flow rates shown in this figure are at the test scale and the head loss values have not been adjusted to subtract the test strainer’s clean screen head loss.
E1-106
Enclosure 1 to FPL Letter L-2017-149
Updated Final Response to NRC Generic Letter 2004-02
Figure 3.f.4-10: PTN4 Full Debris Load Test 1 Timeline
E1-107
Enclosure 1 to FPL Letter L-2017-149
Updated Final Response to NRC Generic Letter 2004-02
PTN4 Full Debris Load Test 2 The total conventional debris loads for the PTN4 Full Debris Load Test 2 are provided in Table 3.f.4-7 and scaled to equivalent plant debris loads. The peak conventional debris head loss observed for this test is shown in Table 3.f.4-11.
Table 3.f.4-7: Total Conventional Debris Loads for PTN4 Full Debris Load Test 2 Latent
Particulate (lbm)
Silica Flour (ft3)
Cal-Sil (lbm)
Nukon (lbm)
Temp-Mat (lbm)
144.5 2.969 439 117.9 137.2 After all conventional debris was added, the head loss had stabilized, and a flow sweep had been performed, chemical precipitate debris was added to the test tank. The chemical precipitate debris batches for the PTN4 Full Debris Load Test 2 are summarized in Table 3.f.4-8 and scaled to equivalent plant debris loads. Table 3.f.4-8: Chemical Precipitate Debris Batches for PTN4 Full Debris Load
Head loss increased relatively quickly and was unstable after the first batch of chemical debris (SAS) was added to the test tank. The maximum chemical debris head loss was observed after the addition of the second batch of SAS, which only created a small increase in head loss. The last two batches of chemical debris had little effect on head loss. Chemical debris addition was therefore ended. The maximum chemical debris head loss for the PTN4 Full Debris Load Test 2 is considered to be the peak observed after introducing the second batch of debris. The chemical debris head loss results are provided in Table 3.f.4-11. Figure 3.f.4-11 shows a plot of raw head loss test data for the PTN4 Full Debris Load Test 2 over time to identify the key testing activities. Note that the flow rates shown in this figure are at the test scale and the head loss values have not been adjusted to subtract the test strainer’s clean screen head loss.
E1-108
Enclosure 1 to FPL Letter L-2017-149
Updated Final Response to NRC Generic Letter 2004-02
Figure 3.f.4-11: PTN4 Full Debris Load Test 2 Timeline
E1-109
Enclosure 1 to FPL Letter L-2017-149
Updated Final Response to NRC Generic Letter 2004-02
PTN4 Thin-Bed Test The total conventional debris loads for the PTN4 Thin-Bed Test are provided in Table 3.f.4-9 and scaled to equivalent plant debris loads. Five batches of Nukon fines were used for the thin-bed test, which resulted in a total theoretical uniform debris bed thickness of 5/16”. The peak conventional debris head loss observed for this test is shown in Table 3.f.4-11.
Table 3.f.4-9: Total Conventional Debris Loads for PTN4 Thin-Bed Test Latent
Particulate (lbm)
Silica Flour (ft3)
Cal-Sil (lbm)
Nukon (lbm)
Temp-Mat (lbm)
144.5 2.908 509.8 213.4 0 After all conventional debris was added, the head loss had stabilized, and a flow sweep had been performed, chemical precipitate debris was added to the test tank. The chemical precipitate debris batches for the PTN4 Thin-Bed Test are summarized in Table 3.f.4-10 and scaled to equivalent plant debris loads. Table 3.f.4-10: Chemical Precipitate Debris Batches for PTN4 Thin-Bed Test
Total 91.42 0 41.11 Head loss increased relatively quickly and was unstable after the first batch of chemical debris was added to the test tank. The maximum chemical debris head loss was observed as head loss stabilized. Several bed shifts occurred during and after adding the next two batches of chemical debris but no new head loss peaks were observed. Chemical debris addition was therefore ended. The maximum chemical debris head loss for the PTN4 Thin-Bed Test is considered to be the peak observed after introducing the first batch of debris. The chemical debris head loss results are provided in Table 3.f.4-11. Figure 3.f.4-12 shows a plot of raw head loss test data for the PTN4 Thin-Bed Test over time to identify the key testing activities. Note that the flow rates shown in this figure are at the test scale and the head loss values have not been adjusted to subtract the test strainer’s clean screen head loss.
E1-110
Enclosure 1 to FPL Letter L-2017-149
Updated Final Response to NRC Generic Letter 2004-02
Figure 3.f.4-12: PTN4 Thin-Bed Test Timeline
E1-111
Enclosure 1 to FPL Letter L-2017-149
Updated Final Response to NRC Generic Letter 2004-02
Summary of Head Loss Test Results for PTN4 Region I Breaks A summary of the head loss results from the PTN4 tests are provided in the table below. As discussed in the Response to 3.f.7, the maximum conventional and chemical debris head losses of the three tests were used to evaluate pump NPSH, void fraction, flashing, and strainer integrity for PTN4. These maximum head losses are shown in bold font in Table 3.f.4-11. The clean screen head loss of the test strainer was approximately 0.014 psi for the nominal test flow rate of 247 gpm.
Table 3.f.4-11: Summary of PTN4 Head Loss Test Results for Region I Breaks
Test Point Head Loss (psi)
Test Flow Rate (at Plant Scale)
(gpm) Temperature
(°F)
PTN4 Full Debris Load Test 1 Conventional Debris Max Head Loss 0.785 249.0
(3,529) 119.2
Conventional Debris Stable Head Loss 0.667 250.0
(3,543) 120.4
Aluminum Precipitate Max Head Loss 1.176 249.7
(3,539) 122.2
Aluminum Precipitate Stable Head Loss 0.771 250.1
(3,544) 120.4
PTN4 Full Debris Load Test 2 Conventional Debris Max Head Loss 1.058 251.4
(3,563) 119.9
Conventional Debris Stable Head Loss 0.839 250.5
(3,550) 119.8
Aluminum Precipitate Max Head Loss 1.370 250.7
(3,553) 120.6
Aluminum Precipitate Stable Head Loss 1.334 250.1
(3,544) 119.8
PTN4 Thin-Bed Test Conventional Debris Max Head Loss 0.517 249.8
(3,540) 119.6
Conventional Debris Stable Head Loss 0.506 250.0
(3,543) 119.5
Aluminum Precipitate Max Head Loss 0.835 251.7
(3,567) 123.9
Aluminum Precipitate Stable Head Loss 0.697 249.9
(3,541) 120.4
E1-112
Enclosure 1 to FPL Letter L-2017-149
Updated Final Response to NRC Generic Letter 2004-02
PTN4 Region II: Head loss testing was not performed for the Region II breaks at PTN4. Instead, the head loss testing from Point Beach (PBN) was used as the basis for the expected head loss resulting from Region II breaks at PTN4. Note that while the PBN testing included both conventional and chemical head loss, only the conventional head loss was applied to PTN4. The head loss contribution from the chemical debris for the PTN4 Region II breaks was based on the PTN4 Region I testing results. A comparison of the PBN and PTN4 strainers is provided in Table 3.f.4-12. Both strainers were designed and constructed by PCI. PTN4 has a higher strainer flow rate than PBN, but the strainer approach velocity is slightly lower because PTN4’s strainer surface area is much larger than the PBN strainers.
Table 3.f.4-12: Comparison of PTN4 and PBN Strainer Parameters Parameter PTN4 PBN Notes
Strainer Manufacturer PCI PCI
Both strainers have vertical disks installed around a core tube.
Strainer Perforated Plate Hole Diameter
0.095 inches 0.066 inches
Strainer Perforated Plate Thickness
0.0625 inches 0.048 inches
Net Strainer Surface Area 3,413.9 ft2 1,754.6 ft2
The net strainer surface areas were subsequently reduced to account for miscellaneous debris.
Calculated by dividing the strainer flow rate by the net strainer surface area and converting to units of feet per second.
E1-113
Enclosure 1 to FPL Letter L-2017-149
Updated Final Response to NRC Generic Letter 2004-02
The PBN test methodology is described below. Note that the PBN tests included chemical precipitate debris additions. However, chemical debris head loss from the PBN tests were not applied for the PTN4 Region II breaks. Therefore, information regarding the PBN testing of chemical debris is not presented here. PBN Test Setup Figure 3.f.4-13 and Figure 3.f.4-14 show the test strainer in the test tank as well as the debris introduction section of the test tank, including the mixing lines and hopper inlet. Note that these figures are from the 2015 test program, for which the test set-up was very similar to the 2016 testing. The test strainer assembly consisted of one prototypical 10-disk strainer module with a flow-controlled suction pipe passing through the center (core tube). The total surface area of the test strainer was 136 ft2. To simulate the module to module clearance, the width of the tank was designed to model the active strainer module length and the 5” module-to-module clearance in the plant.
Figure 3.f.4-13: PBN Head Loss Test Tank and Strainer
E1-114
Enclosure 1 to FPL Letter L-2017-149
Updated Final Response to NRC Generic Letter 2004-02
Figure 3.f.4-14: Mixing Lines and Hopper Inlet in the PBN Head Loss Test Tank
A schematic piping diagram of the test loop is provided in Figure 3.f.4-15. Downstream of the main recirculation pump a small portion of the flow can be directed through a heat exchanger to control the test loop temperature. A large majority of the flow then passes directly through the mixing nozzle configuration, placed at the upstream end of the test tank. The remainder of flow that does not travel through the mixing nozzles is divided and the two streams pass through the debris introduction hopper and transition tank respectively. The continuously mixed transition tank was brought online during conventional and chemical precipitate debris introduction to increase the test loop water capacity and decrease the amount of draining required during testing. Flow directed to the debris introduction hopper supplies turbulence through the bottom of the hopper to encourage mixing of the debris slurry. The discharge of the hopper gravity drains into the test tank. The filter bag housings were used only during pre-test cleaning, and were isolated and bypassed during head loss testing.
E1-115
Enclosure 1 to FPL Letter L-2017-149
Updated Final Response to NRC Generic Letter 2004-02
Figure 3.f.4-15: Piping Diagram of Head Loss Test Loop for PBN Head Loss Tests
PBN Test Parameters and Scaling The test strainer replicated all hydraulic dimensions of the PBN plant strainer except for the number of strainer modules. The test debris quantities and flow rate were scaled from plant values based on the ratio of test strainer surface area (136.0 ft2) to the plant strainer surface area. The test flow rate was 162.8 gpm, which corresponded to a strainer approach velocity of 0.00267 ft/s. PBN Debris Materials and Preparation Conventional debris consists of fiber and particulate debris from failed insulation and coatings, and latent materials that could be transported to the sump strainers following a LOCA. Nukon and mineral wool were the only two fibrous debris types used during the PBN testing.
Nukon fines were used as a surrogate to model latent fiber on a basis of similar macroscopic density and characteristic fiber size. Heat treated Nukon sheets were procured and processed right before each test. Some of the mineral wool used during testing was heat treated by the testing vendor prior to processing. The required burn out gradient reached approximately half way through the blanket.
E1-116
Enclosure 1 to FPL Letter L-2017-149
Updated Final Response to NRC Generic Letter 2004-02
Pulverized Cal-Sil was purchased and used during the test. Due to their similar characteristic sizes and microscopic densities, silica flour, with a material density of 165.4 lbm/ft3 and a median size of approximately 13.5 microns was used as a surrogate for qualified coatings, unqualified coatings, and the fine particle portion of the actively delaminating qualified coatings. Pressure washed paint chips, with a nominal size of approximately 0.125”, were used as a surrogate to model the flat small chip portion of the actively delaminating qualified coatings. The material density of the paint chips was 89.3 lbm/ft3. Latent particulate was modeled with the PCI dirt/dust mix, which was procured from PCI and used without additional processing. Preparation of Nukon and mineral wool fiber started by cutting the insulation sheets into approximately 2” by 2” cubes. The base material for both types of debris, ready for fiber fines preparation, is shown in Figure 3.f.4-16.
Figure 3.f.4-16: Base Debris Material before Pressure Wash for PBN Head Loss
Tests The required quantity of debris was weighed out per the debris batching schedule. The debris was then wetted in preheated test water and processed into fines following the method developed by NEI (Reference 17). The processing involves pressure washing the debris using a nominal 1,500 psi pressure washer with nozzles that produce a fan-type flow distribution. The nozzle position within the preparation vessel and the amount of time the spray was applied were controlled between debris batches. Prepared fiber fines consisted of primarily Class 2 fibers as defined in NUREG/CR-6224 (Reference 16 p. B−16). Figure 3.f.4-17 shows pictures of the processed fiber samples inside an acrylic column on top of a light table.
E1-117
Enclosure 1 to FPL Letter L-2017-149
Updated Final Response to NRC Generic Letter 2004-02
Figure 3.f.4-17: Prepared Nukon and Mineral Wool Debris for PBN Head Loss
Tests Silica flour was used as a surrogate for qualified and unqualified epoxy coatings on an equal volume basis. The required quantity of silica flour for a debris batch was first weighed out before being wetted in test water. For the full debris load tests, the wetted silica flour was combined with the prepared fibrous debris slurry to form a homogeneous suspension. For the thin-bed test, silica flour was mixed in barrels of heated test water and sufficiently diluted to allow for direct introduction through the debris hopper. Cal-Sil was prepared in a similar manner as silica flour. For the full debris load tests, the desired amount of Cal-Sil was weighed out, wetted with heated test water, and combined with the fibrous debris slurry. For the thin-bed test, Cal-Sil was diluted with sufficient test water to allow for direct introduction through the debris hopper. The PCI dirt/dust mix, which was used as a surrogate for latent particulate debris, did not require processing. It was introduced in its dry form and sprinkled directly into the test tank upstream of the strainer. The paint chips were wetted down with test water and repeatedly mixed to minimize the potential for paint chip flotation. For the full debris load tests, the paint chips were combined with the homogenous debris slurry prior to introduction. For the thin-bed test, the wetted paint chips were added directly to the debris introduction hopper prior to the fibrous debris. The large flat chips and curled chips from the actively delaminating qualified coatings were not introduced during the 2016 test program as it was demonstrated during the 2015 test program that these chips would not transport to the strainer even with agitation.
E1-118
Enclosure 1 to FPL Letter L-2017-149
Updated Final Response to NRC Generic Letter 2004-02
Debris Introduction Full Debris Load Tests For the two full debris load tests, the prepared silica flour, Cal-Sil, paint chips, pressure washed paint chips, and fibrous debris for a given batch were combined in barrels prior to addition into the test loop. The debris was agitated into a homogeneous mixture prior to introduction, and was continuously mixed during introduction to prevent agglomeration and to maintain the concentration as constant as practical. The homogeneous mixture of debris was transferred to the hopper via five gallon buckets. Debris additions to the test tank were performed utilizing the debris hopper, which mixed the debris slurry with test loop water before transporting the debris to the upstream end of the test tank. The flow pattern in the hopper caused the debris to be held in suspension, which prevented agglomeration prior to adding the debris to the tank. The dirt/dust for the given batch was added directly to the test tank. To achieve the desired transport of debris in the test tank, five mixing nozzles were implemented. These mixing nozzles maintained turbulence in the test tank to prevent debris from settling. Thin-Bed Test During the thin-bed test, the particulate debris was added before any fibrous debris. The prepared silica flour was added first, followed by the introduction of Cal-Sil, pressure washed paint chips, paint chips, and dirt/dust. All of these particulate debris types were introduced through the hopper with the exception of dirt/dust, which was sprinkled directly into the test tank in its dry form. All particulate debris was added in quick succession, and no fiber was added to the test until all particulate was introduced. After all the particulate debris was added to the test tank, homogeneous mixed batches of Nukon and mineral wool fines were added through the debris hopper. Note that the fibrous debris was continuously mixed during introduction to prevent agglomeration and to maintain the concentration as constant as practical. The size of each fiber batch was equivalent to a 1/16” theoretical uniform debris bed thickness for the test strainer. The mixing nozzles were utilized for the thin-bed test as well to prevent settling.
E1-119
Enclosure 1 to FPL Letter L-2017-149
Updated Final Response to NRC Generic Letter 2004-02
Comparison of PBN Head Loss Test and PTN4 Plant Debris Types As shown in the Response to 3.e.6, for PTN4, fiber fines (Nukon and Temp-Mat), Cal-Sil, epoxy coatings and latent debris could be generated and transported to the sump strainer following a LOCA. PBN testing used Nukon and mineral wool fines, pulverized Cal-Sil, silica flour as a surrogate for coatings, and PCI dirt/dust as a surrogate for latent particulate. In the PBN testing, both Nukon and mineral wool were processed as fines per the NEI guidance, and the processed debris contained primarily Class 2 fiber (Reference 16 p. B−16). If PTN4 had performed Region II testing, the Nukon and Temp-Mat fiber would have been processed in the same manner. Therefore, the fibrous debris mix used for the PBN testing adequately represents the fiber at PTN4. For all other PTN4 debris types (Cal-Sil, coatings and latent particulate), either the debris itself or an acceptable surrogate was used in the PBN testing, as described above. Head Loss Test Cases and Results PBN Full Debris Load Test 1 The total conventional debris load for the PBN Full Debris Load Test 1 is provided in Table 3.f.4-13 and scaled to equivalent PTN4 debris loads. The peak conventional debris head loss observed for these tests are shown in Table 3.f.4-16.
Table 3.f.4-13: PBN Full Debris Load Test 1 Conventional Head Loss Debris Loads
Figure 3.f.4-18 shows a plot of raw head loss test data for the PBN Full Debris Load Test 1 with time to identify the key testing activities. Note that the flow rates shown in these figures are at the test scale and the head loss values have not been adjusted to subtract the test strainer’s clean screen head loss.
E1-120
Enclosure 1 to FPL Letter L-2017-149
Updated Final Response to NRC Generic Letter 2004-02
Figure 3.f.4-18: PBN Full Debris Load Test 1 Conventional Debris Timeline
E1-121
Enclosure 1 to FPL Letter L-2017-149
Updated Final Response to NRC Generic Letter 2004-02
PBN Full Debris Load Test 2 The conventional debris load for the PBN Full Debris Load Test 2 is provided in Table 3.f.4-14 and scaled to equivalent PTN4 debris loads. The peak conventional debris head loss observed for this test is shown in Table 3.f.4-16.
Table 3.f.4-14: PBN Full Debris Load Test 2 Conventional Head Loss Debris Loads
Nukon (lbm)
Mineral Wool (lbm)
Dirt & Dust (lbm)
Cal-Sil (lbm)
Silica Flour (ft3)
Paint Chips (ft3)
Pressure Washed Paint
Chips (ft3) 137.6 134.8 169.0 598.3 18.758 0.483 1.884 Figure 3.f.4-19 shows a plot of raw head loss test data for the PBN Full Debris Load Test 2 with time to identify the key testing activities. Note that the flow rates shown in these figures are at the test scale and the head loss values have not been adjusted to subtract the test strainer’s clean screen head loss.
E1-122
Enclosure 1 to FPL Letter L-2017-149
Updated Final Response to NRC Generic Letter 2004-02
Figure 3.f.4-19: PBN Full Debris Load Test 2 Conventional Debris Timeline
E1-123
Enclosure 1 to FPL Letter L-2017-149
Updated Final Response to NRC Generic Letter 2004-02
PBN Thin-Bed Test The conventional debris load for the PBN Thin-Bed Test is summarized in Table 3.f.4-15 and scaled to equivalent PTN4 debris loads. Six batches of fiber fines were introduced to the thin-bed test, which resulted in a cumulative theoretical uniform debris bed thickness of approximately 3/8”. The peak conventional debris head loss observed for this test is shown in Table 3.f.4-16.
Table 3.f.4-15: PBN Conventional Thin-Bed Head Loss Test Debris Loads
Figure 3.f.4-20 shows a plot of raw head loss test data for the thin-bed test with time to demonstrate the key testing activities. Note that the flow rates shown in these figures are at the test scale and the head values have not been adjusted to subtract the test strainer’s clean screen head loss.
E1-124
Enclosure 1 to FPL Letter L-2017-149
Updated Final Response to NRC Generic Letter 2004-02
Figure 3.f.4-20: PBN Thin-Bed Test Conventional Debris Timeline
E1-125
Enclosure 1 to FPL Letter L-2017-149
Updated Final Response to NRC Generic Letter 2004-02
Summary of Head Loss Test Data for PTN4 Region II Breaks A summary of the debris head loss results for the PTN4 Region II breaks is provided in Table 3.f.4-16. The conventional debris head loss was based on the PBN head loss test program, see the Response to 3.f.7 for additional justification. The maximum conventional debris head loss was from the PBN Full Debris Load Test 2. For chemical debris, the head loss contribution for the Region II breaks was based on the PTN4 head loss test results. As discussed earlier in this section, for each of the PTN4 head loss tests, the measured head loss plateaued before the full predicted chemical debris load was added to the test tank, indicating a debris bed saturated by chemical debris. Should a head loss test be performed for the largest PTN4 Region II break debris load, one would expect a similar head loss response to the chemical debris addition. Therefore, it is reasonable to apply the largest head loss increase after adding chemical debris from the PTN4 head loss tests to the PTN4 Region II breaks. The maximum chemical debris head loss increase from all PTN4 head loss tests occurred during PTN4 Full Debris Load Test 1 (from Table 3.f.4-11, 1.176 psi – 0.785 psi = 0.39 psi). Note that the test flow rates shown in parentheses in Table 3.f.4-16 were converted to the PTN4 plant scale. The flow rates for the conventional debris head losses, which were based on the PBN testing, were converted to PTN4 plant scale by multiplying the test flow rates by the ratio between the PTN4 plant strainer surface area (3,413.9 ft2) and the PBN test strainer surface area of 136 ft2. The flow rate for the chemical debris head loss, which was based on the PTN4 testing, was converted similarly but the PTN4 test strainer surface area was used.
E1-126
Enclosure 1 to FPL Letter L-2017-149
Updated Final Response to NRC Generic Letter 2004-02
Table 3.f.4-16: PTN4 Debris Head Loss Results for Region II Breaks
Description Maximum Head Loss (psi)
Test Flow Rate (gpm)
Temperature (°F)
Full Debris Load Test 1 Maximum Conventional Debris Head Loss 1.135 165.7
(4,159) 119.7
Maximum Head Loss Increase by Chemical Debris 0.39 250.7
(3,553) 120.6
Full Debris Load Test 2 Maximum Conventional Debris Head Loss1 1.592 165.5
(4,154) 123
Maximum Head Loss Increase by Chemical Debris 0.39 250.7
(3,553) 120.6
Thin-Bed Test Maximum Conventional Debris Head Loss 0.525 164.9
(4,139) 120
Maximum Head Loss Increase by Chemical Debris 0.39 251.7
(3,567) 123.9
5. Address the ability of the design to accommodate the maximum volume of debris
that is predicted to arrive at the screen.
Response to 3.f.5
PTN3 Response:
As discussed in the Response to 3.f.4, the PSL1 head loss test conditions and parameters are bounding or representative of PTN3. The PSL1 test setup represented a more restrictive geometry than the plant strainers installed in PTN3. As discussed in the Response to 3.f.7, the amount of debris used in the PSL1 Thin-Bed Test bounds the maximum debris loads that could occur at PTN3. Additionally, the interstitial volume of the PTN3 strainers is 303 ft3, which is greater than maximum volume of fiber transported to the strainer (226 lbm, see Table 3.f.7-1, with a conservatively assumed density of 2.4 lbm/ft3, results in 94 ft3 of fiber). Therefore, the impact of debris volume on the PTN3 plant strainer can be directly determined from the head loss test results.
E1-127
Enclosure 1 to FPL Letter L-2017-149
Updated Final Response to NRC Generic Letter 2004-02
PTN4 Response:
As discussed in the Response to 3.f.4, the head loss tests used test strainers that are prototypical to the plant strainer designs. Additionally, the test debris loads were scaled based on the ratio of the test strainer surface area and the plant’s net strainer surface area. The arrangement of the test strainer with respect to the test tank models the configuration in the vicinity of the plant strainer. Finally, as discussed in the Response to 3.f.7, the full debris load tests bounded the maximum debris loads of all Region I breaks (23” and smaller). With these considerations, the impact of debris volume on the plant strainer can be directly determined from the PTN4 head loss test results for all PTN4 Region I breaks (23” or smaller). For the PTN4 Region II breaks, PBN and PTN4 head loss test data was used. As discussed in the Response to 3.f.4 and 3.f.7, the strainer configuration and debris loads of the Region II breaks were adequately represented or bounded by the PBN and PTN4 testing. Similar to the discussion above, the effect of debris volume on strainer head loss can be determined from the testing results. 6. Address the ability of the screen to resist the formation of a “thin bed” or to
accommodate partial thin bed formation.
Response to 3.f.6:
The “thin-bed effect” is defined as the relatively high head losses associated with a low-porosity (or high particulate to fiber ratio) debris bed formed by a thin layer of fibrous debris that can effectively filter particulate debris.
PTN3 Response:
As discussed in the Response to 3.f.4, the PSL1 Thin-Bed Test was used to determine the PTN3 strainer head loss. During the PSL1 Thin-Bed Test, the full particulate load was added into the test tank first, followed by fiber fines in batches equivalent to a 1/16” theoretical uniform bed thickness. This batching schedule allowed the formation of a debris bed with a high particulate to fiber ratio. As a result, any thin-bed effects, should they occur, were captured by the measured head losses. The PSL1 Thin-Bed Test bounded the expected particulate debris loads for PTN3. This captures any expected head loss if a thin-bed were to occur at PTN3.
E1-128
Enclosure 1 to FPL Letter L-2017-149
Updated Final Response to NRC Generic Letter 2004-02
PTN4 Response:
PTN4 Region I
The PTN4 head loss testing included a test for thin-bed effects. During this test, the particulate debris was added into the test tank first, followed by fiber fines in batches equivalent to a 1/16-inch theoretical uniform bed thickness (see Table 3.f.4-9). This batching schedule allowed the formation of a debris bed with a high particulate to fiber ratio. Note that, as shown in Table 3.f.7-3, the particulate debris loads used for the PTN4 Thin-Bed Test bounded all of the PTN4 Region I breaks (23” and smaller). As a result, any thin-bed effects, should they occur, would be captured by the measured head losses for the Region I breaks.
PTN4 Region II
As shown in Table 3.f.4-16 in the Response to 3.f.4, the total head loss experienced during the PBN thin-bed testing was much lower than the head loss experienced during full debris load testing. Therefore, the full debris load test results bound any thin-bed effect experienced during testing. Additionally, the particulate debris loads for PTN4 Region II breaks (see the Response to 3.f.7) are much lower than the particulate loads used in the PBN Thin-Bed Test.
E1-129
Enclosure 1 to FPL Letter L-2017-149
Updated Final Response to NRC Generic Letter 2004-02
7. Provide the basis for strainer design maximum head loss.
Response to 3.f.7:
PTN3 Response: Comparison of Plant and Head Loss Test Flow Rates As discussed in the Response to 3.f.3, the maximum flow rate through the strainers is 3,446 gpm with an approach velocity of 0.00171 ft/s. During head loss testing, the nominal test flow rate was 417 gpm. This flow rate corresponds to an approach velocity of 0.0026 ft/s during conventional and chemical precipitate debris introduction. The approach velocity used during the head loss tests therefore bounds the plant condition. Comparison of Plant and Head Loss Test Conventional Debris Loads Table 3.f.7-1 compares the conventional debris loads of four PTN3 bounding breaks with those used in the PSL1 Thin-Bed Test. The plant debris loads are shown in Table 3.e.6-19 and Table 3.e.6-20, except for the unqualified coatings and latent debris. The quantities of individual coating types were combined to determine the total volume of qualified coatings. The unqualified coatings quantities were determined by combining the volumes of all subtypes from Table 3.h.1-3 (converted from the mass values with margin). The total coatings particulate debris loads shown in Table 3.f.7-1 were calculated by combining the volumes of qualified coatings and unqualified coatings. The latent debris quantities are from the Response to 3.e.6. The tested debris loads are from Table 3.f.4-2.
E1-130
Enclosure 1 to FPL Letter L-2017-149
Updated Final Response to NRC Generic Letter 2004-02
Table 3.f.7-1: Summary of PTN3 Plant and Head Loss Test Debris Loads Break Location 31-RCS-1302-10 31-RCS-1303-10 12-RC-1301-9 12-RC-1301-8
Updated Final Response to NRC Generic Letter 2004-02
As shown in Table 3.f.7-1, the total fiber, Cal-Sil, and total coatings particulate debris loads of the two loop breaks (31-RCS-1302-10 and 31-RCS-1303-10) and the two surge line breaks (12-RC-1301-9 and 12-RC-1301-8) are bounded by the thin-bed test. The latent particulate debris load used in the head loss test is less than the plant’s debris load, but the significant surplus in the tested amount of Cal-Sil and coatings particulate offsets the difference in the tested amount of latent particulate. Because the head loss test conventional debris loads bound the PTN3 plant debris loads, the maximum conventional debris head loss from the PSL1 Thin-Bed Test (seen in Table 3.f.4-4) was conservatively used for the PTN3 head loss. Comparison of Plant and Head Loss Test Chemical Debris Loads Table 3.f.7-2 compares the bounding chemical debris loads for PTN3 (see the Response to 3.o.2.7.ii) with those used in the head loss test (see the Response to 3.f.4).
Table 3.f.7-2: PTN3 Chemical Precipitate Debris Loads
Plant Chemical Debris Loads
PSL1 Thin-Bed Test
Total Aluminum Precipitated (kg) 413.1 77.99
As shown in Table 3.f.7-2, the total precipitated aluminum quantity for the chemical debris load used for the PSL1 Thin-Bed Test is less than that predicted for PTN3. However, as discussed in the Response to 3.f.4, the introduction of chemical debris was ended after it was confirmed that the added debris had no impact on head loss. Therefore, the maximum chemical debris head loss in Table 3.f.4-4 was determined to be the maximum chemical debris head loss for PTN3.
E1-132
Enclosure 1 to FPL Letter L-2017-149
Updated Final Response to NRC Generic Letter 2004-02
PTN4 Response:
PTN4 Region I:
Comparison of Plant and Head Loss Test Flow Rates
As discussed in the Response to 3.f.3, the maximum flow rate through the strainers is 3,446 gpm with an approach velocity of 0.00225 ft/s. During head loss testing, the nominal test flow rate was 247 gpm. This flow rate corresponds to an approach velocity of 0.00228 ft/s during conventional and chemical precipitate debris introduction. The approach velocity used during the head loss tests therefore bounds the plant condition.
Comparison of Plant and Head Loss Test Conventional Debris Loads
Table 3.f.7-3 compares the conventional debris loads of two PTN4 bounding breaks with those used in the head loss tests. The plant debris loads are described in the Response to 3.e.6 except for the unqualified coatings. The quantities of individual coating types were combined to determine the total volume of qualified coatings. The unqualified coatings quantities were determined by combining the volumes of all subtypes from Table 3.h.1-4 (converted from the mass values with margin). The total coatings particulate debris loads shown in Table 3.f.7-3 were calculated by combining the volumes of qualified coatings and unqualified coatings. The debris loads for PTN4 Full Debris Load Tests 1 and 2 and the PTN4 Thin-Bed Test were taken from the data in Table 3.f.4-5, Table 3.f.4-7, and Table 3.f.4-9, respectively.
E1-133
Enclosure 1 to FPL Letter L-2017-149
Updated Final Response to NRC Generic Letter 2004-02
Table 3.f.7-3: Comparison of PTN4 Test Conventional Debris Loads with Bounding 23” Breaks Highest Fiber Break Highest Cal-Sil Break
Updated Final Response to NRC Generic Letter 2004-02
As shown in Table 3.f.7-3, the total fiber, Cal-Sil, and total coatings particulate debris loads of the highest fiber 23” breaks are bounded by PTN4 Full Debris Load Test 1. The total fiber, Cal-Sil, and total coatings particulate debris loads of the highest Cal-Sil 23” breaks are bounded by the PTN4 Full Debris Load Test 2. The Cal-Sil, total coatings particulate, and latent particulate debris loads of the four 23” breaks are bounded by those used in the PTN4 Thin-Bed test. Figure 3.f.7-1 compares the tested and plant debris loads for fiber fines and Cal-Sil. As shown in the figure, the total fiber fines and Cal-Sil loads of all breaks that are 23” or smaller are bounded by at least one full debris load test. The Cal-Sil loads are also bounded by the thin-bed test.
As shown in Table 3.f.4-11, the PTN4 Full Debris Load Test 2 resulted in higher peak conventional debris head loss than the other two tests. Therefore, the maximum PTN4 conventional debris head loss that would occur for 23-inch and smaller breaks was determined by the result of PTN4 Full Debris Load Test 2, shown in bold text in Table 3.f.4-11.
Figure 3.f.7-1: Comparison between PTN4 Test and Plant Debris Loads
Updated Final Response to NRC Generic Letter 2004-02
Comparison of Plant and Head Loss Test Chemical Debris Loads Table 3.f.7-4 compares the maximum chemical debris loads of PTN4 (see the Response to 3.o.2.7.ii) with those used in the head loss tests (see the Response to 3.f.4). Table 3.f.7-4: Comparison of Plant and Test Chemical Debris Loads for PTN4
Region I Breaks
Plant
Chemical Debris Loads
PTN4 Full Debris Load
Test 1
PTN4 Full Debris Load
Test 2
PTN4 Thin-Bed
Test Total Aluminum Precipitated (kg)
341.7 66.81 66.81 41.11
As shown in the table, the full predicted chemical debris load at the plant was not matched during testing. As discussed in the Response to 3.f.4, chemical debris addition was terminated when it was confirmed that the last batch of debris had little impact to head loss and did not create any new head loss peaks, as shown in the recorded head loss data (see Figure 3.f.4-10, Figure 3.f.4-11, and Figure 3.f.4-12). Table 3.f.4-11 indicates that the PTN4 Full Debris Load Test 2 resulted in higher peak chemical debris head loss compared to the other two tests. Therefore, the maximum PTN4 chemical debris head loss that would occur for 23-inch and smaller breaks was determined by the result of PTN4 Full Debris Load Test 2, shown in bold text in Table 3.f.4-11. PTN4 Region II:
Table 3.f.7-6 compares the conventional debris loads of two PTN4 Region II bounding DEGBs with those used in the PBN head loss tests. The plant debris loads are described in the Response to 3.e.6 except for the unqualified coatings. The quantities of individual coating types were combined to determine the total volume of qualified coatings. The unqualified coatings quantities were determined by combining the volumes of all subtypes from Table 3.h.1-4 (converted from the mass values with margin). The total coatings particulate debris loads shown in Table 3.f.7-6 were calculated by combining the volumes of qualified coatings and unqualified coatings. The debris loads for PBN Full Debris Load Tests 1 and 2 and the PBN Thin-Bed Test were taken from the data in Table 3.f.4-13, Table 3.f.4-14, and Table 3.f.4-15, respectively.
E1-136
Enclosure 1 to FPL Letter L-2017-149
Updated Final Response to NRC Generic Letter 2004-02
Table 3.f.7-5: PTN4 Comparison of Test Conventional Debris Loads with Bounding DEGBs
Break Identifier Highest Fiber Break Highest Cal-Sil Break PBN Full
Debris Load Test 1
PBN Full Debris Load
Test 2
PBN Thin-Bed
Test Break Location 31-RCS-1402-5 31-RCS-1401-10
Location Description Loop B Crossover Leg at SG Nozzle
Loop A Crossover Leg at RCP
Nukon Fines (lbm) 207.2 129.5 243.2 137.6 117.3 Latent Fiber (lbm) 25.5 25.5 Temp-Mat Fines (lbm) 211.7 134.0 N/A N/A N/A Mineral Wool Fines (lbm) N/A N/A 195.9 134.8 114.9
Total Fiber Fines (lbm) 444.4 289.0 430.1 272.4 232.2
Updated Final Response to NRC Generic Letter 2004-02
As shown in Table 3.f.7-6, for the highest fiber 31” break, the total fiber debris load is slightly (<4%) higher than the fiber load of PBN Full Debris Load Test 1. Although the Cal-Sil load of PBN Full Debris Load Test 1 does not bound the highest fiber break, the test used a much larger (approximately 7 times) coatings particulate load. Considering that particulate debris (Cal-Sil and coatings) impact the head loss by filling up the voids inside the fiber bed, it is reasonable to conclude that the head loss of the PBN Full Debris Load Test 1 is applicable for the highest fiber 31” break.
Similarly, for the highest Cal-Sil break, the fiber load is slightly higher than those used for the PBN Full Debris Load Test 2 and PBN Thin-Bed Test. The break has more transported Cal-Sil than these two tests. However, the tests used much greater coatings particulate debris loads. Additionally, the Cal-Sil to fiber ratio for the PBN Thin-Bed Test (3.2) is slightly greater than the ratio of the highest Cal-Sil break (3.1). It is therefore expected that the measured head losses of the PBN Full Debris Load Test 2 and PBN Thin-Bed Test are applicable for the highest Cal-Sil 31” break at PTN4.
As shown in Table 3.f.4-16, the PBN Full Debris Load Test 2 resulted in a higher peak conventional debris head loss than the other two tests. This maximum value was used as the bounding conventional debris head loss for the PTN4 Region II breaks. The contribution to head loss due to chemical debris for the PTN4 Region II breaks was based on the PTN4 Full Debris Load Test 1, which resulted in the largest head loss increase after adding the chemical debris (0.39 psi). These debris head loss values for the PTN4 Region II breaks are summarized in Table 3.f.7-6. Note that the combined debris head loss was increased by 50% to account for the differences between the PBN testing parameters and PTN4 plant parameters.
Table 3.f.7-6: PTN4 Maximum Debris Head Loss for Region II Breaks Conventional
Debris (psi) Chemical
(psi) 50%
Margin (psi)
Conventional plus Chemical plus Margin
(psi) Region II
Head Loss 1.592 0.39 0.991 2.973
E1-138
Enclosure 1 to FPL Letter L-2017-149
Updated Final Response to NRC Generic Letter 2004-02
8. Describe significant margins and conservatisms used in head loss and vortexing calculations.
Response to 3.f.8:
PTN3 Response: Vortexing Evaluation PSL1 vortex testing was used to determine if vortexing is expected to occur at PTN3. As discussed in the Response to 3.f.3, the vortex tests were performed at both clean strainer and debris-laden conditions. The PSL1 clean strainer vortexing test used a strainer submergence of 1” and an average approach velocity of up to 0.00618 ft/s, and the debris-laden vortexing test used an average approach velocity of 0.0026 ft/s. This is conservative as a vortex is more prone to form at higher velocities and lower submergences. For comparison, the minimum SBLOCA submergence for PTN3’s strainer is 2.88”, and the average approach velocity during recirculation is 0.00171 ft/s. As shown in the Response to 3.f.3, plant strainer minimum submergence at the start of recirculation was compared with the submergence limit established by the debris-laden vortex tests. It should be noted that these tests were performed after all conventional and chemical debris has been added to the test tank. This is conservatively bounding because, at the start of recirculation, the strainer is expected to be clear of debris. Strainer Head Loss The quantity of latent debris used to determine the strainer head loss is 200 lbm, but the actual amount of latent debris documented for the plant is 77.2 lbm. Similarly, a sacrificial strainer area of 200 ft2 was used when determining the testing parameters. In reality, the reduction in strainer surface area due to blockage of miscellaneous debris is 70 ft2 (93.192 ft2 x 75%) (Reference 6 p. 49). The clean screen head loss (CSHL) was calculated for a strainer flow rate of 3,750 gpm. As discussed in the Response to 3.f.3, the maximum PTN3 strainer flow rate is 3,446 gpm. Using a higher flow rate to calculate CSHL is conservative because head loss increases with flow rate. As discussed in the Response to 3.f.7 (Table 3.f.7-1), the total quantities of conventional debris used for the PSL1 Thin-Bed Test are greater than the maximum amount of conventional debris calculated to transport to the strainer. As discussed in the Response to 3.f.7, the approach velocity used in the PSL1 Thin-Bed Test is greater than the plant strainer’s average approach velocities.
E1-139
Enclosure 1 to FPL Letter L-2017-149
Updated Final Response to NRC Generic Letter 2004-02
As discussed in the Response to 3.f.10, although the head loss test was performed at more conservative conditions (lower temperatures and higher flow rates) than those in the actual plant, head loss test data was not scaled to greater temperatures and lower flow rates for NPSH and flashing evaluations. The debris transport analysis conservatively predicted the quantity of material that would be transported to the strainer (see the Response to 3.e). Testing required extraordinary measures to ensure fine debris would be transported to the strainer during the test. The reality is that a large portion of the debris would never make it to the strainer due to agglomeration effects, the propensity for fiber to become wrapped around or entangled with plant equipment, and the settling of debris in low flow regions. PTN4 Response: Vortexing Evaluation Testing was conducted to determine if vortexing is expected to occur. As discussed in the Response to 3.f.3, the vortex tests were performed at both clean strainer and debris-laden conditions. All vortex tests used a strainer approach velocity of 0.00228 ft/s, which was based on a conservatively smaller strainer surface area by accounting for a sacrificial area of 200 ft2 for miscellaneous debris. The actual reduction in strainer surface area due to blockage by the miscellaneous debris is less than 100 ft2. This is conservative as a vortex is more prone to form at higher velocities. As shown in the Response to 3.f.3, plant strainer minimum submergence at the start of recirculation was compared with the submergence limit established by the debris-laden vortex tests. These tests were performed after all conventional and chemical debris had been added to the test tank. This is conservatively bounding because, at the start of recirculation, the strainer is expected to be clear of debris.
E1-140
Enclosure 1 to FPL Letter L-2017-149
Updated Final Response to NRC Generic Letter 2004-02
Strainer Head Loss The quantity of latent debris used to determine the strainer head loss is 200 lbm, but the actual amount of latent debris documented for the plant is 154.4 lbm. Similarly, a sacrificial strainer area of 200 ft2 was used when determining the testing parameters. In reality, the reduction in strainer surface area due to blockage of miscellaneous debris (with a total surface area of 116.5 ft2 determined from walkdowns is 87 ft2 (116.5 ft2 x 75%) (Reference 6 p. 49). The CSHL was calculated for a strainer flow rate of 3,750 gpm. As discussed in the Response to 3.f.3, the maximum PTN4 strainer flow rate is 3,446 gpm. Using a higher flow rate to calculate CSHL is conservative because head loss increases with flow rate. As discussed in the Response to 3.f.7 (Table 3.f.7-3), the total quantities of conventional debris used for the PTN4 full debris load tests are greater than the maximum amount of conventional debris calculated to transport to the sump for 23-inch and smaller breaks. As discussed in the Response to 3.f.7, the approach velocities used in the PTN4 head loss tests are greater than the plant strainer’s average approach velocities. As discussed in the Response to 3.f.9, in the PTN4 clean strainer head loss calculation, the head losses calculated for fittings were increased by 10% and the head loss calculated from the prototype testing data was increased by 6% to bound the uncertainties. As discussed in the Response to 3.f.10, although the head loss tests were performed at more conservative conditions (lower temperatures and higher flow rates) than those in the actual plant, head loss test data was not scaled to greater temperatures and lower flow rates for NPSH and flashing evaluations. The debris transport analysis conservatively predicted the quantity of material that would be transported to the strainer. Testing required extraordinary measures to ensure fine debris would be transported to the strainer during the test. The reality is that a large portion of the debris would never make it to the strainer due to agglomeration effects, the propensity for fiber to become wrapped around or entangled with plant equipment, and the settling of debris in low flow regions.
E1-141
Enclosure 1 to FPL Letter L-2017-149
Updated Final Response to NRC Generic Letter 2004-02
9. Provide a summary of methodology, assumptions, bases for the assumptions, and results for the clean strainer head loss calculation.
Response to 3.f.9: PTN3 Response: The PTN3 strainer circles a portion of the perimeter of containment in the sump. The strainer is divided into four sections, each composed of two to four strainer modules. The sections are connected in series by a 14” header pipe. The total strainer flow splits at a 14” tee into the suction piping for RHR Trains A and B. The strainer modules contain 10 to 28 stainless steel perforated disks mounted on plenums. The flow to each disk varies across each strainer section due to the internal strainer and plenum losses. The disk farthest from the plenum outlet receives the least amount of flow because the flow has to travel the length of the plenum and merge with the flow from the downstream disks. The flow rate and approach velocity of each disk was determined for several different flow cases. For each case, the strainer flow was distributed such that the head losses between all strainer disks and the 14” tee were equalized. This approach reflects the actual flow condition through the strainer, because water entering the strainer always follows the path with the least resistance. As a result, the disks that are closer to the 14” tee will have less hydraulic resistance due to a lower number of bends and merges, resulting in higher flow than the disk groups that are farther away from the 14” tee. An iterative head loss calculation for each disk group was performed using a system of simultaneously solved equations until the calculated head loss was balanced for each section by varying the flow rates of different sections. The solution process contains the following steps:
1. Model a disk using CFD software to determine the channel K factor for each prototypical disk design using the perforated plate and wire cloth K factors as inputs.
2. Develop a system of head loss expressions for the flow path of each disk group to the 14” tee as functions of disk group flow rates.
3. Estimate a value of the head loss to the 14” tee that is shared by all parallel flow paths through the disks to the 14” tee.
4. Adjust flow rates of all disk groups until the head loss between any disk group and the 14” tee converges to the acceptance criterion.
5. Calculate the total strainer flow rate by combining all of the disk flow rates and compare it with the target flow rate. If the difference is less than the acceptance criterion, the balancing calculation is finished. Otherwise, Steps 4 and 5 must be repeated with a new guessed value for the head loss to the 14” tee.
E1-142
Enclosure 1 to FPL Letter L-2017-149
Updated Final Response to NRC Generic Letter 2004-02
6. Determine the suction piping losses for each RHR train including the friction, bend, diverging tee, and bellows head losses from the 14” tee to the connection flanges at the containment penetrations. These are added to the head loss from the disks to the 14” tee to determine the CSHL for each RHR train.
7. Repeat Steps 3 through 6 for all flow cases, and apply second degree regression methodology with two independent variables (QA, flow rate through RHR Train A, and QB, flow rate through RHR Train B) to the CSHL values. Then, the coefficients for the CSHL correlations for RHR Trains A and B, as a function of flow rates to RHR Trains A and B, can be determined.
8. Repeat Steps 3 through 6 for all flow cases for the other two temperatures to determine the head loss for each temperature. Apply a quadratic regression line to determine coefficients for the temperature term.
For the solution process, the following acceptance criteria were imposed.
1. For all strainer disk groups, the head losses between any disk group and 14” tee must be equalized within 1%.
2. The total flow rate of all disks must be equalized to the desired total strainer flow rate within 1%.
A quadratic equation with the form shown below was used to determine the clean screen head loss of the PTN3 strainer:
( )( )254
2321
2210, BBAABACSHLL QbQQbQbQbQbTaTaah ++++++=
Where, T = Temperature of the containment sump, °F QA = Flow rate of Train A, gpm QB = Flow rate of Train B, gpm The correlation coefficients to solve the equation determined using the process described above are provided in Table 3.f.9-1 .
E1-143
Enclosure 1 to FPL Letter L-2017-149
Updated Final Response to NRC Generic Letter 2004-02
Table 3.f.9-1: PTN3 Clean Strainer Head Loss Correlation Equation Coefficients Temperature Coefficients Trains A and B Units
a0 1.036 - a1 -3.02E-04 °F-1
a2 5.95E-07 °F-2
Flow Coefficients Train A Train B Units b1 5.19E-06 1.95E-06 ft/gpm
The clean strainer head loss was determined to be 1.99 ft-H2O (or 0.83 psi) at 212 °F when the total strainer flow rate of 3,750 gpm is pumped through RHR Train B. This is greater than if the total strainer flow rate of 3,750 gpm was pumped through RHR Train A. PTN4 Response: The clean strainer head loss for PTN4 was calculated by the strainer vendor. The overall clean strainer head loss consists of head losses of the strainer modules (i.e., strainer disks and core tubes), the piping that connects the strainer modules to the suction plenum, and inside and exiting the plenum. These head losses were calculated separately. Clean strainer head loss test data, from a generic (non-plant specific) PCI prototype, was curve fit to a second-order polynomial function of the strainer’s core tube exit velocity. The function was used to calculate the head loss for the PTN4 strainer modules using the PTN4 core tube exit velocity. It should be noted that this test performed by the strainer vendor was not part of the debris laden head loss test program described in the rest of the Response to 3.f. Because the tested PCI prototype strainer has differences from that installed in PTN4, adjustments were made to account for the physical differences between the two designs. The PCI prototype clean strainer testing used an approach velocity higher than that of the PTN4 strainer design. Because head loss increases with approach velocity, the head loss through the PCI prototype strainer’s perforated plate was expected to be greater than that through the PTN4 strainer perforated plates. Therefore, for conservatism, no adjustment was made to the perforated plate head loss calculated from the PCI prototype test data.
E1-144
Enclosure 1 to FPL Letter L-2017-149
Updated Final Response to NRC Generic Letter 2004-02
The PCI prototype strainer had a core tube length of 54 inches, but the PTN4 strainer has a core tube length of 129.7 inches. The additional frictional head loss due to the longer length was calculated and added to the overall clean strainer head loss value. The Darcy-Weisbach equation, with head loss coefficients from standard hydraulic handbooks, was used to model the head losses for various fittings on the connection piping, and flow through and exiting the plenum box. Finally, the head loss was calculated from internal flow restrictions inside the disks caused by the reinforcing wires in the disks. To account for uncertainties, the calculated head loss for each component was increased by 10%, and the head loss determined from the PCI prototype test data was increased by 6%. All of these head losses (including the head loss due to flow from the plenum into the suction pipe) were summed to determine the maximum clean strainer head loss; 1.73 ft (or 0.73 psi) at 170 °F based on a total strainer flow rate of 3,750 gpm. 10. Provide a summary of methodology, assumptions, bases for the assumptions,
and results for the debris head loss analysis.
Response to 3.f.10:
The total strainer head loss was calculated by combining the debris head losses shown in the Response to 3.f.7 and the clean strainer head loss shown in the Response to 3.f.9. Refer to each individual section for the specific head loss value used. PTN3 Response: The total strainer head losses, used to evaluate ECCS and CS pump NPSH, void fraction, flashing, and strainer structural integrity for PTN3 are provided in Table 3.f.10-1.
Table 3.f.10-1: PTN3 Strainer Head Loss Clean Strainer
Head Loss (psi)
Debris Head Loss (psi)
Total Head Loss (psi)
Notes
0.83 0.35 1.18 Based on aluminum chemical debris head loss
It should be noted that the debris head losses were measured at conditions more conservative (lower temperature and higher flow rate) than the actual plant conditions. For conservatism, scaling was not used to adjust the head losses to actual plant conditions.
E1-145
Enclosure 1 to FPL Letter L-2017-149
Updated Final Response to NRC Generic Letter 2004-02
The clean strainer head loss was calculated at a temperature of 212 °F. The increase in head loss due to a reduction in temperature is negligible.
PTN4 Response: PTN4 Region I: The total strainer head losses, used to evaluate ECCS and CS pump NPSH, void fraction, flashing, and strainer structural integrity for PTN4 Region I breaks are provided in Table 3.f.10-2.
Table 3.f.10-2: PTN4 Strainer Head Losses for Region I Breaks Clean Strainer
Head Loss (psi)
Debris Head Loss
(psi)
Total Head Loss
(psi) Notes
0.73 1.058 1.79 Based on maximum conventional
debris head loss
1.370 2.10 Based on maximum aluminum chemical debris head loss
It should be noted that the debris head losses were measured at conditions more conservative (lower temperature and higher flow rate) than the actual plant conditions. For conservatism, scaling was not used to adjust the head losses to actual plant conditions. The clean strainer head loss was calculated at a temperature of 170° F. Variation in temperature has little impact on the clean strainer head loss, as demonstrated during the head loss testing. PTN4 Region II: The total strainer head losses, used to evaluate ECCS and CS pump NPSH, void fraction, flashing, and strainer structural integrity for PTN4 Region II breaks are provided in Table 3.f.10-3.
Table 3.f.10-3: PTN4 Strainer Head Losses for Region II Breaks Clean Strainer
Head Loss (psi)
Debris Head Loss
(psi)
Total Head Loss
(psi) Notes
0.73 2.973 3.70 Based on maximum aluminum chemical debris head loss
E1-146
Enclosure 1 to FPL Letter L-2017-149
Updated Final Response to NRC Generic Letter 2004-02
It should be noted that the debris head losses were measured at conditions more conservative (lower temperature and higher flow rate) than the actual plant conditions. For conservatism, scaling was not used to adjust the head losses to actual plant conditions. The clean strainer head loss was calculated at a temperature of 170 °F. Variation in temperature has little impact on the clean strainer head loss. 11. State whether the sump is partially submerged or vented (i.e., lacks a complete
water seal over its entire surface) for any accident scenarios and describe what failure criteria in addition to loss of net positive suction head (NPSH) margin were applied to address potential inability to pass the required flow through the strainer.
Response to 3.f.11:
As stated in the Response to 3.g.1, the PTN3 and PTN4 strainers remain fully submerged for all break sizes and the entire duration of sump recirculation. Therefore, no failure criteria other than loss of NPSH margin and strainer structural failure were considered. 12. State whether near-field settling was credited for the head-loss testing, and if so,
provide a description of the scaling analysis used to justify near-field credit.
Response to 3.f.12:
PTN3 Response: No near-field debris settling was credited for the PSL1 head loss test, and therefore the PTN3 application of the PSL1 results are acceptable. Sufficient turbulence was provided in the tank to ensure that all debris had an opportunity to suspend in the water column and transport to the test strainer. The level of turbulence was also controlled to avoid disturbing the debris bed formation. PTN4 Response: No near-field settling was credited in the PTN4 (Region I) or PBN (Region II) head loss testing. Sufficient turbulence was maintained in the mixing section of the test tank to ensure that all debris had an opportunity to collect on the surfaces of the test strainer. The turbulence was created by the flow exiting the discharge piping. The placement and size of the discharge piping was carefully chosen to achieve the desired level of turbulence in the test tank without disturbing the debris bed formed on the test strainer. Manual stirs were also applied as necessary.
E1-147
Enclosure 1 to FPL Letter L-2017-149
Updated Final Response to NRC Generic Letter 2004-02
13. State whether temperature/viscosity was used to scale the results of the head loss test to actual plant conditions. If scaling was used, provide the basis for concluding that boreholes or other differential-pressure induced effects did not affect the morphology of the test debris bed.
Response to 3.f.13:
As stated in the Response to 3.f.10, scaling was not used to adjust the measured debris head losses to actual plant conditions. 14. State whether containment accident pressure was credited in evaluating whether
flashing would occur across the strainer surface, and if so, summarize the methodology used to determine the available containment pressure.
Response to 3.f.14:
PTN3 Response:
The flashing analysis uses the minimum strainer submergence evaluated from the top of the strainer to the minimum sump pool water level. As shown in the Response to 3.g.1, the minimum strainer submergence is 4.8” (or rounded down to 0.17 psi) for an LBLOCA. The SBLOCA strainer submergence was not considered because the debris quantities, strainer head losses, and post-accident containment conditions for the smaller breaks are less limiting than the LBLOCAs.
As discussed in the Response to 3.f.10, the total strainer head loss is 1.18 psi.
The post-accident containment pressure can be expressed as the summation of saturation water pressure at the sump temperature (PVapor) plus air partial pressure (Pair).
Using the information presented above, the pressure downstream of the strainer during the recirculation phase can be calculated as follows:
In order to avoid flashing, the pressure downstream of the strainer (PStrainer) must be greater than the water vapor pressure at the sump temperature (PVapor). In other words, the post-accident air partial pressure (Pair) needs to be greater than 1.01 psi, as shown in the equation above.
E1-148
Enclosure 1 to FPL Letter L-2017-149
Updated Final Response to NRC Generic Letter 2004-02
Note that the air partial pressure prior to the accident is greater than 1.01 psi. For PTN3, the minimum normal operating containment pressure is -2.0 psig or 12.7 psia. The maximum normal operating containment temperature is 125 °F and the corresponding water vapor pressure is 1.942 psia. Assuming 100% relative humidity, the minimum air partial pressure prior to the accident is 10.7 psi (12.7 – 1.942 psi). Because this pre-accident air partial pressure is much higher than the 1.01 psi required, it is reasonable to conclude that flashing will not occur during the sump recirculation phase.
PTN4 Response:
Flashing would occur if the pressure downstream of the strainer was lower than the vapor pressure at the sump temperature. The pressure downstream of the strainer can be calculated by combining the strainer submergence and containment pressure before subtracting the strainer head loss.
The flashing analysis uses the minimum strainer submergence evaluated from the top of the strainer to the minimum sump pool water level. As shown in Section 3.g.1, the minimum strainer submergence is 1.17 ft (or approximately 0.5 psi) for an LBLOCA. The SBLOCA strainer submergence was not considered because the debris quantities, strainer head losses, and post-accident containment conditions for the smaller breaks are less limiting than the LBLOCAs.
PTN4 Region I:
As stated in the Response to 3.f.10, the maximum total strainer head loss for the Region I breaks is 2.10 psi. Note that although flashing is more likely to occur at higher sump temperatures, for conservatism, the head loss was not adjusted to the higher temperatures.
The post-accident containment pressure can be expressed as the summation of saturation water pressure at the sump temperature (PVapor) plus air partial pressure (Pair). Using the information presented above, the pressure downstream of the strainer during the recirculation phase can be calculated as follows:
In order to avoid flashing, the pressure downstream of the strainer (PStrainer) must be greater than the water vapor pressure at the sump temperature (PVapor). In other words, the post-accident air partial pressure needs to be greater than 1.6 psia, as shown in the equation above.
E1-149
Enclosure 1 to FPL Letter L-2017-149
Updated Final Response to NRC Generic Letter 2004-02
The air partial pressure prior to the accident is greater than 1.6 psia. For PTN4, the minimum normal operating containment pressure is -2 psig or 12.7 psia. The maximum normal operating containment temperature is 125 °F and the corresponding water vapor pressure is 1.942 psia. Assuming 100% relative humidity, the minimum air partial pressure prior to the accident is 10.75 psia (12.7 – 1.942 psi). Because this pre-accident air partial pressure is much higher than the 1.6 psia required, it is reasonable to conclude that flashing will not occur during the sump recirculation phase.
There are several conservatisms in this analysis:
1. The minimum strainer submergence at the start of recirculation is used. Any increase in sump pool level over time was conservatively neglected. Raising the minimum strainer submergence through use of a best estimate water level (18.37 ft. with 1.62 ft. of submergence) was not solely sufficient to preclude flashing. As such the minimum water level is used within the analysis alongside the pre-accident, initial containment air pressure as described in NEI 04-07 (Reference 10 p. 6−12).
2. The maximum strainer head loss, which includes the clean strainer, conventional debris, and chemical debris head loss, was used. The head losses calculated or measured at lower temperatures were not adjusted for temperature differences.
3. The most limiting pre-accident operating containment conditions were used: highest normal operating containment temperature and minimum normal operating containment pressure.
4. The increase in air partial pressure due to heat-up of the containment atmosphere following an accident was not credited.
E1-150
Enclosure 1 to FPL Letter L-2017-149
Updated Final Response to NRC Generic Letter 2004-02
PTN4 Region II:
Similar to Region I, the total strainer head loss for Region II was determined by combining the calculated clean strainer head loss and measured debris head loss. As shown in the Response to 3.f.10, the maximum total strainer head loss is 3.70 psi for the PTN4 Region II breaks.
Using the information presented above, the pressure downstream of the strainer during the recirculation phase can be calculated as follows:
As calculated for Region I, the minimum air partial pressure prior to the accident is 10.75 psia. Because this pre-accident, initial air partial pressure is much higher than the 3.2 psia required, it is reasonably concluded that flashing will not occur during the sump recirculation phase following a Region II break.
E1-151
Enclosure 1 to FPL Letter L-2017-149
Updated Final Response to NRC Generic Letter 2004-02
3.g. Net Positive Suction Head
The objective of the NPSH section is to calculate the NPSH margin for the ECCS and CSS pumps that would exist during a loss-of-coolant accident (LOCA) considering a spectrum of break sizes.
1. Provide applicable pump flow rates, the total recirculation sump flow rates, sump temperature(s), and minimum containment water level.
Response to 3.g.1:
PTN3 and PTN4 Pump and Sump Flow Rates Following an LBLOCA both trains of the RHR pumps and HHSI pumps are automatically started on a safety injection (SI) signal. Additionally, both HHSI pumps from the unaffected unit will also be automatically started. If at least two HHSI pumps of the affected unit are not running, operators procedurally verify the unaffected unit’s HHSI pumps are injecting. If both of the affected unit’s HHSI pumps are running and injecting, then the operators procedurally stop both of the unaffected unit’s HHSI pumps and place them in standby. Both CS pumps are automatically started on a containment high pressure signal (CHPS). Recirculation is initiated manually on the RWST low level alarm, which occurs approximately 30 minutes after the LBLOCA. At the changeover to recirculation both RHR pumps are manually stopped and switched over from the RWST to the recirculation sump. One RHR pump is then manually restarted. At this point, the operating CS and HHSI pumps continue to draw water from the RWST. When the RWST level reaches 60,000 gallons, the operating HHSI and CS pumps are manually stopped and aligned to take suction from the RHR pumps ("piggyback" mode), and two HHSI pumps and one CS pump are restarted. Two HHSI pumps are required to be injecting for 14 hours from event initiation. After 14 hours, one HHSI can be secured. Following an SBLOCA greater than the capacity of normal charging, both trains of the RHR pumps and HHSI pumps, and the unaffected unit’s HHSI pumps would automatically start upon receipt of a SI signal. Both CS pumps would automatically start if a CHPS is received. When the recirculation phase is entered, suction to the HHSI pumps is provided by the RHR pumps. Under these conditions the time to recirculation, which is based on the RWST level, is increased beyond the LBLOCA value of approximately 30 minutes (Reference 19 p. Attachment 2 pg 22).
E1-152
Enclosure 1 to FPL Letter L-2017-149
Updated Final Response to NRC Generic Letter 2004-02
Multiple pump alignment cases were analyzed for NPSH margin during the recirculation phase following an LBLOCA. The following three cases are the limiting alignment cases. The total flow rates for each case are as shown:
• Case A, Piggy-back Cold Leg Recirculation: 3,446 gpm • Case B, Normal Hot Leg Recirculation: 3,270 gpm • Case C, Alternate Hot Leg Recirculation: 3,358 gpm
For each of these cases, one RHR pump and one CS pump is running. Case A and B have two HHSI pumps running, while Case C has one HHSI pump running. Pump alignment for each case is discussed in the Response to 3.g.6. Case C is the bounding case for alternate hot leg recirculation alignments that are performed per emergency operating procedures. PTN3 Minimum Containment Water Level The containment water level calculation evaluated bounding minimum sump pool volumes and levels, which were used as inputs in the vortexing evaluation (see the Response to 3.f.3) and chemical precipitate debris calculation (see the Response to 3.o.1). Table 3.g.1-1 summarizes the results of the containment water level calculation. The pool floor elevation is 14 ft, and the height of the PTN3 strainers is 32.25 inches. The pool height values in Table 3.g.1-1 were calculated by subtracting the pool floor elevation from the water level elevations. The submergence values in Table 3.g.1-1 were calculated by subtracting the strainer height from the pool heights.
Table 3.g.1-1: PTN3 Minimum Sump Pool Water Levels
Break Size
Break Elevation
Minimum Water Level Elevation
(ft)
Pool Height
(ft)
Strainer Submergence
(ft)
SBLOCA At the top of the pressurizer 16.93 2.93 0.24
SBLOCA Elevation of the
centerline of the hot legs
16.98 2.98 0.29
LBLOCA At the top of the pressurizer 17.09 3.09 0.40
LBLOCA Elevation of the
centerline of the hot legs
17.95 3.95 1.26
E1-153
Enclosure 1 to FPL Letter L-2017-149
Updated Final Response to NRC Generic Letter 2004-02
PTN4 Minimum Containment Water Level The containment water level calculation evaluated bounding minimum sump pool volumes and levels, which were used as inputs in the vortexing evaluation (see the Response to 3.f.3) and chemical precipitate debris calculation (see the Response to 3.o.1). Table 3.g.1-2 summarizes the results of the containment water level calculation. The pool floor elevation is 14 ft, and the height of the PTN4 strainers is 33 inches. The pool height values in Table 3.g.1-2 were calculated by subtracting the pool floor elevation from the water level elevations. The submergence values in Table 3.g.1-2 were calculated by subtracting the strainer height from the pool heights.
Table 3.g.1-2: PTN4 Minimum Sump Pool Water Levels
Break Size
Break Elevation
Minimum Water Level Elevation
(ft)
Pool Height
(ft)
Strainer Submergence
(ft)
SBLOCA At the top of the pressurizer 16.92 2.92 0.17
SBLOCA Elevation of the
centerline of the hot legs
16.96 2.96 0.21
LBLOCA At the top of the pressurizer 17.07 3.07 0.32
LBLOCA Elevation of the
centerline of the hot legs
17.92 3.92 1.17
PTN3 and PTN4 Sump Temperature For all cases analyzed for NPSH margin, the sump temperature was set to a maximum of 212 °F. See the Response to 3.g.2 for additional details on sump temperature assumptions.
E1-154
Enclosure 1 to FPL Letter L-2017-149
Updated Final Response to NRC Generic Letter 2004-02
2. Describe the assumptions used in the calculations for the above parameters and the sources/bases of the assumptions.
Response to 3.g.2:
PTN3 Pump and Sump Flow Rate
The following assumptions were made in association with flow rates for the NPSH margin calculation:
• The HHSI pumps at PTN3 can be shared between the two units through the use of cross-connecting piping sections. Because there is a cross-connection on the suction and discharge sides of the HHSI pumps, it was assumed that any of the HHSI pumps can draw suction from either RWST and can supply discharge flow to either unit’s RCS. Additionally, it was assumed that the RHR pumps can draw suction from the sump and recirculate that flow through any of the HHSI pumps back to the RCS cold legs or hot legs.
• For all recirculation alignment cases, it was assumed that suction of each pump train draws from the opposite side ECCS suction inlet of the strainer sump. For example, RHR 3B draws suction from the south sump on the other side of the reactor cavity wall, and RHR 3A draws suction from the north sump (see the Response to 3.j.1 for the strainer configuration). This assumption maximizes the pressure drop from the sump to the suction of the pump by selecting the longest and most torturous path possible.
• Pumps were assumed to be operating at their maximum pump curve flow rate during the recirculation phase.
PTN4 Pump and Sump Flow Rate
The following assumptions were made in association with flow rates for the NPSH margin calculation:
• The HHSI pumps at PTN4 can be shared between the two units through the use of cross-connecting piping sections. Because there is a cross-connection on the suction and discharge sides of the HHSI pumps, it was assumed that any of the HHSI pumps can draw suction from either RWST and can supply discharge flow to either unit’s RCS. Additionally, it was assumed that the RHR pumps can draw suction from the sump and recirculate that flow through any of the HHSI pumps back to the RCS cold legs or hot legs.
E1-155
Enclosure 1 to FPL Letter L-2017-149
Updated Final Response to NRC Generic Letter 2004-02
• For all recirculation alignment cases, it was assumed that suction of each pump train draws from the opposite side ECCS suction inlet of the strainer sump. For example, RHR 4B draws suction from the south sump on the other side of the reactor cavity wall, and RHR 4A draws suction from the north sump (see the Response to 3.j.1 for the strainer configuration). This assumption maximizes the pressure drop from the sump to the suction of the pump by selecting the longest and most torturous path possible.
• Pumps were assumed to be operating at their maximum pump curve flow rate during the recirculation phase.
• It was assumed that the results obtained from the PTN3 Fathom model, which are based on PTN3 piping data, are also applicable to PTN4. Fathom is a pipe flow software that models piping systems and performs a hydraulic analysis. Typical outputs of these models are flow rates, temperatures, and head losses at each component and for the entire system. This assumption is necessary because a separate PTN4 Fathom model does not exist. However, the two HHSI pumps from PTN4 are modeled in the PTN3 model to allow the capability to run all 4 HHSI pumps in the same alignment. This is a reasonable assumption because the component layout and performance of the two units are very similar, and there are only minor piping layout differences between the two units.
PTN3 and PTN4 Minimum Containment Water Level The significant assumptions used to determine the minimum containment water level are listed as follows.
1. The CAD model is not all-inclusive. That is, various mechanical items were not modeled (e.g., vents, equipment supports, annulus piping, etc.). This is conservative since the pool level, as a function of pool volume, would be higher if additional components were modeled.
2. The density of the inventory of the RWST, RCS, and accumulators was assumed to be the same density as pure water. This is a reasonable assumption because the nominal concentration of boric acid in these water volumes is small.
3. It was assumed that the bounding containment pressure, temperature, and sump water temperature values are applicable to all classes of LOCAs. This is a reasonable assumption when used to calculate the density of the post-LOCA pool inventory and the vapor in containment hold-up, as the pressure and temperatures are expected to be considerably elevated for all LOCA sizes.
E1-156
Enclosure 1 to FPL Letter L-2017-149
Updated Final Response to NRC Generic Letter 2004-02
4. The inventory of the RCS was assumed to remain relatively constant throughout the operating cycle. This is a reasonable assumption because the RCS is a fixed volume that remains at constant temperature and pressure during full power operation, and any variation in the RCS liquid volume is negligible, considering the magnitude of the RCS liquid volume compared to the RWST liquid volume.
5. The accumulators were assumed not to inject for the SBLOCA cases. This is a reasonable assumption since the accumulator injection pressure is set such that injection only occurs at significant RCS depressurization. Such depressurization would only occur due to a medium-break LOCA (MBLOCA), LBLOCA, or prolonged Small-Small/Small Break. This assumption leads to a slightly lower containment pool elevation in the SBLOCA case.
6. It was assumed that MBLOCAs and LBLOCAs will result in full depressurization of the RCS; therefore, during recirculation, the RCS will retain water up to the elevation of the break.
7. It was assumed that when the SI pumps are stopped (at the RWST low-low level) no additional RWST inventory is transferred to containment. This reduces the volume of water injected into containment from the RWST, thereby reducing the containment water level.
8. For determining the amount of inventory held up as steam in the containment atmosphere, the pre-LOCA mass of steam was subtracted from the post-LOCA mass of steam. The pre-LOCA mass of steam was determined to be 0 lbm by assuming a humidity of 0%, and the post-LOCA mass of steam was determined by assuming a humidity of 100%. This is conservative, since it maximizes the atmospheric steam hold-up, thereby reducing the pool water level.
9. It was assumed that the floor drains of the RFC remain unclogged by debris post-LOCA. This is an acceptable assumption based on the experimental results, which showed that clogging the drain at either PTN3 or PTN4 is not plausible.
PTN3 Sump Temperature The following assumptions were made in association with sump temperature for the NPSH margin calculation:
• The maximum sump temperature was assumed to be 212 °F corresponding to a 0 psig containment pressure, even though a maximum sump temperature of 300 °F is the saturation temperature that corresponds to the PTN3 containment design pressure (55 psig). However, beyond the relationship of fluid properties at the containment design conditions, there is no significance to the assumed sump temperature, since no credit was taken for containment accident pressure at any sump temperatures, and the containment pressure was assumed to be equal to water vapor pressure at the sump temperature.
E1-157
Enclosure 1 to FPL Letter L-2017-149
Updated Final Response to NRC Generic Letter 2004-02
PTN4 Region I Sump Temperature The following assumptions were made in association with sump temperature for the NPSH margin calculation:
• The maximum sump temperature was assumed to be 212 °F corresponding to a 0 psig containment pressure, even though a maximum sump temperature of 300 °F is the saturation temperature that corresponds to the PTN4 containment design pressure (55 psig). However, beyond the relationship of fluid properties at the containment design conditions, there is no significance to the assumed sump temperature, since no credit was taken for containment accident pressure at any sump temperatures, and the containment pressure was assumed to be equal to water vapor pressure at the sump temperature.
PTN4 Region II Sump Temperature The following assumptions were made in association with sump temperature for the NPSH margin calculation:
• The maximum sump temperature was assumed to be 212 °F corresponding to a 0 psig containment pressure, even though a maximum sump temperature of 300 °F is the saturation temperature that corresponds to the PTN4 containment design pressure (55 psig). However, beyond the relationship of fluid properties at the containment design conditions, there is no significance to the assumed sump temperature, since no credit was taken for containment accident pressure at any sump temperatures, and the containment pressure was assumed to be equal to water vapor pressure at the sump temperature.
• Initial air partial pressure prior to a LOCA was credited for Region II breaks. It was conservatively assumed that the air partial pressure does not increase as containment temperature increases following a LOCA.
E1-158
Enclosure 1 to FPL Letter L-2017-149
Updated Final Response to NRC Generic Letter 2004-02
3. Provide the basis for the required NPSH values, e.g., 3 percent head drop or other criterion.
Response to 3.g.3:
The curve for NPSHr supplied by Ingersoll Rand for the RHR pumps was based on 3% pump head loss degradation. The RHR pumps provide the suction to the HHSI and CS pumps during recirculation. The NPSHr for the HHSI pump at runout is 30 ft. The NPSHr for the CS pump at runout is 35 ft. The RHR pump head at runout is 165 ft., which is well in excess of the NPSHr for these pumps. The suction pressure supplied to the HHSI and CS pumps during recirculation is sufficient to account for a 3% pump head loss degradation for the NPSH required for these pumps (Reference 20 p. 60; 21 p. 56). 4. Describe how friction and other flow losses are accounted for.
Response to 3.g.4:
Friction losses were calculated and included in the NPSH margin for all piping and equipment from the sump strainers to the inlet of the ECCS and CS pumps. Friction loss data was input into a Fathom hydraulic model, which uses the Colebrook-White equation to iterate the friction factor. The Fathom hydraulic model calculates the head losses of the components (e.g., valves, elbows, reducers, and tee junctions) on the pump suction piping using the loss coefficients from standard industry handbooks.
For all alignment cases, a global resistance reduction factor of 0.8 was applied to all pipes, junctions, and valves in the Fathom model, excluding the miniflow lines, which have generic loss values assigned to the system components. This was determined to be appropriate based on a comparison of the system resistance values calculated from plant test data to the system resistance values calculated using standard losses from fluid handbooks.
Strainer losses were calculated as part of the clean screen head loss evaluation (see the Response to 3.f.9). Debris head loss values were calculated through strainer testing with debris beds, which include both fibrous, particulate and chemical debris. See the Response to 3.f.4 for additional details on debris head loss.
5. Describe the system response scenarios for LBLOCA and SBLOCAs.
Response to 3.g.5:
See the Response to 3.g.1.
E1-159
Enclosure 1 to FPL Letter L-2017-149
Updated Final Response to NRC Generic Letter 2004-02
6. Describe the operational status for each ECCS and CSS pump before and after the initiation of recirculation.
Response to 3.g.6:
Prior to the initiating event, the ECCS and CS pumps will be in a state of stand-by readiness. RHR Pumps In the event of a LOCA, both trains of the RHR pumps are automatically started on a SI signal. At the changeover to recirculation both RHR pumps are manually stopped and switched over from the RWST to the recirculation sump. One RHR pump is then manually restarted. HHSI Pumps In the event of a LOCA, both HHSI pumps start automatically on receipt of an SI signal. During the injection phase, these pumps take suction from the RWST and deliver water to the RCS cold legs. If at least two HHSI pumps of the affected unit are not running, operators verify that the unaffected unit’s HHSI pumps are providing injection such that two HHSI pumps are injecting. If the unaffected unit’s HHSI pump(s) are being used to meet the two HHSI pump injecting requirement, the operators are procedurally directed to align the unaffected unit’s HHSI pumps to inject into the affected unit, while drawing from the affected unit’s RWST. When the RWST level reaches 60,000 gallons the HHSI pumps are manually stopped and aligned to take suction from the RHR pump ("piggyback" mode). CS Pumps Both CS pumps are automatically started on a CHPS. This signal starts the CS pumps and opens the discharge valves to the spray headers. During the injection phase, the CS pumps take suction from the RWST. At the changeover to recirculation, the CS pumps continue to draw water from the RWST, but one CS pump is manually stopped. When the RWST level reaches 60,000 gallons, the operating CS pump is manually stopped and aligned to take suction from the RHR pump ("piggyback" mode). The operational status described above is the typical status of the ECCS and CS pumps. They can also be aligned in other configurations. The following three alignments are the bounding cases analyzed for NPSH margin. Case A – Piggy-back Cold Leg Recirculation One RHR pump draws from the sump and provides flow to two HHSI pumps and one CS pump. The two HHSI pumps then deliver flow to three cold legs. This recirculation alignment may be entered any time after the RWST reaches the low-low level setpoint. It is assumed that this alignment will be reached exactly when the RWST is empty to provide continuous spray flow.
E1-160
Enclosure 1 to FPL Letter L-2017-149
Updated Final Response to NRC Generic Letter 2004-02
Case B – Normal Hot Leg Recirculation The normal hot leg recirculation alignment is a piggy-back alignment with one RHR pump taking suction from the containment sump and providing flow to two HHSI pump and one CS pump. On the discharge side of the HHSI pumps, the cold leg injection isolation valves are closed and the hot leg injection isolation valves are opened and the HHSI pump flow is delivered to two of the three hot legs. Case C – Alternate Hot Leg Recirculation Alignment In this alignment, one RHR pump takes suction from the sump and delivers flow to hot leg C, and provides piggy-back recirculation flow to one CS pump and one HHSI pump. The HHSI pump then delivers flow to the three cold legs. The RHR cold leg injection isolation valves are closed so that the RHR pump does not inject directly to the cold legs. 7. Describe the single failure assumptions relevant to pump operation and sump
performance.
Response to 3.g.7:
The limiting single failure assumed in the analysis is the loss of an entire safeguards train, such that the ECCS flow only includes one RHR pump and two SI pumps. Two SI pumps are credited due to the cross-tie line between PTN3 and PTN4. With offsite power available, all active containment heat removal systems are assumed to operate, with the shortest delay (i.e., no emergency diesel start time). This single failure scenario does not result in conflicts with the existing cases run in calculating NPSH.
E1-161
Enclosure 1 to FPL Letter L-2017-149
Updated Final Response to NRC Generic Letter 2004-02
8. Describe how the containment sump water level is determined.
Response to 3.g.8:
The water volume calculation used the methodology described below when calculating the minimum containment sump water level: 1. A correlation was first developed for the relationship between the containment
water level and the water volume using a 3D CAD model. 2. The quantity of water added to containment from the RWST, RCS, and
accumulators was calculated. 3. The quantity of water that is diverted from the containment sump by the following
effects was evaluated: • Water volume required to fill the CS discharge piping that is empty pre-
LOCA. • Water in transit from the containment spray nozzles to the containment
floor. • Water held-up on containment surfaces exposed to containment spray
and steam condensation. • Steam held-up in the containment atmosphere. • RCS re-flood hold-up (filling the steam space). • Water held-up in the pressurizer compartment. • The reactor cavity was modeled in the 3D CAD model, effectively acting
as a hold-up volume by influencing the correlation between the water volume and water level.
4. Given the net mass of water added to the containment floor based on Items 2 and 3 listed above, the post-LOCA containment water level is calculated using the correlation developed in Item 1.
The calculation determined bounding minimum containment water levels for LBLOCAs and SBLOCAs using break size-specific injection volumes and hold-up volumes. This calculation provided inputs for evaluating chemical precipitate debris quantities and vortexing.
9. Provide assumptions that are included in the analysis to ensure a minimum (conservative) water level in determining NPSH margin.
Response to 3.g.9:
The assumptions provided in the Response to 3.g.2 ensure that minimum (conservative) containment water levels were calculated in the containment water volume calculation.
E1-162
Enclosure 1 to FPL Letter L-2017-149
Updated Final Response to NRC Generic Letter 2004-02
10. Describe whether and how the following volumes have been accounted for in pool level calculations: empty spray pipe, water droplets, condensation, and holdup on horizontal and vertical surfaces. If any are not accounted for, explain why.
Response to 3.g.10:
As described in the Response to 3.g.8, the following volumes were treated within the water volume calculation as hold-up volumes that remove water from the containment pool: CS discharge piping (initially empty spray piping), water droplets in transit from the containment spray nozzles, water droplets on containment surfaces formed from exposure to containment spray and steam condensation, and steam hold-up in the containment atmosphere.
11. Provide assumptions (and their bases) as to what equipment will displace water resulting in higher pool level.
Response to 3.g.11:
The volumes occupied by structures, equipment, and equipment supports, etc. will displace water and result in a higher pool level. Examples such as concrete, piping, insulation, and cable trays will displace water. These volumes were accounted for in the containment water volume calculation. The 3D CAD model of containment was used to determine the correlation between the containment pool volume and water level. Smaller equipment, cables, and instruments were excluded from the CAD model and therefore provide some conservatism in the resulting water levels, as stated in the Response to 3.g.2.
E1-163
Enclosure 1 to FPL Letter L-2017-149
Updated Final Response to NRC Generic Letter 2004-02
12. Provide assumptions (and their bases) as to what water sources provide pool volume and how much volume is from each source.
Response to 3.g.12:
The following design inputs provided the basis for the water sources and their volumes to determine the minimum containment water level:
• The TS minimum initial RWST level was used for the initial RWST water level. The low-low level (plus an amount to account for instrument uncertainty) was used for the final RWST water level. The minimum RWST injection volume is 253,869 gal.
• The minimum combined volume of the accumulators is 19,569 gal. This volume is not credited in the SBLOCA cases because the RCS pressure was assumed to remain above their injection pressure as stated in the Response to 3.g.2.
• The inventory of the RCS was assumed to remain relatively constant during normal operations. This is a reasonable assumption because during full power operation, the RCS remains at a fixed volume and remains at constant temperature and pressure. Due to the small volume of the RCS as compared to the RWST and its negligible variation in water volume (as noted in Assumption 4 of the Response to 3.g.2), a best estimate value is representative. The best estimate RCS liquid volume is 65,174 gal. The RCS represents both a source of water and a hold-up volume. The mass of water held up in the RCS may be more or less than the initial RCS mass depending on the elevation of the break.
• Note that the masses of the above sources of water were conservatively calculated (with their respective densities based upon their respective temperatures) to minimize the injection of water into containment; thereby, minimizing the pool level.
13. If credit is taken for containment accident pressure in determining available
NPSH, provide description of the calculation of containment accident pressure used in determining the available NPSH.
Response to 3.g.13:
No credit was taken for containment accident pressure at PTN3 or PTN4. See the Response to 3.g.14.
E1-164
Enclosure 1 to FPL Letter L-2017-149
Updated Final Response to NRC Generic Letter 2004-02
14. Provide assumptions made which minimize the containment accident pressure and maximize the sump water temperature.
Response to 3.g.14:
PTN3 Containment Pressure
Containment accident pressure was not credited in determining available NPSH. 0 psig containment pressure was assumed for all cases and vapor pressure was set equal to atmospheric pressure for all cases.
PTN4 Region I Containment Pressure
Containment accident pressure was not credited in determining available NPSH. 0 psig containment pressure was assumed for all cases and vapor pressure was set equal to atmospheric pressure for all cases.
PTN4 Region II Containment Pressure
Containment accident pressure was not credited in determining available NPSH, but containment air pressure prior to a LOCA was credited. It is reasonable to assume that the total pressure in containment is the sum of the partial pressure of water vapor corresponding to the sump saturation pressure, and the dry air partial pressure which remains constant at the pre-accident value (Reference 10 pp. 6-10 – 6-13). The dry air pressure prior to the event was calculated assuming 100% relative humidity at a containment temperature corresponding to the maximum normal operational temperature experienced at the plant. The recognition of the pre-event air pressure acknowledges the thermal-hydraulic condition of containment prior to the event without crediting containment overpressure based on the accident scenarios. Use of best estimate water level (18.37 ft.) would not preclude the need for initial, pre-accident containment air pressure.
PTN3 and PTN4 Sump Temperature
Assumptions to maximize sump temperature are found in the Response to 3.g.2.
15. Specify whether the containment accident pressure is set at the vapor pressure corresponding to the sump liquid temperature.
Response to 3.g.15:
See the Response to 3.g.14.
E1-165
Enclosure 1 to FPL Letter L-2017-149
Updated Final Response to NRC Generic Letter 2004-02
16. Provide the NPSH margin results for pumps taking suction from the sump in recirculation mode.
Response to 3.g.16:
PTN3 NPSH Margin Results
Table 3.g.16-1 provides a summary of the minimum NPSH margins for the RHR pumps in recirculation mode for the three previously described cases (see Response to 3.g.6). The total strainer head losses include the clean strainer head loss, conventional debris (particulate and fiber) head loss, and chemical debris head loss as appropriate. Bounding head loss values, as given in the Response to 3.f.10, were used in the evaluation. As shown in Table 3.g.16-1, the minimum NPSH margin for any given case is positive. Therefore, adequate NPSH margin is available for the PTN3 ECCS pumps to ensure their design functions.
Table 3.g.16-1: PTN3 Limiting NPSH Margin
Case Case Names NPSH Margin
Before Strainer Head Losses
(ft)
NPSH Margin After Strainer
Head Losses (ft)
A RHR Piggy-back Cold Leg Recirculation 5.05 2.24
B Normal Hot Leg Recirculation 6.55 3.74
C Revised Alternate Hot Leg Recirculation 5.85 3.04
PTN4 Region I NSPH Margin Results
Table 3.g.16-2 provides a summary of the minimum NPSH margins for the RHR pumps in recirculation mode for the three previously described cases (see Response to 3.g.6). The total strainer head losses include the clean strainer head loss, conventional debris (particulate and fiber) head loss, and chemical debris head loss as appropriate. Bounding head loss values, as given in the Response to 3.f.10, were used in the evaluation. For Region I, debris head losses were derived from LOCA breaks up to 23 inches. As shown in Table 3.g.16-2, the minimum NPSH margin for any given case is positive. Therefore, adequate NPSH margin is available for the PTN4 ECCS pumps to ensure their design functions, after a Region I break.
Table 3.g.16-2: PTN4 Region I Limiting NPSH Margin
Case Case Names NPSH Margin
Before Strainer Head Losses
(ft)
NPSH Margin After Strainer
Head Losses (ft)
E1-166
Enclosure 1 to FPL Letter L-2017-149
Updated Final Response to NRC Generic Letter 2004-02
Case Case Names NPSH Margin
Before Strainer Head Losses
(ft)
NPSH Margin After Strainer
Head Losses (ft)
A RHR Piggy-back Cold Leg Recirculation 5.02 0.09
B Normal Hot Leg Recirculation 6.52 1.59
C Revised Alternate Hot Leg Recirculation 5.82 0.89
PTN4 Region II NSPH Margin Results
Table 3.g.16-3 provides a summary of the minimum NPSH margins for the RHR pumps in recirculation mode for the three previously described cases (see Response to 3.g.6). Note that NPSH margin for PTN Region II credits pre-accident, initial containment air pressure (see the Response to 3.g.14). The total strainer head losses include the clean strainer head loss, conventional debris (particulate and fiber) head loss, and chemical debris head loss as appropriate. Bounding head loss values, as given in the Response to 3.f.10, were used in the evaluation. For Region II, debris head losses were derived from LOCA breaks larger than 23 inches. As shown in Table 3.g.16-3, the minimum NPSH margin for any given case is positive. Therefore, adequate NPSH margin is available for the PTN4 ECCS pumps to ensure their design functions for a Region II break.
Table 3.g.16-3: PTN4 Region II Limiting NPSH Margin
Case Case Names NPSH Margin
Before Strainer Head Losses
(ft)
NPSH Margin After Strainer Head Losses
(ft)
A RHR Piggy-back Cold Leg Recirculation 30.08 21.41
B Normal Hot Leg Recirculation 31.58 22.91
C Revised Alternate Hot Leg Recirculation 30.88 22.21
E1-167
Enclosure 1 to FPL Letter L-2017-149
Updated Final Response to NRC Generic Letter 2004-02
3.h. Coatings Evaluation
The objective of the coatings evaluation section is to determine the plant-specific ZOI and debris characteristics for coatings for use in determining the eventual contribution of coatings to overall head loss at the sump screen.
1. Provide a summary of type(s) of coating systems used in containment, e.g., Carboline CZ 11 Inorganic Zinc primer, Ameron 90 epoxy finish coat.
Response to 3.h.1:
The types of coating and systems used in PTN3 and PTN4 are presented in Table 3.h.1-1 and Table 3.h.1-2, respectively.
Qualified Coatings Table 3.h.1-1: PTN3 Qualified Coatings Systems Used in Debris Generation
Analyses
Substrate Type DFT* (mil)
Density (lbm/ft³)
Steel Surfaces Carboguard 890N 12 109.0
Concrete Surfaces Carboguard 890N 12 109.0
*DFT – Dry Film Thickness
Table 3.h.1-2: PTN4 Qualified Coatings Systems Used in Debris Generation Analyses
Substrate Type DFT* (mil)
Density (lbm/ft³)
Steel Surfaces Carboguard 890N 12 109.0
Concrete Surfaces Carboguard 890N 12 109.0
*DFT – Dry Film Thickness
E1-168
Enclosure 1 to FPL Letter L-2017-149
Updated Final Response to NRC Generic Letter 2004-02
Unqualified Coatings
Unqualified coatings are those that fail under design basis accident conditions and create debris that could be transported to the containment recirculation strainers. There are unqualified epoxy coatings applied over numerous substrates within containment. The quantity and properties of these unqualified coatings are shown in Table 3.h.1-3 for PTN3 and Table 3.h.1-4 for PTN4.
Table 3.h.1-3: PTN3 Unqualified Coatings Properties and Quantities Used in Debris Generation Analyses
Updated Final Response to NRC Generic Letter 2004-02
2. Describe and provide bases for assumptions made in post-LOCA paint debris transport analysis.
Response to 3.h.2:
The following assumptions related to coatings were made in the PTN3 and PTN4 debris transport analyses:
• It was conservatively assumed that all unqualified coatings are located in lower containment. This is conservative since it results in 100% of unqualified coatings being present in the pool at the start of recirculation and results in 100% transport of this debris type.
• It was assumed that the settling velocity of particulate debris (insulation, dirt/dust, and coatings) can be calculated using Stokes’ Law. This is a reasonable assumption since the particulate debris is generally spherical, small in size, and would settle slowly (within the applicability of Stokes’ Law). This assumption has been addressed in the San Onofre (Reference 22) and Indian Point (Reference 23) Audit Reports, and it has been concluded that it is not a significant factor with respect to debris transport since no credit is taken for debris settling using this approach.
• Unqualified coatings outside the ZOI were assumed to fail after pool fill has occurred, so the transport fraction for this debris during pool fill is 0%.
• It was assumed that the unqualified and degraded qualified coatings debris would be uniformly distributed in the recirculation pool. This is a reasonable assumption since these coatings are scattered around containment in small quantities.
3. Discuss suction strainer head loss testing performed as it relates to both qualified and unqualified coatings. Identify surrogate material and what surrogate material was used to simulate coatings debris.
Response to 3.h.3:
Recent head loss testing was not performed for PTN3. PSL1 head loss testing data is being used for PTN3. The PSL1 testing used pulverized acrylic as a surrogate for failed coatings (epoxy, enamel, inorganic zinc, and cold galvanizing) on an equal volume basis, and had a median size of 12.7 µm. See the Response to 3.f for detailed information on PSL1 head loss testing and its applicability to PTN3.
E1-170
Enclosure 1 to FPL Letter L-2017-149
Updated Final Response to NRC Generic Letter 2004-02
For the PTN4 Region I breaks, the head loss testing used silica flour with a mean size of 13.4 microns as a surrogate for failed coatings. For the PTN4 Region II breaks, the PBN conventional debris head loss data was used. The PBN testing used silica flour, with a median size of approximately 13.5 microns, as a surrogate for qualified coatings, unqualified coatings, and the fine particle portion of the actively delaminating qualified coatings. Pressure washed paint chips, with a nominal size of approximately 0.125”, were used as a surrogate to model the flat small chip portion of the actively delaminating qualified coatings. See the Response to 3.f for detailed information on PBN head loss testing and its applicability to PTN4. 4. Provide bases for the choice of surrogates.
Response to 3.h.4:
See the Response to 3.f.4.
5. Describe and provide bases for coatings debris generation assumptions. For example, describe how the quantity of paint debris was determined based on ZOI size for qualified and unqualified coatings.
Response to 3.h.5:
The following assumptions related to coatings were made in the debris generation calculation:
Unqualified epoxy coatings are assumed to have a density of 94 lb/ft3. This value was taken from NEI 04-07 Volume 1. • All unqualified coatings were assumed to have a particulate size of 10 µm.
This was found acceptable in the SE on NEI 04-07 (Reference 6 p. 22). • The amount of degraded/unqualified coatings from the coatings log were
conservatively increased by 10%. • Qualified coatings were analyzed within a 4.0D ZOI. This ZOI has been
previously accepted by the NRC (Reference 7 p. 2).
The amount of unqualified coatings in containment were quantified based on detailed logs maintained over the life of the plant. The values are shown in Table 3.h.1-3 and Table 3.h.1-4 for PTN3 and PTN4, respectively. The quantities apply to all breaks, regardless of size or location.
The quantity of qualified coatings shown in Table 3.h.5-1 through Table 3.h.5-6, are from the respective worst-case insulation breaks. The volumes in these tables were calculated using the densities presented in Table 3.h.1-1 and Table 3.h.1-2.
E1-171
Enclosure 1 to FPL Letter L-2017-149
Updated Final Response to NRC Generic Letter 2004-02
Table 3.h.5-1: PTN3 Qualified Coatings Debris for the Worst-Case Cal-Sil DEGB Breaks
Break Location 31-RCS-1302-10 31-RCS-1303-10
Location Description Loop B Crossover Leg at RCP
Loop C Crossover Leg at RCP
Break Size 31" 31" Break Type DEGB DEGB
Carboguard 890N (Epoxy) 107.55 lbm
0.99 ft3
131.98 lbm
1.21 ft3
Table 3.h.5-2: PTN3 Qualified Coatings Debris for the Worst-Case Fiber DEGB
Breaks Break Location 12-RC-1301-9 12-RC-1301-8
Location Description Surge Line Near Pressurizer Nozzle
Surge Line Near Pressurizer Nozzle
Break Size 10.5 10.5" Break Type DEGB DEGB
Carboguard 890N (Epoxy) 2.63 lbm
0.02 ft3
5.35 lbm
0.05 ft3
Table 3.h.5-3: PTN4 Qualified Coatings Debris for the Worst-Case Cal-Sil DEGB
6. Describe what debris characteristics were assumed, i.e., chips, particulate, size,
distribution and provide bases for the assumptions. Response to 3.h.6: In accordance with the guidance provided in NEI 04-07 (Reference 10 pp. 3-12 – 3-13) and the associated NRC SE (Reference 6 p. 22) all coating debris was treated as 10-micron particulate. See the Response to 3.h.1, 3.h.2, and 3.h.5 for additional debris characteristics description. 7. Describe any ongoing containment coating conditions assessment program.
Response to 3.h.7:
PTN3 and PTN4 Containment Coating Condition Assessment Program (Reference 19 p. 21)
The current program for controlling the quantity of unqualified/degraded coatings includes two separate inspections by qualified personnel during each refueling outage, and notification of plant management prior to restart if the volume of unqualified/degraded coatings approaches pre-established limits.
E1-173
Enclosure 1 to FPL Letter L-2017-149
Updated Final Response to NRC Generic Letter 2004-02
The first inspection takes place at the beginning of every refueling outage, when areas and components from which peeling coatings have the potential for falling into the reactor cavity are inspected by the FPL Coating Supervisor. The second inspection takes place at the end of every refueling outage when the condition of containment coatings is assessed by a team (including a nuclear coating specialist) using guidance from EPRI. Accessible coated areas of the containment and equipment are included in the second inspection. Plant management is notified prior to restart if the volume of unqualified/degraded coatings approaches pre-established limits.
The initial coating inspection process is a visual inspection. The acceptability of visual inspection as the first step in monitoring of containment building coatings is validated by EPRI. Following identification of degraded coatings, the degraded coatings are repaired per procedure if possible. For degraded coatings that are not repaired, areas of coatings determined to have inadequate adhesion are removed, and a nuclear coatings specialist assesses the remaining coating to determine if it is acceptable for use. The assessment is by means of additional nondestructive and destructive examinations as appropriate.
E1-174
Enclosure 1 to FPL Letter L-2017-149
Updated Final Response to NRC Generic Letter 2004-02
3.i. Debris Source Term
The objective of the debris source term section is to identify any significant design and operational measures taken to control or reduce the plant debris source term to prevent potential adverse effects on the ECCS and CSS recirculation functions. Provide the information requested in GL 2004-02 Requested Information Item 2(f) regarding programmatic controls taken to limit debris sources in containment.
GL 2004-02 Requested Information Item 2(f) A description of the existing or planned programmatic controls that will ensure that potential sources of debris introduced into containment (e.g., insulations, signs, coatings, and foreign materials) will be assessed for potential adverse effects on the ECCS and CSS recirculation functions. Addressees may reference their responses to GL 98-04, “Potential for Degradation of the Emergency Core Cooling System and the Containment Spray System after a Loss-of-Coolant Accident Because of Construction and Protective Coating Deficiencies and Foreign Material in Containment,” to the extent that their responses address these specific foreign material control issues.
In responding to GL 2004-02 Requested Information Item 2(f), provide the following:
1. A summary of the containment housekeeping programmatic controls in place to control or reduce the latent debris burden. Specifically for RMI/low-fiber plants, provide a description of programmatic controls to maintain the latent debris fiber source term into the future to ensure assumptions and conclusions regarding inability to form a thin bed of fibrous debris remain valid.
Response to 3.i.1:
PTN has implemented several actions to enhance containment cleanliness as documented in Response to Bulletin 2003-01. Detailed containment cleanliness procedures exist for unit restart readiness and for containment entry at power. These procedures incorporate the guidance of NEI 02-01 to minimize miscellaneous debris sources within the containment, and ensure the operational readiness of the sump strainers. At the end of each outage, a thorough inspection of containment is performed to ensure the containment is free of loose debris and fibrous material, remove items not approved for storage in containment, and ensure the containment sump strainers and strainer piping can perform their design function with no holes or gaps greater than 3/32 inch (0.095 inch) in the strainers.
E1-175
Enclosure 1 to FPL Letter L-2017-149
Updated Final Response to NRC Generic Letter 2004-02
Additionally, these procedures also require the plant general manager to approve all at power containment entries. These procedures also ensure a complete inspection of all affected areas of containment is performed during at power entries to verify that no loose debris is present which could be transported to the containment sump strainers. Lastly, the maintenance director is responsible for maintaining the general housekeeping of containment, which includes tracking the overall cleanliness of containment and promptly correcting identified deficiencies. 2. A summary of the foreign material exclusion programmatic controls in place to
control the introduction of foreign material into the containment.
Response to 3.i.2:
Foreign material exclusion programmatic controls are in place at PTN that consider the containment building as a plant system. This ensures that proper work control is specified for debris-generating activities within the containment building in order to prevent introduction of foreign material into the containment sump or strainers. Additionally, the foreign material exclusion program requires that engineering be consulted whenever foreign material covers are placed on the containment sump strainers or modifications are performed on the strainers. 3. A description of how permanent plant changes inside containment are
programmatically controlled so as to not change the analytical assumptions and numerical inputs of the licensee analyses supporting the conclusion that the reactor plant remains in compliance with 10 CFR 50.46 and related regulatory requirements.
Response to 3.i.3:
NEE engineering change processes and procedures ensure modifications that may affect the ECCS, including sump performance, are evaluated for GL 2004-02 compliance. During engineering change preparation, the process requires that specific critical attributes be listed, evaluated, and documented when affected. This includes the introduction of materials into containment that could affect sump performance or lead to equipment degradation (e.g., GSI-191). It also includes repair, replacement, and installation of coatings inside containment, including installing coated equipment.
E1-176
Enclosure 1 to FPL Letter L-2017-149
Updated Final Response to NRC Generic Letter 2004-02
NEE adopted the industry’s standard design change process, including the industry procedure. The standard process and tools are intended to facilitate sharing of information, solutions and design changes throughout the industry. This process requires activities that affect UFSAR-described SSC design functions to be evaluated as a design change in accordance with NEE’s 10 CFR 50 Appendix B program. This includes modifications that would impact the containment sump. Design changes require a final impact review meeting (i.e., final design workshop) and assessment in accordance with 10 CFR 50.59. Additional meetings may be required based on complexity and risk of the change. A failure modes and effects analysis is required if the design change introduces any new failure modes or changes failure modes for the affected SSCs. This guidance has been enhanced by an engineering specification that brings together, in one document, the insulation design documents that determine the design basis for the insulation debris component of the containment recirculation strainer design. This specification provides guidance for evaluating and maintaining piping and component insulation configuration within the containment buildings at PTN3 and PTN4. 4. A description of how maintenance activities including associated temporary
changes are assessed and managed in accordance with the Maintenance Rule, 10 CFR 50.65.
Response to 3.i.4:
Temporary configuration changes are controlled by plant procedure. This process maintains configuration control of non-permanent changes to plant systems, structures, and components while ensuring the applicable technical and administrative reviews and approvals are obtained. If, during at-power operation conditions, the temporary alteration associated with maintenance is expected to be in effect for greater than 90 days, the temporary alteration is subject to the requirements of 10 CFR 50.59 prior to implementation.
In accordance with 10 CFR 50.65 (Maintenance Rule), an assessment of risk resulting from the performance of maintenance activities is required. Prior to performing maintenance activities (including but not limited to surveillance, post-maintenance testing, and corrective and preventive maintenance), the licensee assesses and manages the increase in risk that may result from the proposed maintenance activities. The scope of the assessment may be limited to those SSCs that a risk-informed evaluation process has shown to be significant to public health and safety. In general, the risk assessment ensures that the maintenance activity will not adversely impact a dedicated/protected train. The dedicated/protected train ensures a system is capable to perform its intended safety function. PTN implements the requirement via procedures.
E1-177
Enclosure 1 to FPL Letter L-2017-149
Updated Final Response to NRC Generic Letter 2004-02
5. If any of the following suggested design and operational refinements given in the guidance report (guidance report, Section 5) and SE (SE, Section 5.1) were used, summarize the application of the refinements.
a. Recent or planned insulation change-outs in the containment which will reduce
the debris burden at the sump strainers.
Response to 3.i.5.a: At PTN3, insulation modifications were completed. The modifications included replacing the Nukon and Cal-Sil insulation on the pressurizer surge line with RMI, removing the Cal-Sil insulation from the pressurizer relief tank, and replacing Cal-Sil insulation with RMI on sections of ECCS piping (Reference 24 p. 25). Additionally, fibrous insulation installed around selected piping and valves located within the bioshield was either removed or replaced with RMI. At PTN4, insulation modifications were completed, including replacing the thermal insulation on the RCPs with RMI and removing the Cal-Sil insulation on the pressurizer relief tank (Reference 25 p. 29).
b. Any actions taken to modify existing insulation (e.g., jacketing or banding) to reduce the debris burden at the sump strainer. Response to 3.i.5.b: During the extended power uprate (EPU), circa 2012-2013, both PTN3 and PTN4 containment aluminum inventory reductions were performed to reduce the quantity of available aluminum within containment. At PTN3, these efforts included replacing the aluminum normal containment cooler fins with copper fins, and reducing the available surface area of aluminum insulation jacketing through replacement or overjacketing with stainless steel insulation jacketing. At PTN4, these efforts included replacing the aluminum control rod drive mechanism cooler tube fins with copper and reducing the available surface area of aluminum insulation jacketing through replacement or overjacketing with stainless steel insulation jacketing.
E1-178
Enclosure 1 to FPL Letter L-2017-149
Updated Final Response to NRC Generic Letter 2004-02
c. Modifications to equipment or systems conducted to reduce the debris burden at the sump strainers. Response to 3.i.5.c: In addition to the changes discussed in the Response to 3.i.5.b, PTN4 installed debris interceptors during Fall 2006 to reduce the debris loading on the strainers. While not credited within the debris transport analysis, these interceptors provide additional defense in depth for reducing the accumulation of debris on the PTN4 strainers.
d. Actions taken to modify or improve the containment coatings program. Response to 3.i.5.d: Programmatic controls of containment coatings at PTN include technical requirements for protective coating work performed inside the PTN containments on both steel and concrete structures as well as certification requirements for applicators and inspectors. Additionally, containment closeout inspections are required as described in the Response to 3.h.7.
E1-179
Enclosure 1 to FPL Letter L-2017-149
Updated Final Response to NRC Generic Letter 2004-02
3.j. Screen Modification Package
The objective of the screen modification package section is to provide a basic description of the sump screen modification.
1. Provide a description of the major features of the sump screen design modification.
Response to 3.j.1:
PTN3 and PTN4 have different strainer configurations. Thus, this response subsection is broken into separate sections for each unit.
PTN3 Screen Modification Package
The original sump screens were completely replaced with a single, non-redundant, distributed sump strainer system that consists of 12 strainer modules combined into four assemblies and interconnecting piping. This modification increased the surface area from approximately 63 ft2 to 5,543 ft2. However, this design value includes surface area of perforated plate blocked by disk internal structural members. The unobstructed perforated plate surface area of the strainer disks was further evaluated and determined to be 4,699 ft2. The strainer system uses the General Electric (GE) discreet modular stacked disc strainers.
The new strainer system is completely passive (i.e., it does not have any active components or rely on backflushing.)
As in the original design, the new distributed strainer system serves both ECCS suction intakes. The modules in each assembly are tied together into larger units by a connected common plenum. The strainer plenums are connected together and to the ECCS suction inlets by the strainer piping. The original ECCS intake design had a permanent cross-connection downstream of the ECCS sump inlets (outside containment), which permits either train to draw from both ECCS sump inlets. The new strainer design provides a pathway inside containment that is parallel to this cross-connection, which still exists.
The strainer modules consist of a series of vertically oriented rectangular disks, stacked in parallel along a horizontal axis that have exterior debris capturing surfaces or perforated plate covered with a woven wire mesh. The wire mesh decreases the head loss across the strainer plates by breaking up debris beds. Each strainer disk is constructed of two plates and has an open interior to channel disk flow toward the strainer plenum. The disks are mounted on a frame and to the discharge plenum on the side of the disk set, which channels disk flow to the interconnecting suction piping. Stainless steel is used as the construction material.
E1-180
Enclosure 1 to FPL Letter L-2017-149
Updated Final Response to NRC Generic Letter 2004-02
The strainer perforations are nominal 3/32-inch diameter holes. Fabrication and installation tolerances of all equipment are such that debris larger than 0.1031 inch (110% of nominal opening diameter) cannot bypass the strainer system.
The entire strainer system was designed and situated to be fully submerged at the minimum containment water level during recirculation. During flood-up, water would fill the strainer system from the bottom up, forcing air out of the perforated strainer disks, thereby venting the system. Because the disks are below the containment water level prior to the start of recirculation, air will not be sucked in through the perforated disks. Because the strainers vent the system prior to the start of recirculation, no other venting is required. See the Response to 3.g.7 for a discussion of containment sump water level.
The strainer modules and piping are designed to ASME Section III, Subsection NC (Class 2 Components). The capability of strainer perforated plate disks as structural members is based on the equivalent plate approach as specified in ASME Section III Article A-8000. The capability to provide the required NPSH with the maximum debris volume is discussed in the Response to 3.g. See the Response to 3.k for discussion of the sump structural analysis.
The sump strainers were designed to accommodate the maximum postulated LOCA-generated debris loads at the time of their installation. The maximum volume of debris currently calculated for PTN3 is discussed in the Response to 3.e.6. See the Response to 3.f.4 for the methodology and results of head loss testing.
Figure 3.j.1-1 and Figure 3.j.1-2 provide an overview of the strainer layout and configuration within containment. Figure 3.j.1-3 through Figure 3.j.1-5 provide details on the strainer modules, plenum assemblies, and disk assemblies.
E1-181
Enclosure 1 to FPL Letter L-2017-149
Updated Final Response to NRC Generic Letter 2004-02
Figure 3.j.1-1: PTN3 Overview of Containment Layout and the General Location of
Strainer Modules
E1-182
Enclosure 1 to FPL Letter L-2017-149
Updated Final Response to NRC Generic Letter 2004-02
Figure 3.j.1-2: PTN3 Sump Strainer Layout
E1-183
Enclosure 1 to FPL Letter L-2017-149
Updated Final Response to NRC Generic Letter 2004-02
Figure 3.j.1-3: PTN3 Strainer Unit – Typical
E1-184
Enclosure 1 to FPL Letter L-2017-149
Updated Final Response to NRC Generic Letter 2004-02
Figure 3.j.1-4: PTN3 Plenum Assembly – Typical
E1-185
Enclosure 1 to FPL Letter L-2017-149
Updated Final Response to NRC Generic Letter 2004-02
Figure 3.j.1-5: PTN3 Double Strainer Disk Assembly – Typical
E1-186
Enclosure 1 to FPL Letter L-2017-149
Updated Final Response to NRC Generic Letter 2004-02
PTN4 Screen Modification Package
The original sump screens were completely replaced with a single, distributed sump strainer system. The replacement strainer system is a PCI Sure Flow® suction strainer assembly design consisting of three strainer module assemblies designated as A, B, and C. Each of the three strainer assemblies consist of five modules. Each module has 13 disks. All disks have a 48-inch width, 30-inch height, and a nominal ½-inch thickness. Each disk is separated by a screened 1-inch gap resulting in 12 gaps for each module. Each horizontally mounted strainer assembly has a total of approximately 1,200 ft2 of strainer surface area with a total strainer surface area of approximately 3,600 ft2. The strainers have the same components except for varied core tube hole patterns.
The new strainer system is completely passive (i.e., it does not have any active components or rely on backflushing).
Strainer assembly A connects directly through piping to a common plenum box over the south sump. Strainer assemblies B and C merge together and connect through an 18-inch diameter ‘tee’ and piping to the same common plenum box over the south sump. The strainer system and interconnecting piping are located outside the bioshield wall on the 14-foot elevation of the containment building. As in the original design, the new distributed strainer system serves both ECCS suction intakes. The original ECCS intake design had a permanent cross-connection downstream of the ECCS sump inlets (outside containment), which permits either train to draw from both ECCS sump inlets. The new strainer design provides a pathway inside the containment that is parallel to the original cross-connection, which still exists.
The strainer assemblies are composed of individual disks formed by a perforated plate, bolted together in horizontal stacks with intermediate stiffener plates and a core tube for the flow of water to the sumps via the interconnecting piping. The strainer perforation hole size has a nominal diameter of 0.095 inches to control the maximum allowable debris size that can pass through the strainers. Particle retention is 100% of particles larger than 0.103 inches.
The entire strainer system was designed and situated to be fully submerged at the minimum containment water level during recirculation. See the Response to 3.g.7 for a discussion of containment sump water level.
The strainer modules were designed to ASME Section III, Subsection NC (Class 2 Components). The capability of strainer perforated plate disks as structural members is based on the equivalent plate approach as specified in ASME Section III Article A-8000. The strainer piping was designed in accordance with B31.1. The capability to provide the required NPSH with the maximum debris volume is discussed in the Response to 3.g. See the Response to 3.k for discussion of the sump structural analysis.
E1-187
Enclosure 1 to FPL Letter L-2017-149
Updated Final Response to NRC Generic Letter 2004-02
The sump strainers were designed to accommodate the maximum postulated LOCA-generated debris loads at the time of their installation. The maximum volume of debris currently calculated for PTN3 is discussed in the Response to 3.e.6. See the Response to 3.f.4 for the methodology and results of head loss testing.
Additionally, during PTN4 refueling outage PT4-23 (Fall 2006), debris interceptors were installed at five locations within the PTN4 containment to limit the quantity of debris reaching the strainer modules, without restricting recirculation flow.
• 14’-0” Elevation, north side of containment, outside bioshield, across personnel access paths through east labyrinth to area between bioshield and reactor.
• 14’-0” Elevation, north side of containment, outside bioshield, across personnel access paths through west labyrinth to area between bioshield and reactor.
• 14’-0” Elevation, south side of containment, outside bioshield, across personnel access paths through east labyrinth to area between bioshield and reactor.
• 14’-0” Elevation, south side of containment, outside bioshield, across personnel access paths through west labyrinth to area between bioshield and reactor.
• 14’-0” Elevation, under the fuel transfer canal.
See the Response to 3.k for discussion of the debris interceptor structural analysis. Figure 3.j.1-6 provides the strainer locations within containment. Figure 3.j.1-7 and Figure 3.j.1-8 provide details on the strainer modules and module assemblies. Figure 3.j.1-9 provides the debris interceptor locations within containment.
E1-188
Enclosure 1 to FPL Letter L-2017-149
Updated Final Response to NRC Generic Letter 2004-02
Figure 3.j.1-6: PTN4 General Location of Strainer Modules in Containment
E1-189
Enclosure 1 to FPL Letter L-2017-149
Updated Final Response to NRC Generic Letter 2004-02
Figure 3.j.1-7: PTN4 Strainer Module – Typical
E1-190
Enclosure 1 to FPL Letter L-2017-149
Updated Final Response to NRC Generic Letter 2004-02
Updated Final Response to NRC Generic Letter 2004-02
Figure 3.j.1-9: PTN4 Debris Interceptor Locations in Containment (Reference 25 p.
35)
E1-192
Enclosure 1 to FPL Letter L-2017-149
Updated Final Response to NRC Generic Letter 2004-02
2. Provide a list of any modifications, such as reroute of piping and other components, relocation of supports, addition of whip restraints and missile shields, etc., necessitated by the sump strainer modifications.
Response to 3.j.2:
Other changes associated with the sump strainer modifications are discussed below for each unit.
• At PTN3, a 16” diameter core bore under the fuel transfer canal was created to route the strainer piping between the north and south containment sumps. Additionally, the existing sumps were filled with concrete after installation of the new screens to prevent personnel injury and accumulation of radioactive leakage/crud.
• At PTN4, an 18” diameter core bore under the fuel transfer canal was created to route the strainer piping between the north and south containment sumps. Additionally, the existing sumps were filled with concrete and reinforcing steel to protect the exposed liner plate and serve as a strainer pipe anchor point. The following lines were rerouted to allow installation of the new PCI strainers.
o 6” RHR Line o 3” component cooling water (CCW) Inlet Line o 3” CCW Outlet Line o 3/4” chemical volume and control system (CVCS) Inlet Line o 3/4” CVCS Outlet Line o 3/4” waste disposal (WD) Line o 3/8” RCS Instrument Tubing Lines
Also, a conduit support and stairwell support were modified to allow a strainer module assembly to fit underneath the stairway landing.
E1-193
Enclosure 1 to FPL Letter L-2017-149
Updated Final Response to NRC Generic Letter 2004-02
3.k. Sump Structural Analysis
The objective of the sump structural analysis section is to verify the structural adequacy of the sump strainer including seismic loads and loads due to differential pressure, missiles, and jet forces. Provide the information requested in GL 2004-02 Requested Information Item 2(d)(vii).
GL 2004-02 Requested Information Item 2(d)(vii) Verification that the strength of the trash racks is adequate to protect the debris screens from missiles and other large debris. The submittal should also provide verification that the trash racks and sump screens are capable of withstanding the loads imposed by expanding jets, missiles, the accumulation of debris, and pressure differentials caused by post-LOCA blockage under flow conditions.
1. Summarize the design inputs, design codes, loads, and load combinations
utilized for the sump strainer structural analysis.
Response to 3.k.1:
PTN3 Sump Structural Analysis
There are four strainer assemblies in the system. Each assembly consists of multiple strainer units bolted together. There are three major subcomponents: passive strainer assemblies, strainer piping, and pipe supports. The pipe runs that connect the strainer assemblies and ECCS/CSS suction inlets are nominal 14-inch stainless steel, schedule 10S, and utilize flexible bellows connections to allow for thermal expansion. The assemblies are connected to the south ECCS/CSS suction inlet by piping that runs through a cylindrical core bore 15½ feet long with a 16-inch diameter beneath the refueling cavity (also known as the fuel transfer canal). The piping that connects to both the north and south ECCS/CSS suction inlets is embedded in concrete within the sumps so that negligible loads are imposed on the ECCS/CSS suction piping.
The system only operates once the containment is filled with water and the entire system is fully submerged. The system is also designed to vent during containment flood up, and there is no requirement to be leak tight. That is, the strainers and piping are not pressure-retaining vessels, but rather are required to guide the screened water to the pump suction lines while fully submerged. However, the strainers and associated piping have been designed to withstand a crush pressure of 20 psi.
E1-194
Enclosure 1 to FPL Letter L-2017-149
Updated Final Response to NRC Generic Letter 2004-02
Table 3.k.1-1: PTN3 Strainer Structural Loads and Load Combinations
Table 3.k.1-2: PTN3 Strainer Structural Load Symbols Symbol Load Definition
D Weight of Dry Strainer Assembly L’ Water Weight + Debris Weight + Hydrodynamic Mass L Live Load, 250 Pound Person T Normal Operating Thermal Load TA Accident Thermal Load E1 Earthquake Load, OBE in air E2 Earthquake Load, OBE in water E’1 Earthquake Load, SSE in air E’2 Earthquake Load, SSE in water Pcr Differential (Crush) Pressure
PTN3 Sump Strainer Piping and Pipe Support Analysis
The piping load combination is summarized in Table 3.k.1-3. The pipe support structural qualification results are summarized in Table 3.k.1-4. The structural qualification of the piping and supports for the piping were evaluated via separate calculations.
For the piping stress evaluations, pressure stress (DPRS), weight stress (WGHT) and thrust stress (THRU) were combined algebraically and then combined with the seismic inertia (OBEI, SSEI) load as shown below. Thermal stresses were evaluated separately using the stress range between the zero thermal mode and the evaluated thermal mode, as noted below.
Load Load Combination 1 D + L + E1 2 D + L’ + E2 3 D + L + T + E1 4 D + L’ + T + E2 5 D + L + T + E’1 6 D + L + TA 7 D + L’ + TA + E’2 + PCR
E1-195
Enclosure 1 to FPL Letter L-2017-149
Updated Final Response to NRC Generic Letter 2004-02
Table 3.k.1-4: PTN3 Pipe Support Load Combinations Load Case Stress Combination
Level A WGHT or WGHT + THRU or WGHT + THER or WGHT + THER + THRU
For calculating support loads, the weight (WGHT), thermal (THER) and thrust load (THRU) were added algebraically and then combined with seismic loads as shown above.
PTN4 Sump Structural Analysis The strainers are composed of individual disks formed by perforated stainless steel sheets, and bolted together in horizontal modules with stiffener support plates on four sides. These modules are placed in individual horizontal trains with core tubes for flow of water to the plenums. Strainer Trains A, B and C are made up of five modules, each have the same components except for varied core tube hole patterns. The strainer system is designed to limit the total debris-laden head loss such that the total system head losses will maintain acceptable NPSH for the RHR, HHSI and CS pumps. Additionally, the total debris quantity postulated to be present in the PTN4 containment following a LOCA has been mechanistically determined. Based on this, the strainers and associated piping have been designed to withstand a maximum differential pressure of 14 psi. The strainer assemblies are passive and do not employ mechanical or hydraulic cleaning or flushing following a LOCA. Therefore, none of these forces affect the strainers. The potential loads for the operating basis earthquake and safe shutdown earthquake load combinations for the strainer system are provided in Table 3.k.1-5.
E1-196
Enclosure 1 to FPL Letter L-2017-149
Updated Final Response to NRC Generic Letter 2004-02
Table 3.k.1-5: PTN4 Potential OBE and SSE Load Combinations
D Dead weight load component. L Live loads. Ldp Differential pressure live load across a debris covered strainer. Ldeb Debris weight live load. The live load of the strainer includes the weight of
the debris, which accumulates on the strainer during accident conditions. The debris is considered captured by the strainer and is, therefore, active during a seismic event.
T Thermal load. There are no thermal expansion loads since the strainers are basically free to expand without restraint due to sufficient fabrication tolerances that allow for thermal growth.
E Operating basis earthquake load. Ew Operating basis earthquake including underwater earthquake effects. E' Safe shutdown load. E'w Safe shutdown earthquake including underwater earthquake effects. P Differential pressure loads where they occur. The strainer is designed for
maximum differential pressure that is applicable in all load combinations such that it is considered a live load.
J Jet impingement force where it occurs. There are no jet impingement loads applied to the strainer components. There are no high energy line breaks postulated in this area of containment.
R Pipe rupture reactions where it occurs. There are no pipe rupture reactions applied to the strainer.
S Required section strength based on the elastic design methods and the allowable stresses.
Y Yield strength of material. The two load combinations provided in Table 3.k.1-6 are code checked to envelope the above five load combinations for the analysis of the assembly using the GSTRUDL model.
Condition LC1 D + L 1.0 S Sump is dry or flooded LC2 D + L + T 1.0 S Sump is dry or flooded LC3 D + L + T + E 1.33 S Sump is dry or flooded LC4 D + L + T + E’ 1.5 S or Y Sump is dry or flooded
LC5 D + L + T + P + J + R Y Sump is dry or flooded
E1-197
Enclosure 1 to FPL Letter L-2017-149
Updated Final Response to NRC Generic Letter 2004-02
Table 3.k.1-6: PTN4 Bounding Strainer Loads and Load Combinations
The material properties for stainless steel materials at elevated temperatures were taken from ASME Section III, Appendix l, 1989 Edition. In general, applicable design and analysis methods and equations from B31.1-1973 were used for the strainer components. A proper allowable stress was determined based on the code most applicable to the type of component. PTN4 Sump Strainer Piping and Pipe Support Analysis The allowable stresses on the piping support components were based on the 1989 AISC Specification included in the 9th Edition, but utilized the more conservative compression allowables for stainless steel provided in ANSI/AISC-N-6190. The potential loads for the operating basis earthquake and safe shutdown earthquake load combinations for the strainer piping are provided in Table 3.k.1-8.
Table 3.k.1-7: PTN4 Support Loads and Load Combinations
Load Load Combination Allowable Normal DW + T 1.0 AISC Upset DW + T + OBE 1.33 AISC
Faulted DW + T + DBE (SSE) 1.33 AISC DW Dead Load P Differential Pressure T Normal Operating Thermal Load OBE Design Basis Earthquake DBE (SSE) Safe Shutdown Earthquake (Note: Defined Terms are applicable to both Table 3.k.1-7 and Table 3.k.1-8)
1.0 S These are the LC2 loads with submerged strainer at maximum fluid temperature vs LC2 allowables
SSE D + Ldeb + Ldp + E’w 1.33 S
These are the LC4 loads with submerged strainer at maximum fluid temperature vs LC3 allowables
E1-198
Enclosure 1 to FPL Letter L-2017-149
Updated Final Response to NRC Generic Letter 2004-02
Table 3.k.1-8: PTN4 Potential OBE and SSE Load Combinations Load Condition Stress Combination Allowable Stress
Normal (Sustained) P + DW 1.0 Sh Thermal (Displacement) T 1.0 SA
Upset (Occasional) P + DW + OBE 1.2 Sh Faulted (Occasional) P + DW + DBE (SSE) 1.0 Sy
Sh Basic material allowable stress at temperature for normal service
condition, T=283 °F. SC Basic material allowable stress at ambient temperature, T=70 °F. SA Allowable code stress range, (1.25 x Sc + 0.25 x Sh). SY Yield stress.
Since specific detailed guidance is not provided in B31.1 for flanges, the bolted flange connections were evaluated in accordance with the guidelines of ASME Section III, Appendix L.
PTN4 Debris Interceptors Analysis
The debris interceptors consist of multiple sets of vertically and horizontally oriented grating and wire mesh to prevent a certain amount of debris from reaching the containment sump strainers during a LOCA condition. One set of debris interceptors is located in PTN4 containment at location AZ 99 and a second and third set of debris interceptors are located at the right and left bio-wall opening inside containment. The sump strainer debris interceptor’s module structural loads and load combinations are summarized in Table 3.k.1-9 for the bio-wall and location AZ 99 debris interceptors. Table 3.k.1-9: PTN4 Sump Strainer Debris Interceptors Load Combinations
Load Load Combination Allowable Normal DW + T 1.0 AISC Upset DW + T + OBE 1.33 AISC
Updated Final Response to NRC Generic Letter 2004-02
2. Summarize the structural qualification results and design margins for the various components of the sump strainer structural assembly.
Response to 3.k.2:
PTN3 Sump Structural Analysis
The strainer module structural qualification results are summarized in Table 3.k.2-1, Table 3.k.2-2, and Table 3.k.2-3. Finite element analyses were performed for all components of the strainer module assembly using the ANSYS program. The strainer modules were designed using ASME Section III, Subsection NC Class 2 (components) and Subsection NF (supports) as a guide. The capability of the strainer perforated plate discs as structural members was calculated using the equivalent plate approach which is contained in the ASME B&PV Code, Section III, Appendix, Article A-8000. For the concurrent events of a LOCA, seismic event, and the strainer modules fully clogged, the strainer discs were designed to ASME Section III Subsection NCA-2142, Level D allowable stresses. The strainer nozzles were designed for a set of limit loads that envelope the piping capability to apply loads.
The 16-inch diameter core bore was analyzed for its effect on the structural integrity of the concrete wall that it penetrates. The only affected component is the concrete wall that contains the core bore. The analysis confirmed that the concrete wall with the core bore continues to meet the design basis requirements with margin. Subsequent to drilling the 16-inch diameter concrete core, the penetration was coated to protect the cut ends of steel reinforcement from corrosion.
With regard to trash racks, the strainer design is robust and the trash rack function is incorporated into the design. Separate (distinct) trash racks are not installed. This is consistent with the original PTN3 strainers/sumps, which did not have separate trash racks.
E1-200
Enclosure 1 to FPL Letter L-2017-149
Updated Final Response to NRC Generic Letter 2004-02
Table 3.k.2-1: PTN3 Strainer Structural Load Stress Ratio Results
Components Governing
Load Combination
Calculated (psi)
Allowable (psi)
Interaction Ratio
Plenum Support Plate LC4-OBE 16,355 16,600 0.99
Plenum Support Frame LC4-OBE 12,475 16,600 0.75
14 inch Pipe LC4-OBE 15,881 16,600 0.96 Pipe Run
Connection Plate LC4-OBE 10,788 16,600 0.65
Plenum Side Cover 28 Disks LC4-OBE 14,900 16,600 0.90
Updated Final Response to NRC Generic Letter 2004-02
PTN3 Sump Strainer Piping and Pipe Support Analysis
The connecting piping was analyzed using the PIPSYSW software. The connecting piping was designed and analyzed in accordance with ASME III Subsection NC (Class 2 components). The analyses confirmed that the pipe stresses are below the code allowable limits and generate the bounding loads for the clamp supports, grouted sump anchor loads and strainer nozzle loads.
The piping supports were designed to AISC with allowable stresses based on the AISC Manual of Steel Construction, 13th Edition. In all cases, the loads were applied in the direction that generated the maximum stress levels, and the analyses confirmed that the supports met the acceptance criteria. The support analysis considered the configurations of the two way supports (H-1), three way supports (H-3), wall penetration support condition (H-2), and the sump detail. All other support conditions are enveloped by the analysis of these support types. The interaction ratios for the different configurations of the pipe supports in the models are provided in Table 3.k.2-5. The results of the calculation show that the interaction ratios for the strainer piping and supports are below 1.0, and the strainers meet the acceptance criteria for all applicable loadings.
E1-203
Enclosure 1 to FPL Letter L-2017-149
Updated Final Response to NRC Generic Letter 2004-02
Table 3.k.2-5: PTN3 Interaction Ratios for Pipe Supports
Item
Calculated Stress (kip) Code Allowable (kip) Interaction Ratio
Sump Detail Bearing on Concrete 0.056 kip/in2 3 kip/in2 0.019
E1-204
Enclosure 1 to FPL Letter L-2017-149
Updated Final Response to NRC Generic Letter 2004-02
PTN4 Sump Structural Analysis
The fabricated non-pressure components that provide load bearing support within the assembly are designed using allowable stresses in accordance with AISC 9th edition.
Since AISC "Steel Construction Manual" was developed for carbon steels, ANSI/AISC-N690 was used for guidance regarding design of austenitic steels to ensure the analysis was conservative. The stainless steel members in compression were checked against allowables from ANSI/AISC-N690.
The B31.1 Code does not provide design requirements for perforated plates. Therefore, for the perforated plates, the equations from Appendix A Article A-8000 of the ASME B&PV Code, Section III, 1989 Edition were used to calculate the perforated plate stresses. The maximum principal stresses were calculated and compared to the allowable limits, S, as given in Appendix A of the B31.1 Code.
The interaction ratios for the components in the models are provided in Table 3.k.2-6. The results of the calculation show that the interaction ratios for the strainer assembly components are below 1.0, and the strainers meet the acceptance criteria for all applicable loadings.
E1-205
Enclosure 1 to FPL Letter L-2017-149
Updated Final Response to NRC Generic Letter 2004-02
Table 3.k.2-6: PTN4 Interaction Ratios for Strainer Assembly Components
End Cover Assembly NORM 11,423 13,750 0.83 End Cover Anchor Bolts SSE 2,107 2,290 0.92
Lifting Eye SSE 11,050 15,000 0.77
E1-206
Enclosure 1 to FPL Letter L-2017-149
Updated Final Response to NRC Generic Letter 2004-02
PTN4 Sump Strainer Piping and Pipe Support Analysis The structural qualification of the piping and supports for the piping were evaluated via calculation. The piping was evaluated in accordance with ANSI B31.1 Power Piping 1973 Edition. Basic material allowable stresses were taken from Appendix A of B31.1. The evaluations were performed using a combination of Mathcad manual calculations for the supports and AutoPIPE for the piping analysis. The interaction ratios for the piping, flanges, and supports in the models are provided in Table 3.k.2-7. The results of the calculation indicate the interaction ratios for the strainer piping and supports are below 1.0, and the strainers meet the acceptance criteria for all applicable loadings.
E1-207
Enclosure 1 to FPL Letter L-2017-149
Updated Final Response to NRC Generic Letter 2004-02
Table 3.k.2-7: PTN4 Interaction Ratios for Strainer Assembly Components
Updated Final Response to NRC Generic Letter 2004-02
PTN4 Debris Interceptors Analysis The debris interceptors and supports are fabricated from stainless steel. Finite element analyses were performed for the frame and baseplate of the debris interceptor assembly using the PD STRUDL program. The structural adequacy of the debris interceptors and their components was confirmed using hand analysis methods. Seismic adequacy was confirmed using an equivalent static analysis. The debris interceptor acceptance criteria used the guidance in the AISC Manual of Steel Construction, 9th Edition and the ASME BP&V Code Section II, Part D. Expansion anchors were evaluated using the ultimate capacity values with a safety factor of 4. The interaction ratios for the debris interceptors in the models are provided in Table 3.k.2-8 for the bio-wall debris interceptors and Table 3.k.2-9 for the AZ 99 debris interceptors. The results of the calculation indicate the interaction ratios for the strainer piping and supports are below 1.0, and the strainers meet the acceptance criteria for all applicable loadings.
E1-209
Enclosure 1 to FPL Letter L-2017-149
Updated Final Response to NRC Generic Letter 2004-02
Updated Final Response to NRC Generic Letter 2004-02
3. Summarize the evaluations performed for dynamic effects such as pipe whip, jet impingement, and missile impacts associated with high-energy line breaks (as applicable).
Response to 3.k.3:
PTN3
An assessment of the location of the new strainer modules and piping for susceptibility to jet impingement and pipe whip loads due to HELBs was conducted. According to the evaluation, there are no jet impingement or pipe whip concerns for the new strainer equipment. Therefore, the new equipment is acceptable with regards to pipe whip and jet impingement effects associated with an accident.
Due to the strainer’s location outside of the bioshield wall, it would be protected from postulated missiles.
PTN4 An assessment of the location of the new strainer modules and piping for susceptibility to jet impingement and pipe whip loads due to HELBs was conducted. There were no jet impingement or pipe whip concerns identified for the new strainer equipment. Therefore, the new equipment is acceptable with regards to pipe whip and jet impingement effects associated with an accident.
The locations of the PTN4 debris interceptors have been analyzed for susceptibility to missiles, jet impingement and pipe whip. Postulated missiles will not strike the debris interceptors. None of the bioshield or annulus debris interceptors are in the path of a postulated pipe whip or jet spray.
4. If a backflushing strategy is credited, provide a summary statement regarding the sump strainer structural analysis considering reverse flow.
Response to 3.k.4:
Neither PTN3 nor PTN4 credit backflushing with their new strainer designs (see the Response to 3.j). If the backflushing strategy proposed in the alternate evaluation methodology is adopted, then a reverse flow analysis will be performed to demonstrate structural adequacy of the strainer assembly.
E1-212
Enclosure 1 to FPL Letter L-2017-149
Updated Final Response to NRC Generic Letter 2004-02
3.l. Upstream Effects
The objective of the upstream effects assessment is to evaluate the flowpaths upstream of the containment sump for holdup of inventory, which could reduce flow to and possibly starve the sump. Provide a summary of the upstream effects evaluation including the information requested in GL 2004-02 Requested Information Item 2(d)(iv).
GL 2004-02 Requested Information Item 2(d)(iv) The basis for concluding that the water inventory required to ensure adequate ECCS or CSS recirculation would not be held up or diverted by debris blockage at choke points in containment recirculation sump return flowpaths.
1. Summarize the evaluation of the flowpaths from the postulated break locations
and containment spray washdown to identify potential choke points in the flow field upstream of the sump.
Response to 3.l.1:
The following areas / items were considered as part of the evaluation to determine potential choke points for flow upstream of the sump:
The refueling canal is drained by two drains located on the 18’ elevation floor in the refueling canal and exit at the 16’ elevation on the north side of the refueling canal. Any sprays falling directly in the refueling canal must flow through the refueling canal drains. The drains are 8 inches in diameter at the entrance of the pipe, and reduce to 6 inches in diameter. Drain covers are removed during operation. Since the drain line narrows down to 6 inches in diameter, it is possible that these drains could become blocked with debris that is washed into the refueling canal. If these drains were to become blocked with debris, there is the potential for a large volume of water to be retained in the canal, which would significantly reduce the water level. Testing was performed to determine whether the drains could become clogged with debris. The testing confirmed that the drains remain unclogged even with the maximum amount of debris generated and transported to the refueling canal during blowdown and washdown. Note that even though a small percentage of large pieces of Temp-Mat at PTN4 (which is the debris type of most concern for clogging the drain) was determined to be blown to upper containment and subsequently washed into the refueling canal, in reality, it is highly unlikely that this debris would be blown
E1-213
Enclosure 1 to FPL Letter L-2017-149
Updated Final Response to NRC Generic Letter 2004-02
to upper containment since the Temp-Mat is located at the bottom head of the steam generators at PTN4.
Lower Containment
The lower containment at both PTN3 and PTN4 consists of two compartments – the containment area inside the secondary shield wall, and the annulus outside the secondary shield wall.
At PTN3, water can flow from inner containment to the annulus by means of four doors and a passageway located under the refueling canal. Therefore, there is not a potential upstream blockage point from inside the secondary shield wall to the annulus.
At PTN4, water can also flow from inner containment to the annulus by means of four doors and a passageway located under the refueling canal. All of these passageways have debris interceptors installed. The debris interceptors are vertically mounted stainless steel wire mesh (33 ¼” tall with 3/8” square openings) with a horizontal lip (also stainless steel wire mesh; 18” long) that projects into the flow. The remaining structure of these interceptors comprises stainless steel bar-grating panels (1” x 3/16” bars). If small and large pieces of debris were able to block the passage of water through these interceptors, water would simply flow through the other passageways and over the top of the interceptors.
Pressurizer Compartment
The pressurizer compartment is a potential upstream blockage point for breaks in the pressurizer compartment and for breaks in which containment sprays are activated. The pressurizer bottom head support skirt flange sits on top of a concrete curb that is 18 inches tall (measured from the bottom of the pressurizer cubicle floor at the 30’-6” elevation). In the pressurizer bottom head support skirt flange, there are twelve 1 ½ inch diameter vent holes. The water would have to rise to at least the center line of these vent holes in order to drain out of the cubicle. It is highly unlikely that these vent holes would ever become blocked with small or large pieces of debris since all debris present in the pressurizer compartment would become saturated and sink to the bottom of the cubicle.
E1-214
Enclosure 1 to FPL Letter L-2017-149
Updated Final Response to NRC Generic Letter 2004-02
Containment Spray Washdown
Containment spray washdown has a clear path to the containment sump area. Large sections of the floor on each level in containment are covered with grating that allows the water to pass. Sprays that enter the pressurizer compartment have the potential to be held up; however, this is highly unlikely (see earlier discussion).
A complete evaluation of the containment CAD model, along with a review of the CFD model, indicated that no significant areas would become blocked with debris and hold up water during the sump recirculation phase.
Upstream Blockage Point Walkdowns
Walkdowns were conducted in both the PTN3 and PTN4 containments, specifically to evaluate ECCS recirculation flow paths to support the conclusions previously stated above. The walkdowns utilized the guidance in NEI 02-01, NEI 04-07, and the NRC SE on NEI 04-07.
The information obtained during the walkdowns confirmed that the only potential choke points are the refueling canal drain covers at the bottom of the refueling canal. However, since the walkdowns were performed, refueling outage procedures have been modified that ensure the drain cover is removed from the drain during normal operation.
Other specific NEI and NRC concerns that were addressed in the walkdowns are summarized below:
• Choke points will not be created by debris accumulating on access barriers (fences and/or gates) at PTN3 and PTN4.
• Choke points will not be created by debris accumulation in narrow hallways or passages at PTN3 and PTN4.
• No curbs or ledges were observed within the recirculation flow paths at PTN3 and PTN4. At the upper elevations, concrete slabs smoothly transition to grating or open space without any contiguous curbs.
• No potential chokepoints were observed at upper elevations, including floor grates, which would be expected to retain fluid from reaching the containment floor at PTN3 and PTN4.
• The containment floor was surveyed for choke points formed by equipment, components, and other obstructions. While some debris hold up may occur, it will not prevent water from reaching the sump strainers at PTN3 and PTN4.
Subsequent to the walkdown performed at PTN4, debris interceptors were installed in containment to limit the quantity of debris that could reach the sump strainers and screens. The debris interceptors are designed to have an open flow channel above them, even at the minimum sump pool levels. This assures that water is not
E1-215
Enclosure 1 to FPL Letter L-2017-149
Updated Final Response to NRC Generic Letter 2004-02
prevented from reaching the sump strainers, and therefore, no choke points are created by the debris interceptors, regardless of debris accumulation. 2. Summarize measures taken to mitigate potential choke points. Response to 3.l.2: Per the Response to 3.l.1, no measures were necessary to mitigate potential choke points except for the removal of the drain covers described in the Response 3.l.1. The potential choke points of the drains in the refueling canal have been eliminated by updating the containment closeout procedure to ensure that the drain covers are removed prior to restart. Also, testing has been performed that shows that it is highly unlikely that the drains will not become clogged. In PTN4, the debris interceptors are designed to have an open flow channel above them, even at the minimum sump pool levels. This assures that water is not prevented from reaching the sump strainers. 3. Summarize the evaluation of water holdup at installed curbs and/or debris
interceptors. Response to 3.l.3: The debris interceptors in PTN4 are vertically mounted stainless steel wire mesh with a horizontal lip (also steel mesh) that projects into the flow, below the minimum water level. Water hold up was not considered at the interceptors. For breaks that occur in the PTN3 and PTN4 pressurizer cubicle, the curb and the pressurizer skirt flange were evaluated for water holdup (see previous discussion in 3.l.1). The holdup volume was calculated to be 1,817 gallons. 4. Describe how potential blockage of reactor cavity and refueling cavity drains has
been evaluated, including likelihood of blockage and amount of expected holdup.
Response to 3.l.4:
See the Response to 3.l.1 and 3.l.2.
E1-216
Enclosure 1 to FPL Letter L-2017-149
Updated Final Response to NRC Generic Letter 2004-02
3.m. Downstream Effects – Components and Systems
The objective of the downstream effects, components and systems section is to evaluate the effect of debris carried downstream of the containment sump screen on the function of the ECCS and CSS in terms of potential wear of components and blockage of flow streams. Provide the information requested in GL 2004-02 Requested Information Item 2(d)(v) and 2(d)(vi) regarding blockage, plugging, and wear at restrictions and close tolerance locations in the ECCS and CSS downstream of the sump.
GL 2004-02 Requested Information Item 2(d)(v) The basis for concluding that inadequate core or containment cooling would not result due to debris blockage at flow restrictions in the ECCS and CSS flowpaths downstream of the sump screen (e.g., a HPSI throttle valve, pump bearings and seals, fuel assembly inlet debris screen, or containment spray nozzles). The discussion should consider the adequacy of the sump screen’s mesh spacing and state the basis for concluding that adverse gaps or breaches are not present on the screen surface.
GL 2004-02 Requested Information Item 2(d)(vi) Verification that the close-tolerance subcomponents in pumps, valves and other ECCS and CSS components are not susceptible to plugging or excessive wear due to extended post-accident operation with debris-laden fluids.
1. If NRC-approved methods were used (e.g., WCAP-16406-P-A with
accompanying NRC SE), briefly summarize the application of the methods. Indicate where the approved methods were not used or where exceptions were taken, and summarize the evaluation of those areas.
Response to 3.m.1: PTN3 and PTN4 performed evaluations to address ex-vessel downstream effects in accordance with WCAP-16406-P-A and the associated NRC SE (Reference 26). The limitations and conditions provided in the NRC SE were addressed as part of the evaluations and it was shown that the WCAP-16406-P-A methodology was appropriate for use at PTN3 and PTN4. All refinements or modifications that were applied to the WCAP-16406-P-A methodology are described below. The following methodology was employed in the ex-vessel downstream effects evaluations at PTN3 and PTN4.
E1-217
Enclosure 1 to FPL Letter L-2017-149
Updated Final Response to NRC Generic Letter 2004-02
Maximum Debris Ingestion Determination Blockage and wear of the ECCS and CSS components and piping in the post-LOCA recirculation flowpaths downstream of the sump screens were addressed within the downstream effects evaluations. PTN3 has screens with a nominal hole diameter of 0.09375 inches (3/32 inches) and PTN4 has screens with a nominal hole diameter of 0.095 inches. The adequacy of the sump screens’ mesh spacing or strainer hole size is conservatively addressed by assuming that the maximum spherical size of particulate debris that can pass through the strainers is 0.125 inches. The actual maximum spherical size particulate that is expected to pass through the strainer system and into the ECCS and CSS recirculation flow paths is documented as 0.103 inches. Additionally, the maximum quantity of fines debris transported to the sump strainers for each debris type was assumed. Of these maximum quantities, 100% of Cal-Sil, qualified coatings, and latent debris that are generated and transported as fines were assumed to bypass the strainer. For unqualified coatings, the size distribution presented in WCAP-16406-P-A was used to determine what percentage of debris was small enough to bypass the strainer. For RMI, the size distribution presented in Appendix VI of NEI 04-07, Volume 2 was curve fit and applied to determine the percentage of debris small enough to bypass the strainer. PTN3 assumed 100% bypass of fiber fines. PTN4 assumed that the amount of fiber that bypassed the strainer was 100 g/FA, a quantity that is greater than the maximum total reactor vessel fiber load amount shown for a hot-leg break, as discussed in the Response to 3.n.1. An inspection procedure is in place to ensure that adverse gaps or breaches are not present on the screen surface that would invalidate the previously stated assumptions. This procedure is described in the Response to 3.i. Initial Debris Concentrations Initial debris concentrations were developed using the assumptions and methodology described in Chapter 5 of WCAP-16406-P-A. For PTN3, the total maximum initial debris concentration was determined to be 1,262.80 ppm, with fiber debris contributing 10.58 ppm, and particulate and coating debris contributing 1,252.22 ppm. For PTN4, the total maximum initial debris concentration was determined to be 713.12 ppm, with fiber debris contributing 19.04 ppm, and particulate and coating debris contributing 694.08 ppm. Note that the quantities of transported debris at PTN3 and PTN4 have been revised since the debris concentrations above were calculated and used to evaluate downstream effects. It was determined that the revised transported debris quantities would result in lower debris concentrations. Therefore, the downstream effects evaluations performed using the concentrations above are conservative and acceptable for use in the resolution of GSI-191.
E1-218
Enclosure 1 to FPL Letter L-2017-149
Updated Final Response to NRC Generic Letter 2004-02
Flowpaths and Alignment Review Both trains of the ECCS and CSS were reviewed to ensure that all of the flowpaths and components impacted by the debris-laden recirculation flow were considered. Documents used for this effort included piping and instrumentation diagrams (P&IDs) and other plant design documents as applicable. The components within the recirculation flow-paths were categorized as either “smaller”, “further evaluation required”, “larger”, or “excluded”. The “smaller” category contains components with flow clearances known to be physically too small to pass the debris. The “further evaluation required” category includes components that are determined by industry guidance to have the potential to become plugged under debris loading. The “larger” category includes components with clearances sufficiently large enough to pass recirculation debris without causing blockage, and the “excluded” category contains components for which industry guidance suggests are not susceptible to debris blockage. Component Blockage and Wear Evaluations Methodology All component evaluations were performed based on WCAP-16406-P-A (Reference 26). Components addressed in the evaluations include pumps, heat exchangers, orifices, spray nozzles, instrumentation tubing, system piping, and relief valves required for the post-LOCA recirculation mode of operation of the ECCS and CSS. The evaluations included the following steps:
• Identifying all components in the ECCS and CSS flowpaths (see Flowpaths and Alignment Review above).
• Applying the appropriate wear models for pumps. Pumps experience erosive wear and abrasive wear due to debris ingestion. Two abrasive wear models were developed in WCAP-16406-P-A including the free flowing abrasive wear model and Archard abrasive wear model. Each model was used as appropriate in the evaluations.
• Applying the appropriate erosive wear model for heat exchangers, orifices, spray nozzles, system piping, and valves.
• Evaluating the potential for plugging of heat exchanger tubes, orifices, spray nozzles, system piping, and valves by comparing the maximum debris size expected to be ingested through the sump screen to the clearances within the components.
• Evaluating the potential for debris sedimentation inside system piping, heat exchanger tubing and valves that move or reposition during post-LOCA recirculation phase (and must go fully closed) by comparing operating line velocity to minimum line velocity required to avoid sedimentation (0.42 ft/s).
• Evaluating the potential for debris collection in the instrument tubing (sensing lines) by comparing the debris settling terminal velocity to the flow velocities inside the ECCS and CSS lines during plant recirculation mode. As long as
E1-219
Enclosure 1 to FPL Letter L-2017-149
Updated Final Response to NRC Generic Letter 2004-02
the transverse velocity of the ECCS or CSS flow is seven times that of the debris settling velocity, the debris will not settle into the instrumentation tubing.
2. Provide a summary and conclusions of downstream evaluations.
Response to 3.m.2:
The following is the summary of results and conclusions of the downstream effects evaluations: ECCS/CS Pumps The evaluation for pumps addressed the effects of debris ingestion through the sump screen on three aspects of operability: hydraulic performance, mechanical-shaft seal assembly performance, and mechanical performance. For both units, the hydraulic and mechanical performance of the ECCS and CS pumps were determined to not be negatively affected by the recirculating sump debris. Only the CS pumps at PTN3 currently utilize cyclone separators in the seal piping arrangement. The PTN4 CS pumps previously had cyclone separators installed in the seal cooling supply lines, but have since been modified to use an API Plan 23 piping arrangement, which precludes the injection of debris laden post-LOCA fluids into the seal cavity chamber. All pumps besides the PTN3 CS pumps now have API Plan 23 piping arrangements. An engineering evaluation was performed for the PTN3 CS pumps and it was shown that the continued use of the cyclone separators is justified due to the relatively small amount of fiber transported through the strainer. The mechanical shaft seal assembly performance evaluation found that the RHR pumps for both units have carbon backup bushings. However, an engineering evaluation was performed to provide justification for the continued use of the RHR pumps’ carbon backup bushings based on the use of a closed cooling loop system to cool the seal, precluding the introduction of debris. When evaluating pump wear as part of the hydraulic performance evaluation, a modification to the WCAP-16406-P-A methodology was used to refine the distribution of abrasive versus erosive particulate debris. WCAP-16406-P-A considers 50 microns to be the constant lower threshold size for abrasive debris (which is equal to 40% of the wear ring gap of the hypothetical pump considered therein). The PTN3 and PTN4 analyses used 40% of the actual wear ring gap at any given time to define the threshold for abrasive-sized particulate. In other words, as the wear ring gap opens due to wear over time, the threshold size for abrasive debris is increased and the amount of abrasive debris reduced. However, the amount of abrasive debris that was reduced was assumed to contribute to erosive wear.
E1-220
Enclosure 1 to FPL Letter L-2017-149
Updated Final Response to NRC Generic Letter 2004-02
The evaluation for pumps determined that the effects of debris ingestion through the screen is not an issue with regard to hydraulic performance, mechanical-shaft seal assembly performance, and mechanical performance. ECCS/CSS Valves WCAP-16406-P-A provides the criteria for wear and plugging analysis for ECCS and CSS valves due to debris-laden fluid (Reference 26). Table 3.m.2-1 and Table 3.m.2-2 contain a summary of the criteria that would necessitate an evaluation. The valves that do not meet these criteria are not critically impacted by wear and plugging due to debris laden fluid.
Table 3.m.2-1: PTN3 and PTN4 Valve Evaluation Blockage Criteria Valve Type Size (inches) Position During the Event
Gate ≤ 1 Open Globe ≤ 1-1/2 Open Globe > 1 (Cage Guide) Open Check Valves/ Stop Check ≤ 1 Open Butterfly < 4 Throttled < 20° Globe Valves All Throttled Hermetically Sealed Valves All Open
Table 3.m.2-2: PTN3 and PTN4 Valve Evaluation Erosive Criteria Valve Type Size (inches) Position During the Event
Globe All Throttled Butterfly All Throttled
Valves were evaluated for blockage in the downstream effects evaluations. Valves that were determined to be “larger” or “excluded” did not warrant further evaluation, but those valves identified as “further evaluation required” received a more detailed evaluation. It was determined that all valves passed the acceptance criteria for the blockage evaluation. Valves were evaluated for debris sedimentation. Valves identified as “larger” or “excluded” did not require additional analysis, but valves identified as “further evaluation required” were analyzed further. The line velocities for all valves analyzed was found to be greater than 0.42 ft/s, thus, debris sedimentation was not an issue. Valves were screened to determine if an evaluation of the wear impact was required. It was determined that none of the valves in the post-LOCA recirculation flow path are manually throttled, and therefore did not require a calculation to determine the extent of erosion.
E1-221
Enclosure 1 to FPL Letter L-2017-149
Updated Final Response to NRC Generic Letter 2004-02
ECCS/CSS Heat Exchangers, Flow Restrictions, and System Piping Heat exchanger tubes, flow restrictions, and system piping were evaluated for the effects of erosive wear for the initial debris concentrations presented in the Response to 3.m.1 over the mission time of 30 days. The erosive wear on these components was determined to be insufficient to affect system performance. The smallest clearance found for PTN3 and PTN4 heat exchangers, orifices, spray nozzles, and system piping in the recirculation flowpaths that were not categorized as “excluded” is 0.375 inches, for the containment spray nozzles. The maximum diameter of downstream debris was conservatively assumed to be 0.125 inches. Therefore, no blockage of the flow paths is expected. System piping and heat exchanger tubing was evaluated for plugging based on system flow and material settling velocities. For all piping, the minimum flow velocity was found to be greater than 0.42 ft/s, the minimum velocity required to prevent debris sedimentation. All system piping passed the acceptable criteria for plugging due to sedimentation. ECCS/CSS Instrumentation Tubing Instrumentation tubing (or sensing lines) was evaluated for debris settling from the process streams. According to WCAP-16406-P-A, Section 8.6.6, instrument tubing is designed to remain water solid without taking flow from the process stream. This prevents direct introduction of debris laden fluid into the instrument tubing. Settling of the debris is the only process by which the debris is introduced into the instrument tubing. Since the sensing lines are water solid and stagnant, the introduction of either fibrous or particulate debris by flow into the sensing lines is not possible. The terminal settling velocities of the debris sources in the process streams are small by comparison to the process fluid velocities; therefore, introduction of debris by settling into the instrument tubing is not expected. It was found that all instruments identified as required post-LOCA are located either on the top or side of the applicable headers. This excludes the possibility of debris settling in the subjected instrument tubing. Therefore, blockage and wear of ECCS or CSS instrument tubing due to debris laden fluid are not expected. An evaluation of the effects of debris laden recirculation fluid on the reactor vessel level monitoring system (RVLMS) was also performed, and it was determined that RVLMS is acceptable.
E1-222
Enclosure 1 to FPL Letter L-2017-149
Updated Final Response to NRC Generic Letter 2004-02
3. Provide a summary of design or operational changes made because of downstream evaluations.
Response to 3.m.3:
The following plant design changes were made in response to the downstream effects evaluation at PTN3 and PTN4:
• At PTN3, in response to the WCAP-16406-P-A concern over blockage of pump seal cyclone separators by fibrous debris, the Nukon insulation on the pressurizer surge line was removed to reduce fibrous insulation in the recirculation fluid (Reference 24 p. 42).
• At PTN4, A modification was completed to remove the cyclone separators on the seal water lines for the CS pumps and replace the mechanical seals with an API plan 23 design. With this design, seal water in a closed loop is pumped to a heat exchanger and back to the mechanical seal. The mechanical seal functions as a pump. The heat exchanger was repositioned above the mechanical seal to allow thermal recirculation to assist the pumping action of the mechanical seal.
The only operational change made related to downstream effects is that inspection requirements were updated for the new strainer system. Inspection of the strainer system requires verification of maximum strainer equipment gaps to meet new specifications to maintain debris bypass size limits, and inspection now includes new strainer system piping and manifolds in addition to the strainer filtration surface. This procedure is discussed further in the Response to 3.i.
E1-223
Enclosure 1 to FPL Letter L-2017-149
Updated Final Response to NRC Generic Letter 2004-02
3.n. Downstream Effects – Fuel and Vessel
The objective of the downstream effects, fuel and vessel section is to evaluate the effects that debris carried downstream of the containment sump screens and into the reactor vessel has on core cooling.
1. Show that the in-vessel effects evaluation is consistent with, or bounded by, the industry generic guidance (WCAP-16793-NP), as modified by NRC staff comments on that document. Briefly summarize the application of the methods. Indicate where the WCAP methods were not used or where exceptions were taken, and summarize the evaluation of those areas.
Response to 3.n.1:
In-vessel downstream effects for PTN3 and PTN4 were evaluated per the methodology and acceptance criteria in WCAP-16793-NP, the associated NRC SE, WCAP-17788-P, and WCAP-17788-NP. The evaluation included the following:
1. Peak cladding temperature (PCT) due to deposition of debris on fuel rods (WCAP-16793-NP).
2. Deposition thickness (DT) due to collection of debris on fuel rods (WCAP-16793-NP).
3. Amount of fiber accumulation at reactor core inlet and inside reactor vessel (WCAP-17788-P).
The analyses for PTN3 and PTN4 concluded that post-accident long-term core cooling (LTCC) will not be challenged by deposition of debris on the fuel rods, accumulation of debris at the core inlet, or accumulation of debris in the heated region of the core for all postulated LOCAs inside containment. A brief summary of the relevant testing and analyses is provided below for each unit as it was used in the WCAP evaluations.
PTN3 Fiber Penetration Testing
Penetration testing data from DCPP was used to describe the penetration phenomena and quantify penetration at the PTN3 sump strainers. A comparison of PTN3 and DCPP sump strainers and justification for using the DCPP penetration testing is provided below.
Comparison of PTN3 and DCPP Strainers
Critical characteristics of the strainers and recirculation conditions at PTN3 and DCPP are compared in Table 3.n.1-1. Along with the critical input parameters for penetration testing, an evaluation of the parameter values is provided, which discusses applicability of the DCPP parameters to PTN3.
E1-224
Enclosure 1 to FPL Letter L-2017-149
Updated Final Response to NRC Generic Letter 2004-02
Table 3.n.1-1: Comparison of PTN3 and DCPP Key Testing/Plant Parameters
Parameter PTN3 DCPP Evaluation
Strainer Manufacturer GE GE Neither the PTN3 nor the DCPP
strainer is flow-controlled. Both sites have similar disk designs with identical perforated plate hole diameters and arrangement. The wire cloth welded to the perforated plate is identical for the strainers at both sites. The strainer module configurations for DCPP and PTN3 are highly similar, as shown in Figure 3.n.1-1 and Figure 3.n.1-2. Additional discussion is provided below Table 3.n.1-1.
The DCPP test strainer was constructed to replicate the expected approach velocities for both the front and rear disks of the plant strainer. The maximum disk velocities for PTN3 and DCPP are nearly equivalent, and the DCPP average velocity (0.0054 ft/s) is equivalent to the average velocity of the three PTN3 modules nearest the suction source, which account for 91% of the recirculation flow under clean strainer conditions. Therefore, the DCPP test approach velocities are appropriate to apply to PTN3.
E1-225
Enclosure 1 to FPL Letter L-2017-149
Updated Final Response to NRC Generic Letter 2004-02
Parameter PTN3 DCPP Evaluation
Fiber Debris Composition
Nukon, Kaowool, and
latent fiber
Nukon and Nukon-type fiber, Temp-
Mat and Temp-Mat type fiber,
Kaowool, and latent fiber
For PTN3, Kaowool is the dominant fiber type, and for DCPP Temp-Mat is the dominant fiber type.
Maximum Fiber Bed Thickness 0.071 inch 0.076 inch
The fiber bed thicknesses shown are the theoretical uniform bed thicknesses. The value shown for DCPP is the tested bed thickness. It is bounding for PTN3 and is therefore appropriate for this application.
Buffer Type NaTB NaOH
The lowest boron concentration and the buffer concentration required to achieve the highest pH of 9.5 was used for DCPP testing in order to create a conservative water chemistry environment for penetration. PTN3 small scale penetration testing showed that penetration was only moderately affected by water chemistry, and that a high pH led to slightly higher penetration. Since the DCPP test pH is bounding of the max PTN3 pH, the DCPP test water chemistry conditions are conservative for application to PTN3.
Boron Concentration
2,205-2,519 ppm
1,776-2,431 ppm
Max pH 8.04 9.5
E1-226
Enclosure 1 to FPL Letter L-2017-149
Updated Final Response to NRC Generic Letter 2004-02
Comparison of these parameters shows some differences between the DCPP testing and the PTN3 strainer. These differences are identified below.
• The sump pool water makeup is different due to the different buffers used to neutralize the borated water. As mentioned in the table, DCPP penetration testing was conducted at a higher pH than the maximum PTN3 pH. PTN3 small scale testing showed that fiber penetration increased slightly with water pH. Therefore, the DCPP penetration test water chemistry conditions were conservative for PTN3.
• The fiber types expected to be generated at each plant are slightly different. Kaowool is the dominant fiber type at PTN3, along with lesser quantities of Nukon and latent fiber. Temp-Mat is the dominant fiber type at DCPP, along with lesser quantities of Nukon, latent fiber, and other LDFG and HDFG. Although the overall fiber constituents vary, the DCPP penetration testing was performed in four batches, with the first two batches consisting of 100% Kaowool fines. This conservatively maximizes penetration of the dominant fiber type at PTN3, as Kaowool penetrates more easily than Nukon or Temp-Mat, and was introduced at the beginning of the test. Additionally, fiber fines were used for testing regardless of the type of fiber considered. This provides reasonable assurance that the test results are conservative and bounding.
Figure 3.n.1-1 and Figure 3.n.1-2 provide a visual comparison of PTN3 and DCPP strainer modules as installed at their respective plants. Note that for both plants there is a single strainer from which both ECCS/CSS trains draw from. The strainer module configurations for PTN3 and DCPP are highly similar. Each consist of rectangular disks mounted onto a plenum at a short side of the disk. For DCPP, this configuration exists in both a horizontal and vertical orientation. Because of this similarity in configuration, in addition to the similarities noted in Table 3.n.1-1, fiber bed development on the strainer disks is expected to be similar. It should be noted that the orientation of the module for DCPP has no appreciable effect on fiber bed development, as the effect of suction velocity distribution about the disk area is dominant. For both plants, the modules are arranged in series, such that flow from the most upstream module travels through the plenum of downstream modules before reaching the suction source. Therefore, debris bed distribution among modules is expected to vary with the module distance from suction for both the PTN3 and DCPP strainers. The overall debris bed development is therefore expected to be very similar for both plants.
E1-227
Enclosure 1 to FPL Letter L-2017-149
Updated Final Response to NRC Generic Letter 2004-02
Figure 3.n.1-1: DCPP Containment Sump Strainer Front and Rear Modules
Updated Final Response to NRC Generic Letter 2004-02
The subsequent sections detail how testing was conducted for DCPP.
Fiber Penetration Testing
A single large-scale fiber penetration test was conducted with test parameters selected to be representative of the most conservative conditions (temperature, flow rate, and water chemistry). The test results were used to derive a model to quantify fiber penetration for the plant strainer at its respective plant conditions. This model can be applied to the PTN3 strainer because of the similarity between plant conditions relevant to fiber penetration. The penetration test is described in the sections below.
DCPP Test Loop Design
The test loop included a metal and acrylic test tank that housed a test strainer. A pump circulated water through the test strainer, a fiber filtering system, and various piping components. The piping layout for the test loop is shown in Figure 3.n.1-3. Note that during penetration testing a filter bag was in use at all times in order to capture all penetrated debris.
E1-229
Enclosure 1 to FPL Letter L-2017-149
Updated Final Response to NRC Generic Letter 2004-02
Figure 3.n.1-3: DCPP Penetration Testing Piping and Instrumentation Diagram
The test tank, identified in Figure 3.n.1-3, was rectangular and is shown in Figure 3.n.1-4. Debris was introduced in the upstream mixing region in order to model the direction debris approaches the plant strainer. This region was equipped with hydraulic mixing lines to create adequate mixing and prevent the debris from settling. This mixing motion kept fiber in suspension without disturbing the fiber bed on the strainer. The strainer region was designed such that the spacing between the test strainer and the surrounding acrylic boxes imitated the gaps between the DCPP strainer and the sump pit walls that surround it.
E1-230
Enclosure 1 to FPL Letter L-2017-149
Updated Final Response to NRC Generic Letter 2004-02
Figure 3.n.1-4: General Arrangement of DCPP Fiber Penetration Test Tank DCPP Test Strainer
The test debris quantities and test flow rate were scaled from plant values based on the ratio of the test strainer surface area to plant strainer net surface area. A single bounding maximum flow rate was used during penetration testing to accurately model penetration.
Debris Types and Preparation
Nukon, Temp-Mat, and Kaowool were used in testing. All fiber fines were prepared according to the NEI protocol (Reference 17). Preparation of Nukon, Temp-Mat, and Kaowool debris was performed separately. Nukon sheets, with an overall thickness of 2 inches, were baked single-sided until the binder burnout reached into approximately half the thickness. The heat-treated sheets were then cut up into approximately 2”x2” cubes and weighed out according to batch size.
Nukon was then pressure-washed with test water following the NEI protocol. Temp-Mat was pre-shredded by the debris vendor and heat treated at the test vendor’s facility. Temp-Mat batches were prepared with equal parts of heat-treated and un-treated Temp-Mat. Temp-Mat was then pressure-washed in the same manner as the Nukon debris. The Kaowool sheets were cut into pieces at a nominal 4” x 4” size. Fifty percent of the Kaowool for each batch of Kaowool was heat treated similar to Nukon. The Kaowool squares were then pressure-washed with testing water similar
E1-231
Enclosure 1 to FPL Letter L-2017-149
Updated Final Response to NRC Generic Letter 2004-02
to Nukon. Figure 3.n.1-5 shows the prepared fines for all three debris types after pressure washing.
Figure 3.n.1-5: Nukon Fines (Top) Kaowool Fines (Middle), and Temp-Mat Fines
(Bottom) Prepared for DCPP Penetration Testing
After each debris type was separately pressure-washed, the Nukon, Temp-Mat, and Kaowool prepared for each batch were combined in a barrel and stirred to form a homogeneous mixture before introduction.
Debris Introduction
Debris was introduced in four separate batches of increasing batch size. All batches consisted only of fiber fines.
The first and fourth batches resulted in theoretical uniform bed thicknesses of 0.015” and 0.077”, respectively. The first two batches consisted of Nukon, Kaowool, and
E1-232
Enclosure 1 to FPL Letter L-2017-149
Updated Final Response to NRC Generic Letter 2004-02
Temp-Mat in identical quantities for each batch. During testing, 100% of the tested Kaowool fines were added in the first two batches, because Kaowool penetrates more readily than Nukon or Temp-Mat. The effect of this conservatism was maximized since Kaowool was introduced at the minimal strainer loading, when penetration is the highest. In the third batch, only Nukon and Temp-Mat were added. Finally, for the last batch, only Temp-Mat was added into the test tank.
Debris was added to the hopper to transfer the debris slurry from the barrel to the debris hopper. During this process, the debris slurry was stirred to promote a homogeneous mixture in the barrel. Additionally, the debris added to the hopper and transported into the tank was stirred, as necessary to break up any agglomeration of fibers that formed.
For each batch, the debris introduction rate was controlled to maintain a prototypical debris concentration in the test tank.
Debris Capture
Fiber can penetrate through the strainer by two different mechanisms: prompt penetration and shedding. Prompt penetration occurs when fiber reaching the strainer travels through the strainer immediately. Shedding occurs when fiber that already accumulated on the strainer migrates through the bed and ultimately travels through the strainer. Both mechanisms were considered during testing.
Fibers that passed through the strainer were collected by the in-line filters downstream of the test strainer and the pump. All of the flow downstream of the strainer travelled through the 5-micron filter bags before returning to the test tank. The capture efficiency of the filter bags was verified to be above 97 percent. The filtering system allowed the installation of two sets of filter bags in parallel lines such that one set of filter bags could be left online at all times, even during periods in which filter bags were swapped.
Before and after each test, all of the filter bags required for the test were uniquely marked and dried, and their weights were recorded. The weight gain of the filter bags during testing was used to quantify fiber penetration. After testing, the debris-laden filter bags were rinsed with deionized (DI) water to remove residual chemicals before being dried and weighed. When processing the filter bags, in either a clean or debris laden state, the bags were placed in an oven for at least an hour before being cooled and weighed inside a humidity-controlled chamber. This process was repeated for each bag until two consecutive bag weights (taken at least 1 hour apart) were within 0.10 g of each other.
A clean filter bag was placed online before a debris batch was introduced to the test tank, and was left online for a minimum of three pool turnovers (PTOs) to capture the prompt fiber penetration. For each batch, at least two additional filter bags were used to capture the fiber penetration due to shedding. For Batches 3 and 4, a third
E1-233
Enclosure 1 to FPL Letter L-2017-149
Updated Final Response to NRC Generic Letter 2004-02
shedding filter bag was used to capture long term shedding data. The online time of the final shedding bag was longer than the time after an accident at which hot leg switchover occurs at PTN3. This approach allowed the testing to capture time-dependent fiber penetration data, which was used to develop a model for the rate of fiber penetration as a function of fiber quantity on the strainer. Before each debris addition, the test tank and debris hoppers were visually checked to verify that all introduced debris had transported to the strainer.
Test Parameters
The test water used for fiber penetration testing had a boron concentration of 1,776 ppm and the corresponding buffer (NaOH) added until the desired pH of 9.5 was reached. Test water was prepared by adding pre-weighed boron to DI water to achieve the prescribed concentration, and then adding buffer to achieve the prescribed pH.
A strainer flow rate of 871.6 gpm (at test scale) was tested. The strainer flow rate was used for the entire duration of the test.
Strainer Penetration Model Development
Data gathered from the DCPP fiber penetration tests were used to develop a model for quantifying the strainer fiber penetration under plant conditions. The model was developed per the following steps:
• General governing equations were developed to describe both the prompt fiber penetration and shedding through the strainer as a function of time and fiber quantity on the strainer. The equations contain coefficients whose values were determined based on the test results.
• The results for the test were fit to the governing equations using various optimization techniques to refine the coefficient values. This produced a unique set of equations, and thus a unique penetration model. Figure 3.n.1-6 shows the model results adequately represent the test data.
E1-234
Enclosure 1 to FPL Letter L-2017-149
Updated Final Response to NRC Generic Letter 2004-02
Figure 3.n.1-6: DCPP Test Penetration Model Fit
The penetration models from the previous step can be used to determine the prompt fiber penetration fraction and shedding fraction for a given time and amount of fiber accumulated on the strainer. Coupled with a fiber transport model, a time-dependent evaluation can be performed to quantify the total amount of fiber that could pass through the strainer under certain plant conditions.
Example applications of the model are shown below. For the time-dependent analysis, the recirculation duration was divided into smaller time steps. For each time step, the fiber penetration rates and quantities were calculated. Figure 3.n.1-7 shows the resulting cumulative fiber penetration through the strainer over time at plant conditions.
E1-235
Enclosure 1 to FPL Letter L-2017-149
Updated Final Response to NRC Generic Letter 2004-02
Figure 3.n.1-7: DCPP Penetration Model at DCPP Plant Scale
Figure 3.n.1-8 shows the prompt fiber penetration fraction as a function of fiber quantity on the strainer derived using the fiber penetration model. As expected, the prompt penetration fraction decreases as a fiber debris bed forms on the strainer.
Figure 3.n.1-8: DCPP Prompt Fiber Penetration Fraction Strainer Model
Figure 3.n.1-9 shows the shedding rate calculated from the model as a function of time. Note that shedding penetration depends on the fiber quantity on the strainer and time. As shown in the figure, the shedding rate decreases over time for a given amount of fiber on the strainer.
E1-236
Enclosure 1 to FPL Letter L-2017-149
Updated Final Response to NRC Generic Letter 2004-02
Figure 3.n.1-9: DCPP Shedding Rate Calculated
As justified earlier in this submittal, given the similarities between the DCPP and PTN3 strainer characteristics, debris loads and flow conditions, it is reasonable to apply the DCPP fiber penetration correlation to PTN3. More detailed discussion of the analysis can be found later in this section.
PTN4 Fiber Penetration
PTN4 conducted fiber penetration testing in 2015. The purpose of the testing was to collect time-dependent fiber penetration data of the plant strainers. Large-scale testing was conducted with test parameters selected to be representative of the most conservative conditions (temperature, flow rate, and water chemistry). The test results were used to derive a model to quantify fiber penetration for the strainers at plant conditions. The penetration test is described in later sections within this Response to 3.n.1.
PTN4 Test Loop Design The test loop used for penetration testing was the same loop used for head loss testing (described in the Response to 3.f.4), with a couple of differences: in the penetration testing, a second in-line filter was added (in parallel with the first), the main recirculation pump was moved downstream of the filter bags, and the transition tank and related piping were not used. The test loop included a metal and acrylic test tank that housed a test strainer. Water was circulated by a pump through the test strainer, in-line filter housings, and various piping components. The test tank had a rectangular geometry. Debris was introduced in the tank at the opposite end of the strainer. The test tank was equipped with hydraulic mixing lines to create adequate mixing and prevent the debris from settling. This mixing motion kept fiber in suspension without disturbing the fiber bed on the strainer. The strainer region was designed such that the spacing between the test strainer and tank walls imitated the gaps between adjacent strainer stacks and the wall behind them at the plant.
E1-237
Enclosure 1 to FPL Letter L-2017-149
Updated Final Response to NRC Generic Letter 2004-02
PTN4 Test Strainer
The test strainer was composed of a single strainer module. The test strainer was equivalent to a plant strainer module, except that the gap between adjacent disks was increased from 1” to 2.62” to prevent bridging. Likewise, the gaps between strainer disks and adjacent stiffener plates was increased from 1” to 2.12”. In order to do this, the number of disks on the module was decreased, while the span over which the disks were located was maintained. This is conservative, since fiber bridging blocks flow paths to certain areas of the strainer, effectively reducing the penetrable strainer surface area. All modules at PTN4 are flow controlled, which means that the entire strainer has a uniform approach velocity. Therefore, a single module can be tested to model the entire strainer’s penetration. The test strainer was scaled to match the key design parameters of the plant strainer (as described in the Response to 3.f.4). The effective strainer surface area was 111.3 ft2.
PTN4 Debris Types and Preparation
Nukon and Temp-Mat were the only debris types used in testing. This is appropriate because latent fiber is the only other fiber debris type at PTN4. Nukon was used as a surrogate for latent fiber, as they have similar characteristics. All batches were 100% fines.No pieces greater than fines (i.e., smalls, larges, etc.) were investigated for testing.
All fiber fines were prepared according to the NEI protocol following the same procedures used for head loss testing (as described in the Response to 3.f.4) (Reference 17). Nukon and Temp-Mat were prepared separately and then mixed after successful preparation was documented. The fines were prepared by following these steps:
1. Nukon sheets, with an overall thickness of 2 inches, were baked single-sided until the binder burnout reached into approximately half the thickness. The heat-treated sheets were then cut up into approximately 2”x2” cubes and weighed out according to batch size. The heated Nukon is shown in Figure 3.n.1-10.
E1-238
Enclosure 1 to FPL Letter L-2017-149
Updated Final Response to NRC Generic Letter 2004-02
Figure 3.n.1-10: PTN4 Heat Treated Nukon
Temp-Mat fines were generated identically to Nukon except that the raw Temp-Mat sheets were shredded prior to pressure-washing since the material is very tough. The raw Temp-Mat (i.e., non-pressure-washed Temp-Mat) is shown in Figure 3.n.1-11.
Figure 3.n.1-11: PTN4 Heat Treated and Shredded Temp-Mat
E1-239
Enclosure 1 to FPL Letter L-2017-149
Updated Final Response to NRC Generic Letter 2004-02
2. Batches were then pressure-washed with test water following the NEI protocol. The prepared fiber is shown in Figure 3.n.1-12. Figure 3.n.1-12 and Figure 3.n.1-13 appear to show a wide distribution of fiber sizes, ranging from tiny individual fibers to clumps up to 2” or 3” in length. However, in reality, the large clumps of fiber are not individual pieces, but rather an agglomeration of individual fibers that would form shortly after the stirring of the debris-laden water. Such agglomerations were readily broken up when stirred again.
Figure 3.n.1-12: Nukon Fine Fiber Prepared for PTN4 Penetration Testing
The Temp-Mat in Figure 3.n.1-11 was then pressure-washed in batches to create the fines used in testing. A sample of the tested fiber was taken and photographed. This is shown in the Figure 3.n.1-13.
E1-240
Enclosure 1 to FPL Letter L-2017-149
Updated Final Response to NRC Generic Letter 2004-02
Figure 3.n.1-13: Temp-Mat Fine Fiber Prepared for PTN4 Penetration Testing PTN4 Debris Introduction
Debris was introduced in four separate batches. Each additional batch of debris bounded increasingly larger break sizes. Batch 1 bounded the breaks of all pipes with an ID of 8.12” and 8.75”. Batch 2 bounded pipes with an ID of 10.5”, 11.5”, 11.75”, and 13.126”. Batches 3 bounded pipes with an ID of 27.5”, and Batch 4 bounded the pipes with an ID of 29” and 31”.
Debris was introduced via a debris hopper. Debris was added to the hopper by using five gallon buckets to transfer the debris slurry from the barrel to the debris hopper. During this process, the debris slurry was stirred to promote a homogeneous mixture in the barrel. Additionally, the debris added to the hopper and transported into the tank was stirred, as necessary to break up any agglomeration of fibers that formed. For each batch, the debris introduction rate was controlled to maintain a prototypical debris concentration in the test tank.
E1-241
Enclosure 1 to FPL Letter L-2017-149
Updated Final Response to NRC Generic Letter 2004-02
PTN4 Debris Capture
Fiber can penetrate through the strainer by two different mechanisms: prompt penetration and shedding. Prompt penetration occurs when fiber reaching the strainer travels through the strainer immediately. Shedding occurs when fiber that already accumulated on the strainer migrates through the bed and ultimately travels through the strainer. Both mechanisms were considered during testing.
Fibers that passed through the strainer were collected by the in-line filter downstream of the test strainer, upstream of the pump. All of the flow downstream of the strainer travelled through the 5-micron filter bags before returning to the test tank. The capture efficiency of the filter bags was verified to be above 97 percent. The filtering system allowed the installation of two filter bags in parallel lines such that a filter bag could be left online at all times, even during periods in which filter bags were swapped.
Before and after each test, all of the filter bags required for the test were uniquely marked and dried, and their weights were recorded. The weight gain of the filter bags during testing was used to quantify fiber penetration. After testing, the debris-laden filter bags were rinsed with DI water to remove residual chemicals before being dried and weighed. When processing the filter bags, in either a clean or debris laden state, the filter bags were dried in an oven for at least an hour before being cooled and weighed inside a humidity-controlled chamber. This process was repeated for each bag until two consecutive bag weights (taken at least 1 hour apart) were within 0.05 g of each other.
A clean filter bag was placed online before a debris batch was introduced to the test tank, and was left online for a minimum of three PTOs to capture the prompt fiber penetration. For each batch, at least one additional filter bag was used to capture the fiber penetration due to shedding. For Batches 2 and 4, an additional filter bag was used to capture long-term shedding data. The online time of the final shedding bag exceeded time after a LOCA at which hot leg switchover occurs. Before further debris addition, a visual check was required to verify that all introduced debris had transported to the strainer. This approach allowed the testing to capture time-dependent fiber penetration data, which was used to develop a model for the rate of fiber penetration as a function of fiber quantity on the strainer.
PTN4 Test Parameters
The test water used for fiber penetration testing had a chemical composition prototypical to PTN4. The plant condition selected for testing was that of the minimum boron concentration of 0.204 mol/l and the corresponding buffer (NaTB) concentration of 0.0168 mol/l. The test water chemistry corresponds to the maximum pH condition at the plant and was chosen based on small scale testing conclusions that recommended large scale testing use a higher pH to conservatively model plant
E1-242
Enclosure 1 to FPL Letter L-2017-149
Updated Final Response to NRC Generic Letter 2004-02
parameters. Test water was prepared by adding pre-weighed chemicals to DI water per the prescribed concentrations.
A strainer approach velocity of 0.00216 ft/s was determined from plant operating conditions and used for the PTN4 fiber penetration testing. This approach velocity was calculated by dividing a total strainer flow rate of 3,500 gpm by the strainer surface area of 3,613.9 ft2. This is appropriate because the PTN4 strainer is flow-controlled and the flow velocity through the various strainer modules is uniform.
PTN4 Bypass Testing Results
Table 3.n.1-2 documents the bypass results as provided in the penetration testing report. For simplicity, the shedding and prompt results are summed together.
Accumulation of Fiber Inside Reactor Vessel During the post-LOCA sump recirculation phase, debris that passes through the strainer could accumulate at the reactor core inlet or inside the reactor vessel and challenge LTCC. The quantification of fiber reaching the reactor core for PTN3 and PTN4 differs and is discussed in detail below. PTN3 As discussed earlier in this section, the DCPP fiber penetration correlation was justified to be applicable for PTN3. The evaluation of fiber quantity at or inside the PTN3 reactor core was performed using the NARWHAL software . The NARWHAL model used the methodology from WCAP-17788-P and evaluated every break in a self-consistent and time-dependent manner. The duration of the recirculation phase was divided into smaller time steps and, for each time step, the fiber penetration fraction was calculated using the DCPP correlation. The analysis used design bases inputs and conditions to determine expected in-vessel debris loads. For HLBs at PTN3, the largest core inlet and total reactor vessel fiber loads were 20.26 and 20.63 g/FA, respectively. Similarly, for CLBs, the largest core inlet fiber load was 5.3 g/FA. Note that these fiber loads are for the entire 30-day mission time, and
E1-243
Enclosure 1 to FPL Letter L-2017-149
Updated Final Response to NRC Generic Letter 2004-02
therefore are conservative when comparing against the limits currently contained in WCAP-17788-P, which is currently in review. PTN4 The PTN4 in-vessel fiber analysis used the WCAP-17788 acceptance criteria but did not use the WCAP-17788-P methodology to determine fiber accumulation in the reactor vessel. Instead, for HLBs, a simplified method was developed for the fiber penetration and accumulation within the reactor vessel. For CLBs, the simplified WCAP-17788 methodology was implemented (Reference 27). The evaluation showed no failures due to accumulation of fiber at the core inlet or inside the reactor vessel for both HLBs and CLBs for the limits currently contained within WCAP-17788, which is still under review. These evaluations are summarized below. The HLB in-vessel debris loads for PTN4 were determined using scaled up penetration testing results to plant scale. This penetration testing, which is discussed previously in this section, was based on plant-specific inputs. In order to determine the PTN4 HLB debris loads, the total penetration mass from testing (scaled to plant scale), including the prompt and shedding masses, was divided by the number of fuel assemblies at PTN4. The resulting fiber bypass was 20.12 g/FA. This fiber load is below the limits currently contained within WCAP-17788, which is still under review, even if it is assumed that all penetrated debris travels to the reactor vessel and accumulates at the core inlet. The simplified WCAP-17788 methodology for CLBs (Reference 27 p. 5−1)uses the total penetrated debris from the HLB methodology above and scales it with the average decay heat during cold leg recirculation and strainer flow rate. Also, 20% margin was added to account for uncertainties in decay heat generated by the core. The largest in-vessel fiber load expected at PTN4 for a CLB would be 1.69 g/FA. This fiber load is below the CLB limits currently contained in WCAP-17788, which is currently under review (Reference 9 p. 7−2). Peak Cladding Temperature (PCT) and Deposition Thickness (DT)
The LOCADM spreadsheet, which is contained as part of WCAP-16793-NP (Revision 2) (Reference 28), was used to determine the scale thickness due to deposition of debris that passes through the strainer on the fuel rod surfaces and the resulting PCT. The calculated scale thickness was combined with the thickness of existing fuel cladding oxidation and crud build-up to determine the total DT. The calculated total DT and PCT were compared with the acceptance criteria provided in WCAP-16793-NP. Note that the evaluation also considered the applicable requirements and recommendations from the following Pressurized Water Reactor Owners Group (PWROG) letters: OG-07-419, OG-07-534, OG-08-64, and OG-10-253. The limitations and conditions (LACs) identified in the NRC’s SE of this WCAP were also addressed (Reference 29).
E1-244
Enclosure 1 to FPL Letter L-2017-149
Updated Final Response to NRC Generic Letter 2004-02
The inputs (such as pH values, temperature profiles, debris quantities, etc.) used in the PTN LOCADM analysis conservatively bound all potential breaks at the plant, and thus, the results suffice for all breaks for PTN3 and PTN4. Table 3.n.1-3 summarizes the PCT and DT.
Table 3.n.1-3: PTN3 and PTN4 Summary of PCT and DT PCT (°F) DT (mils)
Results Acceptance Criteria Results Acceptance
Criteria 346.1 < 800 27.16 < 50
The PCT is much lower than the acceptance criterion of 800 °F, and the DT value is well within the acceptance criterion of 50 mils. Therefore, deposition of post-LOCA debris and chemical precipitate product on the fuel rods will not block the LTCC flow through the core or create unacceptable local hot spots on the fuel cladding surfaces.
The 15 g/FA fiber limit at the reactor core inlet given in WCAP-16793-NP was not used (Reference 28 p. 10−3). Instead, accumulation of fiber on the reactor core inlet and inside the reactor vessel was evaluated using the WCAP-17788-P methodology and limits, as discussed earlier in this section.
The NRC Safety Evaluation of WCAP-16793-NP provided analysis and recommendations on the use of Westinghouse's WCAP-16793-NP, Revision 2 methodology and identified 14 Limitations and Conditions (LAC) that must be addressed. Responses to these LACs are summarized below.
1. Assure the plant fuel type, inlet filter configuration, and ECCS flow rate are bounded by those used in the FA testing outlined in Appendix G of the WCAP. If the 15 g/FA acceptance criterion is used, determine the available driving head for an HL break and compare it to the debris head loss measured during the FA testing. Compare the fiber bypass amounts with the acceptance criterion given in the WCAP.
Response:
This LAC is associated with the 15 g/FA limit established in WCAP-16793-NP, and is not being used for PTN. Therefore, this LAC is not applicable.
2. Each licensee’s GL 2004-02 submittal to the NRC should state the available driving head for an HL break, ECCS flow rates, LOCADM results, type of fuel and inlet filter, and amount of fiber bypass.
E1-245
Enclosure 1 to FPL Letter L-2017-149
Updated Final Response to NRC Generic Letter 2004-02
Response:
This LAC is associated with the 15 g/FA limit established in WCAP-16793-NP, which does not apply to PTN3 and PTN4, as stated above. Therefore, this LAC is not applicable.
3. If a licensee credits alternate flow paths in the reactor vessel in their LTCC evaluations, justification is required through testing or analysis.
Response:
This LAC is associated with the 15 g/FA limit established in WCAP-16793-NP, and is not being used for PTN. Therefore, this LAC is not applicable.
4. The numerical analyses discussed in Sections 3.2 and 3.3 of the WCAP should not be relied upon to demonstrate adequate LTCC.
Response:
The fuel blockage modeling concerns discussed in Sections 3.2 and 3.3 of WCAP-16793-NP are not applicable to the LOCADM analysis for PTN. Therefore, this LAC is not applicable.
5. The SE requires that a plant must maintain its debris load within the limits defined by the testing (e.g., 15 g/FA), and any debris amounts greater than those justified by generic testing in the WCAP must be justified on a plant-specific basis.
Response:
This LAC is associated with the 15 g/FA limit established in WCAP-16793-NP, and is not being used for PTN. Therefore, this LAC is not applicable.
6. The debris acceptance criterion can only be applied to fuel types and inlet filter configurations evaluated in the WCAP FA testing.
Response:
This LAC is associated with the 15 g/FA limit established in WCAP-16793-NP, and is not being used for PTN. Therefore, this LAC is not applicable.
7. Each licensee’s GL 2004-02 submittal to the NRC should compare the PCT from LOCADM with the acceptance criterion of 800 °F.
Response:
The bounding PCTs are well within the acceptance criterion of 800 °F.
E1-246
Enclosure 1 to FPL Letter L-2017-149
Updated Final Response to NRC Generic Letter 2004-02
8. When utilizing LOCADM to determine PCT and DT, the aluminum release rate must be doubled to more accurately predict aluminum concentrations in the sump pool in the initial days following a LOCA.
Response:
The appropriate methodology was followed with regard to increasing the aluminum release rate in the LOCADM analysis.
9. If refinements specific to the plant are made to the LOCADM to reduce conservatisms, the licensee should demonstrate that the results still adequately bound chemical product generation.
Response:
Silica inhibition of aluminum release is applied to the chemical calculations in the LOCADM spreadsheets. The chemical calculations use the WCAP-16530 methodology to determine the release of silica from debris and concrete (Reference 18). In the Safety Evaluation to WCAP-16530, the NRC staff noted that the chemical model significantly over-predicts the amount of silica released from fiberglass, which would be non-conservative if crediting silica inhibition of aluminum release (Reference 18). Therefore, a sensitivity case was performed without fiberglass insulation to demonstrate that decreased silicon release from fiberglass does not adversely increase the deposition thickness calculated on the fuel rods by allowing more aluminum corrosion to occur. The inputs used for this analysis are the same as those used to obtain the results shown in Table 3.n.1-3. The only difference between the runs is the existence of fiberglass. The results are shown in Table 3.n.1-4, which shows that the deposition thickness was not adversely changed by eliminating fiberglass.
Table 3.n.1-4: PTN3 and PTN4 Sensitivity Analysis
Case Deposition Thickness (mils)
With fiberglass 27.16 Without fiberglass 21.95
The PTN LOCADM runs do not employ any other conservatism-reducing refinements specific to the plant.
10. The recommended value for scale thermal conductivity of 0.11 BTU/(h-ft-°F) should be used for LTCC evaluations.
Response:
As stated in Appendix E of WCAP-16793-NP (Reference 28 p. E−16), the recommended thermal conductivity of 0.11 BTU/(h-ft-°F) can be converted to 0.2 W/m-K, which was used in the evaluation for PTN.
E1-247
Enclosure 1 to FPL Letter L-2017-149
Updated Final Response to NRC Generic Letter 2004-02
11. The licensee’s submittals should include the means used to determine the amount of debris that bypasses the ECCS sump strainer and the fiber loading at the fuel inlet expected for the HL and CL break scenarios. Licensees should provide the debris loads, calculated on a fuel assembly basis, for both the HL and CL break cases in their GL 2004-02 responses.
Response:
This LAC is associated with the 15 g/FA limit established in WCAP-16793-NP, and is not being used for PTN. Therefore, this LAC is not applicable.
12. Plants that can qualify a higher fiber load based on the absence of chemical deposits should ensure that tests for their conditions determine limiting head losses using particulate and fiber loads that maximize the head loss with no chemical precipitates included in the tests. In this case, licensees must also evaluate the other considerations discussed in the first LAC.
Response:
This LAC is associated with the 15 g/FA limit established in WCAP-16793-NP, and is not being used for PTN. Therefore, this LAC is not applicable.
13. The size distribution of the debris used in the FA testing must represent the size distribution of fibrous debris expected to pass through the ECCS sump strainer at the plant.
Response:
This LAC is associated with the 15 g/FA limit established in WCAP-16793-NP, and is not being used for PTN. Therefore, this LAC is not applicable.
14. Each licensee’s GL 2004-02 submittal to the NRC should not utilize the “Margin Calculator” as it has not been reviewed by the NRC.
Response:
The evaluation for PTN does not use the “Margin Calculator”.
In summary, the evaluation showed that the PCT and total DT due to accumulation of debris on the fuel rods meet the acceptance criteria and will not challenge the LTCC.
E1-248
Enclosure 1 to FPL Letter L-2017-149
Updated Final Response to NRC Generic Letter 2004-02
3.o. Chemical Effects
The objective of the chemical effects section is to evaluate the effect that chemical precipitates have on head loss and core cooling.
1. Provide a summary of evaluation results that show that chemical precipitates formed in the post-LOCA containment environment, either by themselves or combined with debris, do not deposit at the sump screen to the extent that an unacceptable head loss results, or deposit downstream of the sump screen to the extent that long-term core cooling is unacceptably impeded.
Response to 3.o.1: The chemical effects strategy for PTN3 and PTN4 includes:
• Quantification of chemical precipitates using the WCAP-16530-NP-A methodology
• Application of an aluminum solubility correlation to determine the maximum precipitation temperature
• Credit for the PSL1 head loss testing results bounding PTN3 • Time-based determination of acceptable head losses • Extrapolation of the resulting head losses to 30 days.
The amount/mass of chemical precipitates was quantified assuming a bounding quantity of LOCA generated debris. Other plant-specific inputs such as pH, temperature, aluminum quantity, and spray times were selected to maximize the generated amount of precipitates. These amounts were compared with the PSL1 prototypical strainer testing to determine if the resulting head loss across the strainers measured from PSL1 could be credited for PTN3, and were found to be bounding. For PTN4, the precipitate amounts were scaled by the ratio of the test strainer area to the plant-strainer surface area and were used in the prototypical strainer tests to determine the resulting head loss across the strainers. Before the tests were conducted, the SAS and AlOOH were prepared according to the WCAP-16530-NP-A recipes and were verified to meet the settling criteria within 24 hours of the test. During the test, a fiber and particulate debris bed was established on the strainer surfaces, the stabilization criteria was satisfied, and the pre-prepared precipitates were added to the test tank in batches. See the Response to 3.f.4 for details on the head loss due to chemical precipitates. See the in-vessel effects evaluations in the Response to 3.n.1 for the evaluation of chemical precipitate deposition on the fuel rod surfaces.
E1-249
Enclosure 1 to FPL Letter L-2017-149
Updated Final Response to NRC Generic Letter 2004-02
2. Content guidance for chemical effects is provided in Enclosure 3 dated March 2008 to a letter from the NRC to NEI (Reference 5).
Response to 3.o.2:
The NRC identified evaluation steps in “NRC Staff Review Guidance Regarding Generic Letter 2004-02 Closure in the Area of Plant-Specific Chemical Effect Evaluations” in March of 2008 (Reference 5). PTN’s responses to the GL supplemental content evaluation steps are summarized below. The numbering of the following subsections to the Response to 3.o.2 follow the numbering scheme provided in Section 3 and Figure 1 of the March 2008 guidance (Reference 5). Figure 3.o.2.22-1 (provided at the end of the Response to 3.o) highlights the PTN chemical effects evaluation process using the flow chart in Figure 1 of the March 2008 guidance (Reference 5).
1. Sufficient ‘Clean’ Strainer Area: Those licensees performing a simplified chemical effects analysis should justify the use of this simplified approach by providing the amount of debris determined to reach the strainer, the amount of bare strainer area and how it was determined, and any additional information that is needed to show why a more detailed chemical effects analysis is not needed.
Response to 3.o.2.1: Neither PTN3 nor PTN4 is crediting clean strainer area to perform a simplified chemical effects analysis, see Figure 3.o.2.22-1.
2. Debris Bed Formation: Licensees should discuss why the debris from the break location selected for plant-specific head loss testing with chemical precipitate yields the maximum head loss. For example, plant X has break location 1 that would produce maximum head loss without consideration of chemical effects. However, break location 2, with chemical effects considered, produces greater head loss than break location 1. Therefore, the debris for head loss testing with chemical effects was based on break location 2.
Response to 3.o.2.2: One thin-bed and two full debris load head loss tests were completed to bound PTN3 (i.e., PSL1 testing) and PTN4. These tests were utilized to develop the head loss contributions from conventional debris and aluminum precipitates. For PTN3, the PSL1 full debris head loss tests loads were credited to bound all prototypical debris loads. For PTN4, the full debris load test bounded the plant debris loads for the Region I breaks. See the Response to 3.f.7 for additional information. For the thin-bed test, a debris bed saturated with particulate debris was formed. Chemical precipitate was added to these tests as described in the Response to 3.f.4. See the Response to 3.f.7 for additional chemical head loss information.
E1-250
Enclosure 1 to FPL Letter L-2017-149
Updated Final Response to NRC Generic Letter 2004-02
3. Plant-Specific Materials and Buffers: Licensees should provide their assumptions
(and basis for the assumptions) used to determine chemical effects loading: pH range, temperature profile, duration of containment spray, and materials expected to contribute to chemical effects.
Response to 3.o.2.3: PTN3 The chemical model requires several plant-specific inputs. Each input was chosen to maximize the calculated quantity and minimize the solubility (aluminum only) of the chemical precipitates. PTN3 uses sodium tetraborate (NaTB) to buffer the post-LOCA containment sump pool to a final pH between 7.111 and 8.048. The injection sprays were assumed to be the same pH as the sump. The pH value used for chemical release was conservatively high, and the pH value used for aluminum solubility was conservatively low. Different pH values for release and solubility were combined in a non-physical way, bounding the effects of all potential pH profile variations. The pH values are summarized in Table 3.o.2.3-1:
Table 3.o.2.3-1: PTN3 and PTN4 pH Values Design Input pH Sump and Recirculation Spray pH Used To Determine Chemical Release Rates 8.048
Injection Spray pH Used To Determine Chemical Release Rates 8.048
Sump pH Used To Determine Aluminum Solubility 7.111 Bounding containment sump pool and containment temperature profiles were used to maximize chemical release rates. The temperature profiles are shown in Tables 3.o.2.3-2 and Table 3.o.2.3-3.
E1-251
Enclosure 1 to FPL Letter L-2017-149
Updated Final Response to NRC Generic Letter 2004-02
Table 3.o.2.3-2: PTN3 and PTN4 Containment Temperature Profile used to Determine Chemical Release Rates
Time (s) Post-LOCA Containment Temperature (°F) Time (s) Post-LOCA Containment
The total amount of submerged “thick” aluminum is 3,119 ft2 (including contingency), and the total amount of submerged “thin” aluminum is 30,285 ft2 (including contingency). The total amount of unsubmerged “thick” aluminum assumed to be exposed to containment sprays is 5,975 ft2 (including contingency). Note, 478 ft2 of submerged “thick” aluminum and 29,403 ft2 of submerged “thin” aluminum are located within the reactor cavity, which is an inactive cavity except for breaks at the reactor vessel nozzles. The mass of “thick” aluminum does not limit the total release. The mass for “thin” aluminum was set to 138 lbm. The total amount of concrete assumed to be exposed and submerged in the containment sump pool was 10,000 ft2. The quantity of chemical precipitates was negligibly impacted by this large assumed surface area of exposed concrete. Therefore, exposed concrete is not a significant impact to chemical product generation in the PTN post-LOCA containment sump pool and is not tracked for this purpose. Injection sprays were assumed to begin immediately post-LOCA and were assumed to be equivalent to the maximum sump pH. Containment spray was assumed to run for 30 days, which maximizes the release of aluminum. The debris quantities used to calculate the amount of chemical products at PTN3 were 2 ft3 of Nukon and 17 ft3 of Temp-Mat. The amount of latent fiberglass insulation in containment is 30 lbm. Additionally, a 10 lbm contingency of E-Glass was added for chemical product generation purposes. Both AlOOH and SAS are acceptable surrogates for aluminum precipitates and may be converted to either aluminum surrogate stoichiometrically relative to aluminum for head loss testing. In the case of PTN3, Cal-Sil debris only serves to determine which type of surrogate precipitate the aluminum forms. Silicon was assumed to precipitate with aluminum as SAS. If silicon was unavailable, aluminum was assumed to precipitate as AlOOH. Separate cases were run for breaks inside and outside of the reactor cavity. Inside the reactor cavity, there is additional aluminum (i.e., the vessel insulation is aluminum and is included as the “thin” aluminum discussed above) but no fiberglass debris besides latent debris. Outside the reactor cavity, there is less aluminum but more fiberglass debris. The maximum aluminum quantities were
E1-255
Enclosure 1 to FPL Letter L-2017-149
Updated Final Response to NRC Generic Letter 2004-02
calculated in the cases analyzing breaks inside of the reactor cavity. Breaks outside of the reactor cavity were included for information. PTN4: The chemical model requires several plant-specific inputs. Each input was chosen to maximize the calculated quantity and minimize the solubility (aluminum only) of the chemical precipitates. PTN4 used the same buffer type, pH profile, temperature profiles, and concrete amount as PTN3. The total amount of submerged “thick” aluminum is 3,987 ft2 (including contingency) and the total amount of submerged “thin” aluminum is 30,000 ft2 (including contingency). The total amount of unsubmerged “thick” aluminum assumed to be exposed to containment sprays is 3,389 ft2 (including contingency). Note that 479 ft2 of submerged “thick” aluminum and 29,404 ft2 of submerged “thin” aluminum are located within the reactor cavity, which is an inactive cavity except for breaks at the reactor vessel nozzles. The mass for “thick” aluminum does not limit the total release. The mass for “thin” aluminum was set to 138 lbm. A maximum of 445 ft3 of Nukon and 53 ft3 of Temp-Mat are destroyed by a LOCA at PTN4. The amount of latent fiberglass insulation in containment is 30 lbm. Additionally, an 85 lbm contingency of E-Glass was added for chemical product generation purposes. Both AlOOH and SAS are acceptable surrogates for aluminum precipitates and may be converted to either aluminum surrogate stoichiometrically relative to aluminum for head loss testing. In the case of PTN4, Cal-Sil debris only serves to determine which type of surrogate precipitate the aluminum forms. Silicon was assumed to precipitate with aluminum as SAS. If silicon was unavailable, aluminum was assumed to precipitate as AlOOH. Separate cases were run for breaks inside and outside of the reactor cavity. Inside the reactor cavity, there is additional aluminum (i.e., the vessel insulation is aluminum and is included as the “thin” aluminum discussed above) but much less fiberglass debris (i.e., 291 lbm). Outside the reactor cavity, there is less aluminum but more fiberglass debris. The maximum aluminum quantities were calculated in the cases analyzing breaks inside of the reactor cavity. Breaks outside of the reactor cavity were included for information.
E1-256
Enclosure 1 to FPL Letter L-2017-149
Updated Final Response to NRC Generic Letter 2004-02
4. Approach to Determine Chemical Source Term (Decision Point): Licensees should identify the vendor who performed plant-specific chemical effects testing. Response to 3.o.2.4: PTN3 and PTN4 are using the separate chemical effects approach to determine the chemical source term. Alden Research Laboratory, Inc. performed head loss testing in their test lab in Holden, MA.
5. Separate Effects Decision (Decision Point): Within this part of the process flow
chart, two different methods of assessing the plant-specific chemical effects have been proposed. The WCAP-16530-NP-A study (Box 7 WCAP Base Model) uses predominantly single-variable test measurements. This provides baseline information for one material acting independently with one pH-adjusting chemical at an elevated temperature. Thus, one type of insulation is tested at each individual pH, or one metal alloy is tested at one pH. These separate effects are used to formulate a calculational model, which linearly sums all of the individual effects. A second method for determining plant-specific chemical effects that may rely on single-effects bench testing is currently being developed by one of the strainer vendors (Box 6, AECL).
Response to 3.o.2.5: PTN3 and PTN4 are using the WCAP-16530-NP-A chemical effects base model to determine the chemical source term. The application of an aluminum solubility correlation to determine a maximum precipitate formation temperature is discussed in the Response to 3.o.2.8 and the Response to 3.o.2.9.i.
6. AECL Model:
i. Since the NRC is not currently aware of the testing approach, the NRC expects licensees using it to provide a detailed discussion of the chemical effects evaluation process along with head loss test results.
Response to 3.o.2.6.i: This question is not applicable because PTN3 and PTN4 are not using the AECL model. See Figure 3.o.2.22-1.
ii. Licensees should provide the chemical identities and amounts of predicted plant-specific precipitates.
Response to 3.o.2.6.ii: This question is not applicable because PTN3 and PTN4 are not using the AECL model. See Figure 3.o.2.22-1.
E1-257
Enclosure 1 to FPL Letter L-2017-149
Updated Final Response to NRC Generic Letter 2004-02
7. WCAP Base Model:
i. Licensees proceeding from block 7 to diamond 10 in the Figure 1 flow chart [in Enclosure 3 dated March 2008 to a letter from the NRC to NEI (Reference 5), should justify any deviations from the WCAP base model spreadsheet (i.e., any plant specific refinements) and describe how any exceptions to the base model spreadsheet affected the amount of chemical precipitate predicted.
Response to 3.o.2.7.i: The PTN chemical model quantifies chemical precipitates using the WCAP-16530-NP-A (Reference 18) methodology with the following two deviations: 1. The application of an aluminum solubility correlation to determine a
maximum precipitate formation temperature is discussed in the Response to 3.o.2.9.i.
2. The use of a new base model spreadsheet that follows the
WCAP-16530-NP-A methodology. An aluminum solubility correlation was used to determine a maximum precipitate formation temperature, which effectively delays the onset of aluminum precipitation. Therefore, to allow for time-based head loss acceptance criteria, a new spreadsheet was developed to include the requirement in the SE to double the aluminum release rate from aluminum metal over the initial 15 days (Reference 18). The spreadsheets also allow for separate accounting of “thick” aluminum (not mass limited) and “thin” aluminum (mass limited). Additionally, the aluminum solubility was used to conservatively decrease the aluminum concentration after precipitation occurs, which increases the rate of release from insulation materials and concrete post-precipitation. The equations and methodology used for “thick” and “thin” aluminum are identical. As shown in Figures 3.o.2.7.i-1 and 3.o.2.7.i-2, the ICET 1 and test results were simulated using the new spreadsheet and compared with the measured aluminum concentrations. The results verify that the new spreadsheet does not under-predict ICET 1 aluminum release and, therefore, can be used for time-based acceptance criteria in accordance with the WCAP-16530-NP-A SE.
E1-258
Enclosure 1 to FPL Letter L-2017-149
Updated Final Response to NRC Generic Letter 2004-02
Figure 3.o.2.7.i-1: Simulation of ICET 1 Al Concentration and Solubility
Figure 3.o.2.7.i-2: Measured Aluminum Concentrations in ICET 1
E1-259
Enclosure 1 to FPL Letter L-2017-149
Updated Final Response to NRC Generic Letter 2004-02
ii. Licensees should list the type (e.g., AlOOH) and amount of predicted plant-specific precipitates.
Response to 3.o.2.7.ii: PTN3 The total amount of aluminum that would precipitate in the containment sump pool at PTN3 is 413.1 kg, based on a reactor cavity break where all aluminum RMI on the reactor vessel is assumed to be submerged and available for aluminum release. The corresponding precipitate surrogate masses that would be generated in the containment sump pool at PTN3 are 44.7 kg SAS and 908.3 kg AlOOH. The total amount of aluminium precipitate for the breaks at locations outside the reactor cavity, where large amounts of conventional debris would be generated (see Table 3.b.4-1 and Table 3.b.4-2) is 333.3 kg. Note that per the WCAP-16530-NP-A Safety Evaluation, both aluminum precipitates are acceptable surrogates for aluminum precipitate in head loss testing. Therefore, AlOOH and SAS surrogates may be substituted for each other stoichiometrically relative to aluminum. See the Response to 3.f.4 for details on the amount of chemical precipitates added to the head loss test. The maximum temperature where aluminum precipitation could occur in the containment sump pool was calculated to be 247.8 °F. PTN4 The total amount of aluminum that would precipitate in the containment sump pool at PTN4 is 341.7 kg, based on a reactor cavity break where all aluminum RMI on the reactor vessel is assumed to be submerged and available for aluminum release. The corresponding precipitate surrogate masses that would be generated in the containment sump pool at PTN4 are 111.9 kg SAS and 734.1 kg AlOOH. The total amount of aluminum precipitate for the breaks at locations outside the reactor cavity, where large amounts of conventional debris would be generated (see Table 3.b.4-1 and Table 3.b.4-2), is 262.1. Note that, per the WCAP-16530-NP-A Safety Evaluation, both aluminum precipitates are acceptable surrogates for aluminum precipitate in head loss testing. Therefore, AlOOH and SAS surrogates may be substituted for each other stoichiometrically relative to aluminum. See the Response to 3.f.4 for details on the amount of chemical precipitates added to the head loss test. The maximum temperature where aluminum precipitation could occur in the containment sump pool was calculated to be 247.8 °F.
E1-260
Enclosure 1 to FPL Letter L-2017-149
Updated Final Response to NRC Generic Letter 2004-02
8. WCAP Refinements: State whether refinements to WCAP-16530-NP-A were utilized in the chemical effects analysis.
Response to 3.o.2.8: Refinements to the model for aluminum solubility are discussed in the Response to 3.o.2.9.i. No other refinements to the WCAP-16530-NP-A methodology were used.
9. Solubility of Phosphates, Silicates and Al Alloys:
i. Licensees should clearly identify any refinements (plant-specific inputs) to the base WCAP-16530-NP-A model and justify why the plant-specific refinement is valid. Response to 3.o.2.9.i: The base WCAP-16530-NP-A model assumes that aluminum precipitates form immediately upon the release of aluminum into solution. However, as justified in the Response to 3.o.2.7.i, the PTN chemical model includes the following application of an aluminum solubility correlation to determine formation temperature and timing. The aluminum solubility limit was determined using Equation 3.o.2.9-1, developed by Argonne National Laboratory (ANL).
CAl,sol = �26980 ∙ 10(pH+∆pH)−14.4+0.0243T, if T ≤ 175 °F26980 ∙ 10(pH+∆pH)−10.41+0.00148T, if T > 175 °F
(Equation 3.o.2.9-1)
Nomenclature: ∆pH = pH change due to radiolysis acids T = solution temperature, °F The aluminum solubility limit equation was used to determine the temperature and timing of aluminum precipitation and to determine the aluminum concentration in solution for use in the aluminum release equations for concrete and insulation. When precipitation was predicted by this equation, the full amount of aluminum released was assumed to precipitate. The aluminum solubility limit equation was not used to reduce the predicted quantity of precipitate by crediting the amount remaining in solution.
E1-261
Enclosure 1 to FPL Letter L-2017-149
Updated Final Response to NRC Generic Letter 2004-02
ii. For crediting inhibition of aluminum that is not submerged, licensees should provide the substantiation for the following: (1) the threshold concentration of silica or phosphate needed to passivate aluminum, (2) the time needed to reach a phosphate or silicate level in the pool that would result in aluminum passivation, and (3) the amount of containment spray time (following the achieved threshold of chemicals) before aluminum that is sprayed is assumed to be passivated.
Response to 3.o.2.9.ii: Silicon and phosphate inhibition of aluminum release were not credited. See the Response to 3.o.2.9.i.
iii. For any attempts to credit solubility (including performing integrated testing), licensees should provide the technical basis that supports extrapolating solubility test data to plant-specific conditions. In addition, licensees should indicate why the overall chemical effects evaluation remains conservative when crediting solubility given that small amount of chemical precipitate can produce significant increases in head loss.
Response to 3.o.2.9.iii: Reductions in precipitate quantity due to residual solubility of aluminum after precipitation occurs was not credited. See the Response to 3.o.2.9.i.
iv. Licensees should list the type (e.g., AlOOH) and amount of predicted plant-specific precipitates. Response to 3.o.2.9.iv: The type and amount of plant-specific precipitates are provided in the Response to 3.o.2.7.ii.
10. Precipitate Generation (Decision Point): State whether precipitates are formed by chemical injection into a flowing test loop or whether the precipitates are formed in a separate mixing tank. Response to 3.o.2.10: As discussed in the Response to 3.o.2.12, testing to bound PTN3 and PTN4 utilized pre-mixed surrogate chemical precipitates prepared in a separate mixing tank for chemical head loss testing. The direct chemical injection method was not used in head loss testing.
E1-262
Enclosure 1 to FPL Letter L-2017-149
Updated Final Response to NRC Generic Letter 2004-02
11. Chemical Injection into the Loop:
i. Licensees should provide the one-hour settled volume (e.g., 80 ml of 100 ml solution remained cloudy) for precipitate prepared with the same sequence as with the plant-specific, in-situ chemical injection. Response to 3.o.2.11.i: The direct chemical injection method was not used in head loss testing for either PTN3 or PTN4. See Figure 3.o.2.22-1.
ii. For plant-specific testing, the licensee should provide the amount of injected chemicals (e.g., aluminum), the percentage that precipitates, and the percentage that remains dissolved during testing. Response to 3.o.2.11.ii: The direct chemical injection method was not used in head loss testing for either PTN3 or PTN4. See Figure 3.o.2.22-1.
iii. Licensees should indicate the amount of precipitate that was added to the test for the head loss of record (i.e., 100 percent, 140 percent of the amount calculated for the plant). Response to 3.o.2.11.iii: The direct chemical injection method was not used in head loss testing for either PTN3 or PTN4. See Figure 3.o.2.22-1.
12. Pre-Mix in Tank: Licensees should discuss any exceptions taken to the
procedure recommended for surrogate precipitate formation in WCAP-16530-NP-A. Response to 3.o.2.12: The WCAP-16530-NP-A precipitate formation methodology for SAS and AlOOH was followed with no exceptions.
13. Technical Approach to Debris Transport (Decision Point): State whether near-field settlement is credited or not. Response to 3.o.2.13: For the head loss testing used to bound PTN3 and PTN4, chemical effects testing used hydraulic and manual agitation and turbulence in the test tank to ensure that essentially all debris analyzed to reach the strainer in the plant
E1-263
Enclosure 1 to FPL Letter L-2017-149
Updated Final Response to NRC Generic Letter 2004-02
reached the strainer in head loss testing. Near field settlement in head loss testing was not credited. See the Response to 3.f.4 for additional details.
14. Integrated Head Loss Test with Near-Field Settlement Credit:
i. Licensees should provide the one-hour or two-hour precipitate settlement values measured within 24 hours of head loss testing. Response to 3.o.2.14.i: Neither PTN3 nor PTN4 credited near field settlement of chemical precipitate in chemical head loss testing. See Figure 3.o.2.22-1.
ii. Integrated Head Loss Test with Near-Field Settlement Credit: Licensees should provide a best estimate of the amount of surrogate chemical debris that settles away from the strainer during the test. Response to 3.o.2.14.ii: Neither PTN3 nor PTN4 credited near field settlement of chemical precipitate in chemical head loss testing. See Figure 3.o.2.22-1.
15. Head Loss Testing Without Near Field Settlement Credit:
i. Licensees should provide an estimate of the amount of debris and precipitate that remains on the tank/flume floor at the conclusion of the test and justify why the settlement is acceptable. Response to 3.o.2.15.i: PTN3 For the head loss testing used to bound PTN3, when fines and particulates were observed to settle on the tank floor, manual mixing was applied to re-suspend the settled debris. Small pieces of fiber settled on the obstruction pipe, the plenum, and against the plenum extending back to the tank floor because the strainer became circumscribed with fibrous debris. There was some entrapment of the chemical precipitate in this fiber with little to no settling of the precipitate away from strainer.
E1-264
Enclosure 1 to FPL Letter L-2017-149
Updated Final Response to NRC Generic Letter 2004-02
PTN4 For PTN4, post-test photographs show that all of the debris reached the strainers. All fibrous debris inside the test tank transported to the immediate vicinity of the test strainer. There was some entrapment of the chemical precipitate in this fiber with little to no settling of the precipitate away from strainer.
ii. Licensees should provide the one-hour or two-hour precipitate settlement values measured and the timing of the measurement relative to the start of head loss testing (e.g., within 24 hours). Response to 3.o.2.15.ii: The 1-hour settling volume for each batch of chemical precipitates was determined at the time that the batch was produced and was required to be 6 ml (SAS and AlOOH) or greater. The chemical precipitate settling was also required to be measured within 24 hours of the time the surrogate was to be used and the 1-hour settled volume was required to be 6 ml or greater and within 1.5 ml of the freshly prepared surrogate. Chemical precipitates that failed the 6 ml or greater (initial test or re-test) and within 1.5 ml of the freshly prepared surrogate criteria were not used in testing.
16. Test Termination Criteria: Licensees should provide the test termination criteria.
Response to 3.o.2.16: For the head loss testing used to bound PTN3 and PTN4, the head-loss test was terminated once the last chemical debris addition did not produce a head loss peak. The debris bed in this state was characterized using both a temperature and a flow sweep. See the Response to 3.f.4 for details on the test termination criteria.
17. Data Analysis:
i. Licensees should provide a copy of the pressure drop curve(s) as a function of time for the testing of record. Response to 3.o.2.17.i: See the Response to 3.f.4 for details on the PTN3 and PTN4 head loss due to chemical precipitates.
E1-265
Enclosure 1 to FPL Letter L-2017-149
Updated Final Response to NRC Generic Letter 2004-02
ii. Licensees should explain any extrapolation methods used for data analysis. Response to 3.o.2.17.ii: No extrapolation methods were necessary since the last chemical debris addition in each test did not produce a new head-loss peak and the head loss had stabilized or was decreasing. See the Response to 3.f.4.
18. Integral Generation (Alion): Licensees should explain why the test parameters
(e.g., temperature, pH) provide for a conservative chemical effects test. Response to 3.o.2.18: PTN3 and PTN4 are using the separate chemical effects approach to determine the chemical source term. This section is not applicable to the PTN chemical effects analysis. See Figure 3.o.2.22-1.
19. Tank Scaling / Bed Formation:
i. Explain how scaling factors for the test facilities are representative or conservative relative to plant-specific values. Response to 3.o.2.19.i: PTN3 and PTN4 are using the separate chemical effects approach to determine the chemical source term. This section is not applicable to the PTN chemical effects analysis. See Figure 3.o.2.22-1.
ii. Explain how bed formation is representative of that expected for the size of materials and debris that is formed in the plant specific evaluation. Response to 3.o.2.19.ii: PTN3 and PTN4 are using the separate chemical effects approach to determine the chemical source term. This section is not applicable to the PTN chemical effects analysis. See Figure 3.o.2.22-1.
20. Tank Transport: Explain how the transport of chemicals and debris in the testing facility is representative or conservative with regard to the expected flow and transport in the plant-specific conditions. Response to 3.o.2.20: PTN3 and PTN4 are using the separate chemical effects approach to determine the chemical source term. This section is not applicable to the PTN chemical effects analysis. See Figure 3.o.2.22-1.
E1-266
Enclosure 1 to FPL Letter L-2017-149
Updated Final Response to NRC Generic Letter 2004-02
21. 30-Day Integrated Head Loss Test: Licensees should provide the plant-specific
test conditions and the basis for why these test conditions and test results provide for a conservative chemical effects evaluation. Response to 3.o.2.21: PTN3 and PTN4 are using the separate chemical effects approach to determine the chemical source term. This section is not applicable to the PTN chemical effects analysis. See Figure 3.o.2.22-1.
22. Data Analysis Bump Up Factor: Licensees should provide the details and the technical basis that show why the bump-up factor from the particular debris bed in the test is appropriate for application to other debris beds.
Response to 3.o.2.22: PTN3 and PTN4 are using the separate chemical effects approach to determine the chemical source term. This section is not applicable to the PTN chemical effects analysis. See Figure 3.o.2.22-1.
E1-267
Enclosure 1 to FPL Letter L-2017-149
Updated Final Response to NRC Generic Letter 2004-02
Figure 3.o.2.22-1: Chemical Effects Evaluation Process for PTN3 and PTN4
(Reference 5 p. 8)
E1-268
Enclosure 1 to FPL Letter L-2017-149
Updated Final Response to NRC Generic Letter 2004-02
3.p. Licensing Basis
The objective of the licensing basis is to provide information regarding any changes to the plant licensing basis due to the sump evaluation or plant modifications.
1. Provide the information requested in GL 2004-02 Requested Information Item 2(e) regarding changes to the plant-licensing basis. The effective date for changes to the licensing basis should be specified. This date should correspond to that specified in the 10 CFR 50.59 evaluation for the change to the licensing basis. GL 2004-02 Requested Information Item 2(e) A general description of and planned schedule for any changes to the plant licensing bases resulting from any analysis or plant modifications made to ensure compliance with the regulatory requirements listed in the Applicable Regulatory Requirements section of this GL. Any licensing actions or exemption requests needed to support changes to the plant licensing basis should be included.
Response to 3.p.1:
As discussed in other sections of this response, physical plant changes and procedural changes have been made to PTN3 and PTN4 to resolve GL 2004-02 and GSI-191 concerns. The PTN3 and PTN4 UFSAR has previously been updated to incorporate the effects of plant modifications and evaluations performed in accordance with the requirements of 10 CFR 50.59. The UFSAR will be reviewed after NRC acceptance of results and methodology presented in this submittal to determine if any further changes are determined to be necessary. If changes are determined to be necessary, then the UFSAR updates will occur after receipt of the final closeout letter from the NRC. The Technical Specification Bases were updated to expand the definition of the recirculation sump inspection requirements to include the entire distributed sump strainer system. This change ensures that the entire system will come under the technical specification requirements for sump inspection and control. No further revision of the technical specifications or bases is anticipated. Installation of the new containment sump strainers for PTN3 and PTN4 necessitated use of a common plenum for the two RHR suction lines within containment. The current strainer design continues to include manually operated, locked-open gate valves, as cross-connections outside containment between the RHR recirculation suction lines. Therefore, the new strainer designs maintain the previous cross-connection between the RHR recirculation suction lines and do not constitute a deviation from the plant design basis.
E1-269
Enclosure 1 to FPL Letter L-2017-149
Updated Final Response to NRC Generic Letter 2004-02
4. References
1. ML042360586. NRC Generic Letter 2004-02. Potential Impact of Debris Blockage on Emergency Recirculation During Design Basis Accidents at Pressurized Water Reactors. September 13, 2004.
2. ML073110278. Revised Content Guide for Generic Letter 2004-02 Supplemental Responses. November 2007.
3. ML080230038. NRC Staff Review Guidance Regarding Generic Letter 2004-02 Closure in the Area of Strainer Head Loss and Vortexing. March 2008.
4. ML080230462. NRC Staff Review Guidance Regarding Generic Letter 2004-02 Closure in the Area of Coatings Evaluation. March 2008.
5. ML080380214. NRC Staff Review Guidance Regarding Generic Letter 2004-02 Closure in the Area of Plant-Specific Chemical Effects Evaluation. March 2008.
6. NEI 04-07 Volume 2. Pressurized Water Reactor Sump Performance Evaluation Methodology "Volume 2 - Safety Evaluation by the Office of Nuclear Reactor Regulation Related to NRC Generic Letter 2004-02". December 2004. Revision 0.
7. ML100960495. NRC Revised Guidance Regarding Coatings Zone of Influence for Review of Final Licensee Responses to Generic Letter 2004-02, "Potential Impact of Debris Blockage on Emergency Recirculation During Design Basis Accidents at Pressurized-Water Reactors". April 2010.
8. NEI Guidance Report on Fibrous Debris Preparation. Generic Procedure - ZOI Fibrous Debris Preparation: Processing, Storage, and Handling. January 24, 2012. Revision 1.
9. WCAP-17788-NP Volume 1. Comprehensive Analysis and Test Program for GSI-191 Closure (PA-SEE-1090). July 2015. Revision 0.
10. NEI 04-07 Volume 1. Pressurized Water Reactor Sump Performance Evaluation Methodology "Volume 1 - Pressurized Water Reactor Sump Performance Evaluation Methodology". December 2004. Revision 0.
11. NUREG-1829 Volume 1. Estimating Loss-of-Coolant Accident (LOCA) Frequencies Through the Elicitation Process. April 2008.
12. Regulatory Guide 1.174 (ML100910006). An Approach for Using Probabilistic Risk Assessment in Risk-Informed Decisions on Plant-Specific Changes to the Licensing Basis. May 2011. Revision 2.
13. ML120730660. Example Pressurized Water Reactor Defense-In-Depth Measures for GSI-191, PWR Sump Performance. March 5, 2012.
14. NUREG/CR-6772. GSI-191: Separate Effects Characterization of Debris Transport in Water. August 2002.
15. NUREG/CR-6808. Knowledge Base for the Effect of Debris on Pressurized Water Reactor Emergency Core Cooling Sump Performance. February 2003.
E1-270
Enclosure 1 to FPL Letter L-2017-149
Updated Final Response to NRC Generic Letter 2004-02
16. NUREG/CR-6224. Parametric Study of the Potential for BWR ECCS Strainer Blockage Due to LOCA Generated Debris. October 1995.
17. ML120481057. ZOI Fibrous Debris Preparation: Processing, Storage and Handling. January 2012. Revision 1.
18. WCAP-16530-NP-A. Evaluation of Post-Accident Chemical Effects in Containment Sump Fluids to Support GSI-191. March 2008.
19. ML080710429. Supplemental Response to NRC Generic Letter 2004-02, "Potential Impact of Debris Blockage on Emergency Recirculation During Design Basis Accidents at Pressurized-Water Reactors". February 28, 2008.
20. ML090920410. Response to NRC Request for Additional Information Regarding the Responses to GL 2004-02, "Potential Impact of Debris Blockage on Emergency Reciculation during Design Basis Accidents at Pressurized-Water Reactors". March 19, 2009.
21. ML090930452. Response to NRC Request for Additional Information Regarding the Responses to Generic Letter 2004-02, "Potential Impact of Debris Blockage on Emergency Recirculation during Design Basis Accidents at Pressurized-Water Reactors". March 19, 2009.
22. ML070950240. San Onofre Nuclear Generating Station Unit 2 and Unit 3 GSI-191 Generic Letter 2004-02 Corrective Actions Audit Report. May 5, 2007.
23. ML082050406. Indian Point Nuclear Generating Uni Nos. 2 and 3. - Report on Results of Staff Audit of Corrective Actions to Address Generic Letter 2004-02. July 29, 2008.
24. ML081960386. Turkey Point Unit 3 Supplemental Response to NRC Generic Letter 2004-02, "Potential Impat of Debris Blockage on Emergency Recirculation During Design Basis Accidents at Pressurized-Water Reators". June 30, 2008.
25. ML082380244. Turkey Point Unit 4 Updated Supplemental Response to NRC Generic Letter 2004-02, "Potential Impact of Debris Blockage on Emergency Recirculation During Design Basis Accidents at Pressurized-Water Reactors". August 11,2008.
26. WCAP-16406-P-A. Evaluation of Downstream Sump Debris Effects in Support of GSI-191. March 18, 2011. Revision 1.
27. WCAP-17788-NP Volume 3. Comprehensive Analyis and Test Program for GSI-191 Closure (PA-SEE-1090) - Cold Leg Break (CLB) Evaluation Method for GSI-191 Long-Term Cooling. December 2014. Revision 0.
28. WCAP-16793-NP. Evaluation of Long-Term Cooling Considering Particulate, Fibrous and Chemical Debris in the Recirculating Fluid. October 2011. Revision 2.
29. WCAP-16793-NP-A. Evaluation of Long-Term Cooling Considering Particulate, Fibrous and Chemical Debris in the Recirculating Fluid. July 2013. Revision 2.