19
Florida Tourism by the Numbers Updated as of January 14, 2016

Florida Tourism by the NumbersUpdated as of January 14, 2016

Florida Tourism by the Numbers(Calendar Year 2014)
98.5 million visitors in 2014 – up 4.6%
Domestic visitors accounted for 84.4% of total overnight visitation by non-residents
Domestic visitation grew 5.6%
International visitation accounted for 15.6% of total overnight visitation
International visitation fell 0.3%, with Overseas up 1.1% and Canadian visitation down 4.1%

Florida Tourism by the Numbers(Calendar Year 2014 Indicators)
$82.0 B in travel spending - up 7.7%
$4.9 B in sales tax collections - up 7.7%• 23% of all sales tax generated from travel spending in 2014
1,145,800 Floridians employed - up 4.4%
Hotel average daily rate in 2014 - up 5.7%
Hotel occupancy in 2014 - up 4.4%
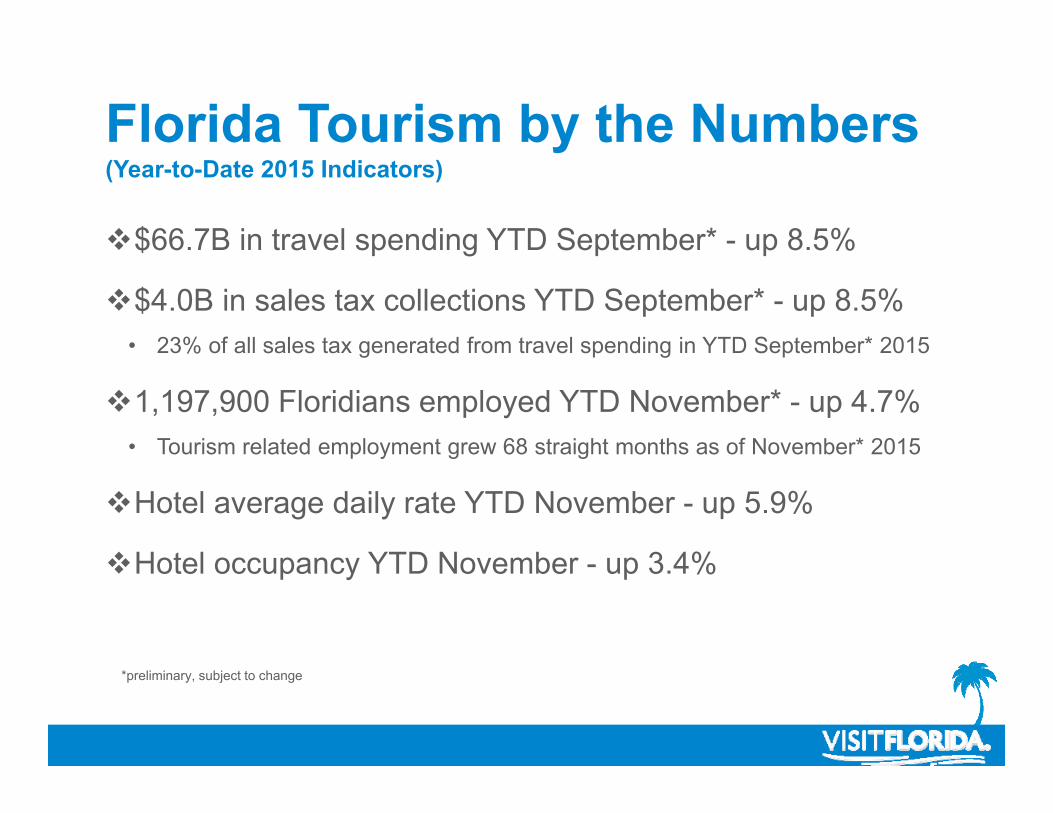
Florida Tourism by the Numbers(Year-to-Date 2015 Indicators)
$66.7B in travel spending YTD September* - up 8.5%
$4.0B in sales tax collections YTD September* - up 8.5%• 23% of all sales tax generated from travel spending in YTD September* 2015
1,197,900 Floridians employed YTD November* - up 4.7%• Tourism related employment grew 68 straight months as of November* 2015
Hotel average daily rate YTD November - up 5.9%
Hotel occupancy YTD November - up 3.4%
*preliminary, subject to change

Florida TourismVisitor Indicators

Florida Visitation: CY 2011 – CY 2014(in millions)
2011 2012 2013 2014
Canada down 4.1%
Overseas up 1.1%
Domestic up 5.6%
94.1M91.5M87.3M
98.5M
Total visitation up 4.6%

Top Origin States of Florida Domestic Visitors(Calendar Year 2014)
%
%

Top Origin States of Domestic Air VisitorsAir visitors accounted for 43.7% of Florida’s domestic visitors in 2014

Top Origin States of Domestic Auto VisitorsAuto visitors accounted for 56.3% of Florida’s domestic visitors in 2014
%
%

International Visitation: CY 2011 – CY 2014(in millions)
9.3M10.4M 11.2M 11.3M
3.3M 3.6M
4.2M 4.0M
2011 2012 2013 2014
Canada Overseas
Note: To derive the most valid estimate possible, VISIT FLORIDA's estimates information and processes are updated annually; therefore, the estimates shown have been revised from those previously released.
12.6M13.9M
15.4M 15.3M

International Visitors by Region: 2014
South America27%
Europe27%
Canada26%
Asia/Oceania8%Caribbean
4%
Central America4%
Mexico 3%
Africa/Middle East2%

Top Origin Countries for Visitation: 2014
1 Canada 4.0 million -4%2 U.K. 1.6 million 8%3 Brazil 1.6 million -10%4 Argentina 724,000 -11%5 Colombia 594,000 47%6 Venezuela 490,000 -22%7 Germany 448,000 6%8 Mexico 430,000 4%9 Australia 320,000 1%
10 France 313,000 4%

Florida TourismEconomic Indicators

Travel Spending: CY 2013 – September 2015*(in millions)
$3,500
$4,500
$5,500
$6,500
$7,500
$8,500
$9,500
Jan Feb Mar Apr May Jun Jul Aug Sep* Oct Nov Dec
201520142013
*preliminary subject to revision
Travel Spending in September 2015* up 11.6% andTravel Spending for YTD September 2015* up 8.5%
11.5% 9.0% 8.8% 7.5% 7.7% 5.6% 10.5% 4.8% 11.6%

Sales Tax Generated by Travel Spending: CY 2013 – September 2015*(in millions)
$200
$250
$300
$350
$400
$450
$500
$550
Jan Feb Mar Apr May Jun Jul Aug Sep* Oct Nov Dec
201520142013
*preliminary subject to revision
Sales Tax Generated by Travel Spending in September 2015* up 11.6%
21% of all Sales Tax Generated in September 2015* is by Travel Spending
11.5% 9.0% 8.8% 7.5% 7.7% 5.6% 10.5% 4.8% 11.6%

1,057,700
1,097,000
1,145,800 1,143,800
1,197,900
2012 2013 2014 Jan-Nov '14 Jan-Nov '15*
Note: year-over-year figures are an average of the individual monthly data.*preliminary subject to revision**consecutive growth in tourism related employment began April, 2010
+3.7%
+4.4% +4.7%
Tourism Related Employment in Florida
Tourism related employment shows growth, year-over-year, for the 68th straight month.**

Hotel Monthly Average Daily Rate Trends: CY 2013 – November 2015
Jan Feb Mar Apr May Jun Jul Aug Sep Oct Nov Dec2013 $126.80 $136.55 $146.14 $124.79 $113.29 $109.54 $110.19 $102.10 $95.81 $108.34 $110.98 $125.032014 $131.43 $144.46 $150.36 $136.40 $118.28 $113.73 $114.76 $107.33 $100.19 $114.74 $116.11 $133.282015 $140.36 $156.44 $162.17 $143.37 $123.92 $118.40 $122.77 $110.33 $105.52 $119.35 $122.64
$0
$20
$40
$60
$80
$100
$120
$140
$160
$180
Source: STR, Inc.***A running 28 day trend ending December 12th indicates an ADR of $125.92, an increase of 6.8%.
YTD November 2015 ADR up 5.9% from
YTD November 2014

Hotel Monthly Occupancy Trends: CY 2013 - November 2015
Jan Feb Mar Apr May Jun Jul Aug Sep Oct Nov Dec2013 65.5% 75.0% 81.8% 69.8% 65.2% 68.7% 69.6% 63.2% 54.2% 61.8% 63.0% 63.1%2014 67.9% 78.1% 82.0% 73.9% 69.5% 70.2% 72.5% 67.0% 57.4% 66.7% 64.7% 66.5%2015 71.9% 81.0% 83.7% 76.9% 70.7% 72.2% 76.1% 66.9% 61.1% 68.4% 67.1%
0%
10%
20%
30%
40%
50%
60%
70%
80%
90%
Source: STR, Inc.
YTD November 2015Occupancy up 3.4% from
YTD November 2014
***A running 28 day trend ending December 12th indicates Florida occupancy at 66.5%, an increase of 3.6%.


